
Submitted:
28 January 2026
Posted:
28 January 2026
You are already at the latest version
Abstract
Accurate quantification of the crack tip driving force (ΔK) is fundamental to predicting the fatigue life of engineering structures. Analytical formulations of ΔK are rarely available for components with complex geometries. In such cases, finite element (FE) analysis has become a widely accepted approach for determining ΔK. In this study, an FE-based solution for the crack-tip driving force of a fatigue crack in an asymmetric L-shaped bell crank geometry, a representative complex structure, is established. The structure is fabricated from AISI 410 martensitic stainless steel. The FE-predicted ΔKI for crack growth in the Paris regime has been independently validated using the multifractal stress-intensity-factor model. Results show that the fatigue crack in the bell crank structure is driven by a combined Mode-I (opening) and Mode-II (shearing) crack tip loading along a curved crack path trajectory, as dictated by the asymmetric stress distribution. The fatigue crack edge exhibits fractality with fractal dimensions ranging from 1.00 (Euclidean) to 1.18 over the crack length, (a-ao) up to 9.947 mm. The FE-calculated crack tip driving forces of the bell crank structure are comparable with those computed based on the corrected crack edge fractal dimensions, thus validating the FE simulation outcomes. The resulting fatigue crack growth rates, determined from crack-tip driving forces based on validated FE-computed contour integrals, are comparable to those obtained from the ASTM standard tests.
Keywords:
contour-integral method
; crack tip driving force
; fatigue crack growth
; finite element simulation
; fractal dimension
; multifractal stress-intensity-factor model
1. Introduction
Fatigue fracture in engineering structures is driven by the initiation and propagation of cracks under cyclic loading [1]. The cracks weaken structural components [2] and grow under the influence of fatigue. Accurate prediction of crack growth rate is fundamental to ensuring structural integrity and developing cost-effective maintenance schedules in safety-critical industries, such as aerospace, automotive, and nuclear. Central to fatigue crack growth analysis is the estimation of the crack tip driving force [3], typically characterized in terms of stress intensity factor range (ΔK), which characterizes the local stress field at the crack front. While catastrophic failure occurs when ΔK reaches the material’s fracture toughness (Kc), subcritical crack growth takes place when the operating ΔK exceeds a threshold value (ΔKth), even if it remains below Kc. Within the exponential crack growth stage (described by the Paris law), the crack growth rate curve can be integrated to estimate the remaining life to catastrophic fracture of the component. This phenomenon forms the basis for damage tolerance and time-to-failure estimations in practical applications [2,4].
The stress intensity factor range ΔK, is expressed in terms of the operating stress range and stress ratio, and the crack geometry factor. Closed-form solutions of ΔK are well documented for standard geometries [5,6,7], and are derived through rigorous mathematical formulations and idealized boundary conditions. However, real-world structures often incorporate design features with geometric discontinuities, such as branched connections, asymmetric linkages, and load-bearing webs, which render analytical solutions for ΔK impractical [8]. In such cases, finite element (FE) analysis has become the preferred approach for evaluating ΔK in cracked bodies. FE methods rely exclusively on accurate modelling of the singular asymptotic response at the crack tip. Numerous recent works employ commonly used FE methods, such as the Contour Integral, X-FEM, and VCCT, to estimate ΔK [9,10]. Despite their analytical sophistication and widespread use, FE-based ΔK estimates are at times prone to significant uncertainty, particularly when an inadequate understanding of boundary conditions and/or an uncertain operational history obstructs accurate modelling of the fracture process. Phase-field modeling approaches, which represent cracks as diffusive interfaces, offer a unified treatment of crack initiation and propagation [8,11], yet remain computationally demanding and sensitive to parameter calibration [12], thus limiting their industrial applicability. These computational models call for independent, credible strategies to validate FE-based ΔK predictions for complex crack geometries and/or loading conditions.
Developing trends in recent research suggest generalizable validation frameworks that integrate deterministic mechanics analysis with data-rich observable parameters for predictive failure analysis [13,14,15,16,17]. Some alternative non-destructive measurement methods reported in the literature, such as Digital Image Correlation (DIC) [1,18,19], Acoustic Emission Monitoring (AEM) [20,21], and Thermoelastic Stress Analysis (TSA) [1,22,23], can be used to validate the computed ΔK. These methods, while inheriting measurement accuracy, often become impractical to apply to complex geometrical structures in a service environment. Additionally, these techniques are typically expensive and labor-intensive. Fractal and multifractal descriptors of fracture surfaces have emerged as physics-aware, data-driven metrics capable of linking morphology to the mechanics of fatigue cracks [24,25]. Multifractal features in the crack wake encode the stress-strain history of the fracture. In this respect, ΔK could be inferred directly from these features by treating the fracture zone as a fractal continuum, thereby providing an independent means of verifying FE-computed results. While FE models provide a deterministic prediction of fatigue crack growth based on first principles, the multifractal approach directly extracts the same information from experimental data, non-destructively. The latter approach processes high-resolution binary images of the crack to estimate the fractal dimension (dF) using the box-counting algorithm or similar approaches. The crack tip driving force ΔK, is then obtained from the fractal dimension paired with the material-specific coefficient of fractality [24].
This work describes the fatigue crack growth response of a general structural component, represented by an asymmetric bell crank plate with a straight-through edge crack. The crack geometry factor is not readily available, and the nominal stress distribution is relatively complex, making the analytical determination of the crack-tip driving force ΔK challenging. Alternatively, the ΔK value at discrete crack lengths is calculated using finite element (FE) simulations. Fractal dimensions of the crack path microfeatures are quantified at the respective crack lengths. These fractal descriptors, extracted from high-resolution crack images, provide a non-destructive, geometry-independent quantification of the crack-tip driving force, thus enabling direct validation of the FE-calculated ΔK of the propagating fatigue crack.
2. Theoretical Background
The crack-tip driving force under cyclic loading is commonly expressed through the stress intensity factor range ΔK, which governs the amplitude of the singular stress field surrounding the crack front. Within the framework of linear elastic fracture mechanics (LEFM), the asymptotic crack-tip fields are uniquely characterized by the three stress intensity components (KI, KII, KIII) corresponding to opening, sliding and tearing modes, respectively. Fatigue crack growth is primarily controlled by Mode I (opening), although geometric asymmetry and local constraints may induce significant mixed-mode contributions. In finite element (FE) formulations, ΔK is typically obtained using the contour-integral approach, most notably the J-integral, which represents the energy release rate per unit crack extension under linear elastic conditions [26]:
where W is the elastic strain energy density, σij the Cauchy stress tensor, ui the displacement vector, and nj the outward normal to the virtual contour Γ, enclosing the crack tip (Figure (1a)). For linear elastic materials, the J-integral is directly related to the stress intensity factor vector, K= [KI KII KIII]T through:
With [B] denoting the pre-logarithmic energy factor matrix that incorporates material elastic constants. In practice, FE software computes the J-integral using domain or interaction integrals, and numerical stability is ensured through convergence of J across successive contours. Under mixed-mode loading, fatigue cracks often deviate from a straight path. Numerous criteria [27,28,29,30,31,32,33] have been developed to predict potential propagation direction, denoted by the kink angle θk, as illustrated in Figure 1(b). This work considers the Maximum Tangential Stress (MTS) criterion, which stipulates that crack growth occurs in the direction of KII = 0, thus providing the local propagation angle as [27]:
The effective Mode-I crack tip driving force in the kinked direction is then expressed as which forms the basis for calculating ΔK in subsequent FE analyses.
Complementary to continuum mechanics, the fractal-based fracture model provides an alternative, morphology-based approach for estimating ΔK. Fracture surfaces generated under fatigue exhibit self-similar and multifractal features that encode the interaction of the crack front with the local stress field. The fractal crack tip driving force model expresses the stress intensity factor range, ΔKI of the crack under mode-1 (opening) as [25]:
where ΔKTH is the threshold stress intensity factor range for crack propagation, KIC is the plane strain fracture toughness, dE is the Euclidean dimension of the crack (equal to 1 for a line crack), dF is the fractal dimension extracted from the crack morphology, and is a material-specific coefficient of fractality. The fractal dimension is obtained by applying the box-counting algorithm to high-resolution crack images, thereby quantifying the geometric complexity of cracks and the driving force at the crack tip.
3. Materials and Methodology
3.1. Material and Bell Crank Geometry
The material used in this study is AISI 410 martensitic stainless steel, supplied in the annealed and hot-finished condition. The chemical composition (in wt.%) of the steel is: 0.15C, 12.40Cr, 0.35Si, 0.495Mn, 0.027P, 0.002S, 0.08Mo, the balance being Fe. The steel exhibits randomly oriented plates and a needle-like microstructure. A series of fatigue crack growth tests was performed on compact tension C(T) specimens fabricated from the same AISI 410 steel plate. The resulting reference mechanical properties and fatigue crack growth characteristics of the steel are listed in Table 1.
The complex structural geometry is represented by an L-shaped bell crank plate structure with asymmetric limbs, as shown in Figure 2. The structure is machined from a 20 mm-thick AISI 410 martensitic stainless-steel plate. The through-hole ahead of the machined notch is intended to induce mixed-mode crack-tip loading and a non-linear crack path, which are commonly encountered in structural applications. Fatigue pre-cracking is performed to establish a fatigue pre-crack of length 30 mm (measured from the load line).
3.2. Fatigue Crack Growth Test of Bell-Crank Structure
The fatigue crack growth test of the bell-crank structure is intended to illustrate a typical crack growth behavior in a general structure of complex geometry and/or loading. A 100 kN servo-hydraulic fatigue testing machine is used to conduct fatigue testing in a load-controlled mode. A sinusoidal load waveform with a load range ΔP = 5.4 kN, load ratio R = 0.1, and frequency f = 10 Hz is applied. Crack propagation is tracked using a microscopic camera mounted on a mobile platform. Crack lengths are measured from the load line and following the crack path. Data pairs of crack length and the corresponding accumulated load cycles are recorded throughout the test.
It is of practical interest to determine the crack growth rate at any stage of the fatigue life. However, the associated crack geometry correction factor for the bell crank structure is not readily available for calculating the stress intensity factor range Alternatively, is determined based on the FE-calculated stress field in the crack tip region.
3.3. FE Simulation of Bell Crack Structure for Crack Tip Driving Force,
A series of FE simulations of the bell crank structure, each with a different crack length, is performed to establish the crack tip stress field for use in calculating the corresponding . The digitized crack trajectory, based on experimental observations, is explicitly modeled to ensure a realistic representation of the observed crack path. Each FE model of the bell crank geometry is discretized using an adjusted element mesh topology to capture crack-tip parameters and local stress gradients accurately. A mesh convergence study is performed using as the monitoring variable. The resulting mesh is non-uniform, with finer mesh applied at geometric discontinuities and traction-free edges to better capture localized deformation and stress gradients, as shown in Figure 3. An ultrafine mesh is used in the immediate vicinity of the crack front where steep stress and strain gradients are anticipated. A coarser mesh is employed in the bulk of the material, away from critical locations, to reduce computational effort while preserving numerical accuracy. Fatigue load cycle is simulated with the maximum and minimum force of 0.6 and 6.0 kN, respectively (i.e. ΔP = 5.4 kN, R = 0.1) applied at the bottom loading hole, as illustrated in the figure. All translational and rotational degrees of freedom (DOF) of the top hole are constrained (UX=UY=UZ=0) and (URX=URY=0) except the Z-rotational DOF. These loading and constraint conditions closely represent the testing setup.
Figure 4 depicts the methodology for mapping the actual crack length in the bell crank structure. The crinkled nature of the fatigue crack path necessitates the use of FE to predict the crack growth direction. The experimentally obtained crack trajectory (including pre-crack length) is digitized at 102 discrete points, as illustrated in Figure 4(a). These points are input into commercial Abaqus FE analysis software to accurately reconstruct the irregular crack path for the analysis. Then, to determine the crack tip driving force at a given crack length, a local coordinate system is prescribed at the crack front, as shown in Figure 4(b). The origin is located at the midpoint of the crack front where the maximum value of KI(k) is expected. The local Cartesian coordinates (x1, x2, x3) are oriented such that the x1 and x2 directions are normal and parallel to the load line, respectively, while x3 is tangential to the crack front. FE simulations are iteratively conducted at distinct crack front locations to evaluate provisional values of KI, KII, and θk, assuming x1 as the virtual crack extension direction. Once the initial estimates are acquired, KI(k) is computed in the direction of θk, in which KII = 0. The stress intensity factor range ΔKI(k) can be computed as the difference between KI(k) evaluated at Pmax and Pmin. (The stress intensity factor range is calculated as ΔKI(k) = KI,max(k) - KI,min(k)).
3.4. Fractal Dimensions Determination of Fatigue Crack in Bell Crank Structure
Post-test, high-resolution digital images of the fatigue crack edges are obtained using an Olympus BX51M optical microscope at 100X magnification and a spatial resolution of 1090 pixels/mm to capture the crack-edge morphology. The grayscale crack image is converted to a binary image using OTSU's global thresholding, yielding an optimal threshold for segmenting crack-edge features. Fractal dimension, dF is determined from binary images using the box-counting algorithm scripted in Python. This approach superimposes a grid of box size, ε and records the number of intersecting boxes N(ε), by successively decreasing ε. A typical log2 N(ε) versus log2 ε is shown in Figure 5. The data show a prominent straight line, indicating that the crack edge exhibits self-similarity or fractal behavior. The (negative) slope of the line defines the fractal dimension corresponding to the crack tip position (crack length). Complete information needed to analyze the image and calculate the fractal dimension dF, is given in [24]. Fractal dimensions of the fatigue crack were determined at selected positions along the fatigue crack path. Once the fractal dimension value at a given crack length has been established, the fractal crack tip driving force model (Equation (4)) can be used to determine the corresponding crack tip driving force, and subsequently the fatigue crack growth rate.
4. Results and Discussion
4.1. Fatigue Crack Growth Response of Bell Crank Structure
The torturous fatigue crack path of the bell crank structure from the notch tip is shown in Figure 6. The crack trajectory deviates from the reference horizontal line at the start of the test and gradually curves as it propagates through the structure. This suggests that the crack front is driven by mixed-mode loading, with contributions from Mode I (opening) and Mode II (shearing). Crack growth tends toward the relatively slender limb due to higher stress magnitude and lower fracture resistance. It is expected that the crack growth path aligns itself perpendicular to the maximum (tensile) principal stress direction. The crack-tip stress field predicted by the FE simulation is discussed in Section 4.2. The fatigue crack growth test is terminated with the final crack length extension of a-a0 = 9.947 mm, measured from the notch tip along the curved crack trajectory. The final crack-tip position is located at 8.453 and 4.409 mm in the X1 and X2 directions, respectively, as illustrated in Figure 6.
The measured fatigue crack growth curve of the bell crank structure is shown in . A typical exponentially increasing trend of the crack length, () with the accumulated load cycles, is noted. The initial fatigue crack growth rate is relatively high, as reflected in the curve's initial slope. This is likely due to the long initial crack length, thereby resulting in a relatively high crack-tip driving force. Post-processing this curve enables the determination of the structure's fatigue crack growth rate at different crack lengths. However, for an engineering structure in field operation, the crack growth curve is unavailable a priori. Additionally, the crack geometry correction factor and the operating stress range are not readily available for determining the crack-tip driving force, Otherwise, the current crack growth rate of the structure could be established from the characteristic curve of the material. In this respect, FE simulation of the cracked structure can be performed to calculate . As deliberated in this work. The FE-calculated results are discussed in the next section.
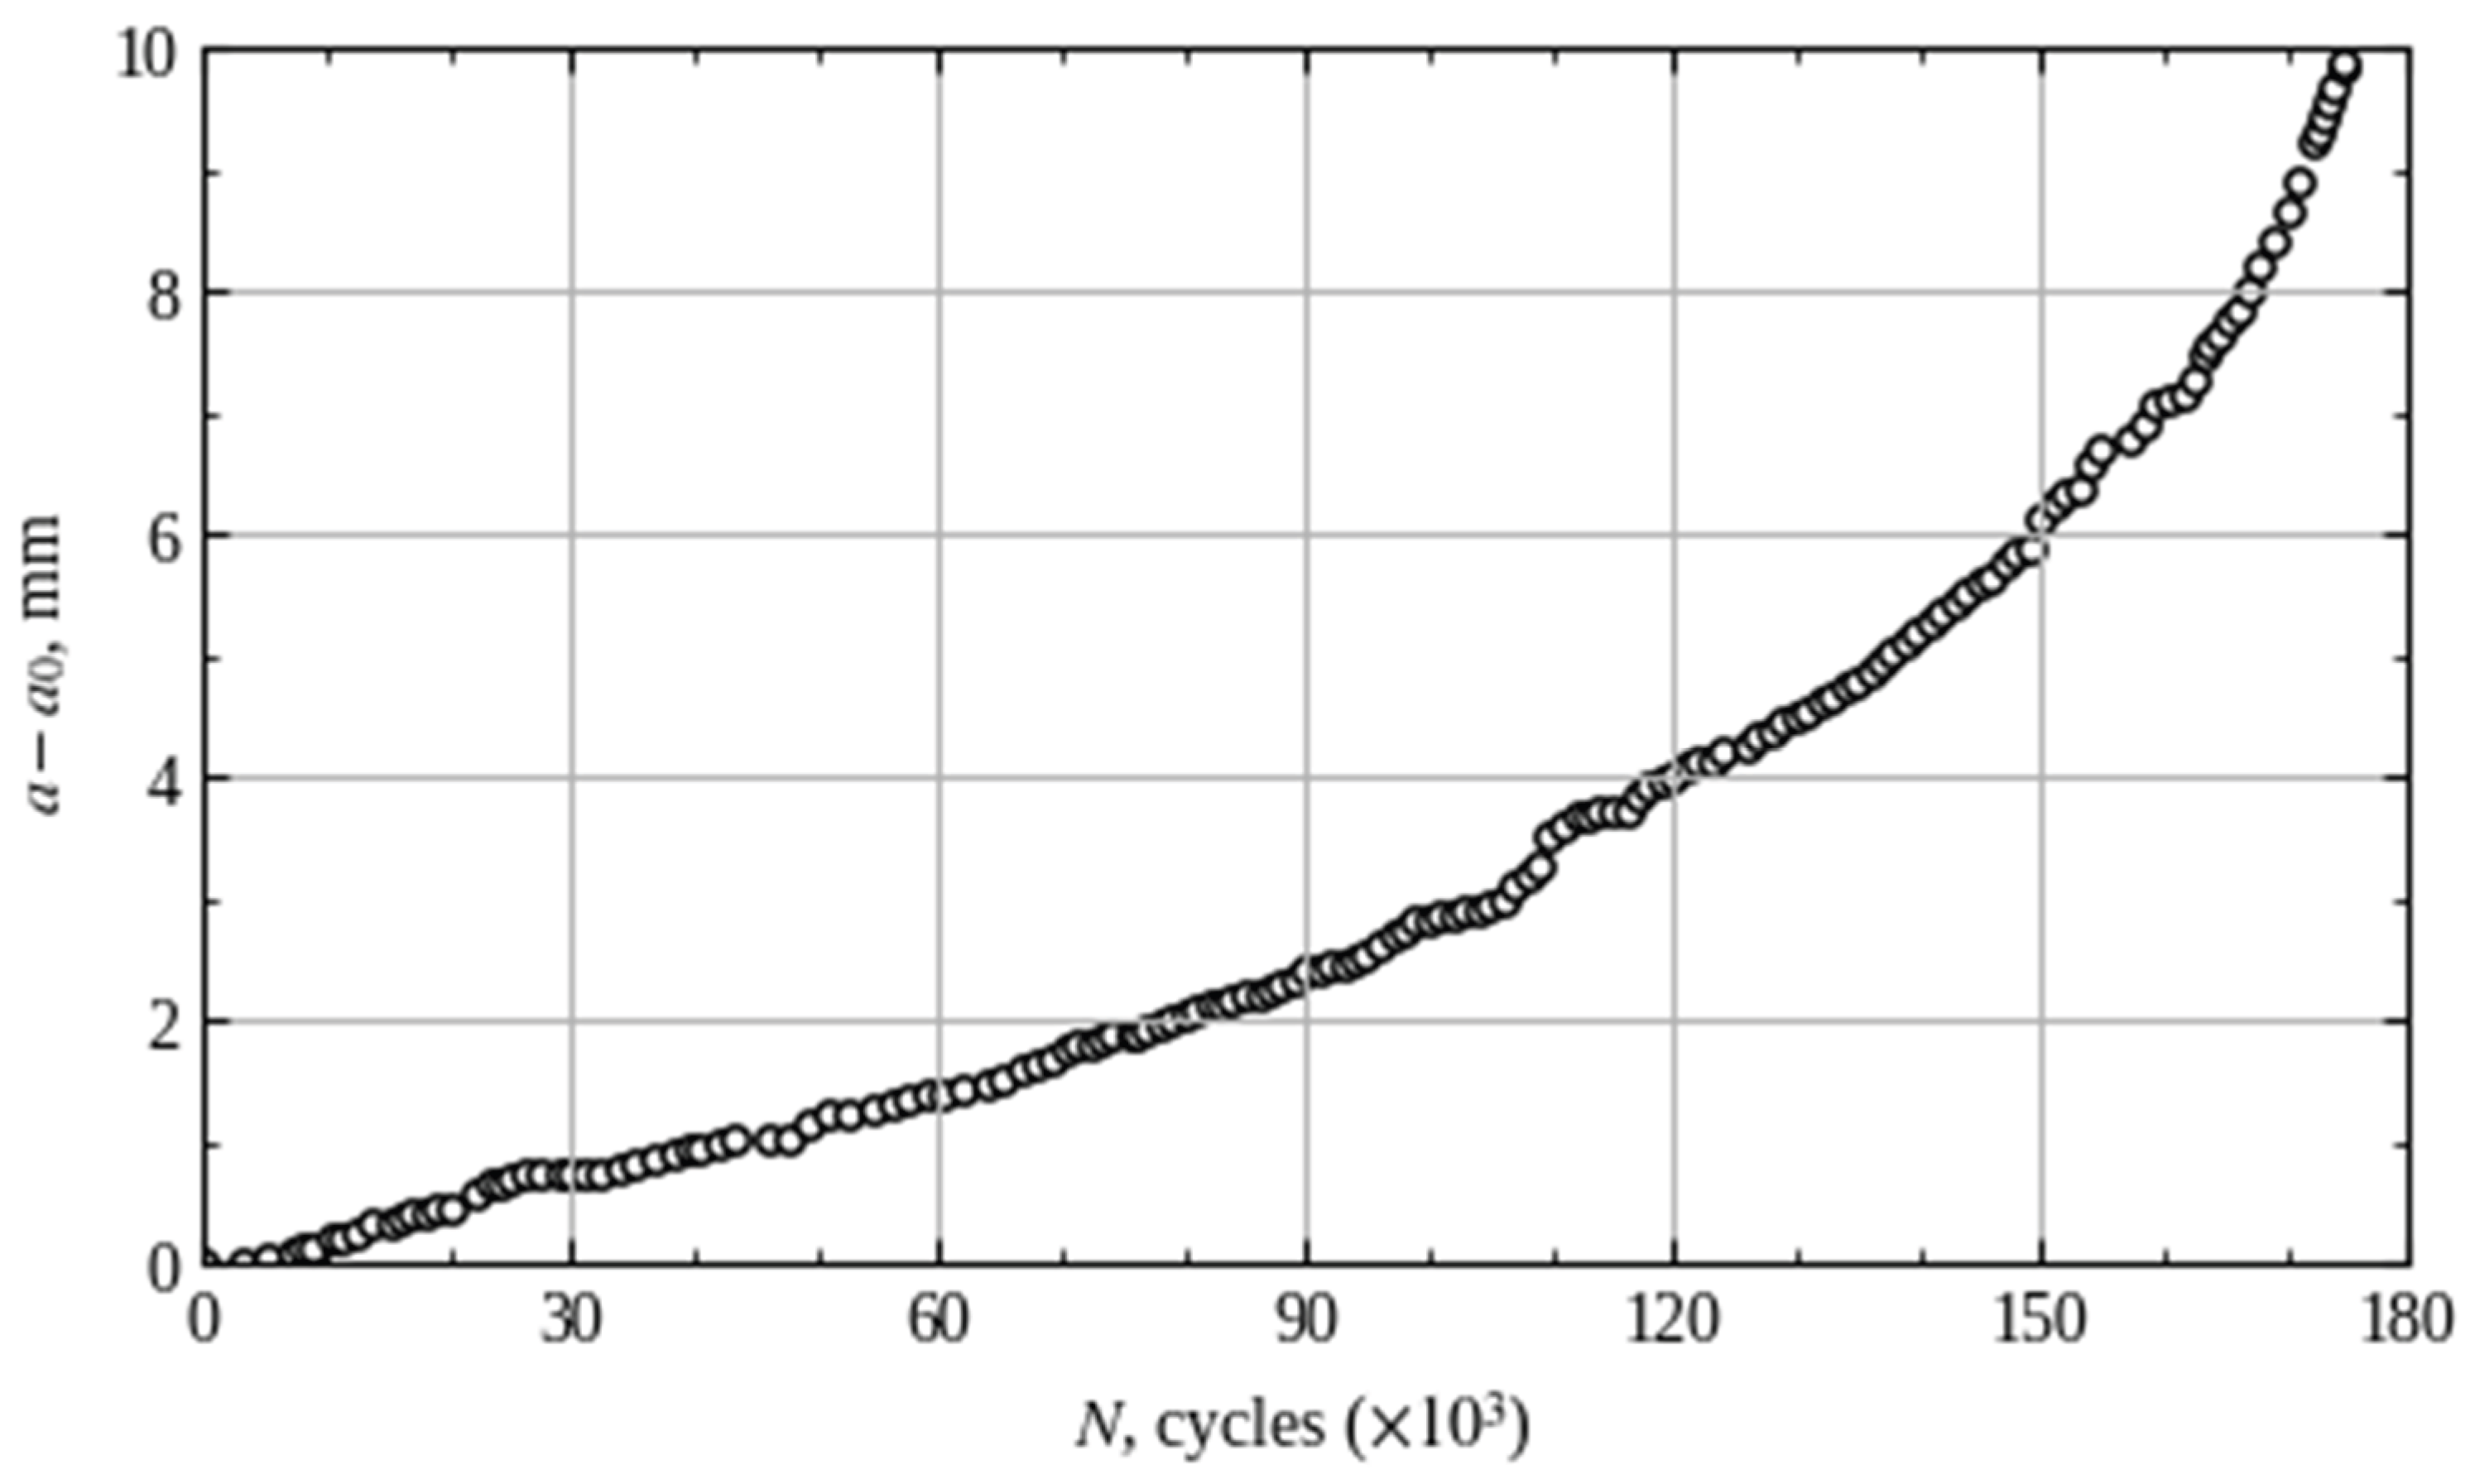
Figure 7.
Measured fatigue crack growth curve of the L-shaped bell crank structure.
4.2. FE Analysis Results of the Bell Crank Structure
Asymmetric limbs, the anterior hole, and the gradual crack propagation interact to cause stress redistribution in the bell crank structure as predicted in Figure 8 and Figure 9. The contour plots correspond to the peak load cycle. The evolution of the maximum principal stress field for different crack lengths ranging from 0.087 to 9.947 mm is illustrated in Figure 8. The (tensile) maximum principal stress direction is perpendicular to the crack trajectory and thus predominantly contributes to crack opening. A comparatively higher stress is distributed in the shorter (lower) limb of the asymmetric crank geometry, driving the crack to curve towards the shorter limb. The early asymmetric distribution of the crack-tip stress field intensifies as the crack grows along the curved trajectory. At the crack lengths of (a - ao) = 7.656 mm (Figure 8(c)), the crack tip stress field begins to acknowledge the presence of the through hole. The crack-tip stress field of the advancing crack interacts with the hole edge, thereby amplifying the mode-mixity of the crack-tip driving force. The fatigue crack growth test is terminated when the crack reaches the length (a - ao) = 9.947 mm. At this crack length, the crack-tip stress field strongly interacts with that of the hole, as illustrated in Figure 8(d). It is noted that a relatively larger size zone of high stress is confined to the crack tip for the mid-thickness plane of the bell crank structure (Figure 8(e)) when compared to the outer surface (Figure 8(d)). The reduced constraint on traction-free surface deformation (plane-stress condition) enables plastic flow, thereby reducing stresses, whereas the mid-plane experiences greater constraint in the thickness direction under the plane-strain condition.
The crack tip stress field and the corresponding shape of the plastic zone under a pure Mode-I crack loading are often examined in terms of the opening stress component. Figure 9 illustrates the crack-tip stress field for different crack lengths, expressed in terms of the global Y-stress component σyy. Butterfly-like stress contours with asymmetrical lobes are predicted. The lobes increase in size as the crack propagates, and the stress intensity factor range increases. Steeper stress gradients in the lower limb of the bell crank structure with smaller lobes drive the crack along the curved path, as represented in Figure 9(d). The plastic zone shape would be similar to the stress lobe geometry, as it traces the elastic-plastic boundary of the material. The relatively small plastic zone size renders the LEFM analysis appropriate.
Figure 10 shows the measured crack trajectory of Figure 6, digitized at 102 data points. The x-axis is perpendicular to the loading direction. The origin (x = 0) defines the transition between the pre-crack and crack growth regions and corresponds to an initial crack length (a – a₀ = 0). This coordinate system is specific to Figure 10 and distinct from the global frame described in Figure 4(b). The predicted direction of crack propagation, based on the Maximum Tangential Stress criterion (KII = 0), as stated in equation (3), at the respective locations along the crack path is illustrated by the vectors. The magnitude of the vectors is scaled proportionally to the Mode-I stress intensity factor range, ΔKI(k). Results show that the crack path predicted by the FE model is comparable to the observed crack trajectory. The prescribed crack growth criterion along KII = 0 direction successfully predicts the instantaneous local crack advance under mixed-mode loading. Additionally, it partially verifies the implementation of the contour-integral approach and the FE modeling strategy used in Abaqus FEA, providing a solid basis for extending this methodology to extract components of the stress intensity factor vector, as discussed next.
The evolution of contributions from various stress intensity factor (K) components, computed using FE analysis and plotted as a function of crack extension (a-a0), is illustrated in Figure 11. All components exhibit a consistent upward trend that accelerates as the crack grows. Although Mode-I (opening) remains the predominant fracture mechanism during crack propagation, significant mode-mixity is observed due to contributions from Mode-II (shearing) crack loading. The Mode-III (tearing) contribution is negligible at all calculation points and is therefore omitted from subsequent analyses. The Mode-I stress intensity factor, computed in the direction perpendicular to the load line, denoted as KI, increases from approximately 20 MPa√m near initiation to over 40 MPa√m at 10 mm crack extension. The values of KI, KII, and KIII shown in Figure 11 are computed at Pmax = 6.0 kN. However, the Mode-I stress intensity factor computed in the direction of crack propagation and at maximum load condition (Pmax), denoted as , follows a different curve as shown in Figure 11. Initially, it tracks KI closely but gradually diverges as the crack length increases, reaching 48 MPa√m at 10 mm. This divergence arises from contributions, which, while secondary, are non-negligible at higher crack lengths. Starting near 2 MPa√m, increases to 12 MPa√m in the final stages of the test, thus revealing significant shear interaction and crack path deviation potential. The stress intensity factor range in the crack propagation direction is computed as It is used as a basis for comparison with the fractal model.
The much-needed crack tip driving force, of an engineering structure where the crack geometry factor is unavailable can be established using FE simulation, as described above. However, validation of the FE-predicted results is required. In this study, the computed is validated using measured fractal dimensions along the fatigue crack edges.
4.3. Fractal Fracture Response of the Bell Crank Structure
The fractal dimension dF, of the propagating fatigue crack in the bell crank structure is plotted against the number of load cycles N, as shown in Figure 12 (reproduced from [34]). The plot represents the fractal nature of the growing fatigue crack edges. The scatter in the data is intrinsic to the material's fatigue response, particularly at low stress amplitudes. Such scatter is attributed to the physical heterogeneity of the material, in which the distribution of near-tip stress and strain is influenced by microstructural discontinuities, inclusions, and local inhomogeneities, thereby leading to a stochastic fracture process [35]. The result shows that dF fluctuates between 1.00 and 1.05 during the initial loading up to ~75×103 cycles, suggesting a Euclidean crack-like profile. This is followed by a gradual increase in the fractal dimension, reflecting enhanced branching and sub-branching patterns and a progressively rougher fracture-surface and crack-edge morphology. In the final fracture stage, dF rises sharply, peaking around 1.17 and 1.18 as the test terminates. The evolution trend of the fractal dimension is similar to that observed for the fatigue crack growth behavior, a-N of the bell crank structure (Figure 7) and the standard specimen geometry [24,34], Therefore, the fractal crack-tip driving force model described by equation (4) can be used to calculate the corresponding crack-tip driving forces.
4.4. Validation of FE-calculated Crack Tip Driving Force using Fractal Measurements
The fractal dimensions of the fatigue crack in the bell crank structure, plotted as a function of the applied load cycles in Figure 12, are established using the morphology of the crack edges, which inherit the plane-stress condition. Consequently, the resulting fractal-based , predicted using equation (4) also represents the plane-stress crack-tip driving force. However, the FE-predicted is based on the computed value at the mid-thickness plane of the bell crank plate structure and represents the plane strain condition. Therefore, the fractal-based values are corrected for the Poisson’s ratio effect, such that . The corrected is then compared with FE-calculated values, plotted as a function of the crack length (a – ao), shown in Figure 13. It is acknowledged that the deterministic FE-predicted data display a smooth trend, whereas the measured fractal-based data exhibit statistical scatter. Additionally, the data represent the crack tip driving forces in the Paris crack growth regime, with the starting of about 18 MPa√m for the AISI 410 steel. The observed high degree of concordance between the two data sets validates the FE-predicted of the asymmetrical L-shaped bell crank structure.
The growth rates of the fatigue crack in the bell crank structure can now be established using the validated FE-computed contour integrals of as illustrated in Figure 14 for the Paris crack growth regime. The standard fatigue crack growth rate curve for AISI 410 steel using the compact tension (C(T)) specimen geometry is shown for comparison [24]. The Paris law for the exponential crack growth regime is given in Table 1. Good agreement between the validated FE-predicted and the standard test curve is demonstrated. The spread of the measured multifractal data used in the validation exercise is shown in Figure 14. The result indicates that most of the predicted fatigue crack growth data for the bell crank structure lie within the 99% confidence interval of the reference test data. This supports the validity of the crack tip driving force model, described in equation (4), for validating the FE-predicted values.
5. Conclusions
Finite element (FE)-based crack-tip driving force solutions for complex structural components have been established using an asymmetric L-shaped bell crank geometry as a representative structure. The bell crank structure is fabricated from AISI 410 martensitic stainless steel. The FE-predicted ΔKI results for crack growth in the Paris regime have been independently validated using the multifractal stress-intensity-factor model. It can be concluded that:
- The fatigue crack in the bell crank structure is driven by a combined Mode-I (opening) and Mode-II (shearing) crack tip loading along a curved crack path trajectory, as dictated by the asymmetric stress distribution.
- The fatigue crack edge exhibits fractality with fractal dimensions ranging from 1.00 (Euclidean) to 1.18 over the crack length, (a-ao) up to 9.947 mm.
- The FE-calculated crack tip driving forces of the bell crank structure compare well with those computed based on the corrected crack edge fractal dimensions, thus validating the simulation outcomes.
- Fatigue crack growth rates determined from crack-tip driving forces based on the validated FE-computed contour integrals are comparable to those obtained through ASTM standard tests.
Author Contributions
Conceptualization, M.H.H. and M.N.T.; Methodology, M.H.H. and M.N.T.; Software, M.H.H. and M.N.T.; Validation, M.H.H. and M.N.T.; Formal Analysis, M.H.H. and M.N.T.; Investigation, M.H.H. and M.N.T.; Resources, M.H.H., S.S.R.K. and M.N.T.; Data Curation, M.H.H. and M.N.T.; Writing – Original Draft Preparation, M.H.H. and M.N.T.; Writing – Review & Editing, M.H.H., S.S.R.K. and M.N.T.; Visualization, M.H.H., S.S.R.K. and M.N.T.; Supervision, M.N.T.; Project Administration, M.N.T.; Funding Acquisition, S.S.R.K. and M.N.T. All authors have read and agreed to the published version of the manuscript.
Funding
This research is funded by the Universiti Teknologi Malaysia under the UTM Global Research Alumni Fellowship (GRAF) 2025.
Data Availability Statement
Data is contained within the article.
Conflicts of Interest
The authors declare no conflict of interest.
References
- Díaz, F.A.; Vasco-Olmo, J.M.; López-Alba, E.; Felipe-Sesé, L.; Molina-Viedma, A.J.; Nowell, D. Experimental evaluation of effective stress intensity factor using thermoelastic stress analysis and digital image correlation. Int J Fatigue 2020, 135, 105567. [Google Scholar] [CrossRef]
- Wang, S.; Zhou, S.; Yang, B.; Xiao, S.; Yang, G.; Zhu, T. Effective stress intensity factor range for fatigue cracks propagating in mixed mode I-II loading. Eng Fract Mech 2024, 312, 110641. [Google Scholar] [CrossRef]
- De Oliveira Miranda, A.C.; Antunes, M.A.; Guamán Alarcón, M.V.; Meggiolaro, M.A.; Pinho De Castro, J.T. Use of the stress gradient factor to estimate fatigue stress concentration factors K. Eng Fract Mech 2019, 206, 250–266. [Google Scholar] [CrossRef]
- Anderson, T.L. Fracture Mechanics: Fundamentals and Applications, 3rd ed.; CRC Press, 2017. [Google Scholar] [CrossRef]
- Tada, H.; Paris, P.C.; Irwin, G.R. The Stress Analysis of Cracks Handbook, Third Edition ed; ASME Press, 2000. [Google Scholar] [CrossRef]
- Kobayashi, A.S. STRESS INTENSITY FACTORS HANDBOOK; Co-editor. Exp Tech; Murakami, Y., Hasebe, M.T., Itoh, Y., Kishimoto, K., Miyata, H., Miyazaki, N., Terada, H., Tohgo, K., Yuuki, R., Eds.; 1994; Volume 18, pp. 46–46. [Google Scholar] [CrossRef]
- The compendium of stress intensity factors: by, D.P. Rooke and D. J. Cartwright, Pendragon House, Inc., Palo Alto, California (1976) 330 pages ($37,50). Int J Fract 1978, 14, R143–R143. [CrossRef]
- Kriaa, Y.; Hersi, Y.; Ammar, A.; Zouari, B. Quasi-Static and Dynamic Crack Propagation by Phase Field Modeling: Comparison with Previous Results and Experimental Validation. Appl Sci 2024, 14, 4000. [Google Scholar] [CrossRef]
- Chen, Z.; Dai, Y.; Liu, Y. Structural fatigue crack propagation simulation and life prediction based on improved XFEM-VCCT. Eng Fract Mech 2024, 310, 110519. [Google Scholar] [CrossRef]
- Xin, H.; Liu, J.; Correia, J.A.F.O.; Berto, F.; Veljkovic, M.; Qian, G. Mixed-mode fatigue crack propagation simulation by means of G eq and walker models of the structural steel S355. Theor Appl Fract Mech 2023, 123, 103717. [Google Scholar] [CrossRef]
- Li, P.; Li, W.; Li, B.; Yang, S.; Shen, Y.; Wang, Q.; et al. A review on phase field models for fracture and fatigue. Eng Fract Mech 2023, 289, 109419. [Google Scholar] [CrossRef]
- Bui, T.Q.; Hu, X. A review of phase-field models, fundamentals and their applications to composite laminates. Eng Fract Mech 2021, 248, 107705. [Google Scholar] [CrossRef]
- Zhang, W.; Su, Y.; Jiang, Y.; Hu, Z.; Bi, J.; He, W. Data-driven fatigue crack propagation and life prediction of tubular T-joint: A fracture mechanics based machine learning surrogate model. Eng Fract Mech 2024, 311, 110556. [Google Scholar] [CrossRef]
- Zhang, X.; Zhao, T.; Liu, Y.; Chen, Q.; Wang, Z.; Wang, Z. A data-driven model for predicting the mixed-mode stress intensity factors of a crack in composites. Eng Fract Mech 2023, 288, 109385. [Google Scholar] [CrossRef]
- Wang, H.; Li, B.; Gong, J.; Xuan, F.-Z. Machine learning-based fatigue life prediction of metal materials: Perspectives of physics-informed and data-driven hybrid methods. Eng Fract Mech 2023, 284, 109242. [Google Scholar] [CrossRef]
- Liang, Z.; Wang, X.; Cui, Y.; Xu, W.; Zhang, Y.; He, Y. A new data-driven probabilistic fatigue life prediction framework informed by experiments and multiscale simulation. Int J Fatigue 2023, 174, 107731. [Google Scholar] [CrossRef]
- Fang, X.; Liu, G.; Wang, H.; Tian, X. A digital twin modeling method based on multi-source crack growth prediction data fusion. Eng Fail Anal 2023, 154, 107645. [Google Scholar] [CrossRef]
- Tasdemir, B. Determınatıon of stress intensity factor using digital image correlation method. Matter 2015, 2, 20–24. [Google Scholar]
- Torabi, A.R.; Bahrami, B.; Ayatollahi, M.R. Experimental determination of the notch stress intensity factor for sharp V-notched specimens by using the digital image correlation method. Theor Appl Fract Mech 2019, 103, 102244. [Google Scholar] [CrossRef]
- Singh, J.J.; Davis, W.T.; Crews, J., Jr. The application of acoustic emission technique to fatigue crack measurement. 1974. [Google Scholar]
- Roberts, T.M.; Talebzadeh, M. Acoustic emission monitoring of fatigue crack propagation. J Constr Steel Res 2003, 59, 695–712. [Google Scholar] [CrossRef]
- Zanganeh, M.; Tomlinson, R.A.; Yates, J.R. T-stress determination using thermoelastic stress analysis. J Strain Anal Eng Des 2008, 43, 529–537. [Google Scholar] [CrossRef]
- Farahani, B.V.; Tavares, P.J.; Moreira, P.M.G.P.; Belinha, J. Stress intensity factor calculation through thermoelastic stress analysis, finite element and RPIM meshless method. Eng Fract Mech 2017, 183, 66–78. [Google Scholar] [CrossRef]
- Exploiting fractal features to determine fatigue crack growth rates of metallic materials. Eng Fract Mech 2022, 270, 108589. [CrossRef]
- Hashmi, M.H.; Abdul-Hamid, M.F.; Abdul-Latif, A.; Tamin, M.N.; Khattak, M.A. Fractal Dimensions of a Propagating Fatigue Crack in Metallic Materials. J Fail Anal Prev 2021, 21, 1644–1651. [Google Scholar] [CrossRef]
- Rice, J.R. A Path Independent Integral and the Approximate Analysis of Strain Concentration by Notches and Cracks. J Appl Mech 1968, 35, 379–386. [Google Scholar] [CrossRef]
- Erdogan, F.; Sih, G.C. On the Crack Extension in Plates Under Plane Loading and Transverse Shear. J Basic Eng 1963, 85, 519–525. [Google Scholar] [CrossRef]
- Cotterell, B.; Rice, J.R. Slightly curved or kinked cracks. Int J Fract 1980, 16, 155–169. [Google Scholar] [CrossRef]
- Hussain, M.; Pu, S.; Underwood, J. Strain Energy Release Rate for a Crack Under Combined Mode I and Mode II. In Natl. Symp. Fract. Mech., 100 Barr Harbor Drive, PO Box C700; p. 2-2–27; Irwin, G, Ed.; ASTM International: West Conshohocken, PA 19428-2959, 1974. [Google Scholar] [CrossRef]
- Palaniswamy, K.; Knauss, W.G. On the Problem of Crack Extension in Brittle Solids Under General Loading. In Mech. Today; Elsevier, 1978; pp. 87–148. [Google Scholar] [CrossRef]
- Maiti, S.K.; Smith, R.A. Comparison of the criteria for mixed mode brittle fracture based on the preinstability stress-strain field Part I: Slit and elliptical cracks under uniaxial tensile loading. Int J Fract 1983, 23, 281–295. [Google Scholar] [CrossRef]
- Theocaris, P.S. A higher-order approximation for the T-criterion of fracture in biaxial fields. Eng Fract Mech 1984, 19, 975–991. [Google Scholar] [CrossRef]
- Sih, G.C. Strain-energy-density factor applied to mixed mode crack problems. Int J Fract 1974, 10, 305–321. [Google Scholar] [CrossRef]
- Hashmi, M.H.; Koloor, S.S.R.; Abdul-Hamid, M.F.; Tamin, M.N. Fractal Analysis for Fatigue Crack Growth Rate Response of Engineering Structures with Complex Geometry. Fractal Fract 2022, 6, 635. [Google Scholar] [CrossRef]
- Hashmi, M.H.; Abdul-Hamid, M.F.; Tamin, M.N. A robust probabilistic fatigue crack growth model based on walker’s crack growth rate equation for metallic materials. Probabilistic Eng Mech 2023, 72, 103445. [Google Scholar] [CrossRef]
Figure 1.
Schematic representation of the contour-integral FE framework for ΔK evaluation; (a) successive contours Γ1, Γ2, Γ3 for computation of J-integral around a crack tip, (b) definition of the crack kink angle (θk).
Figure 1.
Schematic representation of the contour-integral FE framework for ΔK evaluation; (a) successive contours Γ1, Γ2, Γ3 for computation of J-integral around a crack tip, (b) definition of the crack kink angle (θk).
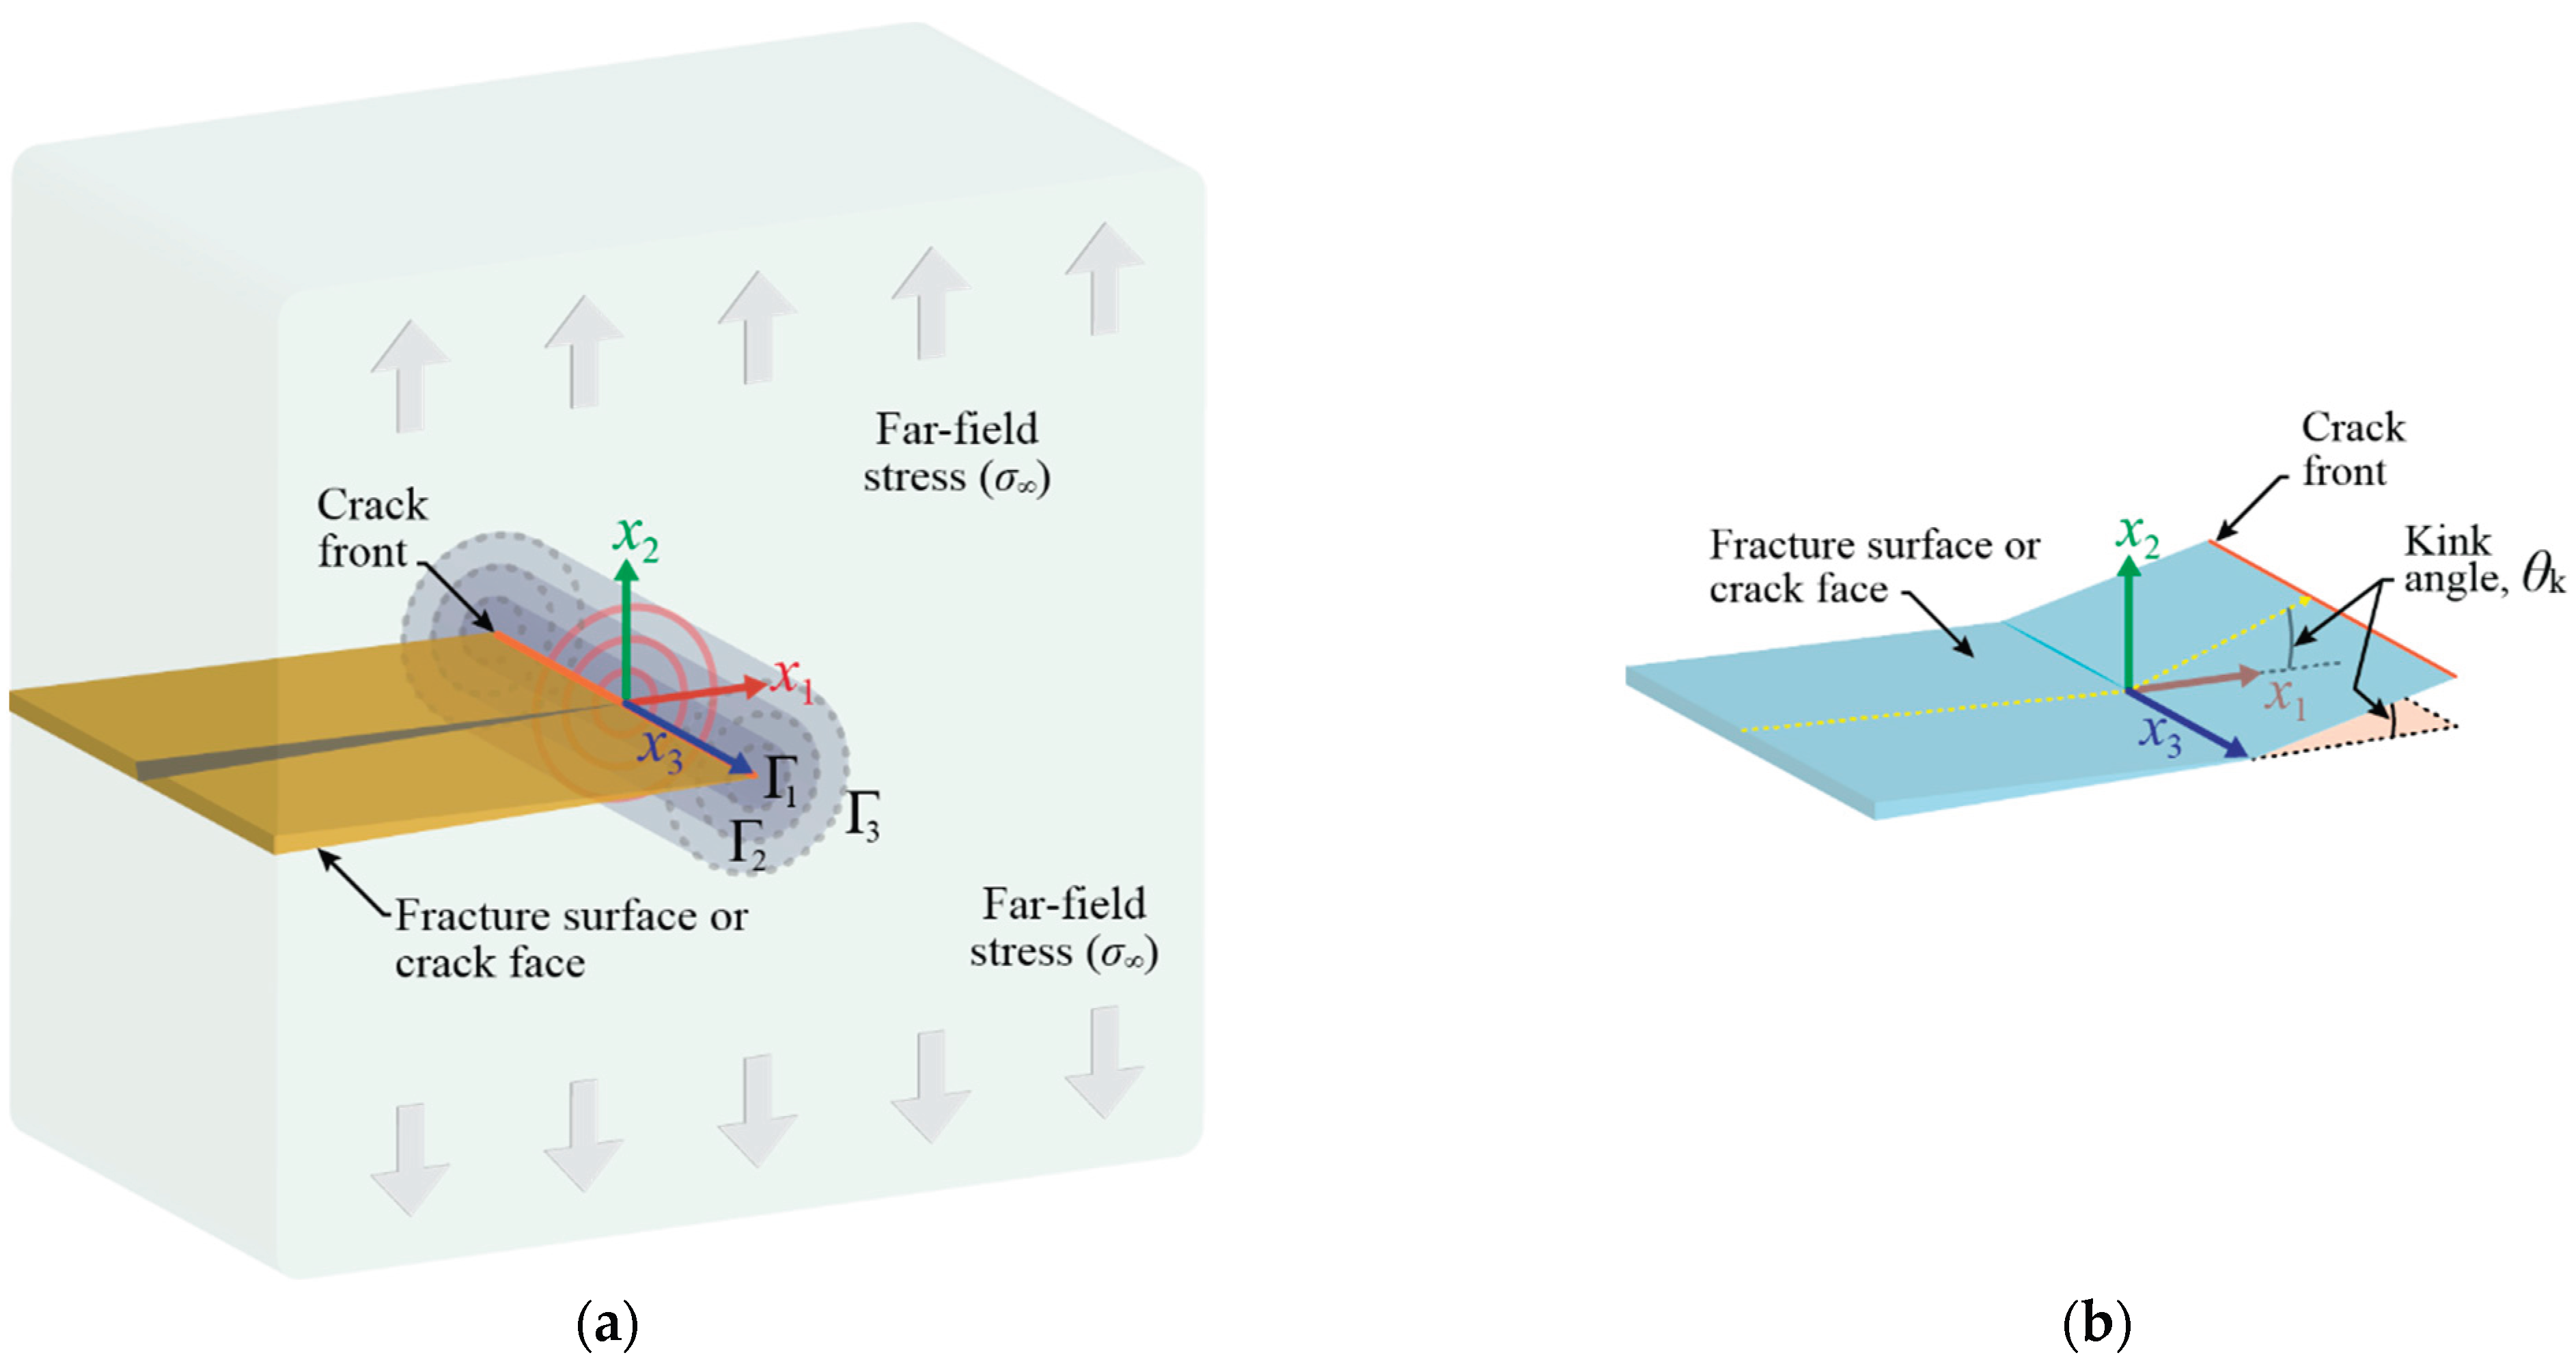
Figure 2.
Case study geometry of the L-shaped bell crank plate structure with a thickness of 20 mm. Dimensions are in mm.
Figure 2.
Case study geometry of the L-shaped bell crank plate structure with a thickness of 20 mm. Dimensions are in mm.
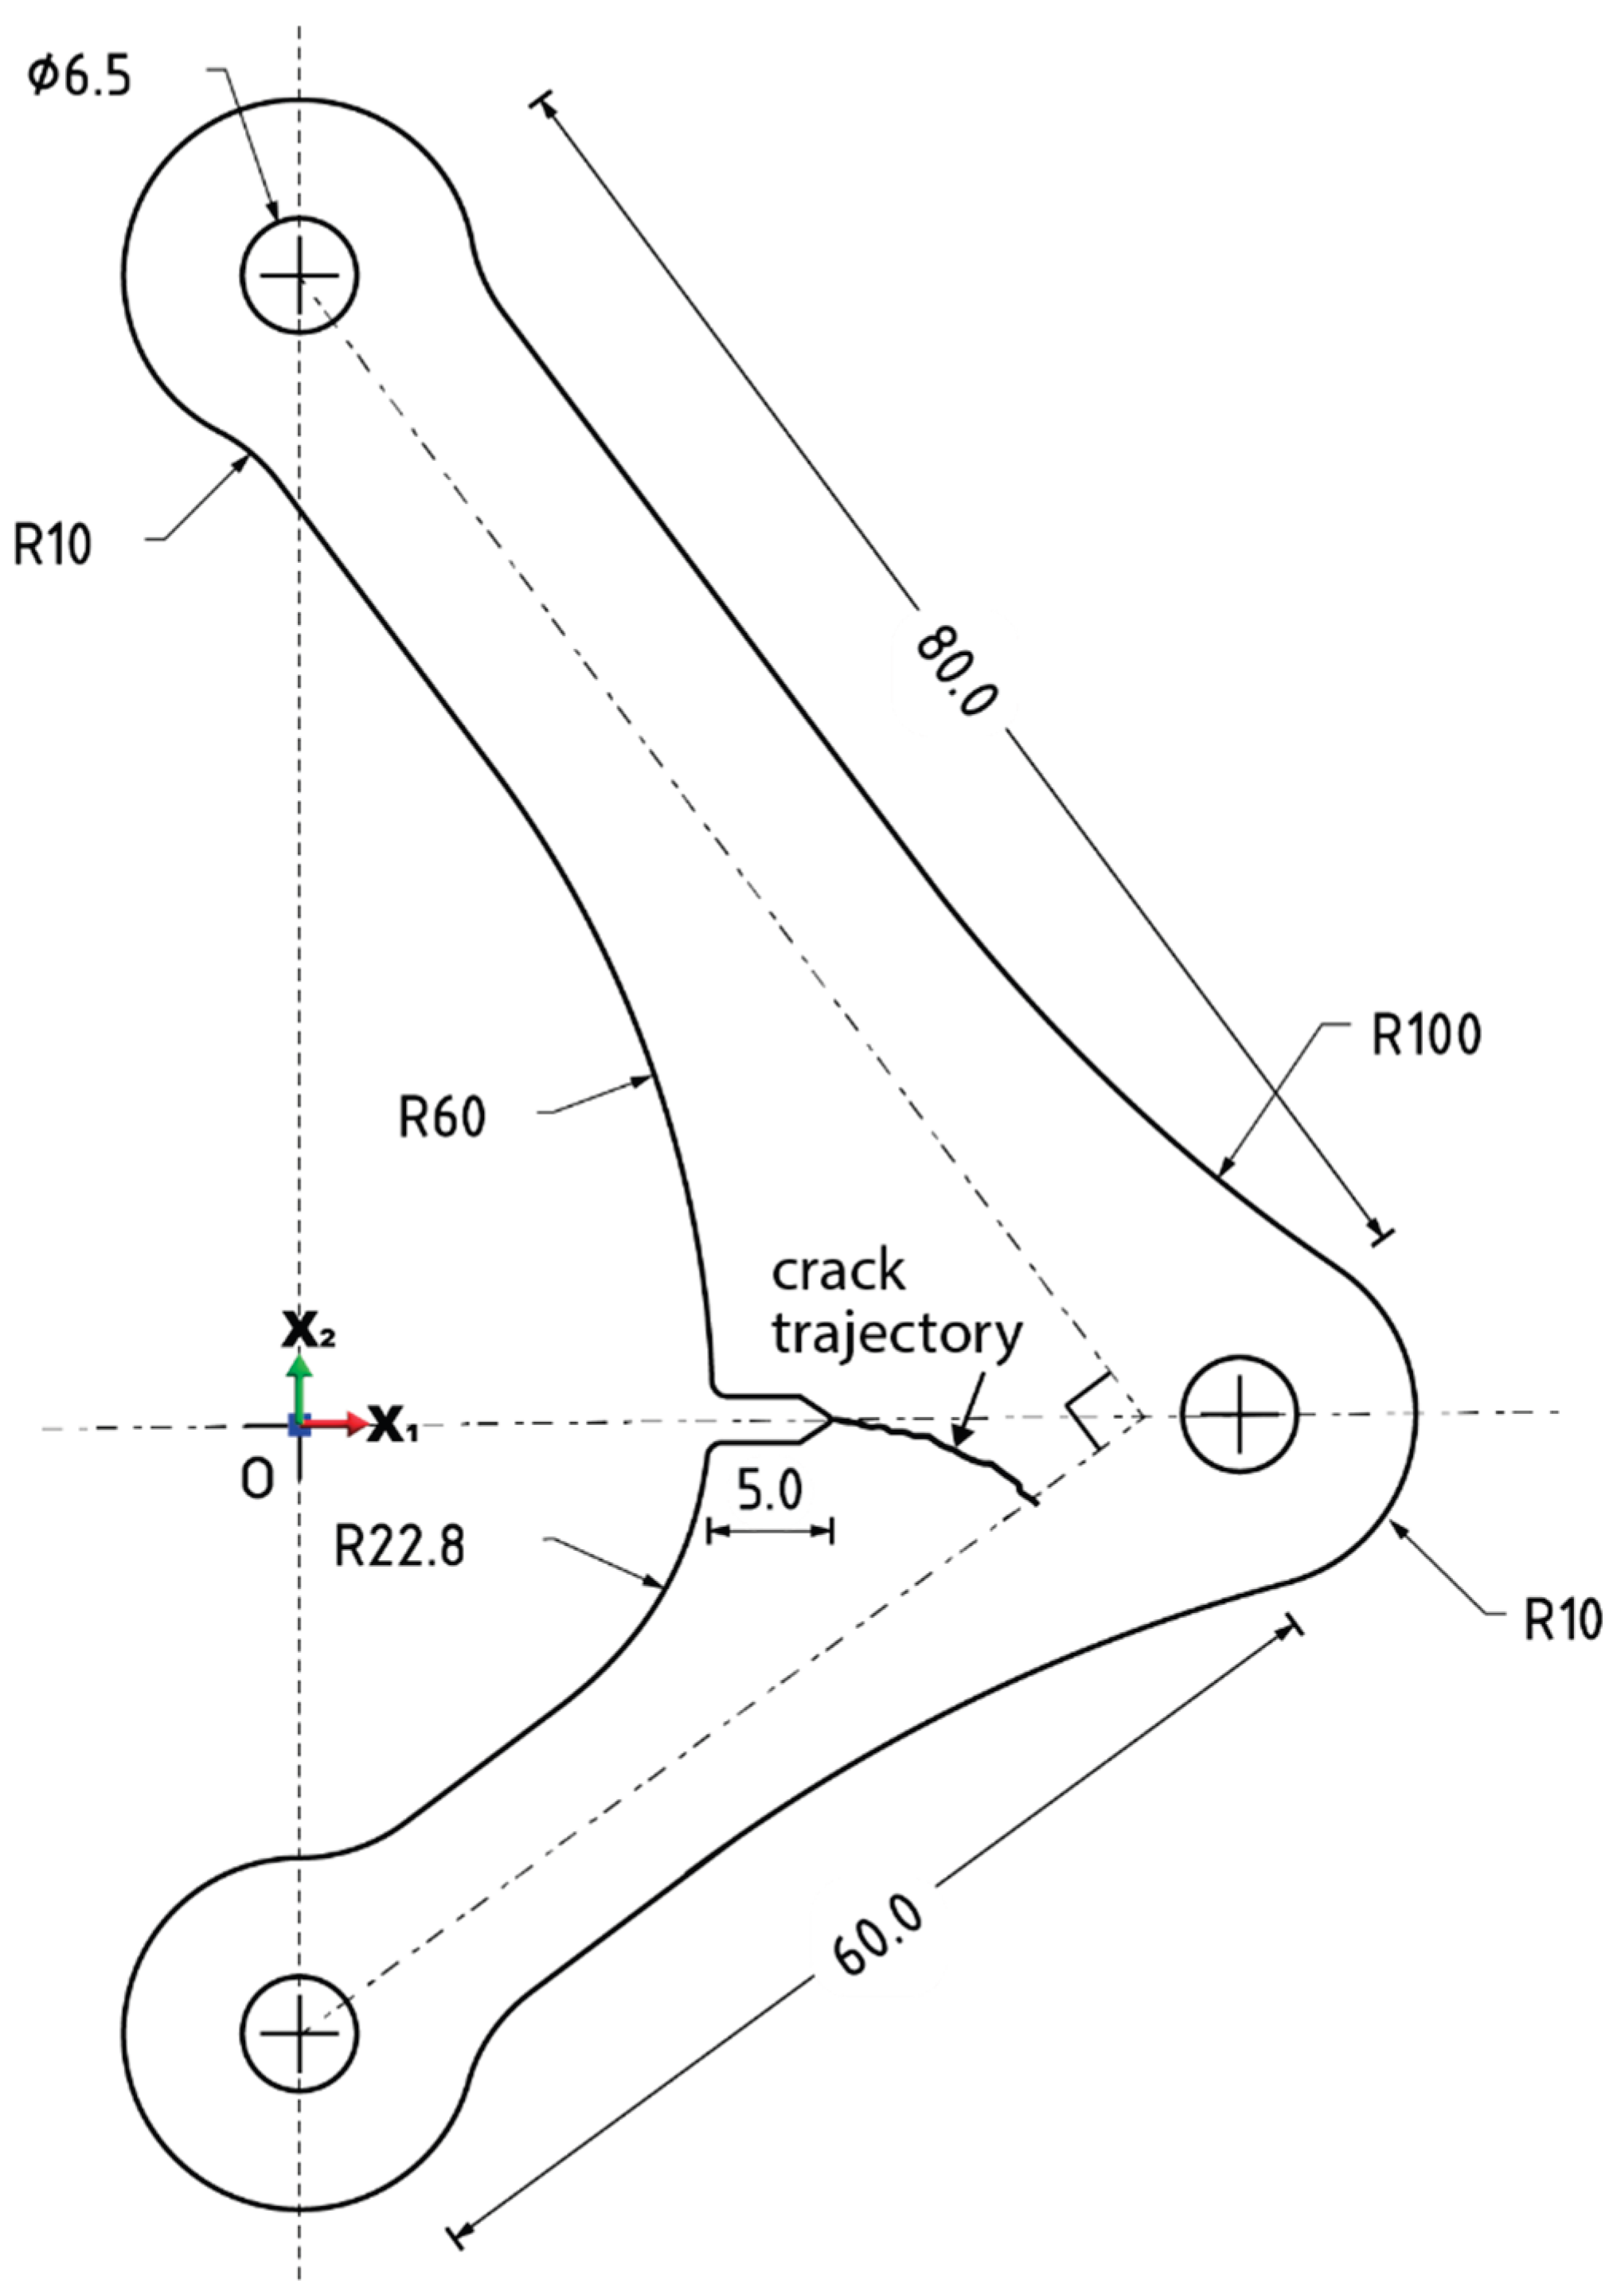
Figure 3.
Discretized Finite element model geometry with non-uniform mesh topology showing higher element mesh density in the crack front and geometric discontinuity regions to capture steep stress gradients. The applied loading and boundary conditions are indicated. .
Figure 3.
Discretized Finite element model geometry with non-uniform mesh topology showing higher element mesh density in the crack front and geometric discontinuity regions to capture steep stress gradients. The applied loading and boundary conditions are indicated. .
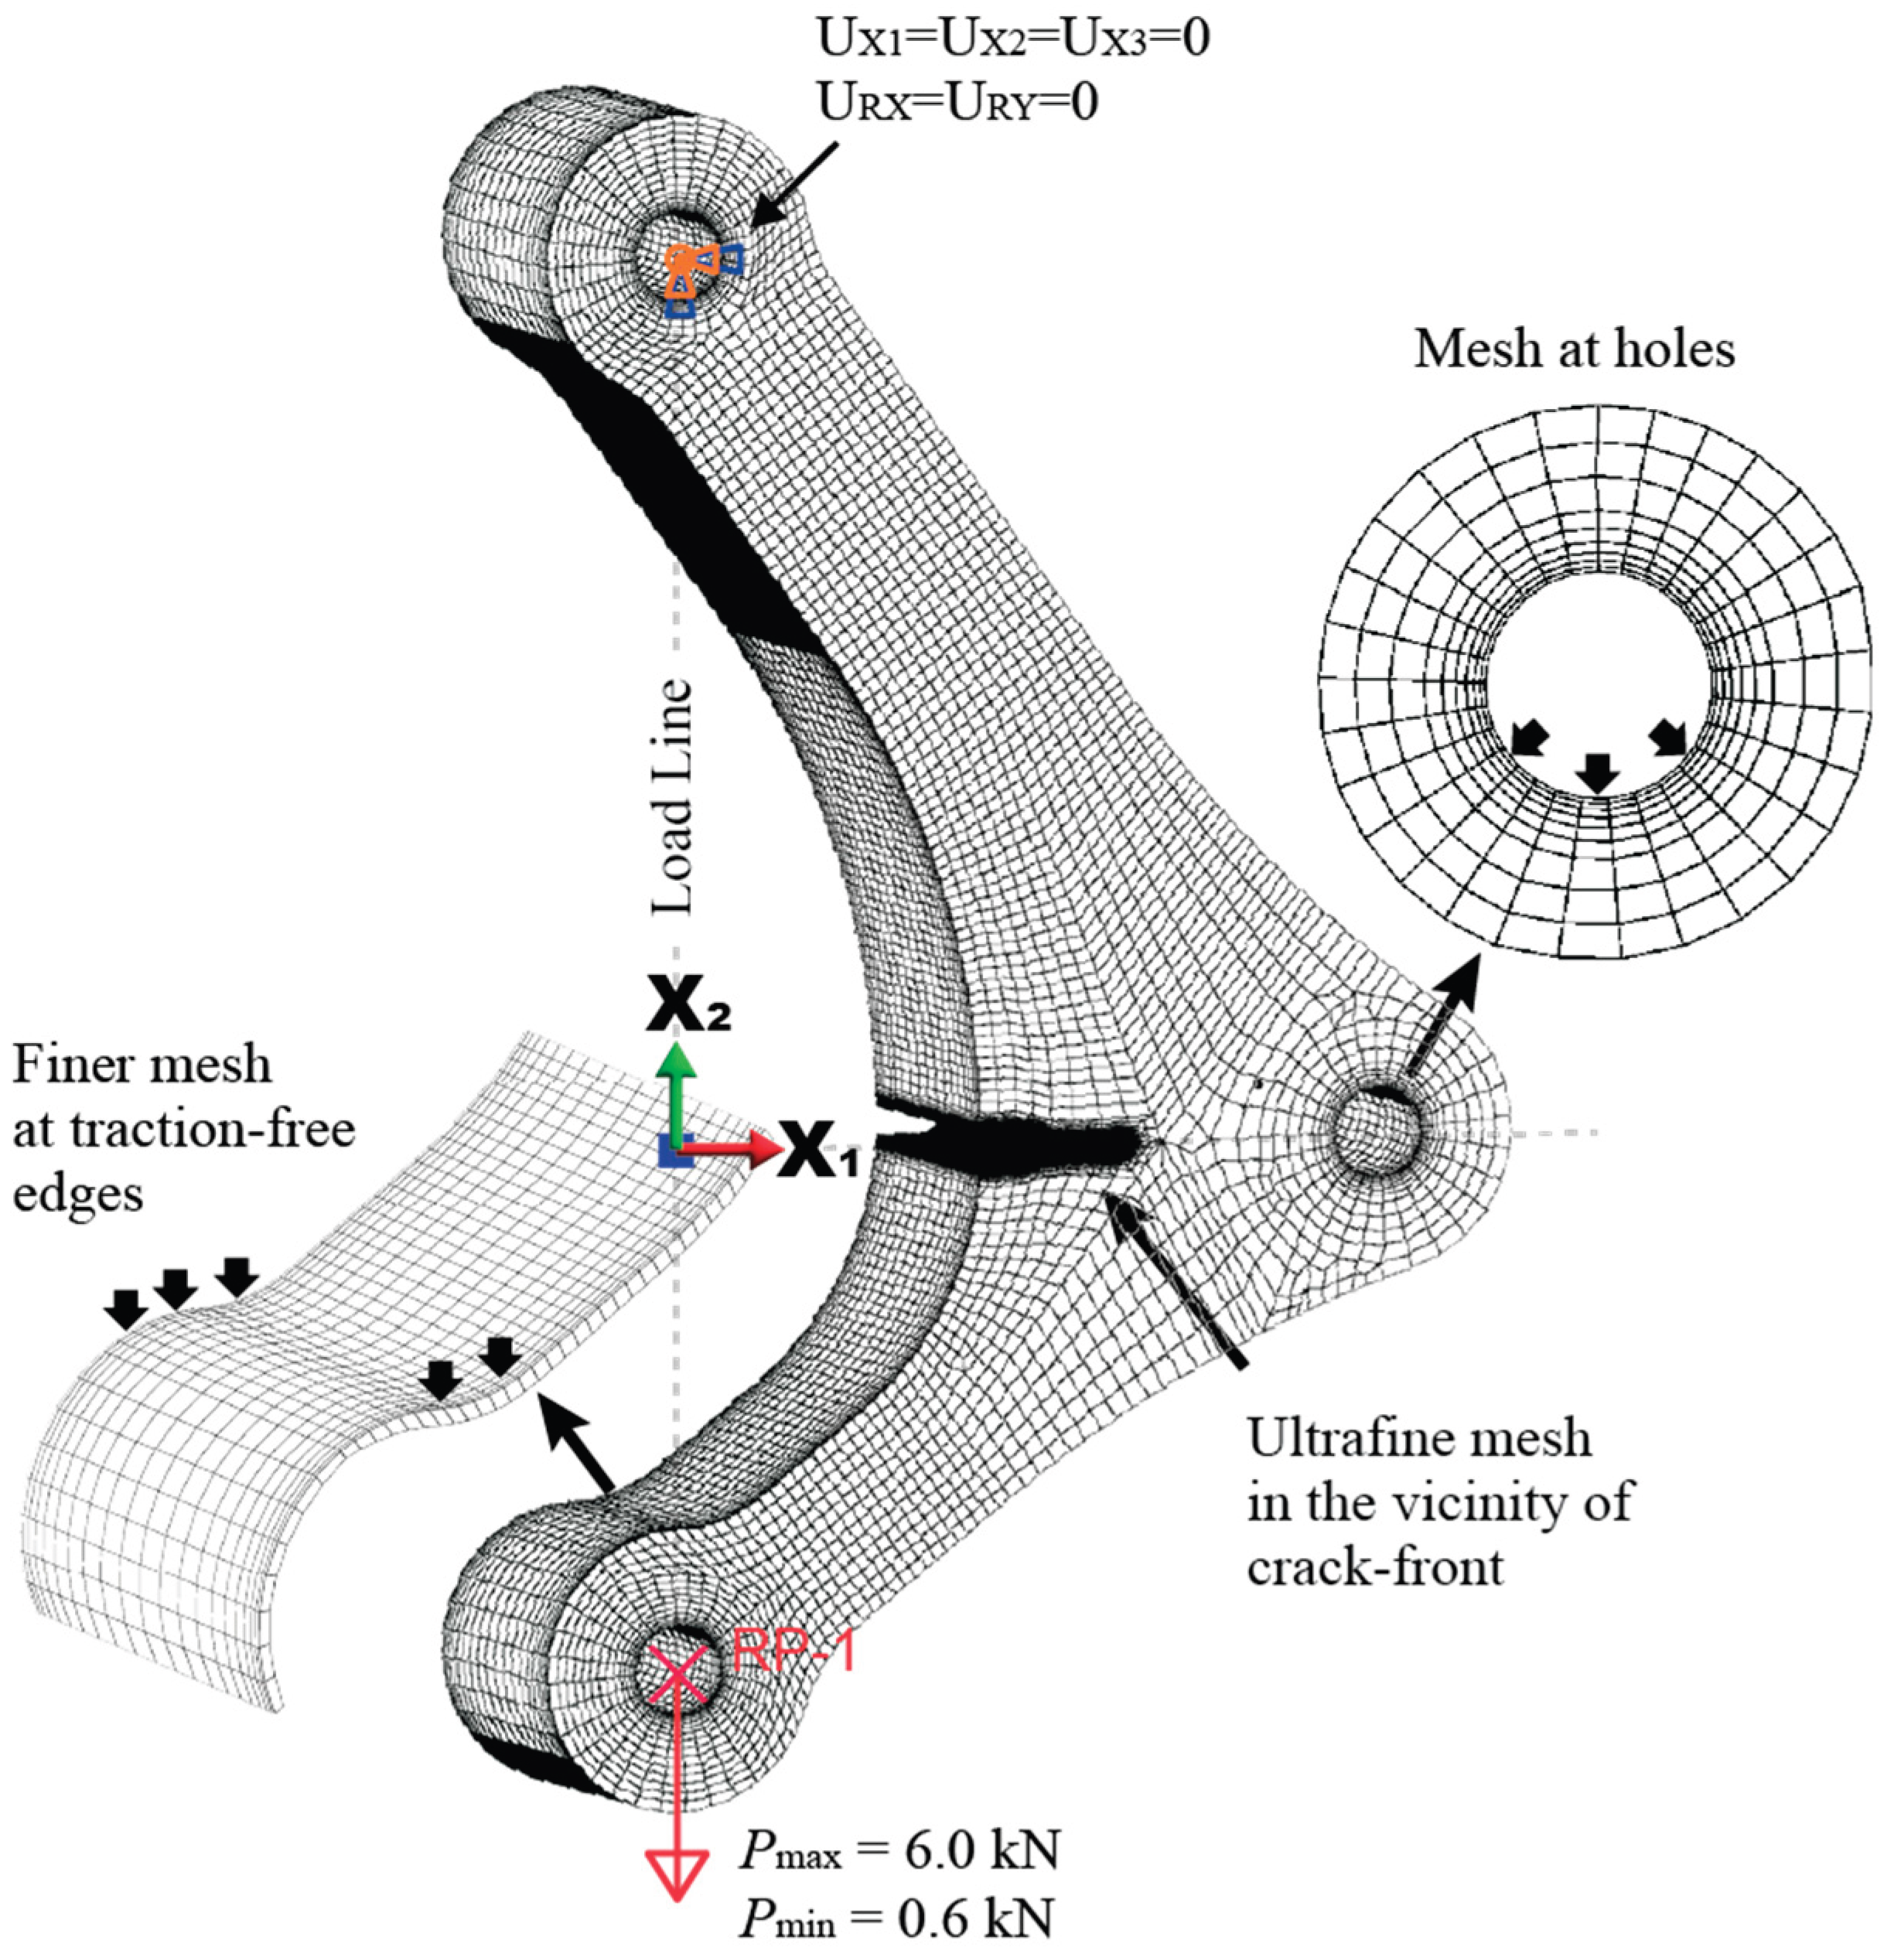
Figure 4.
Methodology for FE modelling of the irregular crack path: (a) digitization of the experimentally obtained crack trajectory (n = 102 points) for precise reconstruction in the FE model, (b) 3D view illustrating the local coordinate system (LCS) orientation on the crack surface.
Figure 4.
Methodology for FE modelling of the irregular crack path: (a) digitization of the experimentally obtained crack trajectory (n = 102 points) for precise reconstruction in the FE model, (b) 3D view illustrating the local coordinate system (LCS) orientation on the crack surface.
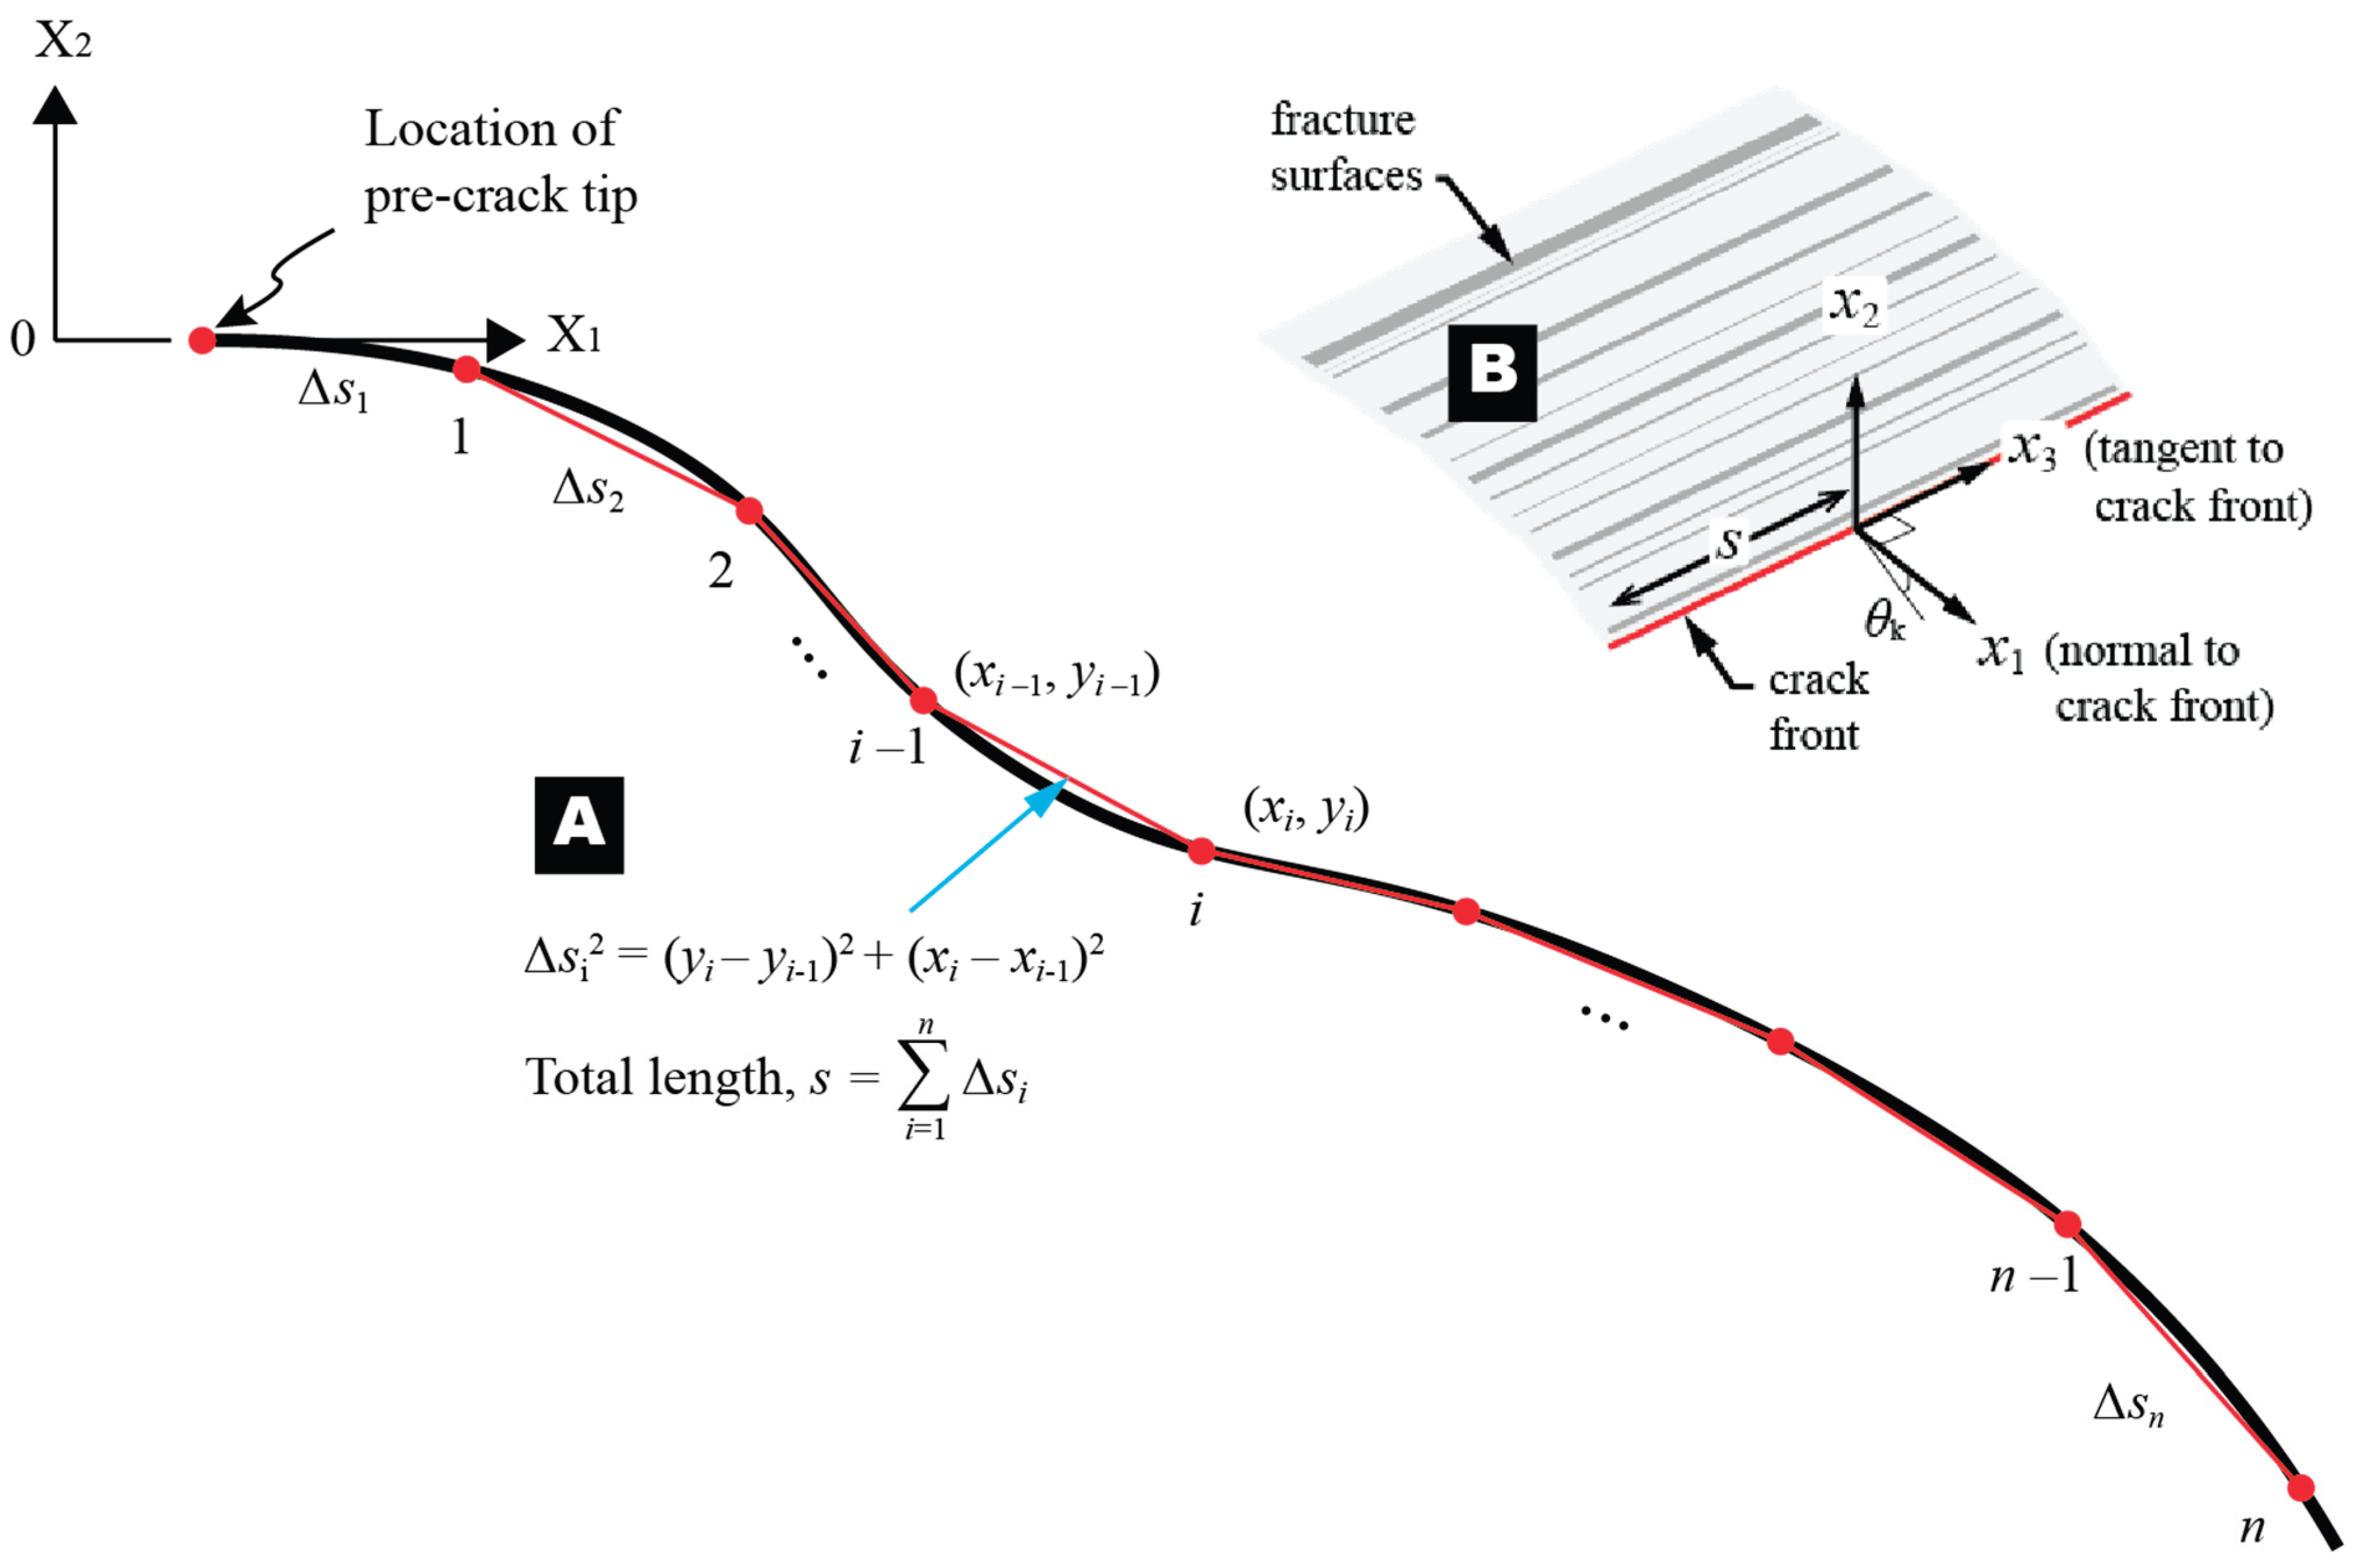
Figure 5.
Results of the box-counting method for a typical location (crack length) along the fatigue crack edge. The negative slope of the best-fit straight line determines the fractal dimension at the crack tip.
Figure 5.
Results of the box-counting method for a typical location (crack length) along the fatigue crack edge. The negative slope of the best-fit straight line determines the fractal dimension at the crack tip.
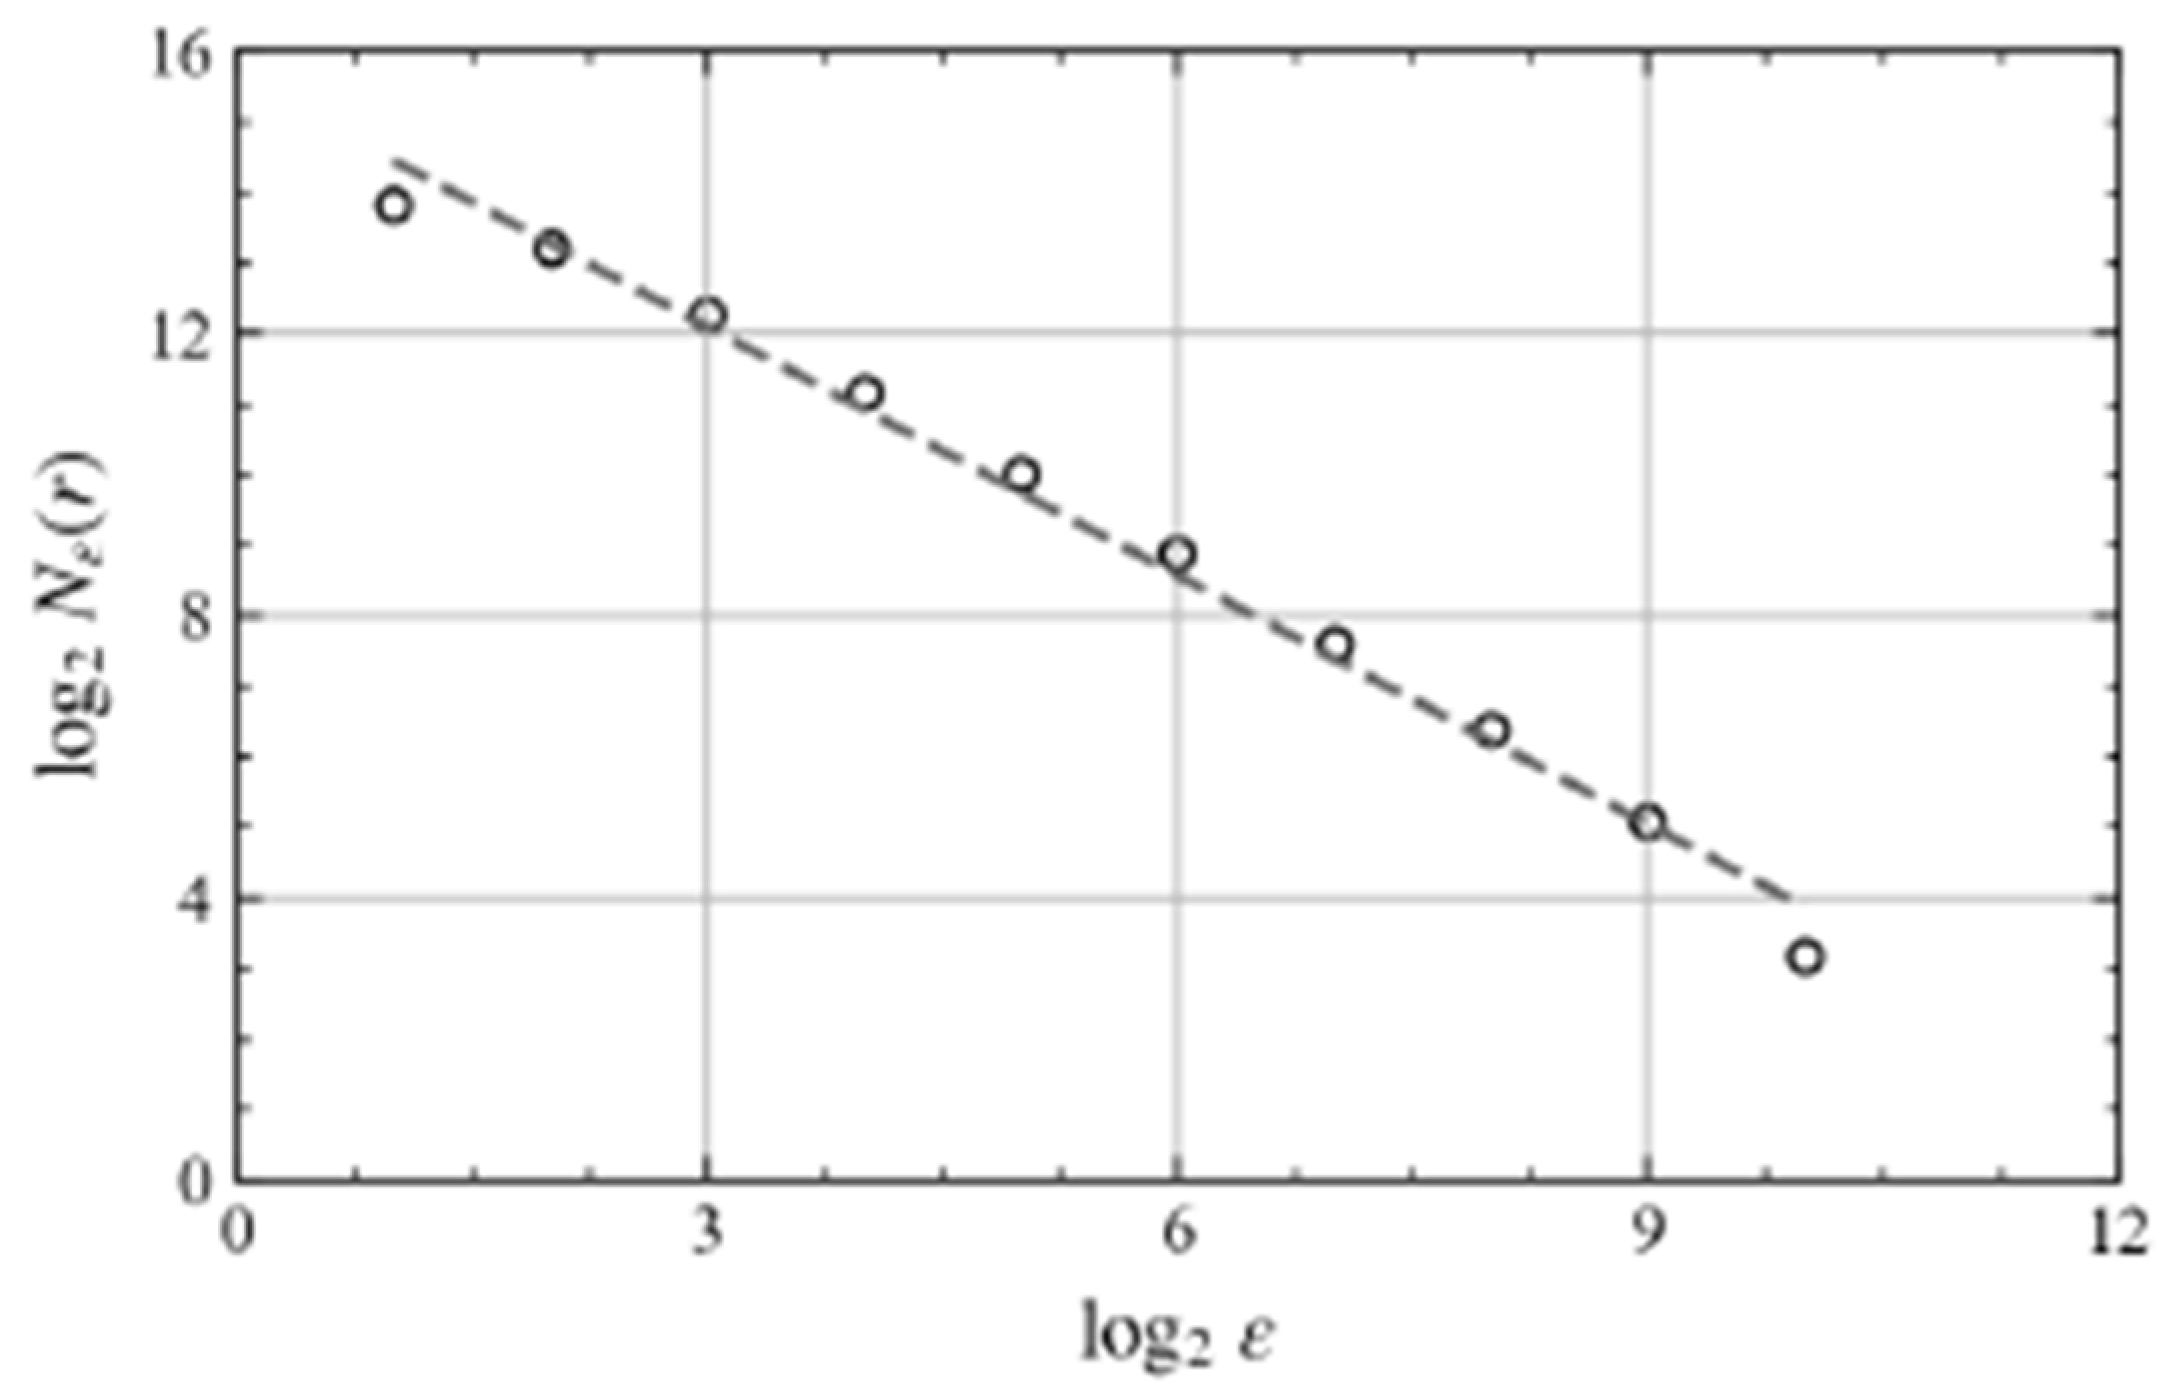
Figure 6.
Composite image of the fatigue crack trajectory in the L-shape bell crank structure.
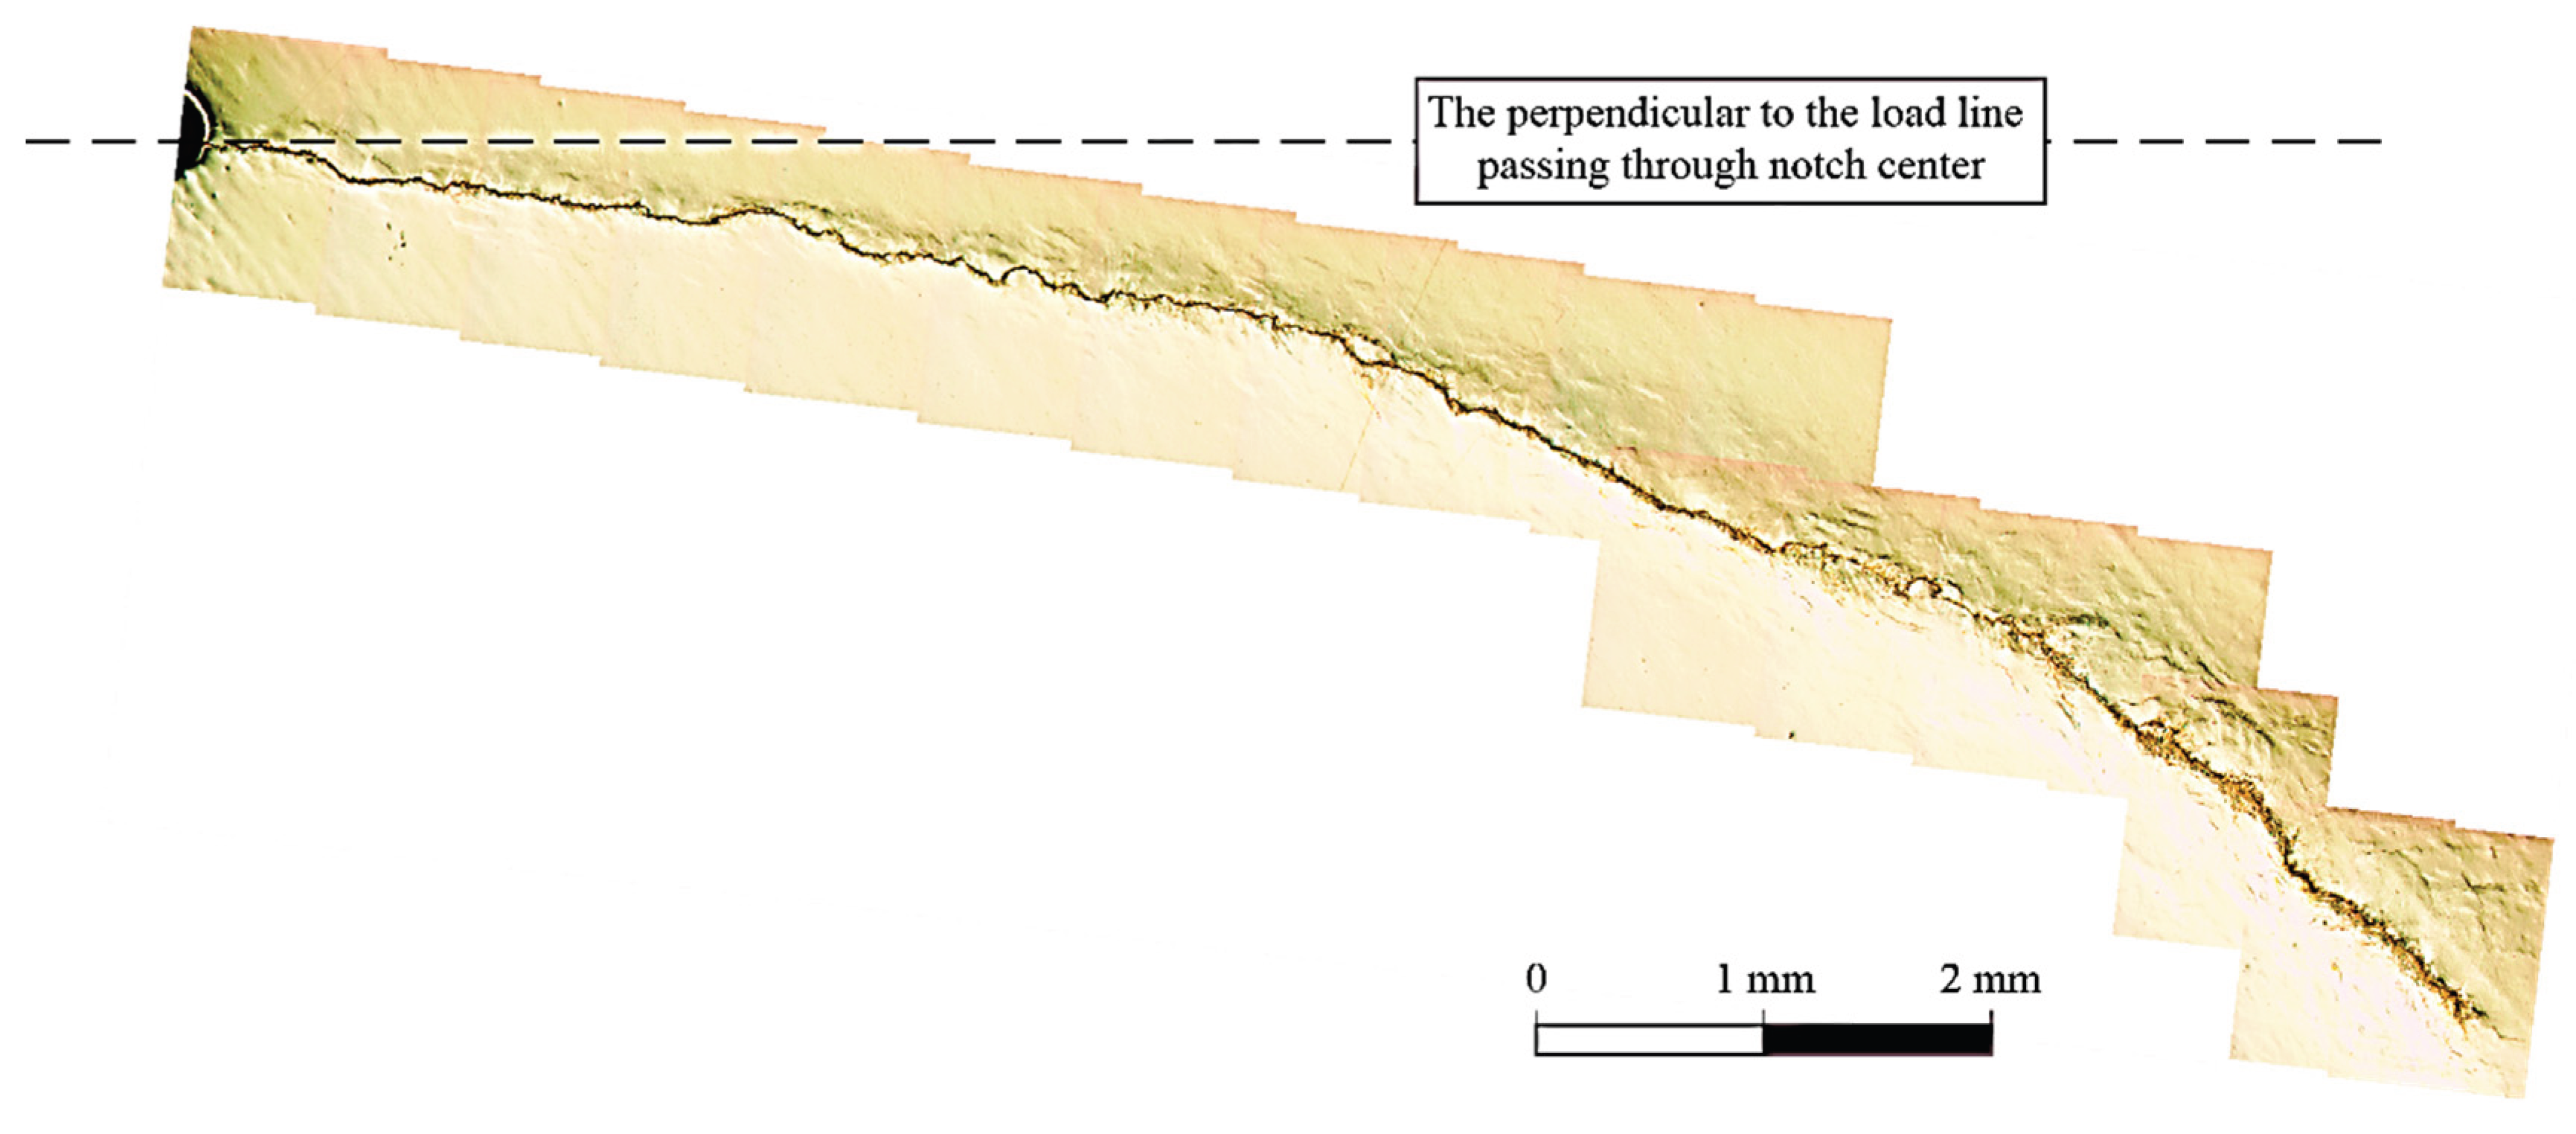
Figure 8.
Evolution of the maximum principal stress distribution at different crack lengths of (a) 0.087 mm, (b) 4.174 mm, (c) 7.656 mm, (d) 9.947 mm (surface view), and (e) 9.947 mm (mid-thickness view), illustrating the dominant stress concentration in the shorter limb.
Figure 8.
Evolution of the maximum principal stress distribution at different crack lengths of (a) 0.087 mm, (b) 4.174 mm, (c) 7.656 mm, (d) 9.947 mm (surface view), and (e) 9.947 mm (mid-thickness view), illustrating the dominant stress concentration in the shorter limb.
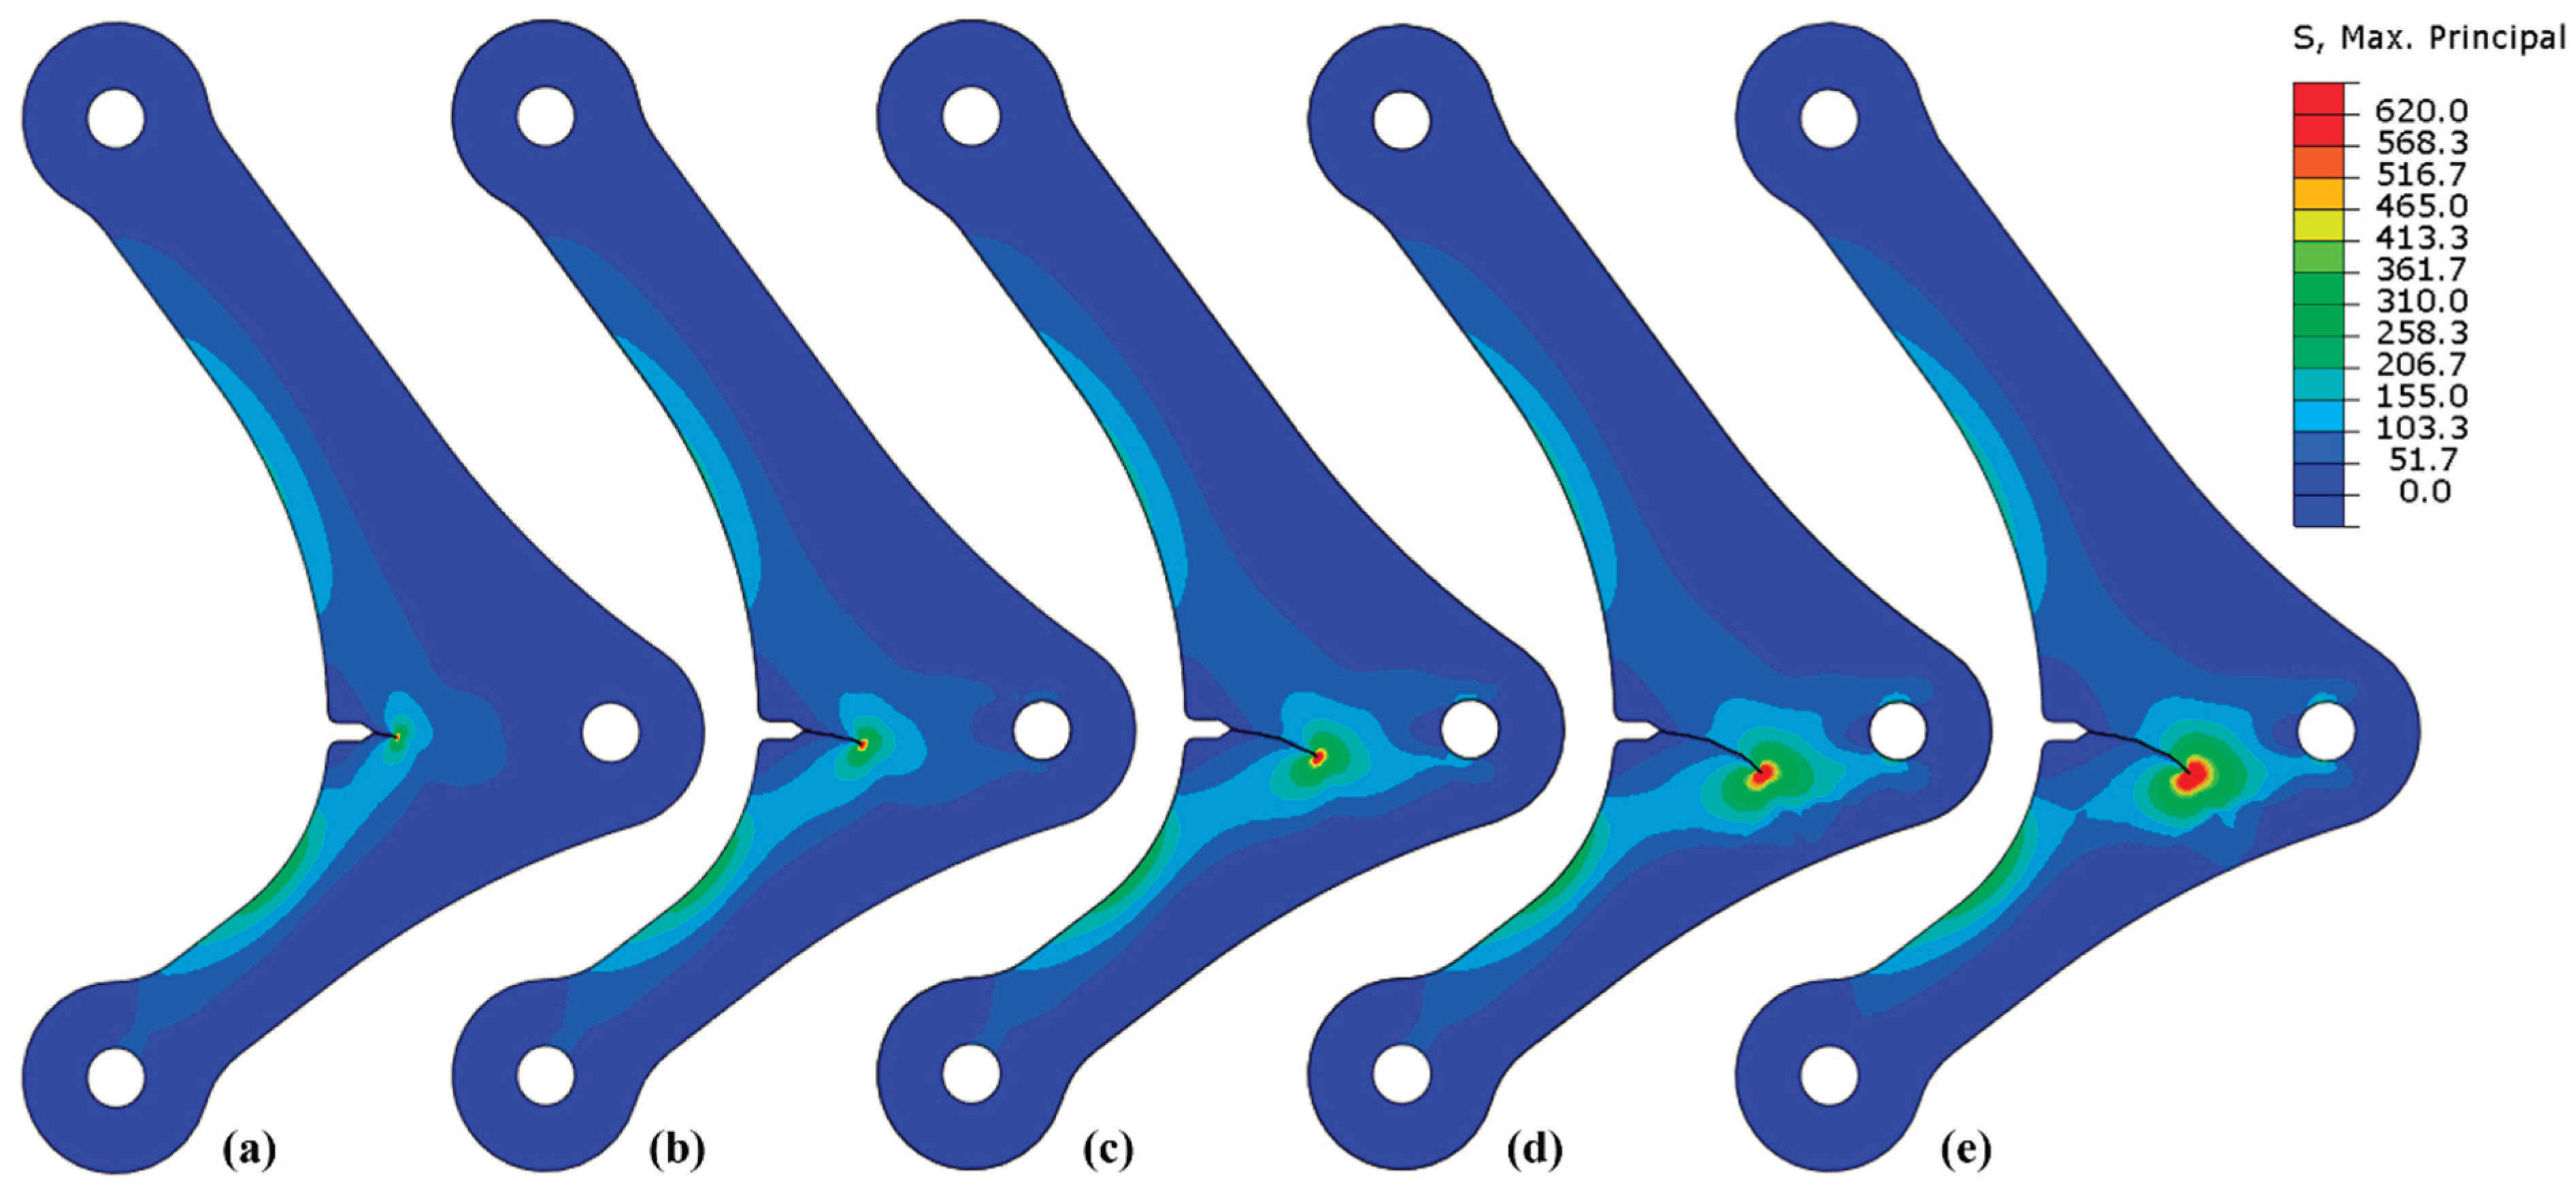
Figure 9.
Evolution of the opening stress component σyy, at different crack lengths of (a) 0.087 mm, (b) 4.174 mm, (b) 7.656 mm, and (c) 7.656 mm. Inset Figure (d) shows a detailed stress contour at a crack length of 7.656 mm.
Figure 9.
Evolution of the opening stress component σyy, at different crack lengths of (a) 0.087 mm, (b) 4.174 mm, (b) 7.656 mm, and (c) 7.656 mm. Inset Figure (d) shows a detailed stress contour at a crack length of 7.656 mm.
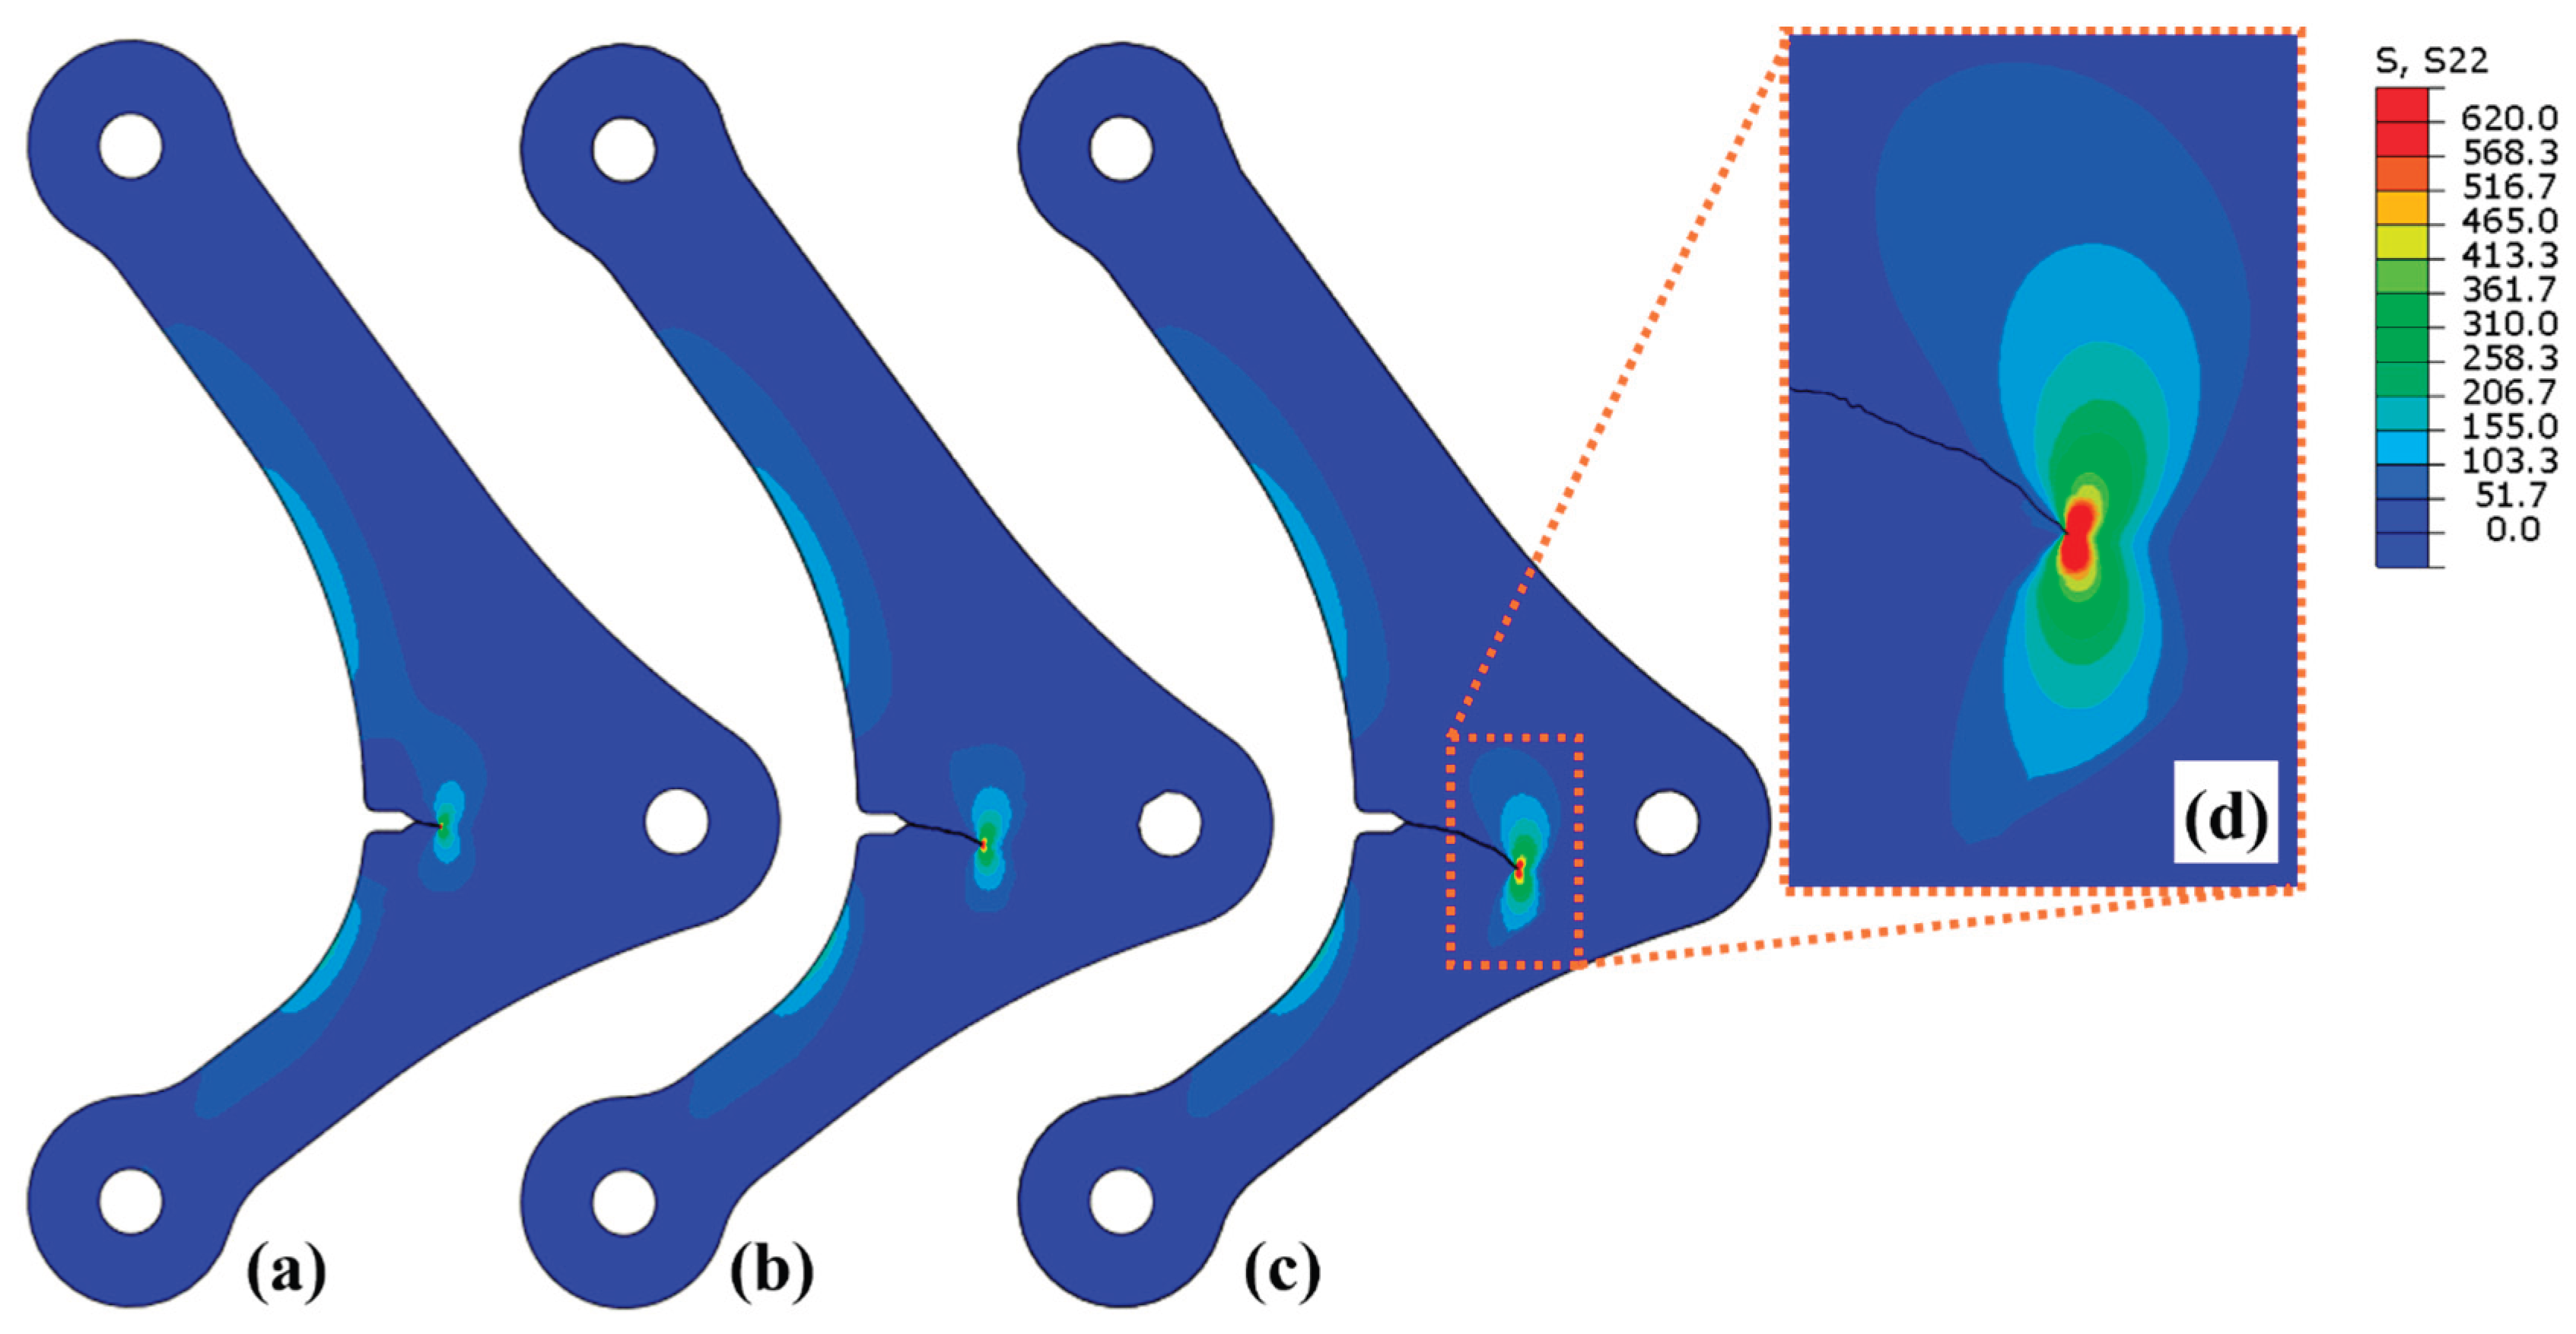
Figure 10.
Superposition of the FE-predicted local crack propagation vectors, scaled to the local ΔKI magnitude and oriented in the KII = 0 direction, on the digitized measured crack path. .
Figure 10.
Superposition of the FE-predicted local crack propagation vectors, scaled to the local ΔKI magnitude and oriented in the KII = 0 direction, on the digitized measured crack path. .
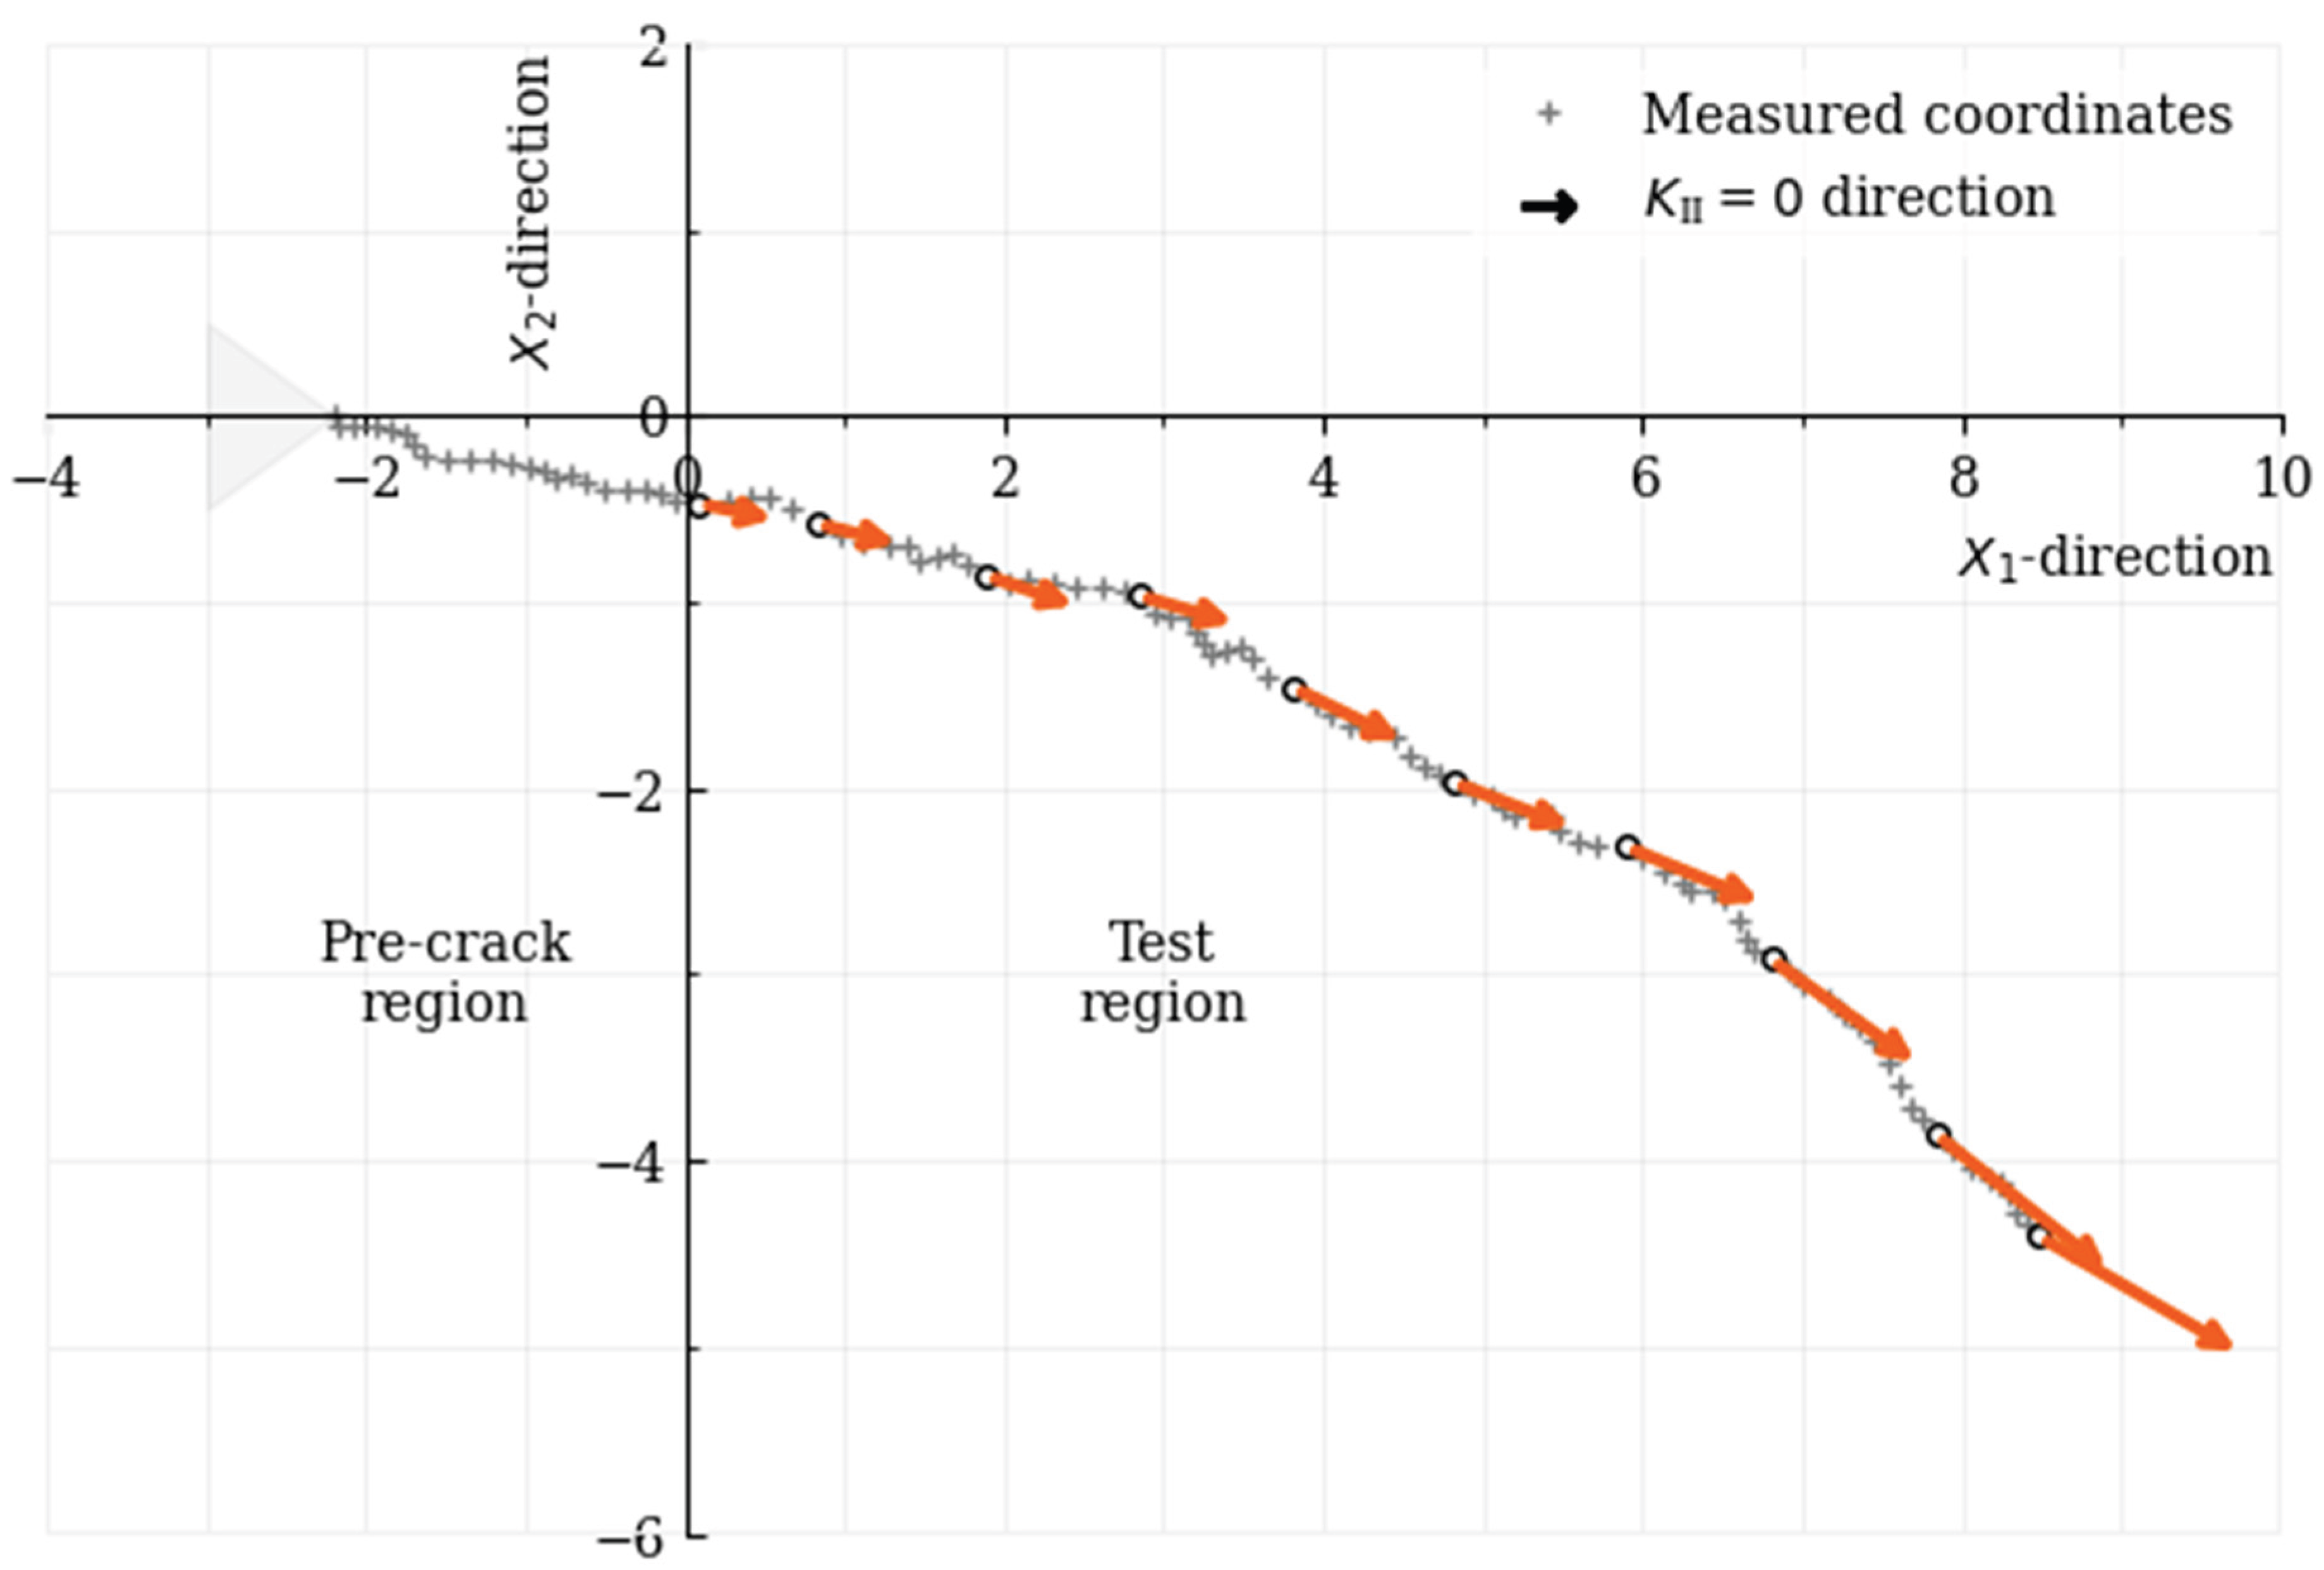
Figure 11.
FE-computed evolution of contributions from stress intensity factor components: Mode-I (KI, KI,max, KI,min), Mode-II (KII), and Mode-III (KIII) with crack extension.
Figure 11.
FE-computed evolution of contributions from stress intensity factor components: Mode-I (KI, KI,max, KI,min), Mode-II (KII), and Mode-III (KIII) with crack extension.
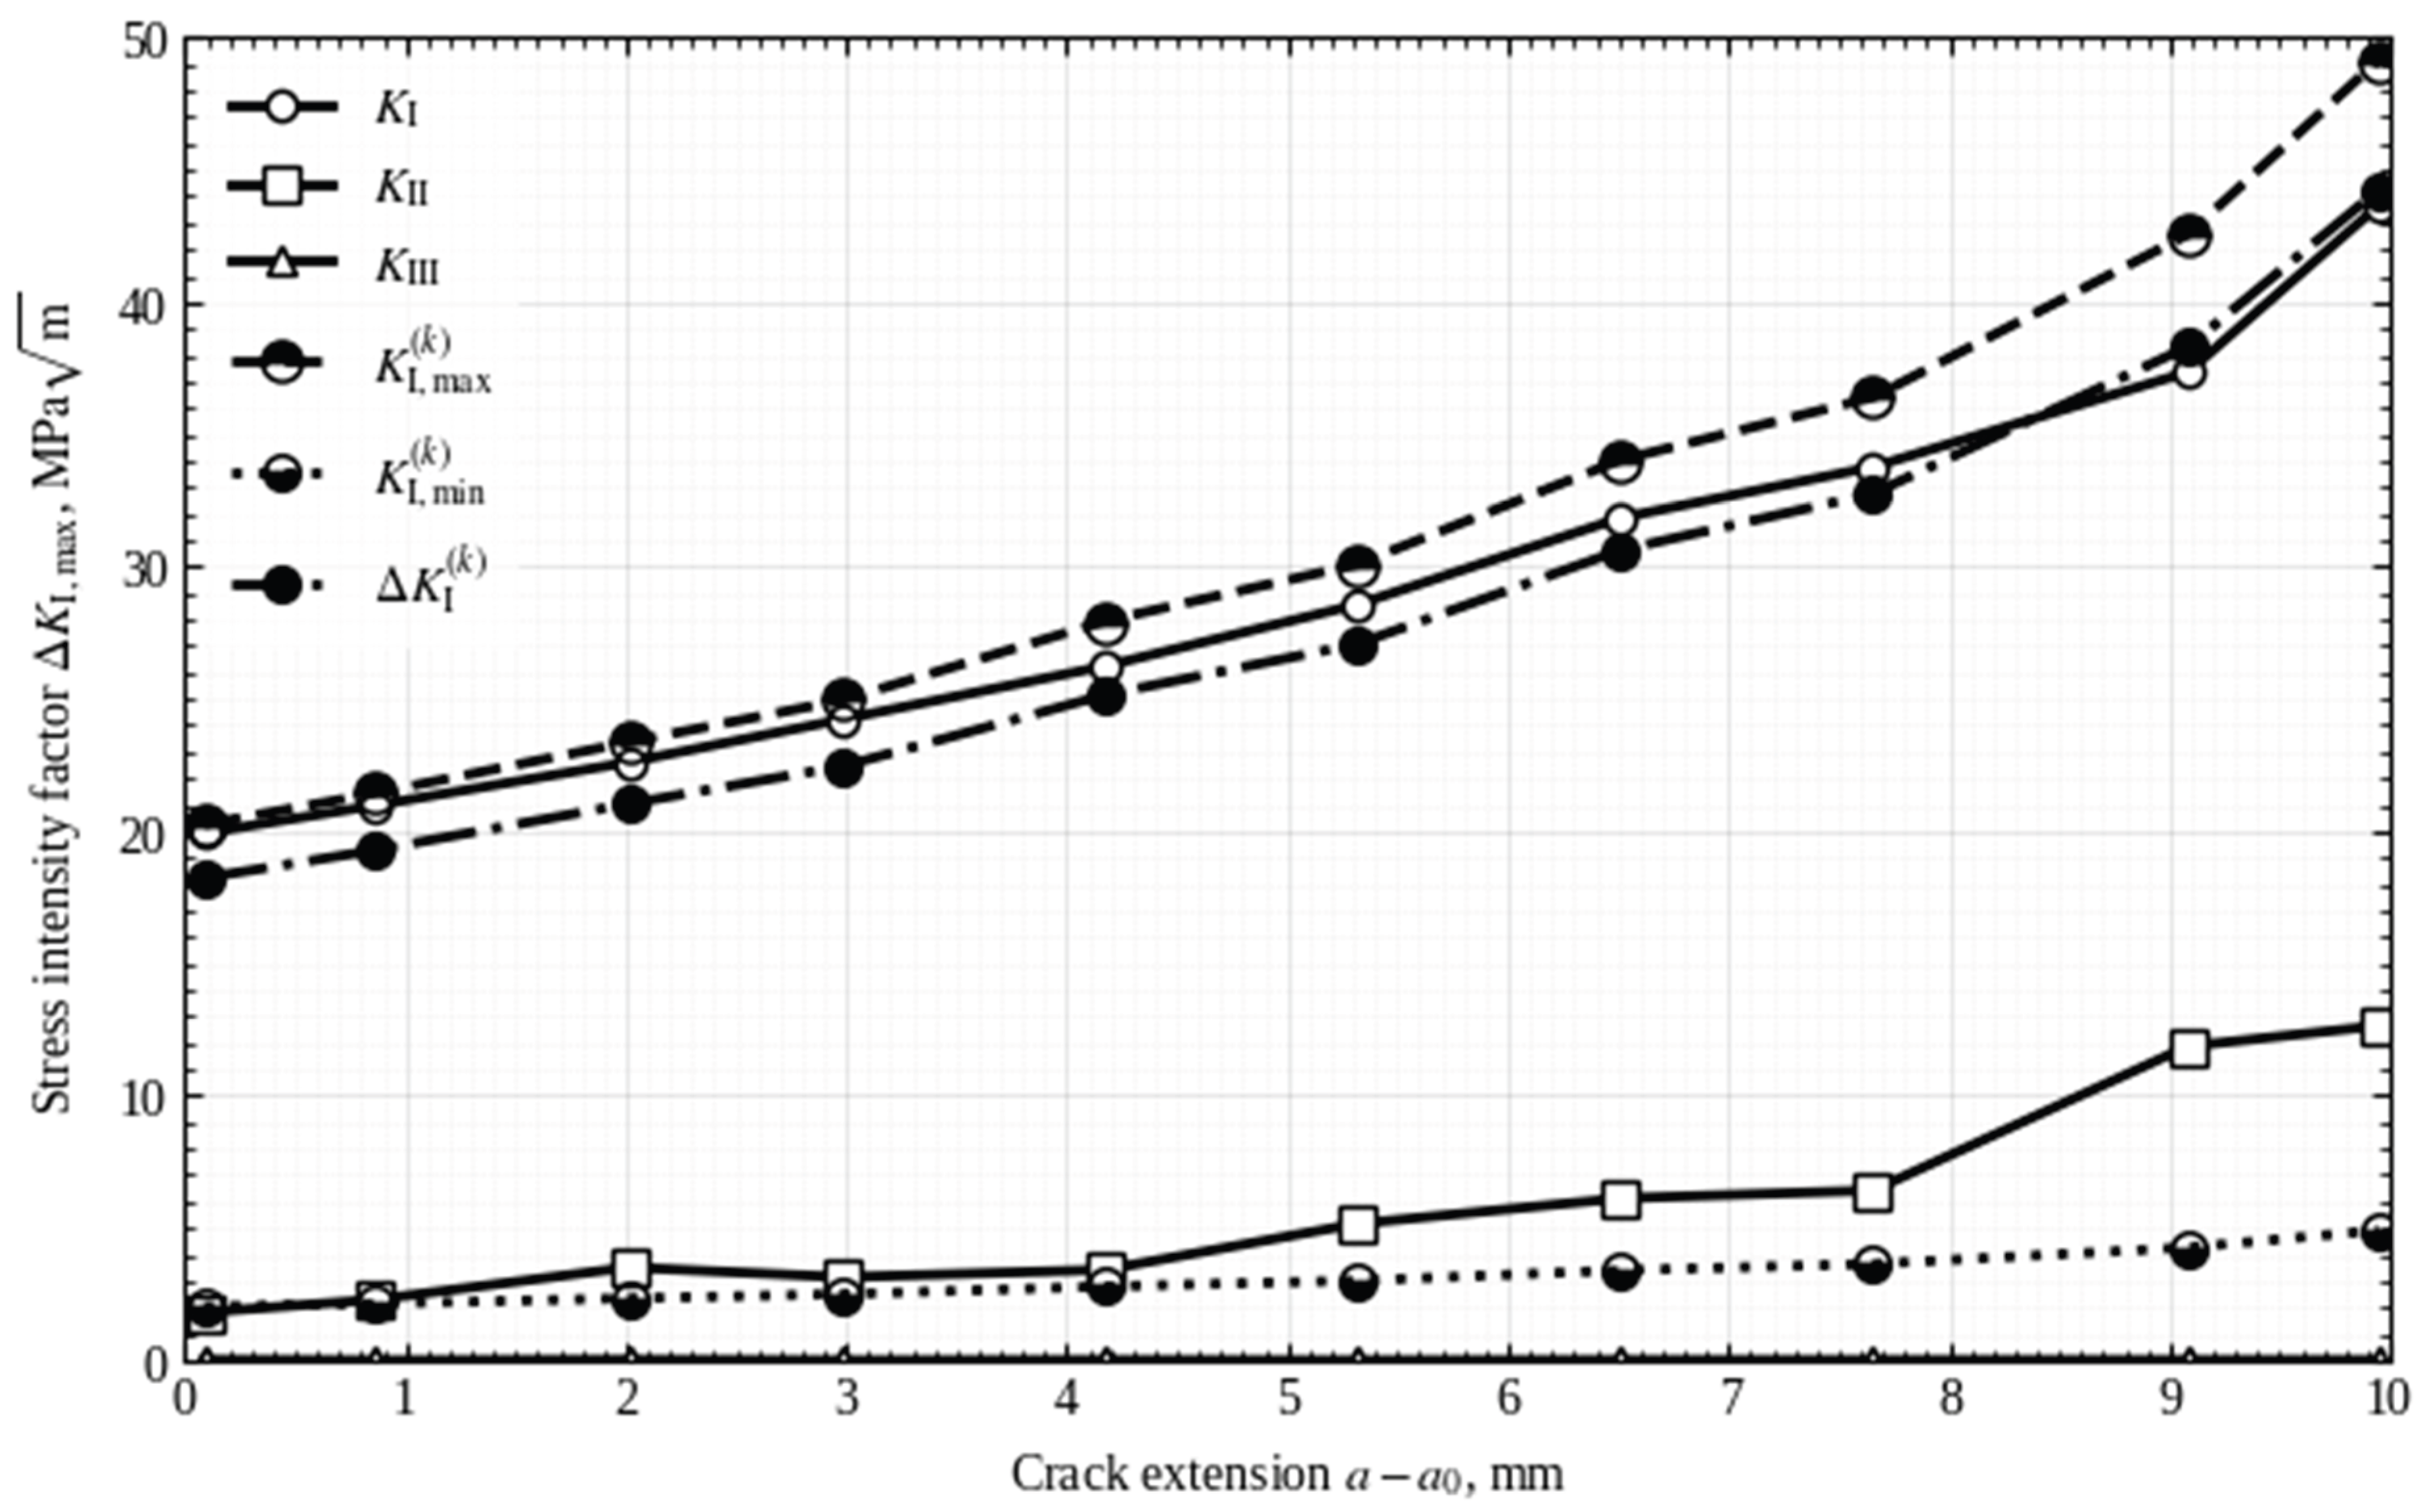
Figure 12.
Fractal dimensions of the propagating fatigue crack in the bell crank structure.
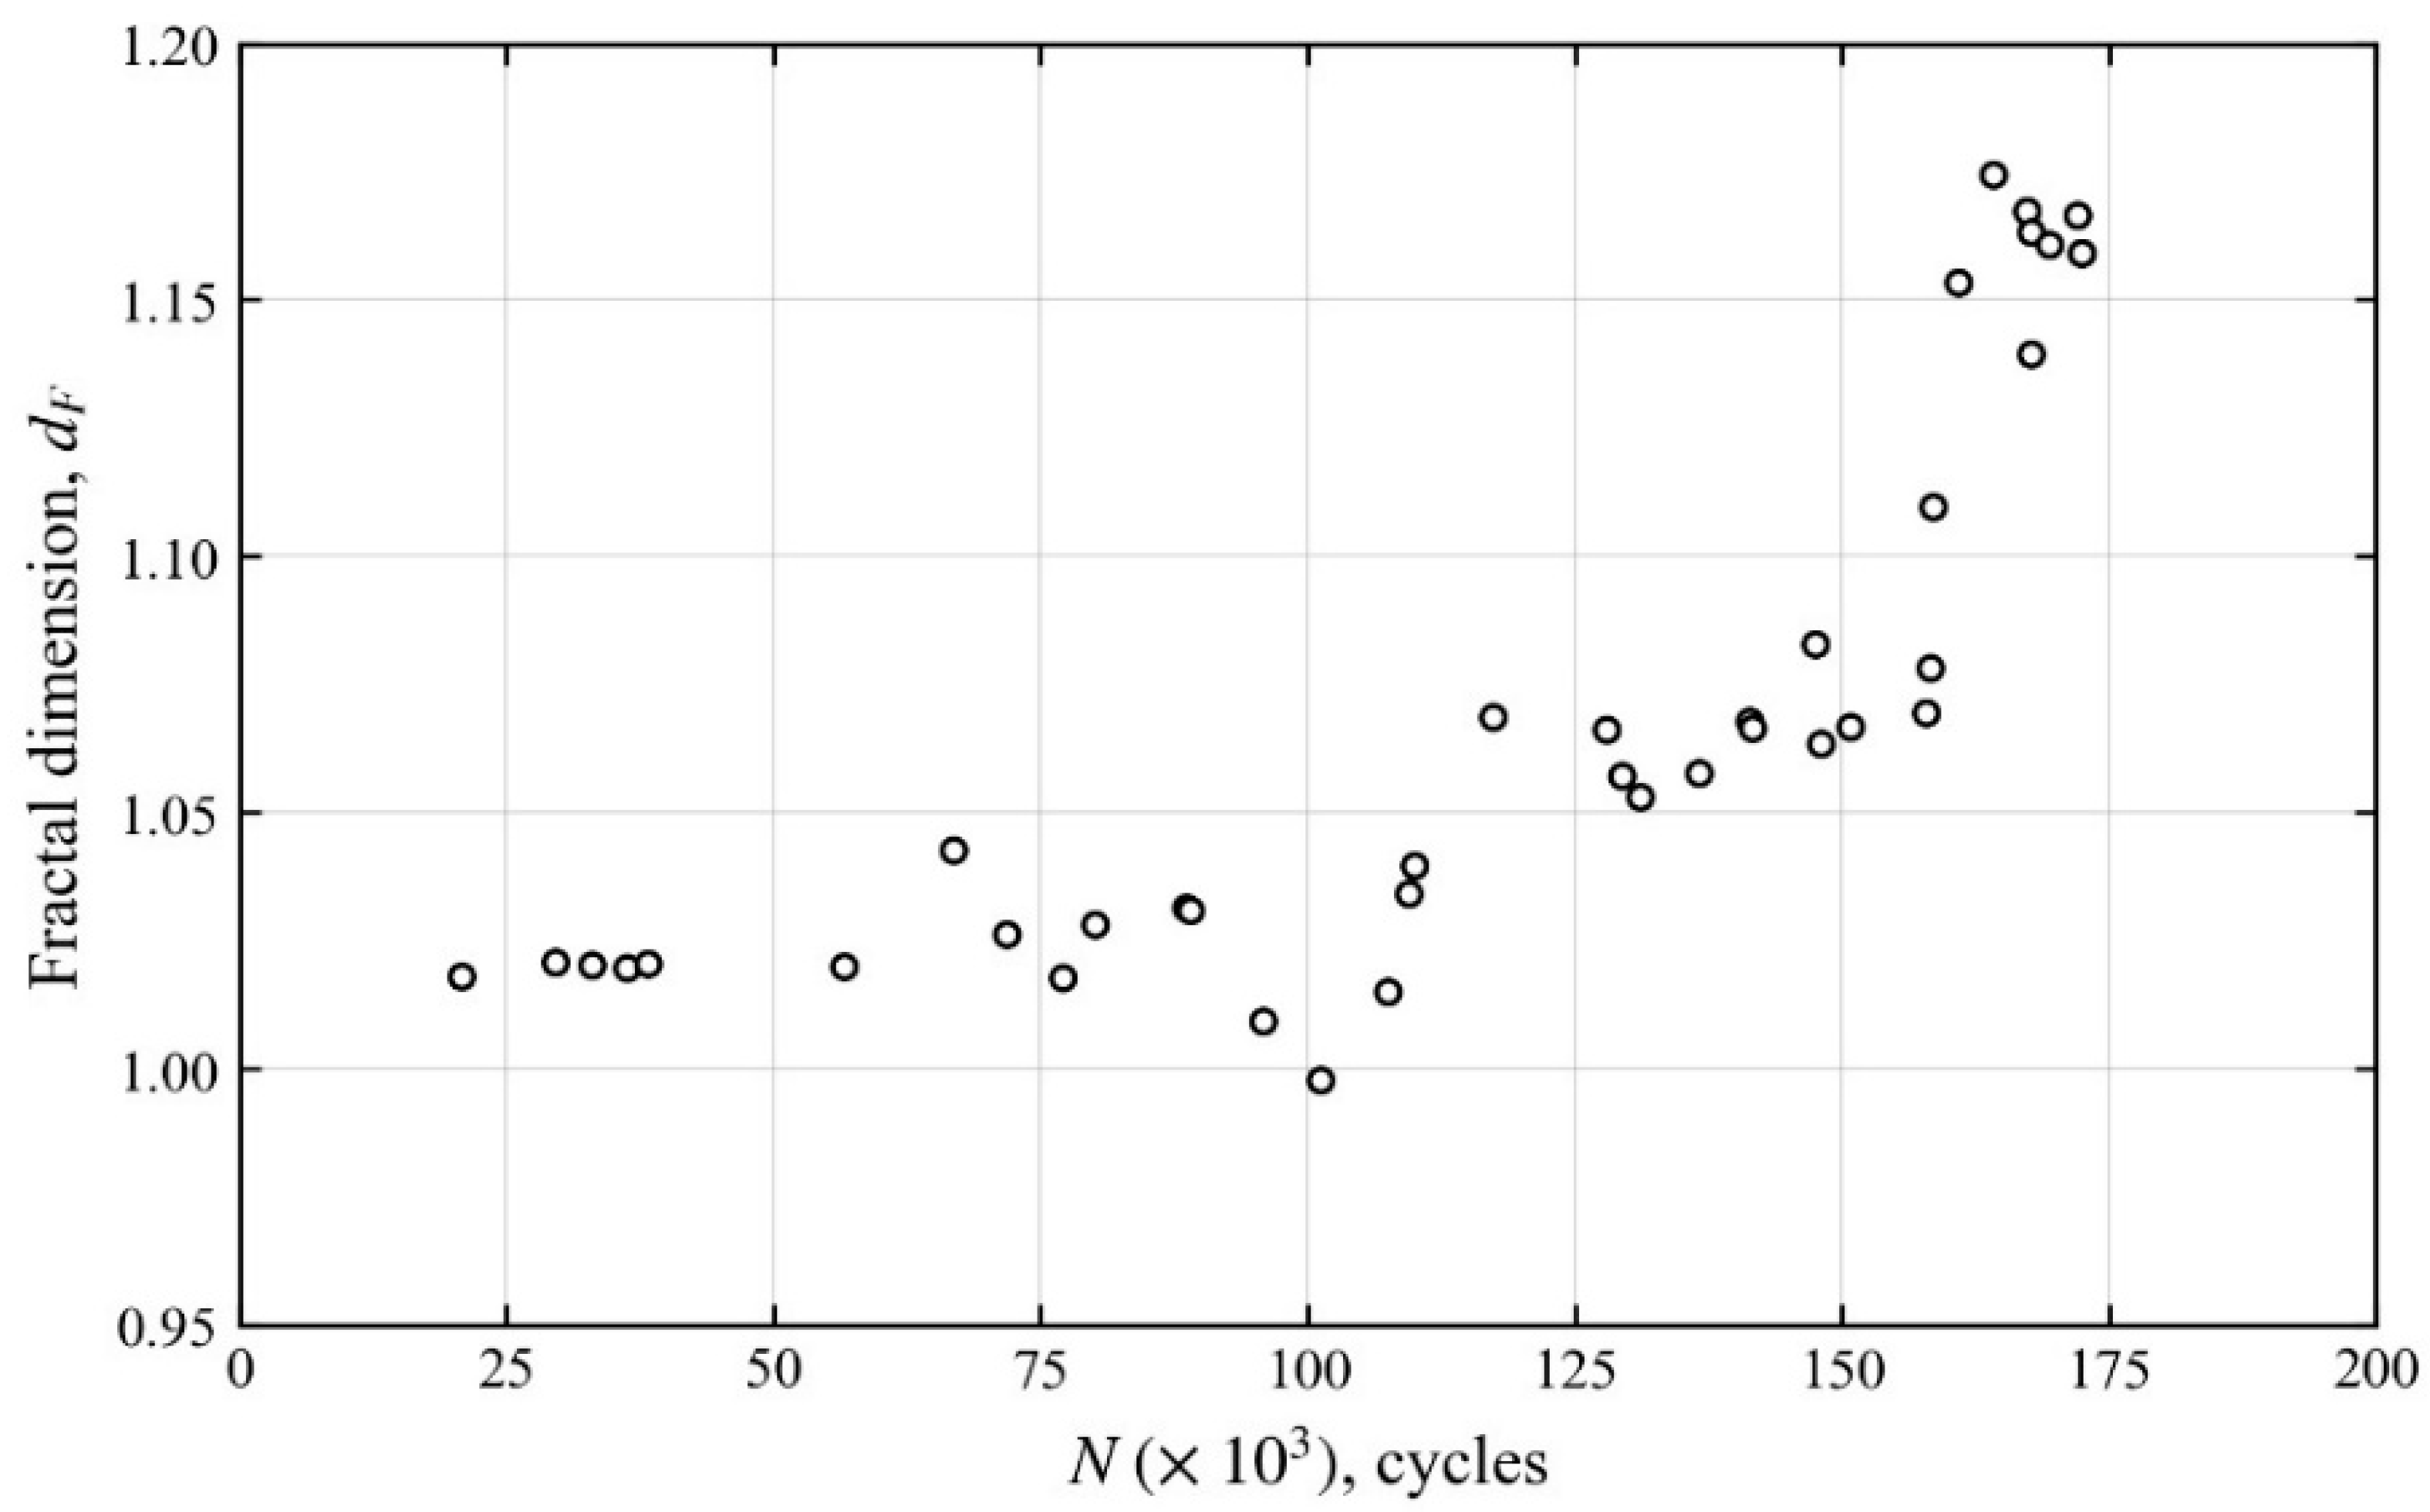
Figure 13.
Comparison of the measured multifractal with FE-predicted ΔK solutions for fatigue crack in the L-shape bell crank structure for FE validation purposes. .
Figure 13.
Comparison of the measured multifractal with FE-predicted ΔK solutions for fatigue crack in the L-shape bell crank structure for FE validation purposes. .
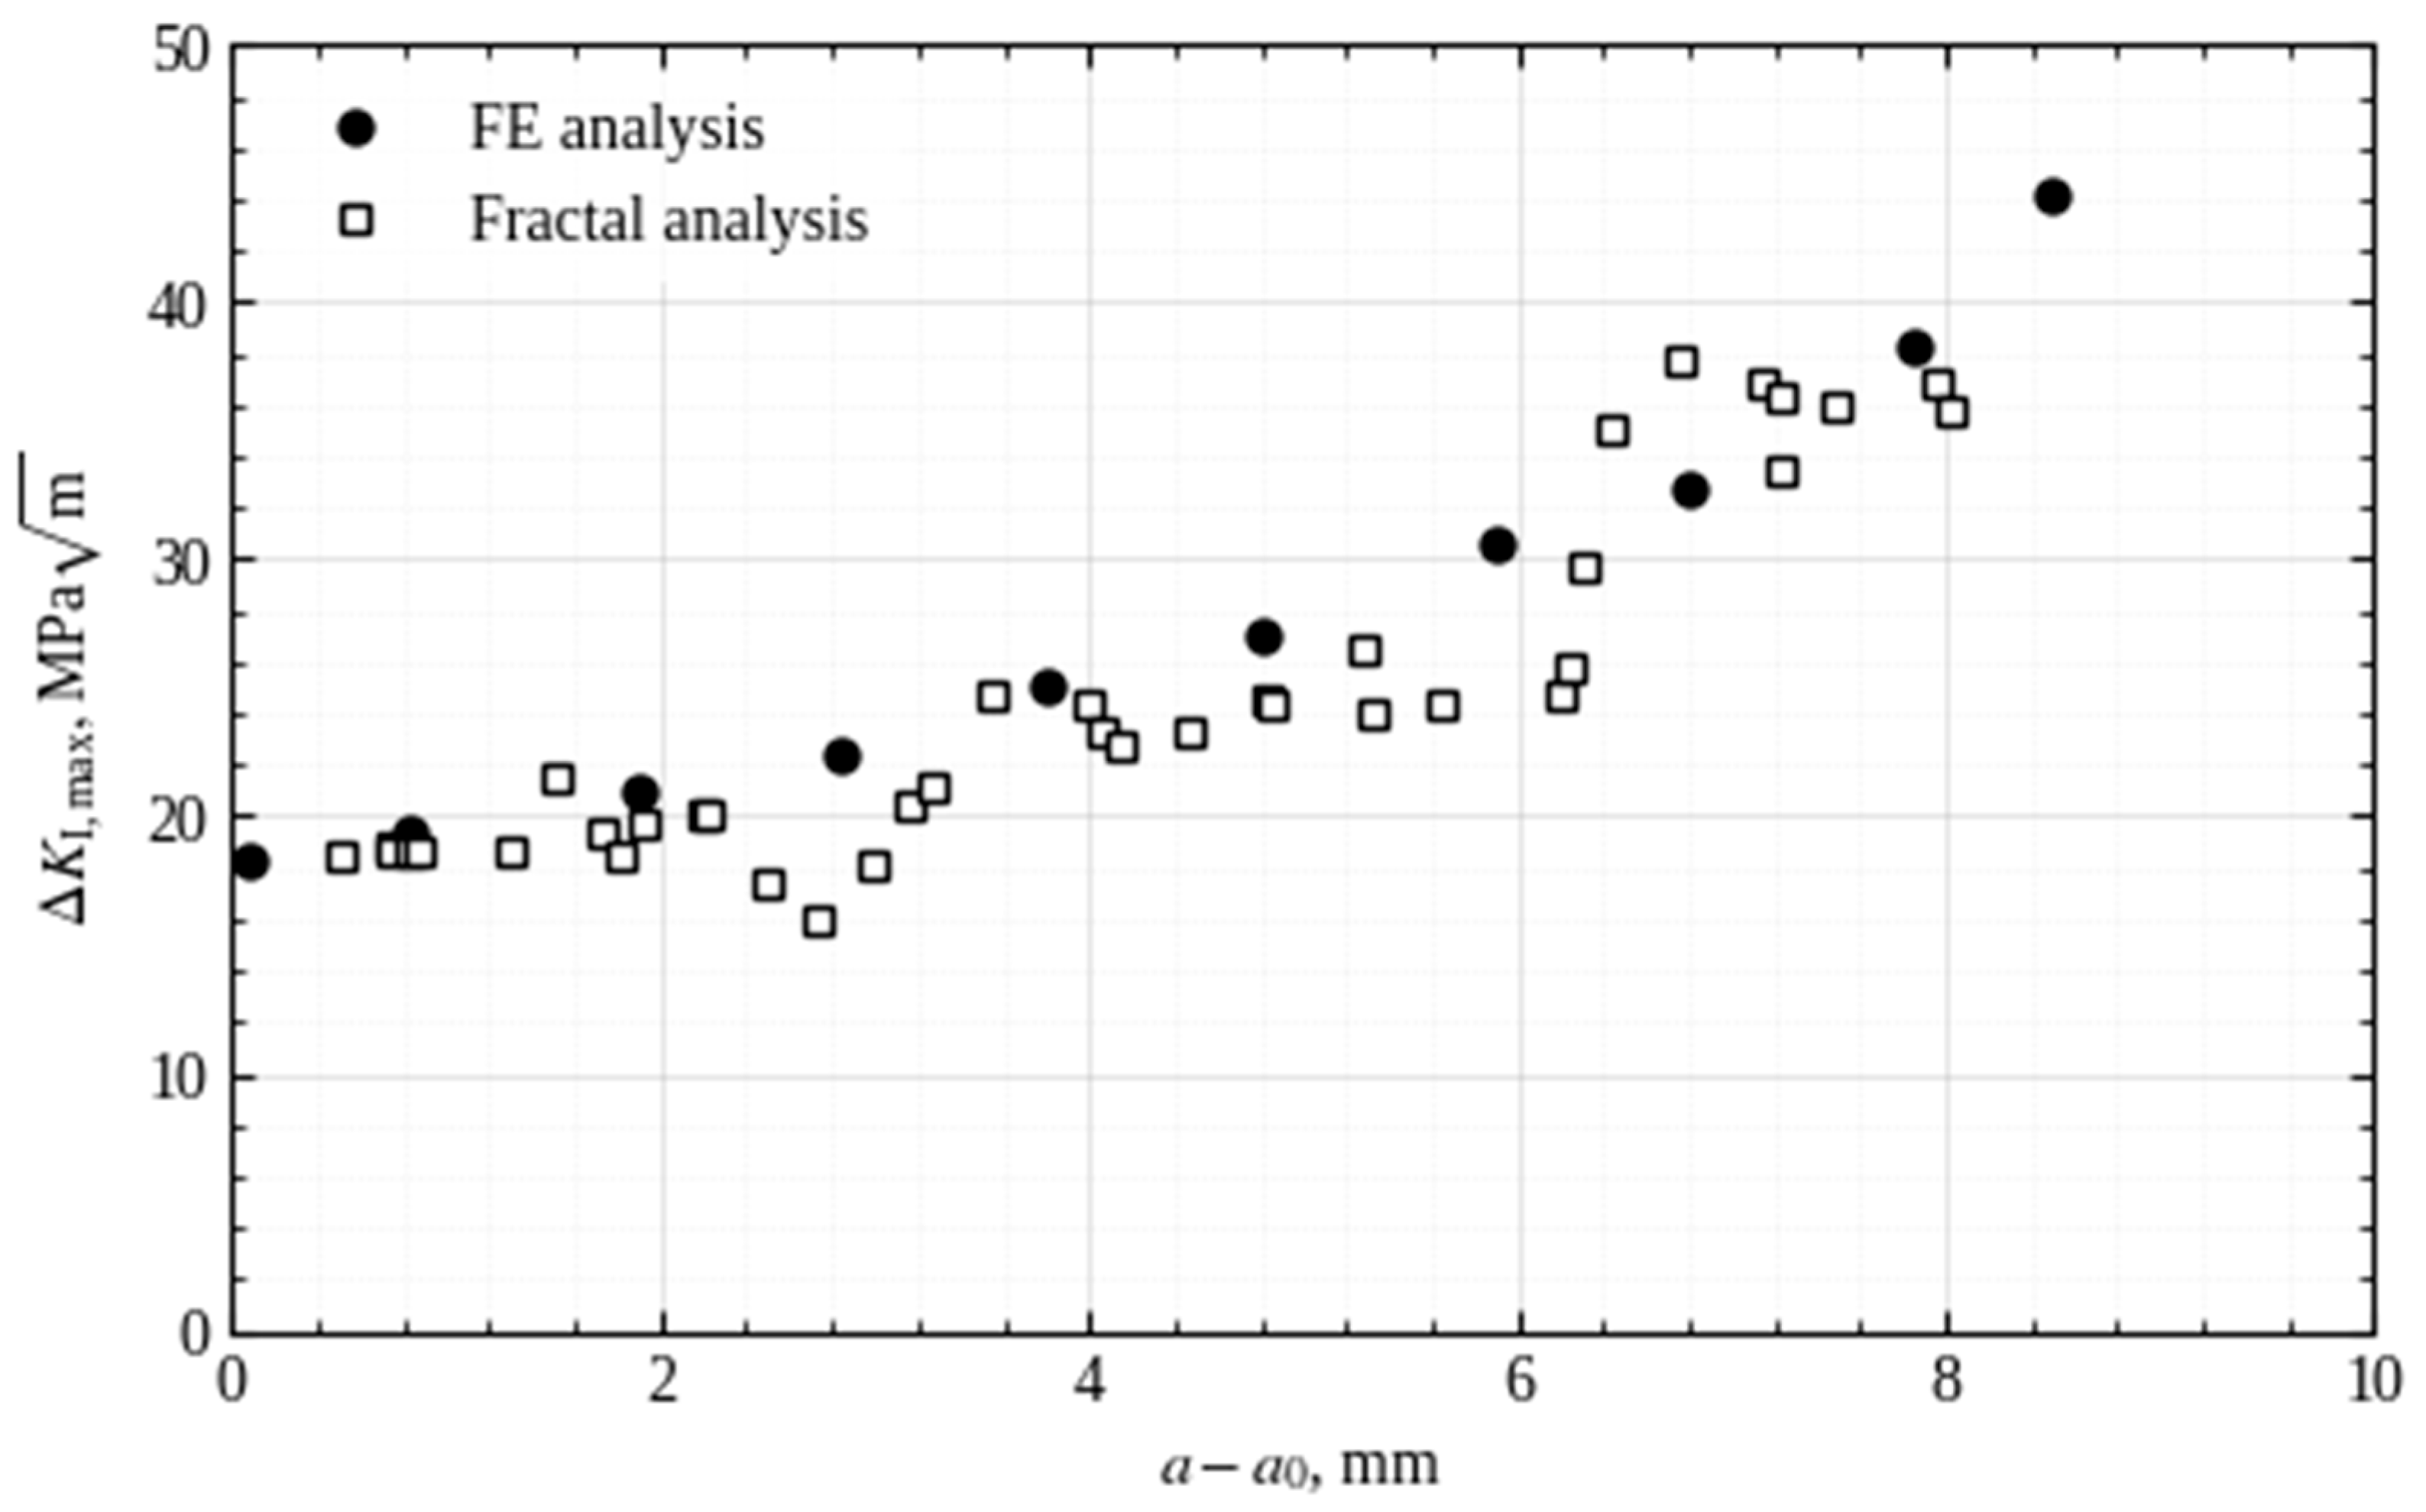
Figure 14.
Comparisons of fatigue crack growth rate curves in the Paris growth regime, determined using the validated FE-calculated ΔK, with the standard test curve based on the C(T) specimen [24]. The 99% confidence band (dashed lines) of the C(T) specimen data is superimposed. Data from the multifractal-based ΔK model is included.
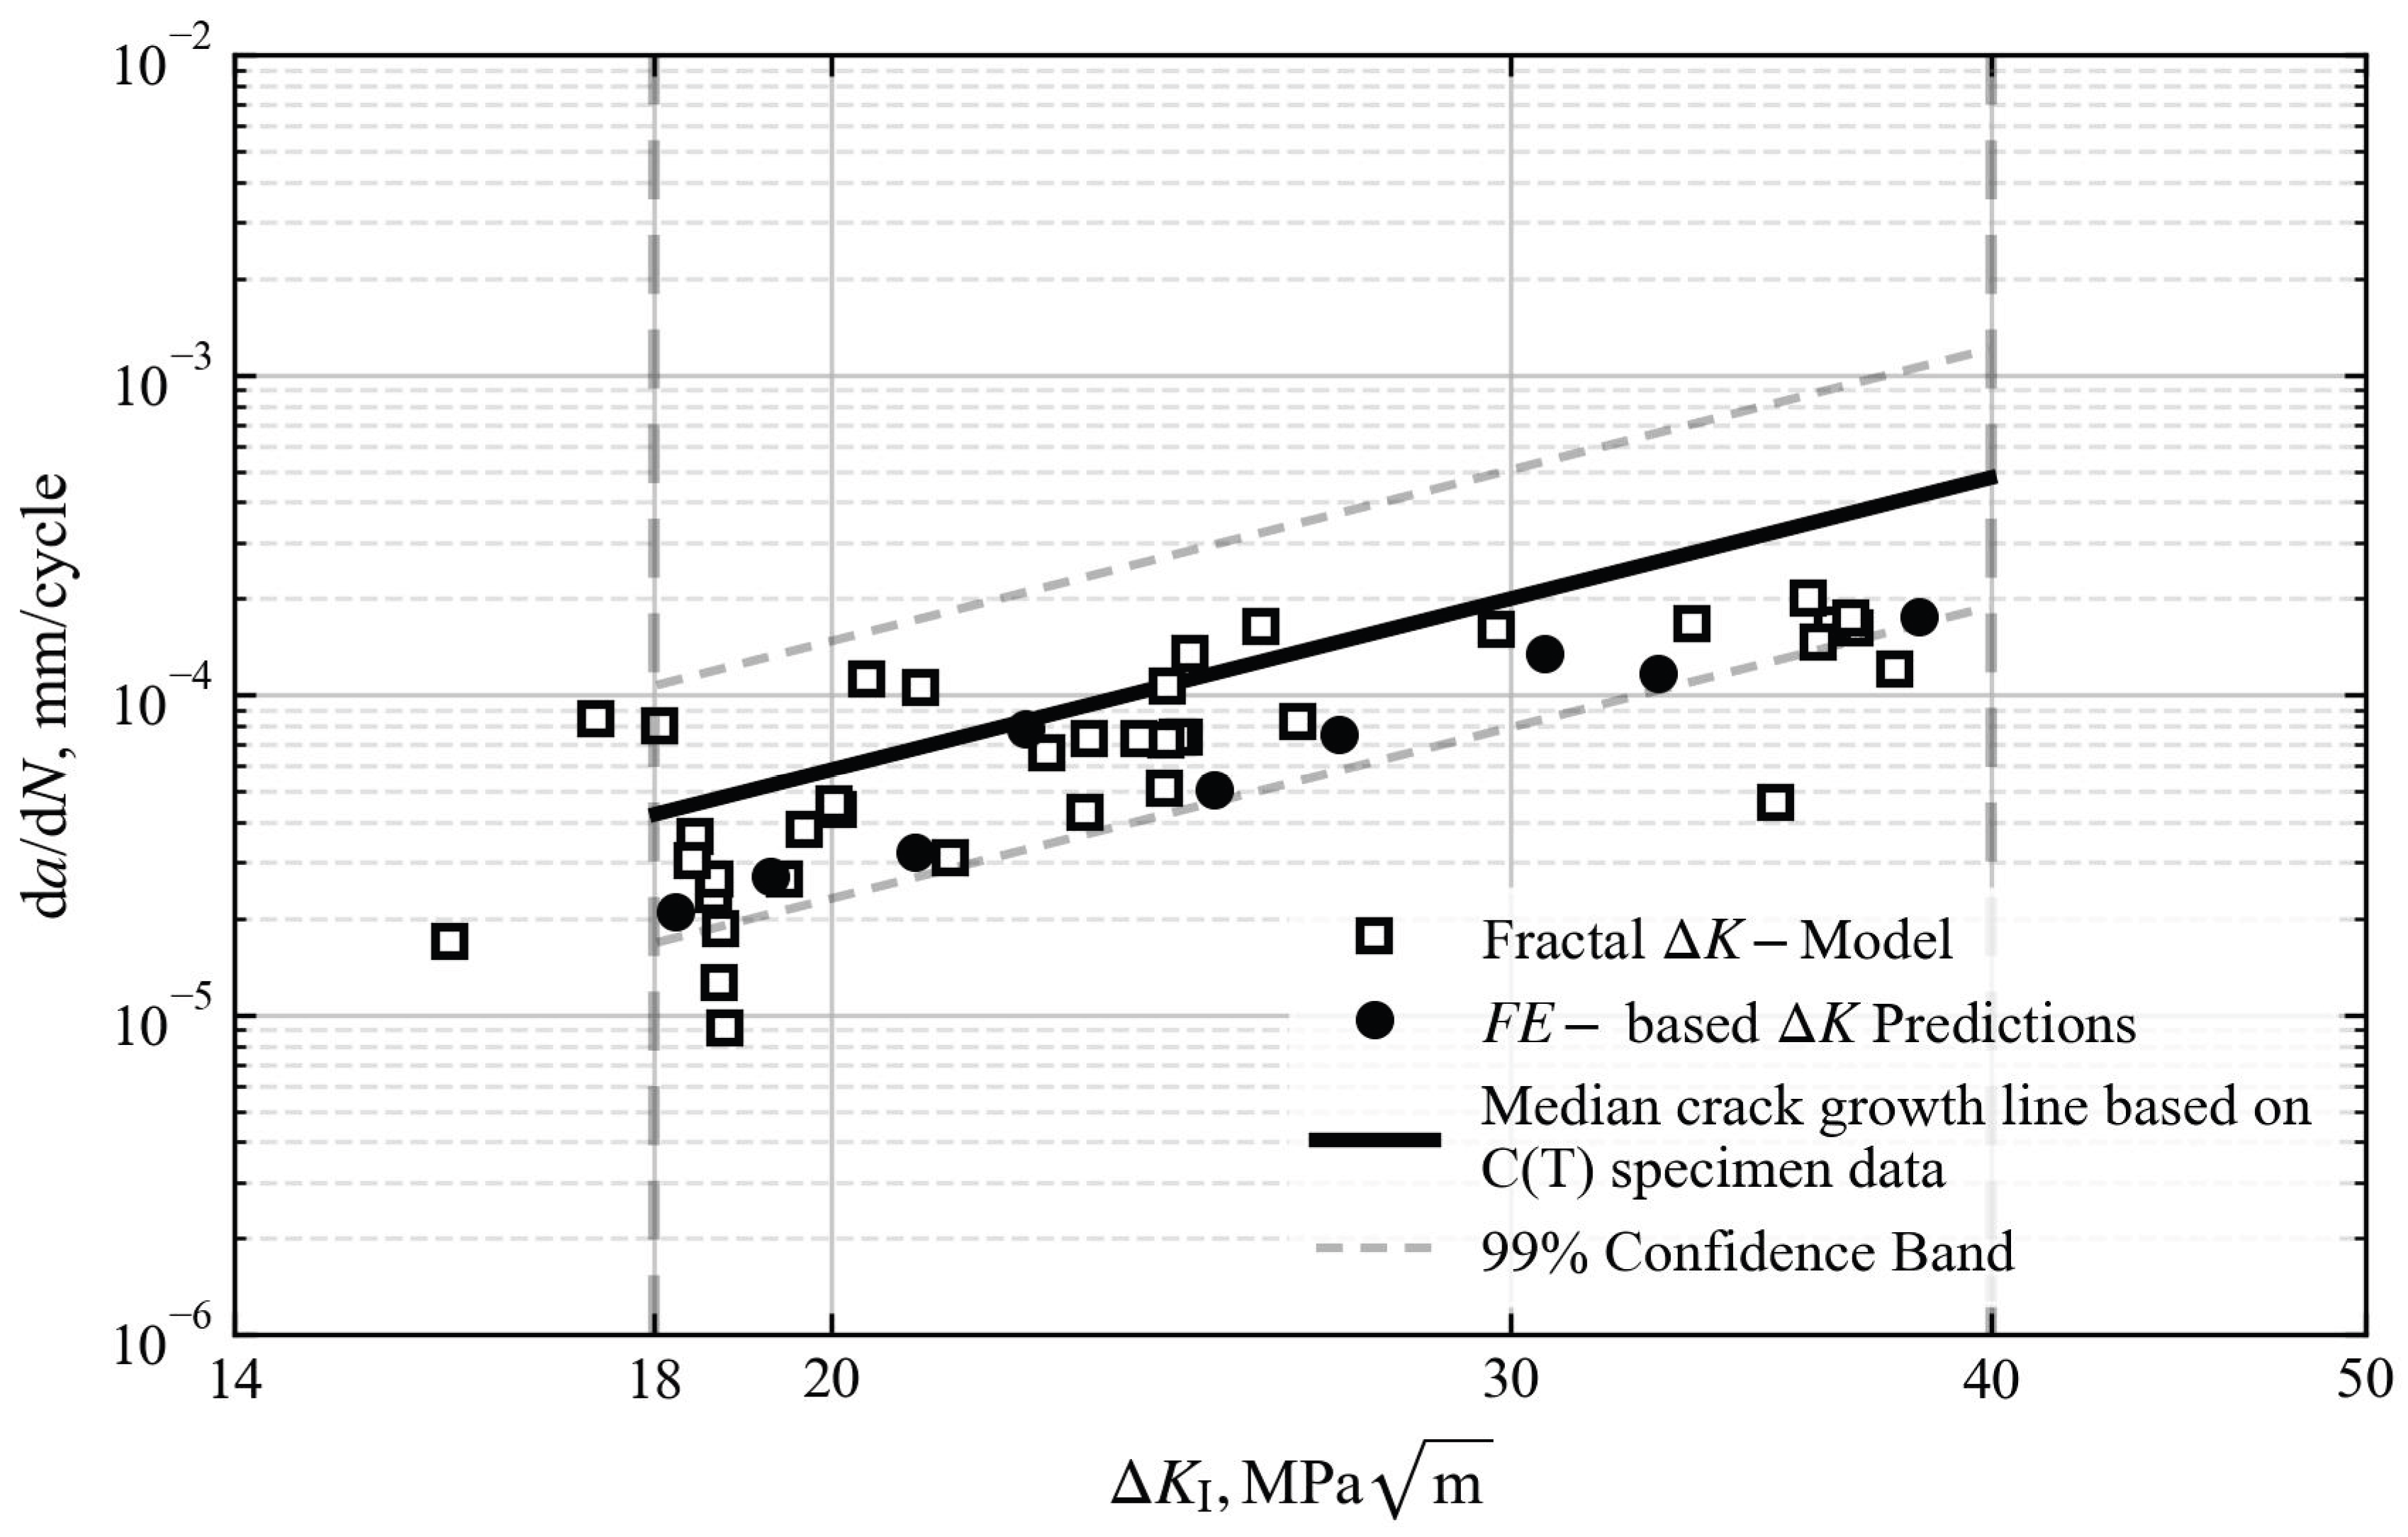

Table 1.
Mechanical properties and fatigue crack growth parameters of AISI410 steel.
| Properties and Parameters | Values |
|---|---|
| Tensile strength, | 657 MPa |
| Yield strength, | 620 MPa |
| Young’s modulus, | 200 GPa |
| Poisson’s ratio, ν | 0.29 |
| Hardness, | 268 |
| Fracture toughness, | 55.0 MPa |
| Threshold stress intensity factor range, | 15.1 MPa |
| Paris crack growth law | mm/cycle |
| Coefficient of fractality, | 2.50 |
Disclaimer/Publisher’s Note: The statements, opinions and data contained in all publications are solely those of the individual author(s) and contributor(s) and not of MDPI and/or the editor(s). MDPI and/or the editor(s) disclaim responsibility for any injury to people or property resulting from any ideas, methods, instructions or products referred to in the content. |
© 2026 by the authors. Licensee MDPI, Basel, Switzerland. This article is an open access article distributed under the terms and conditions of the Creative Commons Attribution (CC BY) license (http://creativecommons.org/licenses/by/4.0/).
Copyright: This open access article is published under a Creative Commons CC BY 4.0 license, which permit the free download, distribution, and reuse, provided that the author and preprint are cited in any reuse.


