
Submitted:
30 January 2026
Posted:
03 February 2026
You are already at the latest version
Abstract
Background: Healthcare systems are responsible for a substantial share of global greenhouse gas emissions, partly due to patient and professional travel. Telemedicine-based interconsultations may reduce this environmental burden. Objective: To quantify avoided travel distances and associated reductions in CO₂ and N₂O emissions referable to interconsultations in the Catalan public healthcare system. Methods: A repeated cross-sectional study with stratified analysis was conducted including 1.48 million interconsultations from 2019, 2023-2025. Driving distances between origin and destination centers were estimated and converted into avoided emissions using standardized emission factors. Results: Non-presential, telemedicine-based interconsultations avoided 29.65 million km of travel, preventing 5.04 million kg of CO2, 0.14 million kg of N2O emissions and 0.24 million kg of CH4. Non-capital regions showed higher per-capita savings, while metropolitan areas accumulated higher absolute reductions. Conclusions: Interconsultations substantially reduce travel-related emissions and represent a scalable strategy to improve environmental sustainability in healthcare systems.
Keywords:
interconsultations
; telemedicine
; environmental sustainability
; health systems
; climate change
; carbon footprint
Introduction
Healthcare systems are major contributors to global greenhouse gas emissions, accounting for approximately 4-5% of total global output [1,2,3]. Most of these emissions arise from energy consumption, medical supply chains, and patient or professional travel. Reducing this environmental footprint has become a central goal in the pursuit of sustainable health policies worldwide. Furthermore, international frameworks have also emphasized the need for climate-resilient and environmentally sustainable healthcare facilities, highlighting the sector’s dual role in protecting health and mitigating its own environmental impact.
Among the strategies to mitigate healthcare-related emissions, telemedicine has proven to be one of the most effective. By replacing or complementing in-person visits, telemedicine reduces patient travel and lowers CO₂ output [4,5,6]. Within telemedicine, interconsultations (Medical Record-based, Store-and-Forward and Provider-to-provider Telemedicine) stand out for their scalability and seamless integration into existing clinical workflows.
In Catalonia, the public healthcare system has implemented a robust digital infrastructure that enables communication among primary care providers, hospitals, and specialized services. Previous economic evaluations have demonstrated that this health information ecosystem significantly reduced road travel and associated atmospheric pollutant emissions and can improve agility and efficiency while maintaining clinical quality [7]. Worldwide, several studies have specifically addressed the environmental benefits of telemedicine [4,5,6,8], including evidence from Catalonia [9]. Despite this, none of the before mentioned has quantified the impact at a system-wide level. Quantifying this contribution is essential not only to understand healthcare’s ecological footprint but also to evaluate how professional digital coordination can advance broader sustainability goals.
This study aims to fill that gap by assessing the environmental impact avoided through interconsultations in Catalonia’s public healthcare system. Specifically, it estimates avoided travel distances and travel times, together with the corresponding reductions in CO₂ and N₂O emissions across different geographic settings within the Catalan health system. By linking organizational innovation to environmental outcomes, this research provides new evidence for sustainable healthcare management and offers a replicable methodological framework to guide other health systems in integrating environmental accountability into digital transformation and policy planning.
Methodology
This study assesses the environmental impact of interconsultations (Medical Record-based, Store-and-Forward and Provider-to-provider Telemedicine) within the Catalan public healthcare system (which provides publicly financed universal health coverage, free at the point of access, with services delivered through a multiprovider network of public and contracted entities), focusing on the reduction of patient travel and the resulting savings in vehicular emissions.
Data Sources
Main data was extracted from the Ministry of Health technological services, which contains information on origin and destination facilities, number of affected individuals, consultation year, and demographic details, covering the period 2019–2025. Data from 2020, 2021, and 2022 were excluded from the analyses due to the impact of the COVID-19 pandemic on both citizen mobility and healthcare activity [10,11]. Additional datasets included the Catalan population census and a coding registry of healthcare facilities [12] and a geographic file delineating the borders of Catalan health areas [13].
Data Cleaning and Preprocessing
Healthcare center names were normalized through a four-step process that included manual correction of ambiguous or complex names, automatic removal of generic prefixes using regular expressions, standardization of acronyms, and exclusion of entries without a physical location (e.g., virtual teams or home-care programs). Facilities with multiple distinct physical locations were split for individual treatment. Only verified physical sites were kept for further examination.
Geocoding and Region Assignment
Center locations were initially geocoded using the Google Maps Geocoding API [14] with regional bias set to Catalonia. Geographic coordinates were verified both manually through interactive map examination and algorithmically by determining whether the coordinates fall inside the borders of the Catalonia area. Each location was spatially assigned to a health region using GeoPandas [15] for geometry operations.
Distance and Route Calculation
The OpenRouteService (ORS) API [16] was utilized to compute driving distances between origin and destination centers, yielding round-trip distances. Open Source Routing Machine (ORSM) API [17] was used to validate route calculations from the main API. Statistical analyses were performed to assess result differences. Shapiro-Wilk tests indicated that distance distributions from both APIs significantly deviated from normality (ORS: W=0.533, P<.001; OSRM: W=0.542, P<.001). Therefore, a Wilcoxon signed-rank test was used for paired comparisons, revealing a statistically significant difference between the two routing services (W=4.39 × 10¹², P<.001). However, the effect size was negligible (Cohen d=0.022), with ORS distances exceeding OSRM distances by a mean difference of 1.28 km (95% CI 1.224-1.335), representing minimal practical difference for emission calculations.
In instances with multiple destination centers, the shortest route was chosen. Route calculations are predicated on the most efficient terrestrial path.
Emission Estimation
It was assumed that every patient would use a private vehicle for transportation during interconsultations. Each vehicle was deemed to transport a single patient for each journey. Furthermore, the model assumes that if a non-presential interconsultation was not possible, the patient would go to the same healthcare facility documented. The environmental impact was evaluated using vehicle-specific emission factors per kilometer for private vehicles, assuming a fleet composition of 57% diesel and 43% gasoline [18,19]. For each interconsultation, total emissions were determined by multiplying the route distance, emission factor, and the number of affected individuals. Aggregate analyses were conducted by center, region, year, and route type, allowing for temporal and spatial comparisons.
Statistical Analysis
Descriptive statistics, including mean, median, standard deviation and percentiles (75th, 90th), were calculated for quantitative variables (distance, CO₂, N2O, CH4, CO₂ eq). Weighted statistics at the individual level considered the number of individuals per interconsultation. Indicators were normalized per 100,000 inhabitants to enable regional comparisons.
Geographic classification distinguished between capital regions (Barcelona Ciutat, Barcelona Metropolitana Nord and Barcelona Metropolitana Sud) and non-capital regions (all others). This classification reflects structural differences in healthcare organisation, including higher population density, greater concentration of specialised referral centres and shorter inter-facility distances in capital regions, compared with more geographically dispersed service provision in non-capital regions. The capital regions collectively accounted for around 790,000 interconsultations, while the non-capital regions showed significantly lower totals at approximately 680,000, despite covering a significantly larger area.
Differences between capital and non-capital regions were assessed using inferential statistics. The assumptions of normality and homogeneity of variances were evaluated prior to group comparison. As these assumptions were not met, non-parametric tests were performed. Group differences were analysed using the Mann-Whitney U-test, and effect sizes were estimated using Cohen’s d. Uncertainty was assessed using bootstrap confidence intervals.
Consultations involving individuals aged 110 or older were excluded as outliers. Distances shorter than 2km (round-trip) were excluded from the analysis, as they were considered within a walkable range.
Tools and Reproducibility
Data processing was performed using Python with libraries including Pandas, GeoPandas, Shapely, OpenRouteService, Plotly, Folium, and GeoPy. Automation and analysis of scripts are structured by phase and ensure consistent reproducibility. Interactive visualizations and maps were produced for result communication.
Results
Overall Environmental Impact
Between 2019 and 2025 (excluding 2020, 2021 and 2022), a total of 1.48 million interconsultations were recorded across 1,612 origin-destination routes within the Catalan public healthcare system. These non-presential communications between healthcare professionals resulted in a total avoided travel distance of approximately 29.65 million kilometers, corresponding to an estimated reduction of 5.04 million kg of CO₂ and 0.14 million kg of N₂O emissions and 0.23 million km of CH4 emissions, overall equivalent to 5.09 million kg of CO2.
The average avoided distance per interconsultation was approximately 20.70 (SD 32.57) km, with corresponding mean avoided emissions of 3.52 (SD 5.54) kg of CO₂, 100.37 (SD 159.63) g of N₂O and 164.90 (SD 262.47) g of CH4 per person. Marked regional differences were observed. Non-capital regions achieved substantially higher per-capita environmental savings due to longer inter-facility distances, whereas metropolitan regions exhibited smaller relative reductions but accumulated larger absolute savings due to higher interconsultation volumes.
When considering only the years included in the analysis (2019 and 2023-2025), avoided emissions showed a clear upward trend. The increase observed after 2020 aligns with the widespread adoption of digital coordination tools during and after the COVID-19 pandemic, although the pandemic years themselves were excluded from the analysis due to major disruptions in healthcare activity.
Population Characteristics
A total of 1,474,162 interconsultations were involved during the study period. The demographic profile of the sample reflected the expected distribution of healthcare service use in Catalonia. Women accounted for 56% of all cases, while men represented 44%. Age distribution showed a gradual rise from childhood to middle age, with the highest concentration among adults aged 40-75 years, followed by a decline in the oldest age groups.The average travel distances showed noticeable variations, with capital regions recording an average of 11.63 km (SD 10.94) compared to non-capital regions, which had an average of 30.76 km (SD 44.74). To assess the statistical significance of these dissimilarities, the assumptions of normality and homogeneity of variance were examined. The Shapiro-Wilk test indicated that neither group meets the normality assumption (capital: W = 0.64, P < 0.001; non-capital: W = 0.60, < 0.001). Given that the parametric assumptions were not satisfied, the Mann-Whitney U test was performed, which revealed highly significant differences (p < 0.001) along with a medium effect size (Cohen’s d = -0.62). The bootstrap 95% confidence intervals for both regions yielded a mean difference [-19.76, -18.96] km excluding zero, and a Cohen’s d within [-0.61, -0.59]; further supporting the significance of the findings.
Regional Comparison
Average travel distances differed significantly between regions. Capital regions exhibited substantially shorter distances compared to non-capital regions, reflecting higher healthcare facility density and shorter referral pathways. In contrast, non-capital regions were characterized by longer inter-facility distances, resulting in higher avoided travel per interconsultation. These differences were statistically significant and of moderate magnitude. Detailed statistical results are reported in Table 1.

Table 1.
Descriptive statistics of avoided environmental impact and travel metrics per interconsultation, stratified by Barcelona metropolitan area vs. other Catalan regions (N=1,474,162).
Table 1.
Descriptive statistics of avoided environmental impact and travel metrics per interconsultation, stratified by Barcelona metropolitan area vs. other Catalan regions (N=1,474,162).
| Metric | Region | Mean | Median | Min | Max | Std. Dev | P75 | P90 |
| Distance per person (km) | Overall | 20.70 | 9.53 | 2.02 | 459.43 | 32.57 | 25.09 | 48.73 |
| Capital | 11.83 | 8.06 | 2.02 | 329.08 | 10.94 | 15.30 | 25.98 | |
| Non-Capital | 32.41 | 18.48 | 2.24 | 459.43 | 45.41 | 44.67 | 71.77 | |
| CO2 per person (kg) | Overall | 3.52 | 1.61 | 0.34 | 77.27 | 5.54 | 4.23 | 8.24 |
| Capital | 2.01 | 1.35 | 0.34 | 58.40 | 1.88 | 2.61 | 4.37 | |
| Non-Capital | 5.51 | 3.13 | 0.38 | 77.27 | 7.71 | 7.67 | 12.35 | |
| N2O per person (g) | Overall | 100.37 | 46.42 | 9.72 | 2,234.16 | 159.63 | 121.32 | 235.44 |
| Capital | 57.35 | 38.62 | 9.72 | 1,604.16 | 52.26 | 68.53 | 125.37 | |
| Non-Capital | 157.19 | 89.43 | 10.82 | 2,234.16 | 222.05 | 219.78 | 353.55 | |
| CH4 per person (g) | Overall | 164.90 | 76.32 | 15.95 | 3,926.28 | 262.47 | 199.44 | 387.28 |
| Capital | 94.06 | 63.44 | 15.95 | 2,973.72 | 85.87 | 125.67 | 206.10 | |
| Non-Capital | 258.36 | 147.06 | 17.76 | 3,926.28 | 364.76 | 361.32 | 581.31 | |
| CO2e per person (kg) | Overall | 3.55 | 1.62 | 0.34 | 77.96 | 5.59 | 4.27 | 8.32 |
| Capital | 2.03 | 1.37 | 0.34 | 58.92 | 1.90 | 2.64 | 4.41 | |
| Non-Capital | 5.56 | 3.16 | 0.38 | 77.96 | 7.78 | 7.74 | 12.46 |
Table 2.
Environmental Impact of Interconsultations by Year (2019, 2023-2025).
| Metric | 2019 | 2023 | 2024 | 2025 |
| Interconsultations | 85,636 | 477,882 | 528,744 | 340,337 |
| Distance (km) Mean | 23.23 | 20.15 | 20.62 | 20.95 |
| Distance (km) Median | 9.36 | 9.36 | 9.56 | 9.56 |
| Distance (km) Total | 1,988,910.52 | 9,627,857.03 | 10,903,284.88 | 7,128,642.66 |
| CO2e (kg) Mean | 4.16 | 3.50 | 3.50 | 3.55 |
| CO2e (kg) Median | 1.68 | 1.62 | 1.62 | 1.62 |
| CO2e (kg) Total | 356,114.43 | 1,671,492.26 | 1,849,306.15 | 1,209,089.08 |
| Time (min) Mean | 15.23 | 14.13 | 14.21 | 14.30 |
| Time (min) Median | 10.66 | 9.97 | 9.97 | 10.00 |
| Time (min) Total | 1,340,141.00 | 6,915,826.00 | 7,744,495.00 | 5,027,501.00 |
There were clear territorial differences across the Catalan health regions. Barcelona Ciutat, Metropolitana Nord and Metropolitana Sud (n=815,211) accounted for the highest number of interconsultations, reflecting their larger population base and clinical activity. Despite this volume, these regions showed the shortest avoided travel distances and the lowest per-capita environmental savings due to the proximity of primary and specialist care facilities.
Non-capital regions such as Terres de l’Ebre (n=106,704), Alt Pirineu i Aran (n=197,020) and Camp de Tarragona (n=197,020) presented a markedly different pattern. These areas are characterised by greater geographic dispersion and longer referral routes, resulting in higher avoided distances, travel times and emissions per interconsultation. When adjusted for population, these regions also recorded the highest CO₂ savings per 100,000 inhabitants, suggesting a stronger environmental impact of digital coordination outside the capital.
Overall, metropolitan regions contributed most to the absolute reduction in emissions because of their high activity, while non-capital regions achieved the highest relative and per-capita environmental benefits. The detailed statistics for each region, including avoided distance, CO₂ eq and travel time, are summarised in Table 3.
Most Frequent Centres and Routes
Interconsultations were highly concentrated in a limited number of primary care centres and referral hospitals. The largest volumes were observed in metropolitan areas, although several non-capital centres also contributed notably due to their role as reference points for wide catchment areas.
Primary care teams with the highest number of interconsultations included EAP Tortosa Oest, EAP Terrasa E - Rambla and several centres in the Barcelona metropolitan region. These centres are responsible for large patient populations and maintain frequent communication with nearby specialist services. Among hospitals, the most common destinations were Hospital de Tortosa Verge de la Cinta, Hospital Universitari Sant Joan de Reus, Hospital Universitari de Vic and Hospital Santa Caterina in Girona. These facilities function as regional referral hubs and therefore receive a substantial proportion of non-presential consultations.
The most frequent origin–destination routes matched established referral pathways between primary care and regional hospitals. These high-volume routes contributed significantly to the total environmental impact of interconsultations, although their average avoided distance tended to be shorter in metropolitan settings and longer in their counterparts.
Figure 1.
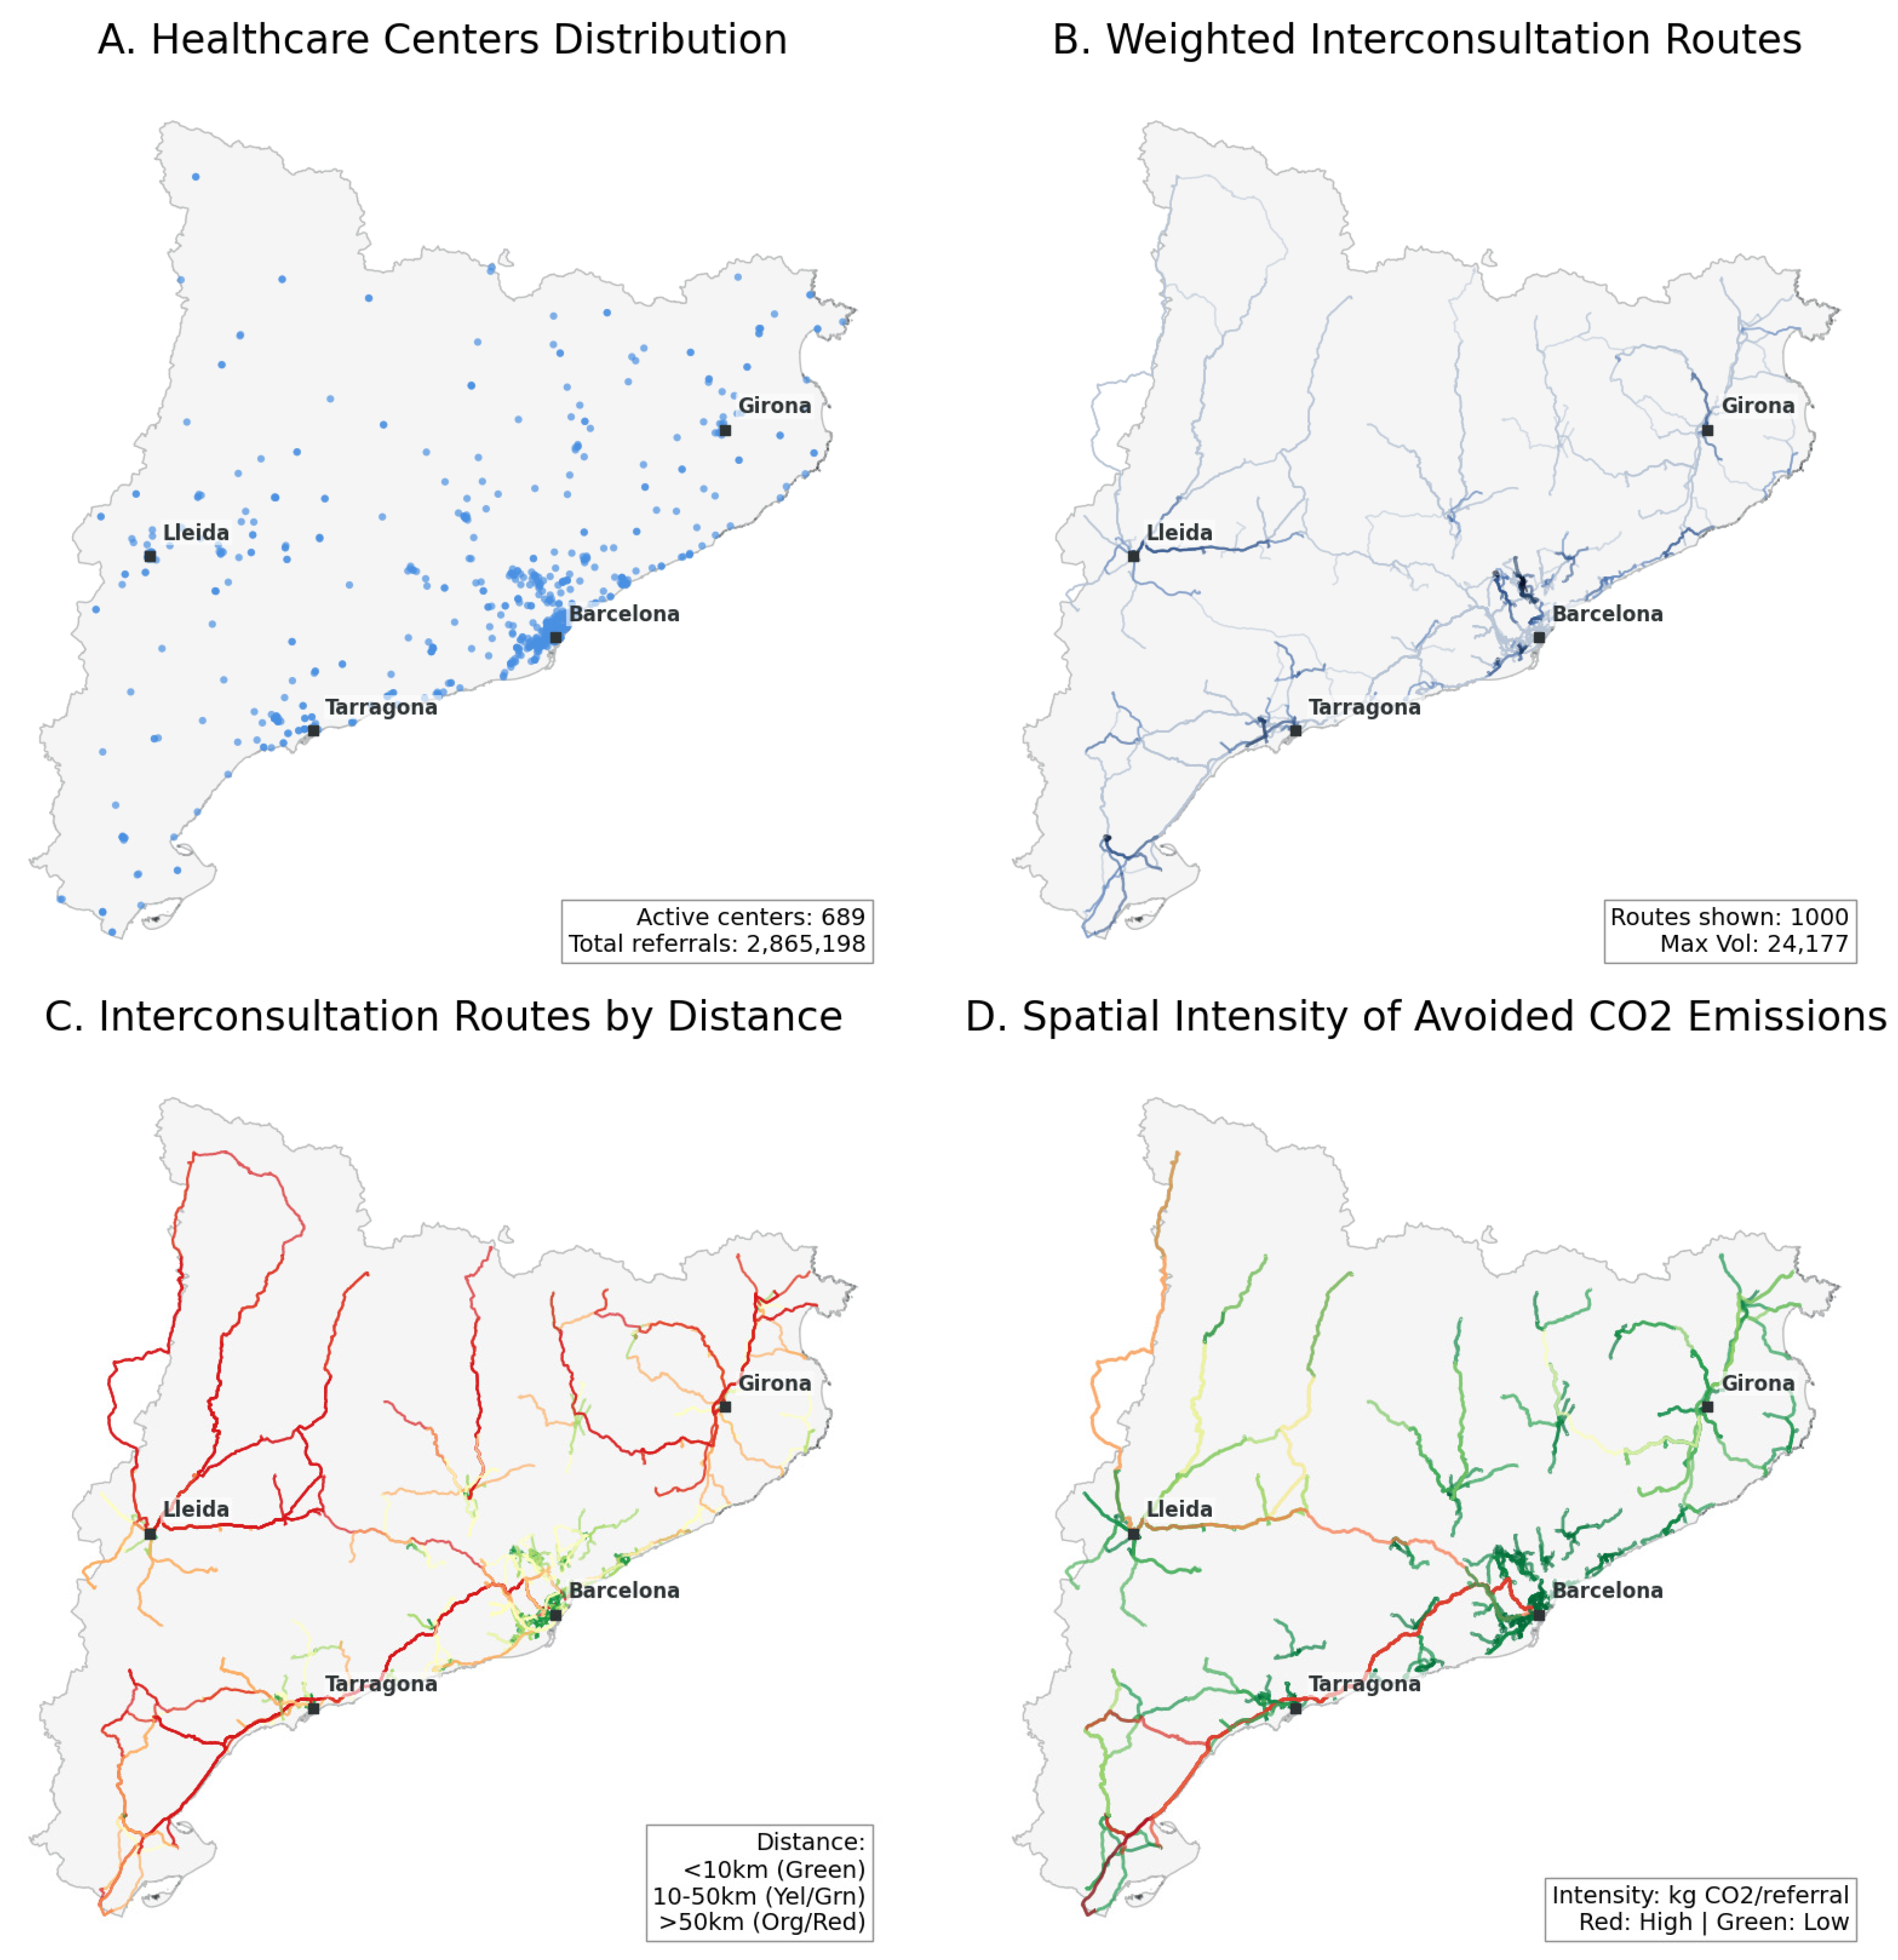
Spatial distribution and environmental impact of interconsultations across Catalonia’s public healthcare system (2019, 2023-2025). (A) Geographic distribution of healthcare centers showing concentration in the Barcelona metropolitan area. (B) Volume-weighted interconsultation routes with line thickness proportional to consultation frequency (max: 24,177 consultations per route). (C) Routes categorized by travel distance, with longer distances (red/orange) predominantly in peripheral regions. (D) Spatial intensity of avoided CO₂ emissions, warmer colors indicate greater theoretical environmental impact, demonstrating highest environmental benefits in geographically dispersed areas with longer inter-facility distances.
Figure 1.
Spatial distribution and environmental impact of interconsultations across Catalonia’s public healthcare system (2019, 2023-2025). (A) Geographic distribution of healthcare centers showing concentration in the Barcelona metropolitan area. (B) Volume-weighted interconsultation routes with line thickness proportional to consultation frequency (max: 24,177 consultations per route). (C) Routes categorized by travel distance, with longer distances (red/orange) predominantly in peripheral regions. (D) Spatial intensity of avoided CO₂ emissions, warmer colors indicate greater theoretical environmental impact, demonstrating highest environmental benefits in geographically dispersed areas with longer inter-facility distances.
Spatial Distribution of Interconsultations
The spatial distribution of interconsultations revealed clear territorial contrasts across Catalonia. Metropolitan areas (n=815,211) concentrated on the highest volume of interconsultation activity, reflecting higher population density and closer proximity between primary and specialised care facilities. In contrast, non-metropolitan regions exhibited more dispersed referral networks characterized by longer inter-facility distances, particularly in areas such as Lleida (n=122,150), Terres de l’Ebre (n=106,704) and Alt Pirineu i Aran (n=8,409).
These spatial patterns have direct implications for environmental impact. While metropolitan regions (n=815,211) account for most interconsultations in absolute terms, the longest referral routes which are predominantly located in non-metropolitan territories are associated with greater avoided travel distances and higher reductions in CO₂ emissions per interconsultation. This highlights the structural relevance of digital coordination in geographically dispersed regions, where replacing physical travel with interconsultations provides proportionally larger environmental benefits.
Discussion
Principal Findings
This study provides a system-wide assessment of the environmental impact associated with interconsultations in the Catalan public healthcare system. Using administrative data from 1.48 million non-presential, professional-to-professional interconsultations conducted over four non-pandemic years, the analysis indicates that digital coordination mechanisms may contribute to reductions in travel-related emissions. These findings suggest that interconsultations, when embedded in routine clinical workflows, represent a potentially scalable approach of improving the environmental sustainability of healthcare delivery.
Marked territorial differences were observed. Metropolitan regions accounted for the largest absolute reductions due to higher activity volumes, whereas non-capital regions achieved higher per-capita savings, likely reflecting longer referral distances and greater geographic dispersion of healthcare services.
Comparison With Prior Work
The results are consistent with previous studies showing that telemedicine can reduce the carbon footprint of healthcare, particularly through reductions in patient and professional travel [1,2,3,6,7]. However, most existing literature has focused on patient-facing virtual visits or specific clinical settings. This study extends prior work by highlighting the environmental relevance of professional coordination mechanisms, such as medical record-based and provider-to provider interconsultations, which are less dependent on patient behavior [5,6,7] and more readily scalable within existing health system infrastructures.
By capturing the cumulative system-level effect of interconsultations across an entire public healthcare system, this analysis complements prior work based on limited time frames or smaller samples and adds to the growing body of evidence in advancing healthcare sustainability.
Implications for Policy and Practice
From a policy and health system management perspective, interconsultations can be considered a low-disruption organizational intervention with potential environmental co-benefits. Their stronger relative impact in geographically dispersed regions suggests that professional telemedicine may help mitigate structural inequalities related to distance and access to specialized care, while simultaneously contributing to reduce travel-related emissions.
The findings also support consideration of environmental indicators, such as avoided travel distance or estimated emissions, into routine healthcare monitoring and evaluation frameworks. Systematic inclusion of such indicators could facilitate more informed decision-making as healthcare systems increasingly seek to align digital transformation strategies with climate and sustainability strategies.
Limitations
This study has several limitations. First, estimates of avoided emissions are based on standardized emission factors and assume private vehicle use for all journeys, which may overestimate avoided emissions in urban areas with extensive public transport networks [6,7]. Second, indirect emissions associated with digital infrastructure were not included in the analysis; however, existing literature suggests that these contributions are relatively small compared with transport-related emissions. Third, the assumption that each interconsultation substitutes a face-to-face visit may not apply uniformly across all clinical contexts, although it is considered reasonable at the population level.
The exclusion of pandemic years was intended to reduce bias related to atypical healthcare utilization and mobility patterns. While this strengthens internal validity, it limits the assessment of longer-term trends during periods of accelerated digital adoption.
Future Research
Future research should explore the environmental impact of interconsultations over longer time horizons and across different healthcare systems. Incorporating life cycle assessments of digital infrastructures and conducting comparative analyses across regions and care models. That would help refine emission estimates and strengthen understanding of the sustainability implications of professional telemedicine.
Conclusions
This study provides system-level evidence that professional-to-professional, non-professional interconsultations are associated with reductions in travel-related emissions within the Catalan public healthcare system. By quantifying avoided travel distances and estimated emissions across multiple years and regions, the findings suggest that digital coordination mechanisms can contribute to improving the environmental sustainability of healthcare delivery.
The results also highlight important territorial differences. While metropolitan regions account for the largest absolute reductions due to higher activity volumes, non-capital regions achieve greater relative and per-capita environmental benefits, reflecting structural differences in healthcare organization and geographic dispersion. These patterns underscore the relevance of professional telemedicine as a complementary strategy to support both sustainability goals and territorial equity.
Overall, interconsultations represent a low-disruption digital intervention with potential environmental co-benefits when embedded in routine clinical practice. Further research is warranted to assess their long-term impact, refine emission estimates, and explore their role with broader strategies for sustainable health system transformation.
Author Contributions
Conceptualization: FL; Data curation: MR; JX; Formal analysis: FL; AP; JX; AP; Investigation: FL; AP; Methodology: FL; AP; Project administration: FL; Supervision: FL; JV, JG; Validation: FL; Visualization: JX; MR; Writing – original draft: FL; AP; LR; MR; JX; AP; Writing – review & editing: FL; AP; LR; MR; JX; AP; EC; MS; JG; JV.
Funding
This study did not receive any specific funding.
Ethics Approval
This study used fully anonymized administrative data from the Catalan public healthcare system and did not involve direct patient contact. According to regulations, ethical approval and informed consent were not required.
Data Availability
The data used in this study are not publicly available due to legal and privacy restrictions but may be made available from the corresponding author upon reasonable request.
Conflicts of Interest
The authors declare no conflicts of interest related to this study.
References
- Lenzen M, Malik A, Li M, et al. The environmental footprint of health care: A global assessment. Lancet Planet Health. 2020;4(7):e271–e279.
- Corvalán C, Villalobos Prats E, Sena A, et al. Towards climate-resilient and environmentally sustainable health-care facilities. Int J Environ Res Public Health. 2020;17(23):8849.
- Eckelman MJ, Huang K, Lagasse R, et al. Health-care pollution and public-health damage in the United States: An update. Health Aff (Millwood). 2020;39(12):2071–2079.
- Purohit A, Smith J, Hibble A. Does telemedicine reduce the carbon footprint of healthcare? Future Healthc J. 2021;8(1):e85–e91.
- Rodler S, Ramacciotti L, Maas M, et al. The impact of telemedicine in reducing the carbon footprint in health care. Eur Urol Focus. 2023;9(6):1312–1322.
- Van der Zee C, Chang-Wolf J, Koopmanschap M, Van Leeuwen R, Wisse R. Assessing the carbon footprint of telemedicine. Health Serv Insights. 2024;17:11786329241271562.
- López Seguí F, Franch Parella J, Gironès García X, Mendioroz Peña J, García Cuyàs F, Adroher Mas C, et al. A cost-minimization analysis of medical record-based, store-and-forward and provider-to-provider telemedicine compared to usual care in Catalonia. Int J Environ Res Public Health. 2020;17(6):2008.
- Delarmente B, Romanov A, Cui M, et al. Impact of telemedicine use on outpatient-related CO₂ emissions. Am J Manag Care. 2025;31(9):447–451.
- Vidal-Alaball J, Franch-Parella J, Lopez Seguí F, Garcia Cuyàs F, Mendioroz Peña J. Impact of a telemedicine program on the reduction in the emission of atmospheric pollutants and journeys by road. Int J Environ Res Public Health. 2019;16(22):4366.
- World Health Organization. Maintaining essential health services: Operational guidance for the COVID-19 context. 2020.
- Google LLC. COVID-19 Community Mobility Report: Catalonia (Spain). 2022.
- Ministerio de Sanidad. Població de referència del Ministry of Health per a l’any 2025. 2025.
- Departament de Salut. Catàleg tècnic de dades: regions sanitàries. 2025.
- Google. Google Maps API [software]. 2025.
- Van den Bossche J, Jordahl K, Fleischmann M, et al. GeoPandas v1.1.1. Zenodo; 2025.
- HeiGIT. OpenRouteService API. 2025.
- Luxen D, Vetter C. Real-time routing with OpenStreetMap data. ACM SIGSPATIAL; 2011.
- Ministerio para la Transición Ecológica y el Reto Demográfico. Inventario Nacional de Gases de Efecto Invernadero 2025.
- Dirección General de Tráfico. Anuario estadístico general de tráfico 2024.
Table 3.
Descriptive statistics of travel distance and CO2 equivalent emissions per interconsultation, stratified by healthcare region in Catalonia (N=1,432,599). “Barcelona Ciutat” (n=129.721), “Barcelona Metropolitana Nord” (n=478.064) and “Barcelona Metropolitana Sud” (n=184.987) has been grouped under “Barcelona”.
| Metric | Barcelona | Camp de Tarragona | Girona | Lleida | Terres de l’Ebre | Catalunya Central | Alt Pirineu i Aran |
| N (Interconsultations) | 815,211 | 197,020 | 124,832 | 122,150 | 106,704 | 58,273 | 8,409 |
| Distance (km) Mean | 11.83 | 16.29 | 32.81 | 38.36 | 46.67 | 26.12 | 180.22 |
| Distance (km) Median | 8.06 | 9.28 | 27.93 | 17.21 | 43.20 | 17.55 | 194.96 |
| Distance (km) Std Dev | 10.94 | 14.89 | 28.23 | 41.26 | 72.16 | 26.16 | 86.65 |
| Distance (km) P75 | 15.30 | 27.85 | 43.69 | 60.41 | 50.50 | 36.63 | 249.59 |
| Distance (km) P90 | 25.98 | 36.40 | 76.20 | 103.97 | 80.45 | 56.06 | 284.94 |
| Distance (km) Total | 9,639,914.38 | 3,209,065.21 | 4,096,152.04 | 4,686,049.77 | 4,980,227.89 | 1,521,808.57 | 1,515,477.24 |
| CO2e (kg) Mean | 2.03 | 2.79 | 5.65 | 6.59 | 7.99 | 4.46 | 30.86 |
| CO2e (kg) Median | 1.37 | 1.57 | 4.85 | 2.92 | 7.33 | 3.02 | 33.07 |
| CO2e (kg) Std Dev | 1.90 | 2.55 | 4.89 | 7.09 | 12.35 | 4.47 | 14.81 |
| CO2e (kg) P75 | 2.64 | 4.72 | 7.58 | 10.49 | 9.04 | 6.35 | 42.55 |
| CO2e (kg) P90 | 4.41 | 6.17 | 13.43 | 18.05 | 13.97 | 9.51 | 48.33 |
| CO2e (kg) Total | 1,653,023.70 | 549,684.12 | 705,577.84 | 805,355.34 | 852,965.27 | 259,922.77 | 259,472.88 |
Disclaimer/Publisher’s Note: The statements, opinions and data contained in all publications are solely those of the individual author(s) and contributor(s) and not of MDPI and/or the editor(s). MDPI and/or the editor(s) disclaim responsibility for any injury to people or property resulting from any ideas, methods, instructions or products referred to in the content. |
© 2026 by the authors. Licensee MDPI, Basel, Switzerland. This article is an open access article distributed under the terms and conditions of the Creative Commons Attribution (CC BY) license (http://creativecommons.org/licenses/by/4.0/).
Copyright: This open access article is published under a Creative Commons CC BY 4.0 license, which permit the free download, distribution, and reuse, provided that the author and preprint are cited in any reuse.


