Preprint
Article

This version is not peer-reviewed.

Chemopreventive Effects of Citrus depressa Leaf Extract Through Nrf2 Pathway Activation and Epigenetic Modulation

Submitted:

26 January 2026

Posted:

27 January 2026

You are already at the latest version

Abstract

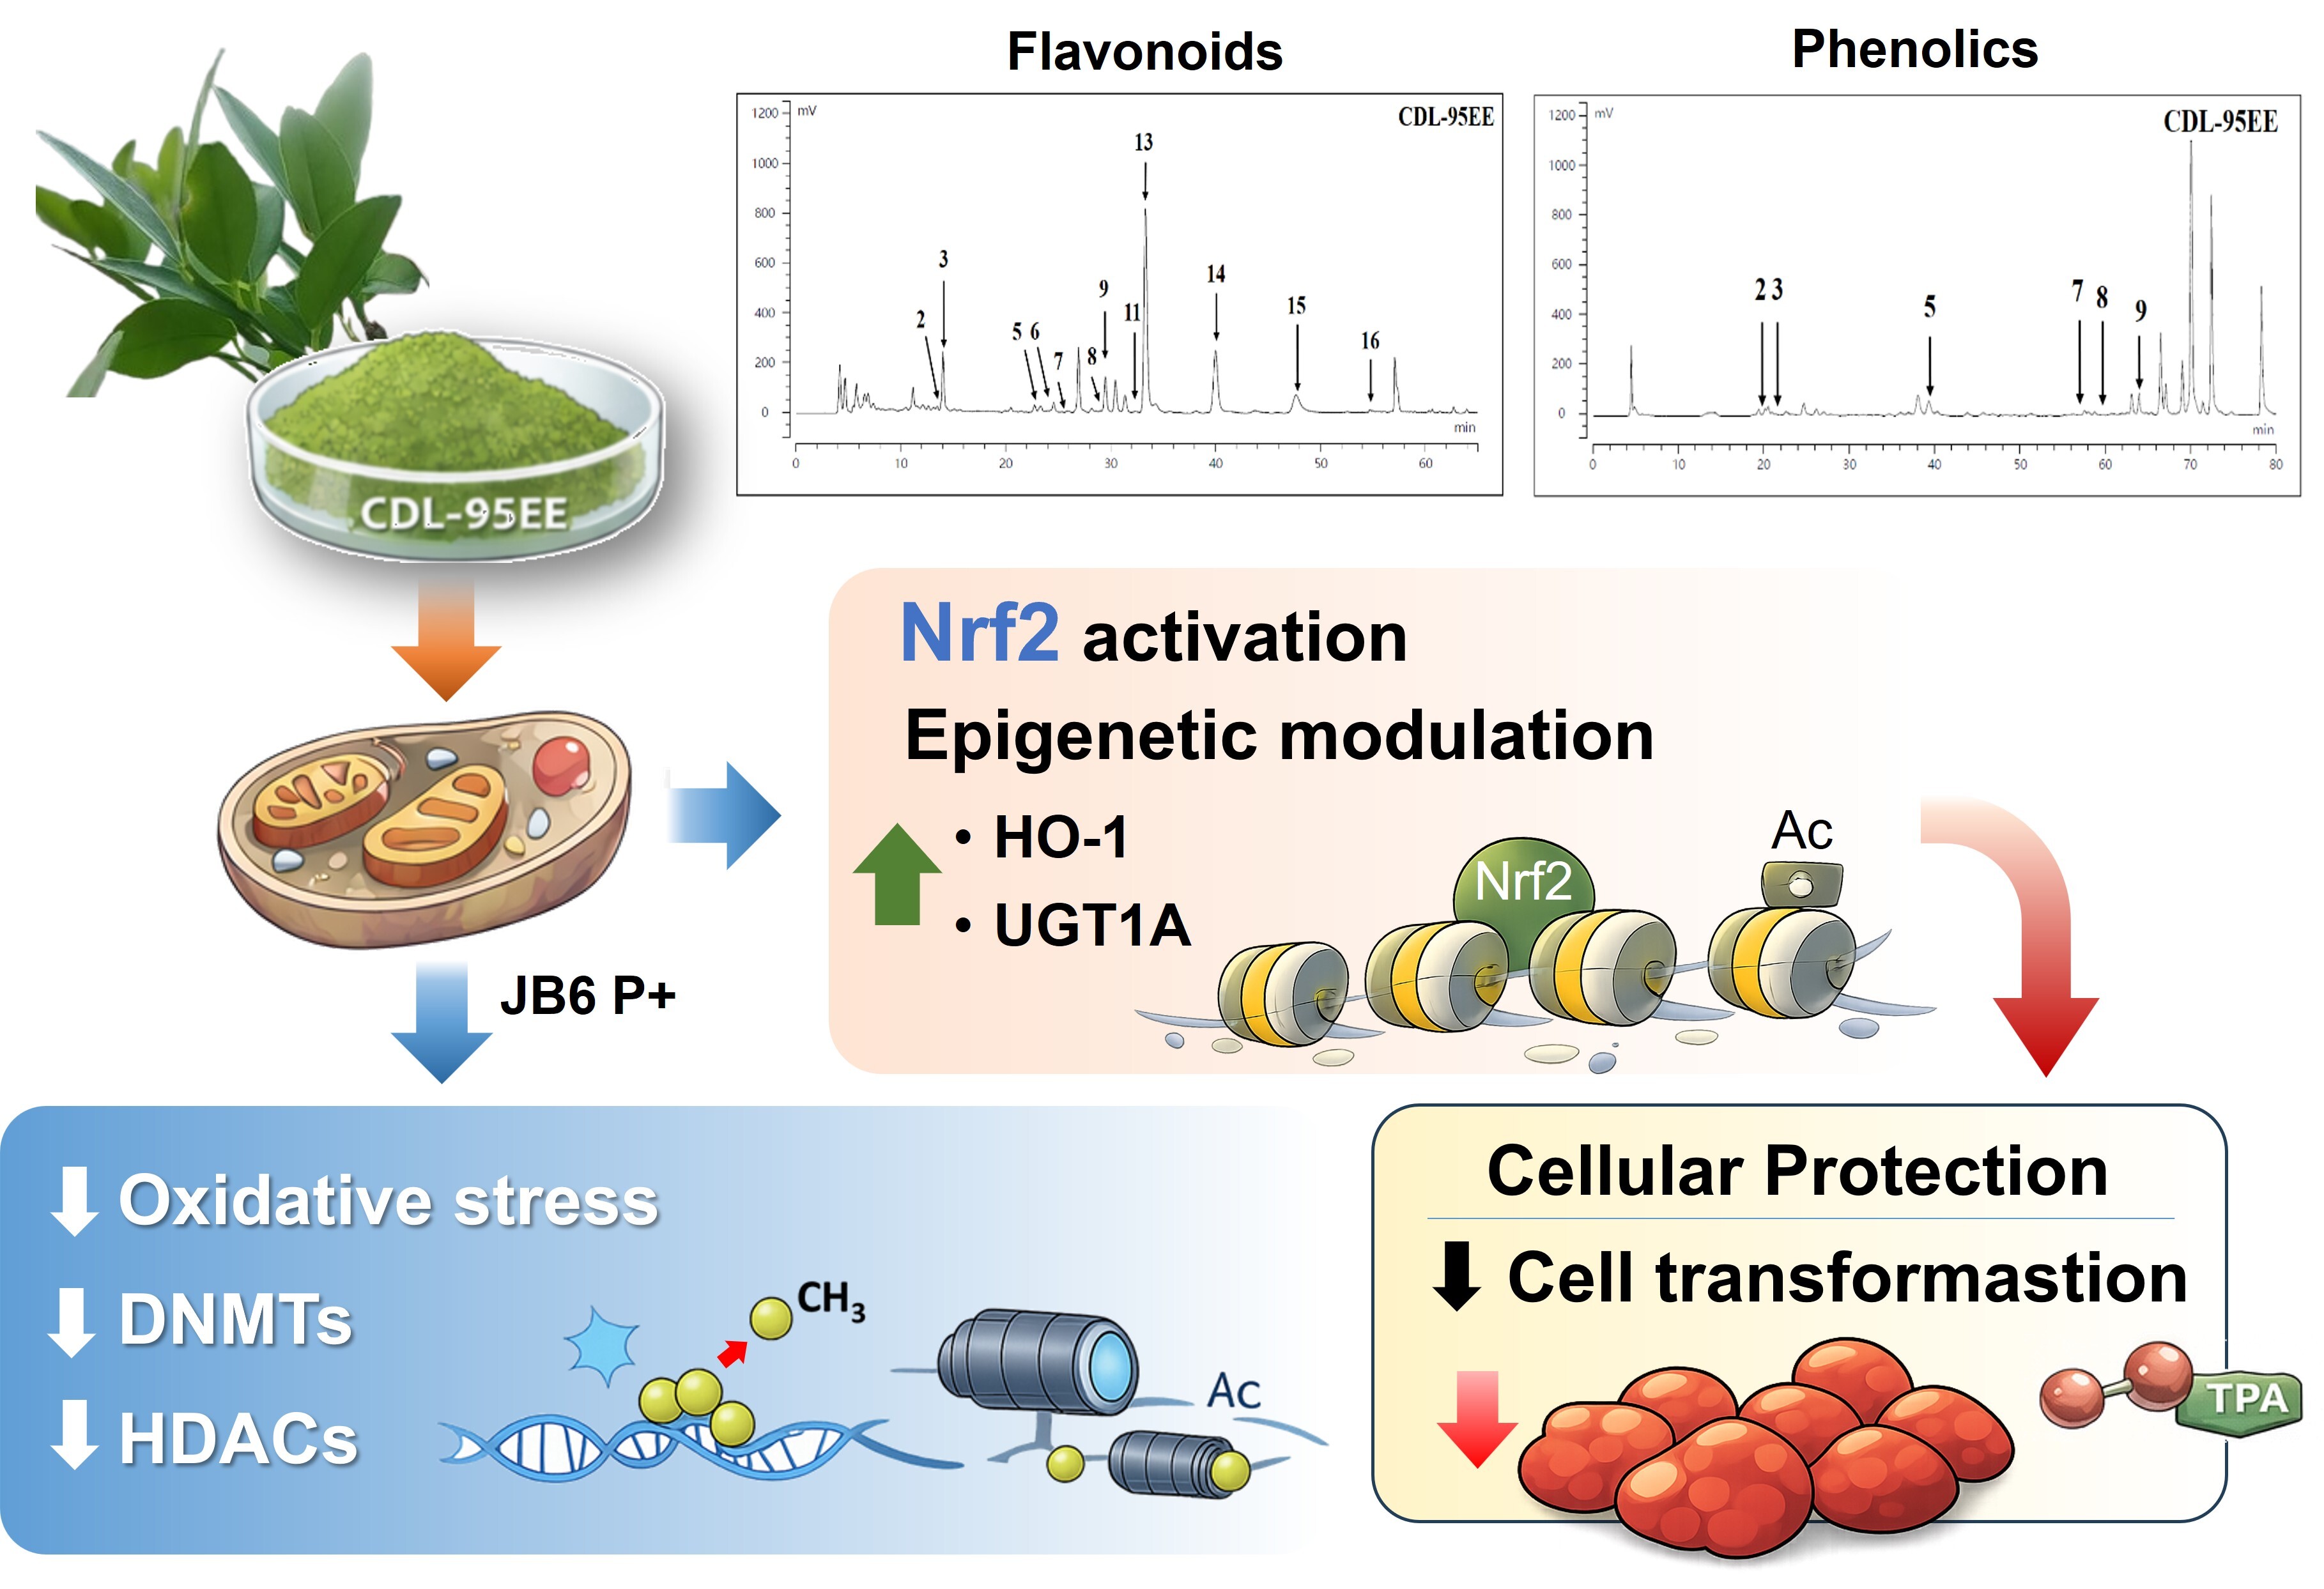
Many chronic diseases, including cancer, can be developed in conjunction with excessive intracellular oxidative stress and persistent inflammation. The importance of preventive strategies is highlighted by the potential of phytochemical interventions to mitigate these diseases. The purpose of this study was to investigate how Citrus depressa leaf (CDL) extracts can prevent TPA-induced carcinogenesis in mouse JB6 P+ skin epidermal cells. Both the water extract (CDL-WE) and the 95% ethanol extract (CDL-95EE) contain abundant flavonoids that inhibit TPA-induced cell transformation and colony formation without minimal cytotoxicity. Mechanistic studies indicated that CDL-95EE increased the gene expression of Nrf2-related detoxification and antioxidant enzymes such as UGT1A and HO-1, and decreased the accumulation of intracellular ROS. Furthermore, CDL-95EE also reduced the expression of epigenetic modifiers, including DNA and histone deacetylases (HDACs), suggesting that it is involved in epigenetic regulation. These findings indicate that CDL, an agricultural by-product, may be useful in cancer prevention through antioxidant and epigenetic mechanisms.

Keywords: 
;  ;  ;  ;  

1. Introduction

Cellular oxidative stress is caused by a decrease in antioxidant levels and an increase in free radical production. Reactive oxygen species (ROS) and free radicals are generated by the human body due to endogenous and external factors, but, fortunately, the antioxidant defense system prevents oxidative damage [1]. Endogenous antioxidant enzymes such as glutathione peroxidase (GPx) and superoxide dismutase (SOD), as well as nonenzymatic antioxidants, including glutathione (GSH), vitamin C, and vitamin E, are used under normal conditions [2]. The accumulation of excessive free radicals can cause oxidative stress when antioxidant defense mechanisms are exhausted, which can cause oxidative damage to DNA, proteins, and other cellular components [1]. The accumulation of oxidative damage can result in acute or chronic cell injury or persistent inflammatory responses, ultimately leading to the development of diseases such as cancer [3]. The activity of nuclear factor erythroid 2–related factor 2 (Nrf2) is regulated by oxidative stress, as it is a transcription factor that is highly sensitive to redox changes [4]. Nrf2 is sequestered in the cytoplasm by binding to Keap1 under normal conditions, but when cells are exposed to oxidative stress, it dissociates from Keap1 and moves to the nucleus [4]. It binds to antioxidant response elements (AREs) and initiates the expression of downstream genes that play a role in antioxidant and detoxification processes [5]. These genes encode superoxide dismutase (SOD), glutathione peroxidases (GPx), peroxiredoxins, heme oxygenase-1 (HO-1), UDP-glucuronosyltransferase (UGT), glutathione S-transferase (GST), and NAD(P)H:quinone oxidoreductase-1 (NQO1) and other enzymes [5]. The increased antioxidant capacity of cells decreases oxidative stress and aids in cancer prevention [6].
Epigenetics is defined as the control of gene expression through mechanisms that do not change the DNA sequence. These mechanisms, including DNA methylation, histone modification, and microRNA actions, can lead to differential gene expression [7]. DNMTs are typically responsible for DNA methylation and occur primarily at CpG dinucleotides [8]. Methylation of a DNA region decreases its transcriptional efficiency, leading to decreased protein production and suppression of gene expression [8]. The enzymes responsible for histone modifications include histone acetyltransferases (HATs), histone deacetylases (HDACs), and histone methyltransferases (HMTs) [9]. HATs loosen the structure of the chromatin to promote transcription, while HDACs compact the chromatin to suppress transcription [9]. The FDA has approved several drugs that inhibit HDACs and DNMTs for use as chemotherapeutic agents at present [10]. Furthermore, research has shown that epigenetic mechanisms mediated by phytochemicals can be used to prevent cancer. Sulforaphane and isothiocyanate are effective inhibitors of HDACs and DNMTs, which reduce methylation of the Nrf2 promoter, leading to increased Nrf2 mRNA expression [11]. Other natural cancer preventive compounds, such as urosolic acid, curcumin, and tocopherols, have been found to regulate Nrf2 gene expression through epigenetic regulatory mechanisms [12].
Lime leaf extracts have been proven to be promising for use in health supplements, and kaffir lime leaves are recognized for their high total phenol and flavonoid content [13,14]. Essential oils extracted from lemon, kaffir lime, and lime leaves have shown potential antioxidant and antidiabetic effects [15]. Bitter orange, bergamot, and kaffir lime leaf extracts also exhibit antioxidant and anticancer effects [16,17,18,19]. Furthermore, cosmetic products already incorporate derivatives of sweet orange and bergamot leaves [20]. These findings, as well as recent reviews on other Rutaceae herbs, such as Ruta graveolens, indicate that Rutaceae plants are essential sources of bioactive phytochemicals with beneficial and potentially adverse effects, which need to be carefully characterized [21]. Citrus depressa Hayata, a fruit of the Rutaceae family, is also known as Shiikuwasha in both Japan and Taiwan for its strong and sour aroma [22]. C. depressa juice and peel extracts, which are known for their biological properties, and polymethoxyflavones (PMFs), such as nobiletin and tangeretin, possess anti-inflammatory properties and can prevent cancer [23,24,25]. However, the bioactive properties of C. depressa leaves (CDL) are not fully explored. Investigating the cancer chemopreventive capacity of CDL can lead to an increase in the added value of agricultural by-products. A range of extraction solvents with varying polarities were used to comprehensively investigate the bioactive potential of CDL, including water, ethanol, methanol, and ethyl acetate [26]. The objective of this approach is to maximize the recovery of phytochemicals that possess diverse bioactive properties, especially flavonoids and phenolics, which differ in solubility depending on solvent polarity. The objective of this study is to determine whether these leaf extracts of these leaves can increase the cell antioxidant capacity of cells and to decipher their mechanism of inhibition of transformation in JB6 P+ skin cells. The results will help establish the efficacy of CDL in cancer prevention and could lead to an increase in its agricultural economic value.

2. Materials and Methods

2.1. Reagents and Materials

Citrus depressa leaves (CDL) were obtained from Pingtung, Taiwan. A voucher specimen has been deposited in the laboratory herbarium of Chung Yuan Christian University under the code CYCU-CD-001. Dr. Guor-Jien Wei, from the Institute of Food Safety and Health Risk Assessment at National Yang Ming Chiao Tung University (Taipei, Taiwan), kindly provided compounds as follows: 7-hydroxy-3',4',5,6,8-pentamethoxyflavone, 4'-hydroxy-5,6,7,8-tetramethoxyflavone, 3',4',5,7-tetramethoxyflavone, sinensetin, 3',4',5',5,6,7-hexamethoxyflavone, 4',5-dihydroxy-6,7,8-trimethoxyflavone, nobiletin, tangeretin, 5-hydroxy-3',4',6,7,8-pentamethoxyflavone, and 5-hydroxy-4',6,7,8-tetramethoxyflavone. Additional reagents and chemicals were obtained as follows: dimethylsulfoxide (DMSO), sodium bicarbonate (NaHCO₃), 12-O-tetradecanoylphorbol-13-acetate (TPA), Basal Medium Eagle (BME), bacteriological agar, 99.8% ethanol, quercetin, caffeic acid, catechin and Folin-Ciocalteu phenol reagent from Sigma-Aldrich (St. Louis, MO, USA); acetonitrile from Aencore (Box Hill Vic, Australia); Fetal bovine serum (FBS), penicillin-streptomycin, trypsin, gentamycin, glutamine, Minimum Essential Medium (MEM) and Dulbecco’s phosphate buffered saline (DPBS) from Thermo Fisher Scientific (Waltham, MA, USA); the Cell Titer 96® Aqueous One Solution Cell Proliferation (MTS) assay kit from Promega (Madison, MI, USA); methanol, 95% ethanol, and rutin from Echo Chemical (Miaoli, Taiwan); apigenin, luteolin, and myricitrin from ChemFaces (Wuhan, China); gallic acid, myricetin, synephrine, naringenin, and hesperidin from TCI (Tokyo, Japan); neohesperidin from Tauto Biotech (Shanghai, China); and 3',4'-dimethoxyflavone from ALFA Chemistry (Ronkonkoma, NY, USA).

2.2. Preparation of CDL Extracts

As previously mentioned, the extraction methods were used to obtain bioactive compounds [26]. The process of extracting CDL involved washing, drying, and grinding fresh leaves using a high speed grinder and then passing them through a 0.22 μm sieve to obtain powder. The mixture of 1 g of leaf powder and 30 mL of boiling water was held for 5 minutes and then filtered by vacuum. The resulting filtrate was freeze-dried to obtain a water extract (CDL-WE). Alternatively, 1 g of the leaf powder was mixed with 30 mL of 95% ethanol (CDL-95EE), 70% ethanol (CDL-70EE), methanol (CDL-ME), or ethyl acetate (CDL-EAE), and extracted at room temperature for 24 hours. After filtering the mixtures under vacuum, the filtrates were freeze-dried to obtain extracts that are solvent-free.

2.3. Determination of Total Phenolic Content (TPC)

The Folin-Ciocalteu method was used to determine TPC, a gallic acid that serves as a baseline [27]. The extracts were dissolved in 95% methanol at a concentration of 5 mg/mL, and standard solutions were prepared. Fifty μL of each extract or standard solution was added to 100 μL of the Folin-Ciocalteu reagent, followed by 400 μL of 700 nM Na₂CO₃. After incubation for 60 minutes, 200 μL of the mixture was transferred to a 96-well microplate and the absorbance was measured at 765 nm. The standard curve equation of gallic acid was used to determine the TPC of the extracts, which is expressed in gallic acid equivalents (GAE) per gram of dried extract.

2.4. Determination of Total Flavonoids Content (TFC)

The measurement of TFC was based on a previous study [27]. The extracts were dissolved in 95% methanol at a concentration of 25 mg/mL, and standard solutions were prepared. 50 μL of each extract or standard was added sequentially with 350 μL of 99.8% methanol, 20 μL of 10% AlCl₃, and 20 μL of 1.0 M potassium acetate, followed by 500 μL of water. After thoroughly mixing and incubating in the dark for 30 minutes, 200 μL of the mixture was transferred to a 96-well microplate. The absorbance was measured at 415 nm and the TFC of the extracts was calculated using the standard curve equation of quercetin to express as quercetin equivalents (QE) per gram of dried extract.

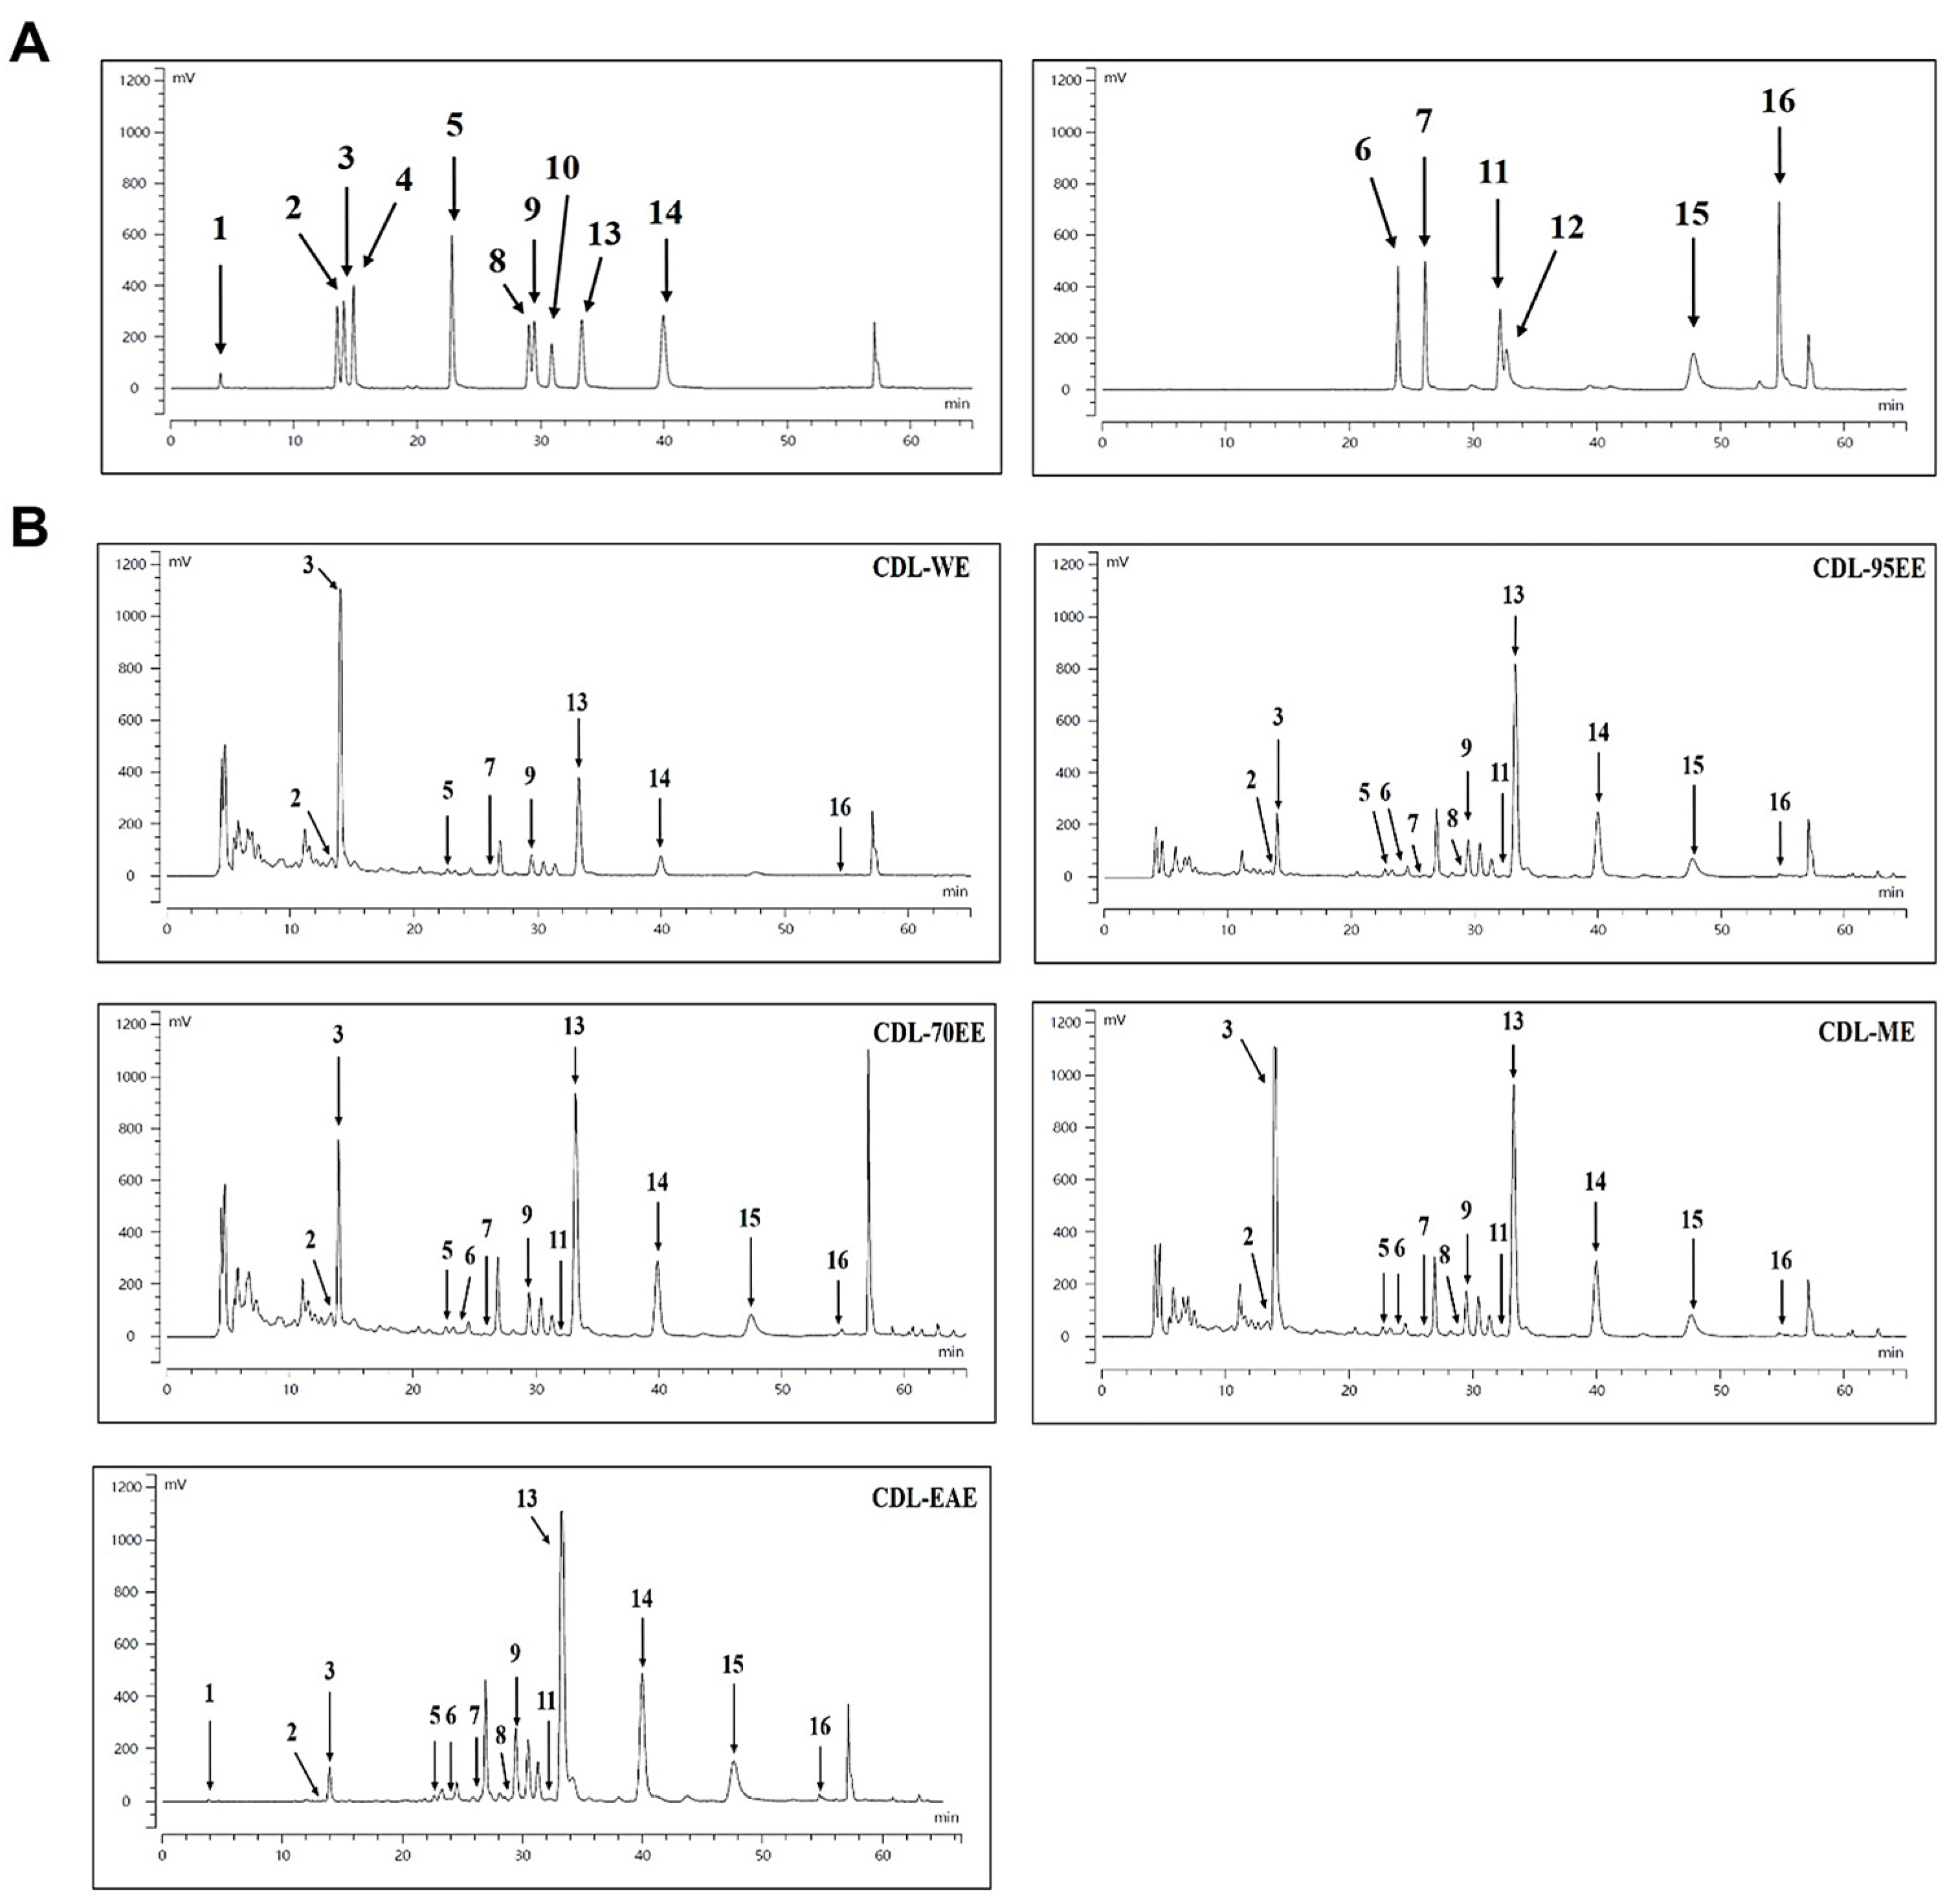
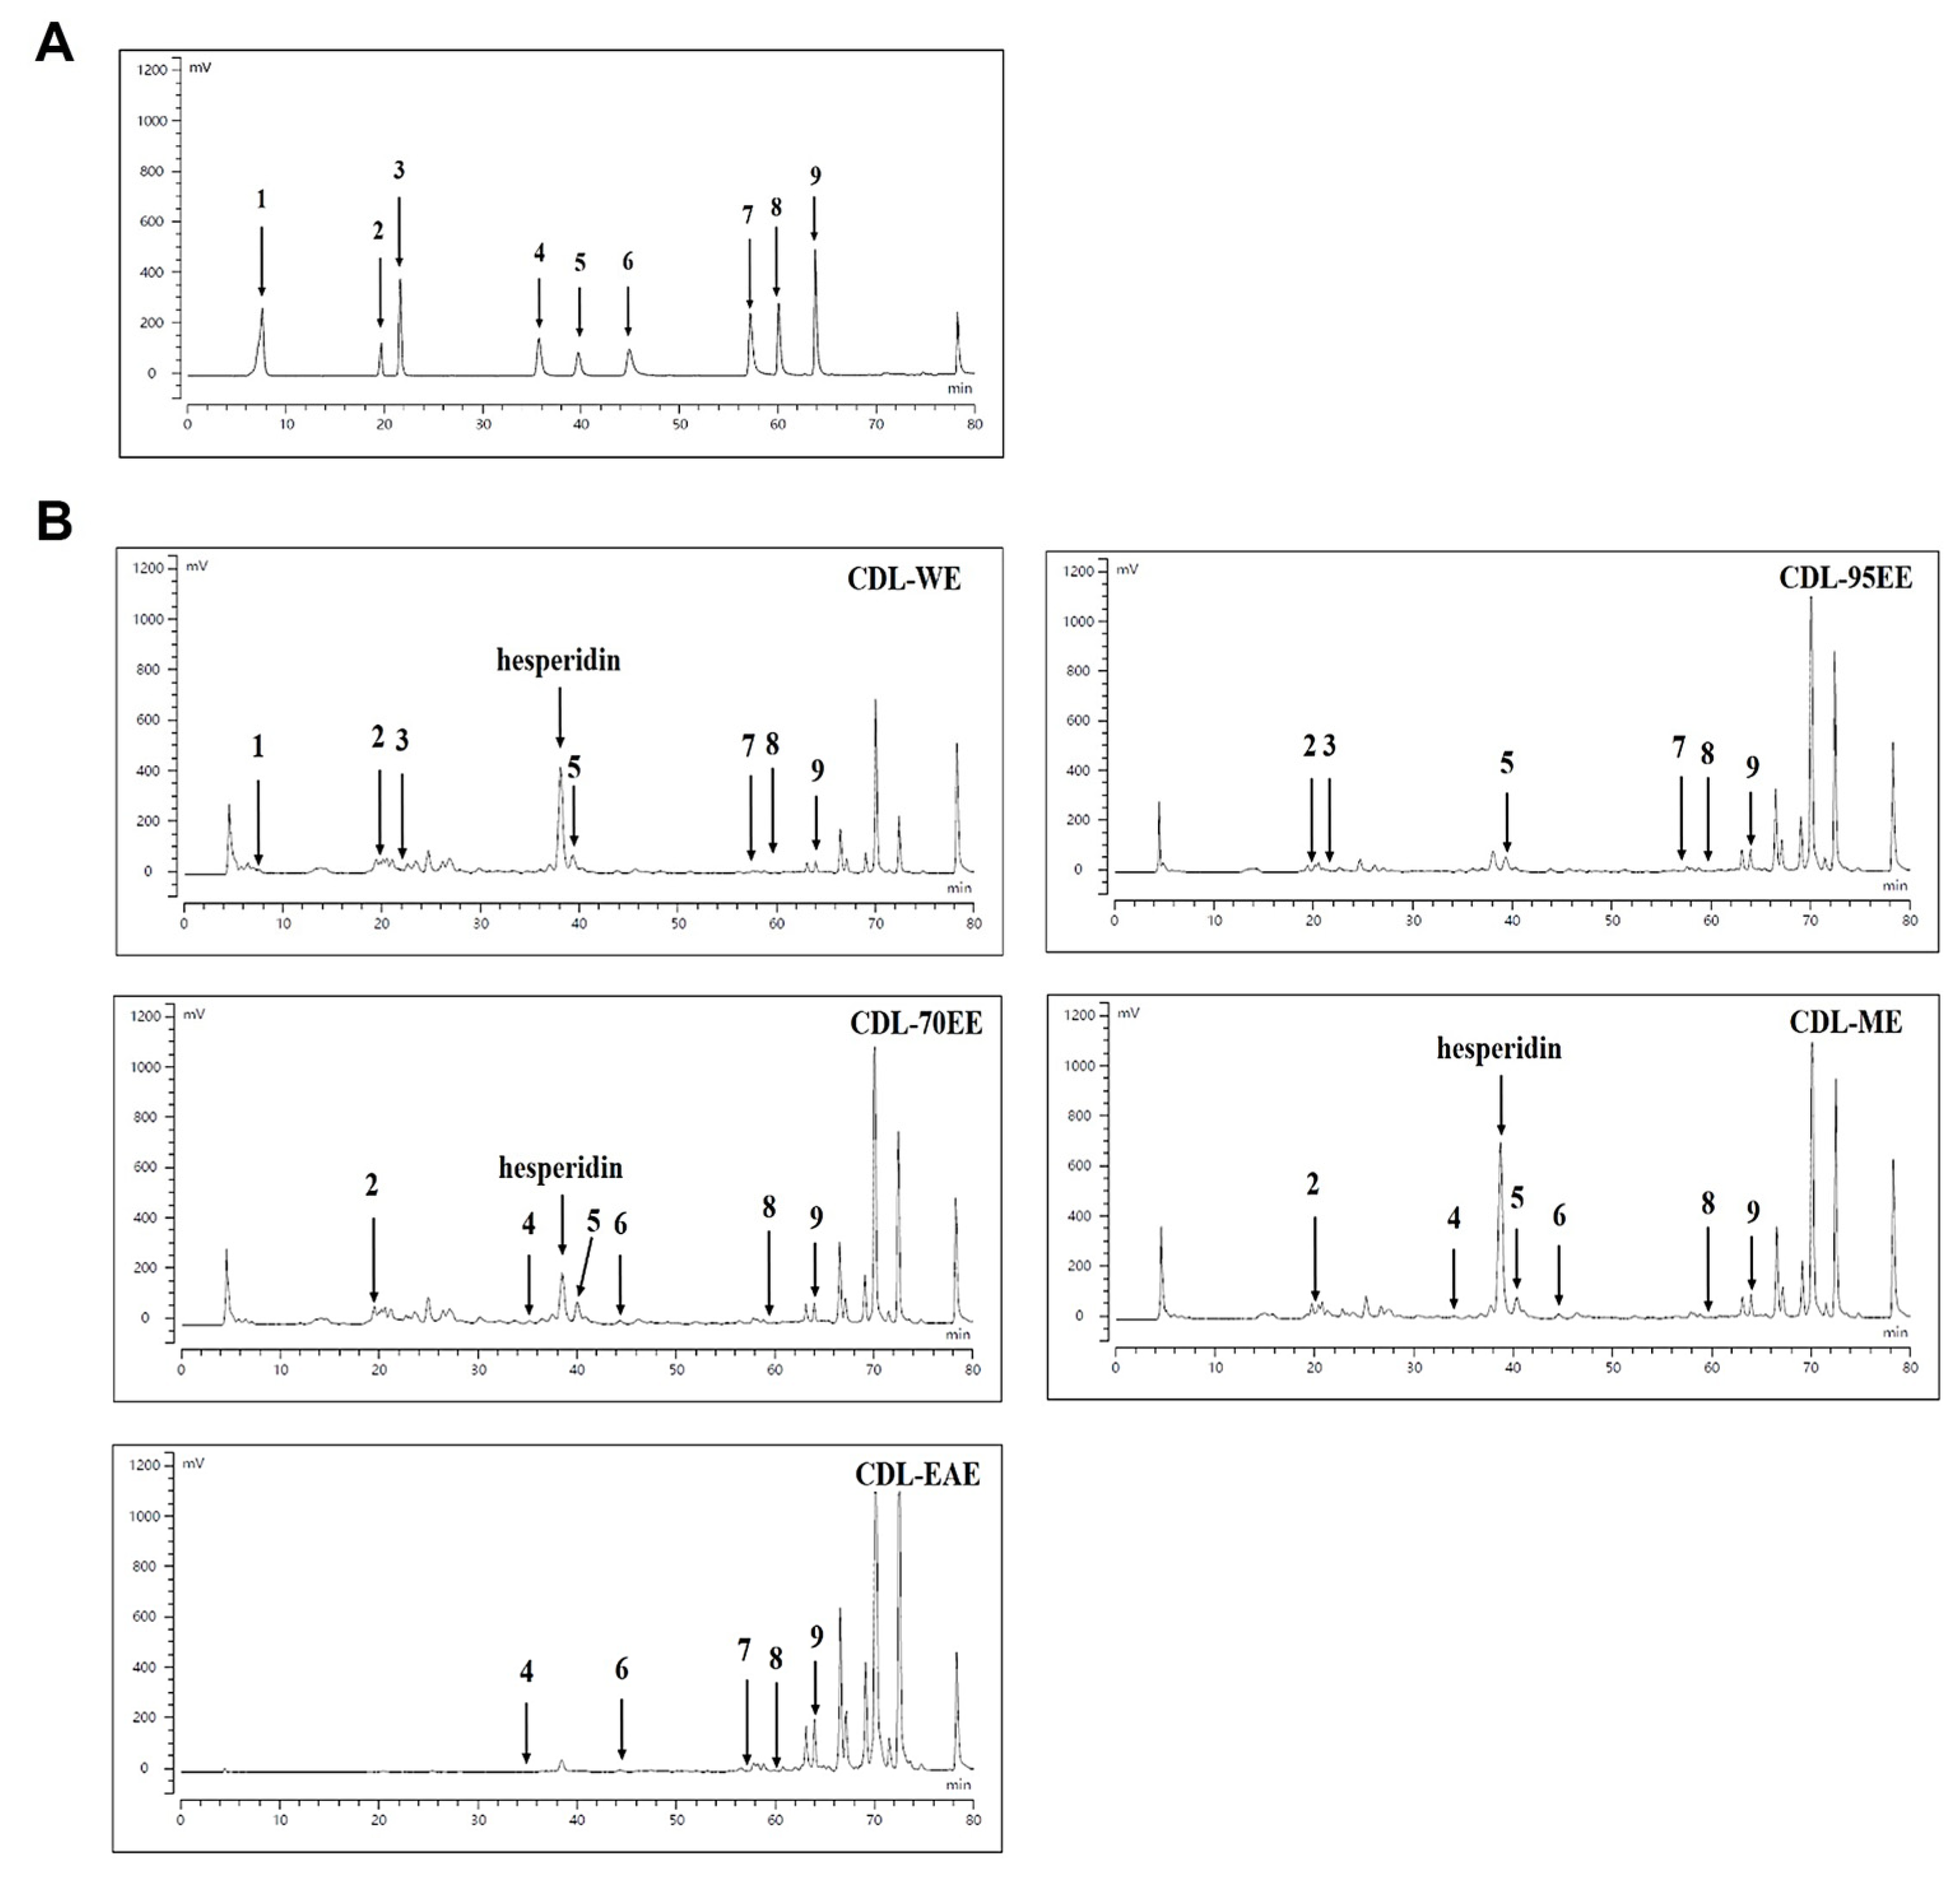
2.5. High Performance Liquid Chromatography (HPLC) of Major Compounds

The composition of the major compound was analyzed using HPLC equipped with a UV-vis detector. The flow rate was 0.7 mL/min, and the injection volume was set at 20 μL for an Agilent C18 column (4.6 × 250 mm, 5 μm). The preparation of standard and sample solutions involved the use of 100% methanol and filtration through a 0.22 μm membrane. The analytical conditions were as follows: (1) Flavonoid compounds were analyzed using a gradient elution method with mobile phase solutions A (0.5% acetic acid in water) and B (100% acetonitrile). The analysis took a total of 70 minutes and the measurement wavelength was 260 nm [28]. (2) Phenolic compounds were analyzed using a gradient elute method using mobile phase solutions A (1.0% acetic acid in water) and B (100% methanol). The total analysis lasted 90 minutes and the measurement wavelength was 280 nm [29].

2.6. Culture of JB6 P+ Cells

MEM was used to culture JB6 P+ cells together with 5% fetal bovine serum (FBS) and 1% penicillin-streptomycin. At 37°C, the cells were kept in a humidified atmosphere that contained 5% CO2. To store for a long time, the cells were suspended in MEM that contained 10% dimethyl sulfoxide (DMSO), transferred to cryovials, and stored in liquid nitrogen tanks.

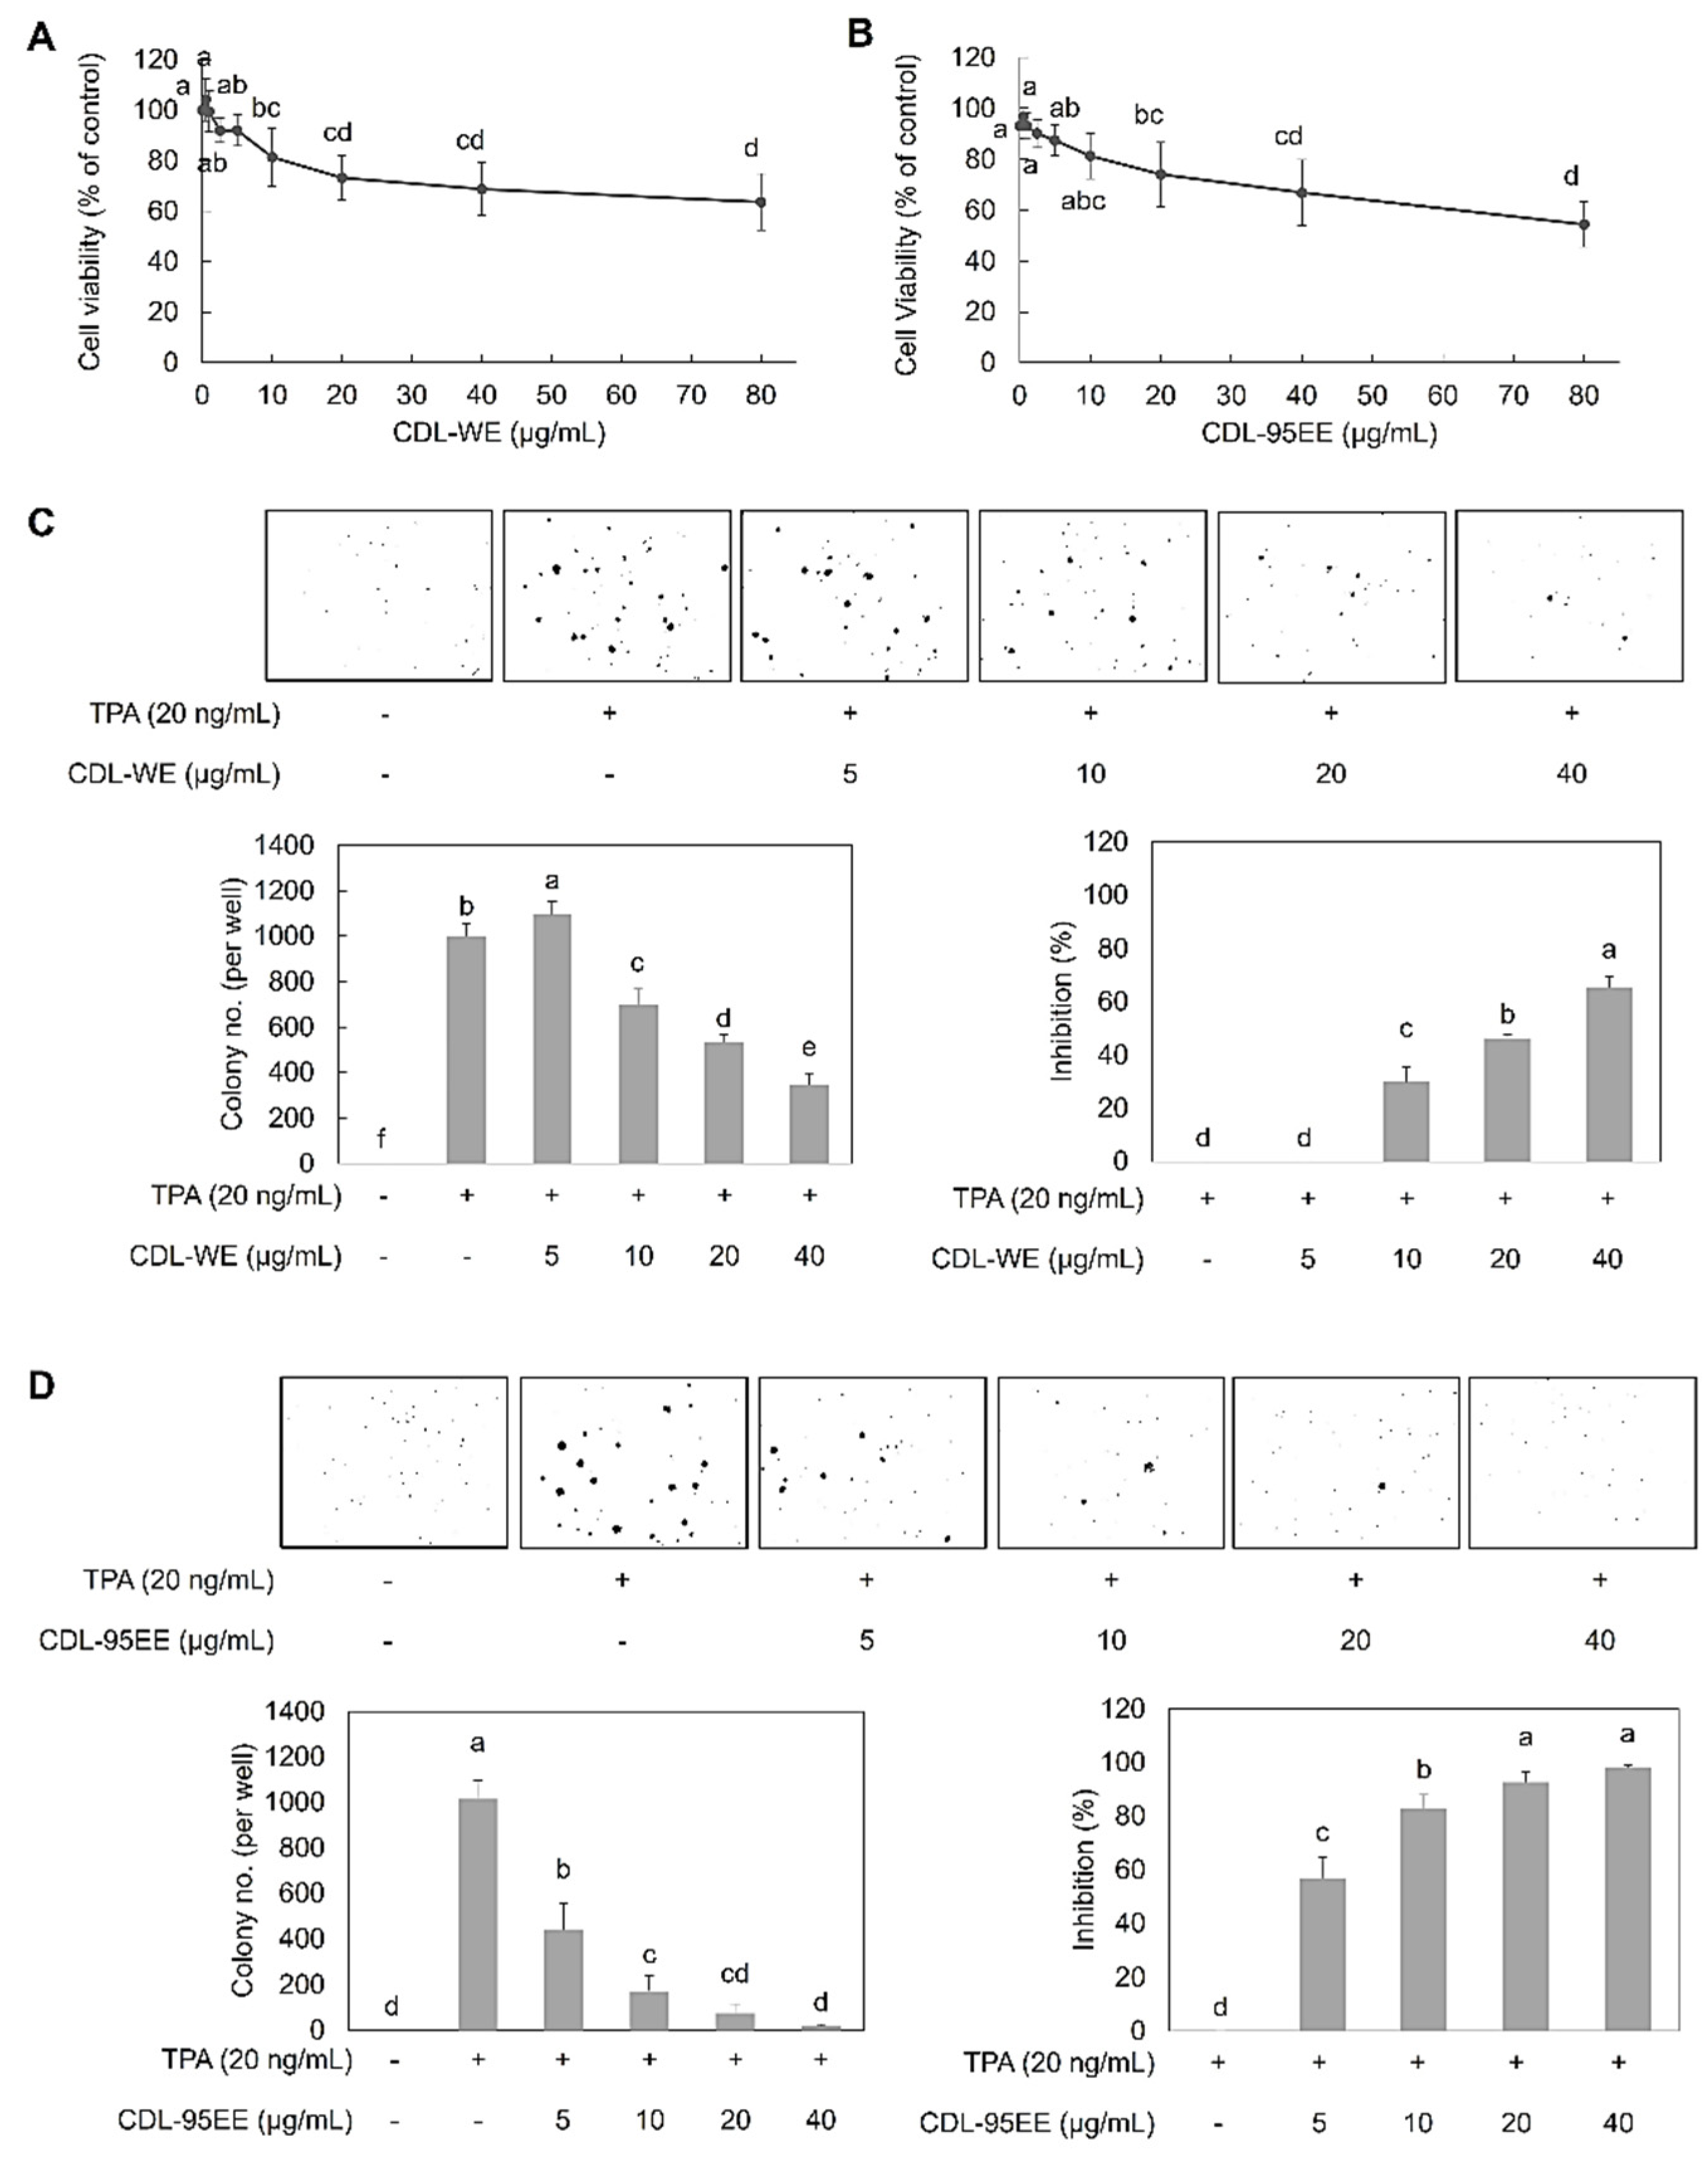
2.7. Cell Viability Assay

At a density of 5 × 10³ cells/100 μL per well, JB6 P+ cells were cultured in MEM that contained 5% FBS in a 96-well plate and for a 24-hour period. After removing the culture medium, cells were treated with CDL-WE or CDL-95EE dissolved in MEM containing 1% FBS. CDL-95EE was first dissolved in DMSO to prepare a stock solution, and then diluted to a final DMSO concentration of 0.01% in the medium, which does not affect cell viability. The MTS assay kit was used to measure cell viability after 72 hours of incubation. The MTS reagent and culture medium were combined in a 1:5 ratio to create the detection solution. The detection solution was added to each well and incubated at 37°C in the dark for approximately 2 hours. The absorption was then measured at 490 nm to calculate the viability of the cells.

2.8. TPA-Induced JB6 P+ Cell Transformation Assay

Following the method described in a previous study [30], the transformation of JB6 P+ cells was induced by TPA in a soft agar assay. A 0.5% agar in basal medium Eagle (BME) was prepared on a 6-well plate and left to solidify at room temperature for 1 hour. The top layer consisted of 0.3% agar and 8 × 10³ JB6 P+ cells per well after that. Cells were treated with 20 ng/mL TPA and various concentrations of CDL-WE or CDL-956EE, and incubated at 37°C for 14 days. ImageJ software was utilized to count the number of cell colonies.

2.9. ROS Level Assay

To assess intracellular oxidative stress, DCFH-DA staining was used and followed by flow cytometry to measure the mean fluorescence intensity (MFI) [31]. JB6 P+ cells were seeded in 6 cm dishes at a density of 1 × 10⁵ cells/3.5 mL/dish using MEM supplemented with 5% FBS. After incubation for 24 hours, the medium was replaced with 3.5 mL of MEM that contained 1% FBS and various concentrations of CDL-95EE. Cells were incubated for 48 hours, medium was removed, and cells were treated with 20 ng/mL TPA and different concentrations of CDL-95EE for another 48 hours. The cells were treated, which involved washing with 1 mL PBS and then incubating with 300 μL trypsin for 5 minutes. Cells were collected after adding 500 μL PBS and centrifugated at 400 ×g for 5 minutes. After removing the supernatant, 200 μL of PBS that included DCFH-DA was included and the cells were kept in the dark at 37°C for 30 minutes. The cells were subjected to centrifugation at 400 ×g for 5 minutes, washed twice with 500 μL PBS, and centrifuged again for 5 minutes. The cell pellet was resuspended in 500 μL PBS, and the fluorescence intensity was measured using flow cytometry with an excitation wavelength of 485 nm and an emission wavelength of 535 nm.

2.10. mRNA Expression Determination

The density of JB6 P+ cells was 5 × 10⁵ cells per dish in 10 cm dishes using MEM and 5% FBS. After 24 hours of incubation, the culture medium was removed and replaced by MEM that contained 1% FBS and different concentrations of CDL-95EE. Cells were incubated for another 48 hours and then scraped off using 1 mL PBS after removing the culture medium. Cells were obtained by centrifuge at 400 ×g at 4°C for 5 minutes, and then washed twice with pellet cells. The collected cells were used to prepare DNA, RNA, and protein samples for further experiments. According to the manual, total RNA was extracted using the total RNA isolation kit (GeneDireX, Las Vegas, NA, USA). The RNA concentration was then determined using a spectrophotometer. CDNA synthesis was performed using the GScript First-Strand Synthesis Kit (GeneDireX). Nuclease-free water, iScript reaction mix, iScript reverse transcriptase, and 500 ng of RNA template were combined to create the reaction mixture that produces first-strand cDNA through reverse transcription. The iQ SYBR Green Supermix kit (Bio-Rad, Hercules, CA, USA) was used to perform quantitative PCR (qPCR). Optimized thermal cycling conditions were used to carry out the qPCR reaction containing SYBR green reagent, primers, and 100 ng of first-strand cDNA. The analysis of relative mRNA expression levels targeted genes such as Nrf2, HO-1, UGT1A1, and NQO1.

2.11. Protein Determination

Cell pellets were lysed by resuspension in a lysis buffer containing phenylmethylsulfonyl fluoride and protease inhibitor. Cell lysates were homogenized using an ultrasonic cell disruptor and centrifuged at 17,000 ×g at 4°C for 30 minutes. The supernatant was collected for protein quantification using the bicinchoninic acid (BCA) assay, with bovine serum albumin (BSA) as standard. A loading dye with SDS was used to mix 20 μg of protein samples and heat them at 95°C for 5 minutes. After the samples were placed in the wells of an SDS-polyacrylamide gel and electrophoresed, the separated proteins were transferred onto a PVDF membrane. The membrane was sequentially incubated in a Tris buffered solution containing 0.1% Tween-20 and primary and secondary antibodies. Finally, the protein bands were captured by detecting chemiluminescence on the PVDF membrane. The images were utilized for evaluating protein expression levels with specific antibodies. Primary antibodies used were anti-Nrf2 (ABclonal, #A0674), anti-HO-1 (Proteintech, #10701-1-AP), anti-UGT1A (GeneTex, #GTX114131), anti-DNMT1 (ABclonal, #A19679), anti-DNMT3a (ABclonal, #A2065), anti-HDAC1 (ABclonal, #A0238), and anti-HDAC4 (GeneTex, #GTX110231). β-actin (GeneTex, #GTX109639) was used as loading controls. The membranes were incubated with primary antibodies for 4°C overnight, and then HRP-conjugated secondary antibodies (anti-rabbit IgG, GeneTex, #GTX213110-01) were used at room temperature for 1 hour. Densitometric analysis using ImageJ (NIH, Bethesda, MD) was used to quantify Western blot bands and calculate the relative protein expression by comparing target protein intensity to β-actin ratio.

2.12. Quantitative Methylation-Specific PCR (qMSP)

According to a previous study [29], the Genomic DNA Isolation Kit (GeneDireX) was used to extract genomic DNA from cells. Bisulfite conversion was assessed using the EZ DNA Methylation-Lightning kit (Zymo Research, Los Angeles, CA, USA) to determine DNA methylation. Quantitative methylation-specific PCR (qMSP) was performed to analyze the methylation status of the Nrf2 promoter using the Bio-Rad iQ SYBR Green Supermix kit. The standardization of DNA quantification was achieved using whole bisulfite-modified DNA as a reference, and the relative amounts of unmethylated DNA were determined.

2.13. Statistical Analysis

Data were expressed using mean + standard deviation (SD). Using one-way analysis of variance (ANOVA) to perform statistical analysis, Duncan's new multiple range test was used to determine significant differences between mean values. The statistical significance of p < 0.05 was considered.

3. Results and Discussion

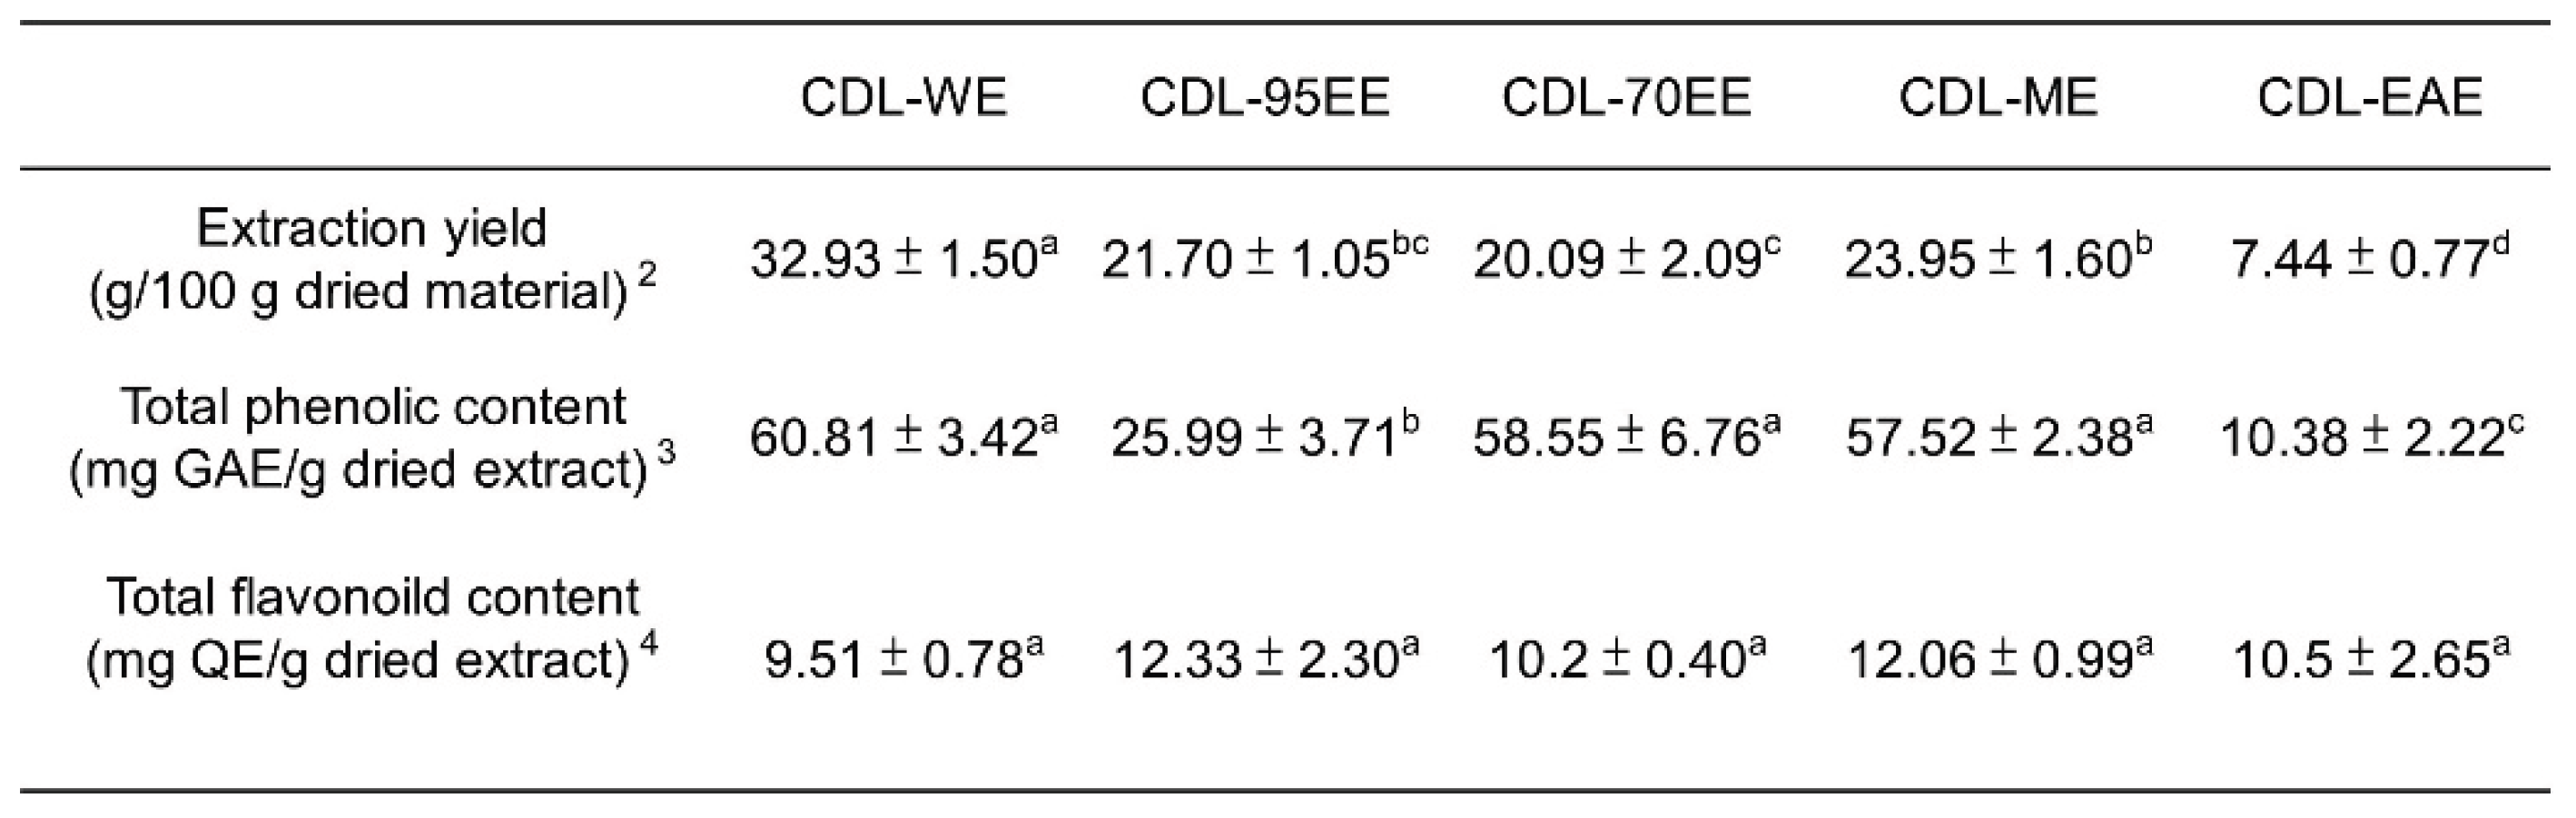
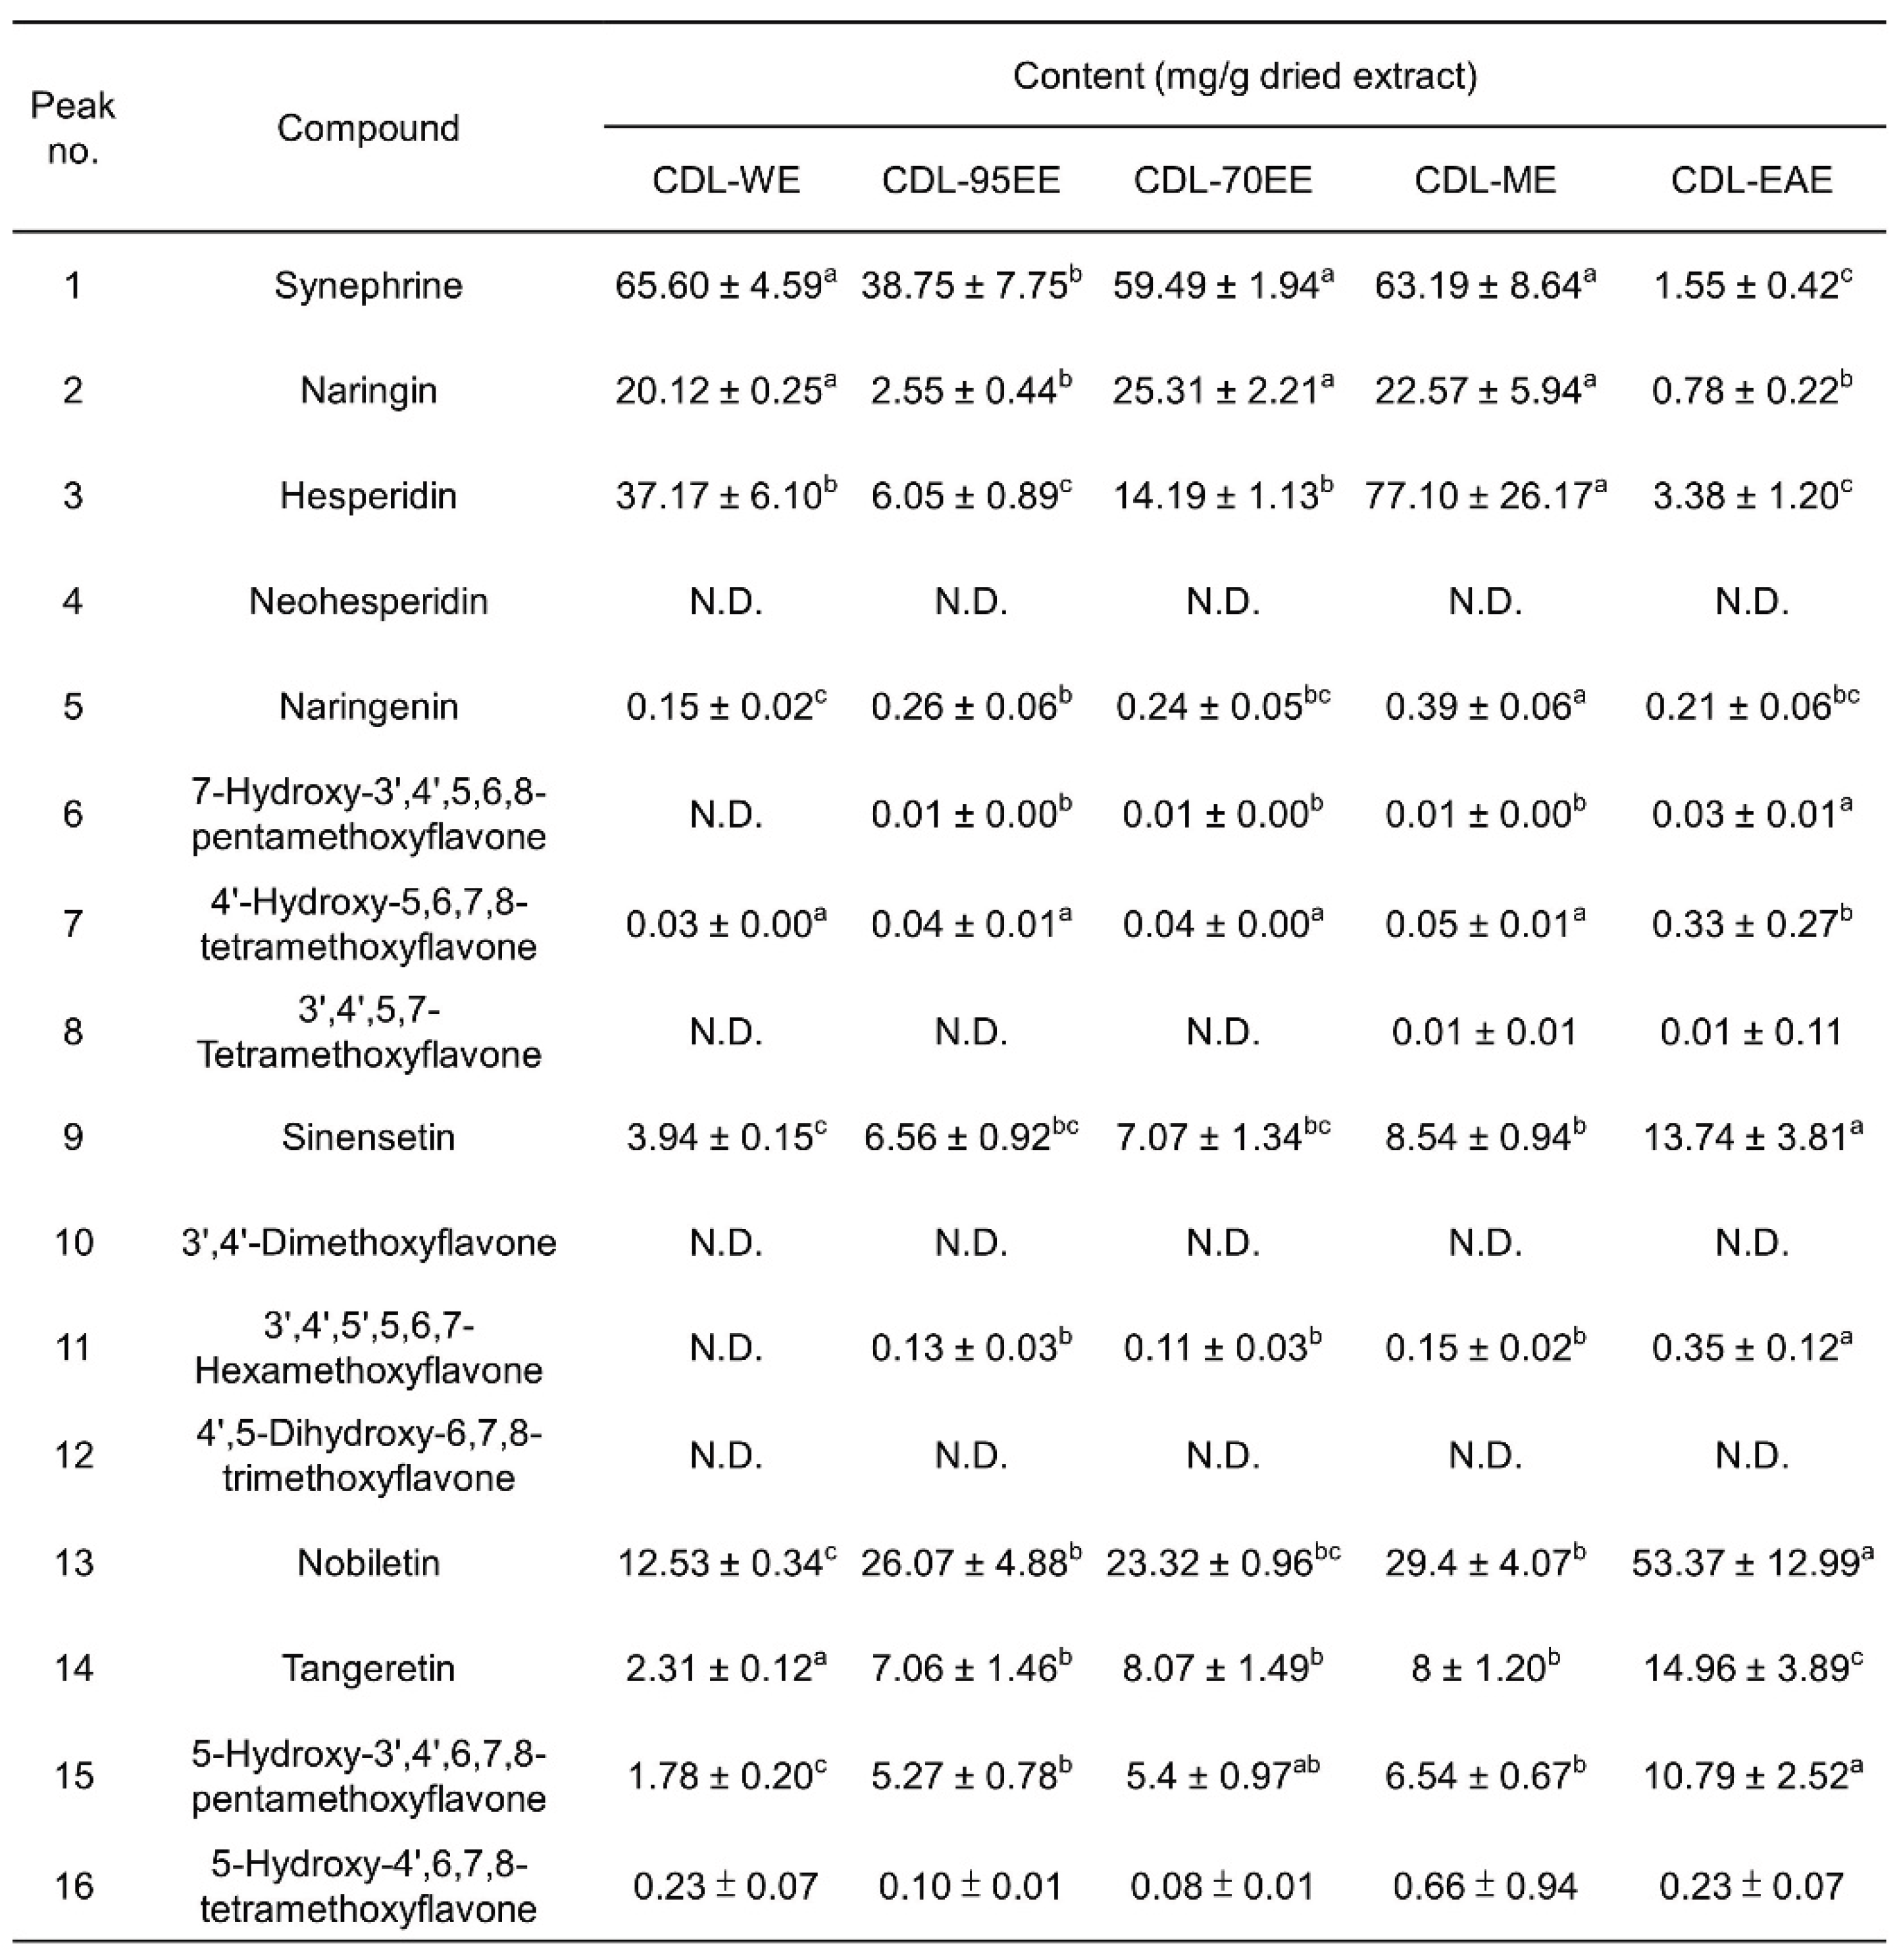
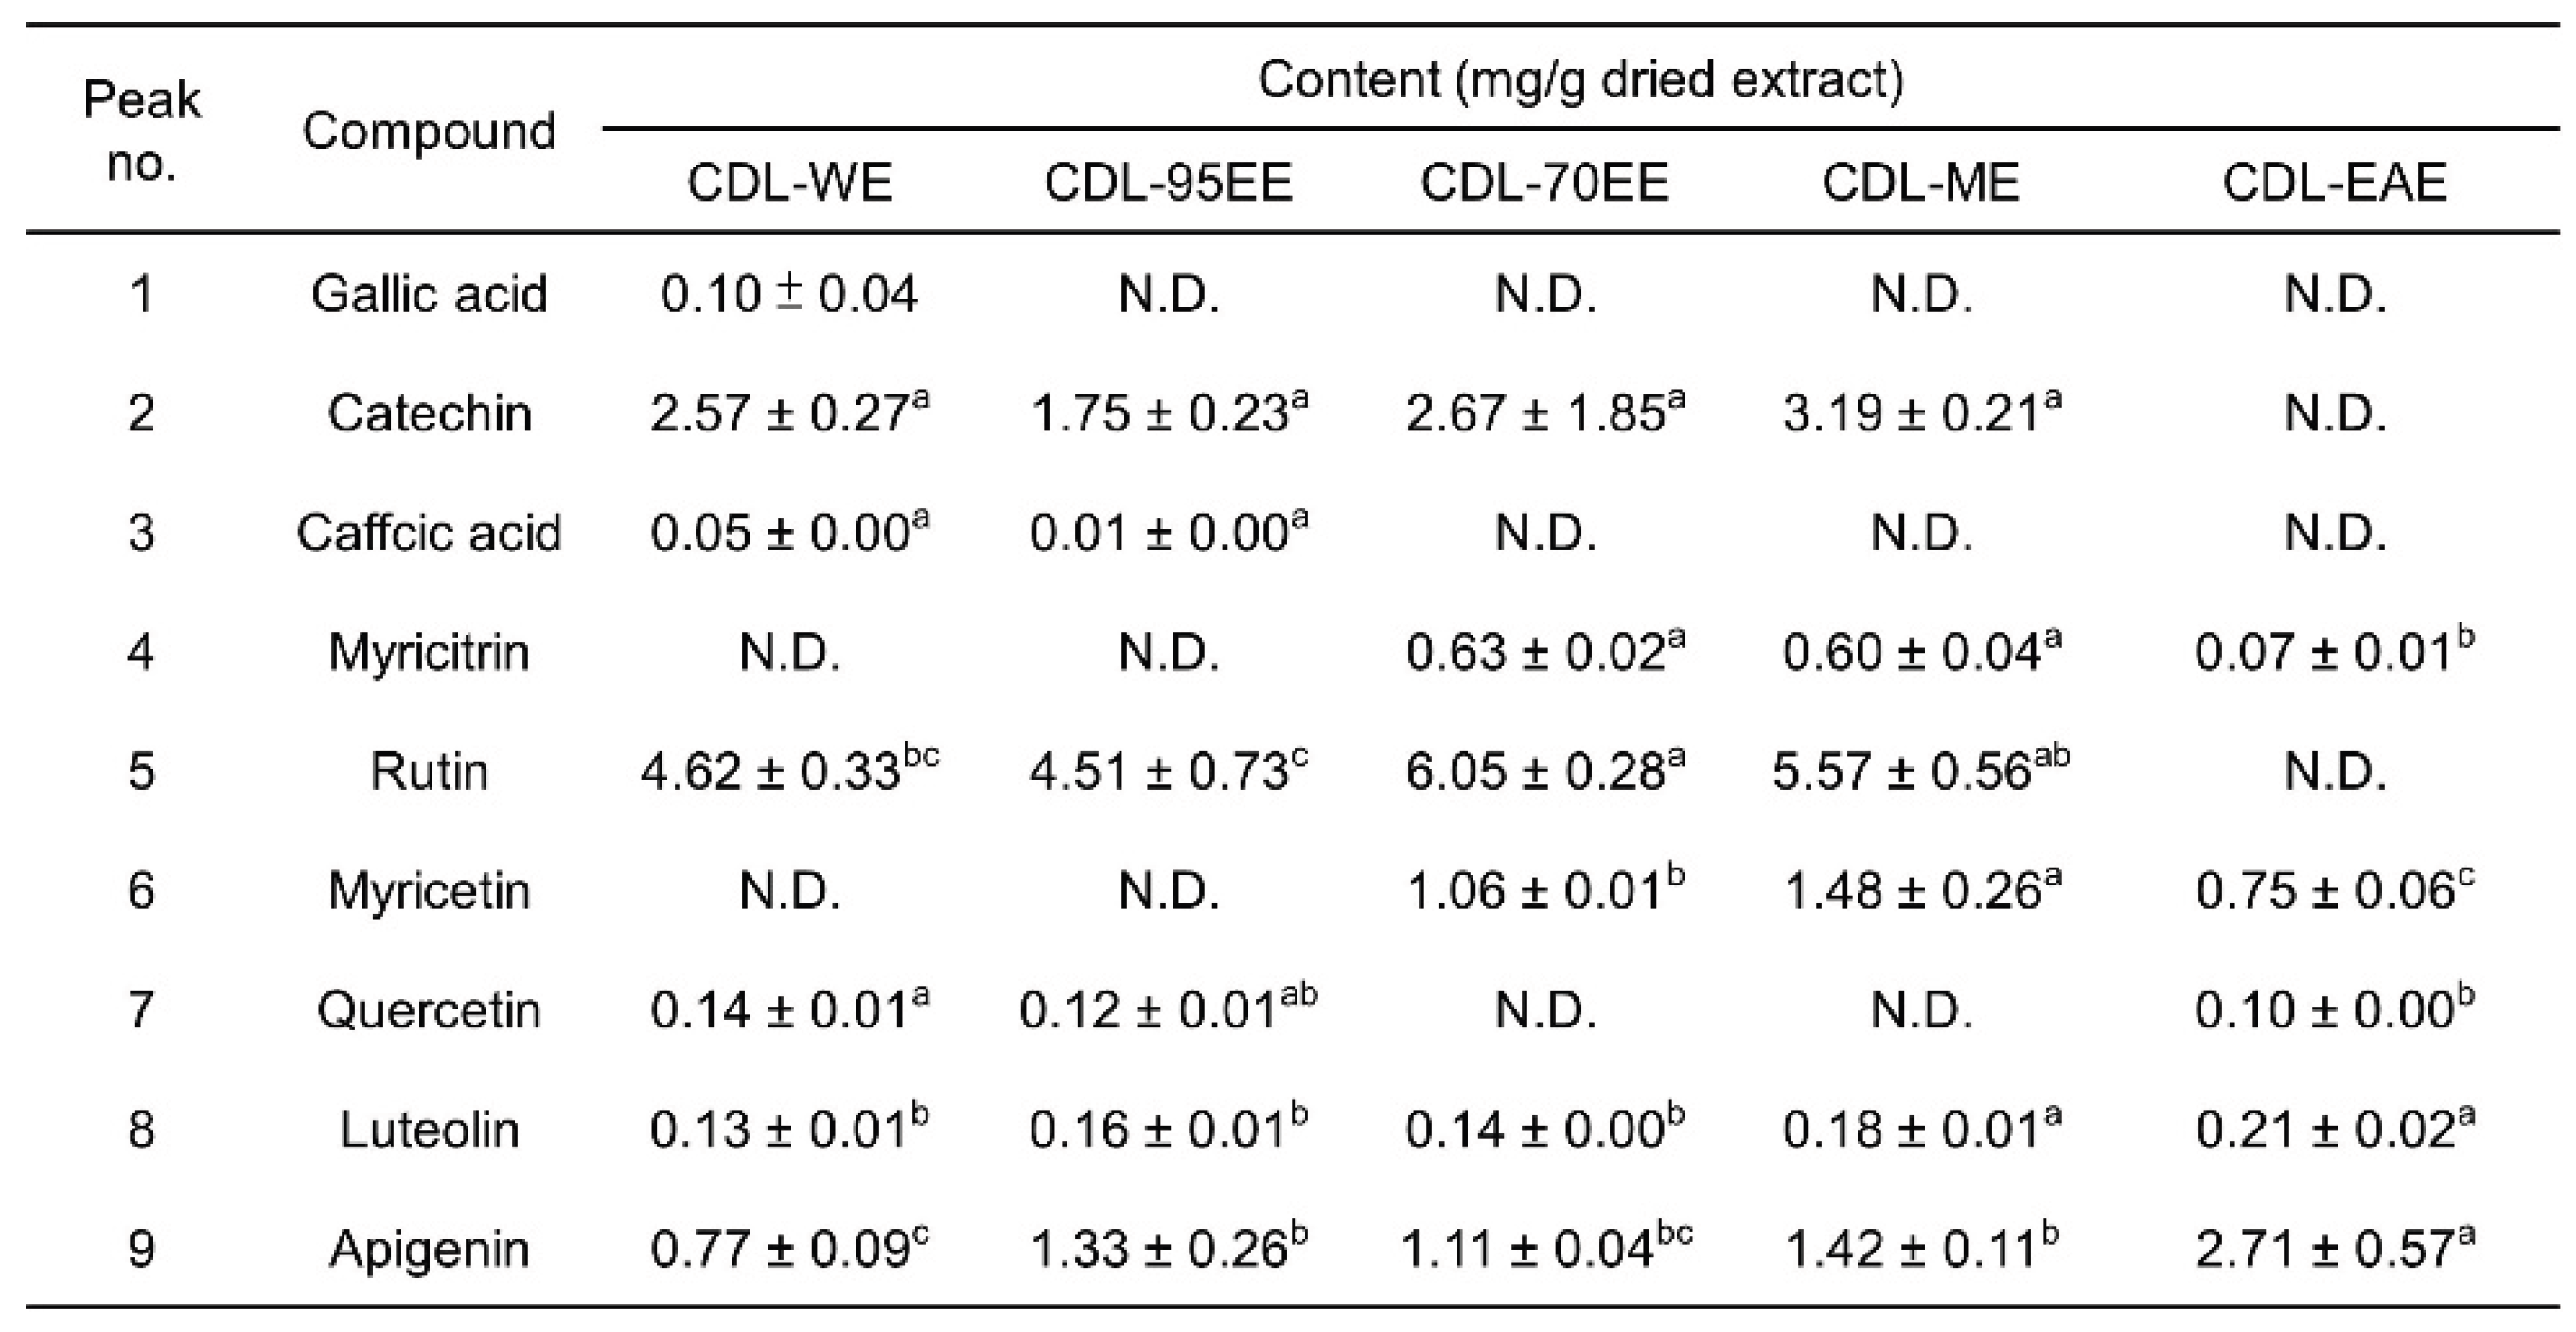
3.1. Citrus Depressa Leaves (CDL) Are Rich in Bioactive Flavonoids and Phenolics

The objective of this study was to pinpoint the key bioactive compounds in CDL with solvents of different polarities to enhance extraction efficiency and connect the chemical composition to bioactivity. First, this study aimed to investigate the active compounds in CDL. Extracts were produced by grinding leaves into powder, freeze drying them and extracting them using five different solvents: hot water extract (WE), 95% ethanol extract (95EE), 70% ethanol extract (70EE), methanol extract (ME), and ethyl acetate extract (EAE). As shown in Table 1, CDL-WE exhibited the highest extraction yield (approximately 32.93%), followed by CDL-ME (approximately 23.95%), CDL-95EE (approximately 21.70%), and CDL-70EE (approximately 20.09%), while CDL-EAE showed the lowest extraction yield (approximately 7.44%). The total phenolic content (TPC) varied significantly in some extracts (p < 0.05). CDL-WE had the highest TPC (60.81 ± 3.42 mg GAE/g), followed by CDL-70EE (58.55 ± 6.76 mg GAE/g) and CDL-ME (57.52 ± 2.38 mg GAE/g), while CDL-EAE had the lowest TPC (10.38 ± 2.22 mg GAE/g). However, the total flavonoid content (TFC) did not show significant differences among the extracts, with values ranging from 9.51 ± 0.78 mg QE/g (CDL-WE) to 12.33 ± 2.30 mg QE/g (CDL-95EE). On the basis of the results above, the extraction yield, TPC, and TFC variations observed with various solvent extractions could be primarily impacted by the solvent polarity and the chemical makeup of the extracted compounds. Water and ethanol-based extractions were the most efficient in extracting phenolic compounds, as previously investigated on the solubility [32]. CDL may have fewer hydrophobic polyphenols, as suggested by the low phenolic and flavonoid content in CDL-EAE.
To determine the composition and content of potential bioactive flavonoid compounds in different CDL extracts, HPLC analysis was performed using standard compounds, as shown in Figure 1. The quantitative analysis of the main flavonoid compounds is detailed in Table 2. The main flavonoids and polymethoxyflavones detected include synephrine at 4.03 min, naringin at 13.52 min, hesperidin at 14.04 min, naringenin at 22.81 min, sinensetin at 29.50 min, nobiletin at 33.34 min, tangeretin at 39.95 min, and 5-hydroxy-3',4',6,7,8-pentamethoxyflavone at 47.78 min. Several other methoxyflavones and various hydroxylated derivatives were also detected in different extracts. According to Table 2, CDL-WE contained the highest amount of synephrine (65.60 ± 4.59 mg/g), followed by hesperidin (37.17 ± 6.10 mg/g) and naringin (20.12 ± 0.25 mg/g). In addition to synephrine (38.75 ± 7.75 mg/g), CDL-95EE had a higher amount of nobiletin (26.07 ± 4.88 mg/g) and tangeretin (7.06 ± 1.46 mg/g). CDL-70EE and CDL-ME also had high levels of synephrine, naringin, and nobiletin, and CDL-EAE mainly consisting of nobiletin (53.37 ± 12.99 mg/g) and tangeretin (14.96 ± 3.89 mg/g) in the main component.
The phenolic levels of various CDL extracts were further evaluated, and Figure 2 shows the chromatograms of the standards and extracts. The results confirm the presence of key bioactive phenolics detected: gallic acid at 7.60 min, catechin at 19.68 min, caffeic acid at 21.61 min, myricitrin at 35.72 min, rutin at 39.72 min, myricetin at 44.91 min, quercetin at 57.21 min, luteolin at 60.09 min, and apigenin at 63.82 min. In Table 3, it was revealed that rutin was the main phenolic compound present in most extracts, with the highest concentration found in CDL-70EE (6.05 ± 0.28 mg/g), followed by CDL-ME (5.57 ± 0.56 mg/g), CDL-WE (4.62 ± 0.33 mg/g), and CDL-95EE (4.51 ± 0.73 mg/g). The high concentration of apigenin (2.71 ± 0.57 mg/g) in CDL-EAE suggests a unique bioactive profile compared to the rutin-rich extracts.
The composition of flavonoids and phenolic compounds in CDL extracts could be significantly different depending on the polarity of the solvent, directly influencing the extraction efficiency. Ethyl acetate extraction (CDL-EAE) was more effective in extracting lipophilic compounds, particularly nobiletin, tangeretin, and apigenin, compared to water and ethanol extractions (CDL-WE, CDL-70EE, and CDL-ME) that produced higher levels of hydrophilic flavonoids such as synephrine, hesperidin, naringin, rutin, and catechin. Nobiletin and tangeretin, both found in CDL, have been extensively researched for their anti-inflammatory, antioxidant, and anticancer activities [33,34]. These compounds have been shown to regulate oxidative stress and inflammation by activating the Nrf2 pathway, which is crucial to regulate cell defense mechanisms against oxidative damage [5]. CDL-95EE and CDL-EAE have a high content of nobiletin and tangeretin, suggesting strong chemopreventive potential, leading to promising candidates for future research in cancer prevention. Synephrine, which is the main alkaloid found in CDL-WE and CDL-70EE, has been documented to enhance thermogenesis and metabolic activity [35], suggesting that these extracts could be used in nutraceuticals and functional foods that aim to improve metabolic health. Furthermore, the most abundant phenolic compound in CDL-70EE and CDL-ME was rutin, which has been extensively studied for its antioxidant, anti-inflammatory, and anticancer properties [36]. Apigenin, found predominantly in CDL-EAE, is a flavone known as a potential chemopreventive agent due to its ability to modulate apoptosis and inhibit tumorigenesis through epigenetic mechanisms [37]. These findings highlight how solvent selection plays a crucial role in maximizing bioactive compound recovery and customizing CDL extracts for specific health applications. To advance research, it is important to evaluate the biological functions of CDL extracts, particularly their ability to regulate oxidative stress and prevent cancer. Therefore, CDL-WE and CDL-95EE were chosen for further research due to their high extraction yields, bioactive compound content, and safety, which makes them more suitable for large-scale applications. Synephrine, hesperidin, and naringin in CDL-WE contribute to its metabolic and antioxidant functions. CDL-95EE is rich in nobiletin and tangeretin, which are considered chemopreventive for cancer.

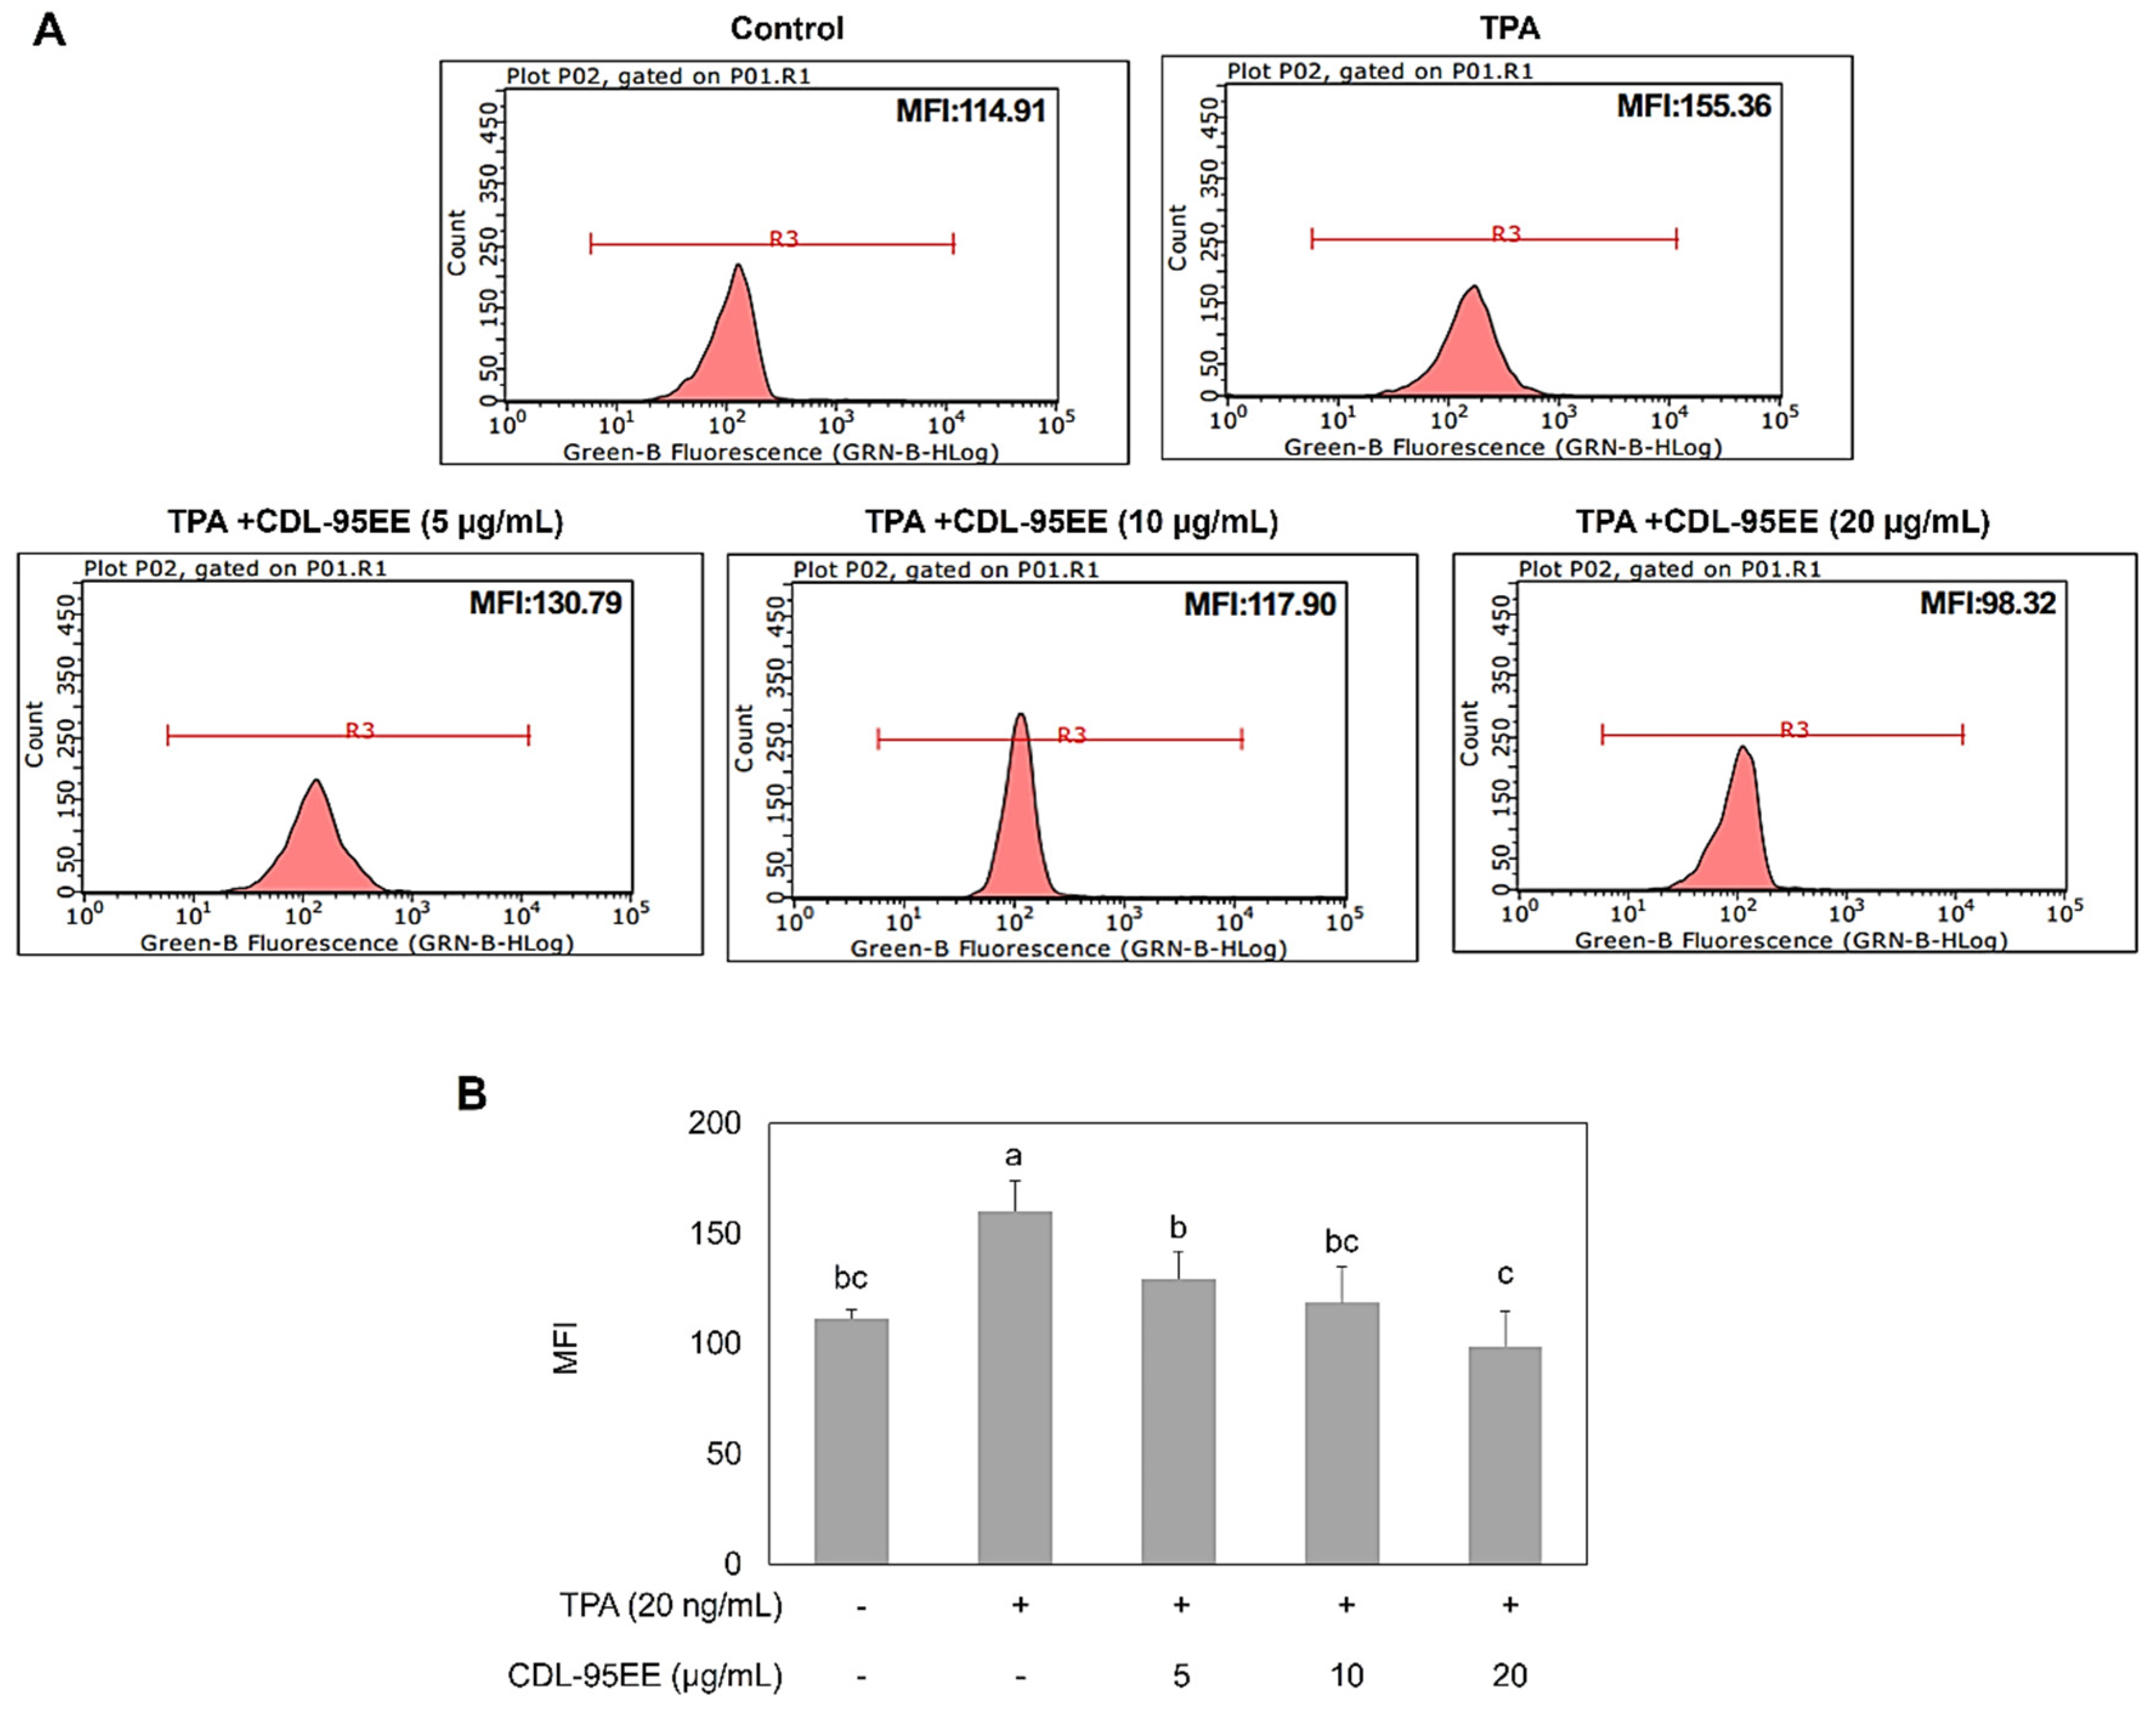
3.2. CDL-95EE Mitigates TPA-Induced Oxidative Stress and Inhibits JB6 P+ Cell Transformation

The potential of CDL extracts to protect against cancer was evaluated through in vitro assays with JB6 P+ cells to evaluate cytotoxicity, antioxidant activity, and inhibition of tumor promoter-induced transformation. The aim of these experiments was to determine whether CDL-WE and CDL-95EE, which are rich in bioactive flavonoids, can reduce oxidative stress and prevent early tumorigenic events. The cytotoxic and cancer chemopreventive potentials of CDL-WE and CDL-95EE in normal mouse skin JB6 P+ cells were evaluated, and the results are shown in Figure 3. Figure 3A and 3B indicate that both CDL-WE and CDL-95EE exhibit a significant dose-dependent decrease in cell viability, respectively. Low cytotoxicity was indicated by IC50 values greater than 80 µg/mL, indicating that these extracts are suitable for further experimentation without causing cell damage. To further assess the cancer chemopreventive potential of CDL extracts, we examined the growth of TPA-induced anchorage independent cells (Figure 3C and 3D). The control group observed a minimal amount of colony formation, but a significant increase in colony formation was observed after treatment with TPA (20 ng/mL), which confirmed a successful transformation. CDL-WE (10-40 µg/mL) and CDL-95EE (5-40 µg/mL) had a significant decrease in colony formation (p < 0.05) due to their dose-dependent inhibitory effect on TPA-induced transformation. CDL-95EE, unlike CDL-WE, showed stronger inhibition that could inhibit 50% of TPA-induced JB6 P+ cells induced by TPA, making it a promising candidate for studying its protective mechanisms.
The correlation between CDL-95EE chemopreventive properties and antioxidant potential was verified by analyzing intracellular ROS levels using flow cytometry and DCFH-DA staining after TPA treatment (Figure 4). TPA caused a significant increase in mean fluorescence intensity (MFI) to 155.36, which is a sign of elevated oxidative stress in JB6 P+ cells. The dose of CDL-95EE (5-20 µg/mL) led to a decrease in MFI, the lowest value observed at 20 µg/mL, which indicates its powerful antioxidant properties. We found that CDL-95EE contained high levels of PMF, particularly nobiletin and tangeretin, which have been widely recognized for their anti-inflammatory, antioxidant and anticancer properties [33,34]. Some PMFs have also been shown to activate the Nrf2 pathway, which is a crucial regulator of antioxidant defense mechanisms [38,39]. These results indicate that CDL-95EE is a highly effective natural chemopreventive agent that can decrease oxidative stress and block TPA-induced transformation in JB6 P+ cells.

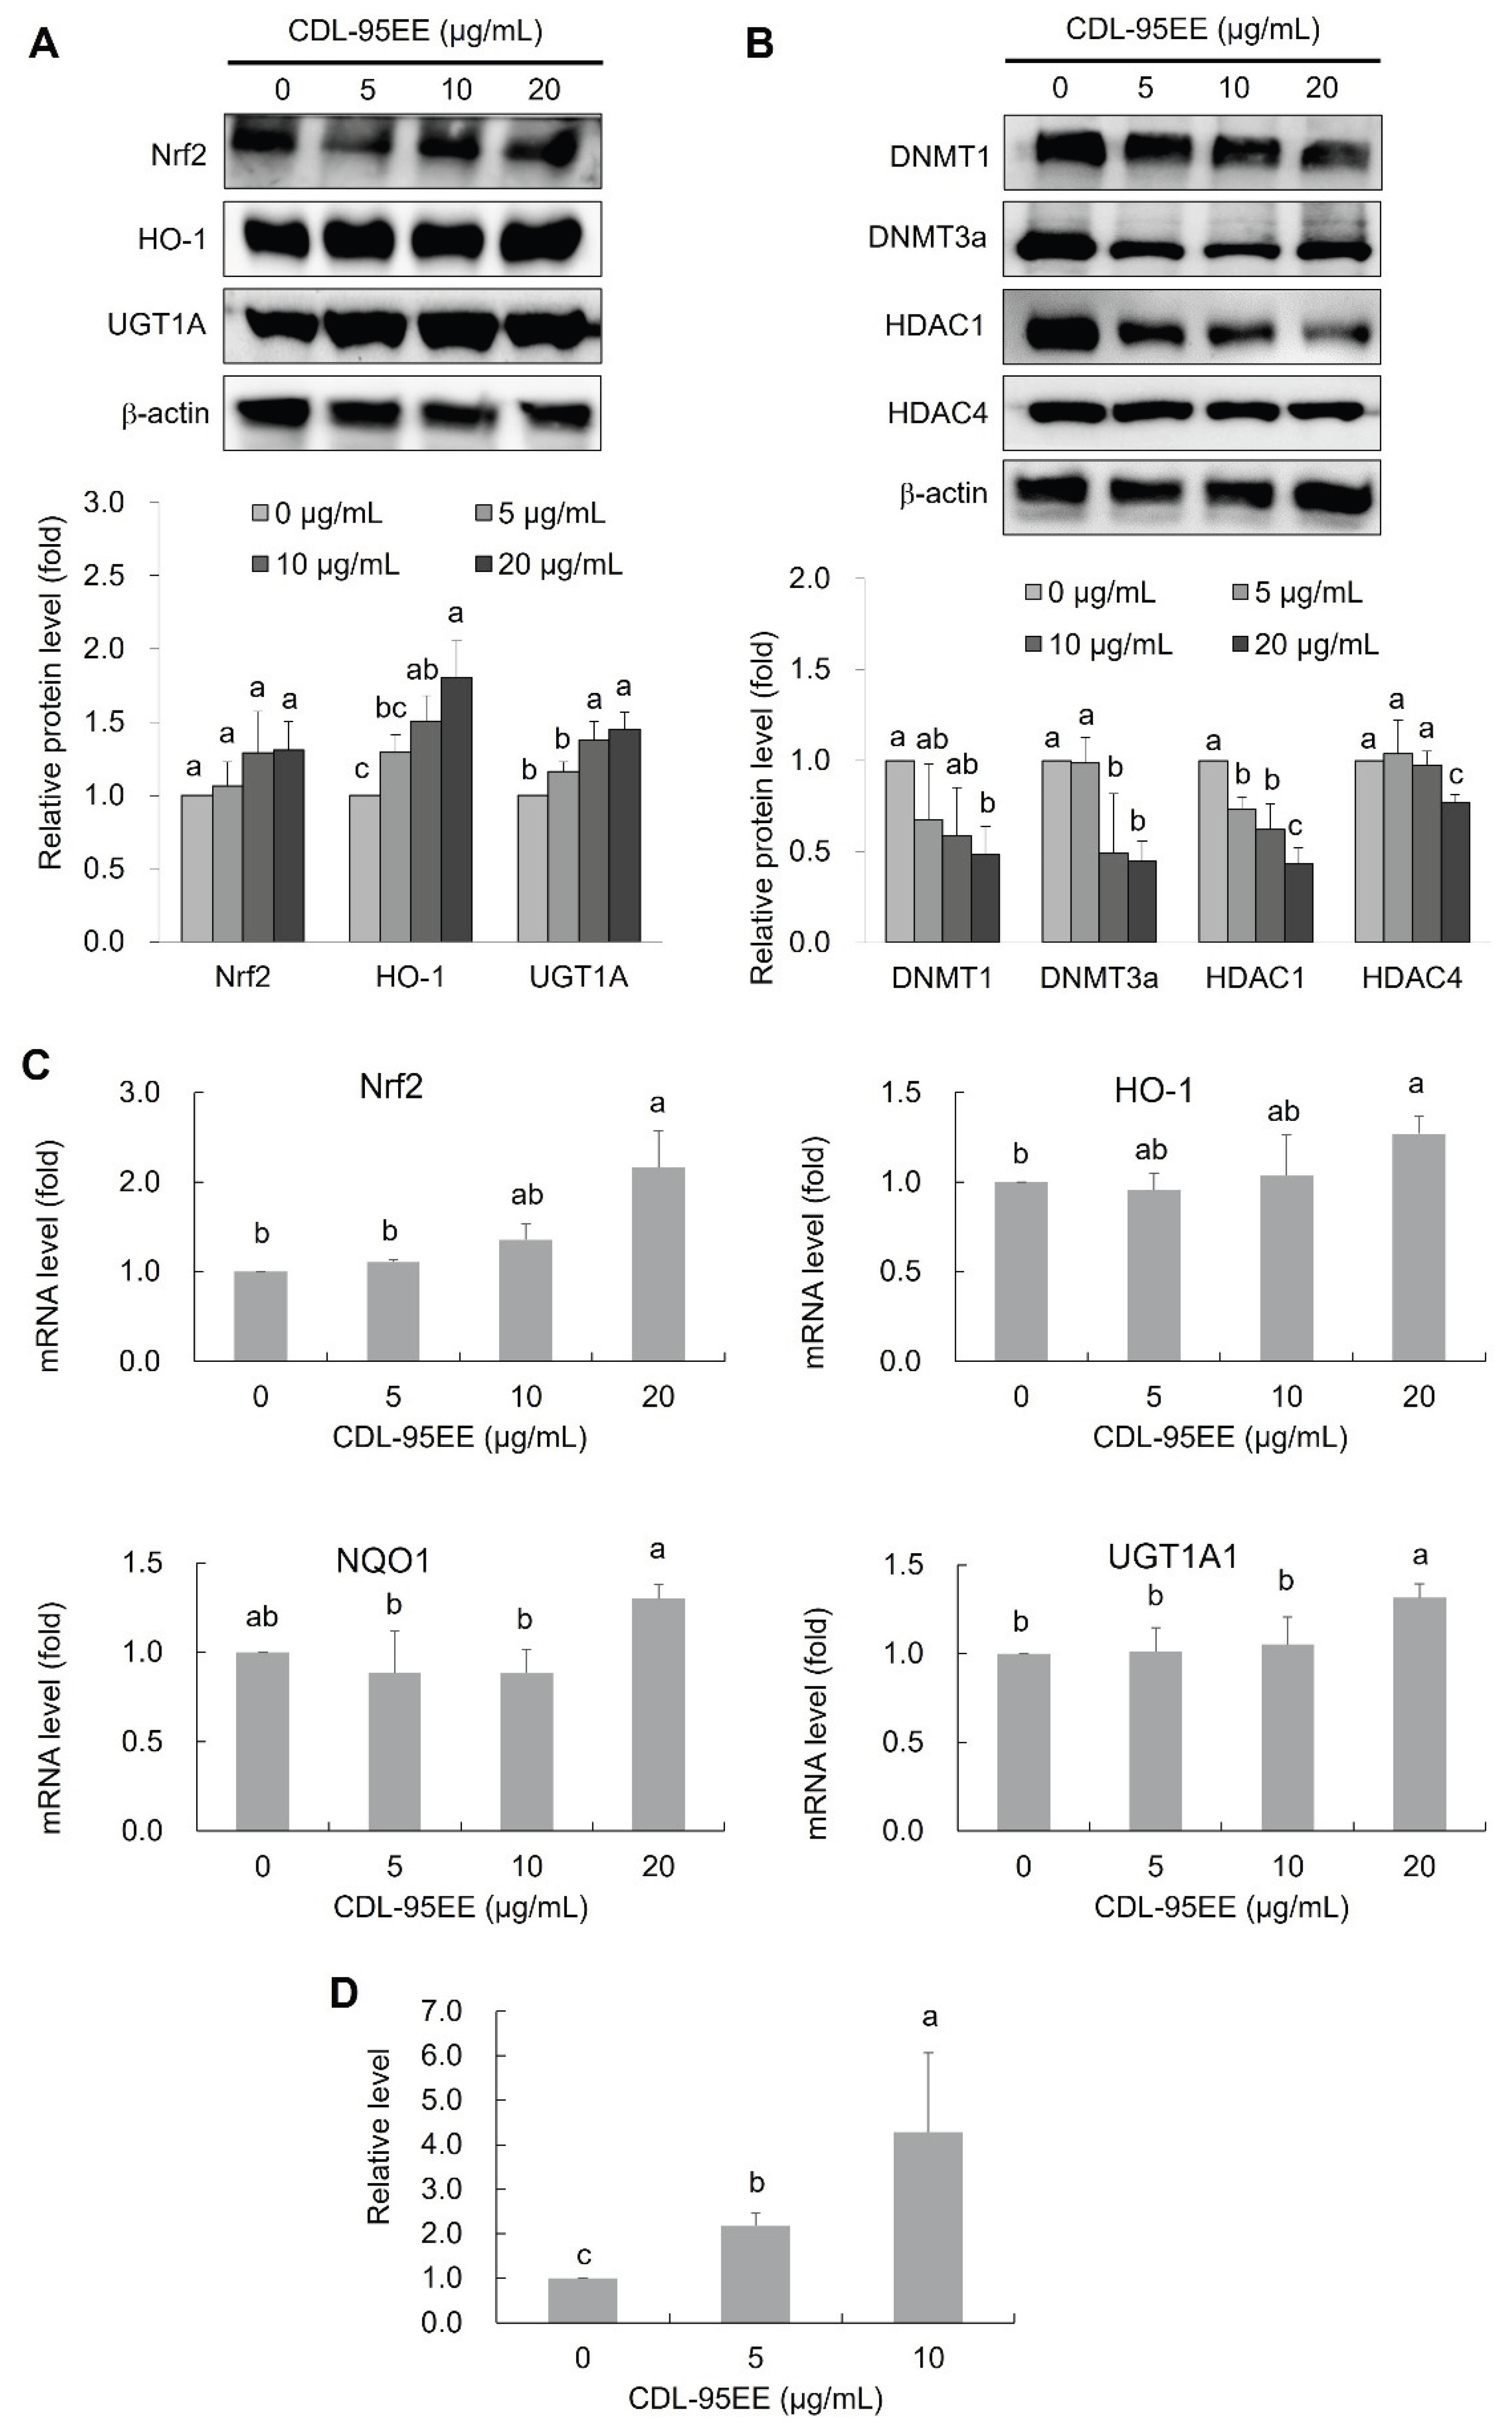
3.3. CDL-95EE Activates the Nrf2 Pathway through Transcriptional and Epigenetic Regulation

Our study demonstrated that CDL-95EE has antioxidant and anti-transformative properties, so we examined the regulatory pathways of Nrf2 signaling, a pathway that is frequently suppressed in cancer. The importance of Nrf2 has been shown to prevent oxidative stress [4], and our study explored whether CDL-95EE increases Nrf2 expression and its downstream antioxidant enzymes through transcriptional activation and epigenetic regulation (Figure 5). The expression of Nrf2 and its downstream antioxidant enzymes, including HO-1 and UGT1A1, was examined by Western blotting after treatment with CDL-95EE at various concentrations. As shown in Figure 5A, CDL-95EE significantly increased Nrf2 protein levels in a dose-dependent manner, indicating that CDL-95EE may function as an activator of Nrf2. Treatment with CDL-95EE activated the Nrf2 pathway, as indicated by increased expression of HO-1 and UGT1A1, two key enzymes involved in detoxification and cellular protection against oxidative stress.
To further explore how CDL-95EE activates Nrf2, we investigated the expression levels of DNA methyltransferases (DNMTs) and histone deacetylases (HDACs), which are key regulators of gene silencing (Figure 5B). Treatment with CDL-95EE resulted in a dose-dependent decrease in the levels of the DNMT1 and DNMT3a proteins. DNMT1 is recognized for maintaining DNA methylation patterns, while DNMT3a is responsible for de novo methylation [8]. Their suppression indicates that CDL-95EE could be able to prevent the hypermethylation of the Nrf2 promoter, a common process for Nrf2 silencing in cancer cells [40]. However, HDACs are capable of removing acetyl groups from histone proteins, which results in condensation of chromatin and transcriptional repression. HDAC1 and HDAC4 decreased significantly in a dose-dependent manner, indicating that CDL-95EE increases chromatin accessibility, which could lead to an increase in the Nrf2-mediated pathway.
To verify whether the increase in protein levels was controlled by transcription, qPCR was performed to analyze Nrf2 expression and its downstream enzyme mRNA after treatment with CDL-95EE (Figure 5C). The results demonstrate a significant increase in Nrf2, HO-1, and UGT1A1 mRNA expressions in cells treated with 20 µg/mL of CDL-95EE, which is consistent with the results of Western blot. To verify that CDL-95EE-mediated Nrf2 activation is a result of epigenetic regulation, we performed quantitative methylation-specific PCR (qMSP) to examine the methylation status of the Nrf2 promoter (Figure 5D). The results showed that the level of the unmethylated Nrf2 promoter increased according to the dose of CDL-95EE (0-10 µg/mL). The finding suggests that CDL-95EE enhances Nrf2 expression by decreasing promoter methylation, thus reversing gene silencing. The potential chemopreventive effects of CDL-95EE are highlighted because it can demethylate Nrf2 expression, which is often silenced by hypermethylation in cancer and diseases related to oxidative stress. Previous studies have also shown that PMFs, such as nobiletin and tangeretin, increase Nrf2 activation and regulate detoxification enzymes [38,39]. Some flavonoids have been shown to modify DNA methylation and gene expression, which can lead to long-term protection against oxidative stress [12]. Since Nrf2 silencing due to promoter hypermethylation is frequently observed in tumorigenesis, restoration of Nrf2 expression by CDL-95EE rich in PMFs and flavonoids may contribute to its cancer prevention properties.
Polymethoxyflavones (PMFs), including nobiletin and tangeretin, have been shown in previous studies, as we have found. These compounds enhance the Nrf2 signaling pathway by a variety of methods, including facilitating Nrf2 nuclear translocation, preventing Keap1-Nrf2 binding, and boosting ARE-driven gene transcription [41,42]. Furthermore, various citrus flavonoids such as hesperetin and naringenin have been shown to regulate epigenetic regulators like DNMTs and HDACs, which in turn facilitate Nrf2 reactivation in cancer cells [43,44]. These findings strengthen the belief that the chemopreventive benefits are at least partially due to its rich composition and the activation of the Nrf2 antioxidant pathway through transcriptional and epigenetic modulation. To confirm the causal role of Nrf2 in mediating the observed effects of CDL-95EE, further studies could use Nrf2-specific inhibitors (e.g., ML385) or siRNA-mediated knockdown.

4. Conclusions

The results of this study show that CDL extracts, particularly CDL-95EE, have powerful antioxidant and chemopreventive abilities. CDL-95EE, which contains nobiletin and tangeretin, is capable of effectively reducing oxidative stress, inhibiting the transformation of JB6 P+ cell transformation, and activating the Nrf2 pathway. Our findings revealed that CDL-95EE enhances Nrf2 expression by regulating epigenetic functions, such as down-regulation of DNMT1, DNMT3a, HDAC1, and HDAC4, and demethylation of the Nrf2 promoter, leading to an increase in the transcription of antioxidant enzymes HO-1 and UGT1A1. These findings indicate that CDL-95EE could be a potential natural agent for cancer prevention. However, since the current results are based solely on in vitro models, more in vivo or clinical investigations are required before evaluating their use in functional foods or nutraceuticals.

Acknowledgments

This research was funded by the National Science and Technology Council (Taipei, Taiwan) through the grant NSTC 112-2813-C-033-072-B and 112-2320-B-033-001. The valuable suggestions and support of Dr. Su’s lab members during this research are greatly appreciated.

Conflicts of Interest

The authors declare no conflict of interest.

References

  1. Chaudhary, P.; Janmeda, P.; Docea, A.O.; Yeskaliyeva, B.; Abdull Razis, A.F.; Modu, B.; Calina, D.; Sharifi-Rad, J. Oxidative stress, free radicals and antioxidants: potential crosstalk in the pathophysiology of human diseases. Front Chem 2023, 11, 1158198. [Google Scholar] [CrossRef] [PubMed]
  2. Jena, A.B.; Samal, R.R.; Bhol, N.K.; Duttaroy, A.K. Cellular Red-Ox system in health and disease: The latest update. Biomed Pharmacother 2023, 162, 114606. [Google Scholar] [CrossRef] [PubMed]
  3. Pizzino, G.; Irrera, N.; Cucinotta, M.; Pallio, G.; Mannino, F.; Arcoraci, V.; Squadrito, F.; Altavilla, D.; Bitto, A. Oxidative stress: harms and benefits for human health. Oxid Med Cell Longev 2017, 2017, 8416763. [Google Scholar] [CrossRef] [PubMed]
  4. He, F.; Ru, X.; Wen, T. NRF2, a transcription factor for stress response and beyond. Int J Mol Sci 2020, 21. [Google Scholar] [CrossRef]
  5. Ngo, V.; Duennwald, M.L. Nrf2 and oxidative stress: a general overview of mechanisms and implications in human disease. antioxidants (Basel) 2022, 11. [Google Scholar] [CrossRef]
  6. Hayes, J.D.; Dinkova-Kostova, A.T.; Tew, K.D. Oxidative stress in cancer. Cancer Cell 2020, 38, 167–197. [Google Scholar] [CrossRef]
  7. Al Aboud, N.M.; Tupper, C.; Jialal, I. Genetics, epigenetic mechanism. StatPearls 2025, 7. [Google Scholar]
  8. Davletgildeeva, A.T.; Kuznetsov, N.A. The role of DNMT methyltransferases and TET dioxygenases in the maintenance of the DNA methylation level. Biomolecules 2024, 14. [Google Scholar] [CrossRef]
  9. Duan, X.; Xing, Z.; Qiao, L.; Qin, S.; Zhao, X.; Gong, Y.; Li, X. The role of histone post-translational modifications in cancer and cancer immunity: functions, mechanisms and therapeutic implications. Front Immunol 2024, 15, 1495221. [Google Scholar] [CrossRef]
  10. Suraweera, A.; O'Byrne, K.J.; Richard, D.J. Epigenetic drugs in cancer therapy. Cancer Metastasis Rev 2025, 10 44, 37. [Google Scholar] [CrossRef]
  11. Akone, S.H.; Ntie-Kang, F.; Stuhldreier, F.; Ewonkem, M.B.; Noah, A.M.; Mouelle, S.E.M.; Muller, R. Natural products impacting DNA methyltransferases and histone deacetylases. Front Pharmacol 2020, 11, 992. [Google Scholar] [CrossRef] [PubMed]
  12. Bhattacharjee, S.; Dashwood, R.H. Epigenetic regulation of NRF2/KEAP1 by phytochemicals. Antioxidants (Basel) 2020, 9. [Google Scholar] [CrossRef] [PubMed]
  13. Loizzo, M.R.; Tundis, R.; Bonesi, M.; Menichini, F.; De Luca, D.; Colica, C.; Menichini, F. Evaluation of Citrus aurantifolia peel and leaves extracts for their chemical composition, antioxidant and anti-cholinesterase activities. J Sci Food Agric 2012, 92, 2960–2967. [Google Scholar] [CrossRef] [PubMed]
  14. Menichini, F.; Loizzo, M.R.; Bonesi, M.; Conforti, F.; De Luca, D.; Statti, G.A.; de Cindio, B.; Menichini, F.; Tundis, R. Phytochemical profile, antioxidant, anti-inflammatory and hypoglycemic potential of hydroalcoholic extracts from Citrus medica L. cv Diamante flowers, leaves and fruits at two maturity stages. Food and Chemical Toxicology 2011, 49, 1549–1555. [Google Scholar] [CrossRef]
  15. Ibrahim, F.A.; Usman, L.A.; Akolade, J.O.; Idowu, O.A.; Abdulazeez, A.T.; Amuzat, A.O. Antidiabetic potentials of Citrus aurantifolia leaf essential oil. Drug Res (Stuttg) 2019, 69, 201–206. [Google Scholar] [CrossRef]
  16. Tang, Q.; Zhang, R.; Zhou, J.; Zhao, K.; Lu, Y.; Zheng, Y.; Wu, C.; Chen, F.; Mu, D.; Ding, Z.; et al. The levels of bioactive ingredients in Citrus aurantium L. at different harvest periods and antioxidant effects on H2O2-induced RIN-m5F cells. J Sci Food Agric 2021, 16 101, 1479–1490. [Google Scholar] [CrossRef]
  17. Tayarani-Najaran, Z.; Tayarani-Najaran, N.; Eghbali, S. A review of auraptene as an anticancer agent. Front Pharmacol 2021, 12, 698352. [Google Scholar] [CrossRef]
  18. Palacio, T.L.N.; Siqueira, J.S.; de Paula, B.H.; Rego, R.M.P.; Vieira, T.A.; Baron, G.; Altomare, A.; Ferron, A.J.T.; Aldini, G.; Kano, H.T.; et al. Bergamot (Citrus bergamia) leaf extract improves metabolic, antioxidant and anti-inflammatory activity in skeletal muscles in a metabolic syndrome experimental model. Int J Food Sci Nutr 2022, 1–8. [Google Scholar] [CrossRef]
  19. Srimurugan, S.; Ravi, A.K.; Arumugam, V.A.; Muthukrishnan, S. Biosynthesis of silver nanoparticles using Citrus hystrix leaf extract and evaluation of its anticancer efficacy against HeLa cell line. Drug Dev Ind Pharm 2022, 48, 480–490. [Google Scholar] [CrossRef]
  20. Burnett, C.L.; Bergfeld, W.F.; Belsito, D.V.; Hill, R.A.; Klaassen, C.D.; Liebler, D.C.; Marks, J.G., Jr.; Shank, R.C.; Slaga, T.J.; Snyder, P.W.; et al. Safety assessment of citrus flower- and leaf-derived ingredients as used in cosmetics. Int J Toxicol 2021, 40, 53s–76s. [Google Scholar] [CrossRef]
  21. Luo, P.; Feng, X.; Liu, S.; Jiang, Y. Traditional uses, phytochemistry, pharmacology and toxicology of Ruta graveolens L.: a critical review and future perspectives. Drug Des Devel Ther 2024, 18, 6459–6485. [Google Scholar] [CrossRef]
  22. Chien, W.J.; Saputri, D.S.; Lin, H.Y. Valorization of Taiwan's Citrus depressa Hayata peels as a source of nobiletin and tangeretin using simple ultrasonic-assisted extraction. Curr Res Food Sci 2022, 5, 278–287. [Google Scholar] [CrossRef] [PubMed]
  23. Murakami, A.; Nakamura, Y.; Torikai, K.; Tanaka, T.; Koshiba, T.; Koshimizu, K.; Kuwahara, S.; Takahashi, Y.; Ogawa, K.; Yano, M.; et al. Inhibitory effect of citrus nobiletin on phorbol ester-induced skin inflammation, oxidative stress, and tumor promotion in mice. Cancer Res 2000, 60, 5059–5066. [Google Scholar] [PubMed]
  24. Singh, R.P.; Dhanalakshmi, S.; Tyagi, A.K.; Chan, D.C.; Agarwal, C.; Agarwal, R. Dietary feeding of silibinin inhibits advance human prostate carcinoma growth in athymic nude mice and increases plasma insulin-like growth factor-binding protein-3 levels. Cancer Res 2002, 62, 3063–3069. [Google Scholar] [PubMed]
  25. Yoshimizu, N.; Otani, Y.; Saikawa, Y.; Kubota, T.; Yoshida, M.; Furukawa, T.; Kumai, K.; Kameyama, K.; Fujii, M.; Yano, M.; et al. Anti-tumour effects of nobiletin, a citrus flavonoid, on gastric cancer include: antiproliferative effects, induction of apoptosis and cell cycle deregulation. Aliment Pharmacol Ther 2004, 20 Suppl 1, 95–101. [Google Scholar] [CrossRef]
  26. Lou, S.N.; Hsu, Y.S.; Ho, C.T. Flavonoid compositions and antioxidant activity of calamondin extracts prepared using different solvents. J Food Drug Anal 2014, 22, 290–295. [Google Scholar] [CrossRef]
  27. Morales, G.; Paredes, A. Antioxidant activities of Lampaya medicinalis extracts and their main chemical constituents. BMC Complement Altern Med 2014, 14, 259. [Google Scholar] [CrossRef]
  28. Khoddami, A.; Wilkes, M.A.; Roberts, T.H. Techniques for analysis of plant phenolic compounds. Molecules 2013, 18, 2328–2375. [Google Scholar] [CrossRef]
  29. Su, Z.-Y.; Lai, B.-A.; Lin, Z.-H.; Wei, G.-J.; Huang, S.-H.; Tung, Y.-C.; Wu, T.-Y.; Hun Lee, J.; Hsu, Y.-C. Water extract of lotus leaves has hepatoprotective activity by enhancing Nrf2- and epigenetics-mediated cellular antioxidant capacity in mouse hepatocytes. Journal of Functional Foods 2022, 99, 105331. [Google Scholar] [CrossRef]
  30. Tung, Y.C.; Sung, P.H.; Chen, P.C.; Wang, H.C.; Lee, J.H.; Su, Z.Y. Chemoprevention of lotus leaf ethanolic extract through epigenetic activation of the NRF2-mediated pathway in murine skin JB6 P+ cell neoplastic transformation. J Tradit Complement Med 2023, 13, 337–344. [Google Scholar] [CrossRef]
  31. Ma, Q.; Liao, H.; Xu, L.; Li, Q.; Zou, J.; Sun, R.; Xiao, D.; Liu, C.; Pu, W.; Cheng, J.; et al. Autophagy-dependent cell cycle arrest in esophageal cancer cells exposed to dihydroartemisinin. Chin Med 2020, 15, 37. [Google Scholar] [CrossRef] [PubMed]
  32. Alara, O.R.; Abdurahman, N.H.; Ukaegbu, C.I. Extraction of phenolic compounds: A review. Curr Res Food Sci 2021, 4, 200–214. [Google Scholar] [CrossRef] [PubMed]
  33. Morley, K.L.; Ferguson, P.J.; Koropatnick, J. Tangeretin and nobiletin induce G1 cell cycle arrest but not apoptosis in human breast and colon cancer cells. Cancer Lett 2007, 251, 168–178. [Google Scholar] [CrossRef] [PubMed]
  34. Chen, Q.; Gu, Y.; Tan, C.; Sundararajan, B.; Li, Z.; Wang, D.; Zhou, Z. Comparative effects of five polymethoxyflavones purified from Citrus tangerina on inflammation and cancer. Front Nutr 2022, 9, 963662. [Google Scholar] [CrossRef]
  35. Bai, J.; Tan, X.; Tang, S.; Liu, X.; Shao, L.; Wang, C.; Huang, L. Citrus p-synephrine improves energy homeostasis by regulating amino acid metabolism in HFD-induced mice. Nutrients 2024, 16. [Google Scholar] [CrossRef]
  36. Ganeshpurkar, A.; Saluja, A.K. The pharmacological potential of rutin. Saudi Pharm J 2017, 25, 149–164. [Google Scholar] [CrossRef]
  37. Naponelli, V.; Rocchetti, M.T.; Mangieri, D. Apigenin: Molecular Mechanisms and Therapeutic Potential against Cancer Spreading. Int J Mol Sci 2024, 25. [Google Scholar] [CrossRef]
  38. Lin, Z.H.; Chan, Y.F.; Pan, M.H.; Tung, Y.C.; Su, Z.Y. Aged citrus peel (Chenpi) prevents acetaminophen-induced hepatotoxicity by epigenetically regulating Nrf2 pathway. Am J Chin Med 2019, 47, 1833–1851. [Google Scholar] [CrossRef]
  39. Su, Z.Y.; Chien, J.C.; Tung, Y.C.; Wu, T.Y.; Liao, J.A.; Wei, G.J. Tangeretin and 4'-demethyltangeretin prevent damage to mouse hepatocytes from oxidative stress by activating the Nrf2-related antioxidant pathway via an epigenetic mechanism. Chem Biol Interact 2023, 382, 110650. [Google Scholar] [CrossRef]
  40. Khor, T.O.; Fuentes, F.; Shu, L.; Paredes-Gonzalez, X.; Yang, A.Y.; Liu, Y.; Smiraglia, D.J.; Yegnasubramanian, S.; Nelson, W.G.; Kong, A.N. Epigenetic DNA methylation of antioxidative stress regulator NRF2 in human prostate cancer. Cancer Prev Res (Phila) 2014, 7, 1186–1197. [Google Scholar] [CrossRef]
  41. He, Z.; Li, X.; Chen, H.; He, K.; Liu, Y.; Gong, J.; Gong, J. Nobiletin attenuates lipopolysaccharide/D-galactosamine-induced liver injury in mice by activating the Nrf2 antioxidant pathway and subsequently inhibiting NF-kappaB-mediated cytokine production. Mol Med Rep 2016, 14, 5595–5600. [Google Scholar] [CrossRef]
  42. Lv, C.; Li, Y.; Liang, R.; Huang, W.; Xiao, Y.; Ma, X.; Wang, Y.; Zou, H.; Qin, F.; Sun, C.; et al. Characterization of tangeretin as an activator of nuclear factor erythroid 2-related factor 2/antioxidant response element pathway in HEK293T cells. Curr Res Food Sci 2023, 6, 100459. [Google Scholar] [CrossRef]
  43. Wang, S.W.; Sheng, H.; Bai, Y.F.; Weng, Y.Y.; Fan, X.Y.; Zheng, F.; Fu, J.Q.; Zhang, F. Inhibition of histone acetyltransferase by naringenin and hesperetin suppresses Txnip expression and protects pancreatic beta cells in diabetic mice. Phytomedicine 2021, 88, 153454. [Google Scholar] [CrossRef]
  44. Casari, G.; Romaldi, B.; Scire, A.; Minnelli, C.; Marzioni, D.; Ferretti, G.; Armeni, T. Epigenetic properties of compounds contained in functional foods against cancer. Biomolecules 2024, 15. [Google Scholar] [CrossRef]
Figure 1. HPLC chromatograms of flavonoid compounds in different solvent extracts of CDL. (A) Chromatogram of standard compounds. (B) Chromatograms of CDL extracts obtained using different solvents: CDL-WE, CDL-95EE, CDL-70EE, CDL-ME, and CDL-EAE. Notable peaks include (1) synephrine at 4.03 min, (2) naringin at 13.52 min, (3) hesperidin at 14.04 min, (4) neohesperidin at 14.83 min, (5) naringenin at 22.81 min, (6) 7-hydroxy-3',4',5,6,8-pentamethoxyflavone at 23.90 min, (7) 4'-hydroxy-5,6,7,8-tetramethoxyflavone at 26.09 min, (8) 3',4',5,7-tetramethoxyflavone at 29.06 min, (9) sinensetin at 29.50 min, (10) 3',4'-dimethoxyflavone at 30.91 min, (11) 3',4',5',5,6,7-hexamethoxyflavone at 32.15 min, (12) 4',5-dihydroxy-6,7,8-trimethoxyflavone at 32.66 min, (13) nobiletin at 33.34 min, (14) tangeretin at 39.95 min, (15) 5-hydroxy-3',4',6,7,8-pentamethoxyflavone at 47.78 min, and (16) 5-hydroxy-4',6,7,8-tetramethoxyflavone at 54.75 min.
Preprints 196060 g001
Figure 2. HPLC chromatograms of phenolic compounds in different solvent extracts of CDL. (A) Chromatogram of standard compounds. (B) Chromatograms of CDL extracts obtained using different solvents: CDL-WE, CDL-95EE, CDL-70EE, CDL-ME, and CDL-EAE. Notable peaks include (1) gallic acid at 7.60 min, (2) catechin at 19.68 min, (3) caffeic acid at 21.61 min, (4) myricitrin at 35.72 min, (5) rutin at 39.72 min, (6) myricetin at 44.91 min, (7) quercetin at 57.21 min, (8) luteolin at 60.09 min, and (9) apigenin at 63.817 min.
Preprints 196060 g002
Figure 3. Effects of CDL-WE and CDL-95EE on JB6 P+ cell viability and TPA-induced cell transformation. (A & B) JB6 P+ cells were treated with different concentrations of CDL-WE and CDL-95EE, respectively, and cell viability was evaluated using the MTS assay. (C & D) JB6 P+ cells were treated with TPA to induce transformation with different concentrations of CDL-WE and CDL-95EE, respectively. Data are expressed as mean ± SD (n = 3). Data with different letters (a, b, c, d) indicate a statistically significant difference between the groups (p < 0.05).
Preprints 196060 g003
Figure 4. Effect of CDL-95EE on TPA-induced ROS generation in JB6 P+ cells. (A) Flow cytometry histograms showing ROS levels in JB6 P+ cells under different treatments. The mean fluorescence intensity (MFI) was measured to assess intracellular ROS levels.(B) Quantitative analysis of ROS levels in JB6 P+ cells treated with TPA and different concentrations of CDL-95EE. Data are expressed as mean ± SD (n = 3). Data with different letters (a, b, c, d) indicate a statistically significant difference between the groups (p < 0.05).
Preprints 196060 g004
Figure 5. Effect of CDL-95EE on Nrf2 pathway activation and epigenetic modifications in JB6 P+ cells. (A, B) Western blot analysis of Nrf2 pathway-related antioxidant and detoxification enzymes (HO-1, UGT1A1, NQO1) and epigenetic regulators (DNMTs, HDACs) following CDL-95EE treatment, respectively. (C) Quantitative analysis of mRNA expression levels of HO-1, UGT1A1, and NQO1 normalized to β-actin. (D) Quantitative methylation-specific PCR (qMSP) analysis of Nrf2 promoter unmethylation levels after treatment with CDL-95EE. Data are expressed as mean ± SD (n = 3). Data with different letters (a, b, c, d) indicate a statistically significant difference between the groups (p < 0.05).
Preprints 196060 g005
Table 1. Extraction yield, total phenolic content, and total flavonoid content of different Citrus depressa Hayata leaf extracts 1.
Preprints 196060 i001
1 Data are expressed as mean ± SD (n = 3). Data with different superscript letters (a, b, c, d) indicate a statistically significant difference between the groups (p < 0.05). 2 Extraction yield (%) = [Weight of freeze-dried extract (g)/Weight of dried powder (g)] × 100%; 3 GAE: gallic acid equivalent; 4 QE: quercetin equivalent.
Table 2. Major flavonoid compounds identified in different CDL extracts 1.
Preprints 196060 i002
1 Data are expressed as mean ± SD (n = 3). Data with different superscript letters (a, b, c, d) indicate a statistically significant difference between the groups (p < 0.05).
Table 3. Major phenolic compounds identified in different CDL extracts 1.
Preprints 196060 i003
1 Data are expressed as mean ± SD (n = 3). Data with different superscript letters (a, b, c, d) indicate a statistically significant difference between the groups (p < 0.05).
Disclaimer/Publisher’s Note: The statements, opinions and data contained in all publications are solely those of the individual author(s) and contributor(s) and not of MDPI and/or the editor(s). MDPI and/or the editor(s) disclaim responsibility for any injury to people or property resulting from any ideas, methods, instructions or products referred to in the content.
Copyright: This open access article is published under a Creative Commons CC BY 4.0 license, which permit the free download, distribution, and reuse, provided that the author and preprint are cited in any reuse.
Prerpints.org logo

Preprints.org is a free preprint server supported by MDPI in Basel, Switzerland.

Subscribe

Disclaimer

Terms of Use

Privacy Policy

Privacy Settings

© 2026 MDPI (Basel, Switzerland) unless otherwise stated