Submitted:
24 January 2026
Posted:
26 January 2026
You are already at the latest version
Abstract
Semantic point cloud maps play a pivotal role in smart agriculture. They not only provide core three-dimensional data for orchard management but also empower robots with environmental understanding, enabling safer and more efficient navigation planning. However, traditional point cloud maps primarily model surrounding obstacles from a geometric perspective, failing to capture distinctions and characteristics between individual obstacles. In contrast, semantic maps encompass semantic information and even topological relationships among objects in the environment. Furthermore, existing semantic map construction methods are predominantly vision-based, making them ill-suited to handle rapid lighting changes in agricultural settings that can cause positioning failures. Therefore, this paper proposes a positioning and semantic map reconstruction method tailored for orchards. It integrates visual, radar, and inertial sensors to obtain high-precision pose and point cloud maps. By combining open-vocabulary detection and semantic segmentation models, it projects two-dimensional detected semantic information onto the three-dimensional point cloud, ultimately generating a point cloud map enriched with semantic information. The resulting 2D occupancy grid map is utilized for robotic motion planning. Experimental results demonstrate that on a custom dataset, the proposed method achieves 74.33% mIoU for semantic segmentation accuracy, 12.4% relative error for fruit recall rate, and 0.038803m mean translation error for localization. The deployed semantic segmentation network Fast-SAM achieves a processing speed of 13.36 ms per frame. These results demonstrate that the proposed method combines high accuracy with real-time performance in semantic map reconstruction. This exploratory work provides theoretical and technical references for future research on more precise localization and more complete semantic mapping, offering broad application prospects and providing key technological support for intelligent agriculture.
Keywords:
LiDAR-Inertial-Visual SLAM
; semantic segmentation
; semantic map
1. Introduction
The construction of environmental maps is crucial for the navigation tasks of orchard robots. It not only serves as a prerequisite for achieving autonomous robot movement but also forms the foundation for subsequent precision variable operations such as inspection tasks, targeted spraying, selective harvesting, and digital orchard management.In many precision agricultural operations—such as monitoring orchard trees [1], pesticide spraying and yield estimation [2,3,4], or weeding between rice and foxtail plants in paddy fields [5,6] and intelligent robot path planning and navigation—additional processing of fruits and the perceived environment is often required. In such scenarios, reconstructing and segmenting agricultural environments using semantic maps [7,8,9]assists agricultural robots in executing complex tasks while advancing the intelligence and automation of agricultural production. However, traditional point cloud maps can only model the environment from a geometric perspective and fail to classify various point cloud obstacles. In contrast, semantic maps not only contain geometric information about the environment, but more importantly, also incorporate semantic information, such as the categories of obstacles, the positional relationships among obstacles, and their affiliations. By constructing semantic maps, orchard robots are endowed with the ability to understand their environment during navigation, enabling more intelligent and efficient decision-making. For instance, when combined with LLMs, semantic maps can facilitate language-guided autonomous navigation and efficient path planning.
In recent years, the advancement of Simultaneous Localization and Mapping (SLAM) technology has promoted the wide application of lidar and depth cameras in orchard mapping and positioning. However, the construction methods of three-dimensional semantic maps in existing research mostly focus on visual sensors, such as binocular cameras and RGB-D cameras[10,11]. Papadimitrion et al.[12] proposed a Graph-SLAM system that utilizes convolutional neural networks for grapevine segmentation while extracting visual features to enhance segmentation robustness. However, such sensors are severely affected by light, and cannot function properly in clear conditions such as dark areas and lack of texture. Moreover, they have a heavy computing load, and the maps they construct are difficult to be directly used for path planning and navigation. The dynamic performance of the sensor is limited. When constructing the map, there will be cumulative errors that require back-end optimization. Therefore, in large-scale outdoor orchards with variable lighting and complex structures, the robustness and reliability of environmental modeling methods that solely rely on vision are often difficult to guarantee. In recent years, thanks to the development of technology, the cost of lidar has decreased, and its application in orchard modeling has become increasingly mature. Compared with visual methods, modeling based on radar point clouds has higher accuracy, stronger robustness, and better adaptability to orchard environments[13,14]. Dong et al. [15] addressed the issue of incomplete reconstruction on one side in traditional orchard mapping by proposing a semantic mapping method that integrates reconstruction results from both sides of tree rows. This approach utilizes a pre-trained MobileNetV2 network to extract high-level semantic features and project them onto a 3D point cloud, providing effective map references for orchard mobile robots. Peng et al. [16] addressed the challenges of dense tree coverage and severe occlusion in orchard scenarios by proposing an integrated solution for UAV image-based 3D reconstruction and semantic segmentation using Neural Radiance Fields (NeRF). This approach deeply integrates semantic segmentation with NeRF reconstruction, achieving high-precision individual tree segmentation and semantic information completion for occluded areas. However, positioning drift and semantic inconsistencies still occur when handling large scenes and long tree rows. Peng et al. [9] focused on semantic mapping requirements in unstructured orchard environments. By combining an improved MobileNetV2 architecture with a fully connected CRF framework, they constructed a semantic map generation scheme. Pan et al. [17] proposed a solution for sensor perception and structured semantic mapping in unstructured orchards. By integrating a 3D-ODN detection network with an improved CSF algorithm, they constructed a 3D semantic map, ensuring efficient path planning and orchard operations for robotic systems. Fu et al. [18] proposed the DSC-DeepLabv3+ model for high-speed semantic segmentation of maize crops and weeds in cornfields by optimizing DeepLabv3+ and implementing lightweight modifications. The model achieved a weed segmentation IOU of 87.5%. Sodano et al. [19] developed a three-dimensional semantic mapping algorithm for hierarchical panoramic segmentation of orchards. By integrating multi-sensor data to acquire 3D orchard data, the 3D-HPS algorithm directly outputs hierarchical semantic information and instance IDs. Jose et al. [20] proposed an active semantic mapping framework based on a lightweight semantic segmentation network combining MobileNetV3+U-Net. This framework employs multimodal fusion and NBV planning algorithms.
To solve the above-mentioned problems, this paper subsequently focuses on the fusion technology of lidar and cameras. By combining the SLAM framework with neural networks, it aims to achieve robust three-dimensional semantic map construction. This map not only supports the navigation and positioning of robots, but also provides a foundation for high-level scene understanding and interaction tasks such as path planning and target search, thereby comprehensively enhancing the overall efficiency and intelligence level of autonomous mobile systems in orchard environments. Specifically, multi-sensor fusion technology is used to fuse lidar point clouds, camera color images, and inertial measurement units (IMU) through error state iterative Kalman filtering(ESIKF) to output precise poses and color point clouds. Unlike the direct use of segmentation neural networks, considering that some unexpected objects may appear in the orchard environment, the model cannot be segmented without prior training. Instead, we first use open vocabulary to detect all objects, and then input the detected regions into the segmentation model for further fine segmentation. At the same time, to solve the problem of the same object being detected as different categories, we adopt the Bayesian fusion method to improve robustness. It can effectively improve the consistency of point cloud labels with similar spatial structures and make them have the same color features in the scene.The main contributions of this article are as follows:
- Integrate data from LIDAR, cameras and IMU for real-time positioning and construction of 3d semantic maps to solve the efficiency and accuracy problems when only vision is used.
- The extraction of semantic information is divided into two stages to meet the complex and changeable environmental characteristics of the orchard.
- Use the Bayesian fusion method to further improve the accuracy of constructing semantic maps.
2. Materials and Methods
2.1. Data Collection and Processing
The dataset is composed of two parts. One part consists of 898 publicly available images from RobFlow, and the other part comprises 1,200 images collected from a dragon fruit orchard in Conghua District, Guangzhou City. Color images were captured in an orchard using an Intel RealSense D435i camera and a Hikvision MV-CS050-10UC global shutter camera, mounted on a self-built drone. Lidar point clouds were captured using a Livox MID360 scanner, while depth maps were acquired via the Intel RealSense D435i camera. Due to excessive noise from the RealSense D435i’s built-in IMU, which negatively impacted state estimation, IMU data was sourced from the radar’s integrated IMU and the PX4 6C Mini flight controller’s built-in IMU. The final radar point cloud, IMU data, and data from the Hikvision MV-CS050-10UC camera serve as inputs for the Livo system. For comparison with the Intel RealSense D435i camera’s depth map, the color image and the built-in IMU data from the PX4 6C Mini are used as inputs for the VIO system. Data acquisition was performed using the Ubuntu operating system, with ROS message bags recorded for storage. To simplify semantic annotation complexity, objects in the images are categorized into only three common classes: fruit, branches and leaves, and background. Remaining objects receive no specific annotation. As shown in Figure 1, during annotation, objects too distant from the camera are treated as background.
2.2. Methods
Figure 2 presents the system flowchart for a large-scale outdoor semantic map reconstruction system based on visual-LiDAR fusion. System inputs include RGB images, LiDAR point clouds, and IMU data. Upon receiving input data, the FAST-LIVO2 framework first fuses multi-source sensor information through an iterative error state Kalman filter to achieve real-time localization, outputting dense color point cloud maps and camera pose sequences. Simultaneously, the RGB image sequence feeds into the YOLO-world[21] object detection network to generate 2D bounding boxes. These detection results serve as input prompts for the FAST-SAM[22] segmentation model, which produces pixel-level instance masks. During the semantic fusion stage, the system projects the point cloud onto images from various viewpoints using refined camera parameters. Valid points are filtered through 3D bounding box constraints and depth consistency checks, while multi-view semantic evidence is accumulated using a Bayesian log-likelihood framework. Finally, the semantic annotation results undergo multi-scale spatial consistency refinement and boundary smoothing processing to generate a dense semantic point cloud map.
2.2.1. Open Vocabulary Detection and Semantic Segmentation Algorithm
The construction of semantic maps relies on accurate identification and segmentation of object categories within the environment. Compared to traditional rule-based or manually annotated methods, deep neural networks can automatically learn hierarchical feature representations, demonstrating superior generalization capabilities and robustness in complex scenarios. In recent years, deep learning-based semantic segmentation methods for 3D point clouds have made significant progress. PointNet[23] pioneered a deep network architecture directly processing unordered point clouds, while PointNet++[24] further introduced hierarchical feature learning mechanisms. For large-scale outdoor scenes, RandLA-Net[25] employs random sampling and local feature aggregation strategies, whereas Cylinder3D[26] leverages cylindrical partition representations to enhance LiDAR point cloud segmentation accuracy. However, these methods suffer from the following limitations: Training data dependency: Requires large-scale point-labeled 3D datasets with high annotation costs and fixed categories. Lack of texture information: Pure geometric features struggle to distinguish visually similar yet semantically distinct objects. Limited generalization: Models exhibit significant performance degradation in cross-domain scenarios. Weak open-word capability: Inability to recognize new categories not covered in training sets. In contrast, 2D vision models benefit from pre-training on large-scale datasets like ImageNet[27] and COCO[28], demonstrating greater maturity in object detection and segmentation tasks. Therefore, this paper employs image-based neural networks to extract pixel-level semantic information from RGB images. Through multi-view fusion, this information is projected onto a 3D point cloud map, enabling the construction of semantic maps without requiring 3D annotation data.
We employ a two-stage semantic extraction strategy as shown in Figure 3: first, YOLO-world is used for object detection to obtain 2D bounding boxes and confidence scores. Subsequently, these detected boxes are fed as input to FAST-SAM to generate precise instance masks. Compared to directly employing end-to-end semantic segmentation networks, this approach offers several advantages: First, each detection box corresponds to an independent instance, facilitating the construction of instance-level semantic maps. Simultaneously, the 3D bounding boxes constructed with depth information effectively suppress background noise. Furthermore, the detection confidence supports multi-view Bayesian probability fusion, significantly enhancing the robustness of object category classification.
2.2.2. Lidar-Based Positioning and Point Cloud Map Construction
In recent years, Simultaneous Localization and Mapping (SLAM) technology has made remarkable progress. Due to its ability to estimate pose and reconstruct maps in real time, SLAM has become an indispensable tool for various robotic navigation tasks. Dense 3D maps provide critical environmental information, while color maps also carry substantial semantic information. Traditional visual SLAM lacks depth perception and is sensitive to lighting conditions, whereas lidar SLAM lacks color information and tends to fail in geometrically degenerate scenes. This paper employs Fast Livo2[29] for simultaneous localization and mapping. This method efficiently fuses IMU, lidar, and image measurement data through an Error State Iterative Kalman Filter (ESIKF). By utilizing a sequential update strategy within the Kalman filter to address the dimensional mismatch between lidar and image measurements, it achieves reliable localization and precise mapping.
In the LIVO system, it is assumed that the time offsets between the three sensors (lidar, inertial measurement unit, and camera) are known. These offsets can be determined through prior calibration or synchronization. This paper employs a calibration method using a target plate (featuring four circular holes and four ArUco markers) to calibrate external parameters. Time calibration will not be performed, as external synchronization will be utilized to achieve precise alignment.The calibration process for external parameters is shown in the Figure 4.
First, identify the four ArUco markers on the calibration plate. Calculate the 3D pose of each marker relative to the camera coordinate system based on the known marker dimensions and camera intrinsic parameters. Take the average of the four marker poses as the calibration plate’s pose, thereby deriving the 3D coordinates of the four circular hole centers in the camera coordinate system, denoted as the point set . Next, use pass-through filtering to roughly extract the point cloud region containing the calibration plate. Fit a plane using RANSAC to extract the point cloud of the calibration plate’s plane. Rotate and align the plane point cloud to the z=0 plane, converting it into a 2D point cloud. If a point’s neighborhood contains angular gaps exceeding 25°, it is classified as an edge point. Cluster the edge points and fit an ellipse to each cluster as shown in the following formula:
where the parameters (A, B, C, D, E, F) are obtained through fitting. Subsequently, the ellipse center is calculated as shown in Eq. 2 and transformed back to the original LiDAR coordinate system, yielding the point set .
Ultimately, by leveraging the known correspondence between the (camera coordinate system) and (LiDAR coordinate system) where the centers of the four circular apertures correspond one-to-one, the optimal rigid transformation is solved to minimize the distance error between corresponding points:
After obtaining reliable external references, the asynchronous laser point cloud and camera images are first temporally aligned, followed by state prediction using the IMU. During the update phase, geometric constraints are first established using the laser point cloud and map plane to optimize the state and update the map structure. Subsequently, visual optimization is performed by minimizing photometric error with the current image, utilizing visual map points extracted from the map that are associated with reference image blocks. The raw data is processed using a direct approach, eliminating the need for feature extraction methods like ORB. Mechanisms such as plane priors, real-time exposure estimation, and on-demand ray projection are incorporated to enhance accuracy and robustness. Due to space constraints, this paper does not provide detailed derivations of FAST-LIVO2’s core algorithms (such as ESIKF state estimation and VoxelMap incremental mapping). Readers are strongly encouraged to consult the references[30,31] for further details. This section focuses on FAST-LIVO2’s functional role within the system and its output data format. The final outputs—high-precision state estimates and textured dense point cloud maps—are illustrated as shown in Figure 5,Figure 6.
2.2.3. 3d Semantic Maps Construction and Postprocessing
Typically, cameras and lidar are configured to the same acquisition frequency, while the inertial measurement unit (IMU) operates at a higher frequency. By utilizing ROS’s time synchronization mechanism, multiple topic data streams can be received. The system generates a callback function for the synchronized results, allowing us to process the synchronized data within this callback function. However, ROS’s message filters synchronization mechanism relies on software-layer message matching. Affected by network latency, its synchronization accuracy is only millisecond-level, and timestamps across sensors suffer from drift issues. In highly dynamic scenarios, millisecond-level timing errors can lead to significant inaccuracies. To address this, the system employs external hardware clock synchronization. As shown in Figure 7, a unified clock source triggers simultaneous data acquisition from multiple sensors, followed by strict timestamp alignment achieved through Linux’s shared memory mechanism.
Before fusion, ground point clouds must be removed. This paper employs the CSF algorithm to achieve this. The fusion process involves taking the dense point cloud map output by the SLAM system, where represents the 3D coordinates of the i-th point, along with the corresponding RGB image sequence and camera pose . The objective is to assign a semantic category label to each point .For each image frame, detection results are first extracted using the YOLO-World object detection network:
where denotes the category label, represents the bounding box coordinates, and indicates the detection confidence score. Subsequently, the detection box is input as a prompt into the FastSAM segmentation model to generate a pixel-level binary mask .
For a point in the world coordinate system, transform it to the camera coordinate system using the camera’s external parameter matrix :
where is the homogeneous coordinate. Let be projected onto the pixel plane via the pinhole camera model:
where represents the focal length and denotes the principal point coordinates. Only points satisfying and lying within the image range are retained.
To avoid mislabeling background points as foreground targets, bounding box constraints are constructed in 3D space based on 2D detection boxes. First, the depth of the detection box center is estimated (by taking the median of the projection point depths in the box’s central region). Then, the 3D bounding box dimensions are computed via backprojection:
where represents the pixel dimensions of the detection box. The center coordinates of the 3D bounding box are:
Then only retain points that satisfy the following constraints:
For points passing the above screening, a Bayesian framework is employed to fuse multi-view semantic observations. A log-likelihood vector for each category is maintained for each point, initialized as a zero vector. When a point is observed by a detection box of category with confidence in frame k, the log-likelihood for the corresponding category is updated:
where is the truncated confidence level to avoid numerical instability. This update rule originates from the log-likelihood form of Bayesian posterior probability. Let denote the prior probability that point p belongs to class c. Then, after n independent observations, the posterior probability is:
After taking the logarithm, it is converted into an accumulative form to facilitate multi-perspective fusion.After completing the fusion of all perspectives, the final category for each point is determined by taking the maximum log-likelihood.
Due to potential inconsistencies in 2D segmentation results across different viewpoints, 3D spatial consistency constraints are introduced for refinement. A vertical columnar grid structure is employed, with the grid partitioned in the plane at resolution r and spanning the Z direction. For each grid cell , the number of points belonging to each category is counted. If the dominant category exceeds a threshold:
All points within the grid are uniformly labeled with the dominant category. A multi-scale strategy is employed, sequentially refining the resolution at meters to progressively optimize from coarse to fine scales. To further optimize noise annotation at category boundaries, a K-nearest neighbor-based boundary smoothing strategy is employed. First, boundary points are identified, followed by local majority voting on these boundary points:
Update only when the dominant category exceeds 60% to avoid excessive smoothing.
The semantic graph optimization results are shown in the Figure 8. The figure shows the optimized effect. The red point cloud represents the optimized fruit point cloud, while the blue point cloud represents the redundant point cloud that was wrongly segmented before. The picture explains that the reason for the segmentation error is due to the incorrectness of a certain frame mask. Some scattered points might be caused by the insufficient point cloud density within the previous mask area, resulting in incorrect coloring of the background. Experimental results validate the effectiveness of the semantic segmentation optimization method.
3. Experiments and Results
3.1. Experiments Platform
We independently built an autonomous navigation drone, as shown in Figure 9, for data collection tasks. It is important to note that the drone is solely responsible for data acquisition, while verification runs offline. This is because the drone lacks an NVIDIA graphics card to run visual models, and its advantage lies in its flexible and compact design, making it suitable for diverse environments. The flight platform is primarily constructed from lightweight carbon fiber and aluminum, ensuring structural strength and extreme lightness. The core sensor suite includes: Livox MID360 LiDAR providing a 360° field of view, with an integrated six-axis inertial measurement unit (IMU); MV-CS050-10UC camera; Intel RealSense D435i camera for RGB-D image capture; LiDAR and IMU operating at 10Hz and 200Hz, respectively. The onboard Intel NUC 12 Pro serves as the core computing unit, with the radar and MV-CS050-10UC camera synchronized via an STM32 microcontroller.
3.2. Semantic segmentation performance analysis
To train a semantic segmentation model for dragon fruit, this paper divides the annotated dataset into training, validation, and test sets at an 8:1:1 ratio, then fine-tunes the model based on FastSAM pretrained weights. Figure 10 compares segmentation results between traditional and deep learning approaches: The conventional threshold-based segmentation method using the HSV color space achieves moderate results under uniform lighting and simple backgrounds, but its performance significantly degrades in scenarios involving leaf occlusion, backlighting, and complex backgrounds. In contrast, the FastSAM model learns high-level semantic features, enabling accurate segmentation of fruit and foliage regions even under these challenging conditions. Although affected by environmental factors and annotation quality, the model still exhibits missed detections in severely occluded regions. Nevertheless, its overall segmentation accuracy and robustness surpass traditional methods.
To comprehensively evaluate the performance of the Fastsam segmentation model, we also selected several classical networks for comparison, such as U-NET, DeepLabV3+, and BiSeNet. Testing was conducted on our own dataset using mean Intersection over Union (mIoU), pixel accuracy (PA), F1 score, and inference speed (FPS) as evaluation metrics. mIoU measures the overlap between predicted and ground-truth regions, PA reflects overall pixel classification accuracy, F1 score comprehensively evaluates precision and recall, and FPS assesses real-time processing capability. The relevant calculation formula is as follows:
Here, denotes the total number of classes, while , , and represent the pixel counts for true positives, false positives, and false negatives, respectively. indicates the number of pixels in the confusion matrix where the true class is i but the predicted class is j, and denotes the number of correctly classified pixels.
Table 1 compares the performance of different segmentation methods on the dragon fruit test set. mIoU, PA, and F1 are expressed as percentages, while FPS was measured on an NVIDIA RTX 3090ti. Although its accuracy is lower than that of BisNet, Fast-sam can support text prompts. For some uncommon objects, there is no need for cumbersome separate training, as that would be too costly. Overall, FastSAM maintains a high level of segmentation accuracy while having a slower inference speed compared to other networks. However, with over 70 fps, it is sufficient for mapping tasks, indicating that it is suitable for visual segmentation tasks with high real-time requirements..
3.3. Evaluation of 3D semantic map construction in a orchard
To evaluate the reconstruction effectiveness and accuracy of the system, we conducted experiments in a greenhouse dragon fruit orchard at South China Agricultural University in Guangzhou, as shown in the Figure 11. The environment featured densely distributed plants with a height of approximately 2 meters.
First, evaluate the reconstruction results for a small group of trees to determine whether the number of fruits obtained from the reconstructed point cloud matches the actual count. In the reconstructed point cloud, fruits are colored red, paper strips are colored green, and other unintended objects are colored with different random hues, while the remaining points retain their original RGB colors.
Observation of the semantic information from reconstructed individual fruit trees, including point clouds of branches and fruits, reveals that most elements are correctly classified as green and red. This finding is closely related to the accuracy of semantic segmentation. The Bayesian log-likelihood fusion approach effectively mitigates discrepancies in color assignment caused by the same point cloud being segmented into different categories. Compared to point clouds constructed using visual methods, those obtained via SLAM exhibit significantly more pronounced geometric features and appear more regular and distinct. This is because visual methods do not directly capture distance information for each point but instead calculate it indirectly through means such as stereo disparity, resulting in lower absolute accuracy, particularly at long distances.
To quantitatively assess the quality of semantic reconstruction, we conducted quantitative experiments. First, we employed conditional filtering to extract dragon fruit point clouds from the semantic map based on color. Subsequently, since manual counting in semantic point cloud maps is challenging, we used a clustering algorithm to group discrete point clouds into multiple clusters for counting. Based on point cloud density and actual fruit size, we set the minimum allowed points per cluster to 30, with a minimum radius of 0.03 and a maximum radius of 0.08, while other parameters remained at default values. The clustering results are shown in Figure 12, where each small square is regarded as a piece of pulp. However, it should be noted that due to the error in the mask segmentation area, some point clouds of branches may be mistakenly regarded as belonging to the fruit during clustering, resulting in an increase in the number. Finally, based on the fitting results, the predicted value is determined and compared with the true value . The relative error is calculated using formula 17 to evaluate the system’s reliability. Experimental statistical results are shown in Table 2.
Relative error serves as a crucial metric for evaluating semantic reconstruction quality, with lower values indicating more reliable reconstruction results. As shown in the table, the average relative error of the proposed method is 12.4%, demonstrating overall high prediction accuracy, though some counting bias remains. The sources of error can be summarized as follows:
- Occlusion issues: In natural orchard environments, dragon fruit are often obscured by dense branches and foliage. Some fruits have only a small portion of their surface exposed within the sensor’s field of view, preventing complete reconstruction in the 3D point cloud and leading to missed detections.
- Point cloud noise: Influenced by factors such as LiDAR measurement accuracy, multipath reflections, and edge effects, semantic point clouds inevitably contain outliers and areas with blurred boundaries. This noise interferes with density-based clustering algorithms, leading to adjacent fruits being incorrectly merged or individual fruits being excessively fragmented;
- Semantic segmentation errors: During the projection of 2D image segmentation results onto the 3D point cloud, imprecision in segmentation boundaries is transferred to point cloud annotations, affecting final clustering and counting outcomes.
Despite these error sources, the average relative error of 12.4% remains within an acceptable range, validating the practicality of this method in complex orchard environments.
To further validate the semantic mapping performance in large-scale scenarios, testing was conducted across the entire orchard, traversing multiple tree rows to cover all areas. As shown in Figure 13, Figure 14 branches in each row were reconstructed effectively, and fruits were correctly segmented. This demonstrates the value of our method for semantic mapping in orchards. It should be noted that due to the non-repeating scanning pattern of the radar, distant noise points may be detected. Before converting the point cloud into a grid map for navigation, filtering can be applied to remove these outliers. While this process may inevitably eliminate some valid points, it has minimal impact on semantic information and navigation maps. Indeed, our experiments confirmed that filtering did not significantly reduce the point cloud volume but instead enhanced structural clarity.
3.4. Localization accuracy evaluation
Although semantic maps can help robots operate according to human rules, plan and execute advanced tasks, all of this relies on reliable positioning. Whether robots can truly leverage the value of semantic maps ultimately depends on the accuracy of their positioning. Given these considerations, we also evaluated the system’s positioning accuracy. We selected a starting point within the orchard, navigated around the tree rows, and returned to the origin. Due to the lack of ground truth data, we recorded only the Fast-Livo2, and odometry (with vision disabled) measurements. We then used the open-source evaluation tool EVO to compare the relative errors between these methods. The results are shown in Figure 15.
4. Discussion and Future Work
This study proposes a method for constructing semantic point clouds of dragon fruit orchards based on the fusion of 2D semantic segmentation and 3D LiDAR point clouds. The core approach involves using FastSAM to perform semantic segmentation on captured orchard images, obtaining pixel-level annotations for fruits and foliage. Subsequently, through camera-LiDAR fusion, the 2D semantic labels are projected onto the 3D point cloud space, enabling automatic construction of the semantic point cloud. Quantitative evaluation results demonstrate that the proposed method achieves an average intersection-over-union (IoU) of 74.33%, pixel accuracy of 85.02%, and an F1 score of 84.72% on the dragon fruit test dataset. Regarding inference efficiency, FastSAM maintains a processing speed of 75 FPS, meeting real-time requirements. Experiments on fruit counting using the semantic point cloud revealed an average relative error of 12.4% between predicted and actual values. Errors primarily stemmed from incomplete fruit reconstruction due to branch and leaf occlusion, as well as point cloud noise interfering with clustering algorithms. These results validate our method’s value in providing information for orchard management and supporting robots in executing higher-level tasks.
Although the method proposed in this paper can achieve semantic reconstruction of dragon fruit orchards, the following limitations remain: The accuracy of semantic segmentation has a decisive impact on the quality of semantic map reconstruction. As shown in Figure 16, the dragon fruit orchard environment is complex, primarily manifested in the following aspects: (1) Randomly distributed branches cause significant variations in the distance between the camera and the target during data collection, resulting in incomplete representation of some fruits within the image field of view; (2) To ensure synchronization between the camera and radar frequencies, the camera operates at a frame rate of 10 Hz. Motion blur during movement reduces segmentation accuracy; (3) Rapid changes in orchard lighting conditions, coupled with severe occlusion of fruits by branches and leaves, resulted in incorrect segmentation of some targets. Furthermore, the complex morphological structure of dragon fruit plants, where branches and fruits intertwine, made dataset annotation laborious and error-prone. Inconsistencies and errors in annotation directly impact training data quality, causing the model to learn incorrect semantic features and consequently degrading segmentation performance. To address these challenges, future research will focus on the following directions: First, optimizing the dataset to provide higher-quality training samples. Second, implementing lightweight improvements to the segmentation network tailored to the practical deployment requirements of orchard robots. This will enable adaptation to computationally constrained embedded platforms while meeting real-time demands in highly dynamic operational environments.
Author Contributions
Conceptualization, Q.W. and Y.C.; Methodology, Q.W., Y.C.; Software, Q.W.and Y.C.; Validation, Q.W., J.L., and Y.C.; Formal analysis, Q.W. and J.L.;Data curation, Q.W.; Writing-original draft, Q.W.; Writing review & editing, H.W.; Supervision, H.W.; Project administration, H.W.; funding acquisition, H.W. All authors have read and agreed to the published version of the manuscript.
Funding
This research was supported in part by the National Natural Science Foundation of China under Grant 32372001.
Institutional Review Board Statement
Not applicable.
Informed Consent Statement
Not applicable.
Data Availability Statement
The data presented in this study are available on request from the corresponding author.
Acknowledgments
Not applicable.
Conflicts of Interest
The authors declare no conflict of interest.
References
- Kazerouni, I.A.; Fitzgerald, L.; Dooly, G.; Toal, D. A survey of state-of-the-art on visual SLAM. Expert Systems with Applications 2022, 205, 117734. [Google Scholar] [CrossRef]
- Liu, T.; Kang, H.; Chen, C. ORB-Livox: A real-time dynamic system for fruit detection and localization. Computers and electronics in agriculture 2023, 209, 107834. [Google Scholar] [CrossRef]
- Yuan, Q.; Wang, P.; Luo, W.; Zhou, Y.; Chen, H.; Meng, Z. Simultaneous Localization and Mapping System for Agricultural Yield Estimation Based on Improved VINS-RGBD: A Case Study of a Strawberry Field. Agriculture 2024, 14, 784. [Google Scholar] [CrossRef]
- Kutyrev, A.; Khort, D.; Smirnov, I.; Zubina, V. UAV-based sustainable orchard management: Deep learning for apple detection and yield estimation. Proceedings of the E3S Web of Conferences. EDP Sciences 2025, 614, 03021. [Google Scholar] [CrossRef]
- Casado-García, A.; Heras, J.; Milella, A.; Marani, R. Semi-supervised deep learning and low-cost cameras for the semantic segmentation of natural images in viticulture. Precision Agriculture 2022, 23, 2001–2026. [Google Scholar] [CrossRef]
- Liu, Z.; Wang, J.; Liu, C.; Li, Z.; Jiang, H.; Ma, Y.; Zhang, Y.; Wang, Z. Online Point Coverage Path Planning for Prior-Free Robotic Weeding Using Deep Reinforcement Learning. In Authorea Preprints; 2025. [Google Scholar]
- Rapado-Rincon, D.; Kootstra, G. Tree-SLAM: semantic object SLAM for efficient mapping of individual trees in orchards. Smart Agricultural Technology 2025, 101439. [Google Scholar] [CrossRef]
- Lei, J.; Prabhu, A.; Liu, X.; Cladera, F.; Mortazavi, M.; Ehsani, R.; Chaudhari, P.; Kumar, V. Spatio-Temporal Metric-Semantic Mapping for Persistent Orchard Monitoring: Method and Dataset. IEEE Robotics and Automation Letters, 2025. [Google Scholar]
- Peng, C.; Roy, P.; Luby, J.; Isler, V. Semantic mapping of orchards. IFAC-PapersOnLine 2016, 49, 85–89. [Google Scholar] [CrossRef]
- Xiong, J.; Liang, J.; Zhuang, Y.; Hong, D.; Zheng, Z.; Liao, S.; Hu, W.; Yang, Z. Real-time localization and 3D semantic map reconstruction for unstructured citrus orchards. Computers and Electronics in Agriculture 2023, 213, 108217. [Google Scholar] [CrossRef]
- Nakaguchi, V.M.; Abeyrathna, R.R.D.; Liu, Z.; Noguchi, R.; Ahamed, T. Development of a Machine stereo vision-based autonomous navigation system for orchard speed sprayers. Computers and Electronics in Agriculture 2024, 227, 109669. [Google Scholar] [CrossRef]
- Papadimitriou, A.; Kleitsiotis, I.; Kostavelis, I.; Mariolis, I.; Giakoumis, D.; Likothanassis, S.; Tzovaras, D. Loop closure detection and slam in vineyards with deep semantic cues. In Proceedings of the 2022 International Conference on Robotics and Automation (ICRA), 2022; IEEE; pp. 2251–2258. [Google Scholar]
- Wang, S.; Song, J.; Qi, P.; Yuan, C.; Wu, H.; Zhang, L.; Liu, W.; Liu, Y.; He, X. Design and development of orchard autonomous navigation spray system. Frontiers in Plant Science 2022, 13, 960686. [Google Scholar] [CrossRef] [PubMed]
- Blok, P.M.; van Boheemen, K.; van Evert, F.K.; IJsselmuiden, J.; Kim, G.H. Robot navigation in orchards with localization based on Particle filter and Kalman filter. Computers and electronics in agriculture 2019, 157, 261–269. [Google Scholar] [CrossRef]
- Dong, W.; Roy, P.; Isler, V. Semantic mapping for orchard environments by merging two-sides reconstructions of tree rows. Journal of Field Robotics 2020, 37, 97–121. [Google Scholar] [CrossRef]
- Peng, H.; Guo, S.; Zou, X.; Wang, H.; Xiong, J.; Liang, Q. UAVO-NeRF: 3D reconstruction of orchards and semantic segmentation of fruit trees based on neural radiance field in UAV images. Computers and Electronics in Agriculture 2025, 237, 110631. [Google Scholar] [CrossRef]
- Pan, Y.; Hu, K.; Cao, H.; Kang, H.; Wang, X. A novel perception and semantic mapping method for robot autonomy in orchards. Computers and Electronics in Agriculture 2024, 219, 108769. [Google Scholar] [CrossRef]
- Fu, H.; Li, X.; Zhu, L.; Xin, P.; Wu, T.; Li, W.; Feng, Y. DSC-DeepLabv3+: a lightweight semantic segmentation model for weed identification in maize fields. Frontiers in Plant Science 2025, 16, 1647736. [Google Scholar] [CrossRef] [PubMed]
- Sodano, M.; Magistri, F.; Marks, E.; Hosn, F.; Zurbayev, A.; Marcuzzi, R.; Malladi, M.V.; Behley, J.; Stachniss, C. 3D Hierarchical Panoptic Segmentation in Real Orchard Environments Across Different Sensors. arXiv 2025, arXiv:2503.13188. [Google Scholar] [CrossRef]
- Cuaran, J.; Ahluwalia, K.S.; Koe, K.; Uppalapati, N.K.; Chowdhary, G. Active Semantic Mapping with Mobile Manipulator in Horticultural Environments. In Proceedings of the 2025 IEEE International Conference on Robotics and Automation (ICRA), 2025; IEEE; pp. 12716–12722. [Google Scholar]
- Cheng, T.; Song, L.; Ge, Y.; Liu, W.; Wang, X.; Shan, Y. YOLO-World: Real-Time Open-Vocabulary Object Detection. In Proceedings of the Proc. IEEE Conf. Computer Vision and Pattern Recognition (CVPR), 2024. [Google Scholar]
- Zhao, X.; Ding, W.; An, Y.; Du, Y.; Yu, T.; Li, M.; Tang, M.; Wang, J. Fast Segment Anything. arXiv 2023, arXiv:2306.12156. [Google Scholar] [CrossRef]
- Qi, C.R.; Su, H.; Mo, K.; Guibas, L.J. Pointnet: Deep learning on point sets for 3d classification and segmentation. In Proceedings of the Proceedings of the IEEE conference on computer vision and pattern recognition, 2017; pp. 652–660. [Google Scholar]
- Qi, C.R.; Yi, L.; Su, H.; Guibas, L.J. Pointnet++: Deep hierarchical feature learning on point sets in a metric space. Advances in neural information processing systems 2017, 30. [Google Scholar]
- Hu, Q.; Yang, B.; Xie, L.; Rosa, S.; Guo, Y.; Wang, Z.; Trigoni, N.; Markham, A. Randla-net: Efficient semantic segmentation of large-scale point clouds. In Proceedings of the Proceedings of the IEEE/CVF conference on computer vision and pattern recognition, 2020; pp. 11108–11117. [Google Scholar]
- Zhou, H.; Zhu, X.; Song, X.; Ma, Y.; Wang, Z.; Li, H.; Lin, D. Cylinder3d: An effective 3d framework for driving-scene lidar semantic segmentation. arXiv arXiv:2008.01550.
- Deng, J.; Dong, W.; Socher, R.; Li, L.J.; Li, K.; Fei-Fei, L. Imagenet: A large-scale hierarchical image database. In Proceedings of the 2009 IEEE conference on computer vision and pattern recognition, Ieee, 2009; pp. 248–255. [Google Scholar]
- Lin, T.Y.; Maire, M.; Belongie, S.; Hays, J.; Perona, P.; Ramanan, D.; Dollár, P.; Zitnick, C.L. Microsoft coco: Common objects in context. In Proceedings of the European conference on computer vision, 2014; Springer; pp. 740–755. [Google Scholar]
- Zheng, C.; Xu, W.; Zou, Z.; Hua, T.; Yuan, C.; He, D.; Zhou, B.; Liu, Z.; Lin, J.; Zhu, F.; et al. Fast-livo2: Fast, direct lidar-inertial-visual odometry. IEEE Transactions on Robotics, 2024. [Google Scholar]
- Liu, Z.; Li, H.; Yuan, C.; Liu, X.; Lin, J.; Li, R.; Zheng, C.; Zhou, B.; Liu, W.; Zhang, F. Voxel-slam: A complete, accurate, and versatile lidar-inertial slam system. arXiv 2024. arXiv:2410.08935.
- Zheng, C.; Zhu, Q.; Xu, W.; Liu, X.; Guo, Q.; Zhang, F. Fast-livo: Fast and tightly-coupled sparse-direct lidar-inertial-visual odometry. In Proceedings of the 2022 IEEE/RSJ international conference on intelligent robots and systems (IROS), 2022; IEEE; pp. 4003–4009. [Google Scholar]
Figure 1.
Schematic diagram of semantic annotation.
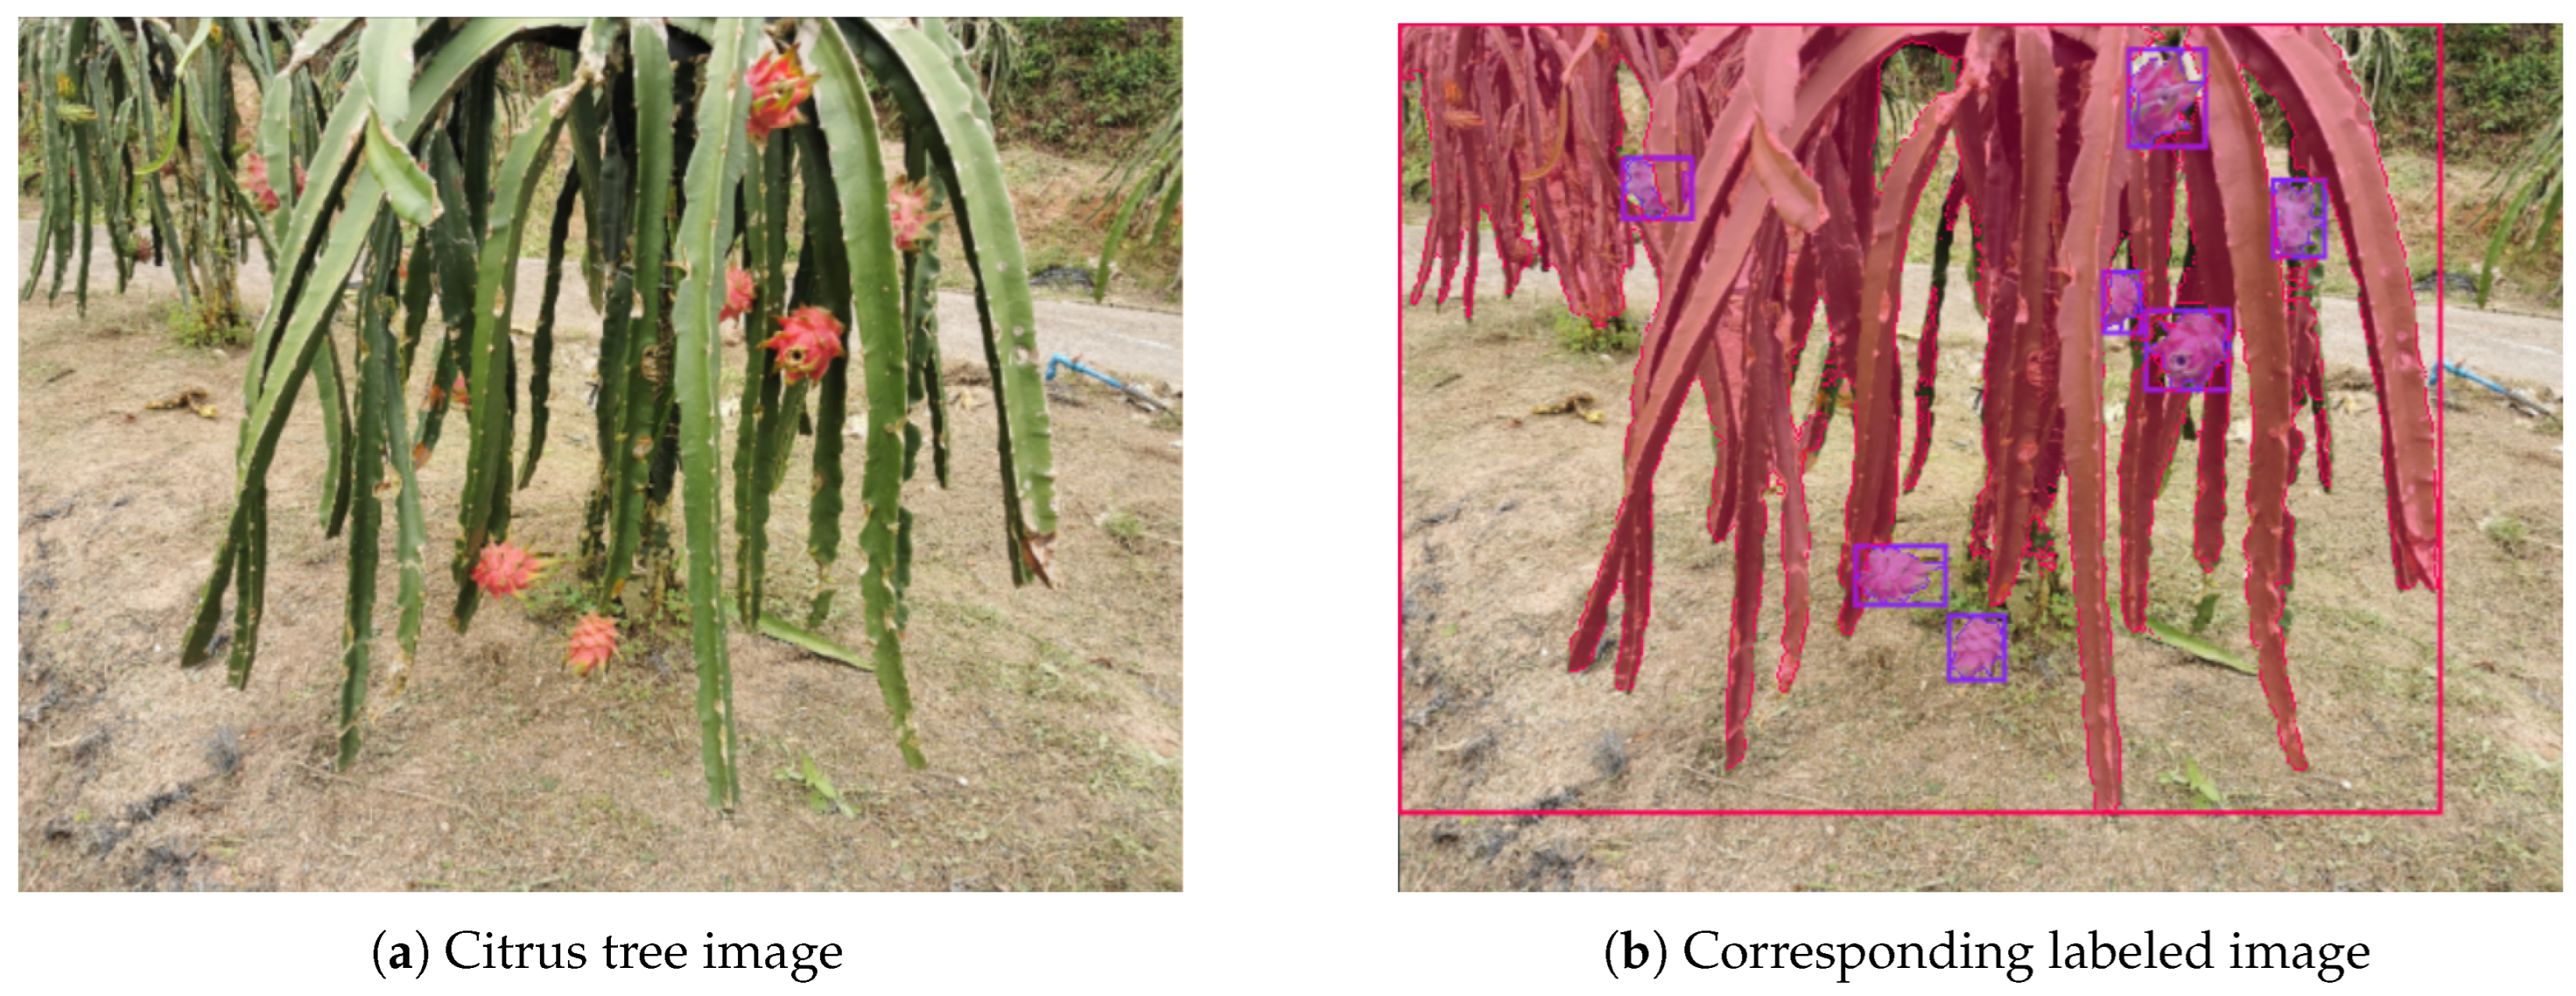
Figure 2.
System overview of 3D semantic map construction.
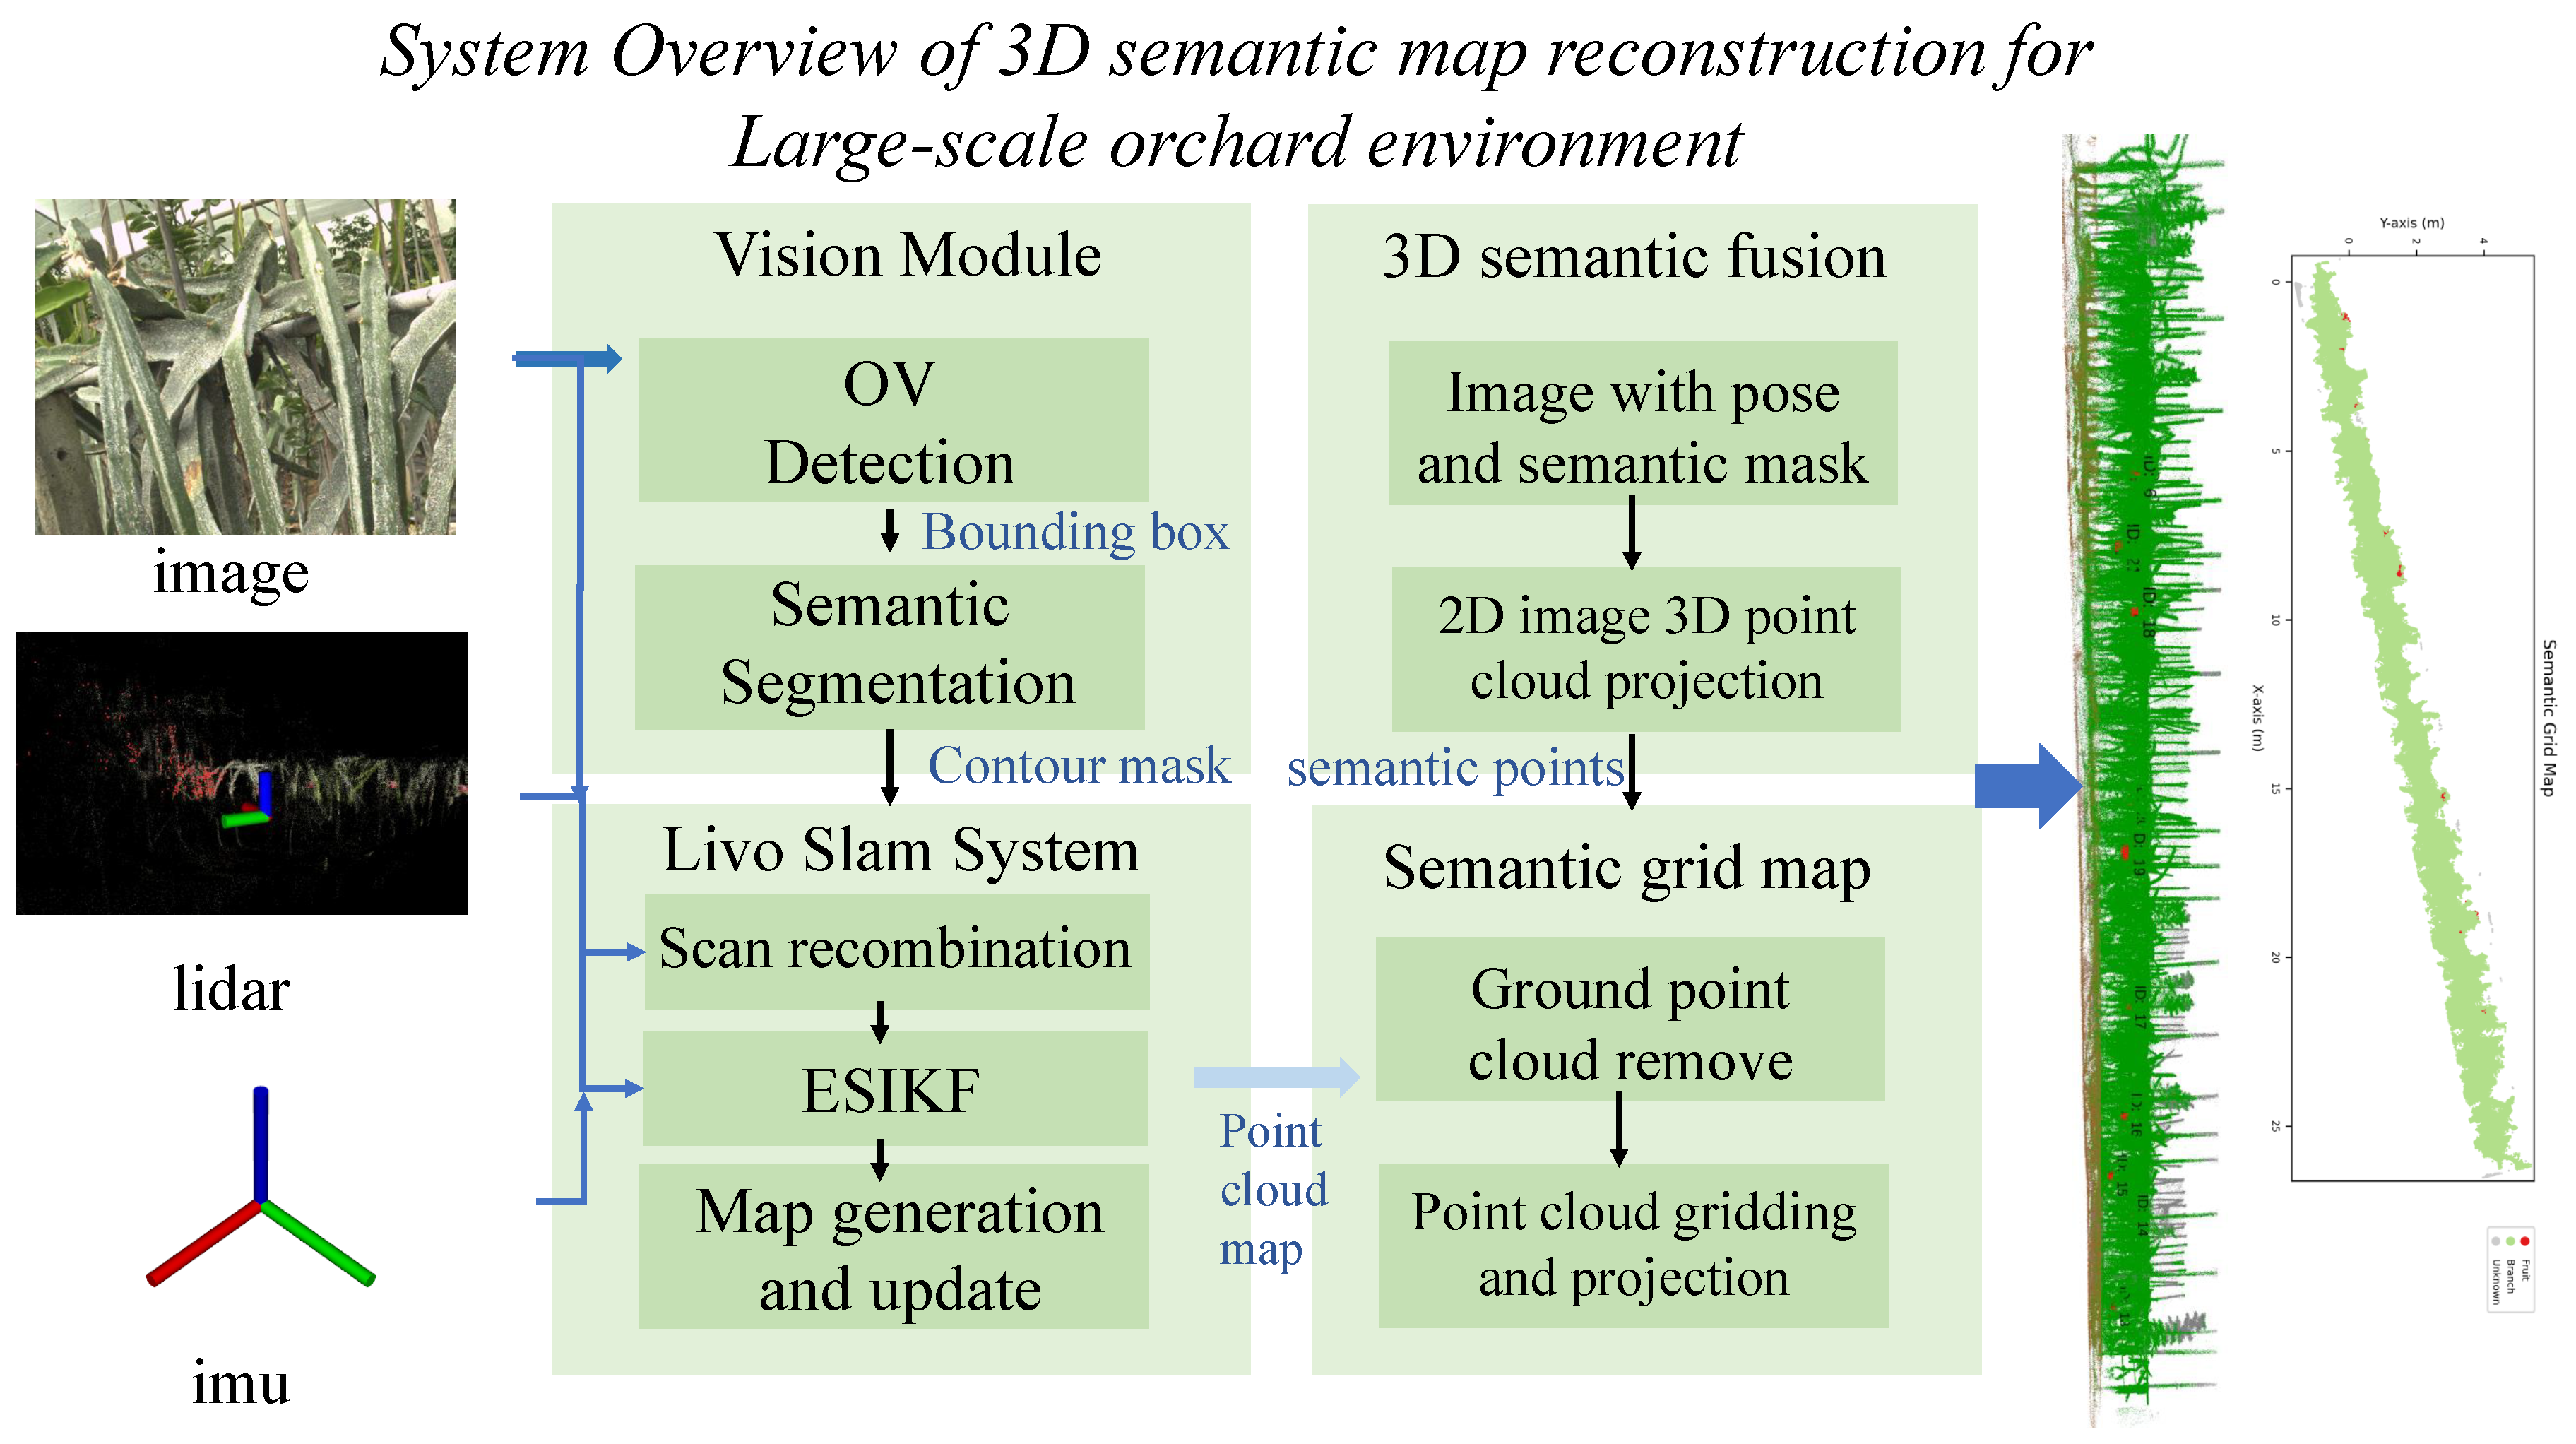
Figure 3.
Two-stage semantic segmentation model diagram.
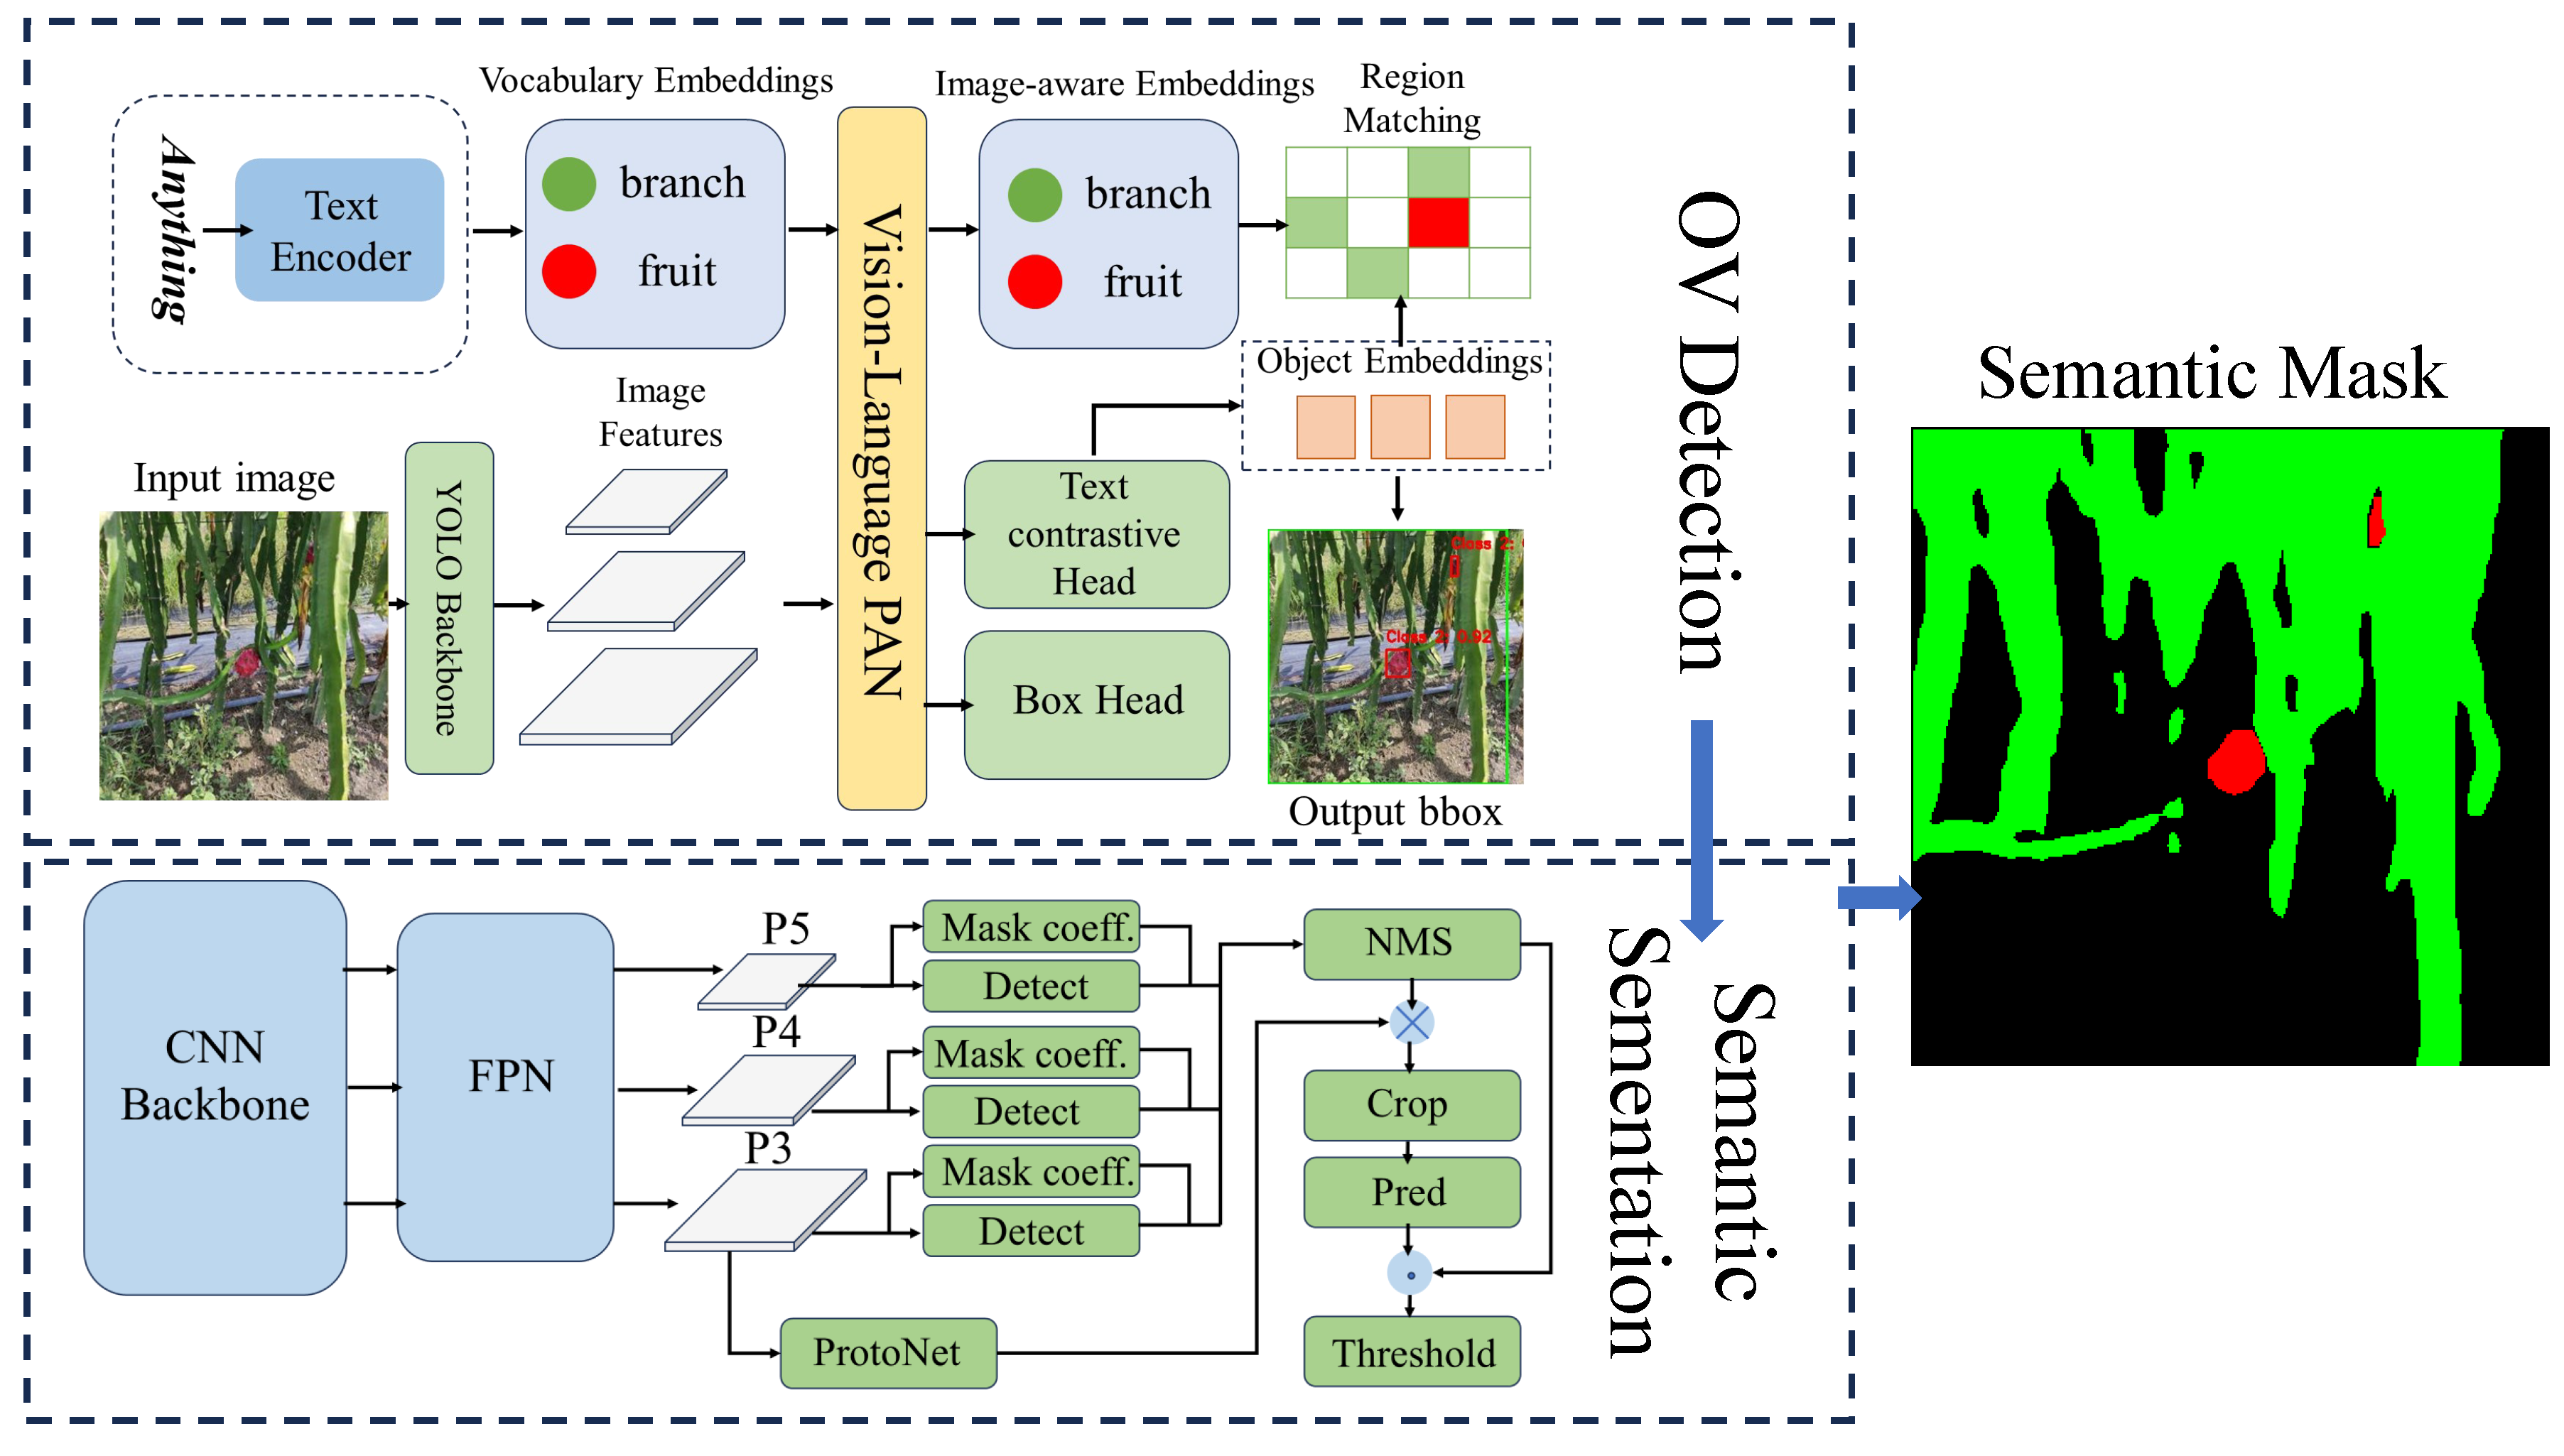
Figure 4.
System overview of external calibration.
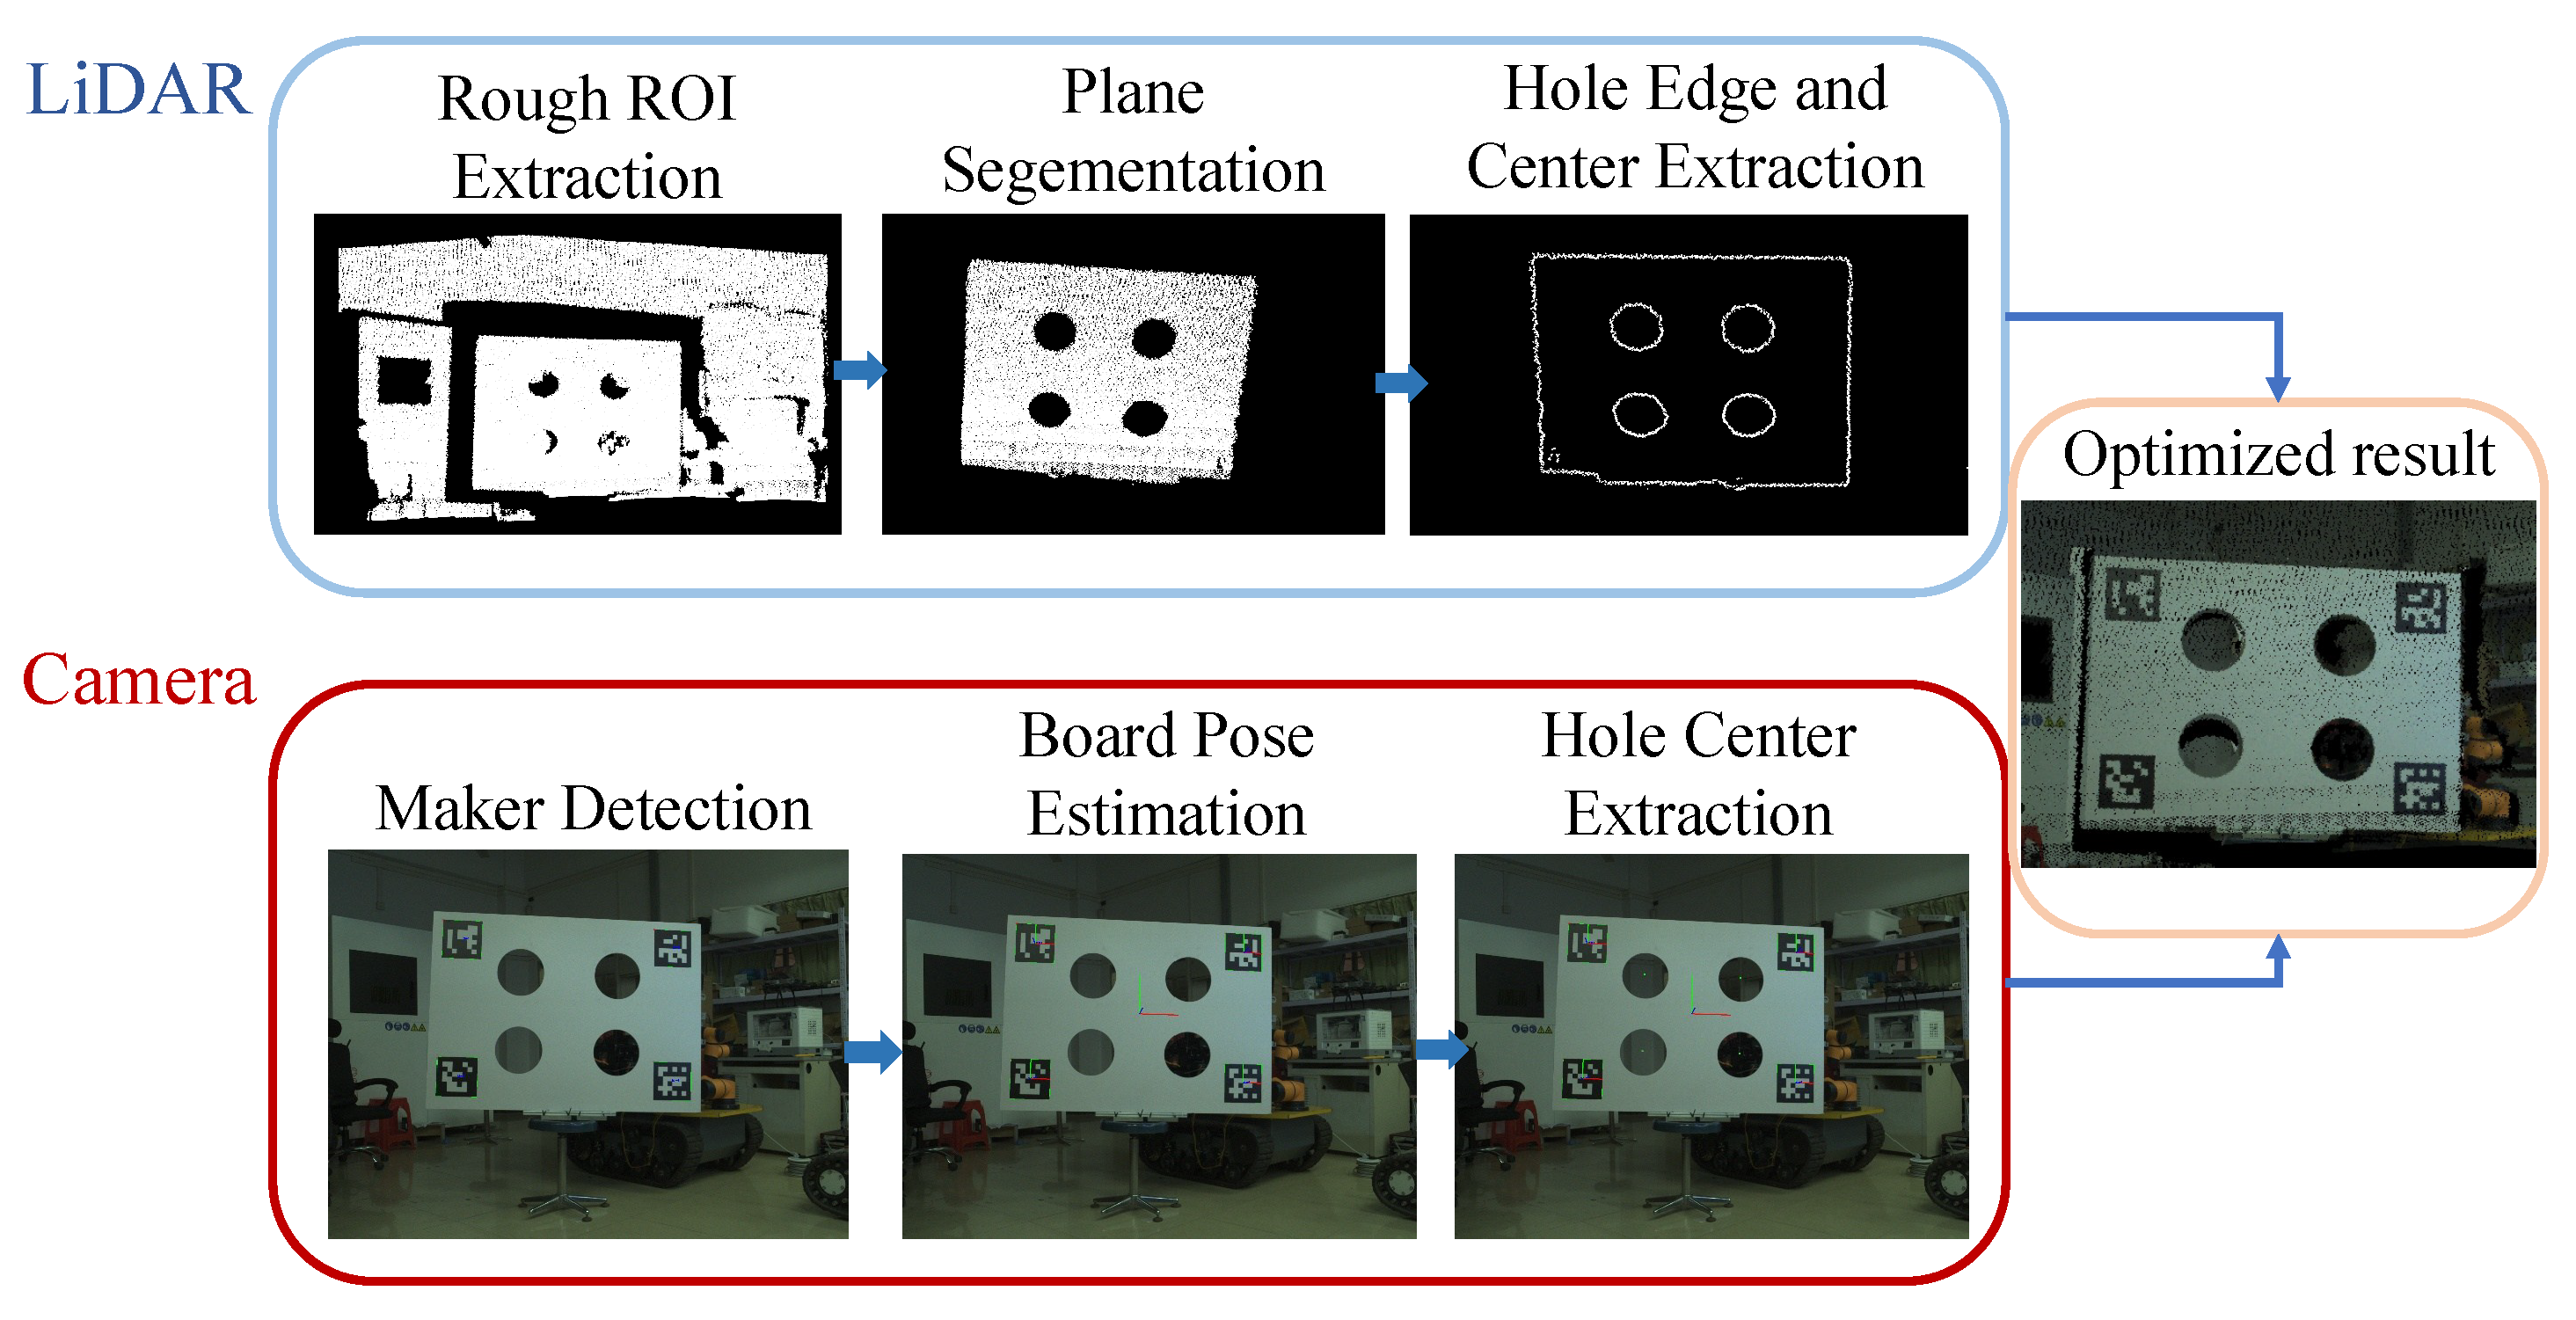
Figure 5.
Lidar SLAM experiment results. (a), (b) The colored point cloud map; (c) The point cloud map.
Figure 5.
Lidar SLAM experiment results. (a), (b) The colored point cloud map; (c) The point cloud map.
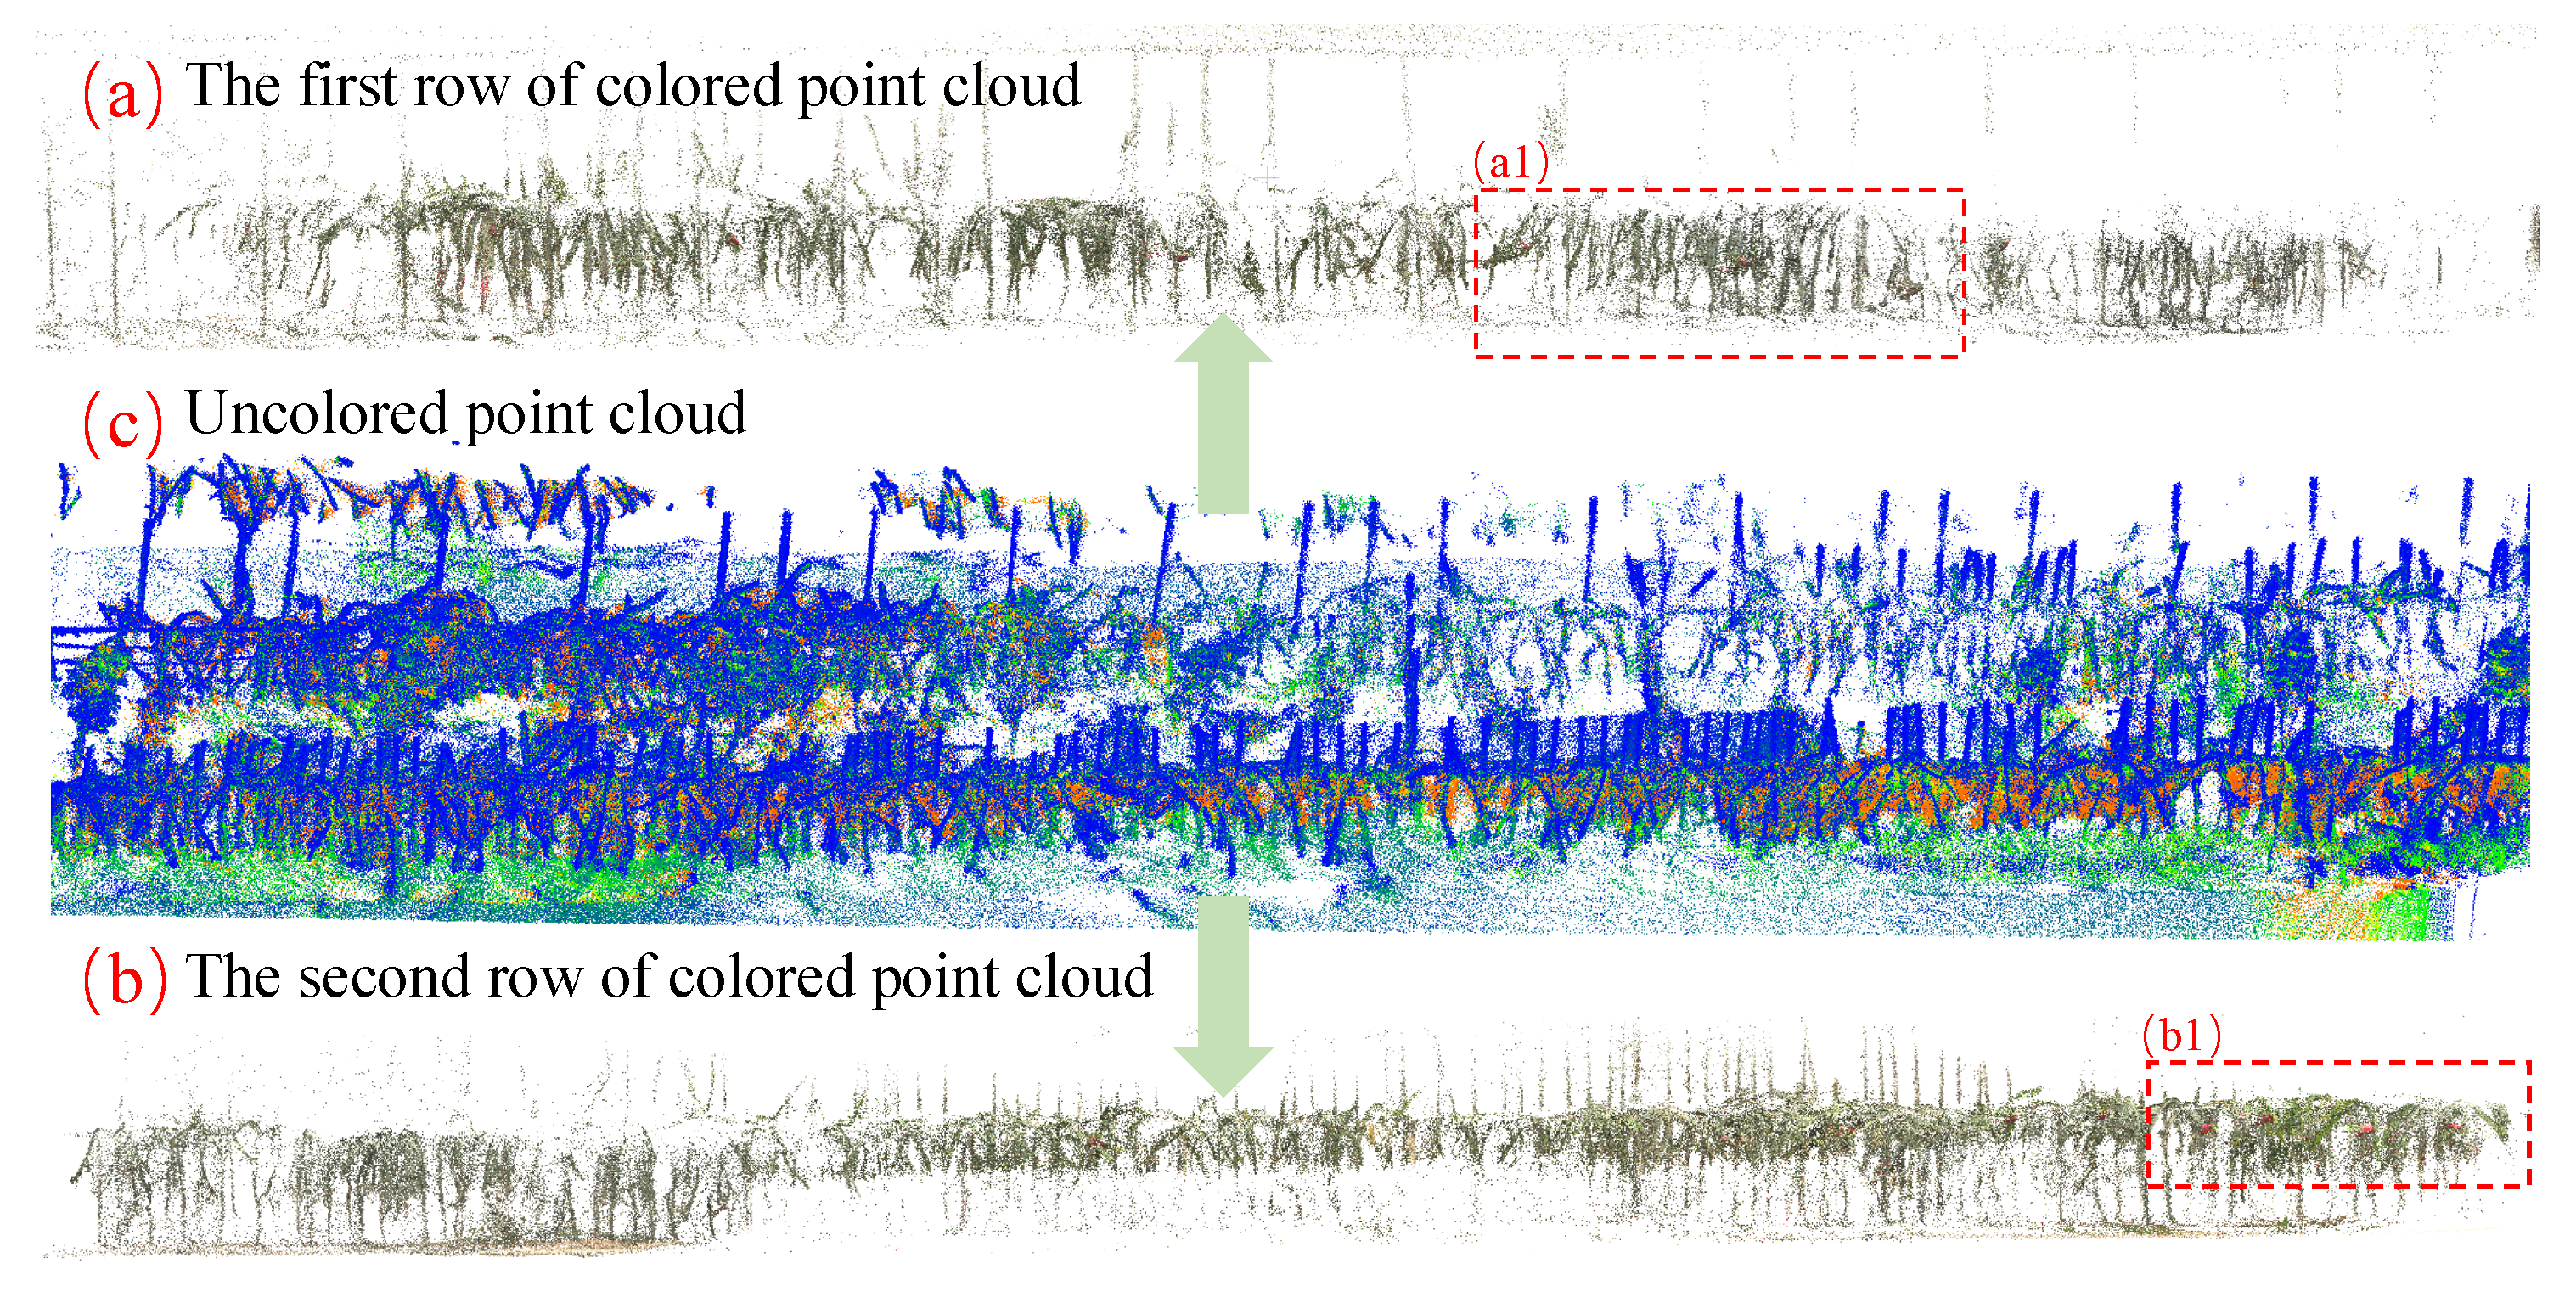
Figure 6.
Detailed magnified illustration.
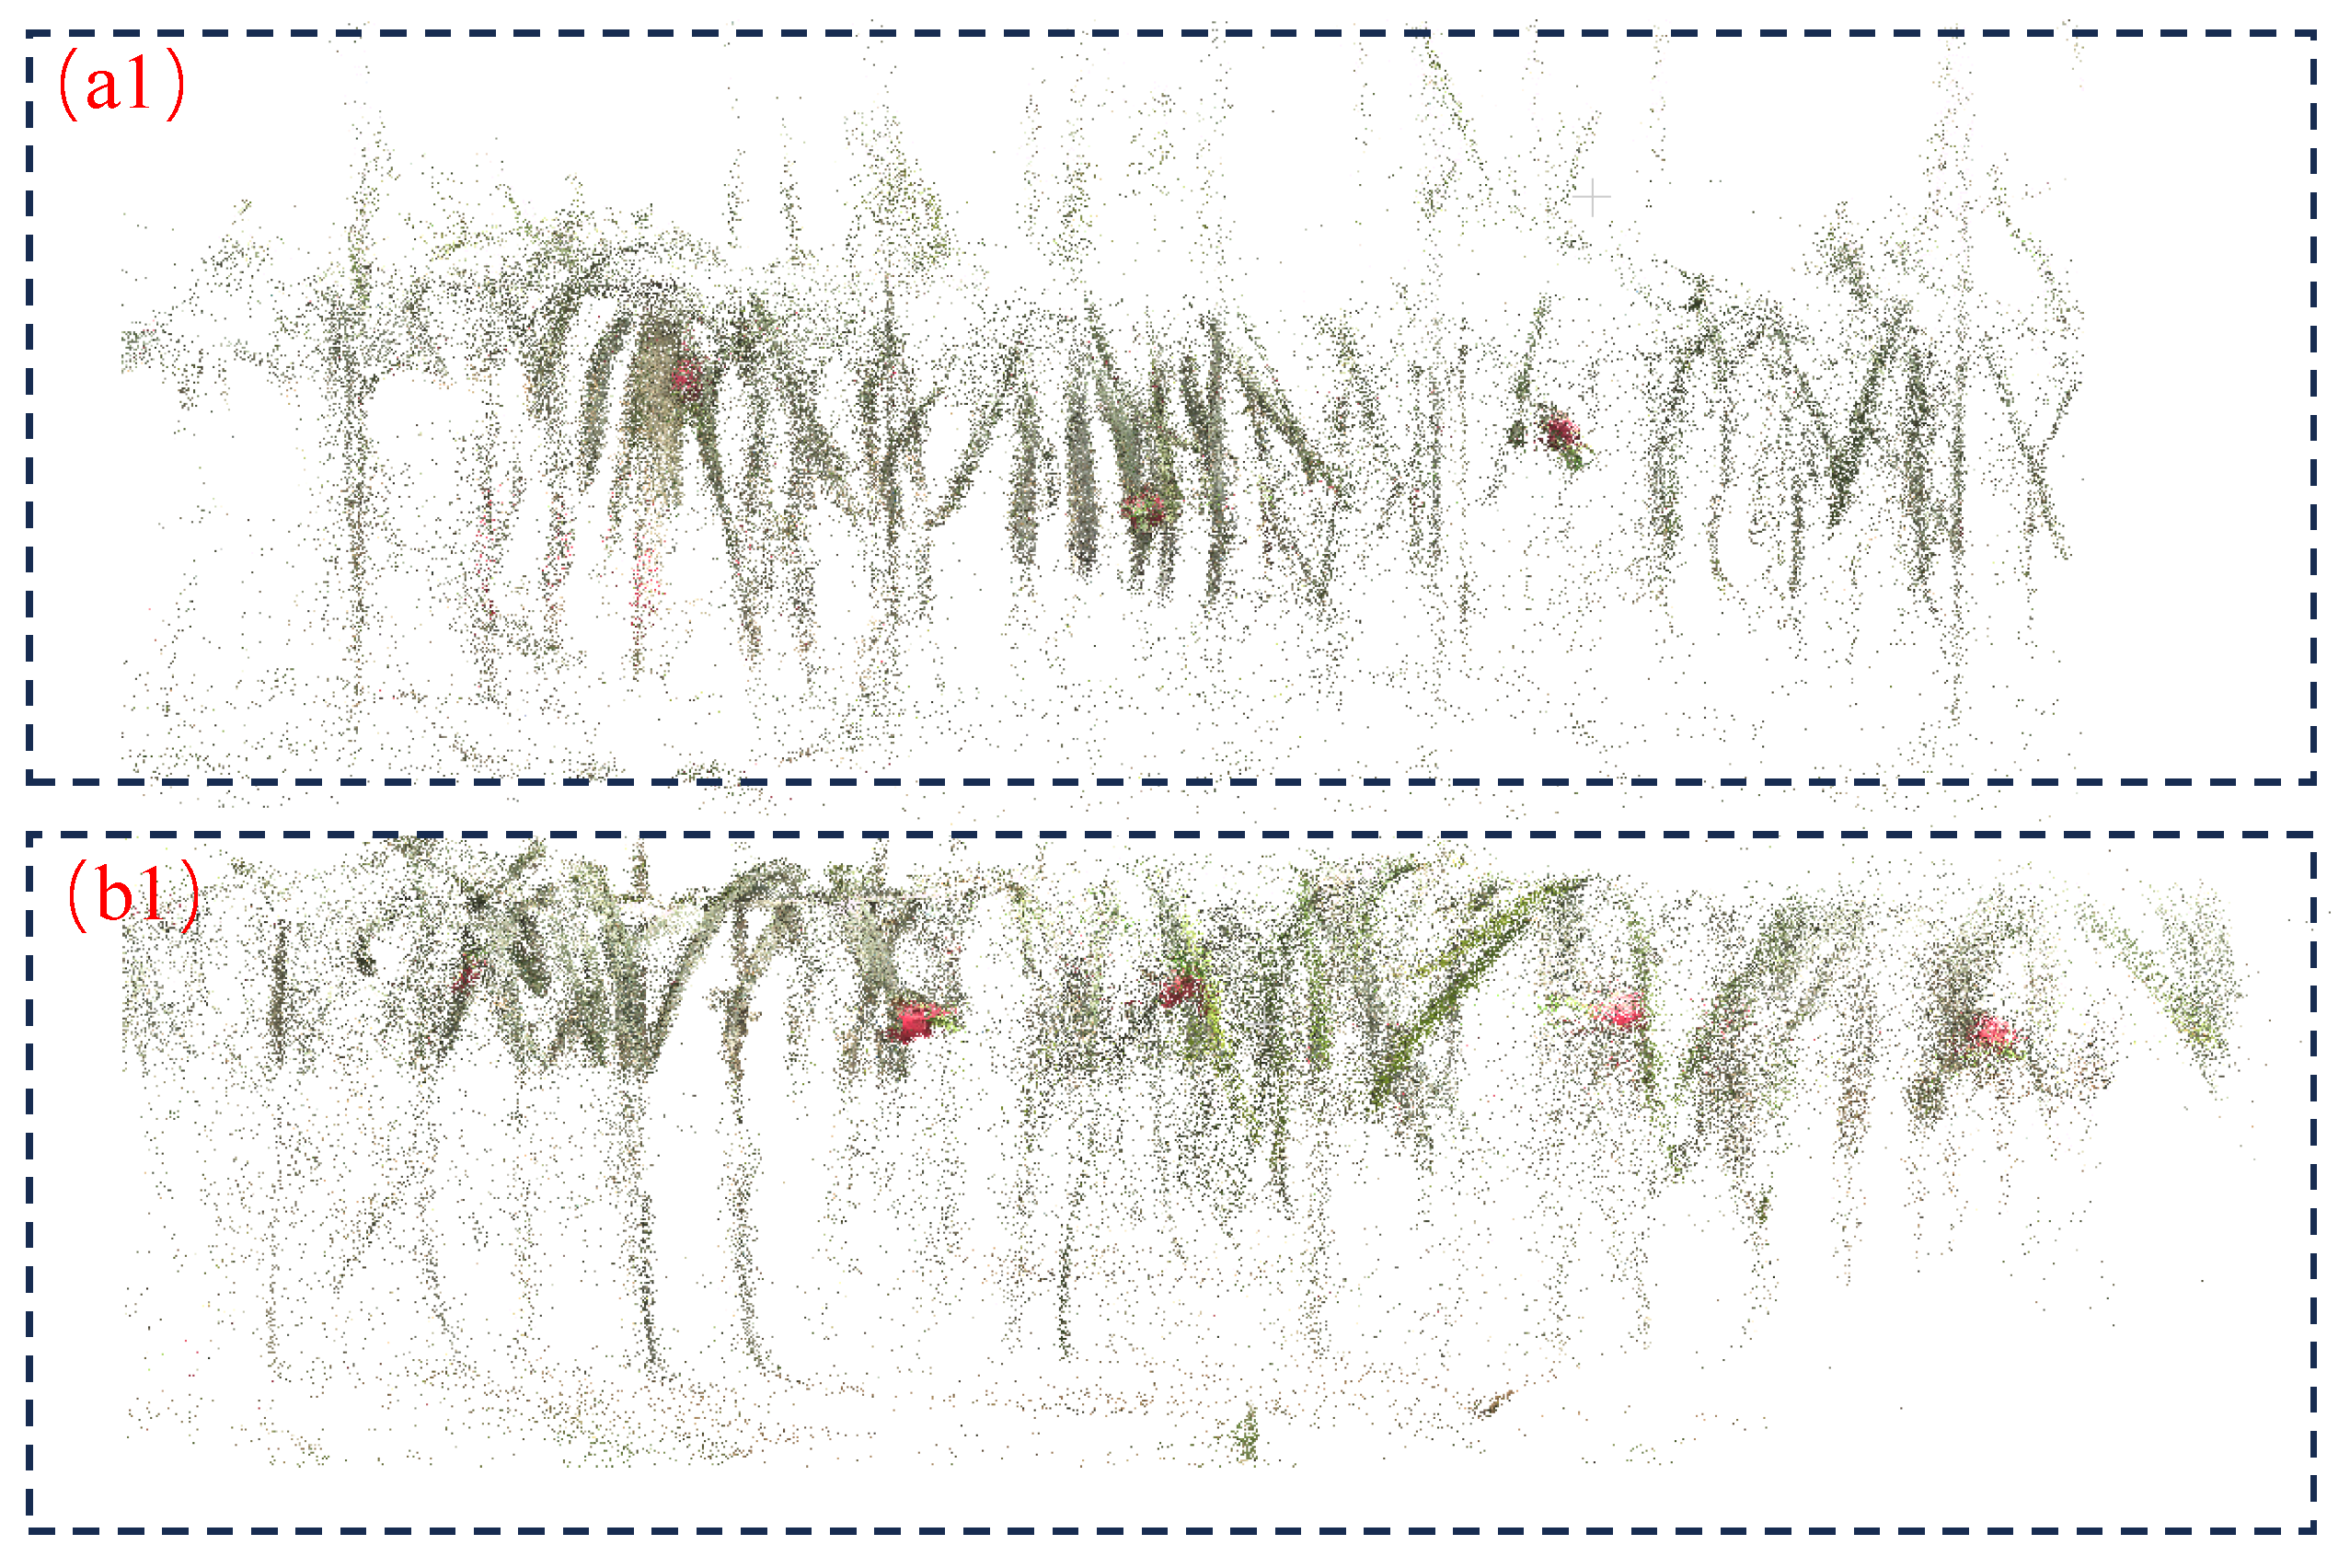
Figure 7.
The hardware synchronization scheme.
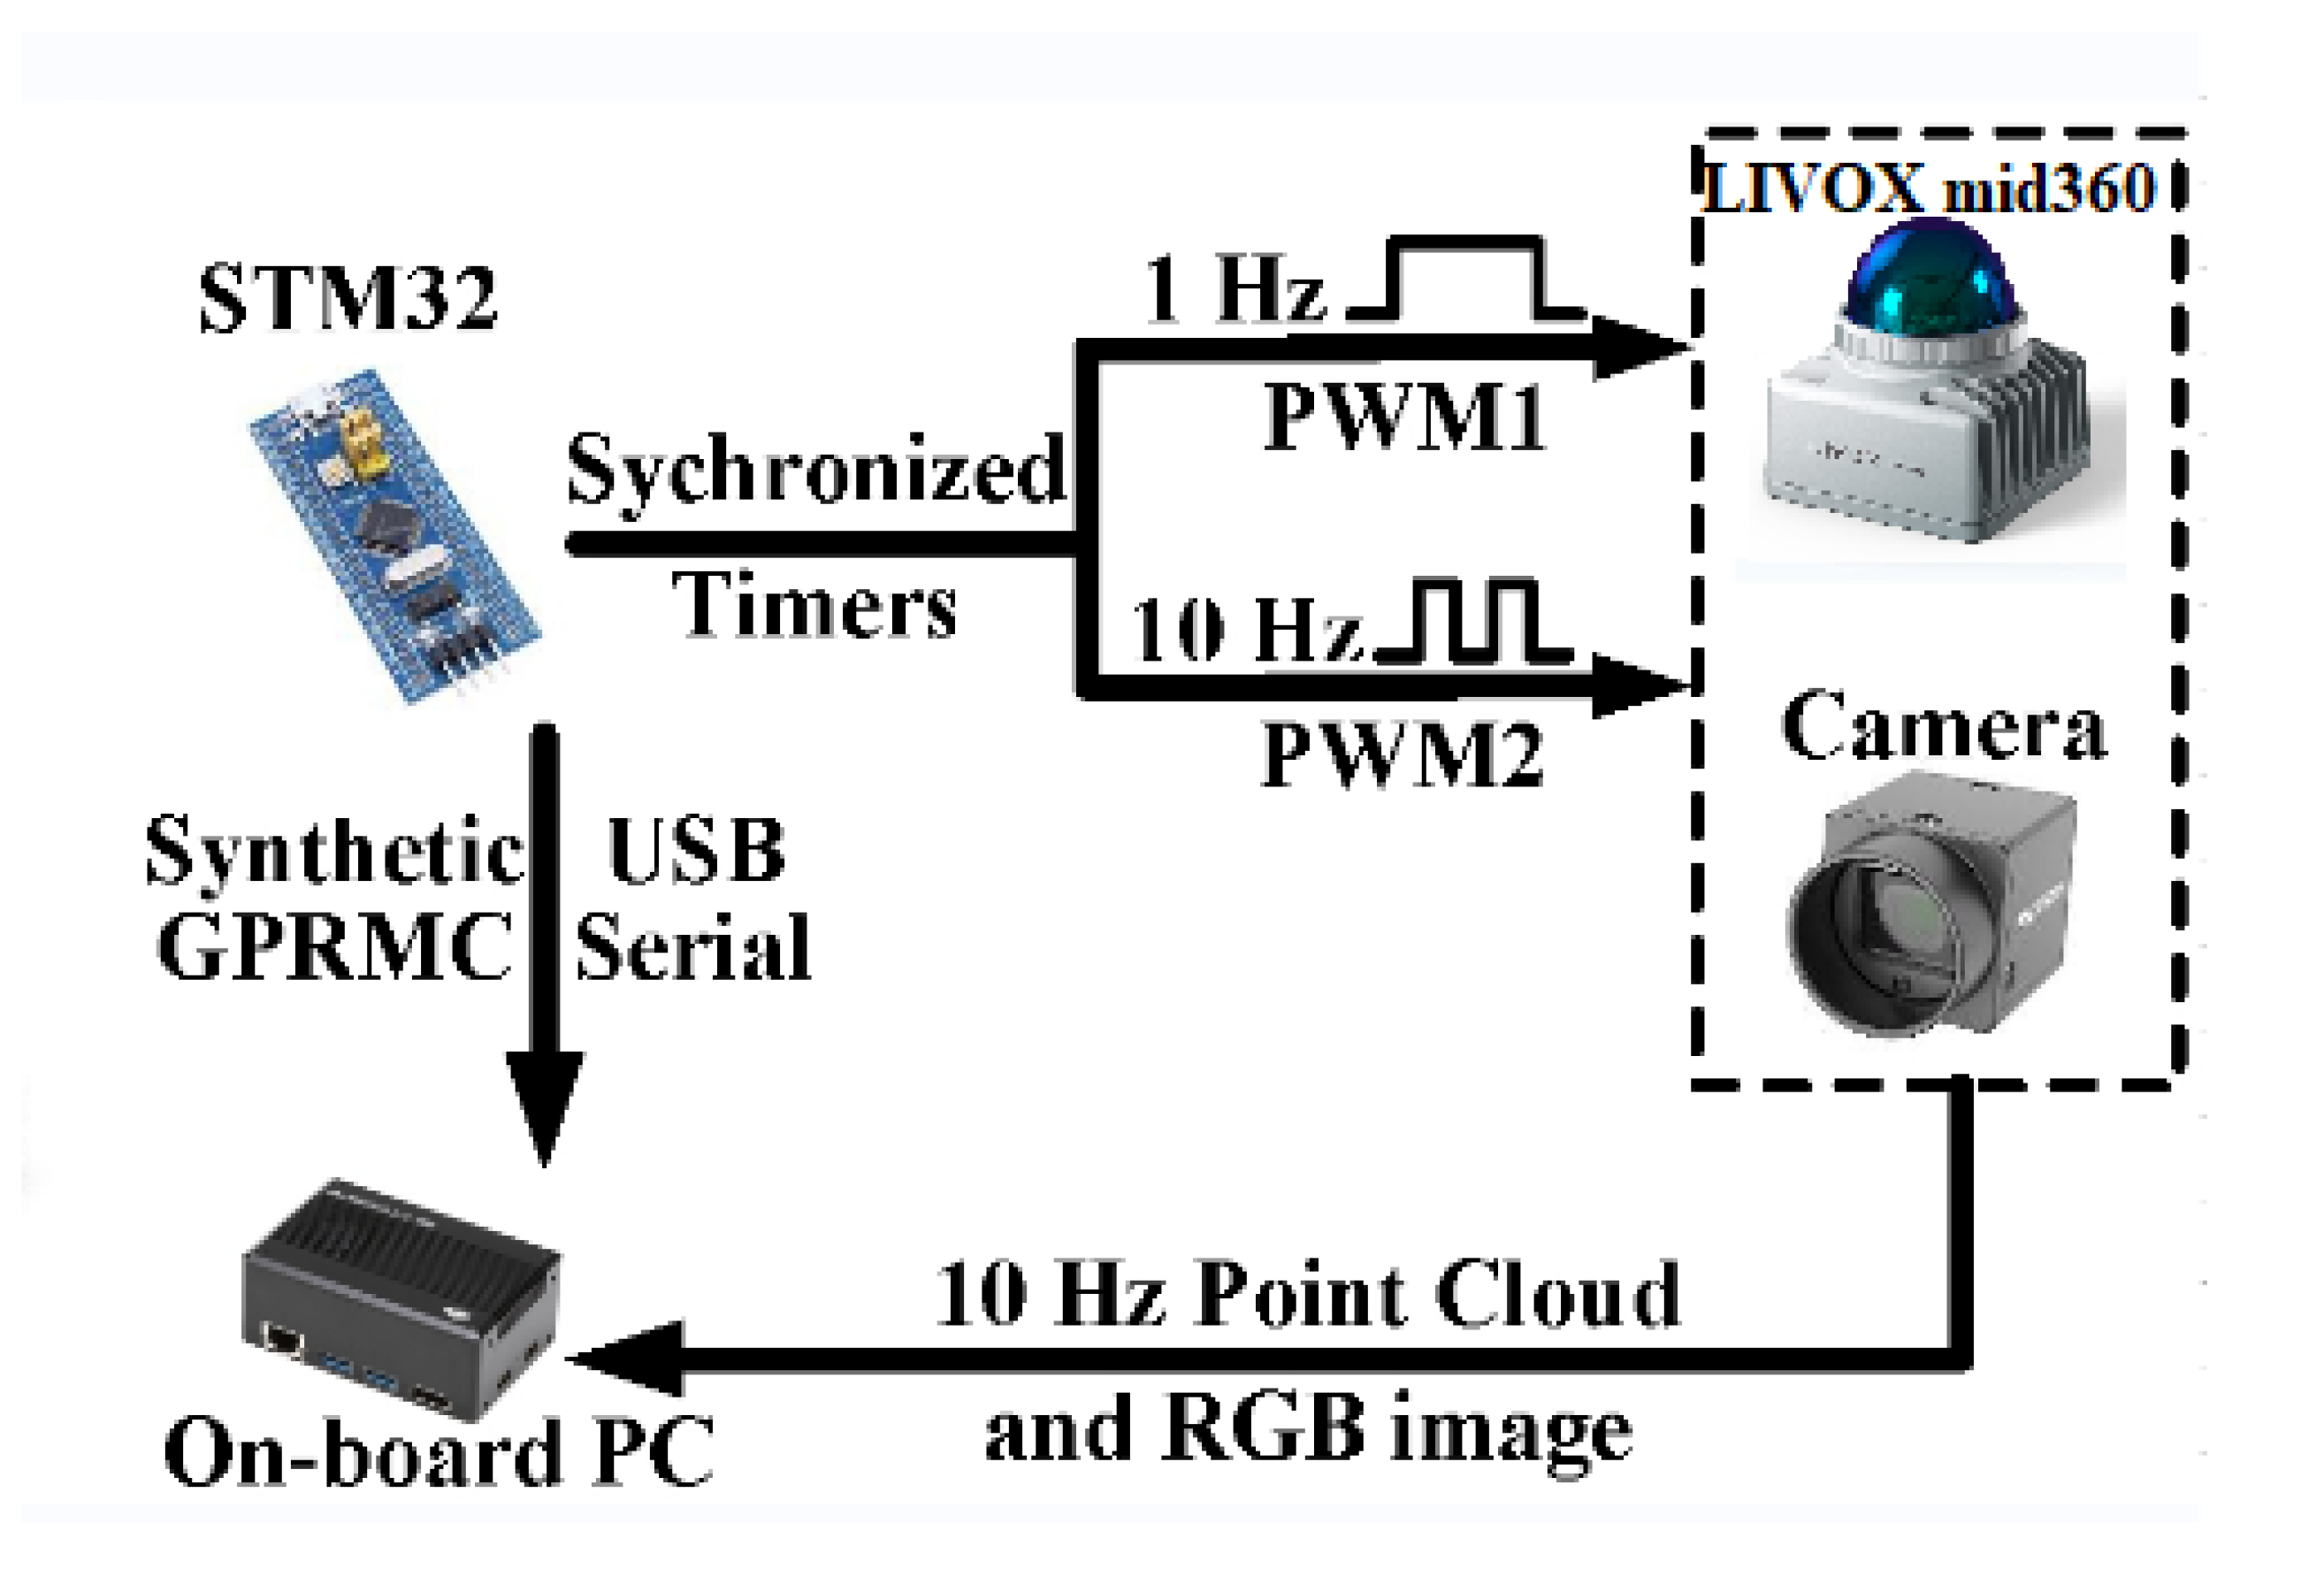
Figure 8.
Optimization results.
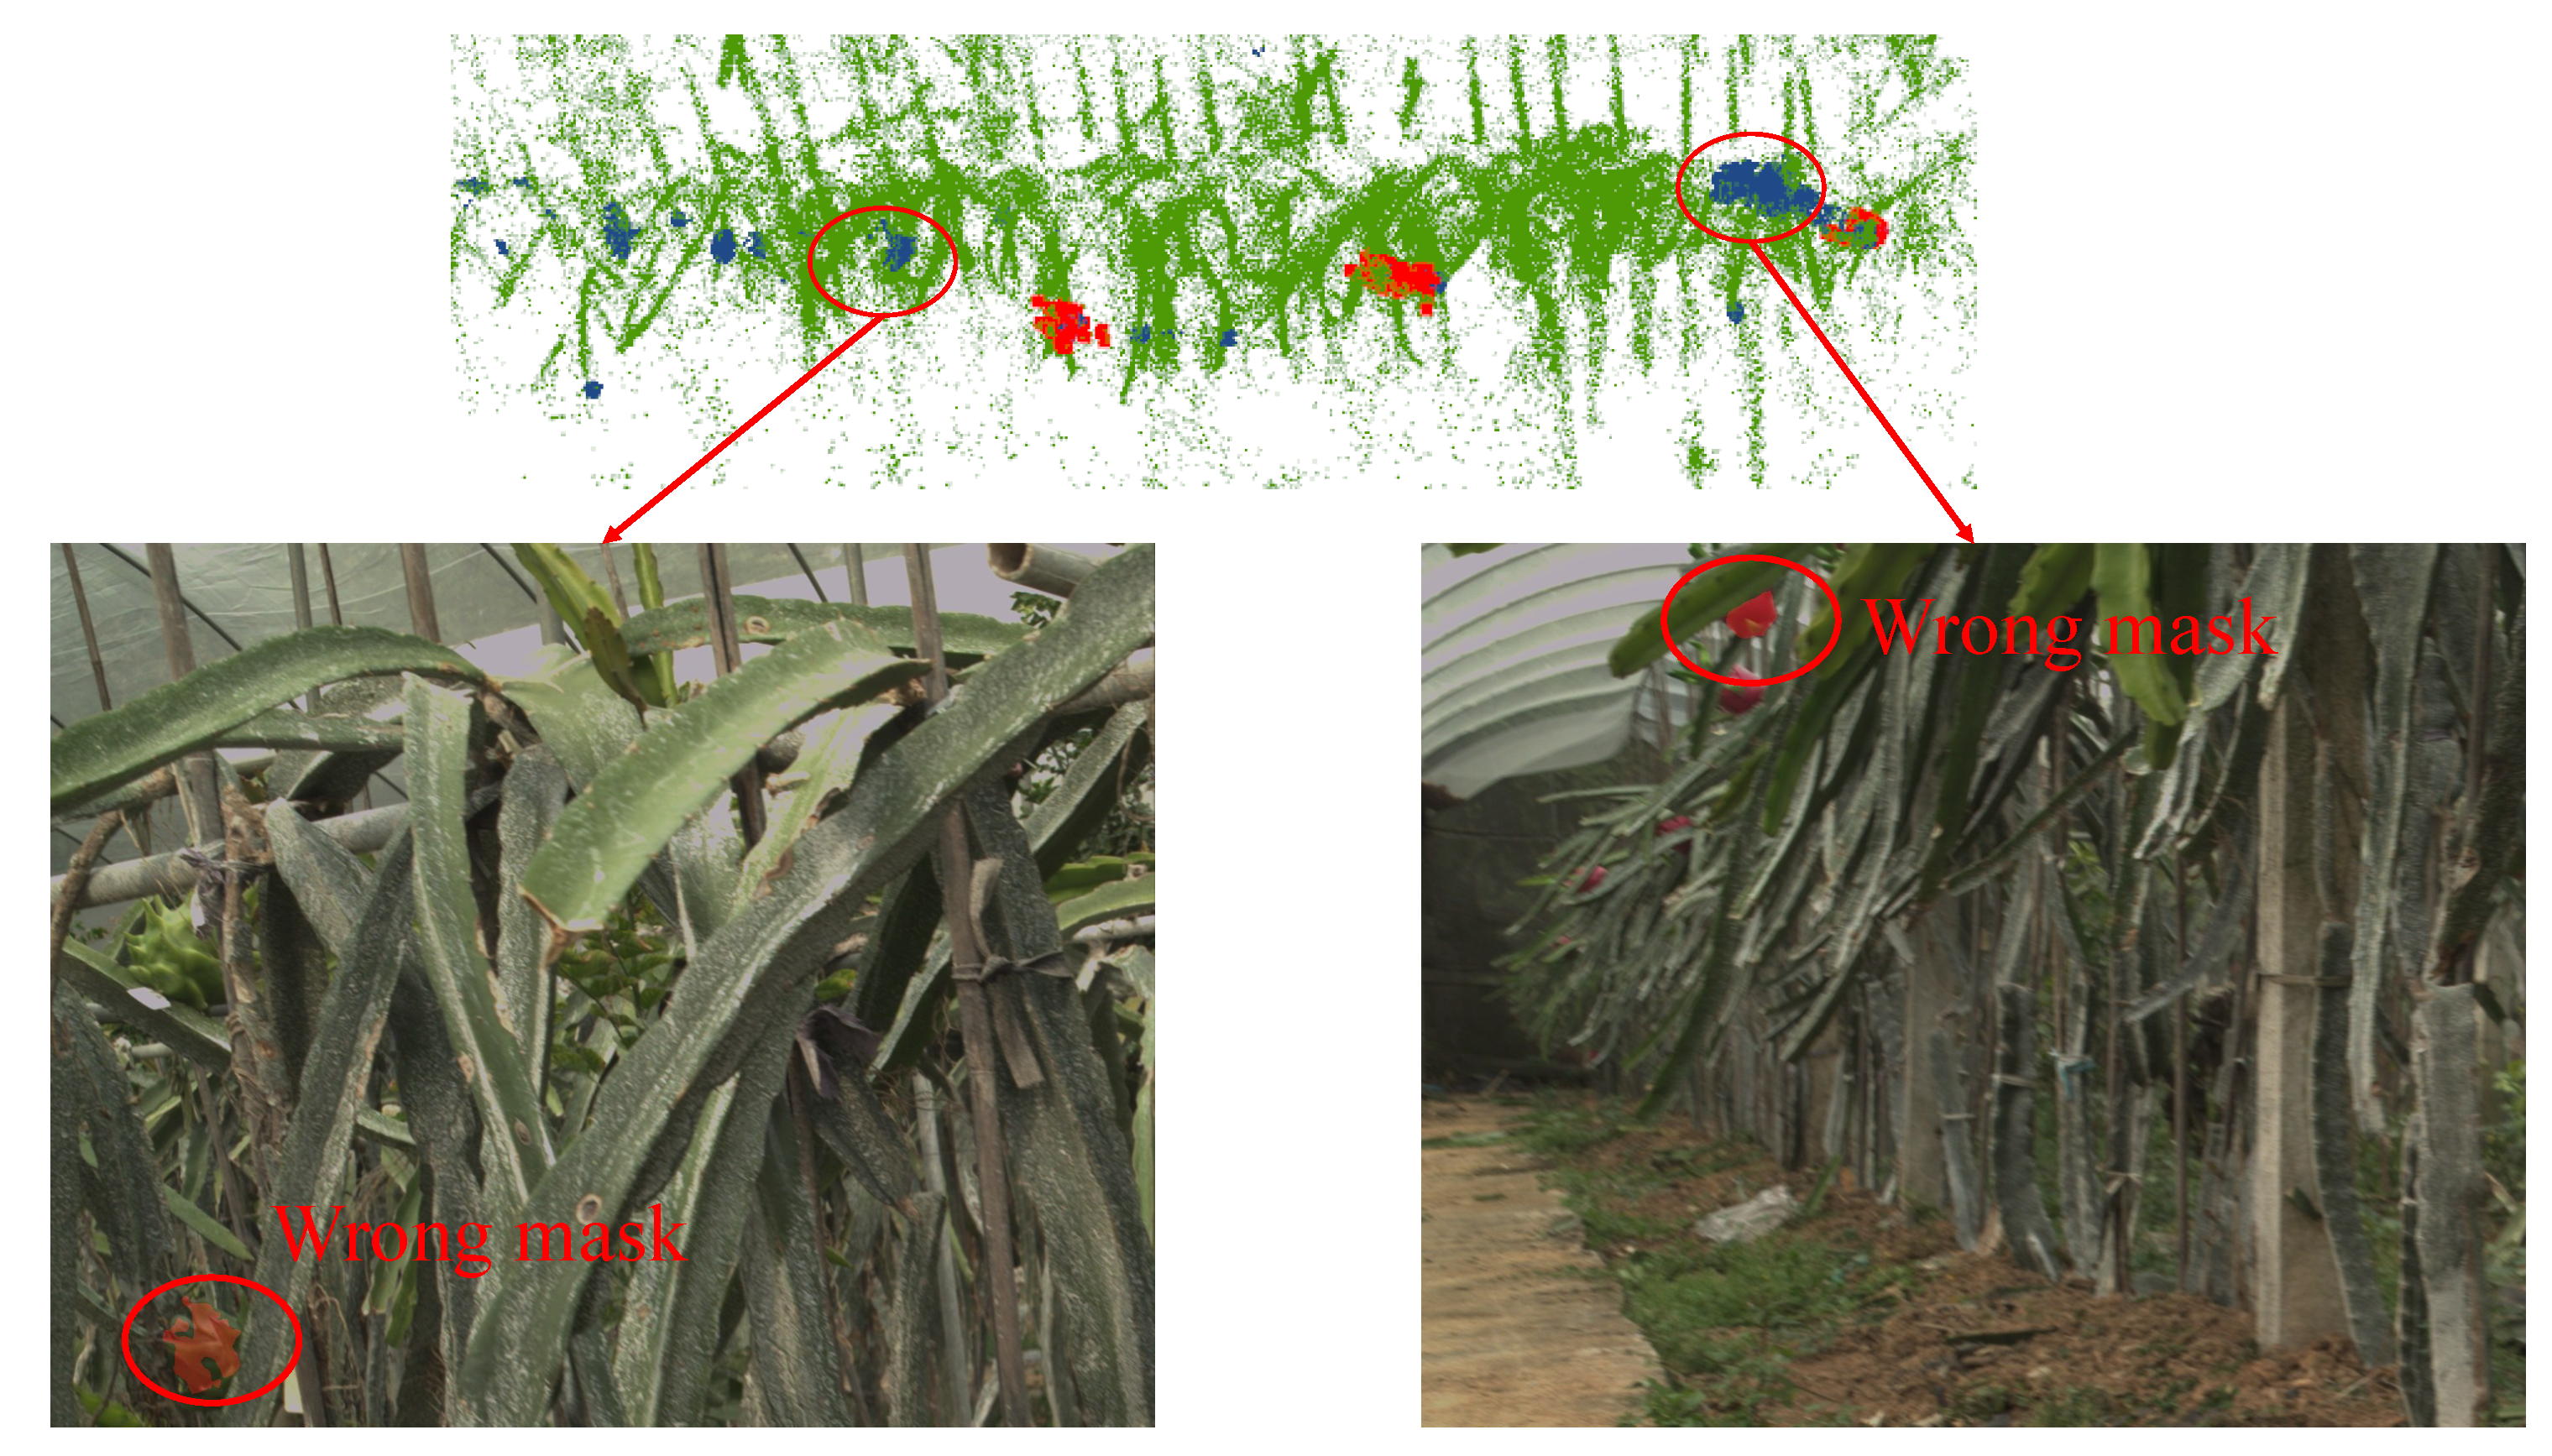
Figure 9.
The experiments platform.
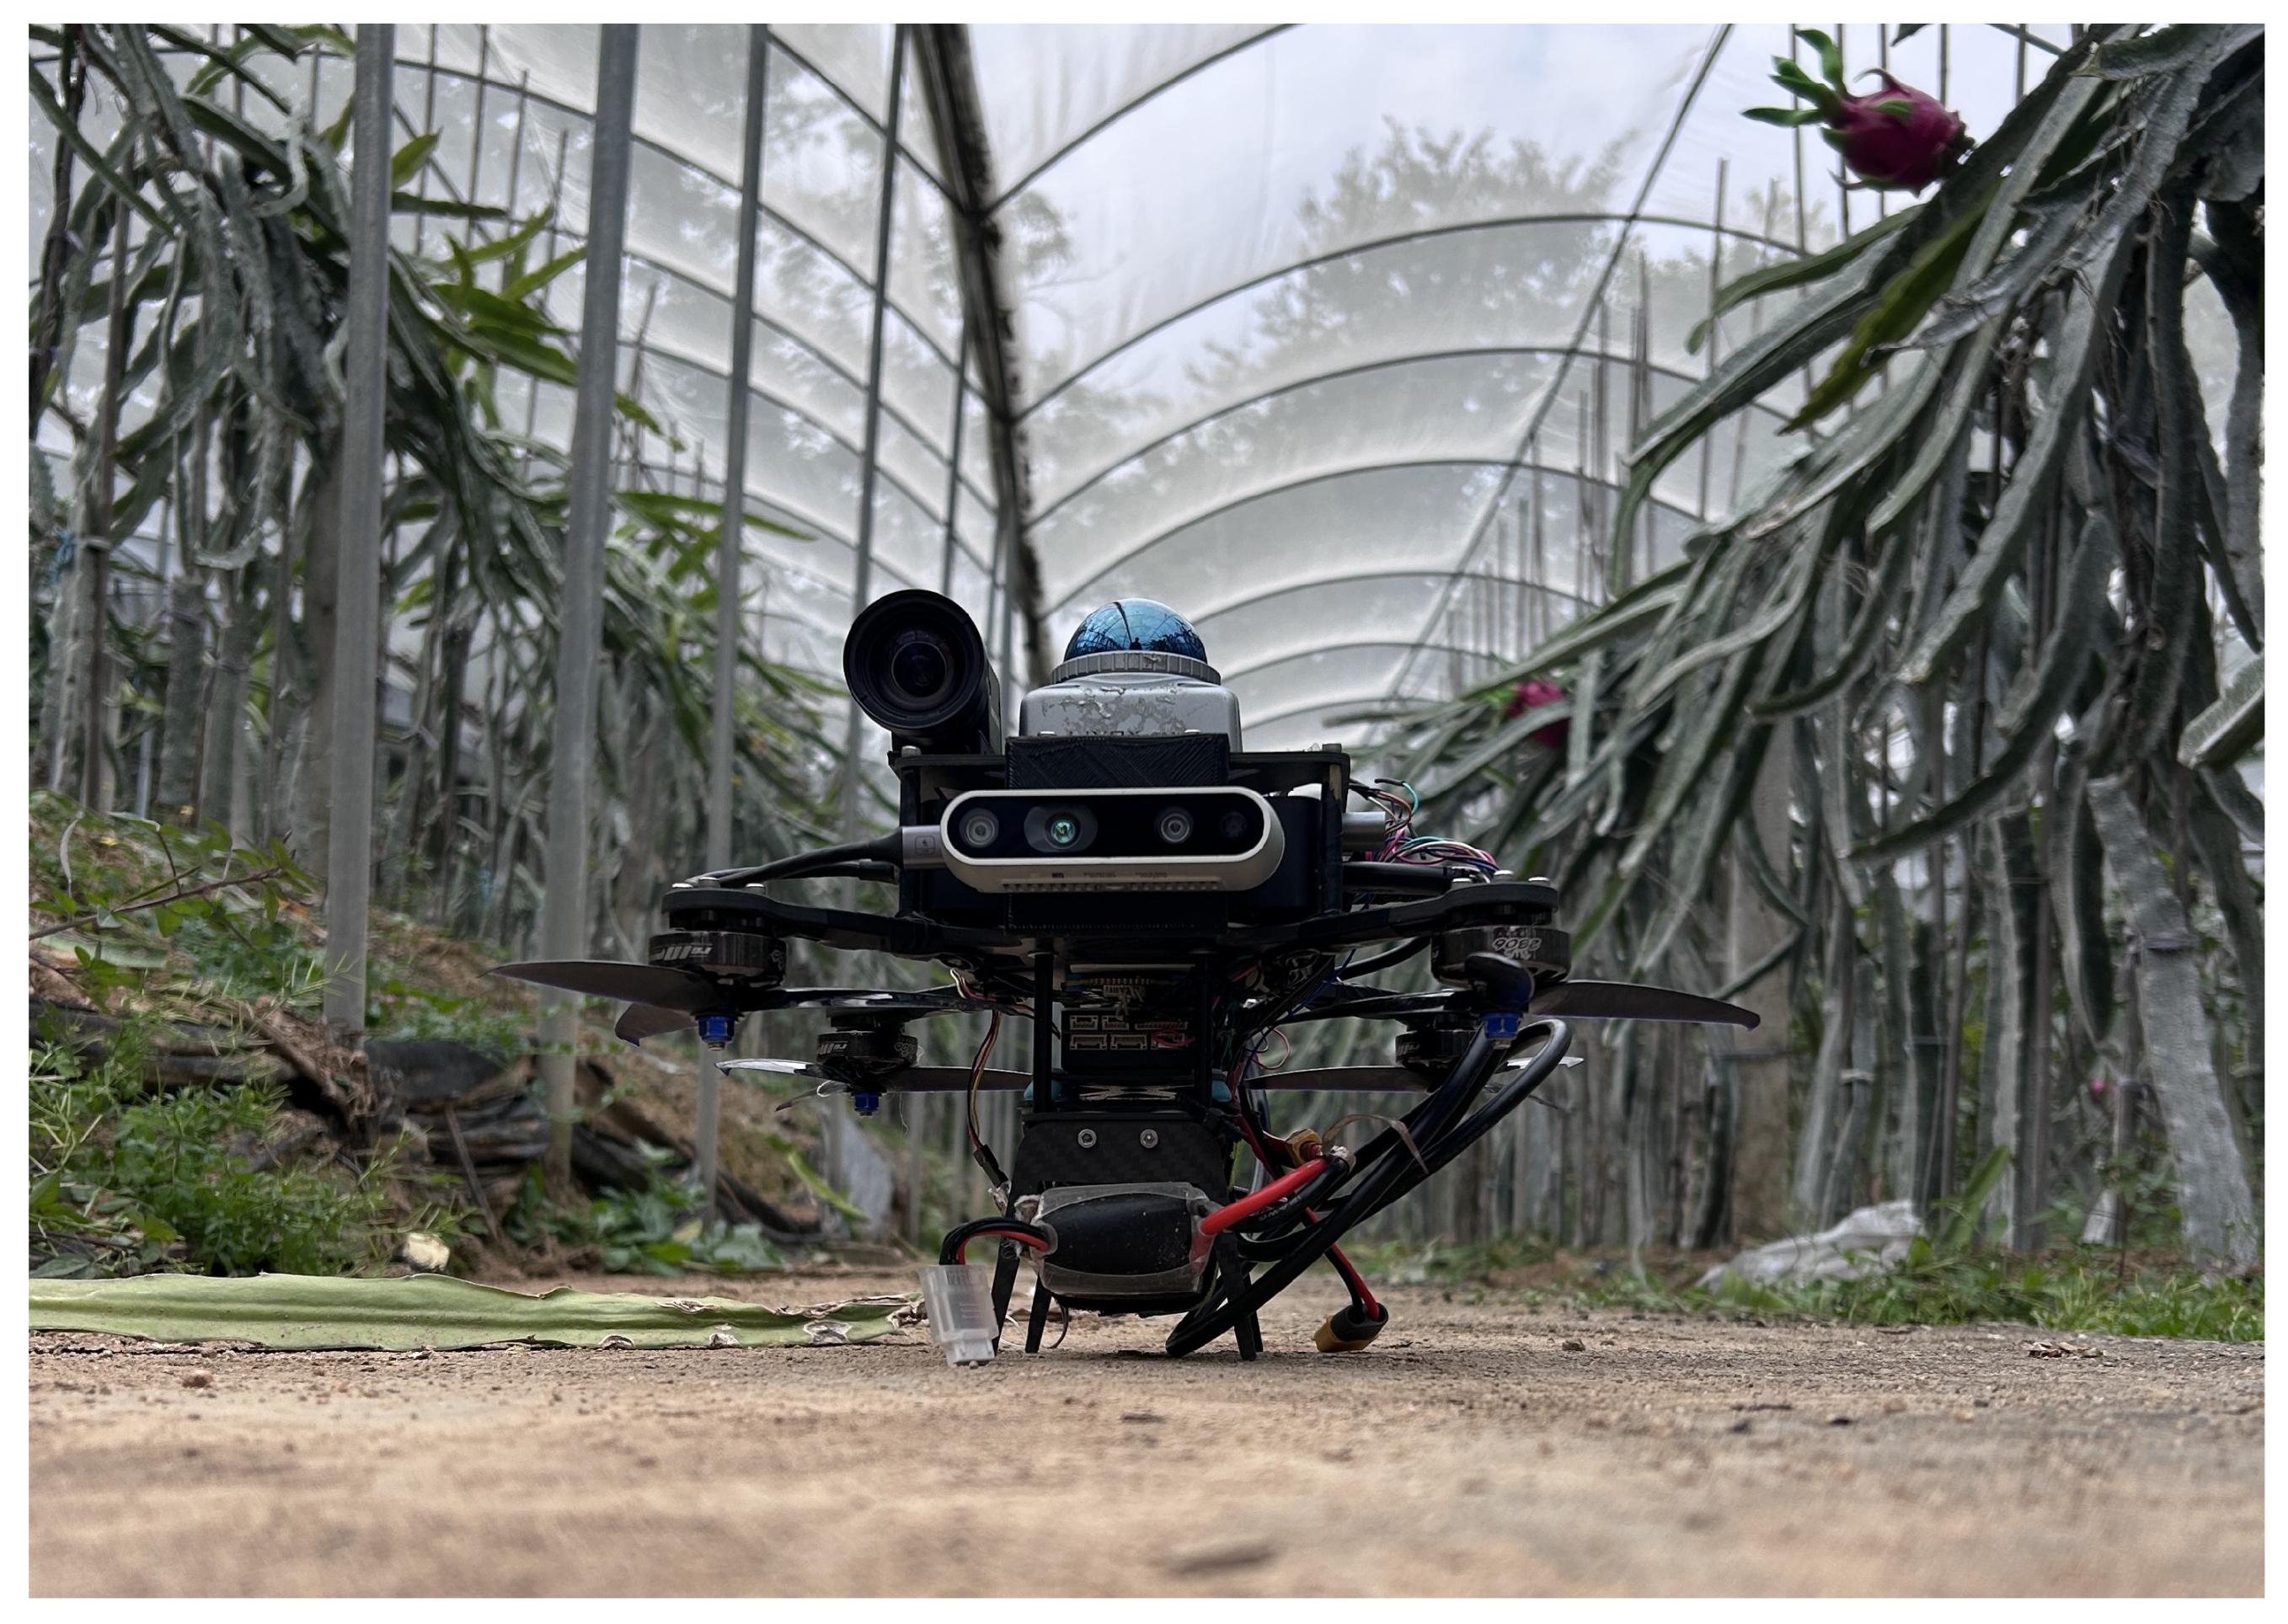
Figure 10.
Comparison of Segmentation Effects.
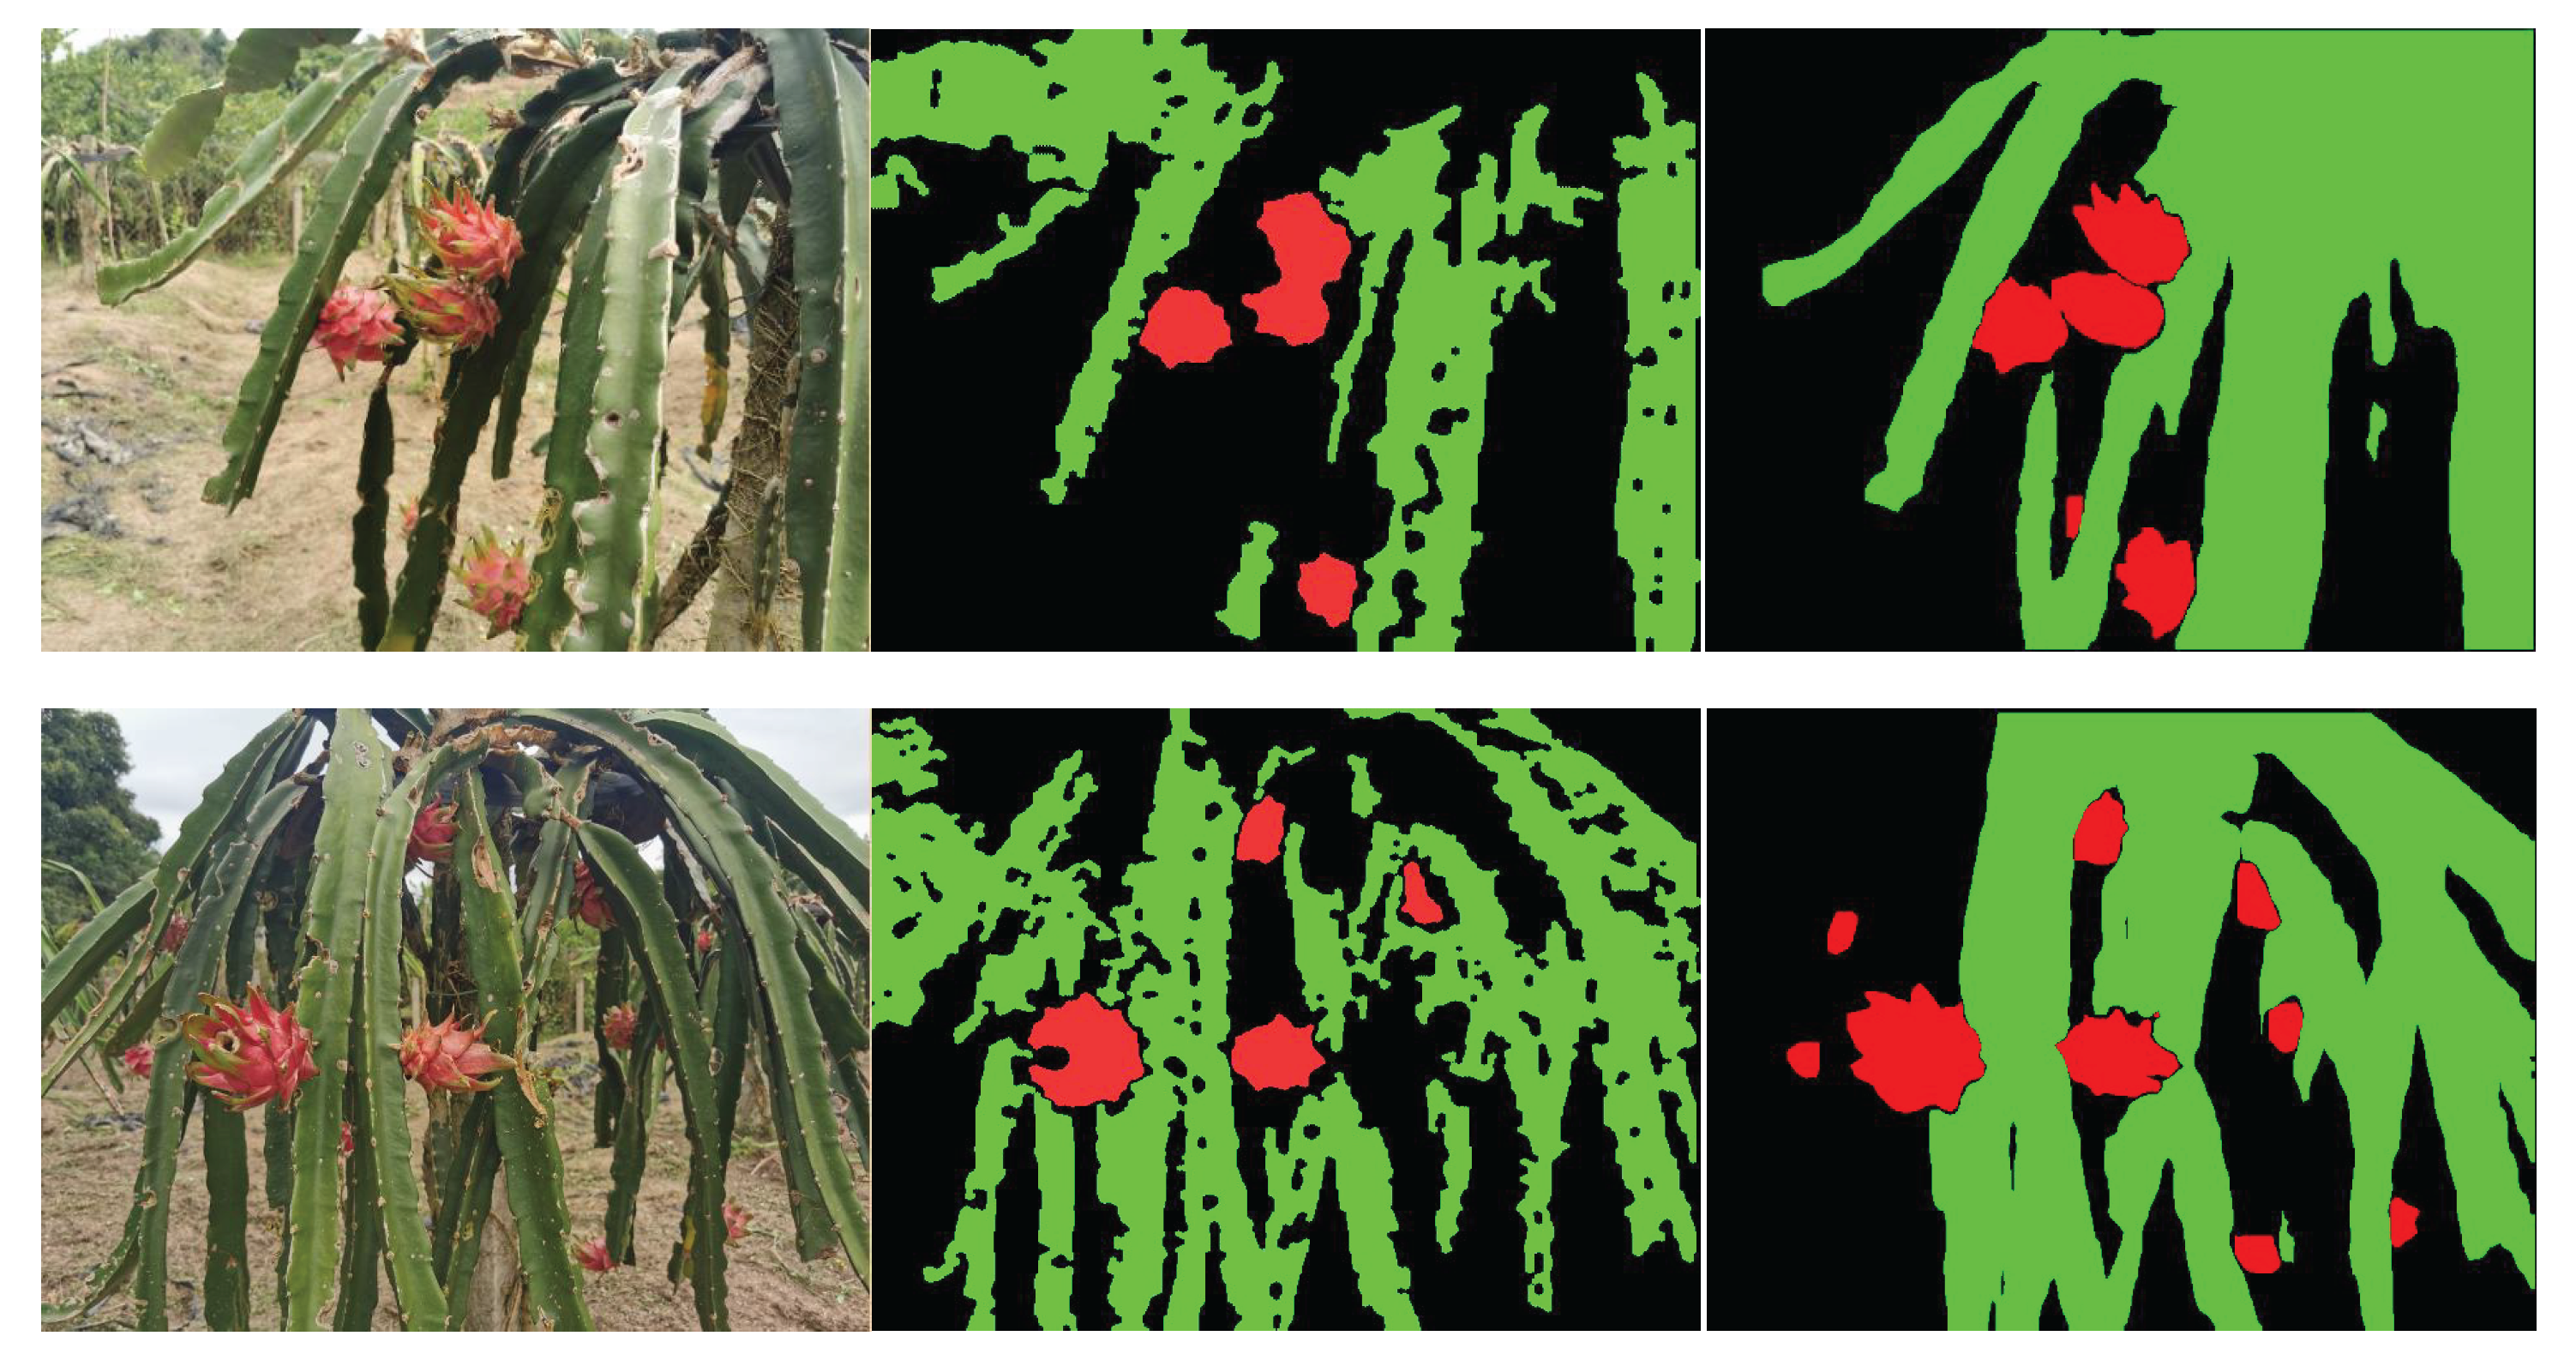
Figure 11.
Experimental environment setup.
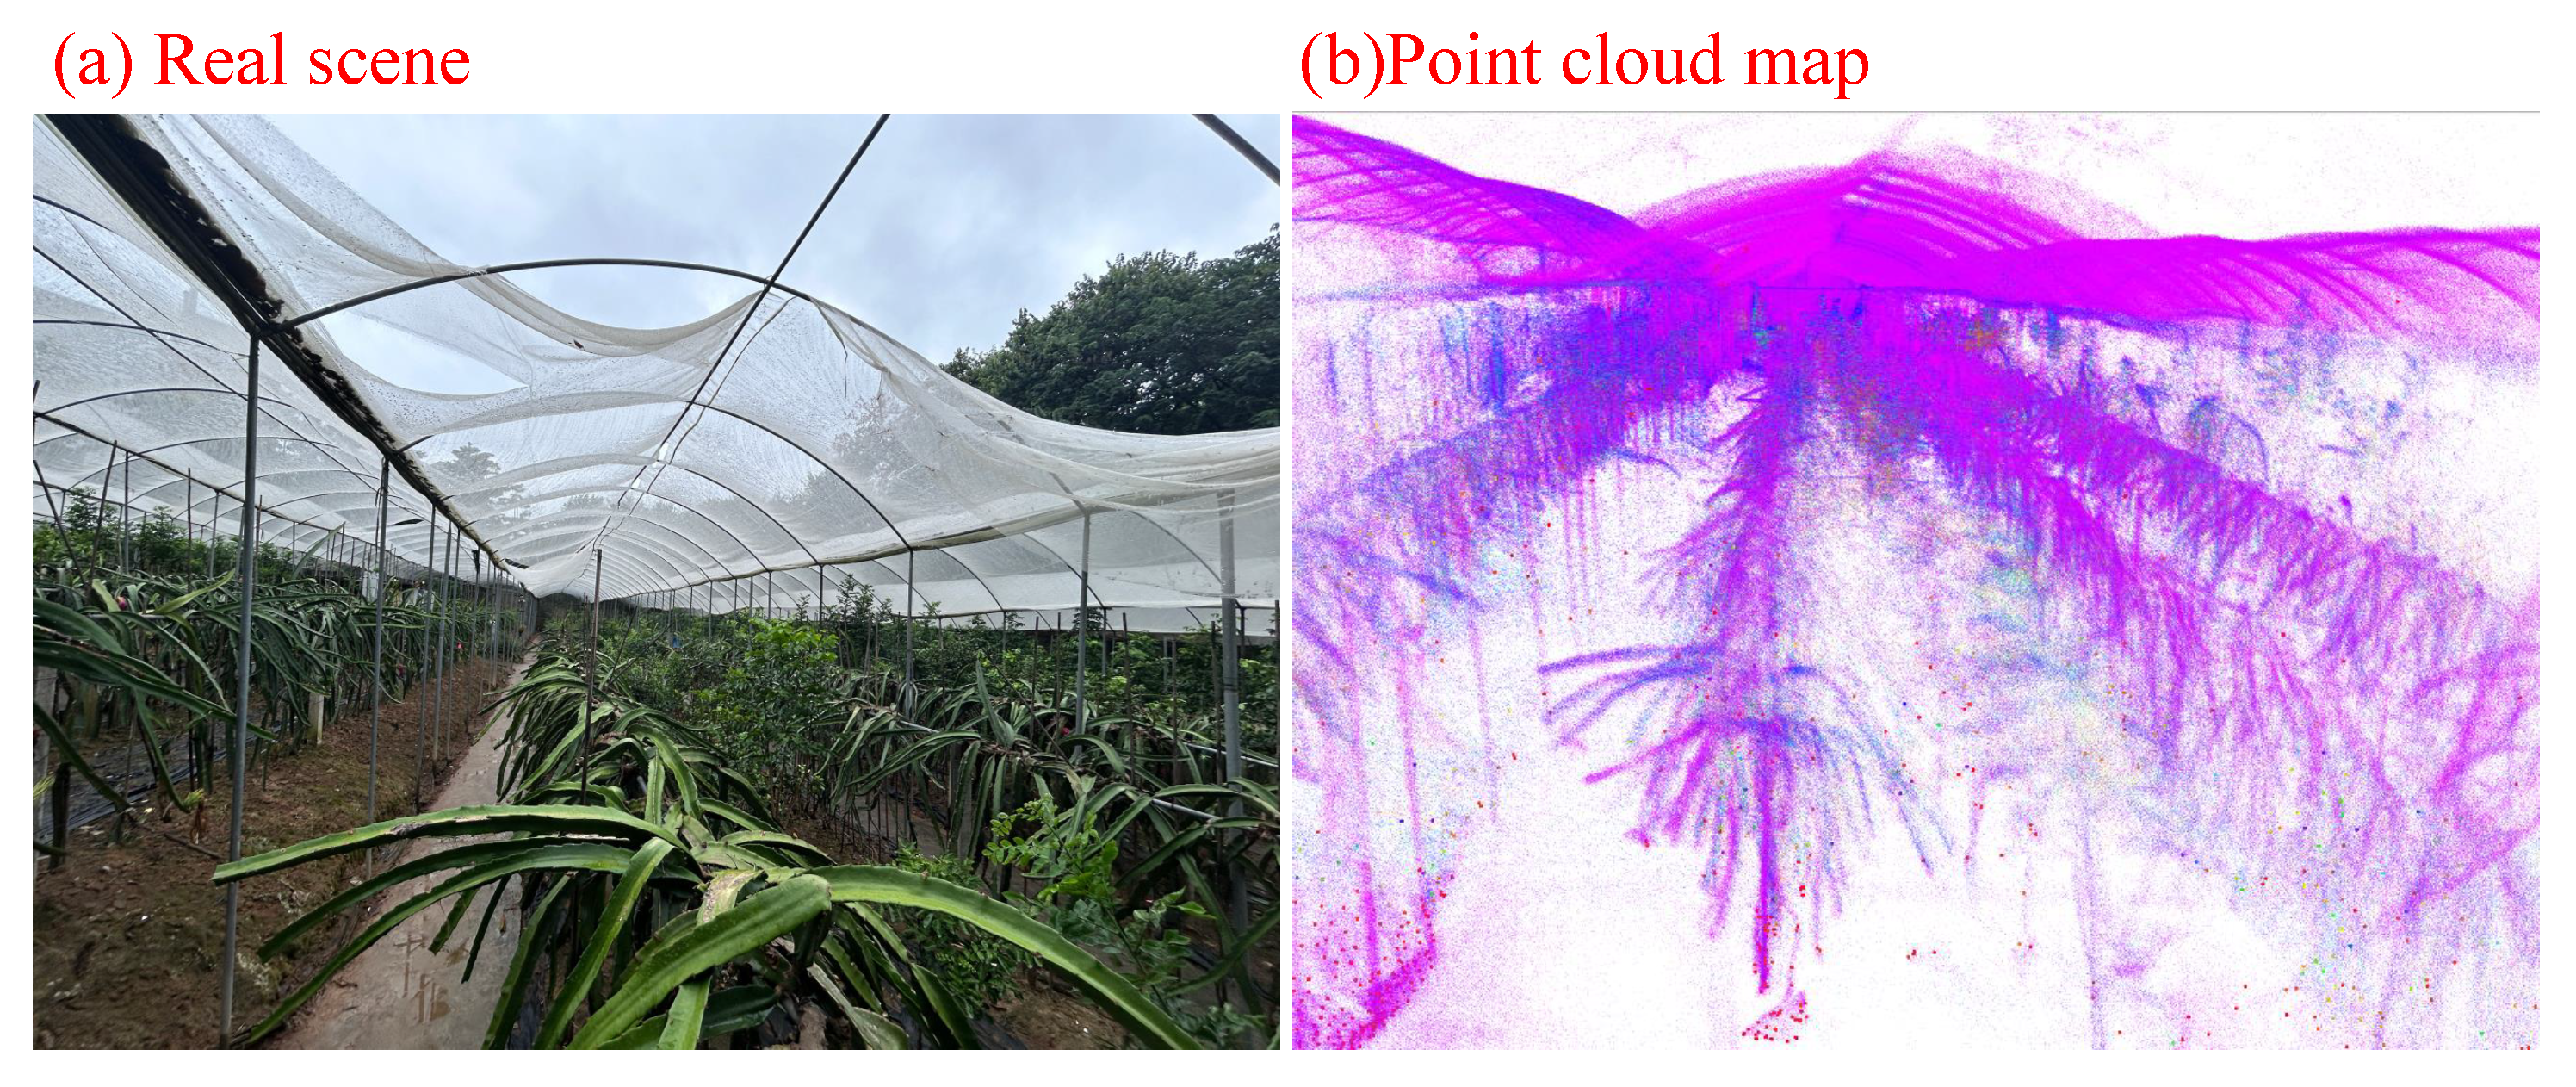
Figure 12.
Small-scale point cloud reconstruction results.
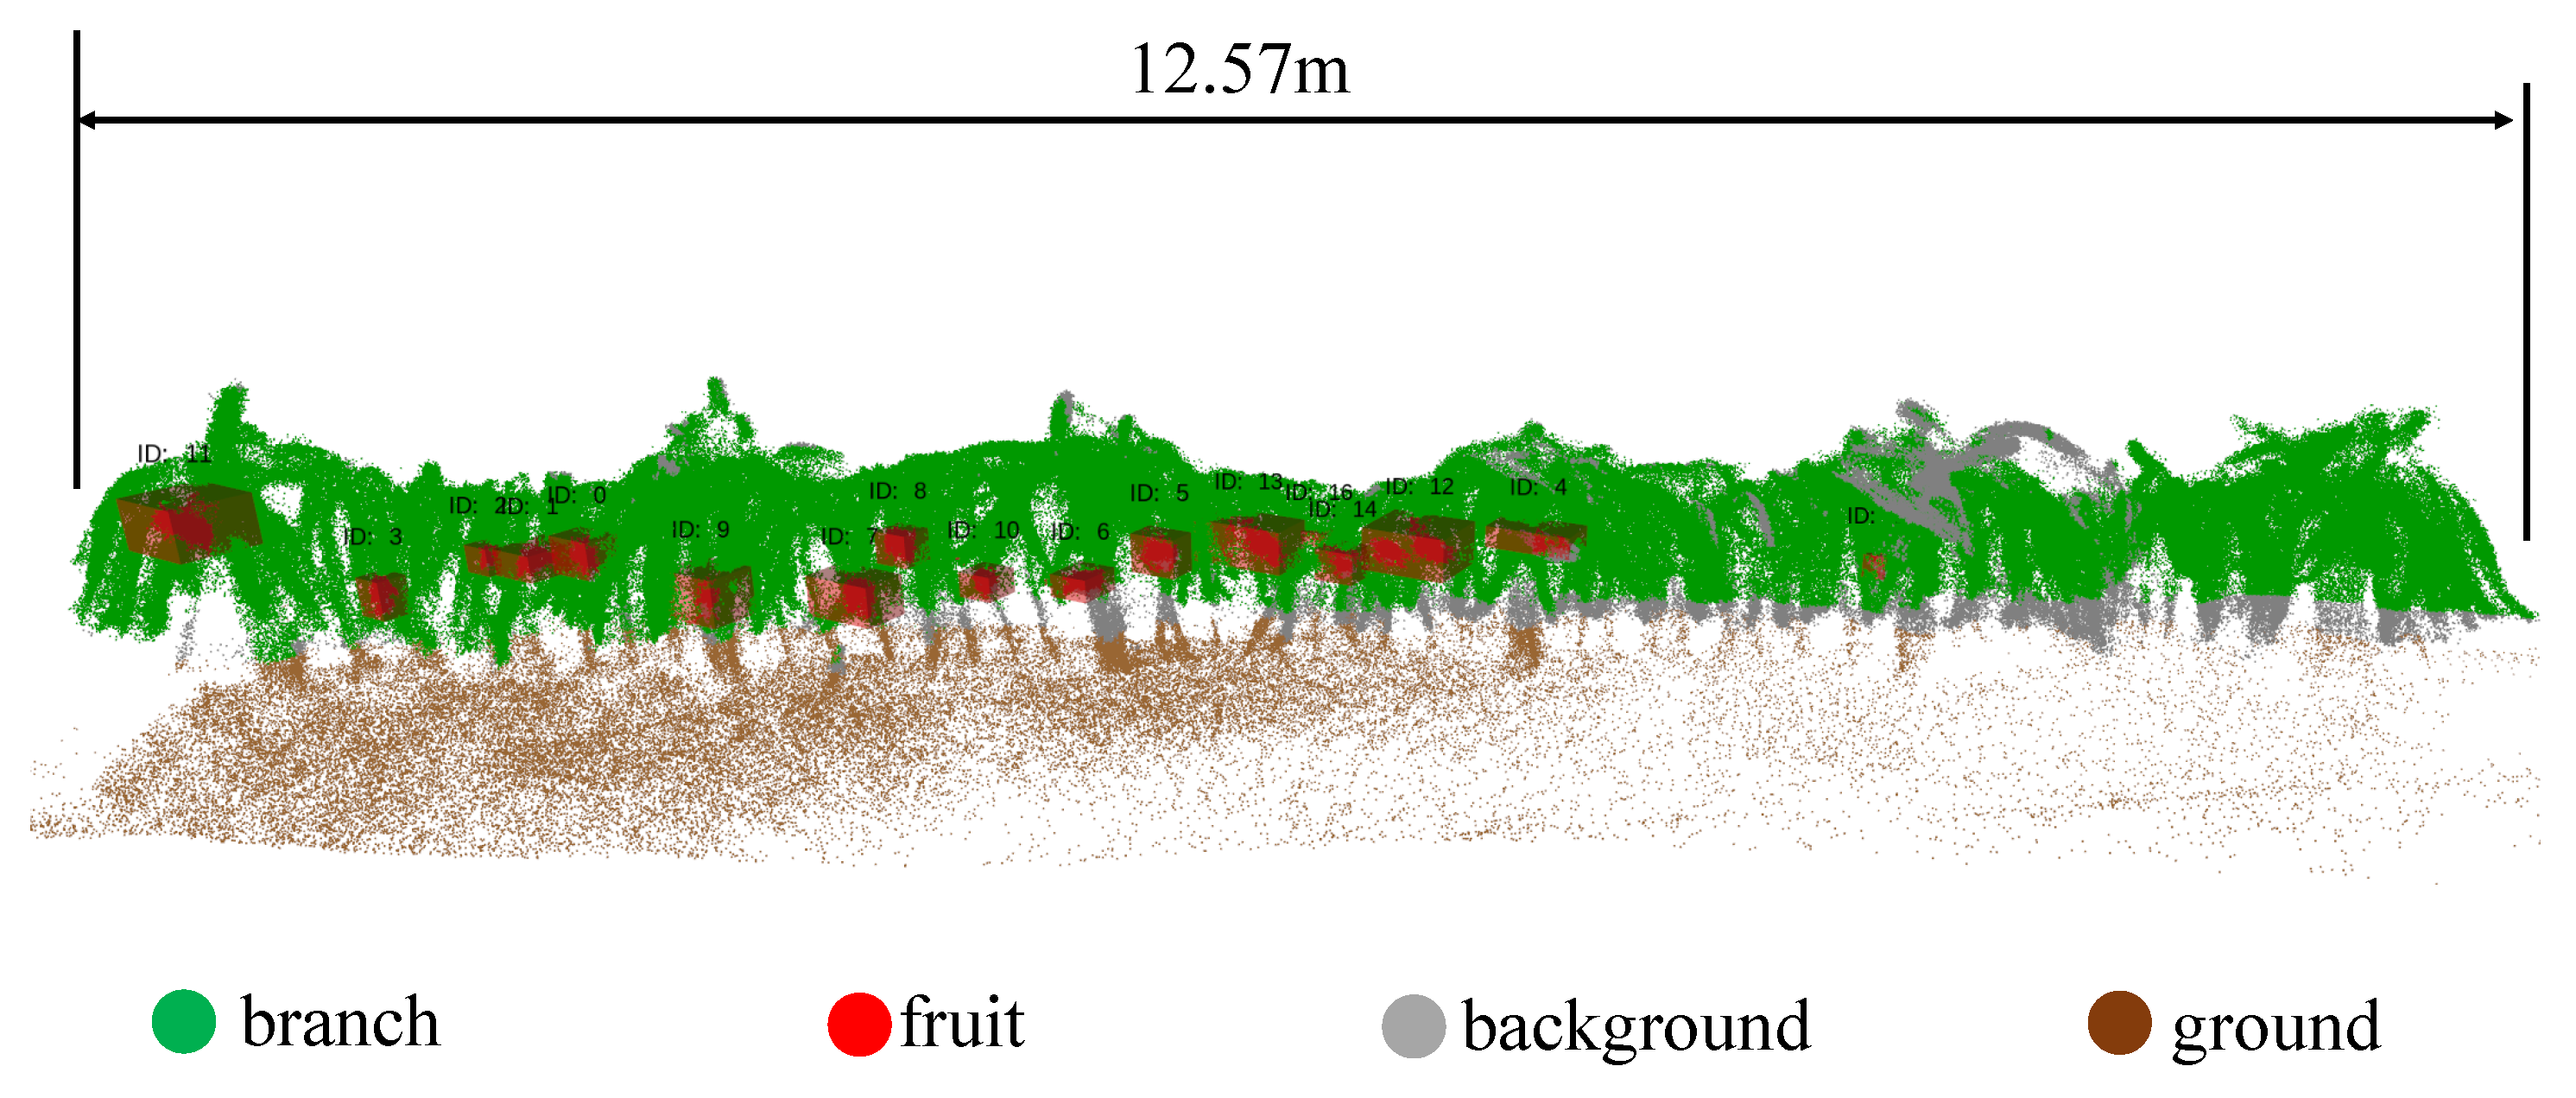
Figure 13.
Color-based point cloud preprocessing.
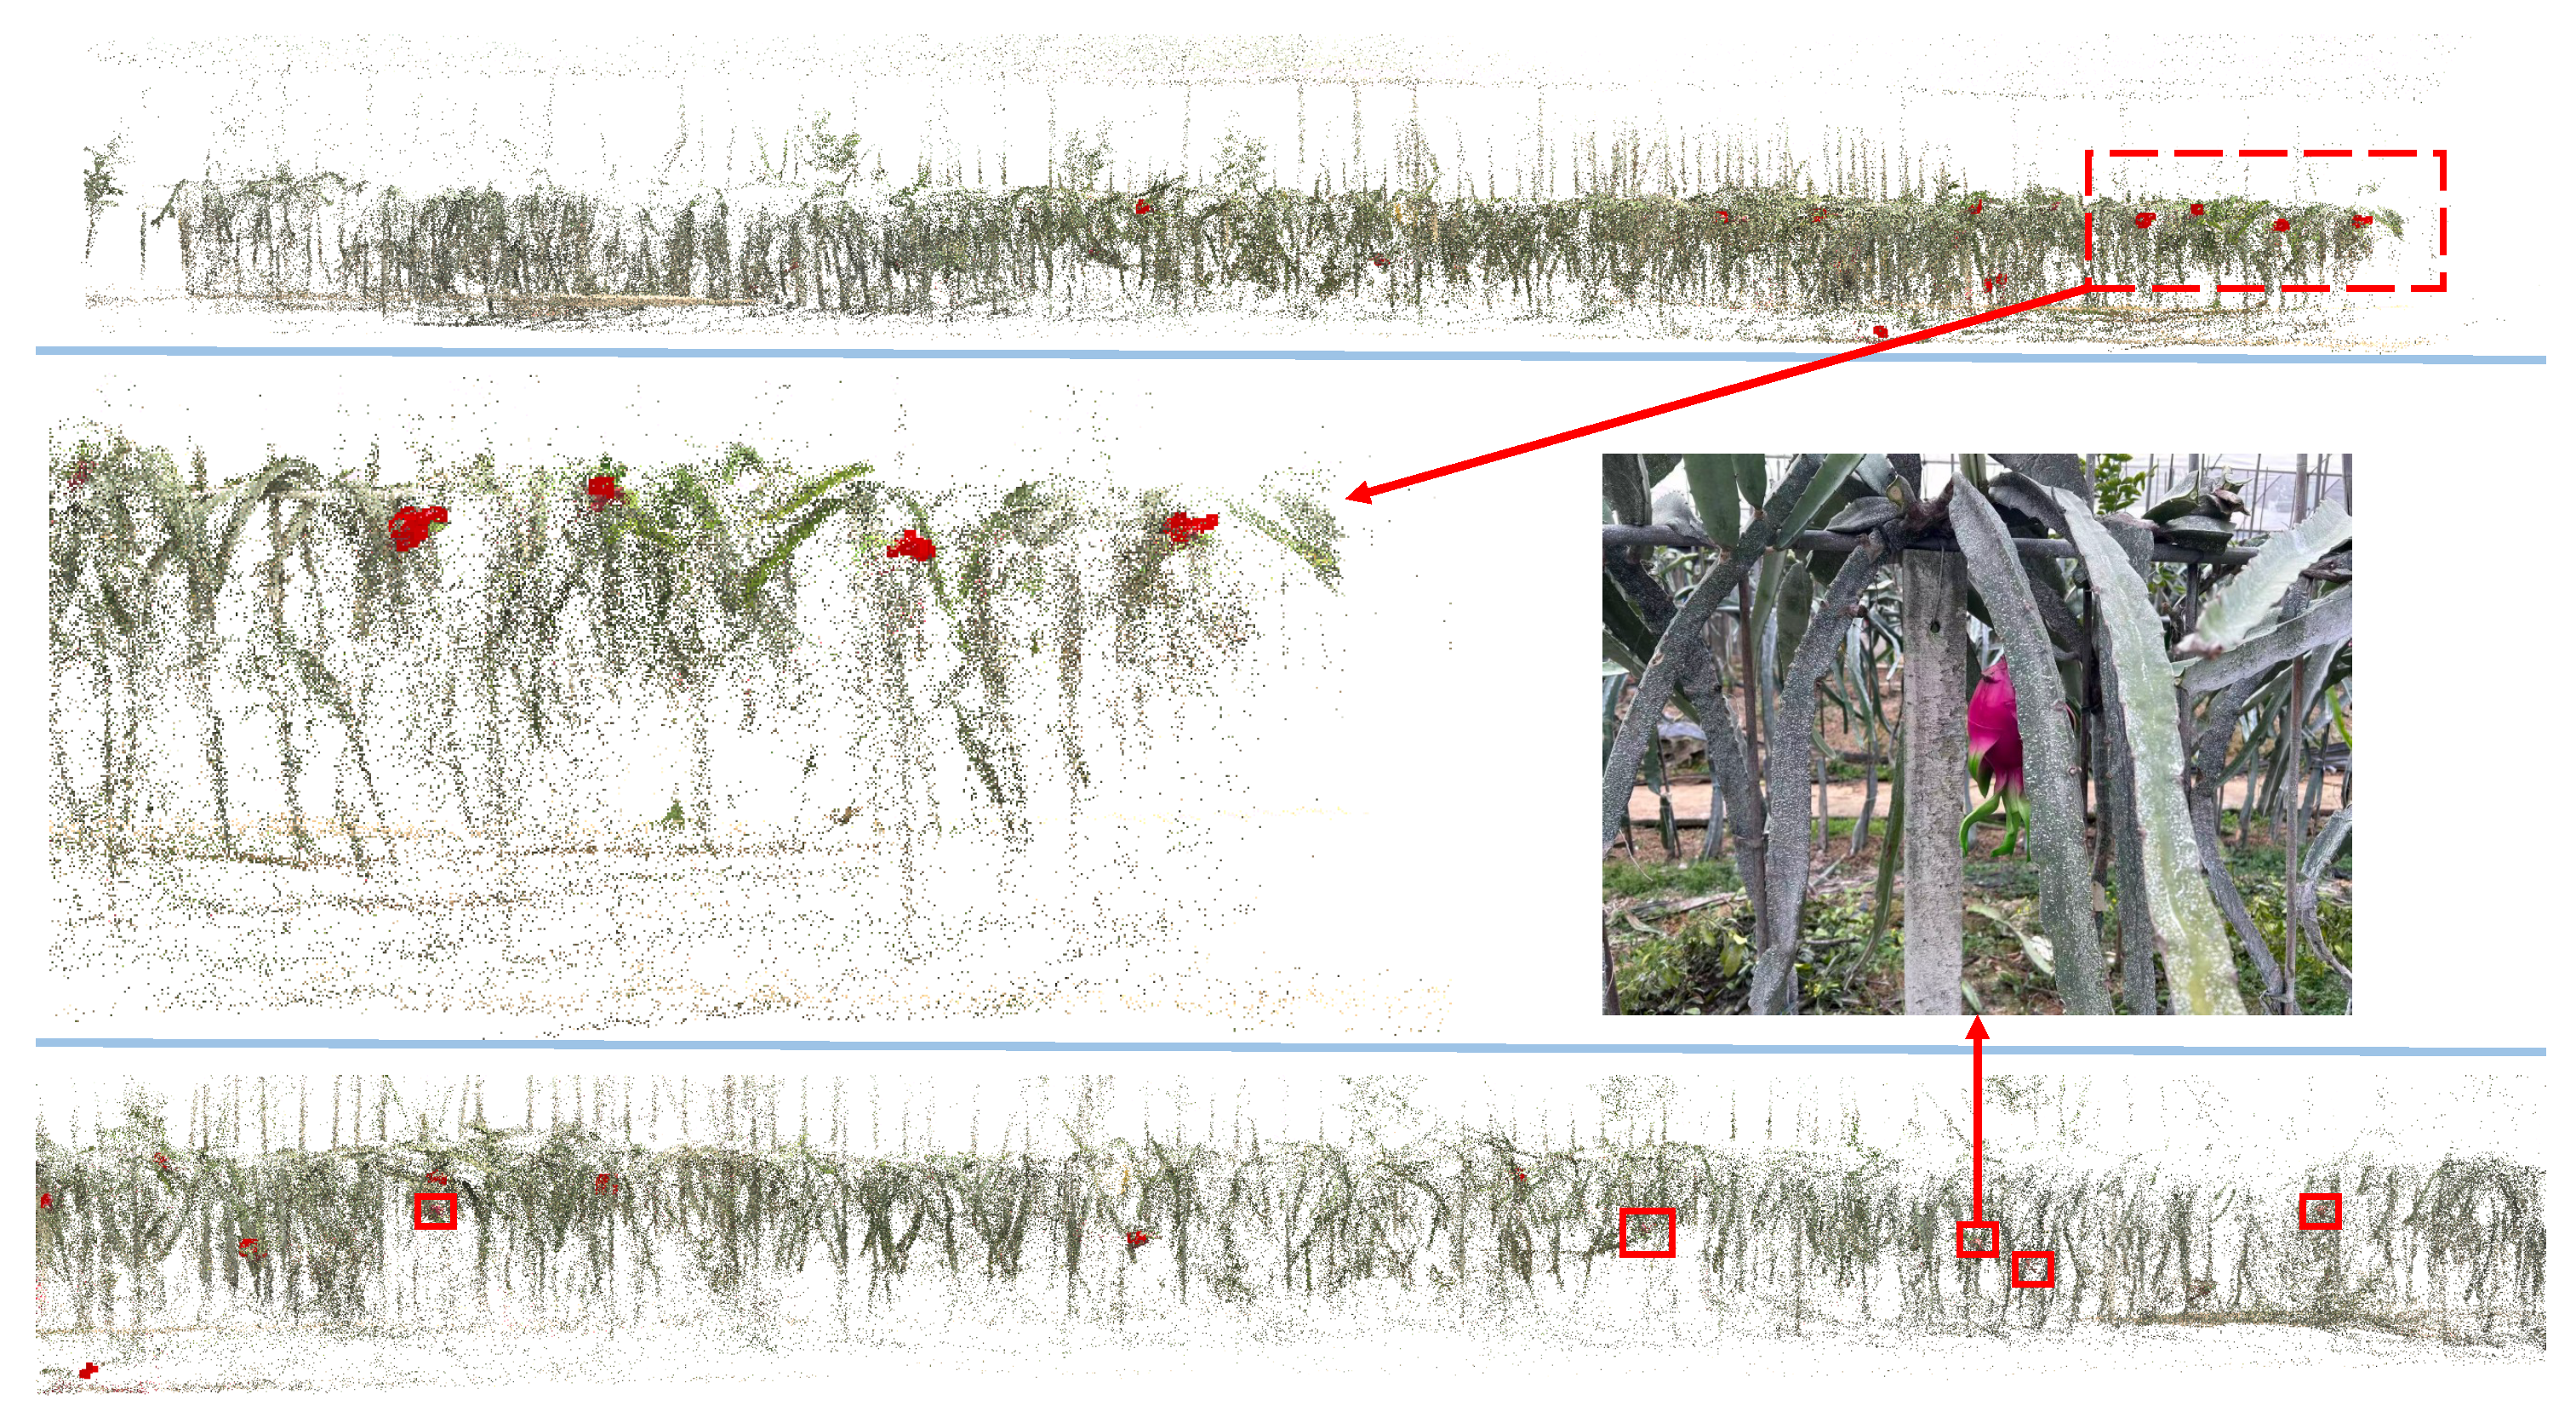
Figure 14.
Fruit clustering results.
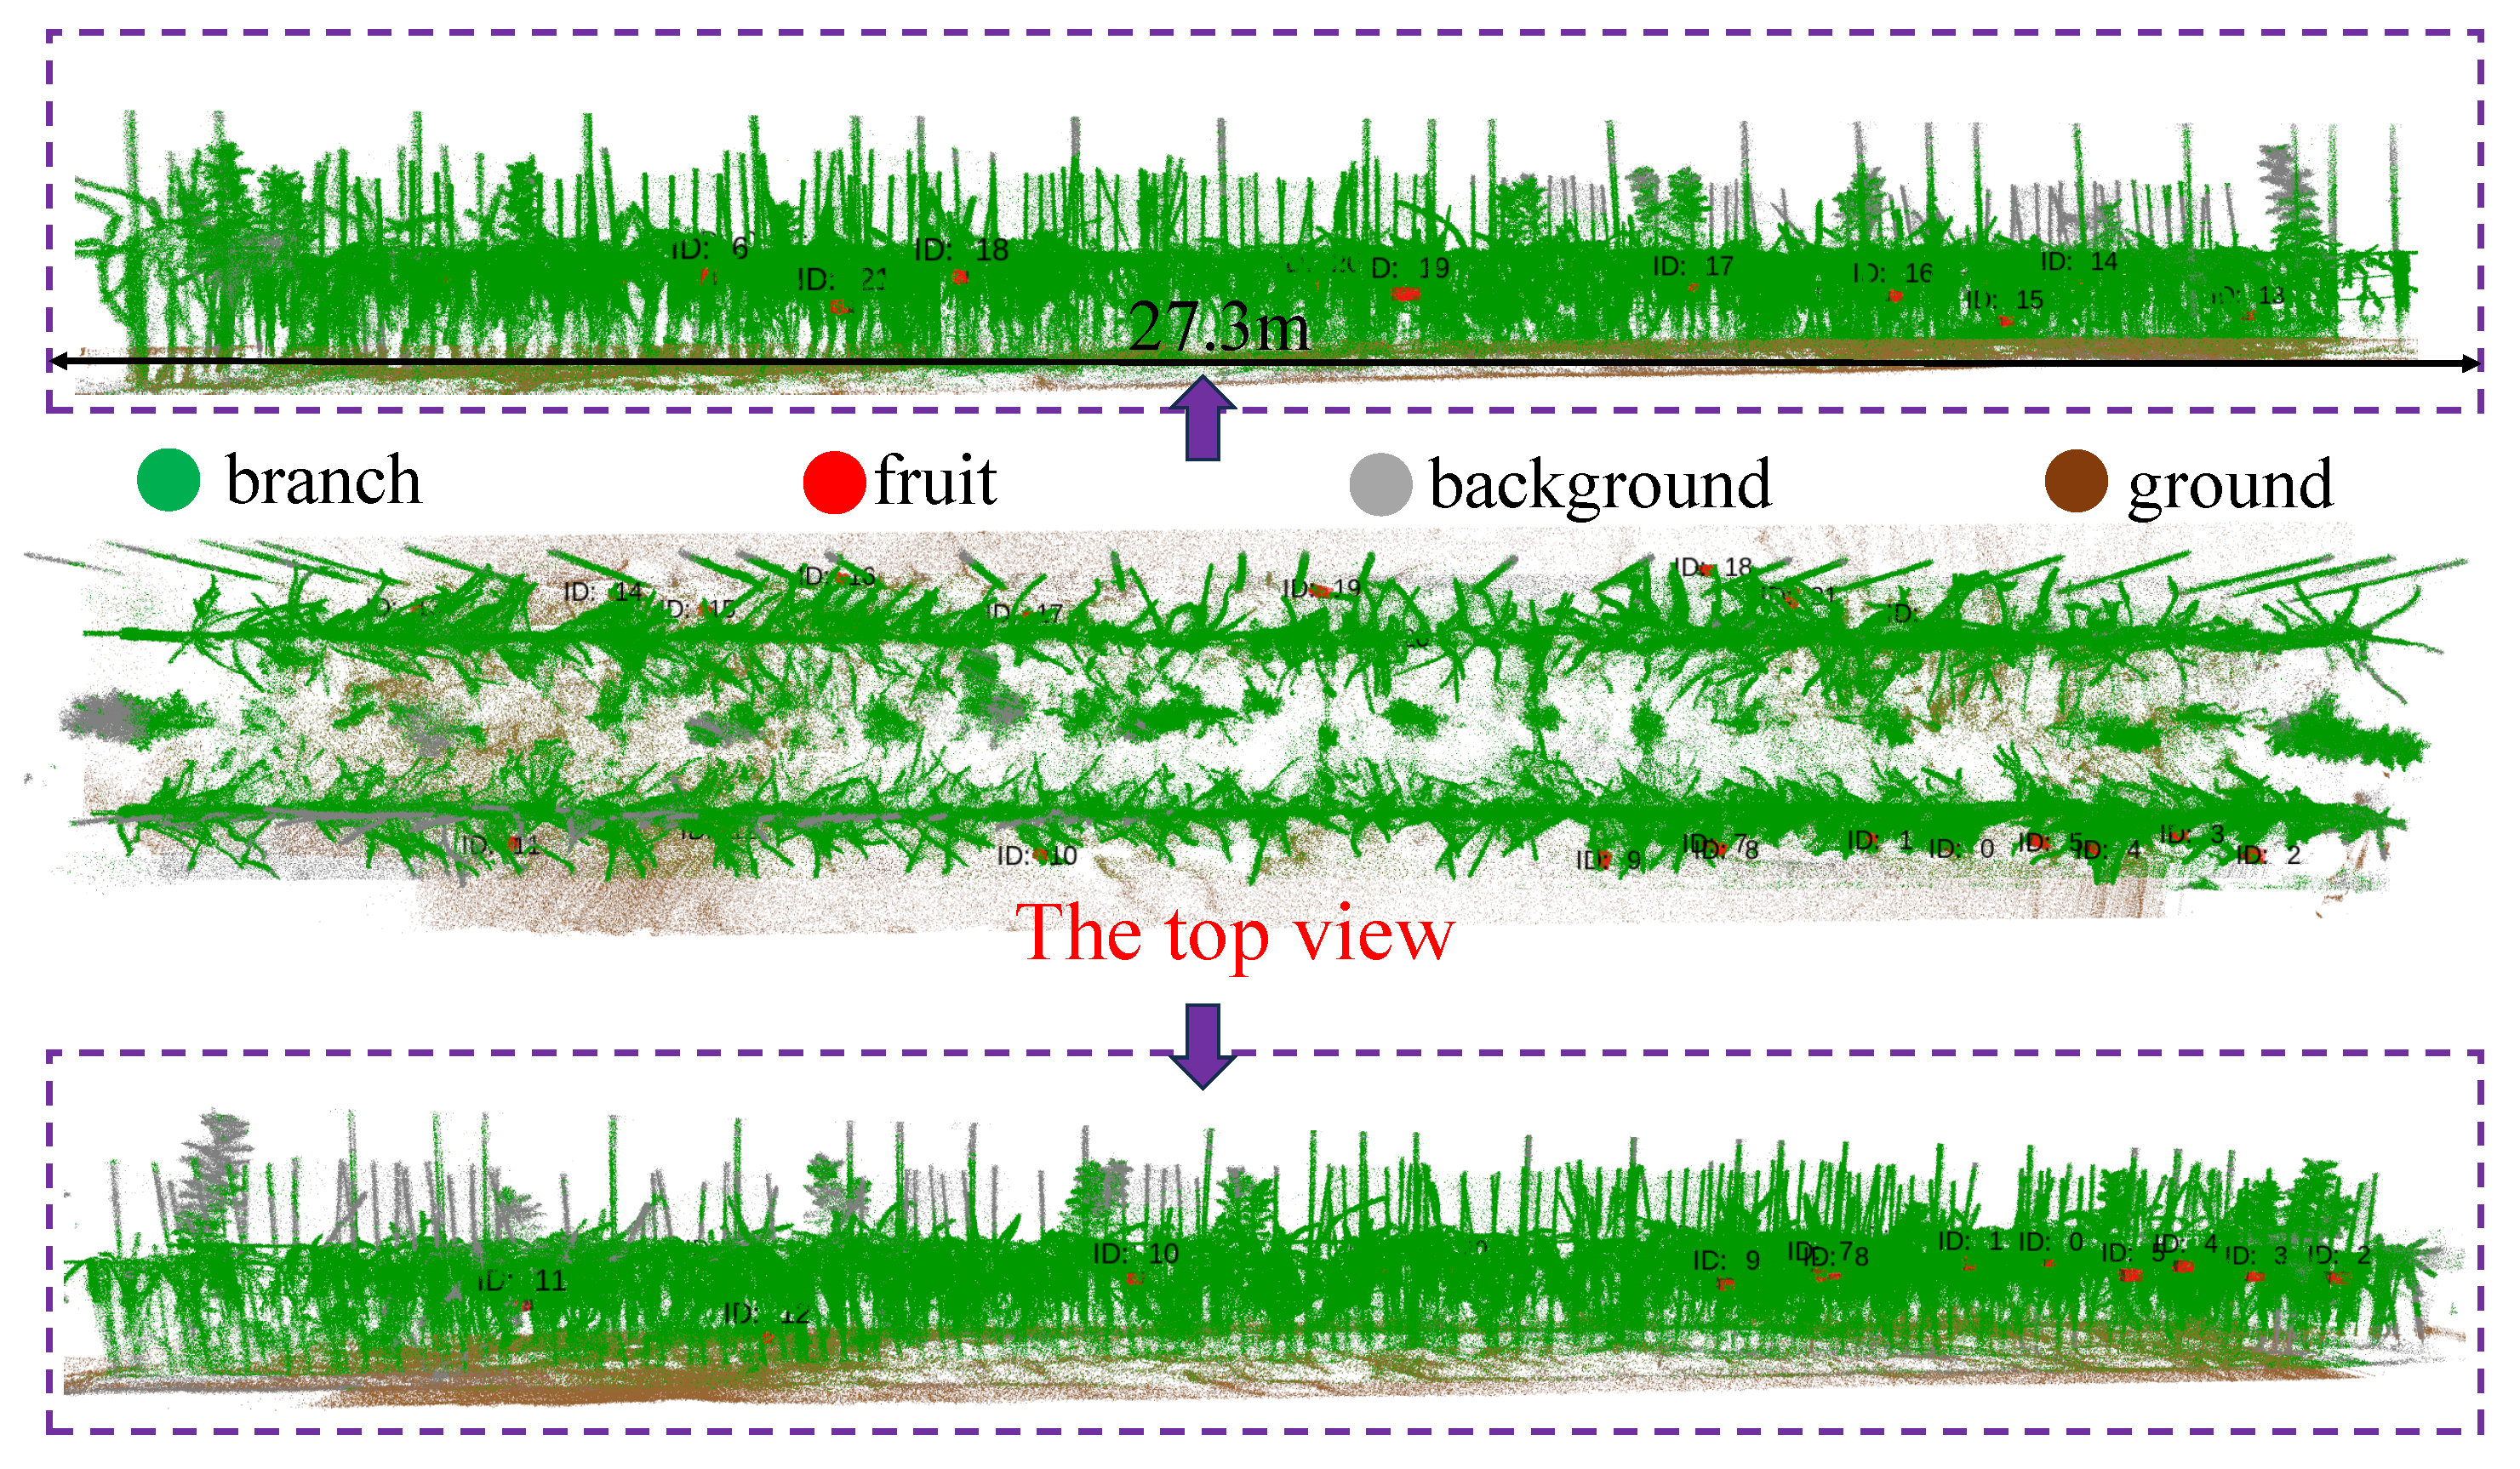
Figure 15.
Visual ablation positioning error experiment. (a)Trajectory schematic diagram. (b)Error comparison chart, based on visual standards.
Figure 15.
Visual ablation positioning error experiment. (a)Trajectory schematic diagram. (b)Error comparison chart, based on visual standards.
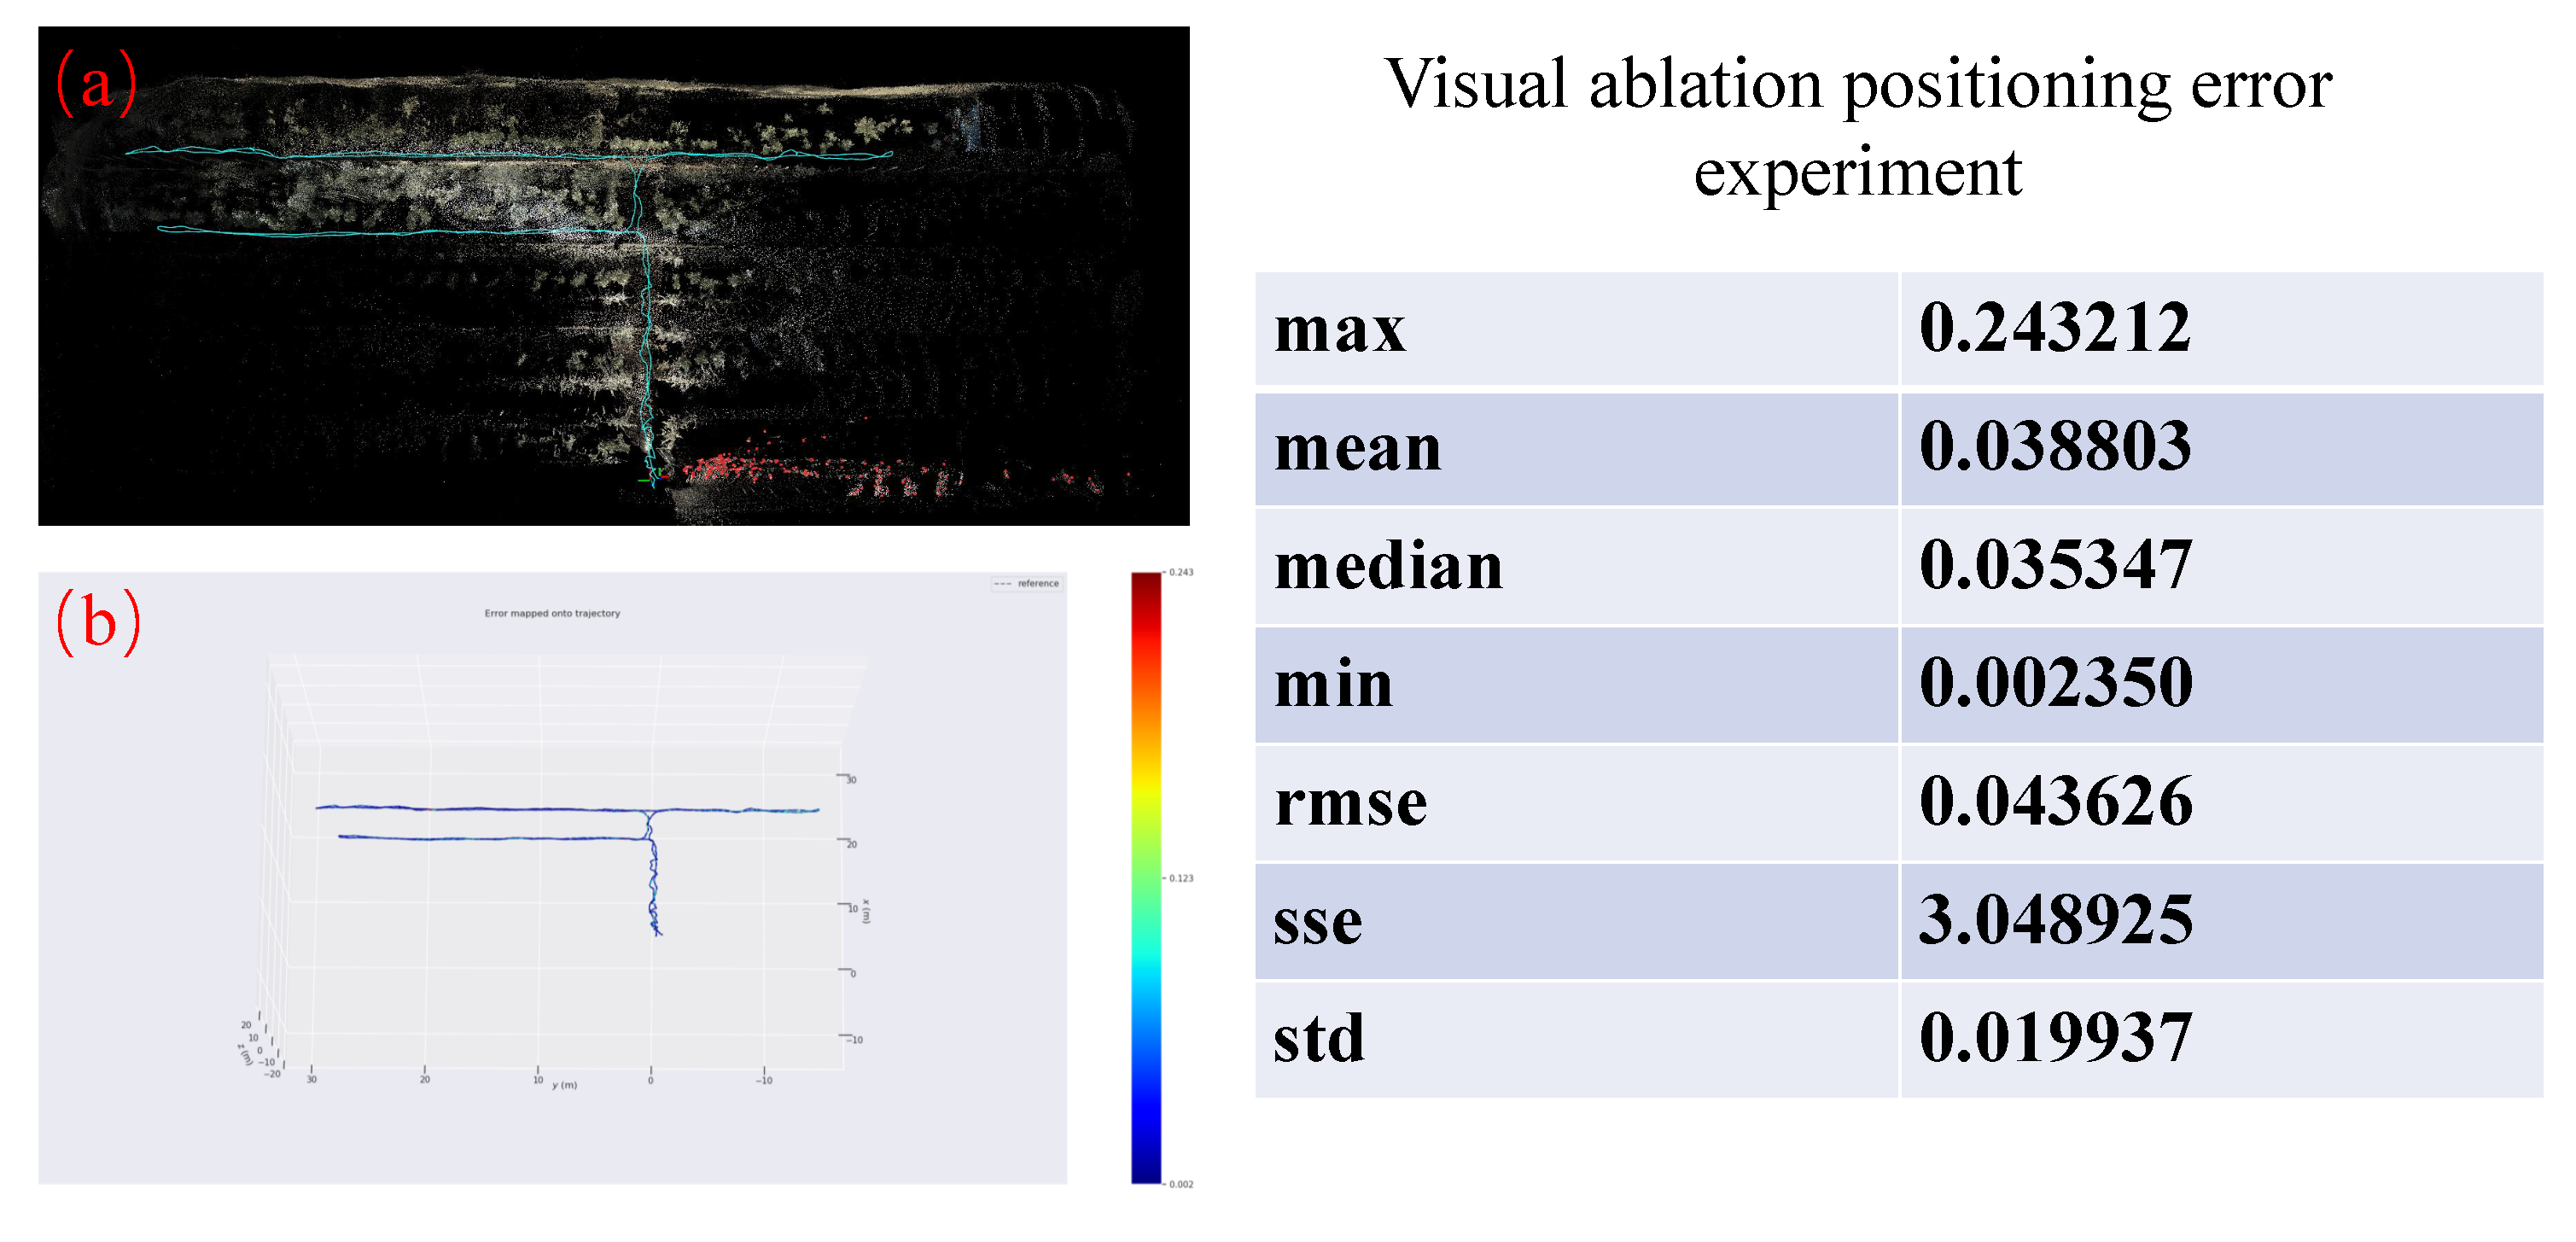
Figure 16.
Example of model segmentation error.(a1),(a2):Original picture. (b1),(b2):Prediction Mask.
Figure 16.
Example of model segmentation error.(a1),(a2):Original picture. (b1),(b2):Prediction Mask.
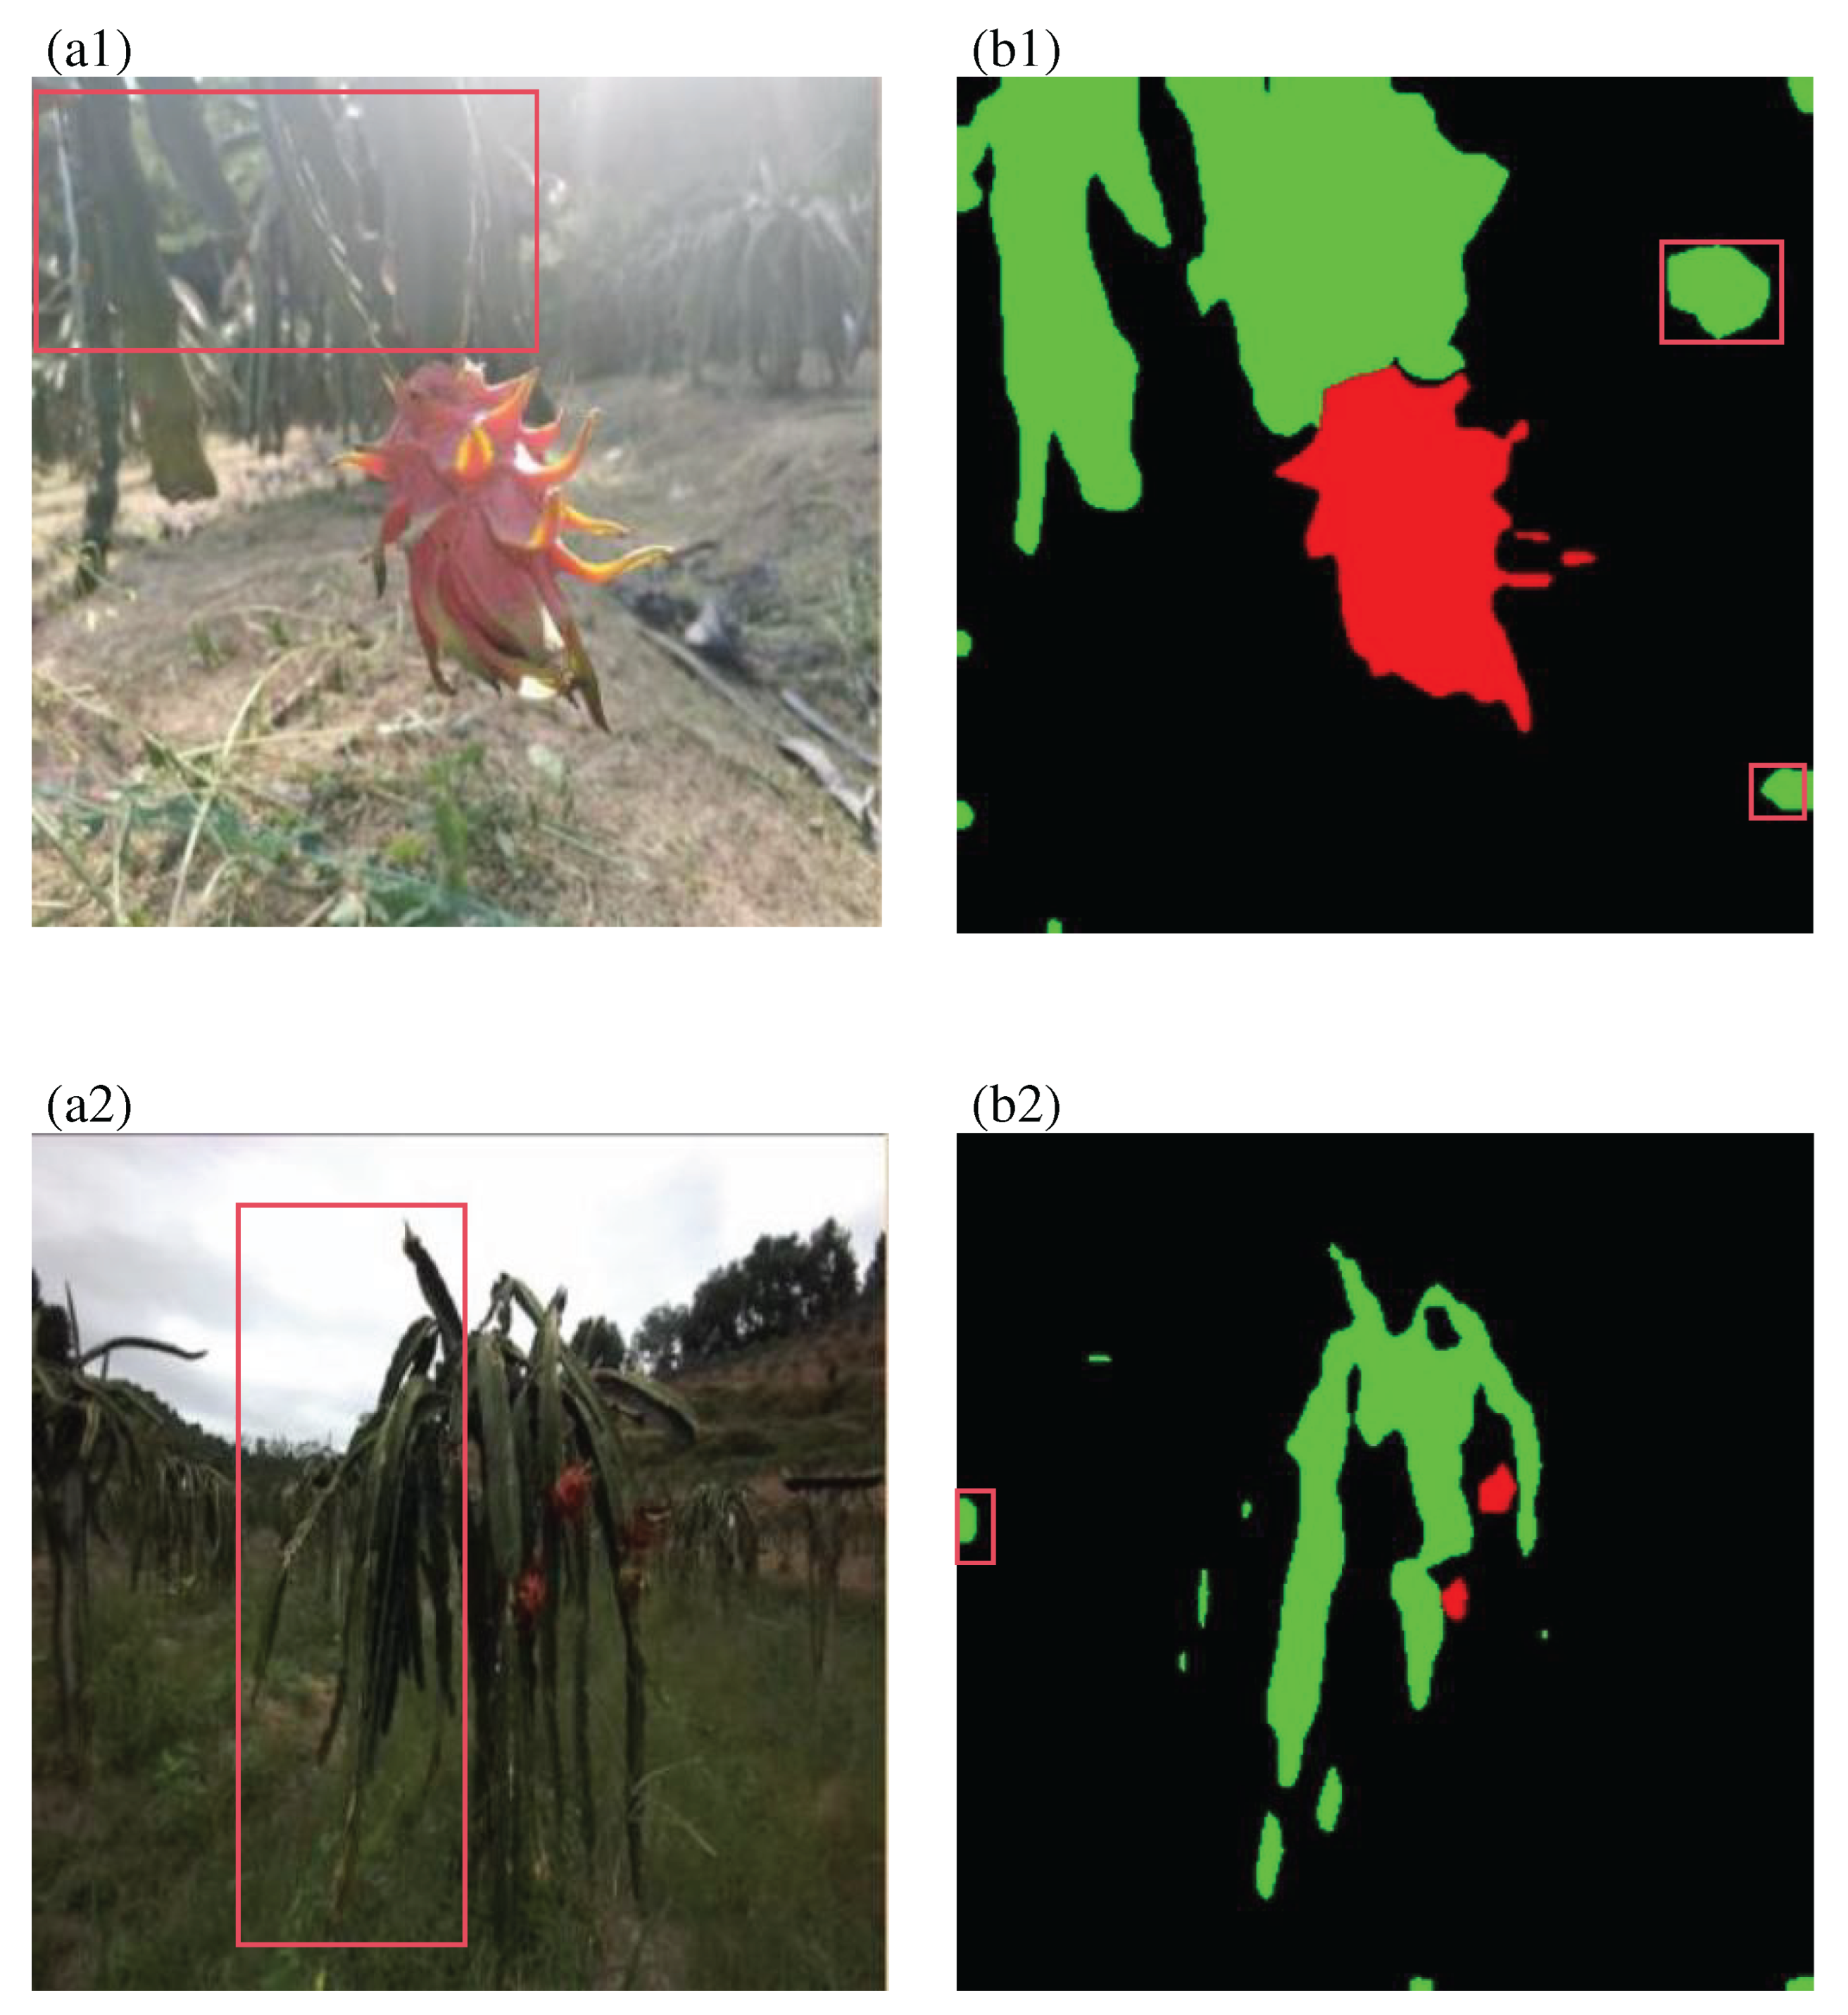

Table 1.
Performance comparison of different segmentation methods on pitaya test set
| Method | mIoU/% | PA/% | F1/% | FPS |
|---|---|---|---|---|
| BiSeNet | 78.61 | 87.75 | 88.0 | 115.15 |
| U-Net | 66.65 | 83.75 | 87.56 | 67.3 |
| DeepLabV3+ | 67.14 | 82.24 | 79.28 | 133.08 |
| FastSAM | 74.33 | 85.02 | 84.72 | 74.85 |
Table 2.
Comparison of actual and predicted values
| Experiment ID | Actual value | Predicted value | Relative error /% |
|---|---|---|---|
| 1 | 24 | 19 | 20.8 |
| 2 | 20 | 20 | 0 |
| 3 | 19 | 16 | 15.7 |
| 4 | 19 | 17 | 10.5 |
| 5 | 20 | 23 | 15 |
| Mean | – | – | 12.4 |
Disclaimer/Publisher’s Note: The statements, opinions and data contained in all publications are solely those of the individual author(s) and contributor(s) and not of MDPI and/or the editor(s). MDPI and/or the editor(s) disclaim responsibility for any injury to people or property resulting from any ideas, methods, instructions or products referred to in the content. |
© 2026 by the authors. Licensee MDPI, Basel, Switzerland. This article is an open access article distributed under the terms and conditions of the Creative Commons Attribution (CC BY) license (http://creativecommons.org/licenses/by/4.0/).
Copyright: This open access article is published under a Creative Commons CC BY 4.0 license, which permit the free download, distribution, and reuse, provided that the author and preprint are cited in any reuse.


