Submitted:
26 January 2026
Posted:
26 January 2026
You are already at the latest version
Abstract
Polypyrrole (PPy) is one of the most extensively studied conducting polymers due to its favorable optical properties and electrical conductivity. In this work, the relationship between the morphology of nuclei formed during electrochemical synthesis and the electronic properties of PPy is investigated, with particular emphasis on controlling nu-cleation and growth mechanisms (NGM). Polymerization was carried out electrochemi-cally in acetonitrile containing pyrrole as the monomer and LiClO4 (0.1 M) as the sup-porting electrolyte. Potentiodynamic techniques, specifically cyclic voltammetry (CV), were used to establish the synthesis conditions, while potentiostatic techniques, such as chronoamperometry, were employed to analyze NGM and achieve morphological con-trol. The resulting polymeric films were characterized by X-ray diffraction (XRD), scanning electron microscopy (SEM), and UV–Vis spectroscopy. The optical band gap was estimated using the Tauc method. Three distinct contributions to the NGM of PPy de-posited on indium tin oxide (ITO) conductive glass were identified: instantaneous nu-cleation with two-dimensional growth (IN2D), progressive three-dimensional nucleation controlled by charge transfer (PN3Dct), and progressive three-dimensional nucleation controlled by diffusion (PN3Ddif). When the growth mechanism was controlled, the electrosynthesized PPy exhibited band gap values of 3.31, 3.54, and 3.58 eV. SEM analysis revealed that IN2D leads to the formation of flat and homogeneous nuclei, whereas PN3Dct and PN3Ddif produce denser, more branched structures with growth perpen-dicular to the electrode surface. These findings demonstrate that precise control of NGM enables modulation of the electronic properties of PPy, providing opportunities to op-timize its performance in applications such as electrochemical sensors, supercapacitor electrodes, and organic electronic devices.
Keywords:
polypyrrole
; band gap
; nucleation
; electrosynthesis
1. Introduction
Polymers are natural or synthetic macromolecules composed of repeating structural units known as monomers. Among synthetic polymers, conducting polymers (CPs) constitute a class of particular interest, as they are capable of transporting electrical charges due to the presence of π-electrons delocalized along their conjugated backbone [1]. These materials are considered key candidates for the development of sustainable technologies owing to their synthetic versatility and their outstanding physical, electrical, and optical properties [2]. The most extensively studied CPs include polypyrrole (PPy), polythiophene (PTh), and polyaniline (PANI) [3]. Among them, PPy has received significant attention, as evidenced by the large number of publications addressing its properties and potential applications, and stands out for its physicochemical stability, ease of doping, and favorable performance in electronic devices [2].
PPy can be synthesized by either chemical or electrochemical methods; however, the electrochemical route offers several advantages, including direct deposition onto conductive substrates and precise control over experimental parameters such as applied potential and charge, monomer concentration, dopant and electrolyte composition, temperature, and pH. This level of control enables accurate modulation of the growth morphology of the polymeric film [2]. The resulting morphology is governed by the nucleation and growth mechanisms (NGM), which can be inferred from mathematical analysis of chronoamperometric current-time (i–t) transients recorded during potentiostatic electropolymerization, and further supported by microscopic and spectroscopic (UV–Vis) characterization techniques [3]. In this study, chronoamperometry and scanning electron microscopy (SEM) were employed to distinguish between instantaneous and progressive nucleation processes and to correlate the resulting morphologies with the electrical and optical properties of PPy.
The NGM are governed by experimental variables such as the nature and concentration of the monomer, the type of supporting electrolyte, the composition and topology of the electrodes, and the waveform of the applied electrochemical signal [4]. From an operational standpoint, nucleation is classified as instantaneous (IN) when, following the application of a potential step, a fixed density of nuclei is rapidly generated and only subsequent growth occurs. In contrast, nucleation is considered progressive (PN) when nuclei continue to form over an extended time interval, resulting in an increasing nucleus density with time. The ensuing growth may be predominantly two-dimensional (2D), characterized by coplanar discoidal islands that coalesce into continuous films, or predominantly three-dimensional (3D), involving growth both perpendicular and parallel to the substrate [5,6]. These nucleation-growth combinations produce characteristic features in diffusion-controlled i–t transients, enabling their discrimination through electrochemical analysis supported by microscopic and spectroscopic characterization.
These processes may be governed primarily by charge transfer (ct) or by diffusion of the monomer (dif) toward the electrode surface. Through mathematical analysis of the i–t transients, the different NGM can be quantitatively modeled using characteristic equations, as summarized in Table 1.
The mathematical equations describing the NGM involved in the electropolymerization of PPy incorporate several relevant physicochemical parameters: n represents the number of electrons transferred in the reaction; F is the Faraday constant; h corresponds to the height of the 2D nuclei; k₂ is the growth rate constant for these nuclei; A represents the steady-state growth rate constant; M is the molar mass of the polymer; N₀ is the number of nuclei formed at the initial time; k’₃ and k₃ are the growth constants for three-dimensional (3D) nuclei in the directions perpendicular and parallel to the electrode, respectively; D is the diffusion coefficient of the monomer, and M is also used to denote its concentration in the bulk solution.
From a functional standpoint, the performance of conducting polymers is strongly influenced by their electronic bandgap (Eg), which can be estimated using electrochemical techniques such as cyclic voltammetry (CV) or spectroscopic methods including UV–Vis absorption [7]. These techniques allow Eg to be inferred from characteristic absorption wavelengths associated with electronic transitions the highest occupied molecular orbital (HOMO) and the lowest unoccupied molecular orbital (LUMO) [4].
In this context, the present study aims to elucidate how different NGM during the electrosynthesis of PPy govern the morphology of the resulting films and how this morphology, in turn, affects the value of Eg. Such understanding is essential for designing synthesis strategies that enable optimization of the electronic properties of PPy, thereby expanding its applicability in emerging technologies such as sensors, optoelectronic devices, and energy storage systems.
2. Materials and Methods
For the synthesis and characterization of the polymer, potentiodynamic electrochemical techniques, specifically CV, and potentiostatic techniques, namely potential-step methods, were employed. These were complemented by UV–Vis spectroelectrochemical analysis and SEM.
2.1. Reagents and Solvents
The pyrrole monomer (98%, Sigma-Aldrich) was used without further purification. Lithium perchlorate (LiClO4, 0.1 mol·L⁻¹) dissolved in acetonitrile (CH3CN) served as the supporting electrolyte. The monomer concentration was adjusted to 0.01 mol·L⁻¹ Ultrapure water was used when required for electrode cleaning and rinsing procedures.
2.2. Electrochemical Synthesis of PPy
The electrochemical synthesis of PPy was performed in a three-compartment glass electrochemical cell. Indium tin oxide (ITO)–coated glass was used as the working electrode. A high-purity platinum wire, wound in a spiral configuration to maximize surface area and ensure uniform current distribution, served as the counter electrode, while an Ag/AgCl electrode in saturated KCl was used as the reference electrode.
All electrochemical experiments were controlled using an EmStat potentiostat/galvanostat (PalmSens, The Netherlands, EmStat4+ model) connected to an HP Pavilion computer running PSTrace software (v. 5.9). CV was used to define the growth windows and doping/dedoping conditions, whereas potentiostatic chronoamperometry was used to record i–t transients for subsequent kinetic analysis of nucleation and growth. Prior to each synthesis, the working electrodes were cleaned by ultrasonic treatment in acetone and isopropanol, followed by rinsing with distilled water.
2.3. UV–Visible Spectroscopy Coupled with Electrochemical Measurements
For the spectro-electrochemical studies, a UV–Vis spectrophotometer (Jasco V-750) coupled to an HP computer was used. Absorption spectra were recorded over the 300–900 nm wavelength range using Spectra Manager software (Jasco).
2.4. Scanning Electron Microscopy (SEM)
The morphology of the PPy films was examined by SEM using a JEOL JSM-5600LV instrument operated at an accelerating voltage of 15 kV. Prior to imaging, samples were mounted on carbon tape to enhance surface conductivity and minimize charge accumulation. Micrographs were acquired at magnifications of 5000× and 10000× to assess both surface structure and coating homogeneity.
2.5. X-Ray Diffraction Characterization
XRD analysis were conducted using a D8 ECO Advance diffractometer with a copper X-ray source. Patterns were recorded over a 2θ range of 20°–80°, with a step size of 0.02° and a counting time of 1.20 s per step, using CuKα radiation (λ = 1.5406 Å).
3. Results
3.1. Optimization of Electropolymerization
To optimize polymer growth on the ITO working electrode, CV was employed. Synthesis conditions were benchmarked against previous studies, where the potential window ranged from −1 V to 1.7 V [8,9]. In the present work, the optimal growth window was determined to be −1 V to 1.5 V, as shown in Figure 1. The voltammogram, recorded over five consecutive scan cycles, exhibits a progressive increase in current, indicating efficient and reproducible polymer growth. Given the relatively low oxidation potential of pyrrole [10], initial nucleation occurs at approximately 0.9 V, where a noticeable current increase is observed during the first cycle. This potential was therefore selected to define the applied potential in subsequent potentiostatic synthesis experiments.
Based on the voltammetric analysis, potentiostatic synthesis was performed by chronoamperometry under controlled conditions, using the identified oxidation potential 0.9 V as a reference. To optimize the process, slightly higher potentials were applied without exceeding the overoxidation threshold, ensuring controlled polymerization and preventing film degradation. Under these conditions, the optimal polymer growth potential was determined to be 1.1 V.
Figure 2 presents the i–t transients recorded during potentiostatic synthesis. In all curves, the current increases almost immediately after t = 0 s, indicating a negligible induction time. This behavior confirms that the applied potentials exceed the initial oxidation potential 0.9 V, promoting immediate nucleation. The rapid current increase, followed by a slight decrease and subsequent stabilization, is characteristic of PPy growth under potentiostatic conditions [5].
Comparison of the three i–t transients show that all curves exhibit a distinct maximum current peak, which increases with higher applied potentials and is reached at progressively shorter times. This peak current is closely associated with the overlap of nuclei on the electrode surface, independent of the substrate [5]. At an applied potential of 1.0 V, the current reaches approximately 350 µA, indicating limited PPy formation. In contrast, at 1.2 V, the current rises to around 800 µA, reflecting highly accelerated nucleation that leads to pronounced current decay and reduced stabilization, consistent with polymer degradation [10]. At 1.1 V, however, the growth is more stable and controlled, with no signs of material degradation. Accordingly, this potential was selected for subsequent analysis involving deconvolution.
Figure 3 shows the deconvolution of the i–t transient recorded at 1.1 V to identify the maximum nucleation contributions (MNCs). The deconvolution reveals contributions corresponding to NI2D, NI2D + NP3Dtc, and NI2D + NP3Dtc + NP3Ddif. All contributions occur within the first three seconds, a behavior influenced by the polarity of the solvent, as higher solvent polarity reduces the solubility of oligomers [11]. The decrease in current associated with the NI2D and NP3Ddif contributions is also related to solvent polarity; increased polarity promotes stronger adsorption of solvent molecules onto the substrate, which hinders the adsorption of oligomers and short-chain monomers [12].
Although the predominance of two-dimensional progressive nucleation during PPy synthesis has been widely reported [5,6,13] under the conditions of the present study, PPy exhibited a very rapid and abrupt current increase, reaching a maximum at approximately 1 s, followed by an almost immediate decay. This behavior is characteristic of instantaneous NI2D, in which nuclei form rapidly and parallel to the electrode surface, leading to their encounter and overlap [6]. Subsequently, progressive nucleation dominates, with new nuclei forming continuously on the existing ones. In this context, NP3Dtc reaches its maximum current at around 2 s, while NP3Ddif peaks at approximately 3 s.
The deconvolution of the i–t transient was performed over the first 10 s, as the current stabilized after ~7 s. This approach focused the analysis on the initial stage of synthesis, where nucleus formation occurs.
The equation describing nucleus growth during the synthesis is given below.
Here, P1 and P2 correspond to 2D instantaneous nucleation, P3 and P4 to three-dimensional progressive nucleation controlled by charge transfer, and P5 and P6 to diffusion-controlled progressive nucleation. The values of each parameter are listed in Table 2.
The mathematical expressions associated with each parameter are shown in Table 3.
3.2. Optical Band-Gap Calculations by the Tauc Method
3.2.1. Controlled Synthesis
With the NGMs identified, and considering the time at which each reaches its maximum current, it was possible to control the film growth morphology for each NGM using multipulse amperometry. As shown in Figure 4, optimal PPy film growth on the substrate was achieved by applying 10 cycles, as the current increase remained consistent throughout the cycles. This behavior indicates continuous material growth without overoxidation, in contrast to the behavior observed in Figure 5.
3.2.2. UV–Vis Characterization
Figure 6 compares the UV- Vis spectra of PPy films synthesized at different deposition times. Absorption spectra were recorded over the 300–900 nm wavelength range, and the optical band gap was determined. The spectra display a peak associated with the π–π* transition, reflecting the presence of neutral species and polarons, as well as adsorption of the initial oligomers on the substrate in the 400–500 nm region [14].
The spectra also show that, as the polymerization time increases, the absorption peak undergoes a slight red shift toward ~600 nm (Figure 6). This shift indicates a higher oxidation degree of the film and an increase in chain conjugation, reflecting the presence of longer oligomer chains on the substrate. Consequently, this behavior corresponds to a decrease in the optical band gap (Eg) [15].
The optical Eg was calculated using the Tauc method, which, like CV, provides a reliable estimate of the bandgap [16].
Here, α is the absorption coefficient, h is Planck’s constant, ν is the photon frequency, A is a material-dependent constant related to the mobility of electrons and holes, and n describes the nature of the electronic transition. The value of n depends on whether the transition is forbidden or allowed, and whether it is direct or indirect: n = 1/2 for allowed direct transitions; n = 3/2 for allowed indirect transitions, n = 2 for forbidden direct transitions, and n = 3 for forbidden indirect transitions.
In most materials, absorption is dominated by allowed transitions, corresponding to n = 1/2 or n = 2. To determine the appropriate value of n for a given system, both possibilities should be tested, and the one yielding the best fit should be selected. Accordingly, the Tauc analysis require absorbance data to calculate the photon energy using Eq. 3 and the absorption coefficient using Eq. 4.
From these equations, the Tauc plot is constructed by plotting (αhν)2 versus hν. The optical band gap (Eg) is then determined by extrapolating the linear region of the plot to the energy axis, corresponding to (αhν)2, as illustrated in Figure 7.
Figure 7 presents the calculated Eg values. For NI2D, Eg was 3.60 eV, while values of 3.55 and 3.35 eV were obtained for NI2D + NP3Dtc and NI2D + NP3Dtc + NP3Ddif, respectively. A clear decrease in Eg is observed as a function of the NGMs. The transition from the first to the second contribution results in a modest reduction in Eg (0.5 eV), whereas a more pronounced decrease occurs between the second and third contributions.
This reduction reflects a narrowing of the energy gap between the valence and conduction bands, thereby lowering the energy required for electronic transitions. These results demonstrate that NGMs have a significant influence on the electronic properties of PPy [17].
As the PPy synthesis time increases, a larger amount of polymer is deposited on the substrate. Accordingly, NGMs associated with lower Eg values correspond to films with greater material deposition, which is attributed to a higher density of delocalized charge carriers. These findings are consistent with the SEM analysis, which shows that both film morphology and substrate coverage evolve with increasing synthesis time.
SEM characterization was performed to verify the correlation between the NGMs derived from deconvolution of the i–t transients and the resulting film morphology. Micrographs were acquired at magnifications of 5000× and 10000×. The images reveal significant differences in substrate coverage as a function of the synthesis conditions, particularly the deposition time [18]. Figure 8a and Figure 8b show a fully homogeneous surface covered by flattened, circular nuclei. At 5000× magnification, a compact and continuous film without voids is observed, indicating rapid and simultaneous nucleation across the entire substrate. This growth behavior is characteristic of instantaneous nucleation processes, in which the maximum density of nuclei is reached shortly after a brief induction period.
In contrast, Figure 9 reveals a markedly different morphology. At 5000× magnification, the substrate is covered with rough heterogeneous structures, while at 10,000× individual nuclei exhibiting growth perpendicular to the substrate can be early identified. This morphology is indicative of a three-dimensional progressive nucleation process, in which new nuclei continue to form over time and their growth is governed by charge-transfer kinetics. Similar morphologies have been reported for electropolymerized films formed under polarization conditions that promote the continuous generation of active nucleation sites. Previous studies [8,9,18] have shown that such morphologies are associated with high transferred charge densities, which favor the formation of domains with pronounced perpendicular orientation.
Figure 10 shows a denser morphology composed of compact, heterogeneous aggregates. At 5000× magnification, the surface exhibits a rough and apparently disordered texture, while at 10,000× irregular domains with diffuse edges are clearly observed. This morphology is characteristic of a three-dimensional growth process dominated by diffusion of the monomer toward the electrode surface, corresponding to diffusion-controlled progressive nucleation (NP3Ddif).
3.3. X-Ray Diffraction (XRD) Characterization
Structural characterization of the PPy films by XRD revealed patterns characteristic of partially amorphous materials. As shown Figure 11, intense and well-defined peaks appear at 2θ values corresponding to the (211), (222), (400), (440), and (622) crystallographic planes, which are attributed to the crystalline ITO substrate. This response is consistent with the cubic structure of ITO reported in the literature [19,20,21]. In contrast, the broad diffraction feature observed in the 2θ range between 20° and 30° is indicative of the amorphous nature of PPy and is associated with the spatial disorder of polymer chains within interplanar regions, confirming the low crystallinity of the material²². This amorphous character may also be attributed to rapid growth kinetics during nucleation, as fast polymerization processes generally lead to less ordered materials [2,23,24].
4. Conclusions
This study demonstrates that NGMs play a decisive role in controlling the morphology and, consequently, the electronic properties of electrochemically synthesized polypyrrole. A clear correlation was established between the dominant NGM and the optical band gap of morphologically controlled PPy, with Eg values of 3.60 eV for NI2D, 3.55 eV for NI2D + NP3Dtc, and 3.35 eV for NI2D + NP3Dtc + NP3Ddif. These findings highlight the potential to design morphologically directed synthesis strategies that enable precise tuning of electronic properties according to the intended application. Furthermore, XRD and SEM analysis confirm the predominantly amorphous nature of PPy. Overall, the results establish a strong correlation between PPy morphology and its physicochemical and electrochemical properties.
Funding
.
Author Contributions
Investigation, I.M.F; M.R. and J.M.: Methodoly, I.M.F and M.R.: Conceptualization, M.R. and J.M.: supervision M.R. and G.C.A.:Project Administration M.R.: Formal Analysis, G.C.A., M.M.L., A.M. and D. A.: writing- original draft, I.M.F, M.M.L., D. A. and G.C.A.: writing- review editing, I.M.F; M.R., G.C.A., A.M. and D. A.
Data Availability Statement
The original contributions presented in this study are included in the article. Further inquiries can be directed to the corresponding authors.
References
- Pratap Khare, K.; Kathal, R.; Shukla, N.; Srivastava, R.; Srivastava, A. Orientation dependent DFT analysis of aniline and pyrrole based copolymer. Materials Today: Proceedings 2020, 47, 6934–6937. [Google Scholar] [CrossRef]
- Balint, R., Cassidy, N. J., & Cartmell, S. H. (2014). Conductive polymers: Towards a smart biomaterial for tissue engineering. In Acta Biomaterialia (Vol. 10, Issue 6, pp. 2341–2353). Elsevier Ltd. [CrossRef]
- Solis, A. B. M. (2019). Síntesis y caracterización de polímeros conductores para su aplicación en dispositivos electrocrómicos duales.
- Duvenhage, M. M.; Ntwaeaborwa, M.; Visser, H. G.; Swarts, P. J.; Swarts, J. C.; Swart, H. C. Determination of the optical band gap of Alq3 and its derivatives for the use in two-layer OLEDs. Optical Materials 2015, 42, 193–198. [Google Scholar] [CrossRef]
- Puerres, J.; Ortiz, P.; Cortés, M. T. Effect of electrosynthesis potential on nucleation, growth, adhesion, and electronic properties of polypyrrole thin films on fluorine-doped tin oxide (FTO). Polymers 2021, 13(15). [Google Scholar] [CrossRef] [PubMed]
- Hwang, B. J.; Santhanam, R.; Lin, Y. L. Nucleation and growth mechanism of electroformation of polypyrrole on a heat-treated gold/highly oriented pyrolytic graphite. Electrochimica acta 2001, 46(18), 2843–2853. [Google Scholar] [CrossRef]
- Roldán, L. Determination of the band gap in semiconductor materials using UV-Vis spectroscopy. Journal of Applied Chemistry 2014, 11(3), 56–62. [Google Scholar]
- Bayat, M.; Izadan, H.; Santiago, S.; Estrany, F.; Dinari, M.; Semnani, D.; Alemán, C.; Guirado, G. Study on the electrochromic properties of polypyrrole layers doped with different dye molecules. Journal of Electroanalytical Chemistry 2021a, 886. [Google Scholar] [CrossRef]
- Marín, T. A.; Isaza, F. J.; Calderón, J. A. Electrodeposición de Películas de polipirrol/platino. Portugaliae Electrochimica Acta 2009, 27(3), 397–407. [Google Scholar] [CrossRef]
- Sadki, S.; Schottland, P.; Brodie, N.; Sabouraud, G. The mechanisms of pyrrole electropolymerization. Chemical Society Reviews 2000, 29(5), 283–293. [Google Scholar] [CrossRef]
- Monk, P., Mortimer, R. y Rosseinsky, D. (2007). Electrocromismo y dispositivos electrocrómicos . Cambridge University Press.
- Díaz, F. R.; Del Valle, M. A.; Núñez, C.; Godoy, A.; Mondaca, J. L.; Toro-Labbé, A.; Bernède, J. C. Synthesis, characterization, electropolymerization, and theoretical study of 2,3-di-(2-thienyl)quinoxaline. Polymer Bulletin 2006, 56(2–3), 155–162. [Google Scholar] [CrossRef]
- Ávalos Huarte, E. (2020). Mechanism and kinetics of nucleation and electrochemical growth of polypyrrole from deep eutectic solvents. Retrieved from: https://hdl.handle.net/11191/7479.
- Morávková, Z.; Taboubi, O.; Minisy, I. M.; Bober, P. The evolution of the molecular structure of polypyrrole during chemical polymerization. Synthetic Metals 2021, 271. [Google Scholar] [CrossRef]
- Yun, S. R.; Kim, G. O.; Lee, C. W.; Jo, N. J.; Kang, Y.; Ryu, K. S. Synthesis and control of the shell thickness of polyaniline and polypyrrole half hollow spheres using the polystyrene cores. Journal of Nanomaterials 2012. [Google Scholar] [CrossRef]
- Viezbicke, B. D.; Patel, S.; Davis, B. E.; Birnie, D. P. Evaluation of the Tauc method for optical absorption edge determination: ZnO thin films as a model system. Physica Status Solidi (B) Basic Research 2015, 252(8), 1700–1710. [Google Scholar] [CrossRef]
- Samwang, T.; Watanabe, N. M.; Okamoto, Y.; Srinives, S.; Umakoshi, H. Study of Chemical Polymerization of Polypyrrole with SDS Soft Template: Physical, Chemical, and Electrical Properties. ACS Omega 2023, 8(51), 48946–48957. [Google Scholar] [CrossRef] [PubMed]
- Castro-Beltrán, A.; Domínguez, C.; Bahena-Uribe, D.; Sepúlveda-Guzmán, S.; Cruz-Silva, R. Efecto de aditivos no electroactivos en la electropolimerización de pirrol en etapa temprana sobre electrodos de óxido de indio y estaño. Thin Solid Films 2014, 566, 23–31. [Google Scholar]
- Arjomandi, J.; Raoufi, D.; Ghamari, F. Surface Characterization and Morphology of Conducting Polypyrrole Thin Films during Polymer Growth on ITO Glass Electrode. Journal of Physical Chemistry C 2016, 120(32), 18055–18065. [Google Scholar] [CrossRef]
- Alsultany, F. H.; Ahmed, N. M.; Matjafri, M. Z. Effects of CW CO<sub>2</sub> Laser Annealing on Indium Tin Oxide Thin Films Characteristics. Soft Nanoscience Letters 2014, 04(04), 83–89. [Google Scholar] [CrossRef]
- Eshaghi, A.; Graeli, A. Optical and electrical properties of indium tin oxide (ITO) nanostructured thin films deposited on polycarbonate substrates thickness effect. Optik 2014, 125(3), 1478–1481. [Google Scholar] [CrossRef]
- Chougule, M. A.; Pawar, S. G.; Godse, P. R.; Mulik, R. N.; Sen, S.; Patil, V. B. Synthesis and Characterization of Polypyrrole (PPy) Thin Films. Soft Nanoscience Letters 2011, 01(01), 6–10. [Google Scholar] [CrossRef]
- Kaur Sidhu, G.; Kumar, R. Study the Structural and Optical behaviour of Conducting Polymer based nanocomposites: ZrO2-Polypyrrole Nanocomposites. IOP Conference Series: Materials Science and Engineering 2018, 360(1). [Google Scholar] [CrossRef]
- Mitchell, G. R., Geris, A., Rg6, S. J. J., & Uk, T. 2af. (1987). Molecular organisation of electrochemically prepared conducting polypyrrole films Printed in the UK. In J. Phys. D: Appl. Phys (Vol. 20). http://iopscience.iop.org/0022-3727/20/11/002.
Figure 1.
CV profiles recorded at the ITO | 0.01 mol·L⁻¹ pyrrole interface in CH3CN containing 0.1 mol·L⁻¹LiClO4. Scan rate: 100 mV·s⁻¹.
Figure 1.
CV profiles recorded at the ITO | 0.01 mol·L⁻¹ pyrrole interface in CH3CN containing 0.1 mol·L⁻¹LiClO4. Scan rate: 100 mV·s⁻¹.
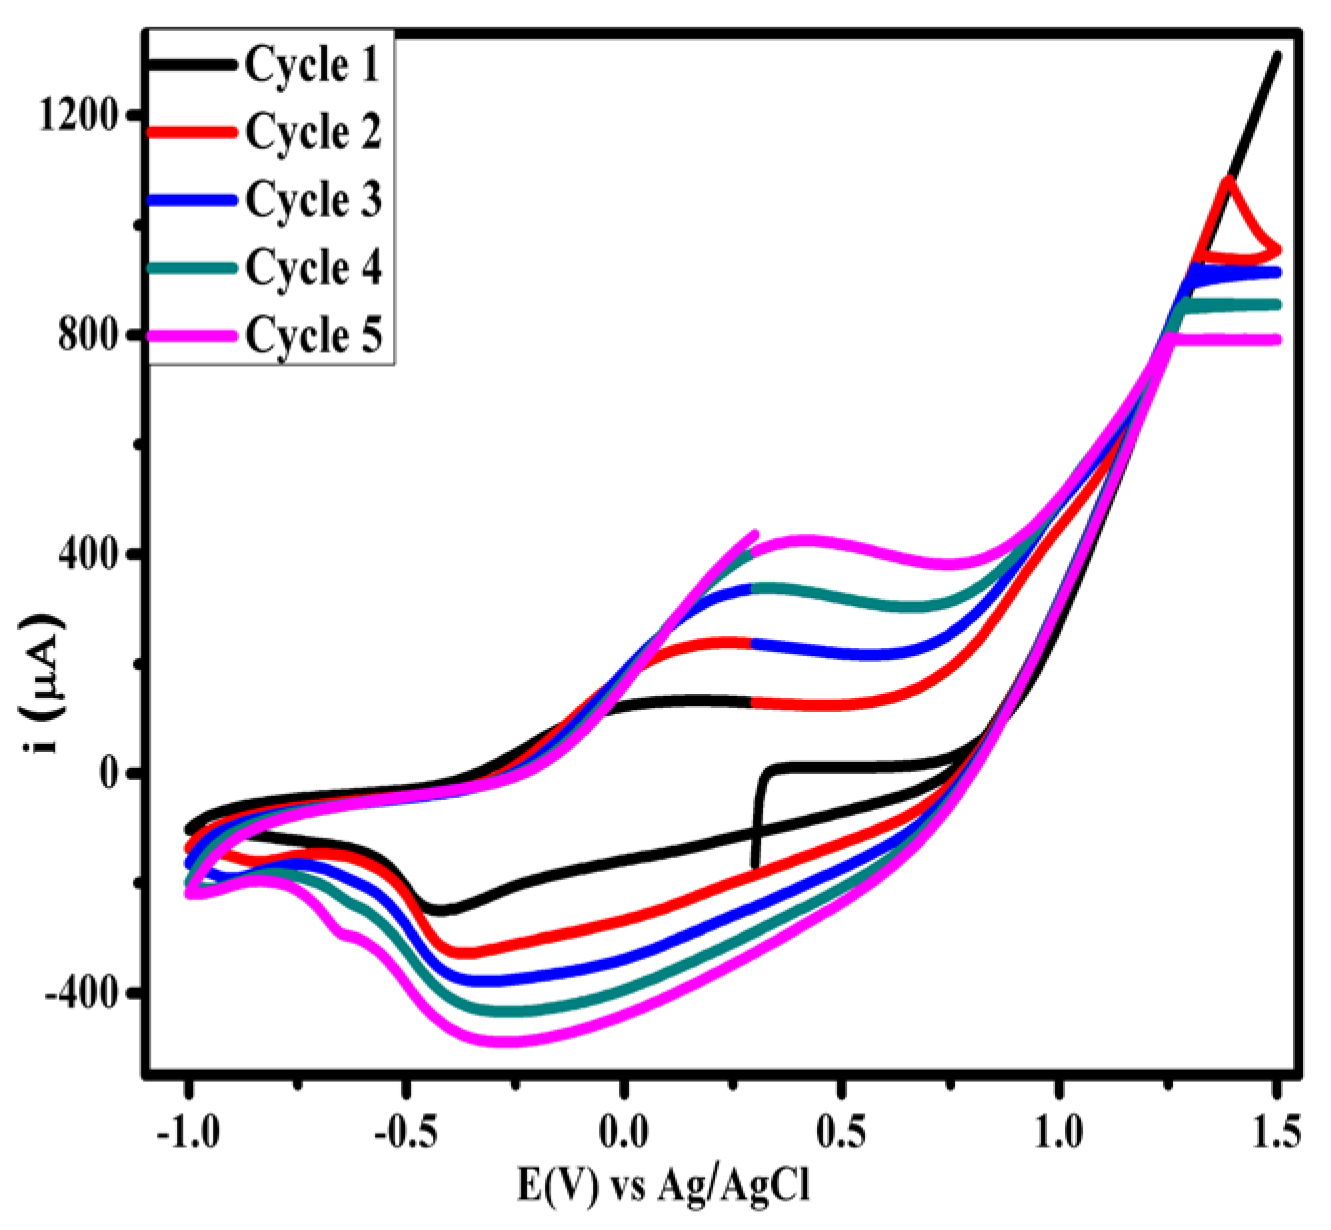
Figure 2.
Potentiostatic current–time (i-t) transients recorded during PPy electropolymerization at different applied potentials.
Figure 2.
Potentiostatic current–time (i-t) transients recorded during PPy electropolymerization at different applied potentials.
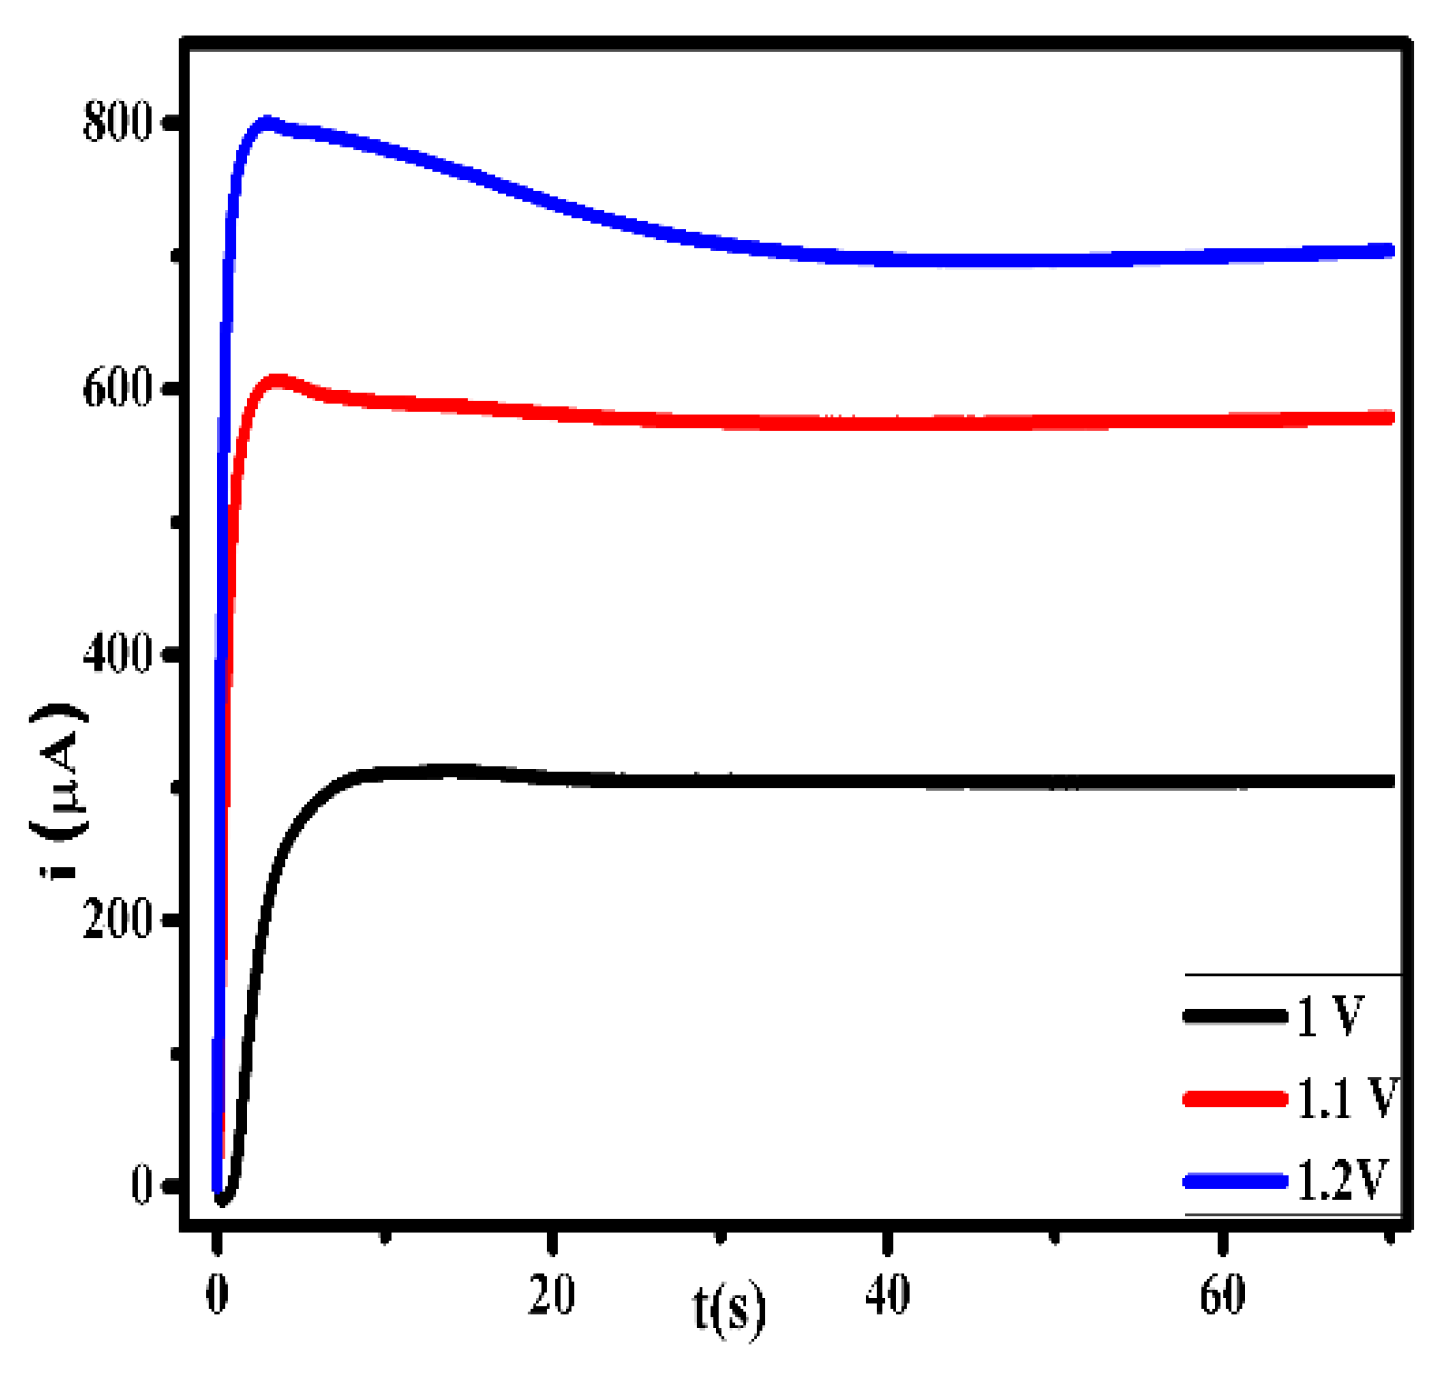
Figure 3.
Deconvolution of the experimental i–t transient recorded at 1.1 V, used to identify the NGMs during PPy electropolymerization.
Figure 3.
Deconvolution of the experimental i–t transient recorded at 1.1 V, used to identify the NGMs during PPy electropolymerization.
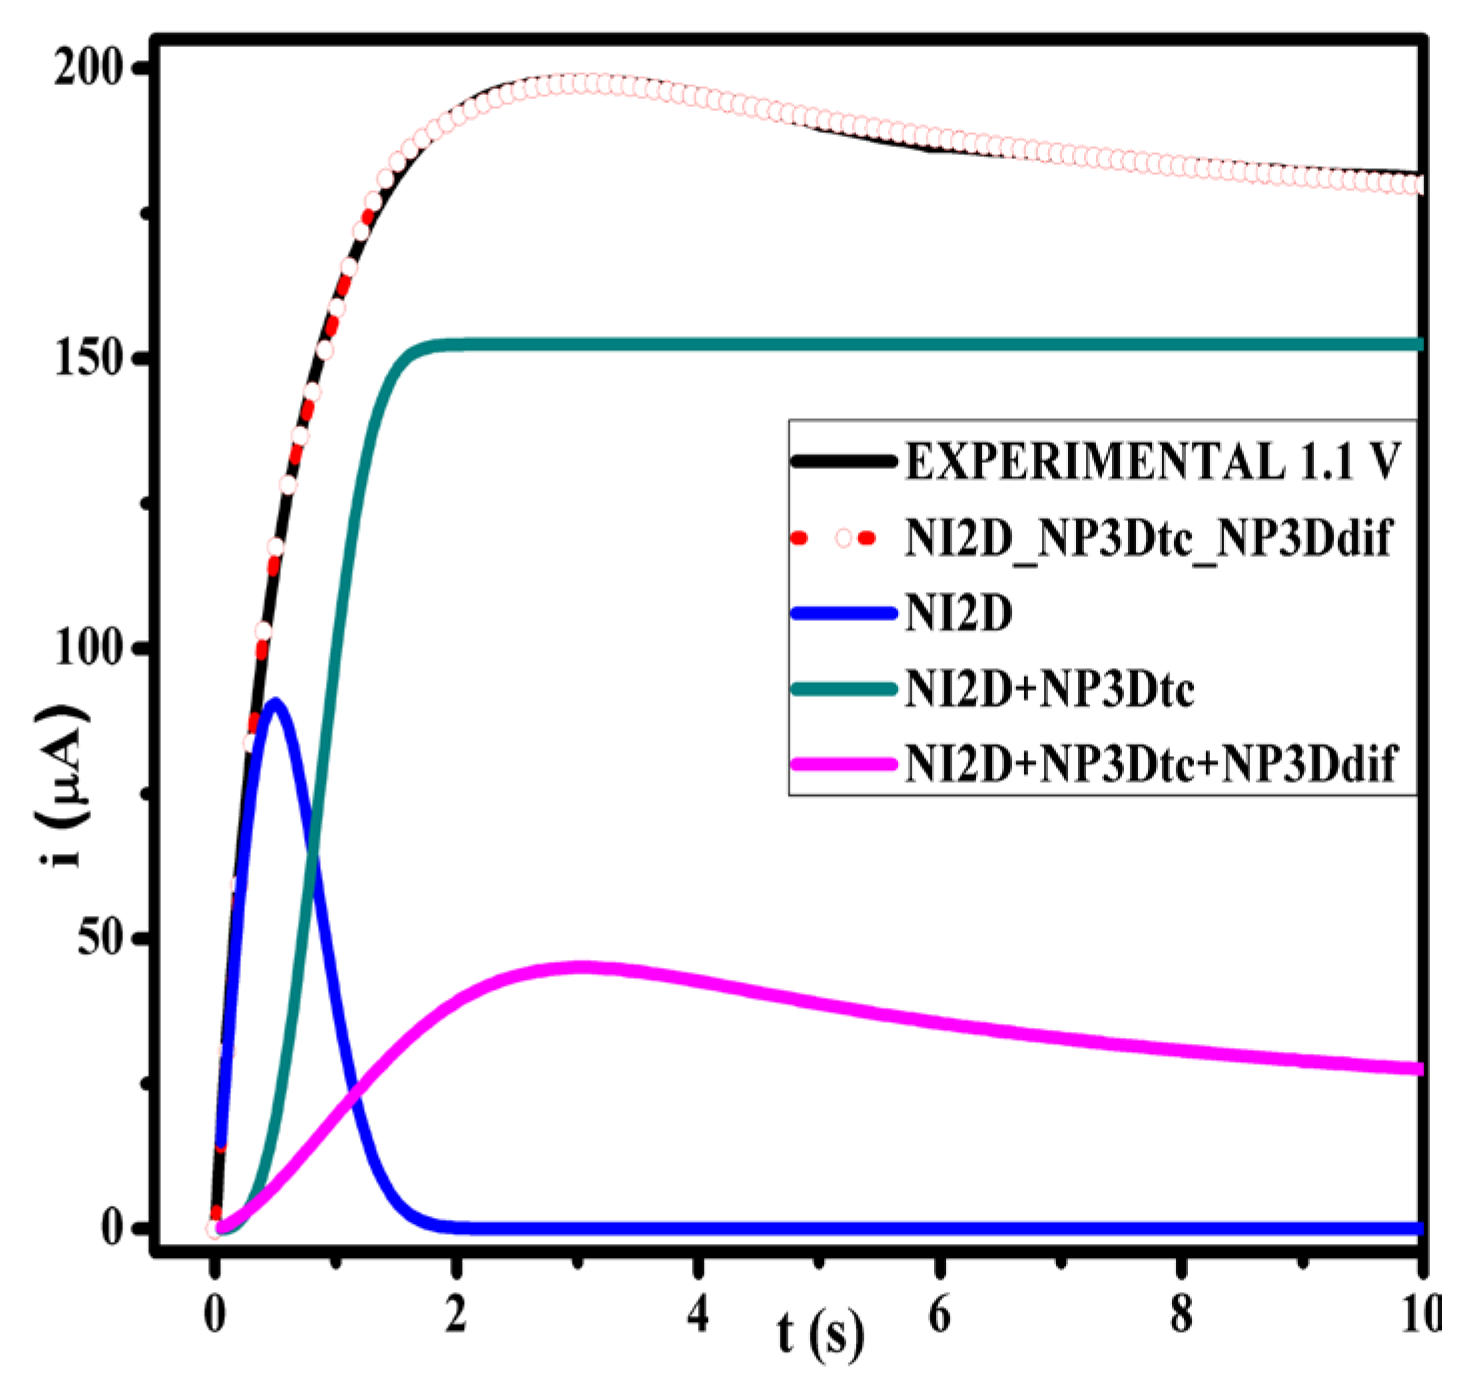
Figure 4.
Growth of the PPy film by multipulse amperometry, showing the evolution of the i-t transient over 10 cycles.
Figure 4.
Growth of the PPy film by multipulse amperometry, showing the evolution of the i-t transient over 10 cycles.
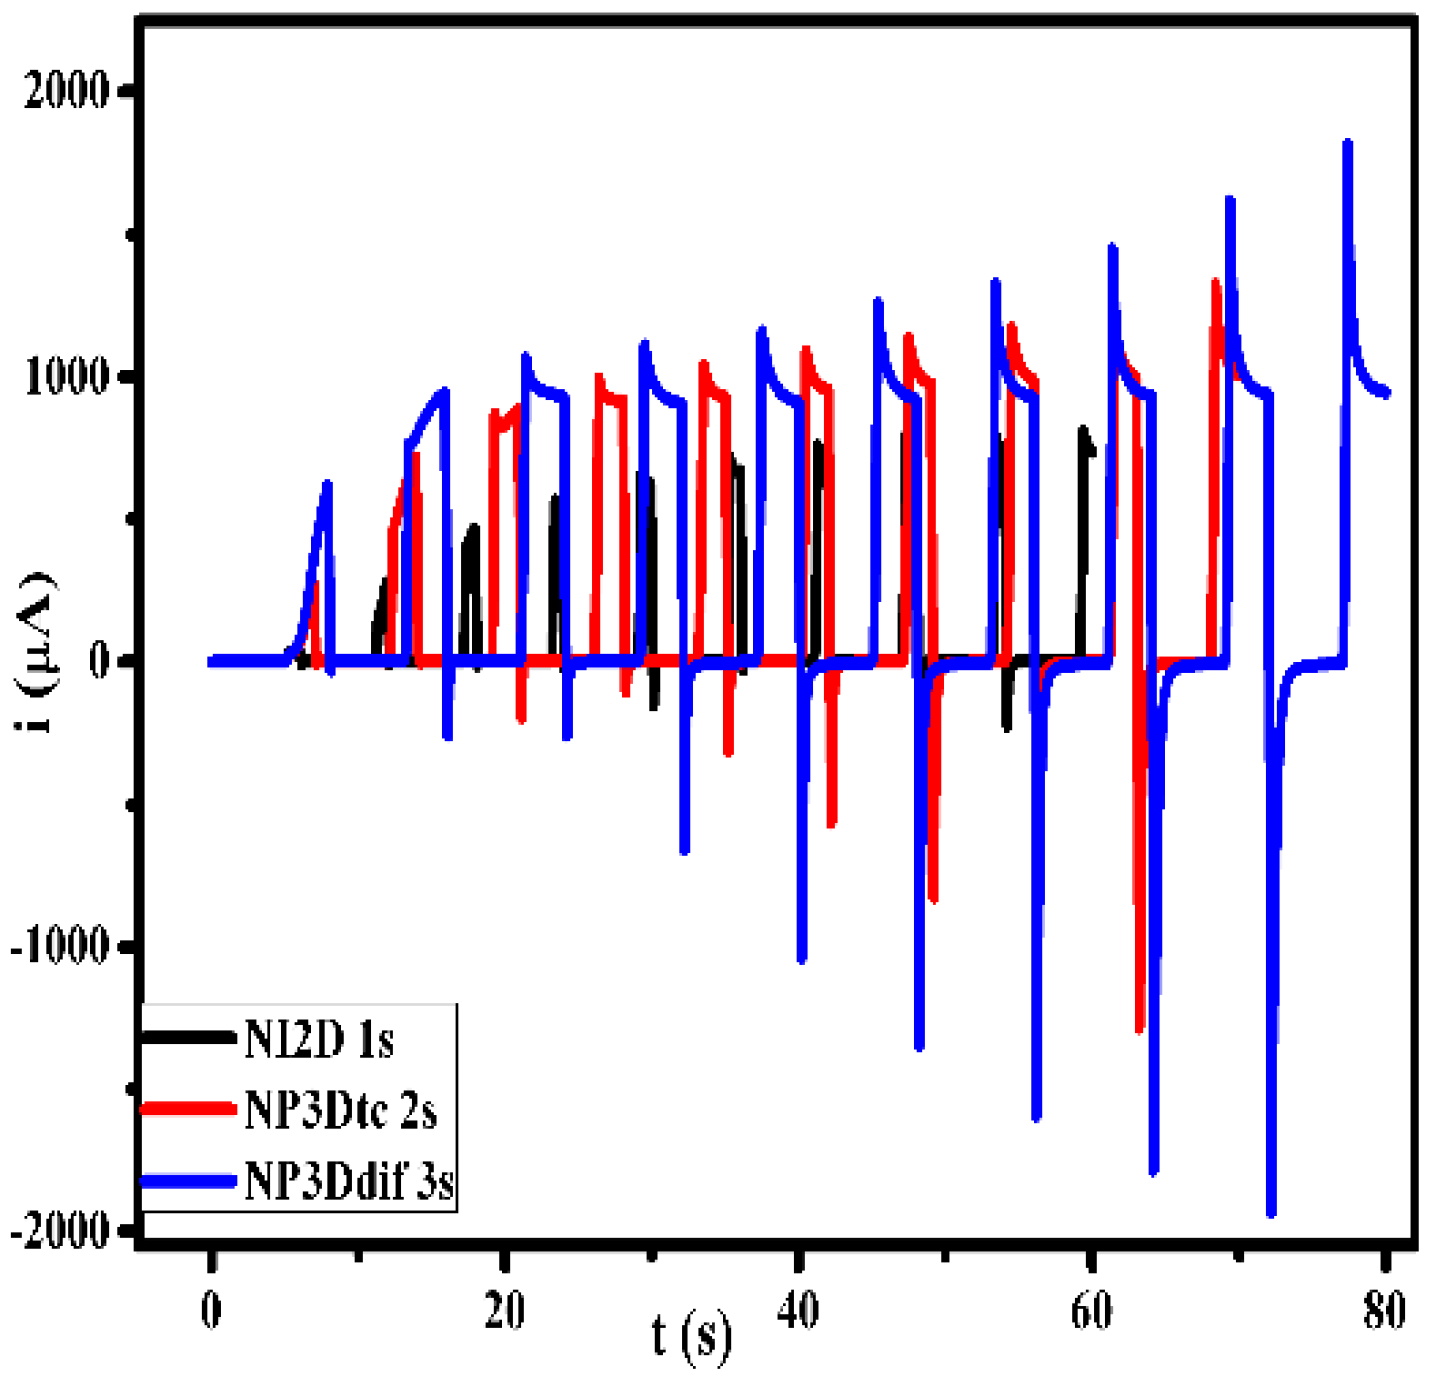
Figure 5.
ITO electrode coated with PPy films synthesized at different deposition times: (a) 1 s, corresponding to 2D instantaneous nucleation (NI2D); (b) 2 s, corresponding to NI2D + 3D progressive nucleation controlled by charge transfer (NP3Dtc); (c) 3 s, corresponding to NI2D + NP3Dtc + diffusion-controlled 3D progressive nucleation (NP3Ddif).
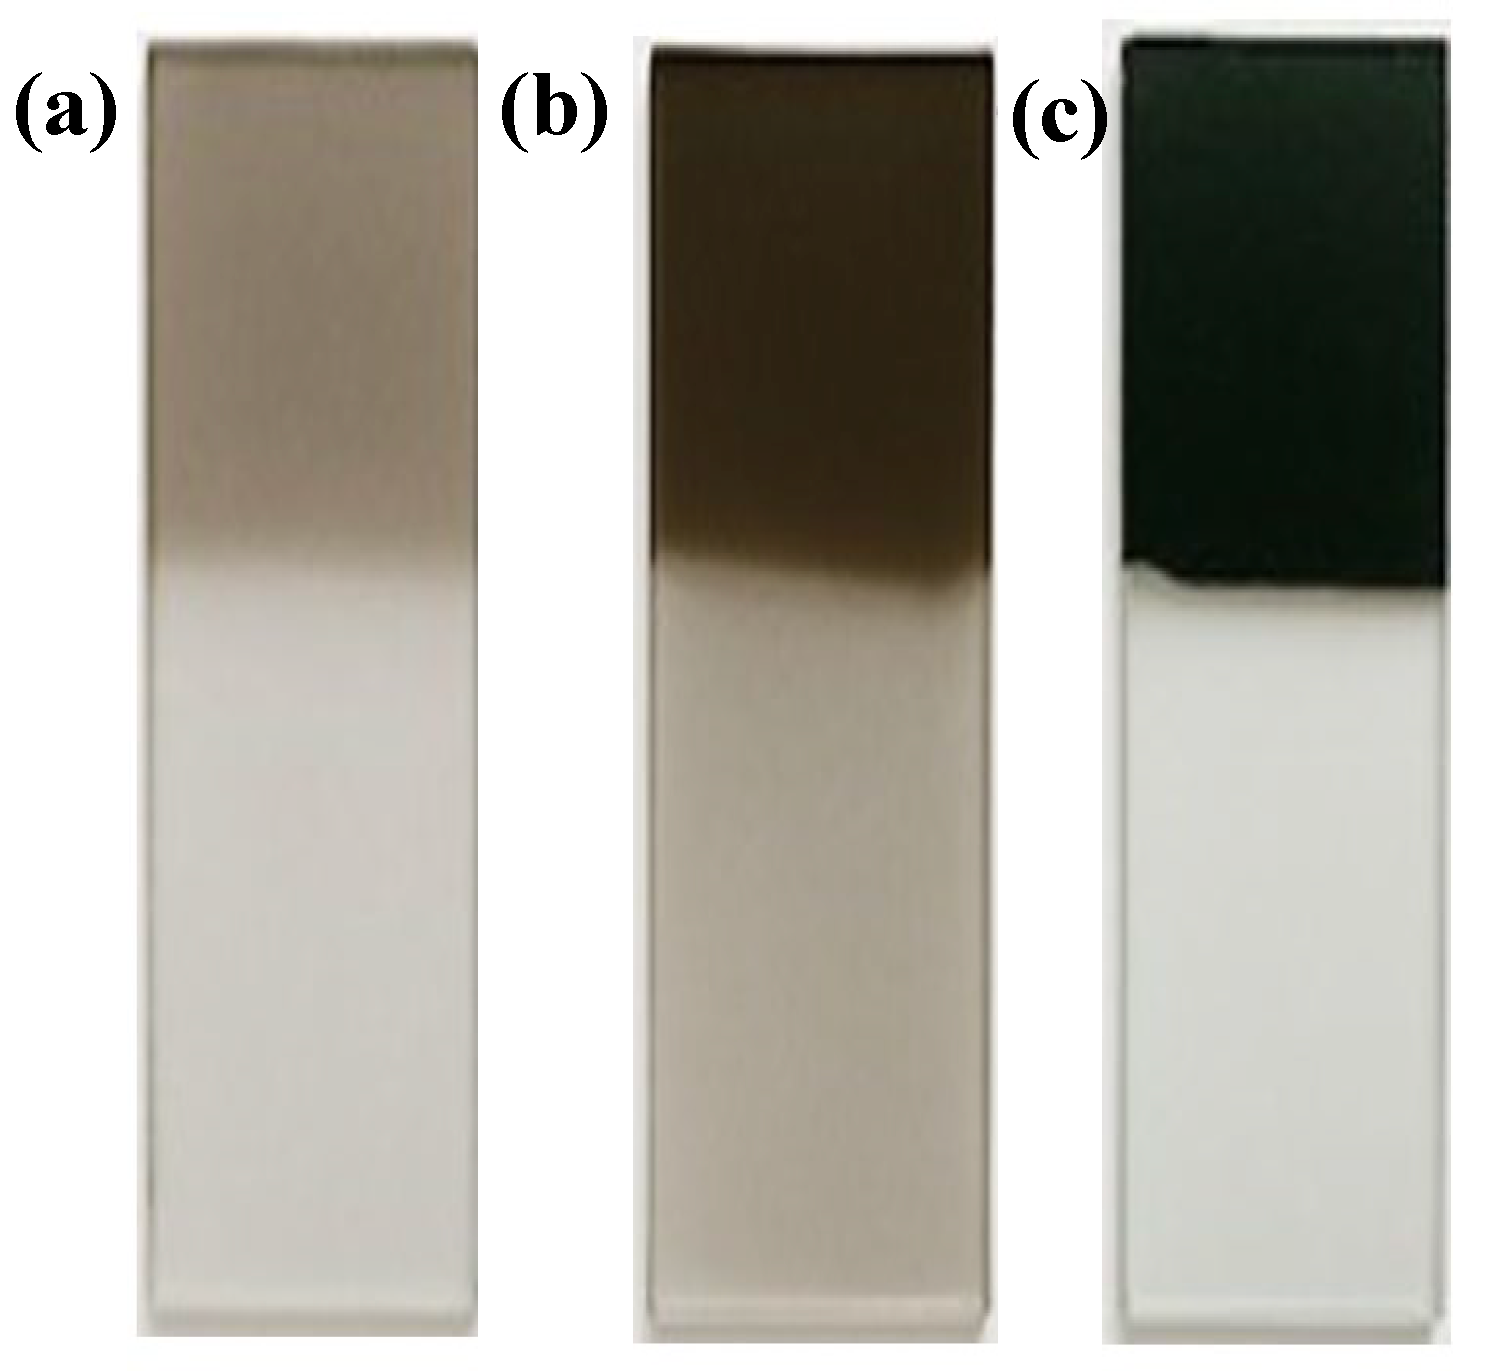
Figure 6.
UV–Vis absorption spectra recorded for each polymerization sample: (a) NI2D, (b) NI2D + NP3Dtc, (c) NI2D + NP3Dtc + NP3Ddif.
Figure 6.
UV–Vis absorption spectra recorded for each polymerization sample: (a) NI2D, (b) NI2D + NP3Dtc, (c) NI2D + NP3Dtc + NP3Ddif.
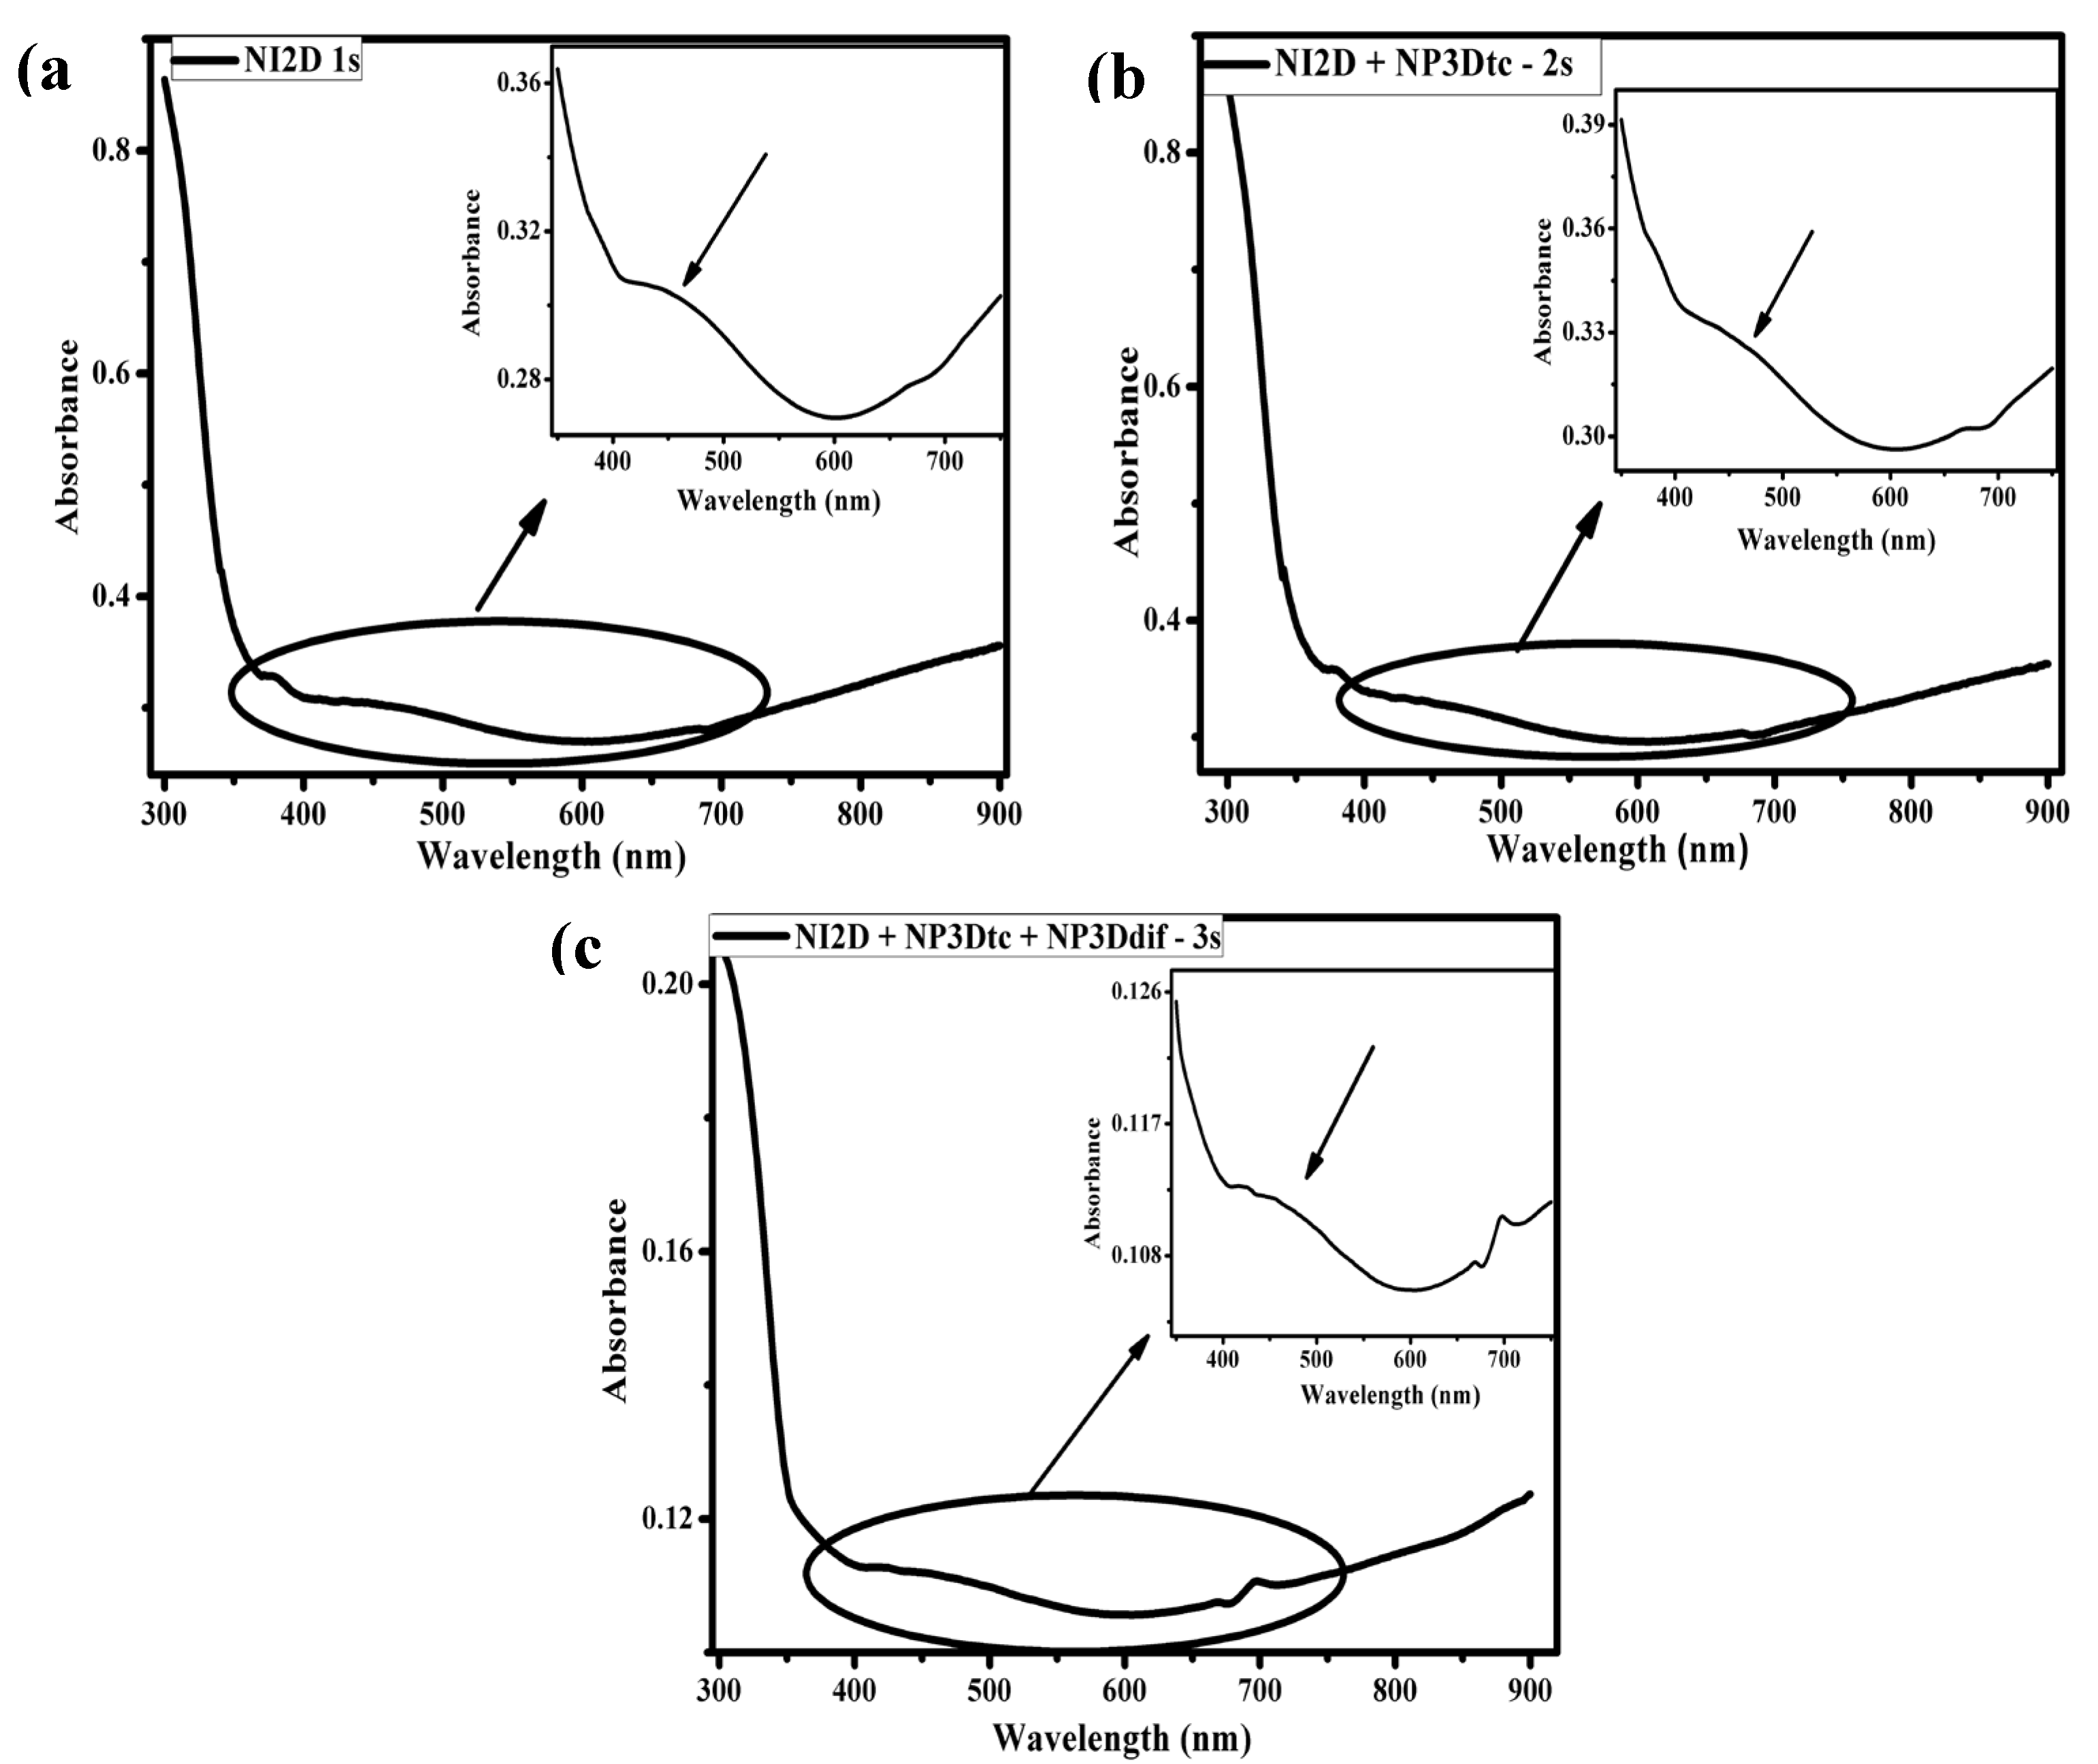
Figure 7.
Band-gap calculation by the Tauc method: (a) NI2D, (b) NI2D + NP3Dtc, (c) NI2D + NP3Dtc + NP3Ddif; (d) band gap vs. NGM.
Figure 7.
Band-gap calculation by the Tauc method: (a) NI2D, (b) NI2D + NP3Dtc, (c) NI2D + NP3Dtc + NP3Ddif; (d) band gap vs. NGM.
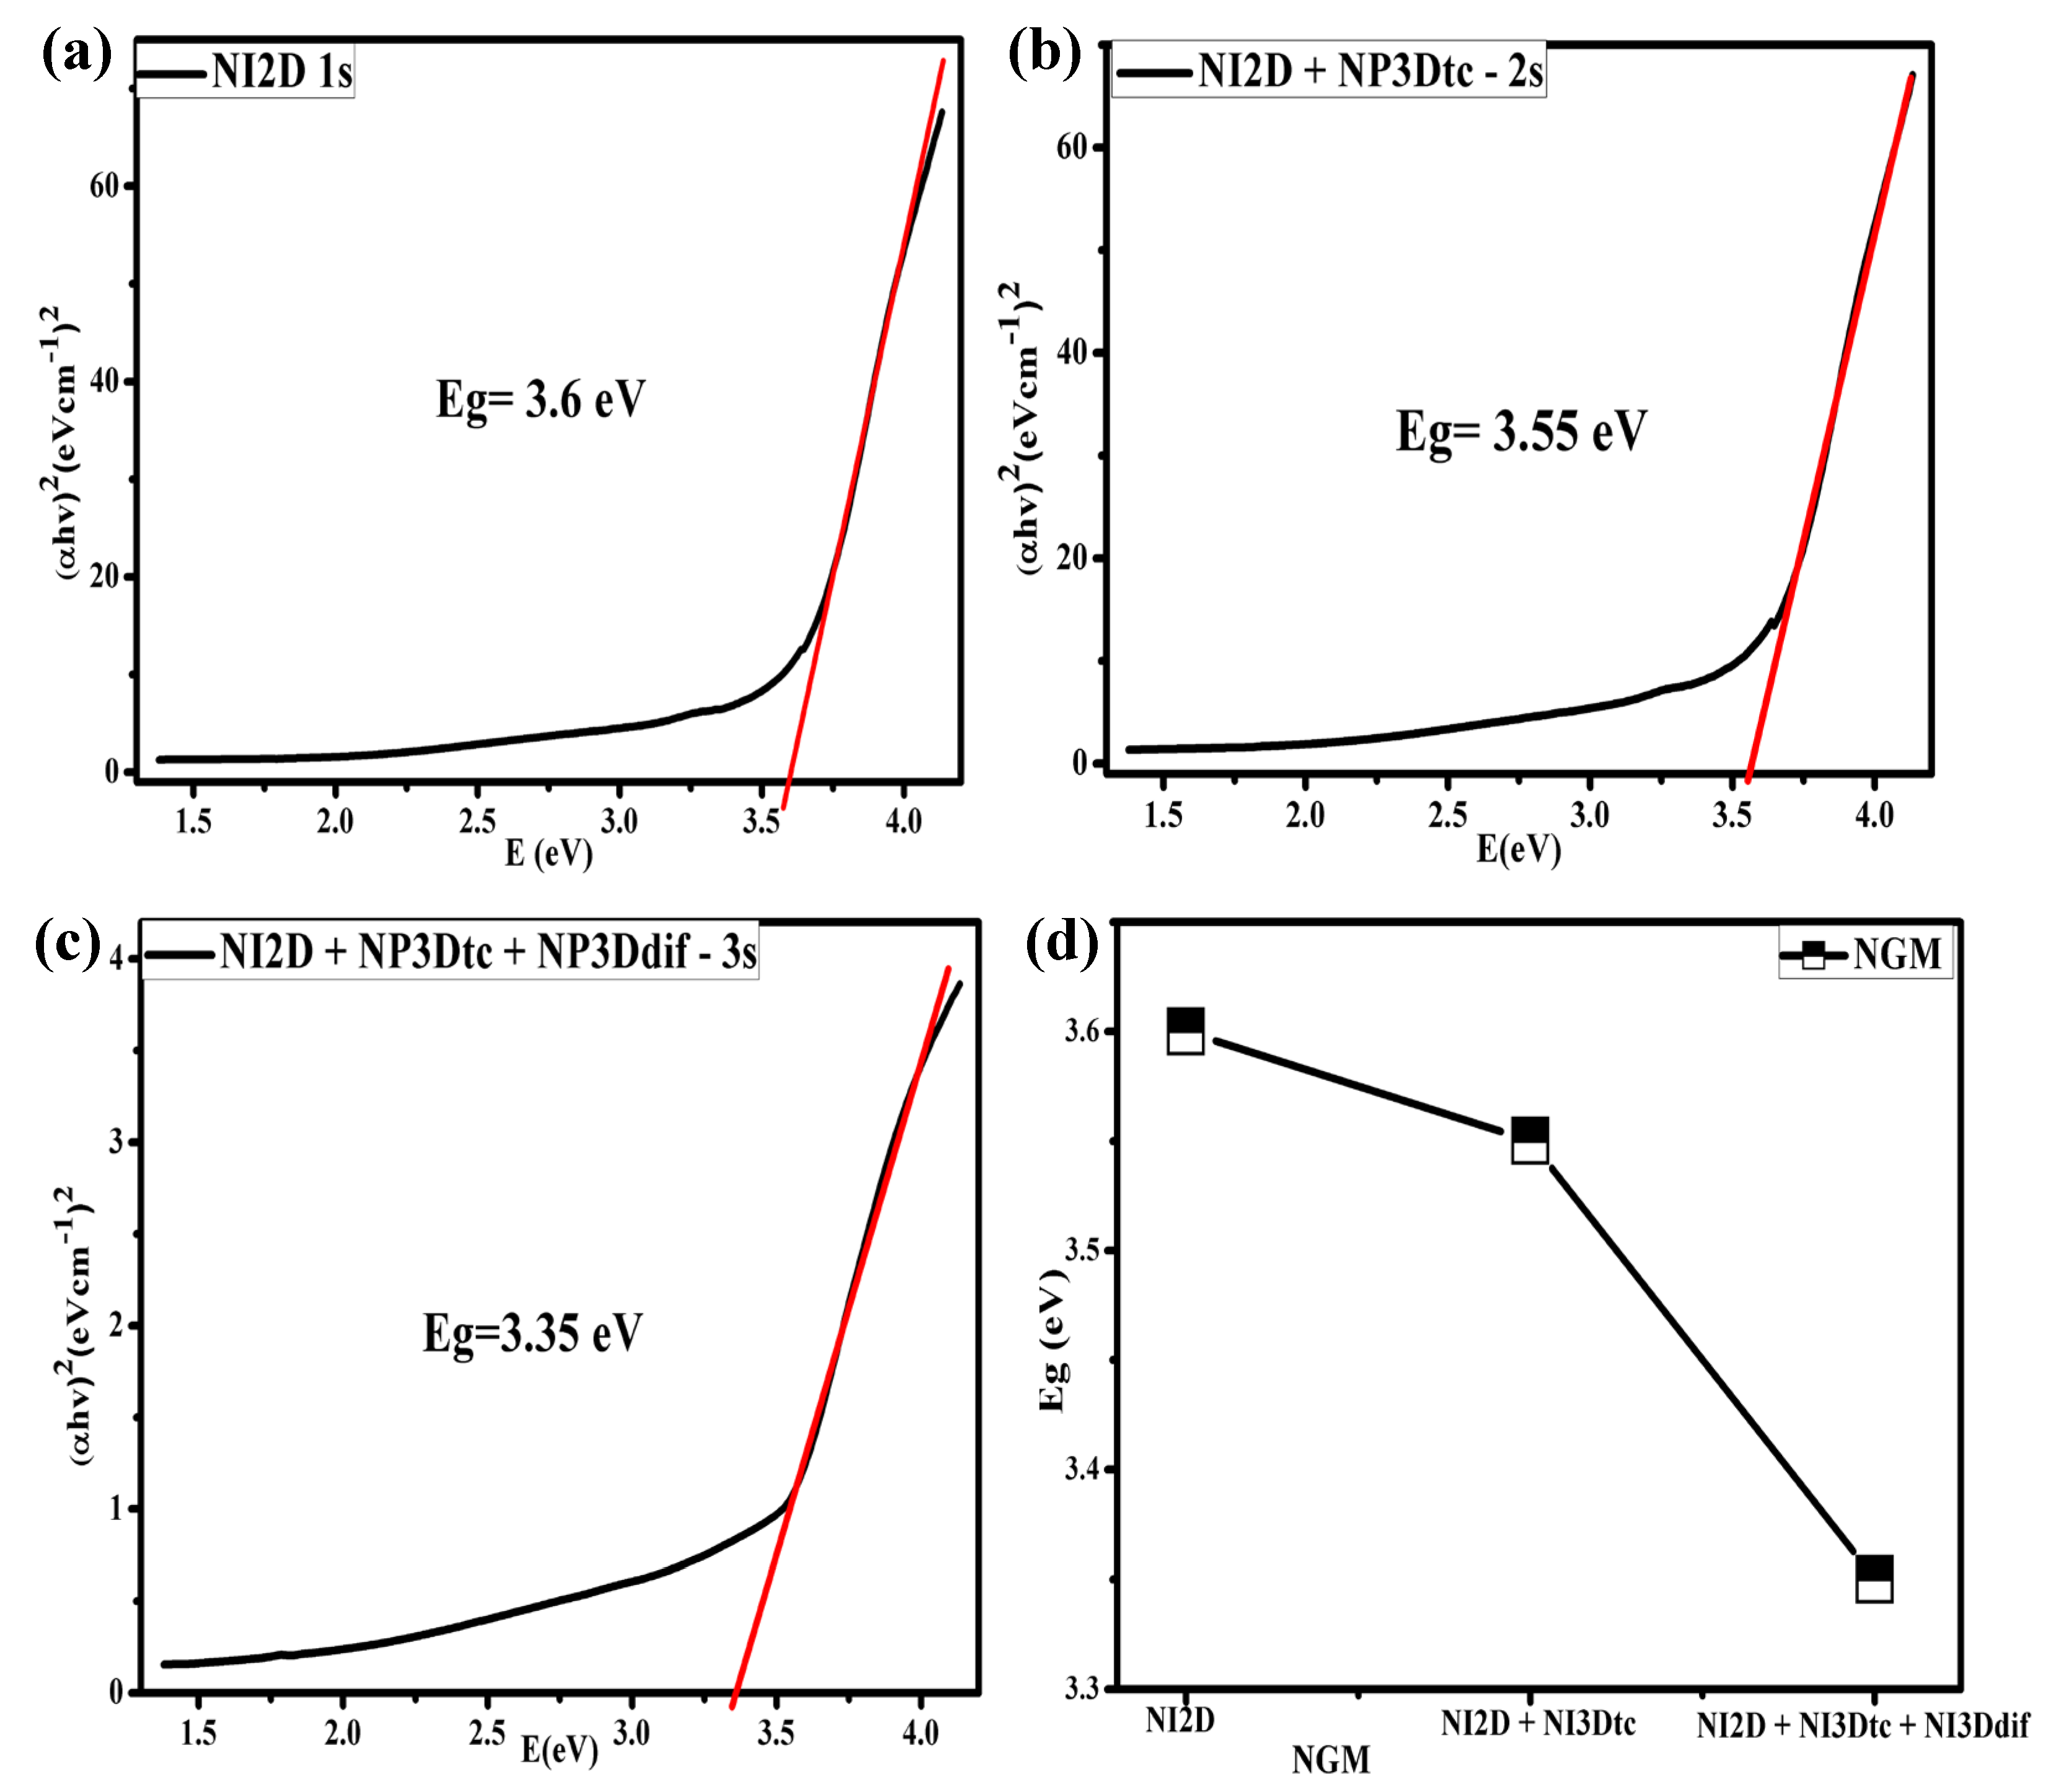
Figure 8.
SEM micrographs of the PPy film synthesized under NI2D conditions: (a) 5000× magnification; (b) 10000× magnification; (c) controlled synthesis obtained at a deposition time of 1 s over 10 cycles.
Figure 8.
SEM micrographs of the PPy film synthesized under NI2D conditions: (a) 5000× magnification; (b) 10000× magnification; (c) controlled synthesis obtained at a deposition time of 1 s over 10 cycles.
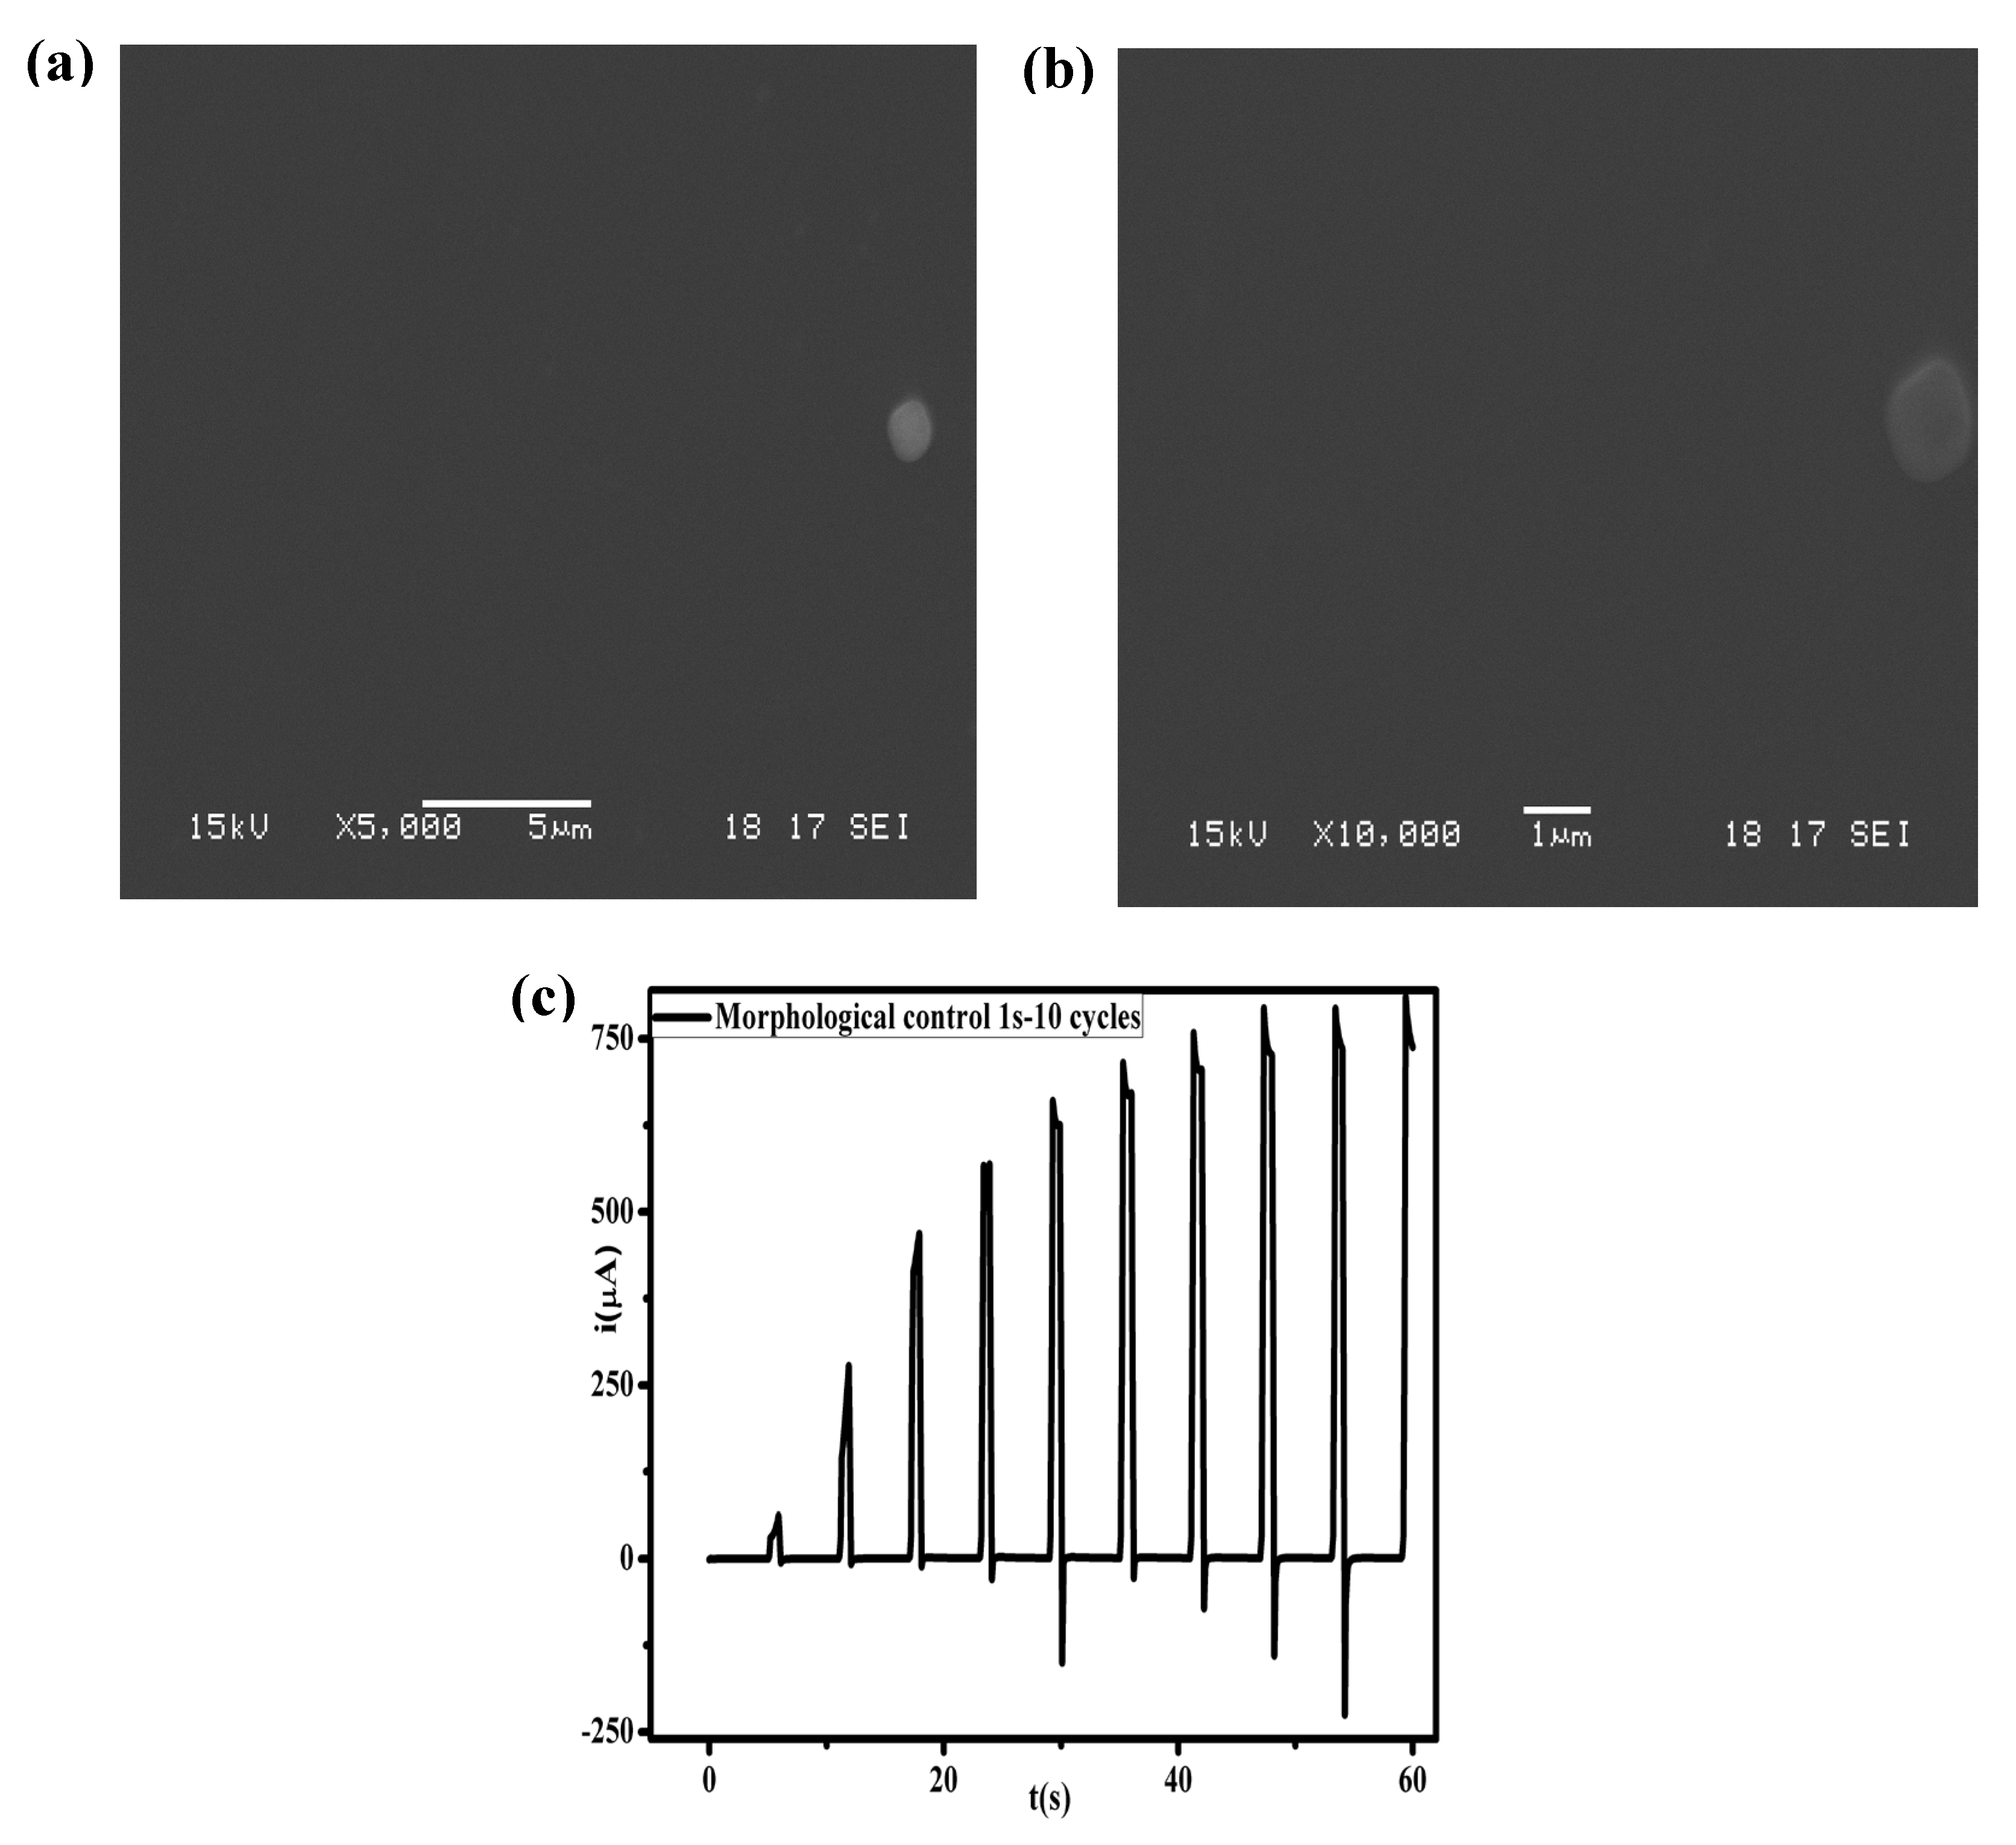
Figure 9.
SEM micrographs of the PPy film synthesized under NI2D + NP3Dtc conditions: (a) 5000× magnification; (b) 10000× magnification; (c) controlled synthesis obtained at a deposition time of 2 s over 10 cycles.
Figure 9.
SEM micrographs of the PPy film synthesized under NI2D + NP3Dtc conditions: (a) 5000× magnification; (b) 10000× magnification; (c) controlled synthesis obtained at a deposition time of 2 s over 10 cycles.
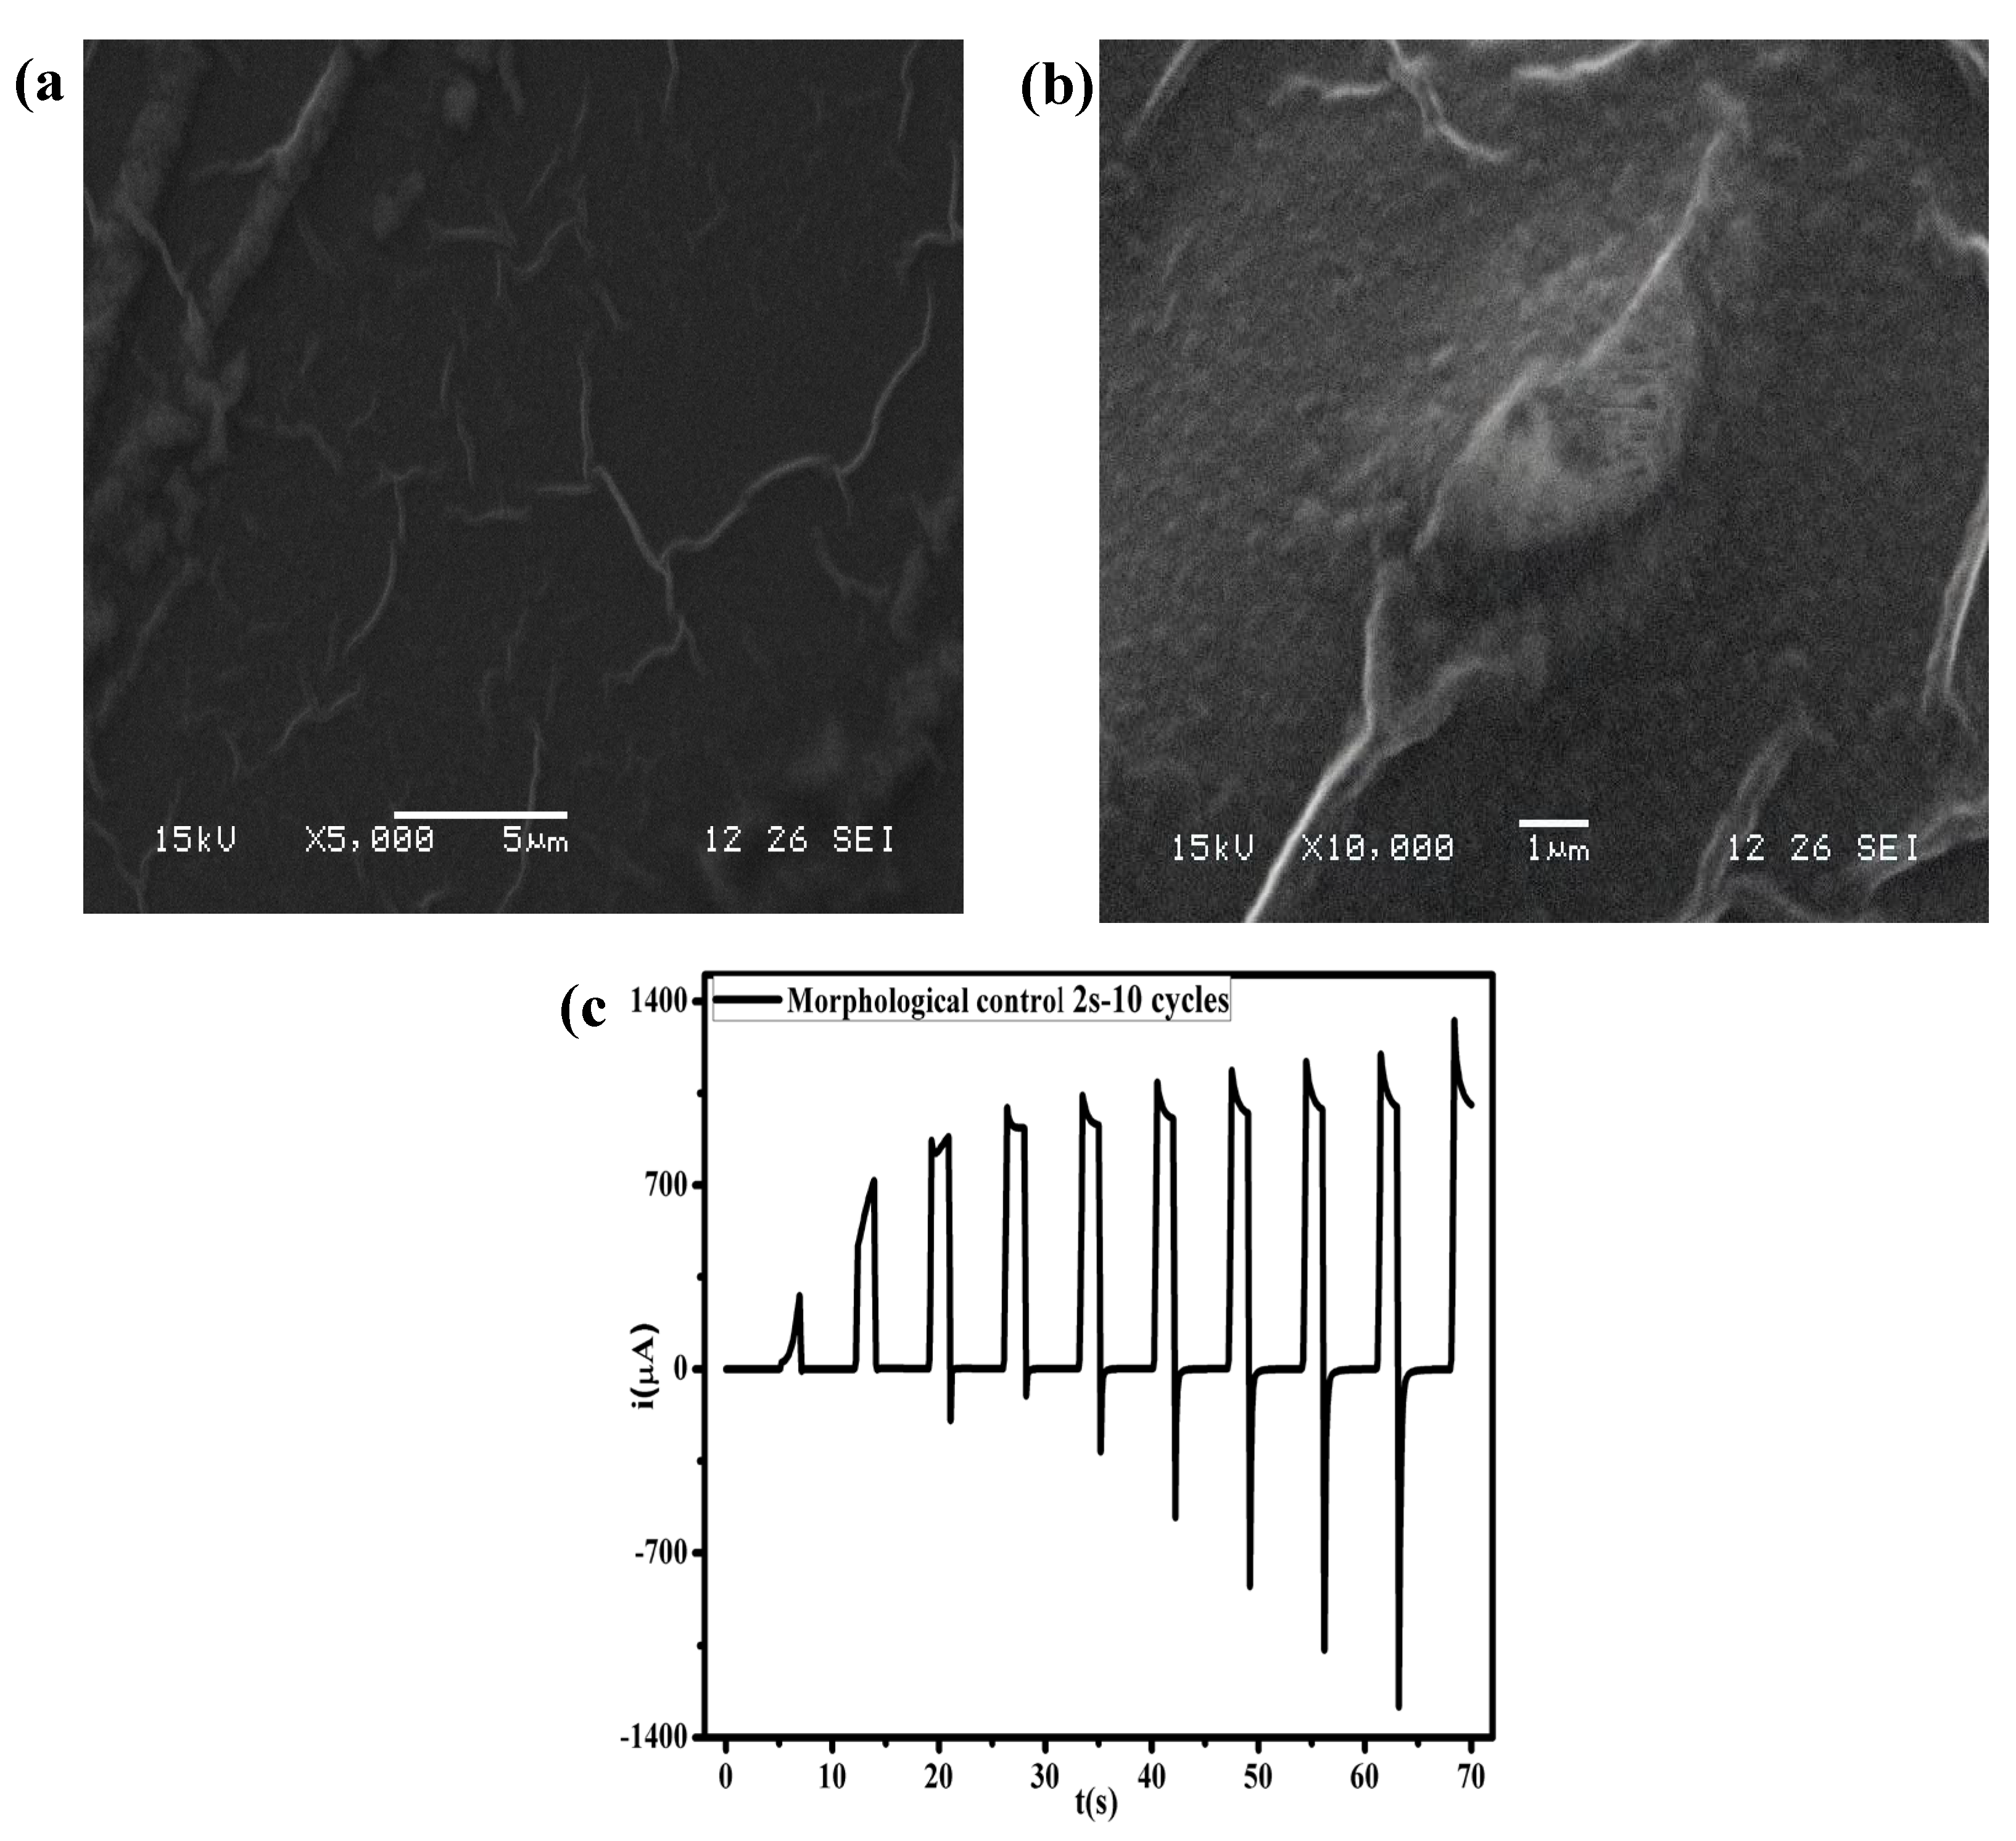
Figure 10.
SEM micrographs of the PPy film synthesized under NI2D + NP3Dtc + NP3Ddif conditions: (a) 5000× magnification; (b) 10000× magnification; (c) controlled synthesis obtained at a deposition time of 3 s over 10 cycles.
Figure 10.
SEM micrographs of the PPy film synthesized under NI2D + NP3Dtc + NP3Ddif conditions: (a) 5000× magnification; (b) 10000× magnification; (c) controlled synthesis obtained at a deposition time of 3 s over 10 cycles.
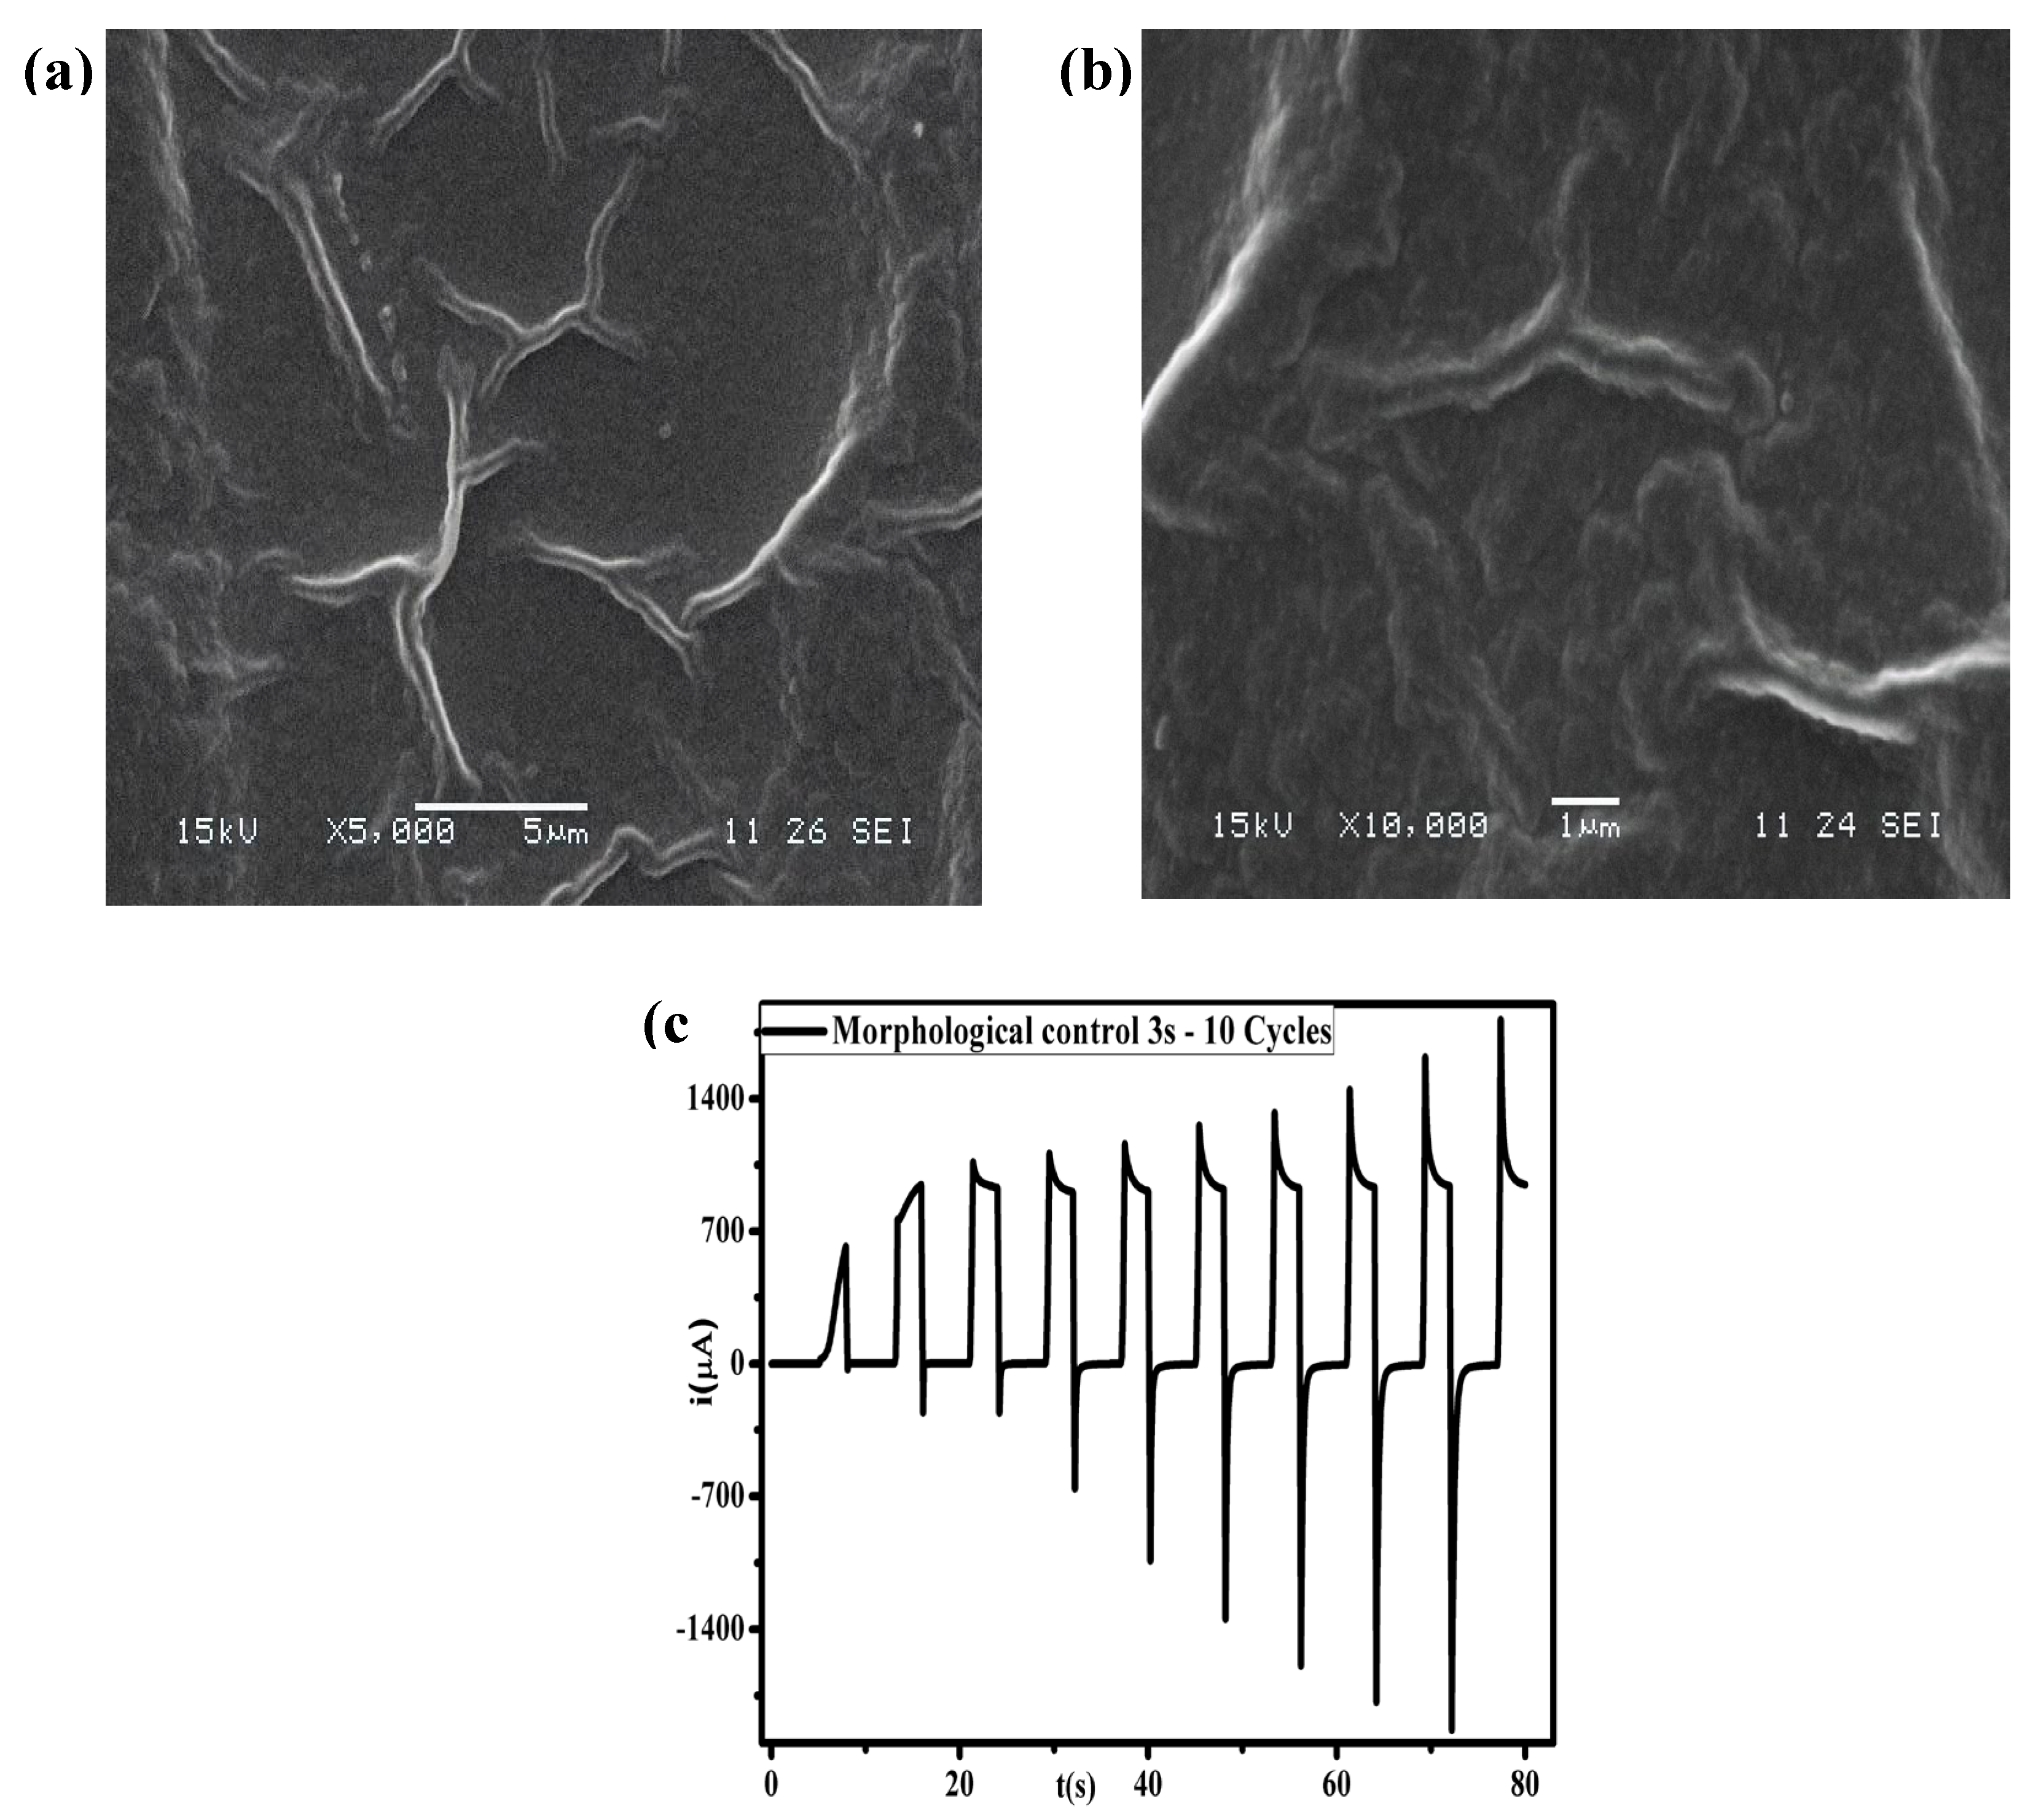
Figure 11.
X-ray diffraction patterns of PPy films electrodeposited by controlled synthesis.
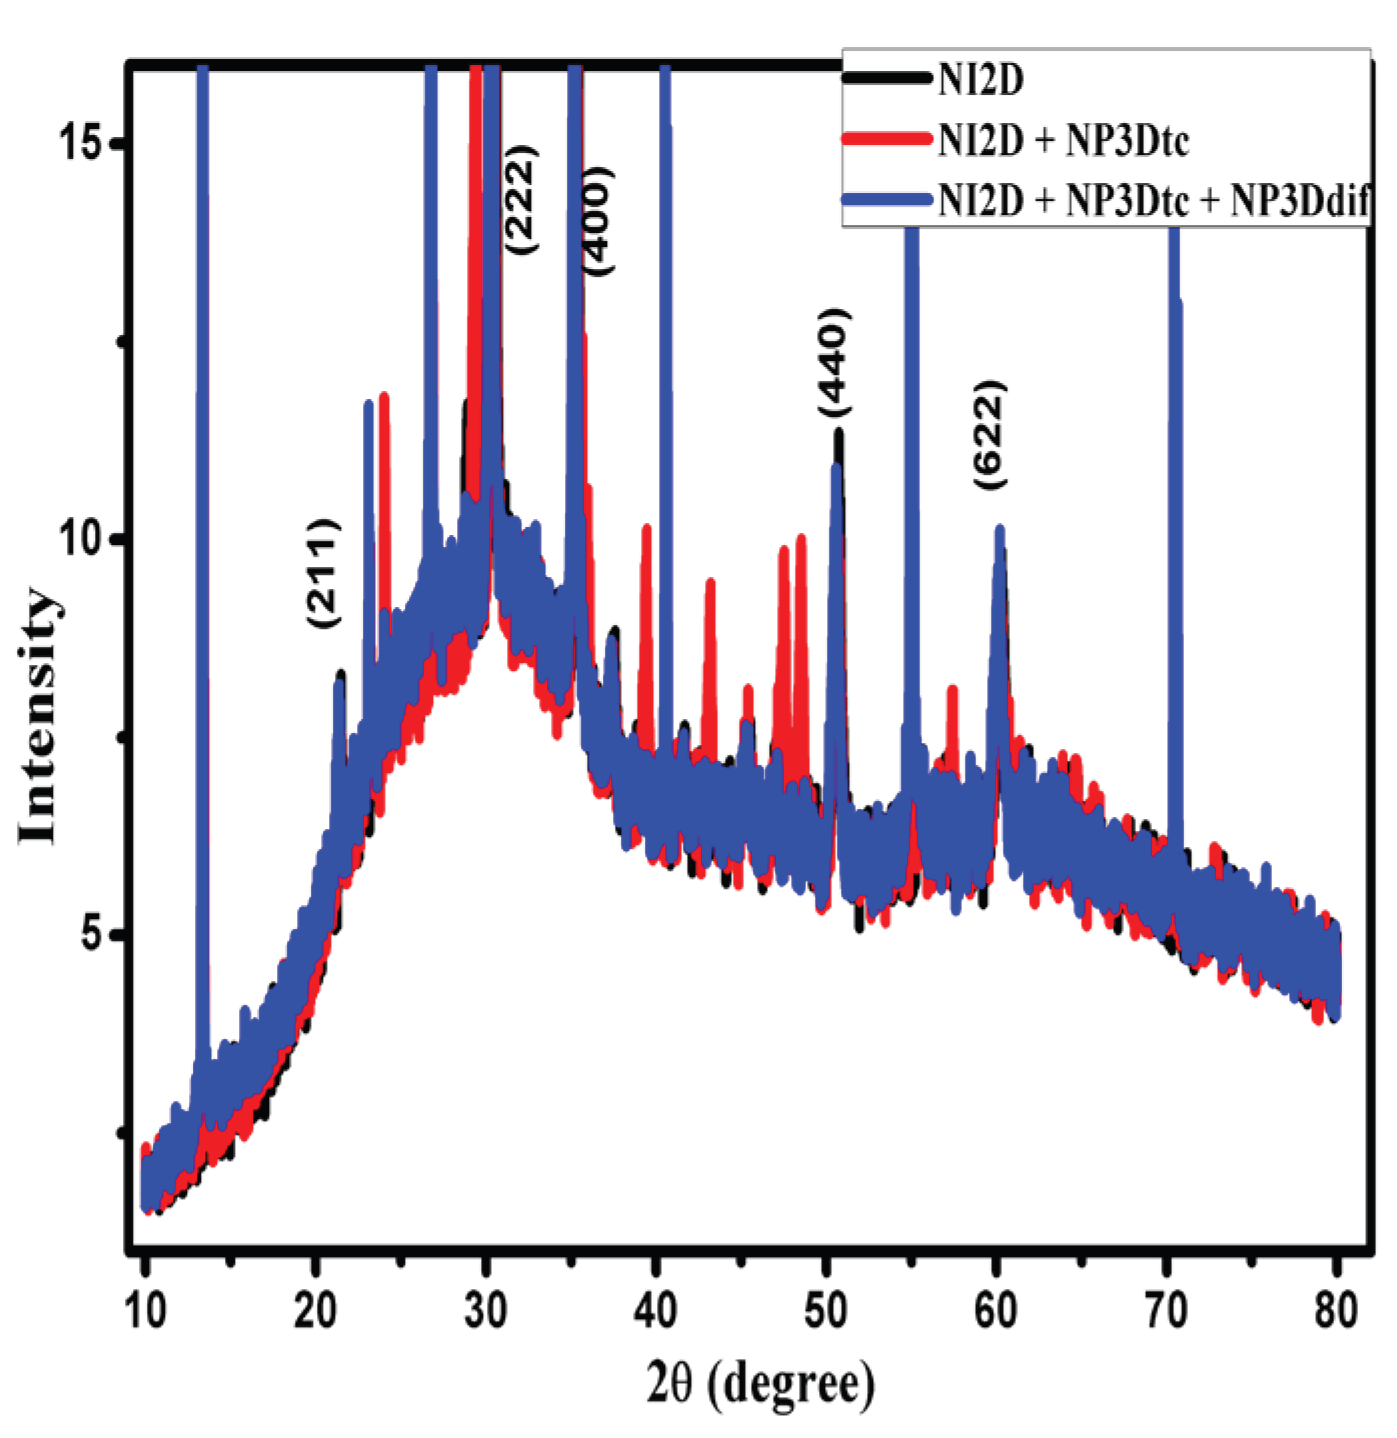

Table 1.
Representative mathematical models for NGM in the electropolymerization of PPy.
| Nucleation | Geometry | Mathematical expression |
| NI2D |  |
|
| NP2D |  |
|
| NI3Dtc |  |
|
| NP3Dtc |  |
|
| NI3Ddif |  |
|
| NP3Ddif |
Table 2.
Parameters obtained from the deconvolution of the i–t transient recorded at 1.1 V, corresponding to the different NGMs during PPy electropolymerization.
Table 2.
Parameters obtained from the deconvolution of the i–t transient recorded at 1.1 V, corresponding to the different NGMs during PPy electropolymerization.
| Polímero | E(V) | P1 | P2 | P3 | P4 | P5 | P6 | R2 |
| PPy | 1.1 | 300.761 | 2.028 | 152.403 | 1.0495 | 86.920 | 0.2529 | 0.999 |
Table 3.
Expressions of the parameters in Eq. 1.
| P1 | P2 | P3 | P4 | P5 | P6 |
Disclaimer/Publisher’s Note: The statements, opinions and data contained in all publications are solely those of the individual author(s) and contributor(s) and not of MDPI and/or the editor(s). MDPI and/or the editor(s) disclaim responsibility for any injury to people or property resulting from any ideas, methods, instructions or products referred to in the content. |
© 2026 by the authors. Licensee MDPI, Basel, Switzerland. This article is an open access article distributed under the terms and conditions of the Creative Commons Attribution (CC BY) license (http://creativecommons.org/licenses/by/4.0/).
Copyright: This open access article is published under a Creative Commons CC BY 4.0 license, which permit the free download, distribution, and reuse, provided that the author and preprint are cited in any reuse.


