Submitted:
26 January 2026
Posted:
28 January 2026
You are already at the latest version
Abstract
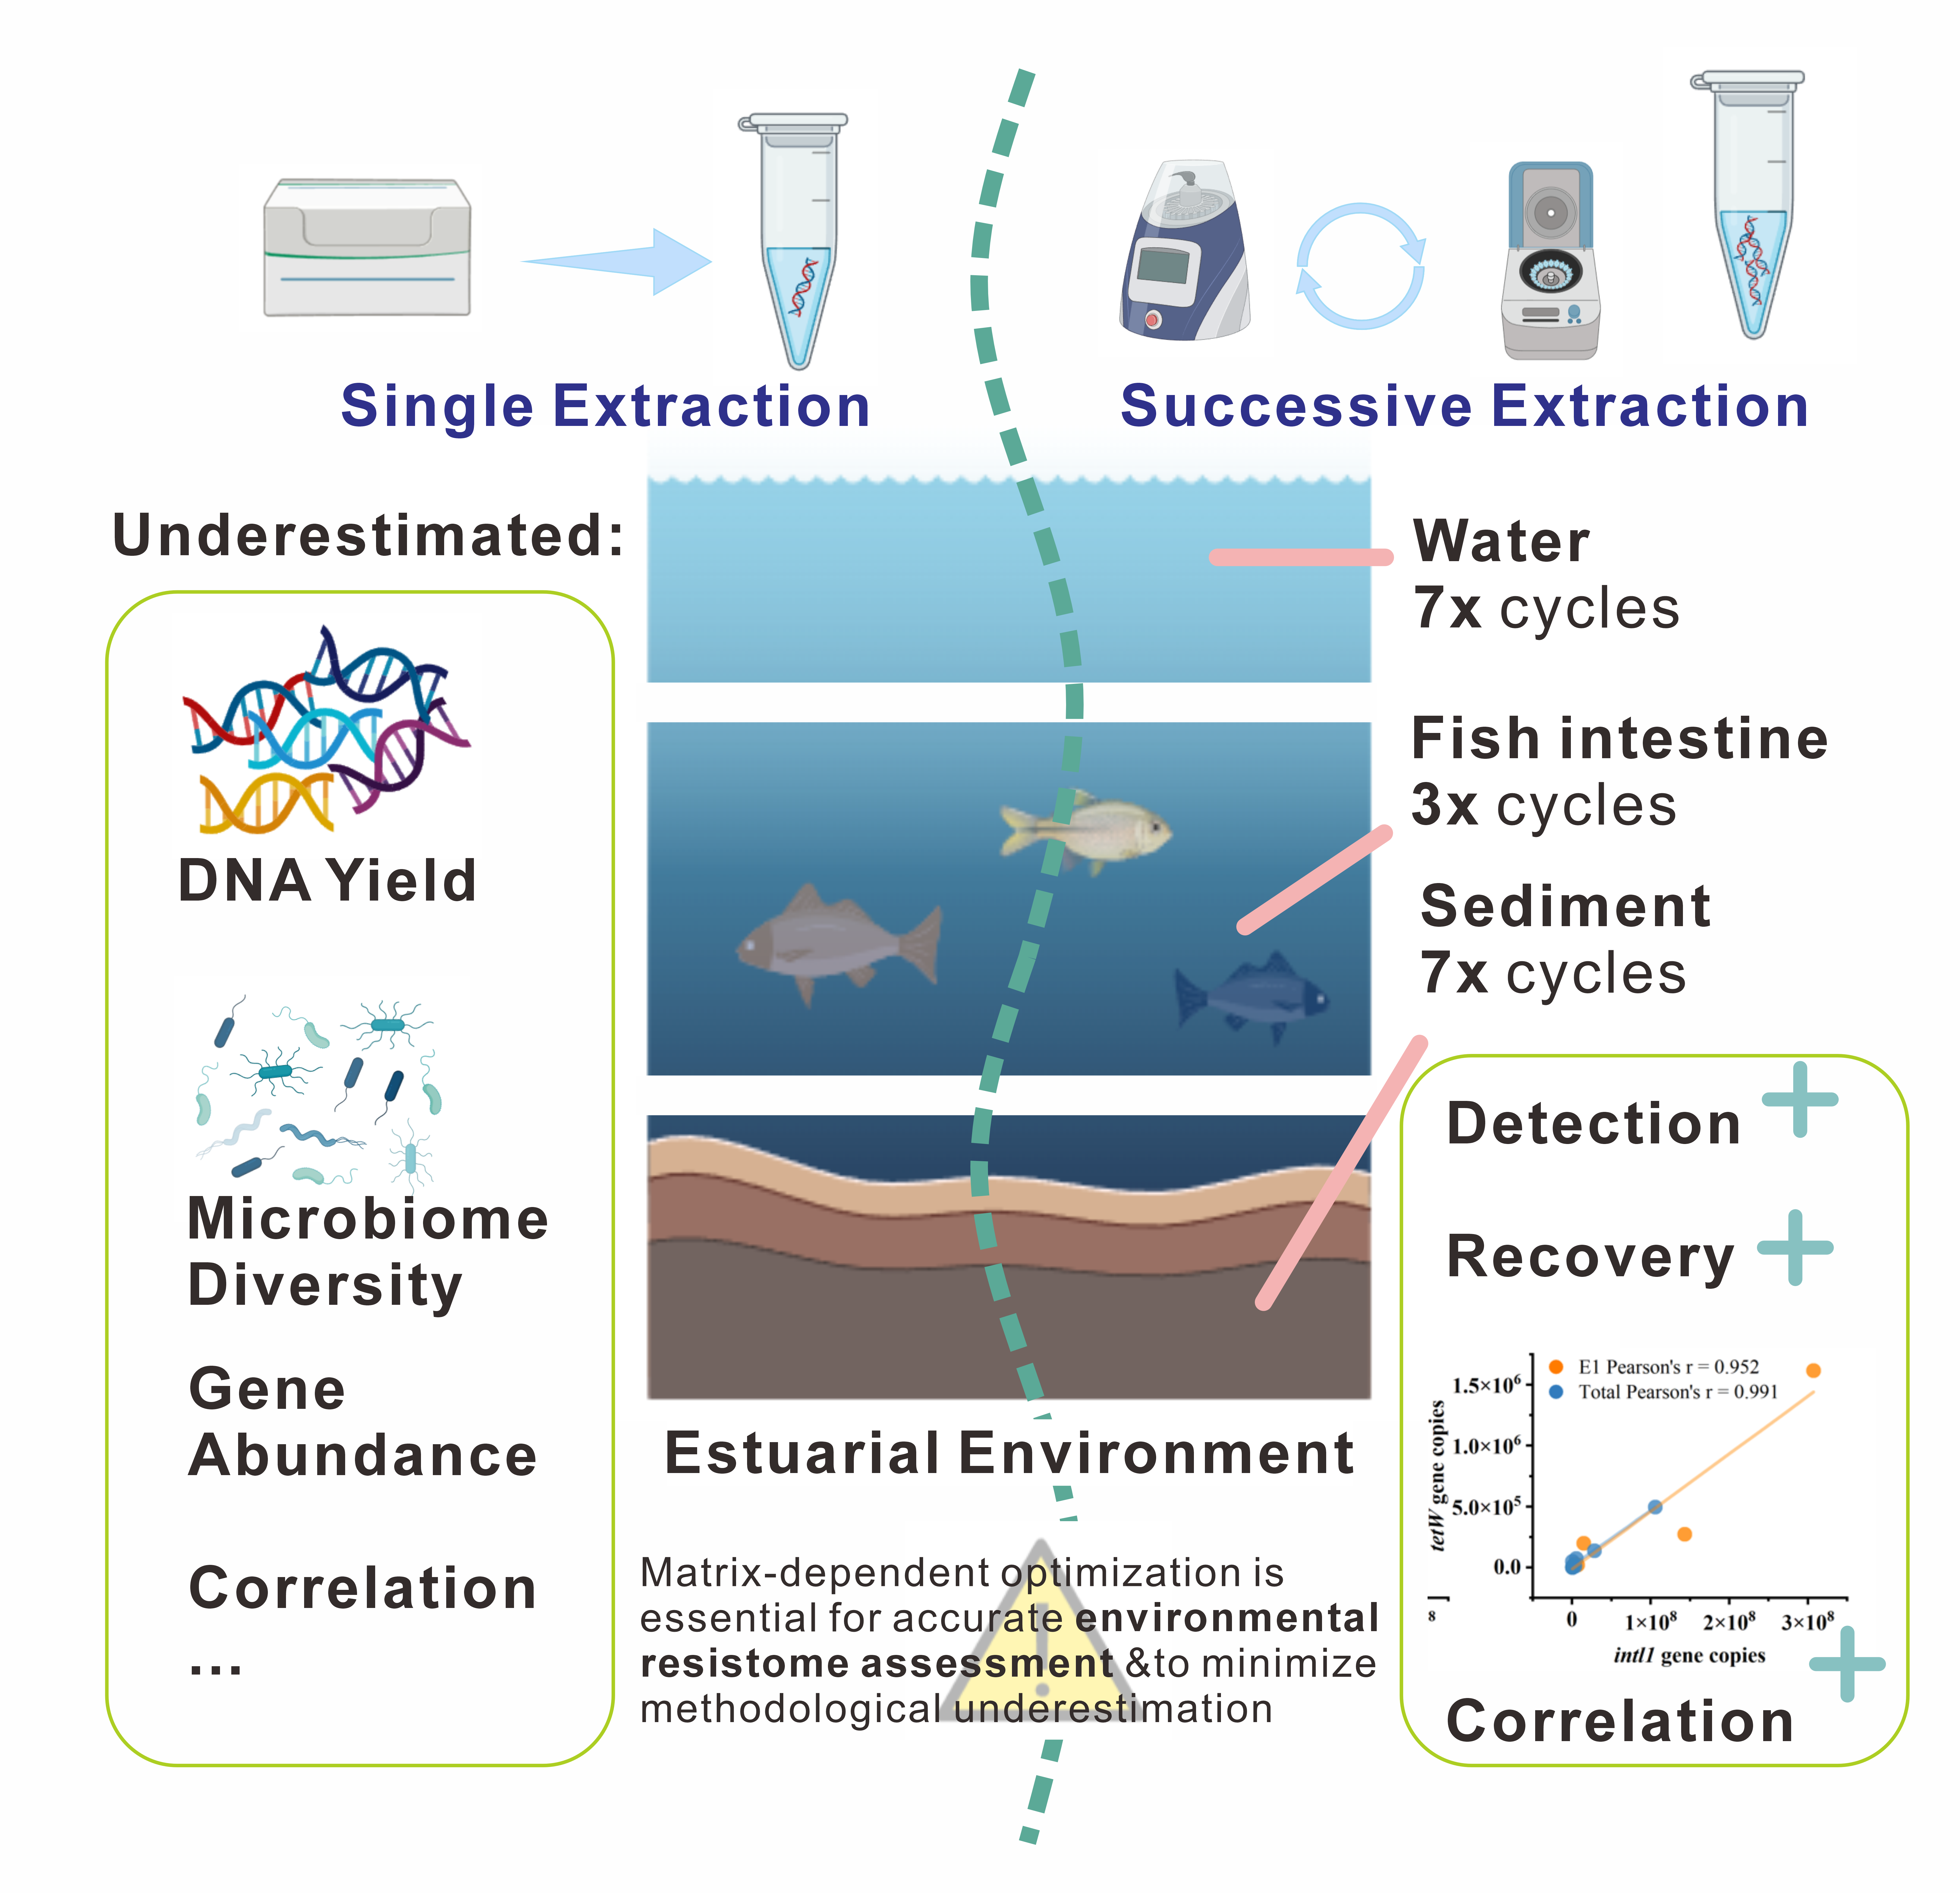
Antibiotic resistance gene (ARG) monitoring in environmental systems increasingly relies on DNA-based molecular approaches; however, the extent to which DNA extraction strategies bias downstream resistome interpretation remains insufficiently understood. This study systematically evaluated the effects of single versus successive DNA extraction on DNA recovery, microbial community composition, and the abundance and diversity of 385 genes related to antibiotic resistance including ARGs, mobile genetic elements (MGEs) across three contrasting matrices: water, sediment, and fish intestinal tissue. Successive extraction markedly increased DNA yield and detection of functional genes in water and sediment, particularly for low-abundance and particle-associated taxa. Enhanced recovery resulted in higher richness and abundance of ARGs and MGEs and strengthened correlations between intI1, ARGs, and bacterial taxa, indicating that single-cycle extraction may underestimate resistome magnitude and potential host associations in complex matrices. Conversely, biological tissue showed limited benefit or even reduced gene abundance with repeated extraction, likely due to rapid depletion of extractable nucleic acids and DNA degradation. While successive extraction improves recovery efficiency, the potential inclusion of extracellular or relic DNA suggests caution in interpreting inflated ARG abundance. Overall, our findings demonstrate that DNA extraction is a matrix-dependent methodological driver that can reshape both quantitative outcomes and ecological inference. Matrix-specific optimization and careful protocol selection are therefore essential for improving data comparability and minimizing methodological underestimation in environmental resistome assessments.
Keywords:
successive DNA extraction
; ARGs
; microbial community composition
; mobile genetic elements (MGEs)
; matrix-dependent effects
1. Introduction
Antibiotic resistance genes (ARGs) are now recognized as pervasive environmental contaminants with the potential to disseminate among pathogens via horizontal gene transfer, posing profound threats to public health and ecosystem stability [1,2]. Estuaries as dynamic convergence zones linking land, river, coastal ocean and human activity are increasingly identified as hotspots for ARG enrichment, transformation, and dispersal [3,4]. ARGs in estuarine systems exist not only in water but also within sediments [5] and host-associated microbiomes such as fish guts [6], forming multi-compartment resistome reservoirs and complex transmission pathways [7]. Yet, cross-matrix assessments integrating multiple biological and environmental compartments remain scarce, limiting holistic risk evaluation.
A critical methodological limitation lies in DNA extraction efficiency. Single-step extraction may lyse only a fraction of resistant cells, resulting in underestimated DNA yield, distorted microbial composition and undervalued ARG abundance. Strong empirical evidence supports this concern: activated sludge showed severe under-recovery of DNA without mechanical lysis [8]. In soils, successive extractions released additional ribosomal genes and uncovered previously undetected taxa [9,10]. In sediments and paddy soil, single extraction underestimated functional microbial groups including anammox bacteria [11]. Successive extraction of animal manure increased DNA yield substantially and altered dominant phyla from Proteobacteria to Firmicutes [12]. Similar findings were reported in estuarine sediments, where cumulative extraction elevated DNA 1.8‒3.1 fold and improved ARG and intI1 detectability [13]. Collectively, these studies demonstrate that extraction bias propagates into downstream resistome interpretation and risk assessment.
Quantitative PCR (qPCR) and high-throughput qPCR (HT-qPCR) are widely applied for ARG quantification. qPCR enables precise absolute quantification of specific targets [14], while HT-qPCR allows simultaneous detection of hundreds of ARGs, mobile elements and host markers, greatly enhancing profiling capacity [15,16]. Compared with metagenomics, HT-qPCR often offers higher sensitivity for low-abundance ARGs, though the two approaches are complementary rather than interchangeable [17,18]. Standardization of sample processing, especially DNA extraction, has been repeatedly emphasized as essential for generating comparable resistome datasets across studies and environments [19].
However, no study has systematically examined how successive DNA extractions influence ARG quantification and microbial community profiles across multiple estuarine matrices (water, sediment and fish gut). To address this research gap, we compare three commercial extraction kits with successive extraction cycles in the Yangtze River Estuary, assessing impacts on DNA yield, ARG detection sensitivity (qPCR/HT-qPCR), and microbial community resolution. Findings aim to establish optimized extraction strategies and provide methodological standards for estuarine resistome surveillance.
2. Materials and Methods
2.1. Study Area, Sample Collection and Pretreatment
In July 2025, water, sediment, and fish samples were collected from Sanjiagang (SJG), a representative site in the Yangtze Estuary, China (Figure 1). In situ pH and salinity were measured with a Multi 3630 IDS multiparameter system (WTW, Germany). Water samples were obtained with a plexiglass sampler and stored in sterilized polypropylene bottles. Surface sediments were collected using a stainless-steel grab sampler and sealed in sterile plastic bags. Fish specimens were captured with trawl nets (mesh size: 1.5 cm; net width: 9 m). All samples were immediately transported to the laboratory on ice.
In the laboratory, 0.8 L of each water sample was filtered through sterile mixed cellulose ester membrane filters (0.2 μm pore size, 50 mm diameter; Whatman, Cytiva, UK) to retain microbes. Sediment samples were homogenized aseptically. The fish specimen was photographed, measured, and identified as Pampus argenteus (details provided in Supplementary Information S1–2.1). After rinsing with deionized water, the intestines were aseptically dissected using sterile scalpels and forceps. Filters, sediments, and intestinal contents were preserved at −80 °C in sterile cryovials until DNA extraction.
2.2. DNA Extraction and Quality Evaluation
The efficiency of total DNA extraction is a key determinant for accurate characterization of microbial communities, functional genes, and antibiotic resistance profiles. In this study, a modified extraction protocol was developed with reference to previous improvements [13,20] and optimized for different environmental matrices, including water, sediment, and fish intestinal contents (Figure 2). Six commercial DNA extraction kits from three manufacturers‒Yeasen Biotechnology (China), MP Biomedicals (USA), and Qiagen (Germany)‒were evaluated for extraction efficiency. Specifically, the MolPure® Soil DNA Kit (Yeasen), FastDNATM Spin Kit for Soil (MP Biomedicals), and DNeasy® PowerSoil® Pro Kit (Qiagen) were used for water and sediment samples, while the MolPure® Cell/Tissue DNA Kit (Yeasen), SPINeasyTM DNA Kit for Tissue with Lysing Matrix (MP Biomedicals), and DNeasy® Blood & Tissue Kit (Qiagen) were used for biological samples.
2.2.1. DNA Extraction from Sediment and Water Samples
For sediment samples, approximately 0.4 g (wet weight) was used per replicate, and for water samples, microorganisms collected on 0.22 μm membranes from 0.8 L of water (half filter per replicate) were subjected to DNA extraction. Two replicates were processed for each medium as parallel controls.
DNA extraction was performed according to the manufacturer’s instructions with modifications in the cell lysis step (Figure 2B). Homogenization–centrifugation cycles were repeated 1–7 times using a FastPrep-24TM 5G Instrument (MP Biomedicals, USA) at 6.0 m/s for 40 s, followed by centrifugation at 14,000 × g for 10 min. The supernatant obtained after the first lysis–centrifugation step was collected as the first extraction (E1). The remaining sediment or filter material in the original tubes was not discarded but resuspended with fresh lysis buffer for subsequent extraction cycles (E2–E7). After completion of all extraction cycles, inhibitor removal, DNA binding, washing, and elution were performed according to the respective kit protocols. DNA extracts were stored at −80 °C until further analysis.
2.2.2. DNA Extraction from Biological Samples
DNA from fish intestinal contents was extracted using the three commercial kits mentioned above, following modified protocols (Figure 2A). Approximately 0.05 g (wet weight) of intestinal tissue was used for each replicate. Six replicates were divided into two groups (three replicates per group) and subjected to 1–3 repeated lysis–incubation cycles for comparison. Samples were placed in lysis tubes containing lysis buffer and proteinase solution, homogenized using the FastPrep-24TM 5G Instrument at 4.0 m/s for 5 s, then incubated at 56 °C with shaking at 300 rpm for 10 min. The supernatant obtained after each cycle was collected as E1, E2, or E3. Subsequent purification steps followed the respective kit protocols.
2.2.3. DNA Quantification and Storage
DNA concentration and purity were determined using a NanoDropTM 2000 spectrophotometer (Thermo Fisher Scientific, USA), and yields were normalized to sample mass (per g sediment/biota) or volume (per L water). All DNA extracts were aliquoted and stored at −80 °C for downstream molecular analyses.
2.3. Quantification of ARGs by High-Throughput Quantitative PCR
DNA concentration for HT-qPCR was determined using a Qubit 4.0 fluorometer (Thermo Fisher Scientific, Waltham, USA). DNA was diluted to 50 ng μl-1 using sterile water. High-throughput quantitative PCR (HT-qPCR) was employed to quantify ARGs, mobile genetic elements (MGEs), heavy metal resistance genes (HMRGs), and taxonomic marker genes. In total, 384 primer pairs (Table S1) were applied to DNA extracted from multiple phases using different extraction protocols. The primer panel comprised 309 sets targeting ARGs across all major antibiotic classes, 57 sets for MGE-related genes (including insertion, integrase, and transposase genes), 10 for HMRGs, and 8 for taxonomic genes such as the 16S rRNA gene. Amplifications were carried out using the SmartChip Real-Time PCR platform (WaferGen Biosystems, USA). Each run included a non-template negative control. The thermal cycling program consisted of an initial denaturation at 95 °C for 5 min, followed by 40 cycles at 95 °C for 15 s and 60 °C for 1 min. Melting curve analyses were automatically generated by the SmartChip software. All reactions were conducted in technical triplicates. Data quality was ensured by excluding wells with amplification efficiencies outside the range of 1.8–2.2 or R2 values below 0.99. A gene was considered reliably detected when at least two of the three replicates showed amplification, and the mean Ct value was used for quantification. The relative copy number of each gene was calculated according to the equation:
where Ct is the measured threshold cycle and 31 represents the detection limit. Relative ARG copy numbers were then normalized to the absolute abundance of the 16S rRNA gene.
Absolute quantification of 16S rRNA gene copies was performed using a standard curve (SC) approach on a Roche LightCycler 480 system. Each 20 μL reaction contained 10 μL of 2 × LightCycler 480 SYBR Green I Master Mix (Roche Applied Science), 0.2 μM of each primer, 1 ng μL-1 of template DNA, and 7.2 μL of nuclease-free water. The thermal program included enzyme activation at 95 °C for 5 min, followed by 40 cycles of 95 °C for 15 s, 60 °C for 1 min, and 72 °C for 20 s. Standard curves were generated using serial dilutions of a plasmid containing a cloned and sequenced 16S rRNA gene fragment. All qPCR assays were run in triplicate, with negative controls included in each batch.
2.4. 16S rRNA Sequencing, Quality Control and Data Processing
To characterize the overall microbial community structure, the V3–V4 regions of the bacterial 16S rRNA gene were amplified using barcoded primers 338F (5’ -ACTCCTACGGGAGGCAGCA-3’) and 806R (5’-GGACTACHVGGGTWTCTAAT-3’) [21]. All E1 DNA extracts (Figure 2) were used as templates for sequencing. In addition, pooled DNA samples were prepared by mixing 20 μL of DNA from each of the E1–E3 extracts (Figure 2A) for fish intestinal samples and from the E1–E7 extracts (Figure 2B) for water and sediment samples. These pooled samples were used to compare the microbial profiles obtained from single DNA extraction (E1 samples) with those generated from successive extractions (combined samples). PCR reactions were performed with an initial denaturation at 95 °C for 3 min, followed by 28 cycles of 95 °C for 30 s, 55 °C for 30 s, and 72 °C for 45 s, and a final extension at 72 °C for 10 min. Each sample was amplified in triplicate 20-μL reaction mixtures containing 4 μL of 5 × FastPfu Buffer, 2 μL of 2.5 mM dNTPs, 0.8 μL of each 5 μM primer, 0.4 μL of FastPfu Polymerase, and approximately 10 ng of template DNA. The purified PCR products were pooled at equimolar concentrations and subjected to paired-end sequencing (2×300 or 2×250) on the Illumina MiSeq platform (Illumina, San Diego, USA) by Majorbio Bio-Pharm Technology Co., Ltd. (Shanghai, China).
2.5. Real-Time Fluorescence Quantitative PCR Detection
Based on previous studies of estuarine and coastal environments [13,22], twelve representative target genes were selected for quantitative analysis using the primer sets reported in Guo et al. [23]. These genes were chosen because they are frequently detected, environmentally relevant, and recognized as key indicators of anthropogenic antibiotic pollution in estuarine systems. The target panel included the 16S rRNA gene as an internal reference, the class I integron-integrase gene (intI1), and ten ARGs. The ARGs covered eight major resistance classes: sulfonamide (sul1, sul2), tetracycline (tetA, tetW), β-lactamase (blaOXA), phenicol (floR), multidrug (qacE), macrolide (ermB), aminoglycoside (aac(6′)-Ib), and fluoroquinolone (qnrB).
All qPCR analyses were performed on an ABI 7300 Real-Time PCR System (Applied Biosystems, USA) using the SYBR Green chemistry. Primers and plasmid standards were synthesized by Sangon Biotech (Shanghai), and plasmid concentrations were quantified using a Nanodrop spectrophotometer. Each reaction was run in a 10-μL mixture under the cycling conditions described in Supplementary Information S1-2.4. Standard curves were generated from 10-fold serial dilutions of plasmid DNA, with three technical replicates per dilution. All environmental samples were analyzed in triplicate, and gene copy numbers were calculated from mean Ct values against the corresponding standard curves. Absolute abundances (copies/g for sediments and fish intestine, copies/L for water) were derived by normalizing to the initial sample mass or volume, and relative abundances were obtained by dividing ARG copy numbers by those of the 16S rRNA gene [24].
2.6. Bioinformatic Analyses
Raw sequencing data were processed using the Majorbio Cloud (www.majorbio.com) [25]. Briefly, raw fastq reads were first subjected to quality trimming with Trimmomatic (v3.0), and paired-end reads were subsequently assembled using FLASH (v1.2.7). Operational taxonomic units (OTUs) were generated in UPARSE (v7.1) at a 97% sequence similarity cutoff, during which putative chimeric sequences were identified and removed using UCHIME. Taxonomic assignment of the high-quality 16S rRNA gene sequences was carried out with the RDP Classifier against the SILVA SSU123 database, using a confidence threshold of 70%.
Alpha diversity was evaluated in MOTHUR v1.30.1 [26], including richness estimators (Chao1), diversity indices (Shannon), and Good’s coverage to assess sequencing depth. Fisher’s exact test was applied to evaluate differences in the mean relative abundance of the same taxa between samples. Based on the test results, fold-change plots were generated to visualize inter-sample differences, with significant and non-significant taxa explicitly annotated to indicate whether the observed variation in relative abundance between the two samples was statistically meaningful. Redundancy analysis (RDA) was performed in the vegan package in R to examine the relationships between environmental parameters and microbial community structure [27]. Statistical significance was evaluated using 999 Monte Carlo permutations (p < 0.05). In the RDA ordination, arrow length reflects the strength of correlation between environmental variables and community composition, while the direction of the angle indicates positive or negative associations [28].
Sequencing data were processed to determine taxonomic composition and relative abundances across samples. All bioinformatic analyses were conducted using the Majorbio Cloud platform (www.majorbio.com).
Data visualization of DNA yield and ARG abundance was performed in Origin 2024. Pearson correlations among ARGs, intI1, and bacterial communities at the phylum level were calculated using the psych package in R (v4.4.0) and visualized with ggplot2 and ggcorrplot.
3. Results
3.1. DNA Yield Improvement Through Successive Extractions Across Different Matrices
To evaluate the efficiency of successive extraction, DNA yields were compared across water, sediment, and biological tissue samples using three commercial extraction kits. As shown in Figure 3A, DNA yields from water samples obtained using the Yeasen MolPure®, Qiagen DNeasy® PowerSoil® Pro, and MP FastDNATM SPIN kits after a single extraction were 6.1, 9.3, and 10.1 μg L-1, respectively. After seven extraction cycles, the cumulative yields increased to 11.0, 15.3, and 25.6 μg L-1, representing 1.6–2.5-fold improvements relative to single extraction. Among the three kits, the MP kit exhibited the highest extraction efficiency, producing total yields 2.3 times greater than Yeasen and 1.7 times greater than Qiagen under the same number of cycles. Exponential regression analysis (R2 > 0.99) revealed strong exponential relationships between DNA yield and extraction cycles for all three kits. The yields of the Qiagen and Yeasen kits plateaued after three cycles, whereas the MP kit approached its maximum yield after seven cycles, indicating superior recovery efficiency under repeated homogenization–centrifugation.
A comparable trend was observed for sediment samples (Figure 3B). After seven successive extraction cycles, cumulative DNA yields increased markedly from 9.5 to 25.2 μg g-1 wet sediment with the MP kit, from 2.6 to 8.1 μg g-1 with the Yeasen kit, and from 1.0 to 2.1 μg g-1 with the Qiagen kit, corresponding to 2.1–3.1-fold increases. The MP kit produced up to 3.1 times higher yield than Yeasen and 12 times higher than Qiagen under identical conditions. Exponential fitting (R2 > 0.99) confirmed significant exponential correlations for the MP and Yeasen kits respectively, while the Qiagen kit showed no clear exponential trend.
In contrast, fish intestinal tissue exhibited a distinct pattern (Figure 3C). The MP kit showed a pronounced decrease from 149.4 μg g-1 in the first extraction to 34.5 μg g-1 and 10.6 μg g-1 after the second and third cycles, respectively. The Yeasen kit yielded 25.3 μg g-1 initially, followed by slight declines in subsequent cycles (22.0 μg g-1, 21.1 μg g-1). By contrast, the Qiagen kit produced an increasing cumulative yield, reaching 48.4 μg g-1 wet intestine after three extraction cycles, which is a 1.7-fold increase compared with single extraction (28.1 μg g−1). These results indicate that, unlike environmental matrices, repeated extraction offered limited improvement for biological tissues, likely due to rapid depletion of extractable nucleic acids after the initial extraction and degradation of DNA. Collectively, these findings suggest that while successive extractions substantially enhance DNA recovery from aquatic and sediment matrices, the benefit is minimal in biological tissues, possibly due to tissue depletion or deoxyribonuclease degradation effects.
3.2. Taxonomic Shifts in Microbial Community Composition Under Successive DNA Extractions
To assess the influence of extraction cycles on microbial community profiling, 16S rRNA gene sequencing was conducted for 17 representative samples (sample information provided in Supplementary Table S2). Sequencing produced a total of 973,940 raw reads, of which 885,155 high-quality sequences were retained after filtering and quality control. Clustering at 97% sequence similarity resulted in 23,929 OTUs across all samples, with an average read length of approximately 420 bp.
Rarefaction curves based on the Chao1 richness estimator (Supplementary Figure S2) reached asymptotes for all samples, indicating that the sequencing depth was sufficient to capture the vast majority of bacterial taxa. Consistently high Good’s coverage values (> 0.96) further supported the reliability of the sequencing data.
The relative abundance of bacterial communities at the phylum (Figure 4A) and class (Figure 4B) levels revealed distinct compositional patterns across the 17 analyzed samples. Pronounced differences were observed among environmental matrices. At the phylum level, Proteobacteria dominated all samples but exhibited distinct co-dominant taxa in different media. In fish intestinal samples, Proteobacteria were overwhelmingly predominant, whereas both Proteobacteria and Actinobacteria showed high relative abundance in water samples. Sediment samples displayed a more complex community structure, characterized by the co-dominance of Proteobacteria, Bacteroidota, and Actinobacteria, reflecting the heterogeneous nature of benthic environments.
Across all extraction methods, Proteobacteria remained the most abundant phylum; however, their relative abundance did not increase consistently with successive extraction cycles and in several cases even declined, suggesting that repeated extraction may preferentially recover DNA from less dominant taxa. At the class level, Alphaproteobacteria and Gammaproteobacteria were the principal constituents of Proteobacteria, with Gammaproteobacteria being predominant in biological (intestinal) samples. For most samples, successive extraction had minimal effect on the relative proportions of these two classes. Nevertheless, a noticeable decline in Gammaproteobacteria abundance was observed in sediment and water samples extracted with the MP kit, as well as in water samples extracted with the Yeasen kit, indicating potential kit-specific extraction bias toward certain bacterial groups.
To further assess community shifts, Fisher’s exact tests were conducted to compare taxonomic abundances between single and successive extractions at both phylum (Figure 4C) and class (Figure 4D) levels. In sediment samples, repeated extractions resulted in marked enrichment of Cyanobacteria and Verrucomicrobiota, with Fibrobacterota showing the most pronounced increase. In water samples, the relative abundance of Planctomycetota and Verrucomicrobiota also increased significantly with successive extractions. In fish intestinal samples, Actinobacteriota and Cyanobacteria displayed highly significant enrichment. These findings suggest that successive extraction not only improves total DNA recovery but may also enhance the detection of low-abundance or tightly bound taxa, particularly in complex or organic-rich matrices.
3.3. Abundance and Correlation of ARGs, MGEs and HMRGs Under Successive DNA Extractions
Quantitative PCR (Figure 5, Supplementary Table S6 and Supplementary Table S7) results indicate that except for the absence of floR and tetW in the biological samples extracted using the Qiagen (Q3) and Yeasen (Y3) kits, and the absence of aac(6’)-Ib in the single extractions with the MP (M1) and Yeasen (Y1) kits, all ten selected ARGs were successfully detected across all samples. Among these, sul1 consistently exhibited the highest absolute abundance, followed by qacE. Multiple-cycle DNA extraction generally enhanced the detection of certain ARGs: the absolute abundances of tetA, tetW, and qacE increased by 1.3 – 21.7 fold, up to 20.2 fold, and 24.2 – 37.3 fold, respectively. For the remaining ARG subtypes, variations between single and successive extractions were generally below 5.0-fold. In most cases, repeated extraction did not largely increase the absolute abundances of target functional genes compared to single extraction; however, a concomitant rise in relative abundance was observed for the same gene categories across several sample types (e.g. sul1, sul2, blaOXA in sediment samples; sul1 and sul2 in water samples).
The relative abundances of ARGs and intI1 across different environmental matrices are shown in Figure 5. In biological samples, the total relative abundance of ARGs increased markedly, from 8.46 × 10⁻⁶–2.59 × 10⁻² in single extractions (E1) to 4.83 × 10⁻⁵–4.72 × 10⁻¹ in triple extractions (E3), corresponding to 1.4–74.2-fold increases. In sediments, ARG abundance rose from 2.17 × 10⁻⁶–1.29 × 10⁻³ (E1) to 3.81 × 10⁻⁷–1.32 × 10⁻² (E7), representing 1.0–28.5-fold increases. Similarly, in water samples, relative abundance increased from 8.68 × 10⁻⁶–1.32 × 10⁻² (E1) to 1.54 × 10⁻⁵–1.31 × 10⁻² (E7), corresponding to 1.0–12.6-fold elevation. Collectively, these results indicate that successive DNA extractions enhance ARG detectability, whereas single-cycle extraction may underestimate their abundance in environmental samples.
Distinct distribution patterns of ARG subtypes were also observed across environmental matrices. tetA, blaOXA, qacE, and ermB were relatively enriched in biological samples, while qnrB and sulfonamide resistance genes (sul1, sul2) predominated in water samples. Overall, biological samples exhibited the highest relative ARG abundances, followed by sediment and water.
Linear fitting between the absolute abundances of intI1 and target ARGs (Figure 6) revealed strong correlations (R > 0.9) for aac(6’)-Ib, tetW, and qacE, while sul1 and blaOXA showed weaker associations (R < 0.8). For single-cycle extraction, intI1 displayed a strong correlation with tetW (R = 0.95), which further increased to 0.99 after seven extraction cycles. In contrast, the correlation between qnrB and intI1 declined slightly from 0.98 to 0.88 after repeated extraction. The total ARG abundance exhibited a strong overall correlation with intI1 (R = 0.99), but this relationship weakened with successive extractions. These results suggest that multiple-cycle extraction improves the detection of low-abundance ARGs and their correlation with intI1 for certain resistance types (e.g., tetW), but may introduce variability or overrepresentation that weakens overall correlations. Hence, the choice of extraction strategy can influence not only ARG quantification but also ecological interpretation of their association with mobile genetic elements.
HT-qPCR results reveal that the gene richness varied across functional categories and extraction protocols using the MP kits, as shown in Supplementary Figure S3. Successive extraction yielded higher richness of both ARGs (151 vs. 136) and MGEs (37 vs. 35) in water samples compared to single extraction. In contrast, the richness of taxonomic marker genes and HMRGs showed little variation with the extraction method.
The absolute abundances of targeted functional genes across different sample types are presented in Figure 7, with detailed data available in Supplementary Table S3. In water samples, successive extraction (W7) markedly increased the detectable absolute abundance (copies/L) of almost all gene categories compared to single-cycle extraction (W1). For instance, the total abundance of taxonomic marker genes increased by approximately 5-fold, while dominant ARG classes, such as those conferring resistance to multidrug and aminoglycoside, increased by 4.9- to 6.5-fold. In sediment samples, a similar strong positive effect was observed. The successive extraction protocol (S7) yielded significantly higher gene copy numbers (copies/g) across all functional categories, including taxonomic genes, ARGs, HMRGs, and MGEs, compared to the single-cycle protocol (S1). In fish intestinal samples, a contrasting pattern emerged. Increased extraction cycles (B3) did not enhance but rather reduced the absolute abundance (copies/g) of most gene targets compared to the single-cycle protocol (B1).
The water resistome was dominated by ARGs conferring resistance to multidrug, sulfonamide, macrolide–lincosamide–streptogramin B resistance (MLSB) and aminoglycoside. The abundance of several MGE classes (e.g., transposases) showed a co-increase pattern with ARGs upon successive extraction. The sediment resistome also showed high abundance and diversity of ARGs, with a similar dominance pattern to water. Successive extraction uniformly enhanced the detection of both ARG and MGE subclasses. The fish intestinal community presented a distinct profile. While taxonomic marker genes were abundant, the absolute abundance of most specific ARG and MGE subtypes was substantially lower in magnitude compared to the other categories within the same sample. The resistome composition was also different, with notable abundances of tetracycline, β-lactamase resistance genes and fluoroquinolone.
In conclusion, successive DNA extraction cycles significantly enhanced the detectable absolute abundance of functional genes in environmental samples (water and sediment), but had a suppressive effect in the biological sample (fish intestine). The composition of resistance genes and their associated MGEs varied distinctively across the three sample ecosystems.
The relative abundances of targeted functional genes (normalized to 16S rRNA) were systematically compared across three sample types and between single (W1, S1, B1) and successive (W7, S7, B3) DNA extraction cycles (Supplementary Figure S4 and Supplementary Table S4). To evaluate the impact of extraction cycles, a relative change threshold of ≥20% was applied to classify the responses of individual gene classes as “significantly increased,” “significantly decreased,” or “stable” (change < 20%).
For water samples, there is overall stability with selective enhancement. Successive extraction (W7) did not substantially alter the overall community structure, as indicated by the stable taxonomic marker gene abundance (1.56 vs. 1.58, Δ +0.9%). Within the ARG category, 8 out of 15 subclasses (53%) remained stable, while the abundance of 5 ARGs (33%) increased after successive extraction. Notable increases were observed for rifamycin resistance genes, which increased 143% (from 9.59×10⁻⁵ to 2.33×10⁻⁴), peptide antibiotic resistance genes, which increased 102% (from 1.65×10⁻⁵ to 3.34×10⁻⁵) and phenicol resistance genes, which increased 79% (4.63×10⁻⁴ to 8.31×10⁻⁴). In contrast, multidrug, sulfonamide and tetracycline resistance genes remained stable (Δ < 4%). Among MGEs, all five subclasses showed stable relative abundances (Δ < 15%), with the “MGE” subclass increasing marginally by 3.1%. HMRG levels remained unchanged (Δ -1.5%).
Sediment samples showed divergent responses among dominant ARGs. In sediments, taxonomic marker gene abundance remained stable between S1 and S7 (1.33 vs. 1.33). The ARG category exhibited a more heterogeneous response: 8 out of 15 subclasses (53%) changed by ≥20%. β-lactamase resistance genes increased 121% (1.25×10⁻³ to 2.76×10⁻³), phenicol resistance genes increased 94% (3.15×10⁻⁴ to 6.12×10⁻⁴), and aminoglycoside resistance genes increased 26% (2.61×10⁻² to 3.28×10⁻²). In contrast, peptide resistance genes decreased 86% (4.30×10⁻⁵ to 6.07×10⁻⁶) and rifamycin resistance genes decreased 78% (1.69×10⁻⁴ to 3.77×10⁻⁵). MGE subclasses remained largely stable (Δ <9%), except for integrase genes, which decreased 11%. HMRG abundance increased 52% (3.64×10⁻³ to 5.52×10⁻³), suggesting enhanced recovery of metal resistance determinants with repeated extraction.
Fish intestinal samples showed pronounced reduction in most non-taxonomic genes. Successive extraction (B3) markedly reduced the relative abundance of most functional genes. Taxonomic marker genes remained near baseline (1.00 vs. 1.00). Seven out of 15 ARG subclasses (47%) exhibited significant changes, with 5 decreasing by ≥20%. For instance, sulfonamide resistance genes declined 100% (1.04×10⁻⁴ to 0.00), tetracycline resistance genes declined 93% (5.99×10⁻³ to 4.02×10⁻⁴), and multidrug resistance genes decreased 76% (3.59×10⁻³ to 8.44×10⁻⁴). In contrast, phenicol resistance genes increased dramatically by 1956% (1.03×10⁻⁴ to 2.12×10⁻³). MGE subclasses were strongly suppressed, with the “MGE” subclass decreasing 89% (4.78×10⁻⁴ to 5.45×10⁻⁵) and “plasmid” genes decreasing 56%. HMRG increased 44% (2.24×10⁻³ to 3.22×10⁻³), similar to the trend in sediments.
The water resistome was dominated by multidrug (~2.50×10⁻²), sulfonamide (~1.66×10⁻²), MLSB (~1.11–1.46×10⁻²), and aminoglycoside (~7.45–9.76×10⁻³) resistance genes, with MGEs such as MGE (~3.14×10⁻²) and transposase (~1.65×10⁻²) co-occurring. Sediments harbored a richer and more abundant resistome, with multidrug (up to 6.07×10⁻²), sulfonamide (up to 3.14×10⁻²), and aminoglycoside (up to 3.28×10⁻²) as the top three ARG classes. Fish intestines presented a distinct profile dominated by tetracycline (5.99×10⁻³ in B1), multidrug (3.59×10⁻³ in B1), β-lactamase (~1.33–1.45×10⁻³), and fluoroquinolone (~8.21×10⁻⁴) resistance genes, albeit at much lower overall abundance compared to environmental samples.
Successive DNA extraction cycles exert sample-type-dependent effects on the relative abundance of functional genes. In water, the community structure remains resilient, with low-abundance ARGs showing enhancement. In sediments, the effects are gene-specific, likely influenced by substrate binding and differential lysis efficiency. In fish intestines, repeated extraction leads to substantial dilution or degradation of most non-taxonomic genes, possibly due to inhibitor accumulation or DNA fragmentation. These findings underscore that extraction protocols not only impact gene recovery yield but also shape the perceived functional composition of microbial communities, with important implications for comparative resistome studies across diverse matrices.
RDA analysis (Figure 8) revealed that MGEs, HMRGs, and taxonomic marker genes were significantly correlated with multidrug, sulfonamide, and MLSB ARGs (p < 0.01). Extraction cycle numbers were also correlated with the abundances of these genes (p < 0.1). ARGs in the W7 and S7 samples showed stronger associations with MGEs, taxonomic marker genes, and HMRGs. These results suggest that successive DNA extractions from water and sediment samples may better capture the correlations among ARGs, MGEs, and HMRGs.
3.4. Correlations Among intI1, Antibiotic Resistance Genes, and Microbial Communities
Co-occurrence network and correlation analyses are widely used to elucidate the relationships among ARGs, MGEs, and bacterial communities, thereby inferring potential ARG hosts [3,5,29]. Following this approach, Pearson correlation analysis was performed to compare the association patterns of intI1, ARGs, and bacterial communities between single and successive DNA extractions (Figure 9) [13]. Pronounced differences in correlation strength and partner taxa were observed between the two extraction methods.
In the E1 samples, sul1 exhibited significant positive correlations with several bacterial classes, including Holophagae, Kapabacteria, Verrucomicrobiae, Acidimicrobia, and Actinobacteria. The strongest associations were observed with Kapabacteria (R = 0.90), Actinobacteria (R = 0.90), and Acidimicrobiia (R = 0.86). In contrast, successive extraction samples revealed additional significant associations of sul1 with Vicinamibacteria (R = 0.72) and Thermoleophilia (R = 0.90), while correlation coefficients generally increased (e.g., Kapabacteria, R = 0.98; Actinobacteria, R = 0.93). Similarly, sul2 correlated only with Kapabacteria in single-extraction samples, but with ten bacterial classes under successive extraction, including Acidimicrobiia (R = 0.94), Thermoleophilia (R = 0.90), and Cyanobacteriia (R = 0.93). Both sulfonamide resistance genes (sul1 and sul2) therefore demonstrated significant and consistent positive correlations with the same ten bacterial classes following successive extraction.
The tetA gene was positively correlated with Alphaproteobacteria, Actinobacteria, and Kapabacteria in single-extraction samples, but in successive extractions, it exhibited a negative correlation with Desulfuromonadia and a positive correlation with Gammaproteobacteria. The ermB gene remained consistently correlated with Kapabacteria across both extraction methods, while additional strong associations with Actinobacteria emerged under successive extraction. Likewise, qnrB showed more extensive correlations after successive extraction, with five additional bacterial classes (Thermoleophilia, Holophagae, Vicinamibacteria, Verrucomicrobiae, and Alphaproteobacteria) positively associated. Notably, the correlation coefficients between qnrB and Cyanobacteria increased from 0.80 to 0.90, and similar enhancements were observed for Bacteroidia (R increased from 0.70 to 0.88) and Acidimicrobiia (R increased from 0.73 to 0.88).
Significant variation was also detected in the associations of intI1 with bacterial communities. In single-extraction samples, intI1 correlated positively with Kapabacteria, Cyanobacteriia, Actinobacteria, Bacteroidia, Holophagae, and Acidimicrobiia. Successive extractions revealed three additional positively associated taxa, Thermoleophilia, Alphaproteobacteria, and Verrucomicrobiae, suggesting a broader potential for horizontal gene transfer interactions under enhanced extraction recovery.
Bacterial community composition is a key determinant of ARG distribution, as ARGs are primarily localized within bacterial genomes. Therefore, significant ARG–bacteria correlations can indicate potential bacterial hosts [30]. In this study, the association patterns of Thermoleophilia with multiple ARGs strengthened notably after successive extractions, consistent with previous findings that identified this class as an important ARG carrier [13,31]. Similarly, Vicinamibacteria and Alphaproteobacteria exhibited broader and stronger correlations with ARGs in successive-extraction datasets, supporting their roles as potential ARG reservoirs [32].
Overall, both ARG‒bacteria and MGE–bacteria correlations were consistently stronger and more extensive following successive extractions compared with single extractions. These findings highlight that repeated extraction cycles can improve the recovery of ARG-associated microbial DNA, thereby enhancing the reliability of host association inference and the representativeness of microbial community–ARG interaction networks.
4. Discussion
DNA extraction represents not only a preparatory laboratory step but a methodological filter that determines how much of the environmental resistome is accessible to downstream molecular analyses. By integrating DNA yield dynamics, microbial community composition, and quantitative profiles of ARGs and MGEs across water, sediment, and fish intestinal matrices, this study demonstrates that the performance and ecological consequences of successive DNA extraction are strongly matrix-dependent. Our findings reveal that repeated extraction cycles substantially improve the recovery of particle-associated and recalcitrant DNA fractions in environmental matrices, while providing little analytical benefit and, in some cases, introducing methodological artefacts in biological tissues. Below, we synthesize these outcomes from a methodological perspective and further discuss their implications for ecological interpretation and antimicrobial resistance (AMR) surveillance.
4.1. Successive Extraction as a Matrix-Dependent Strategy to Access Recalcitrant DNA Pools
Successive extraction markedly increased cumulative DNA yield in water and sediment and followed an exponential–plateau pattern, indicating that a considerable fraction of extractable DNA is not liberated during a single extraction. This is consistent with prior studies showing that standard protocols frequently fail to lyse resistant cells or detach extracellular DNA bound to mineral or organic particles in multiple environmental media, including soil, sediment and swine manure [9,10,12,13]. The stronger yield response in sediment (Figure 3) suggests that complex particle-rich matrices harbor a substantial “recalcitrant pool” of DNA that can only be progressively accessed through repeated lysis and homogenization. The superior cumulative yield obtained using the MP FastDNATM SPIN kit further highlights the role of intensive mechanical disruption in releasing DNA from microaggregates and tough bacterial cell structures. This agrees with observations that bead-beating enhances desorption of DNA from mineral surfaces and improves recovery of low-permeability microbial cells in soils and sediments [8,33].
A contrasting pattern was observed for the biological tissue samples. For all kits except Qiagen, cumulative DNA yield did not increase across successive extraction cycles; instead, most extractable DNA was released during the first cycle, and additional processing produced negligible or even reduced yield. This result differs from observations in swine manure, where repeated extraction produced a linear increase in DNA recovery [12]. The discrepancy may be attributed to differences in particle-size distribution, organic matter composition, and mineral-associated binding capacity, which affect DNA sorption–desorption dynamics during extraction [34,35] and can lead to matrix-specific recovery responses [12]. Methodological differences may also have contributed: unlike previous protocols in which the supernatant was removed and fresh buffer replenished after each cycle [12], the present study retained the same extraction solution and repeated only the incubation–lysis steps. Such prolonged processing may have facilitated fragmentation or nuclease-mediated degradation of already-released intracellular DNA [36], particularly when most DNA was liberated during the first cycle, thereby explaining the reduced cumulative yield observed in later cycles for biological tissues.
These results collectively indicate that the utility of successive extraction is fundamentally matrix-specific: it is highly advantageous for environmental samples containing mineral-associated or physically protected DNA fractions, whereas a single optimized extraction remains sufficient for fresh biological tissues.
4.2. Extraction Bias in Microbial Community Representation: Implications for Low-Abundance and Particle-Associated Taxa
Although dominant taxonomic patterns at the phylum level remained broadly consistent across extraction cycles, successive extraction selectively increased the relative abundance of several low-abundance but ecologically relevant taxa in water and sediment, including Cyanobacteria, Verrucomicrobiota, Fibrobacterota, and Planctomycetota (Figure 4). These groups are frequently associated with biofilms, particle attachment, or resistant cell envelopes, making them less susceptible to lysis under standard single-step protocols [9,37,38,39,40]. The observed shifts therefore do not reflect in situ community change, but rather differential extraction efficiency that determines which microbial fractions are represented in sequencing output.
Conversely, decreased proportions of Gammaproteobacteria in certain kit–matrix combinations further emphasize that extraction-related bias is not uniform but strongly shaped by matrix properties and lysis chemistry. For studies targeting low-abundance taxa, particle-associated communities, or potential ARG hosts, successive extraction provides a more inclusive representation of the microbial assemblage by increasing recovery from recalcitrant compartments. This supports earlier work demonstrating that additional extraction cycles can uncover previously undetected or under-represented microbial groups [9,10,13], reinforcing the need to account for extraction bias when interpreting ecological patterns.
4.3. Quantitative and Structural Reshaping of the Environmental Resistome
The most operationally significant outcome of successive extraction lies in its impact on ARG and MGE quantification. HT-qPCR results showed that successive extractions increased ARG abundances by 3.7–12.2 fold in water samples, 2.2–9.3 fold in sediment samples, and up to 8.3 fold in biological samples. These findings confirm that a substantial fraction of the resistome resides in DNA pools that are poorly captured by single extraction, particularly those associated with particle-bound, biofilm-embedded, or physically resilient microbial fractions [9,10,13]. Thus, omission of successive extraction may systematically underestimate both the magnitude and diversity of environmental ARG reservoirs.
Beyond quantitative increases, successive extraction also reshaped ARG–MGE–host association patterns. Strengthened correlations between specific ARGs (e.g., tetW) and intI1 suggest improved co-recovery of genetic elements that are likely co-located within the same microbial hosts or mobile platforms [13]. Meanwhile, the attenuation of correlations between intI1 and composite ARG totals may reflect the broader recovery of diverse ARG types that are less strongly linked to class 1 integrons, thereby revealing a more heterogeneous resistome structure than previously inferred from single extracts. These results indicate that extraction incompleteness not only masks low-abundance ARGs, but also constrains the resolution of inferred ecological networks and horizontal gene transfer (HGT) potential [12].
By contrast, successive extraction of fish intestinal samples resulted in decreased absolute and relative abundances of most ARGs and MGEs, paralleling the decline in cumulative DNA yield. This likely reflects preferential degradation or fragmentation of released intracellular DNA during repeated homogenization rather than biological differences in resistome composition, supporting the conclusion that successive extraction provides limited analytical benefit for soft biological matrices.
4.4. From Methodological Bias to Ecological Interpretation: Opportunities and Cautions
Our results highlight that particle-associated and recalcitrant microbial compartments in aquatic environments constitute important, and previously under-represented, reservoirs of ARGs and MGEs. Successive extraction improves their detectability and thereby offers a more complete overview of environmental resistomes, an advantage for surveillance and risk assessment in estuarine systems. However, improved recovery also increases inclusion of extracellular and relic DNA, which may inflate apparent ARG abundance relative to the active microbial community [41,42]. Distinguishing biologically active, potentially mobile ARGs from historical DNA pools remains an important direction for future investigation.
From a methodological standpoint, our findings support the adoption of matrix-optimized successive extraction, for example, multiple extraction cycles combined with intensive mechanical lysis, when the analytical objective is to maximize ARG and MGE detection in particle-rich matrices such as sediments and turbid waters. Conversely, for fresh and homogenized biological tissues, a single optimized extraction remains preferable. To enhance comparability among studies, we recommend explicit reporting of extraction cycle number, lysis conditions, and DNA recovery efficiency, particularly where ARG abundances are used in quantitative risk assessment or cross-matrix synthesis.
Future work should integrate successive extraction with approaches that differentiate intracellular from extracellular DNA and with genome-resolved metagenomics to verify whether additionally recovered ARGs and MGEs are co-localized within specific microbial hosts. Such combined strategies will strengthen ecological interpretation while supporting the development of standardized and transparent methodologies for environmental AMR monitoring.
5. Conclusions
This study demonstrates that DNA extraction strategy is a key analytical factor that influences resistome characterization in a matrix-dependent manner. Across water, sediment and fish intestinal samples, successive DNA extraction substantially increased DNA yield and improved the detection of low-abundance microbial taxa, ARGs and MGEs in environmental matrices, particularly in sediment. These results indicate that a considerable fraction of particle-associated or recalcitrant DNA is not recovered by single-cycle extraction, and that repeated lysis enhances the representativeness of ARG and MGE profiles and strengthens subtype-level associations with intI1. In contrast, biological tissue showed limited or negative responses to successive extraction, with decreasing DNA yield and gene abundance across cycles, suggesting that most intracellular DNA is already released during the initial extraction and that additional processing may promote DNA degradation rather than accessing new genetic material.
Overall, our findings highlight that DNA extraction is not method-neutral and can influence quantitative estimates and ecological interpretation of resistome patterns. Successive extraction is recommended for particle-rich environmental matrices where comprehensive recovery is required, whereas optimized single extraction is more appropriate for biological tissues. Clear reporting of extraction conditions will improve cross-study comparability in environmental AMR assessment.
Supplementary Materials
The following supporting information can be downloaded at the website of this paper posted on Preprints.org.
Author Contributions
WJD: Investigation, Methodology, Formal analysis, Writing - original draft. LXR: Investigation, Methodology, Writing - original draft, Writing - review & editing, Supervision, Funding acquisition. LM: Formal analysis, Funding acquisition, Writing - review & editing. SYW: Investigation. LQ: Investigation. WJ: Formal analysis. HY: Supervision, Formal analysis, Funding acquisition, Writing - review & editing.
Acknowledgments
This work was supported by the National Key R&D Program of China [grant number 2022YFB3105800], National Natural Science Foundation of China [grant numbers 42071134, 42230505], National Key R&D Program of China [grant number 2020YFB1806700]. We acknowledge our group members for their generous help in laboratory assistance.
Conflicts of Interest
The authors declare that they have no known competing financial interests or personal relationships that could have appeared to influence the work reported in this paper.
References
- Zhu, Y.G.; Johnson, T.A.; Su, J.Q.; Qiao, M.; Guo, G.X.; Stedtfeld, R.D.; Hashsham, S.A.; Tiedje, J.M. Diverse and abundant antibiotic resistance genes in Chinese swine farms. Proc Natl Acad Sci U S A 2013, 110, 3435–3440. [Google Scholar] [CrossRef]
- Martínez, J.L. Antibiotics and Antibiotic Resistance Genes in Natural Environments. Science 2008, 321, 365–367. [Google Scholar] [CrossRef]
- Zhao, Z.; Zhang, K.; Wu, N.; Li, W.; Xu, W.; Zhang, Y.; Niu, Z. Estuarine sediments are key hotspots of intracellular and extracellular antibiotic resistance genes: A high-throughput analysis in Haihe Estuary in China. Environment International 2020, 135, 105385. [Google Scholar] [CrossRef]
- Zhou, L.; Xu, P.; Gong, J.; Huang, S.; Chen, W.; Fu, B.; Zhao, Z.; Huang, X. Metagenomic profiles of the resistome in subtropical estuaries: Co-occurrence patterns, indicative genes, and driving factors. Sci Total Environ 2022, 810, 152263. [Google Scholar] [CrossRef] [PubMed]
- Zhu, Y.-G.; Zhao, Y.; Li, B.; Huang, C.-L.; Zhang, S.-Y.; Yu, S.; Chen, Y.-S.; Zhang, T.; Gillings, M.R.; Su, J.-Q. Continental-scale pollution of estuaries with antibiotic resistance genes. Nature Microbiology 2017, 2, 16270. [Google Scholar] [CrossRef] [PubMed]
- Muziasari, W.I.; Pitkänen, L.K.; Sørum, H.; Stedtfeld, R.D.; Tiedje, J.M.; Virta, M. The Resistome of Farmed Fish Feces Contributes to the Enrichment of Antibiotic Resistance Genes in Sediments below Baltic Sea Fish Farms. Frontiers in Microbiology 2017, 7–2016. [Google Scholar] [CrossRef]
- Berendonk, T.U.; Manaia, C.M.; Merlin, C.; Fatta-Kassinos, D.; Cytryn, E.; Walsh, F.; Bürgmann, H.; Sørum, H.; Norström, M.; Pons, M.N.; et al. Tackling antibiotic resistance: the environmental framework. Nat Rev Microbiol 2015, 13, 310–317. [Google Scholar] [CrossRef]
- Guo, F.; Zhang, T. Biases during DNA extraction of activated sludge samples revealed by high throughput sequencing. Applied Microbiology and Biotechnology 2013, 97, 4607–4616. [Google Scholar] [CrossRef]
- Feinstein, L.M.; Sul, W.J.; Blackwood, C.B. Assessment of bias associated with incomplete extraction of microbial DNA from soil. Applied and Environmental Microbiology 2009, 75, 5428–5433. [Google Scholar] [CrossRef]
- Dimitrov, M.R.; Veraart, A.J.; de Hollander, M.; Smidt, H.; van Veen, J.A.; Kuramae, E.E. Successive DNA extractions improve characterization of soil microbial communities. PeerJ 2017, 5, e2915. [Google Scholar] [CrossRef]
- Han, P.; Li, M.; Gu, J.D. Biases in community structures of ammonia/ammonium-oxidizing microorganisms caused by insufficient DNA extractions from Baijiang soil revealed by comparative analysis of coastal wetland sediment and rice paddy soil. Applied Microbiology and Biotechnology 2013, 97, 8741–8756. [Google Scholar] [CrossRef]
- Luo, L.; Feng, J.; Xue, R.; Ma, J.; Lou, L.; He, J.; Liu, Y.; Xiao, H.; Deng, O.; Xie, L. The insufficient extraction of DNA from swine manures may underestimate the abundance of antibiotic resistance genes as well as ignore their potential hosts. Journal of Environmental Management 2021, 278, 111587. [Google Scholar] [CrossRef]
- Wu, C.; Zhang, G.; Xu, W.; Jian, S.; Peng, L.; Jia, D.; Sun, J. New Estimation of Antibiotic Resistance Genes in Sediment Along the Haihe River and Bohai Bay in China: A Comparison Between Single and Successive DNA Extraction Methods. Frontiers in Microbiology 2021, 12, 705724. [Google Scholar] [CrossRef]
- Boulter, N.; Suarez, F.G.; Schibeci, S.; Sunderland, T.; Tolhurst, O.; Hunter, T.; Hodge, G.; Handelsman, D.; Simanainen, U.; Hendriks, E.; et al. A simple, accurate and universal method for quantification of PCR. BMC Biotechnology 2016, 16, 27. [Google Scholar] [CrossRef]
- Zhang, L.; Mao, Y.; Wang, Z. Quantitative comparison of HT-qPCR/16S rRNA sequencing and metagenomics for antibiotic resistance gene profiling: A novel risk assessment approach. J Hazard Mater 2025, 498, 139904. [Google Scholar] [CrossRef]
- Zhang, S.; Yang, G.; Zhang, Y.; Yang, C. High-throughput profiling of antibiotic resistance genes in the Yellow River of Henan Province, China. Sci Rep 2024, 14, 17490. [Google Scholar] [CrossRef]
- Liu, X.; Xiao, P.; Guo, Y.; Liu, L.; Yang, J. The impacts of different high-throughput profiling approaches on the understanding of bacterial antibiotic resistance genes in a freshwater reservoir. Sci Total Environ 2019, 693, 133585. [Google Scholar] [CrossRef]
- Hendriksen, R.S.; Munk, P.; Njage, P.; van Bunnik, B.; McNally, L.; Lukjancenko, O.; Röder, T.; Nieuwenhuijse, D.; Pedersen, S.K.; Kjeldgaard, J.; et al. Global monitoring of antimicrobial resistance based on metagenomics analyses of urban sewage. Nature Communications 2019, 10, 1124. [Google Scholar] [CrossRef]
- Keenum, I.; Liguori, K.; Calarco, J.; Davis, B.C.; Milligan, E.; Harwood, V.J.; Pruden, A. A framework for standardized qPCR-targets and protocols for quantifying antibiotic resistance in surface water, recycled water and wastewater. Critical Reviews in Environmental Science and Technology 2022, 52, 4395–4419. [Google Scholar] [CrossRef]
- Miao, Y.; Liu, X.; Liu, M.; Huang, Y.; Hu, Q.; Zhang, Q.; Xie, Z.; Li, Q. Vertical migration of antibiotics, ARGs, and pathogens in industrial multi-pollutant soils: Implications for environmental and public health. Ecotoxicology and Environmental Safety 2025, 303, 118912. [Google Scholar] [CrossRef]
- Liu, X.R.; Liu, M.; Chen, X.; Yang, Y.; Hou, L.J.; Wu, S.X.; Zhu, P.K. Indigenous PAH degraders along the gradient of the Yangtze Estuary of China: Relationships with pollutants and their bioremediation implications. Marine Pollution Bulletin 2019, 142, 419–427. [Google Scholar] [CrossRef]
- Luo, Y.; Mao, D.; Rysz, M.; Zhou, Q.; Zhang, H.; Xu, L.; J.J.A., P. Trends in antibiotic resistance genes occurrence in the Haihe River, China. Environmental Science & Technology 2010, 44, 7220–7225. [Google Scholar] [CrossRef]
- Guo, X.-p.; Chen, Y.-R.; Sun, X.-l.; Li, C.-l.; Hou, L.-j.; Liu, M.; Yang, Y. Plastic properties affect the composition of prokaryotic and eukaryotic communities and further regulate the ARGs in their surface biofilms. Science of The Total Environment 2022, 839, 156362. [Google Scholar] [CrossRef]
- Guo, X.P.; Chen, Y.R.; Sun, X.L.; Li, C.L.; Hou, L.J.; Liu, M.; Yang, Y. Plastic properties affect the composition of prokaryotic and eukaryotic communities and further regulate the ARGs in their surface biofilms. Science of the Total Environment 2022, 839, 156362. [Google Scholar] [CrossRef]
- Ren, Y.; Yu, G.; Shi, C.; Liu, L.; Guo, Q.; Han, C.; Zhang, D.; Zhang, L.; Liu, B.; Gao, H.; et al. Majorbio Cloud: A one-stop, comprehensive bioinformatic platform for multiomics analyses. iMeta 2022, 1, e12. [Google Scholar] [CrossRef] [PubMed]
- Schloss, P.D.; Gevers, D.; Westcott, S.L. Reducing the effects of PCR amplification and sequencing artifacts on 16S rRNA-based studies. Plos One 2011, 6. [Google Scholar] [CrossRef] [PubMed]
- Sheik, C.S.; Mitchell, T.W.; Rizvi, F.Z.; Rehman, Y.; Faisal, M.; Hasnain, S.; McInerney, M.J.; Krumholz, L.R. Exposure of Soil Microbial Communities to Chromium and Arsenic Alters Their Diversity and Structure. Plos One 2012, 7. [Google Scholar] [CrossRef]
- Wang, Y.Y.; Chen, J.; Zhou, S.A.; Wang, X.D.; Chen, Y.; Lin, X.M.; Yan, Y.; Ma, X.; Wu, M.; Han, H.C. 16S rRNA gene high-throughput sequencing reveals shift in nitrogen conversion related microorganisms in a CANON system in response to salt stress. Chem. Eng. J. 2017, 317, 512–521. [Google Scholar] [CrossRef]
- Zhang, T.; Ding, Y.; Peng, J.; Dai, Y.; Luo, S.; Liu, W.; Ma, Y. Effects of Broad-Spectrum Antibiotic (Florfenicol) on Resistance Genes and Bacterial Community Structure of Water and Sediments in an Aquatic Microcosm Model. Antibiotics (Basel) 2022, 11, 1299. [Google Scholar] [CrossRef]
- Wang, Z.; Han, M.; Li, E.; Liu, X.; Wei, H.; Yang, C.; Lu, S.; Ning, K. Distribution of antibiotic resistance genes in an agriculturally disturbed lake in China: Their links with microbial communities, antibiotics, and water quality. Journal of Hazardous Materials 2020, 393, 122426. [Google Scholar] [CrossRef] [PubMed]
- Yang, S.; Zhang, W.; Yang, B.; Feng, X.; Li, Y.; Li, X.; Liu, Q. Metagenomic evidence for antibiotic-associated actinomycetes in the Karamay Gobi region. Front Microbiol 2024, 15, 1330880. [Google Scholar] [CrossRef] [PubMed]
- Zhang, H.; Wang, Y.; Liu, P.; Sun, Y.; Dong, X.; Hu, X. Unveiling the occurrence, hosts and mobility potential of antibiotic resistance genes in the deep ocean. Science of The Total Environment 2022, 816, 151539. [Google Scholar] [CrossRef] [PubMed]
- Niu, J.; Chen, H.; Cai, L.; He, M.; Zhang, R.; Wang, L. Grinding Beads Influence Microbial DNA Extraction from Organic-Rich Sub-Seafloor Sediment. Microorganisms 2022, 10, 2505. [Google Scholar] [CrossRef]
- Bürgmann, H.; Pesaro, M.; Widmer, F.; Zeyer, J. A strategy for optimizing quality and quantity of DNA extracted from soil. Journal of Microbiological Methods 2001, 45, 7–20. [Google Scholar] [CrossRef]
- Daniel, R. The metagenomics of soil. Nature Reviews Microbiology 2005, 3, 470–478. [Google Scholar] [CrossRef]
- Hong, B.-Y.; Driscoll, M.; Gratalo, D.; Jarvie, T.; Weinstock, G.M. Improved DNA Extraction and Amplification Strategy for 16S rRNA Gene Amplicon-Based Microbiome Studies. International Journal of Molecular Sciences 2024, 25, 2966. [Google Scholar] [CrossRef]
- Huanca-Valenzuela, P.; Fuchsman, C.A.; Tully, B.J.; Sylvan, J.B.; Cram, J.A. Quantitative microbial taxonomy across particle size, depth, and oxygen concentration. Frontiers in Microbiology 2025, 16–2025. [Google Scholar] [CrossRef]
- Bozan, M.; Berreth, H.; Lindberg, P.; Bühler, K. Cyanobacterial biofilms: from natural systems to applications. Trends Biotechnol 2025, 43, 318–332. [Google Scholar] [CrossRef]
- Faria, M.; Bordin, N.; Kizina, J.; Harder, J.; Devos, D.; Lage, O.M. Planctomycetes attached to algal surfaces: Insight into their genomes. Genomics 2018, 110, 231–238. [Google Scholar] [CrossRef] [PubMed]
- Pushpakumara, B.L.D.U.; Tandon, K.; Willis, A.; Verbruggen, H. Unravelling microalgal-bacterial interactions in aquatic ecosystems through 16S rRNA gene-based co-occurrence networks. Scientific Reports 2023, 13, 2743. [Google Scholar] [CrossRef]
- Carini, P.; Marsden, P.J.; Leff, J.W.; Morgan, E.E.; Strickland, M.S.; Fierer, N. Relic DNA is abundant in soil and obscures estimates of soil microbial diversity. Nat Microbiol 2016, 2, 16242. [Google Scholar] [CrossRef] [PubMed]
- Sivalingam, P.; Sabatino, R.; Sbaffi, T.; Fontaneto, D.; Corno, G.; Di Cesare, A. Extracellular DNA includes an important fraction of high-risk antibiotic resistance genes in treated wastewaters. Environ Pollut 2023, 323, 121325. [Google Scholar] [CrossRef] [PubMed]
Figure 1.
Location of the sampling site Sanjiagang (SJG) in the Yangtze Estuary, China. Water, sediment, and fish samples were collected here.
Figure 1.
Location of the sampling site Sanjiagang (SJG) in the Yangtze Estuary, China. Water, sediment, and fish samples were collected here.
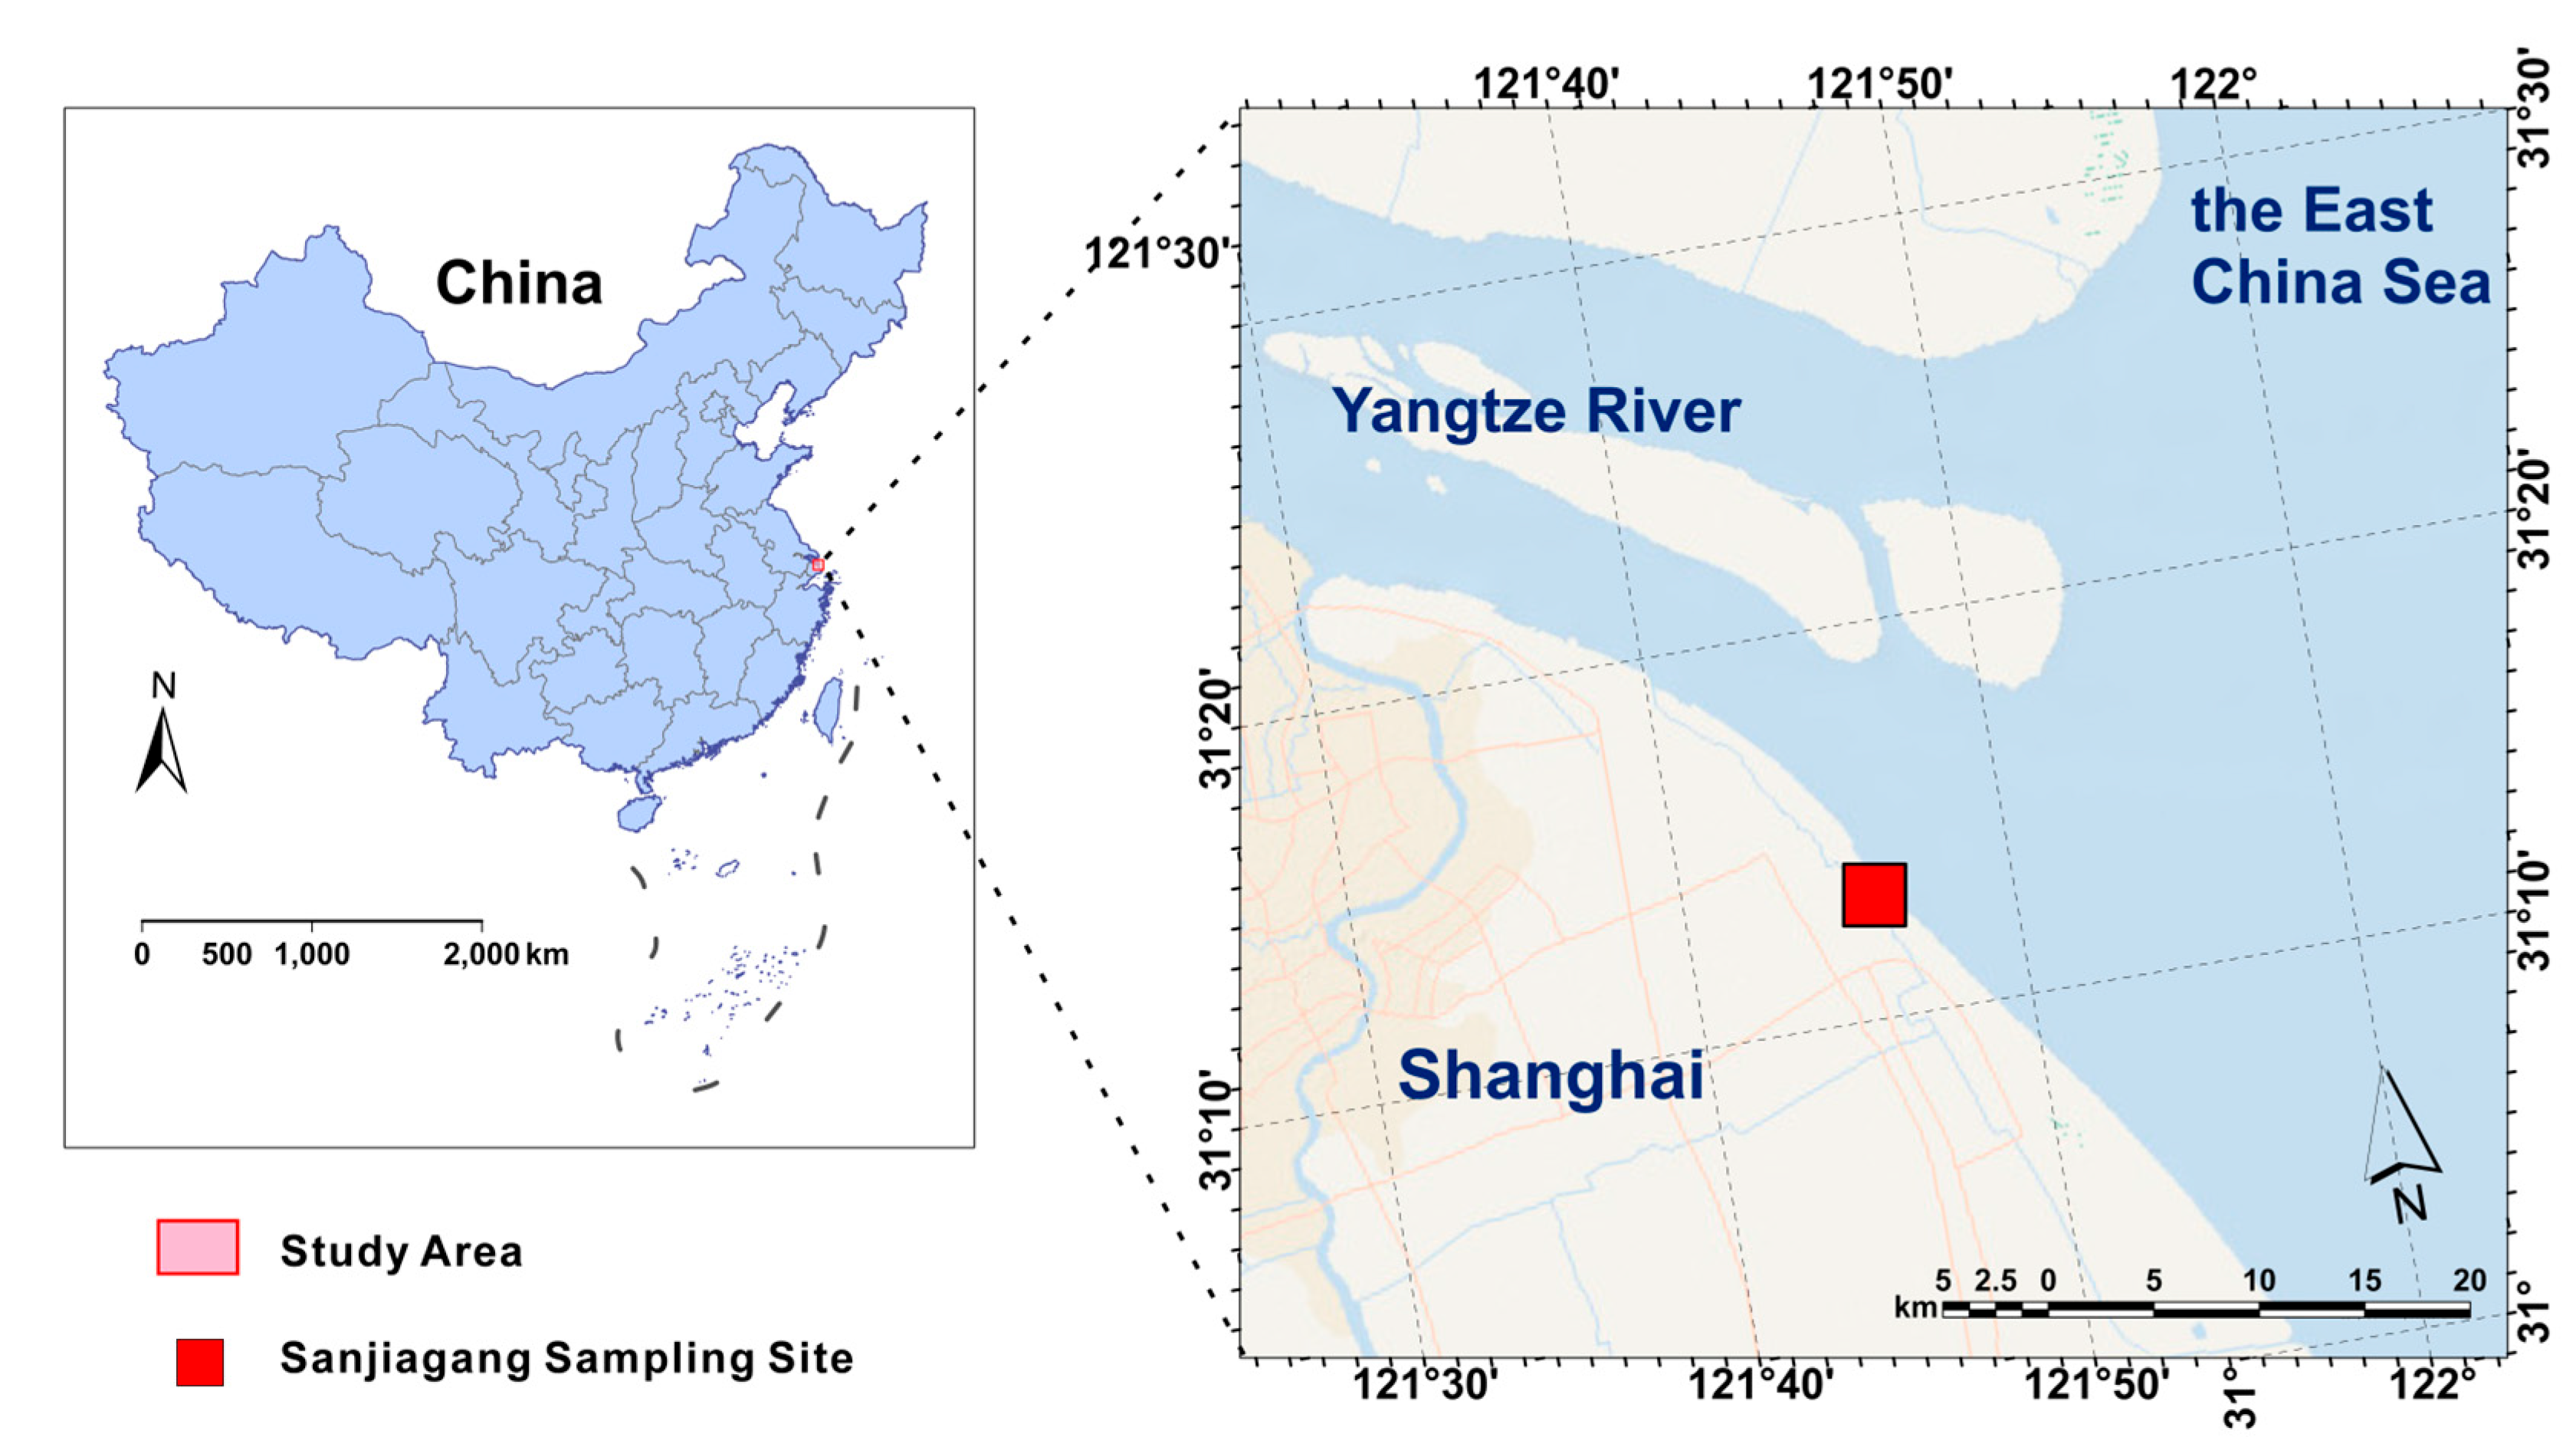
Figure 2.
The modified procedure of DNA extraction method used in the present study. (A) The protocol for fish intestinal samples. (B) The protocol for sediment and water samples. E1-E7 mean extraction cycles.
Figure 2.
The modified procedure of DNA extraction method used in the present study. (A) The protocol for fish intestinal samples. (B) The protocol for sediment and water samples. E1-E7 mean extraction cycles.
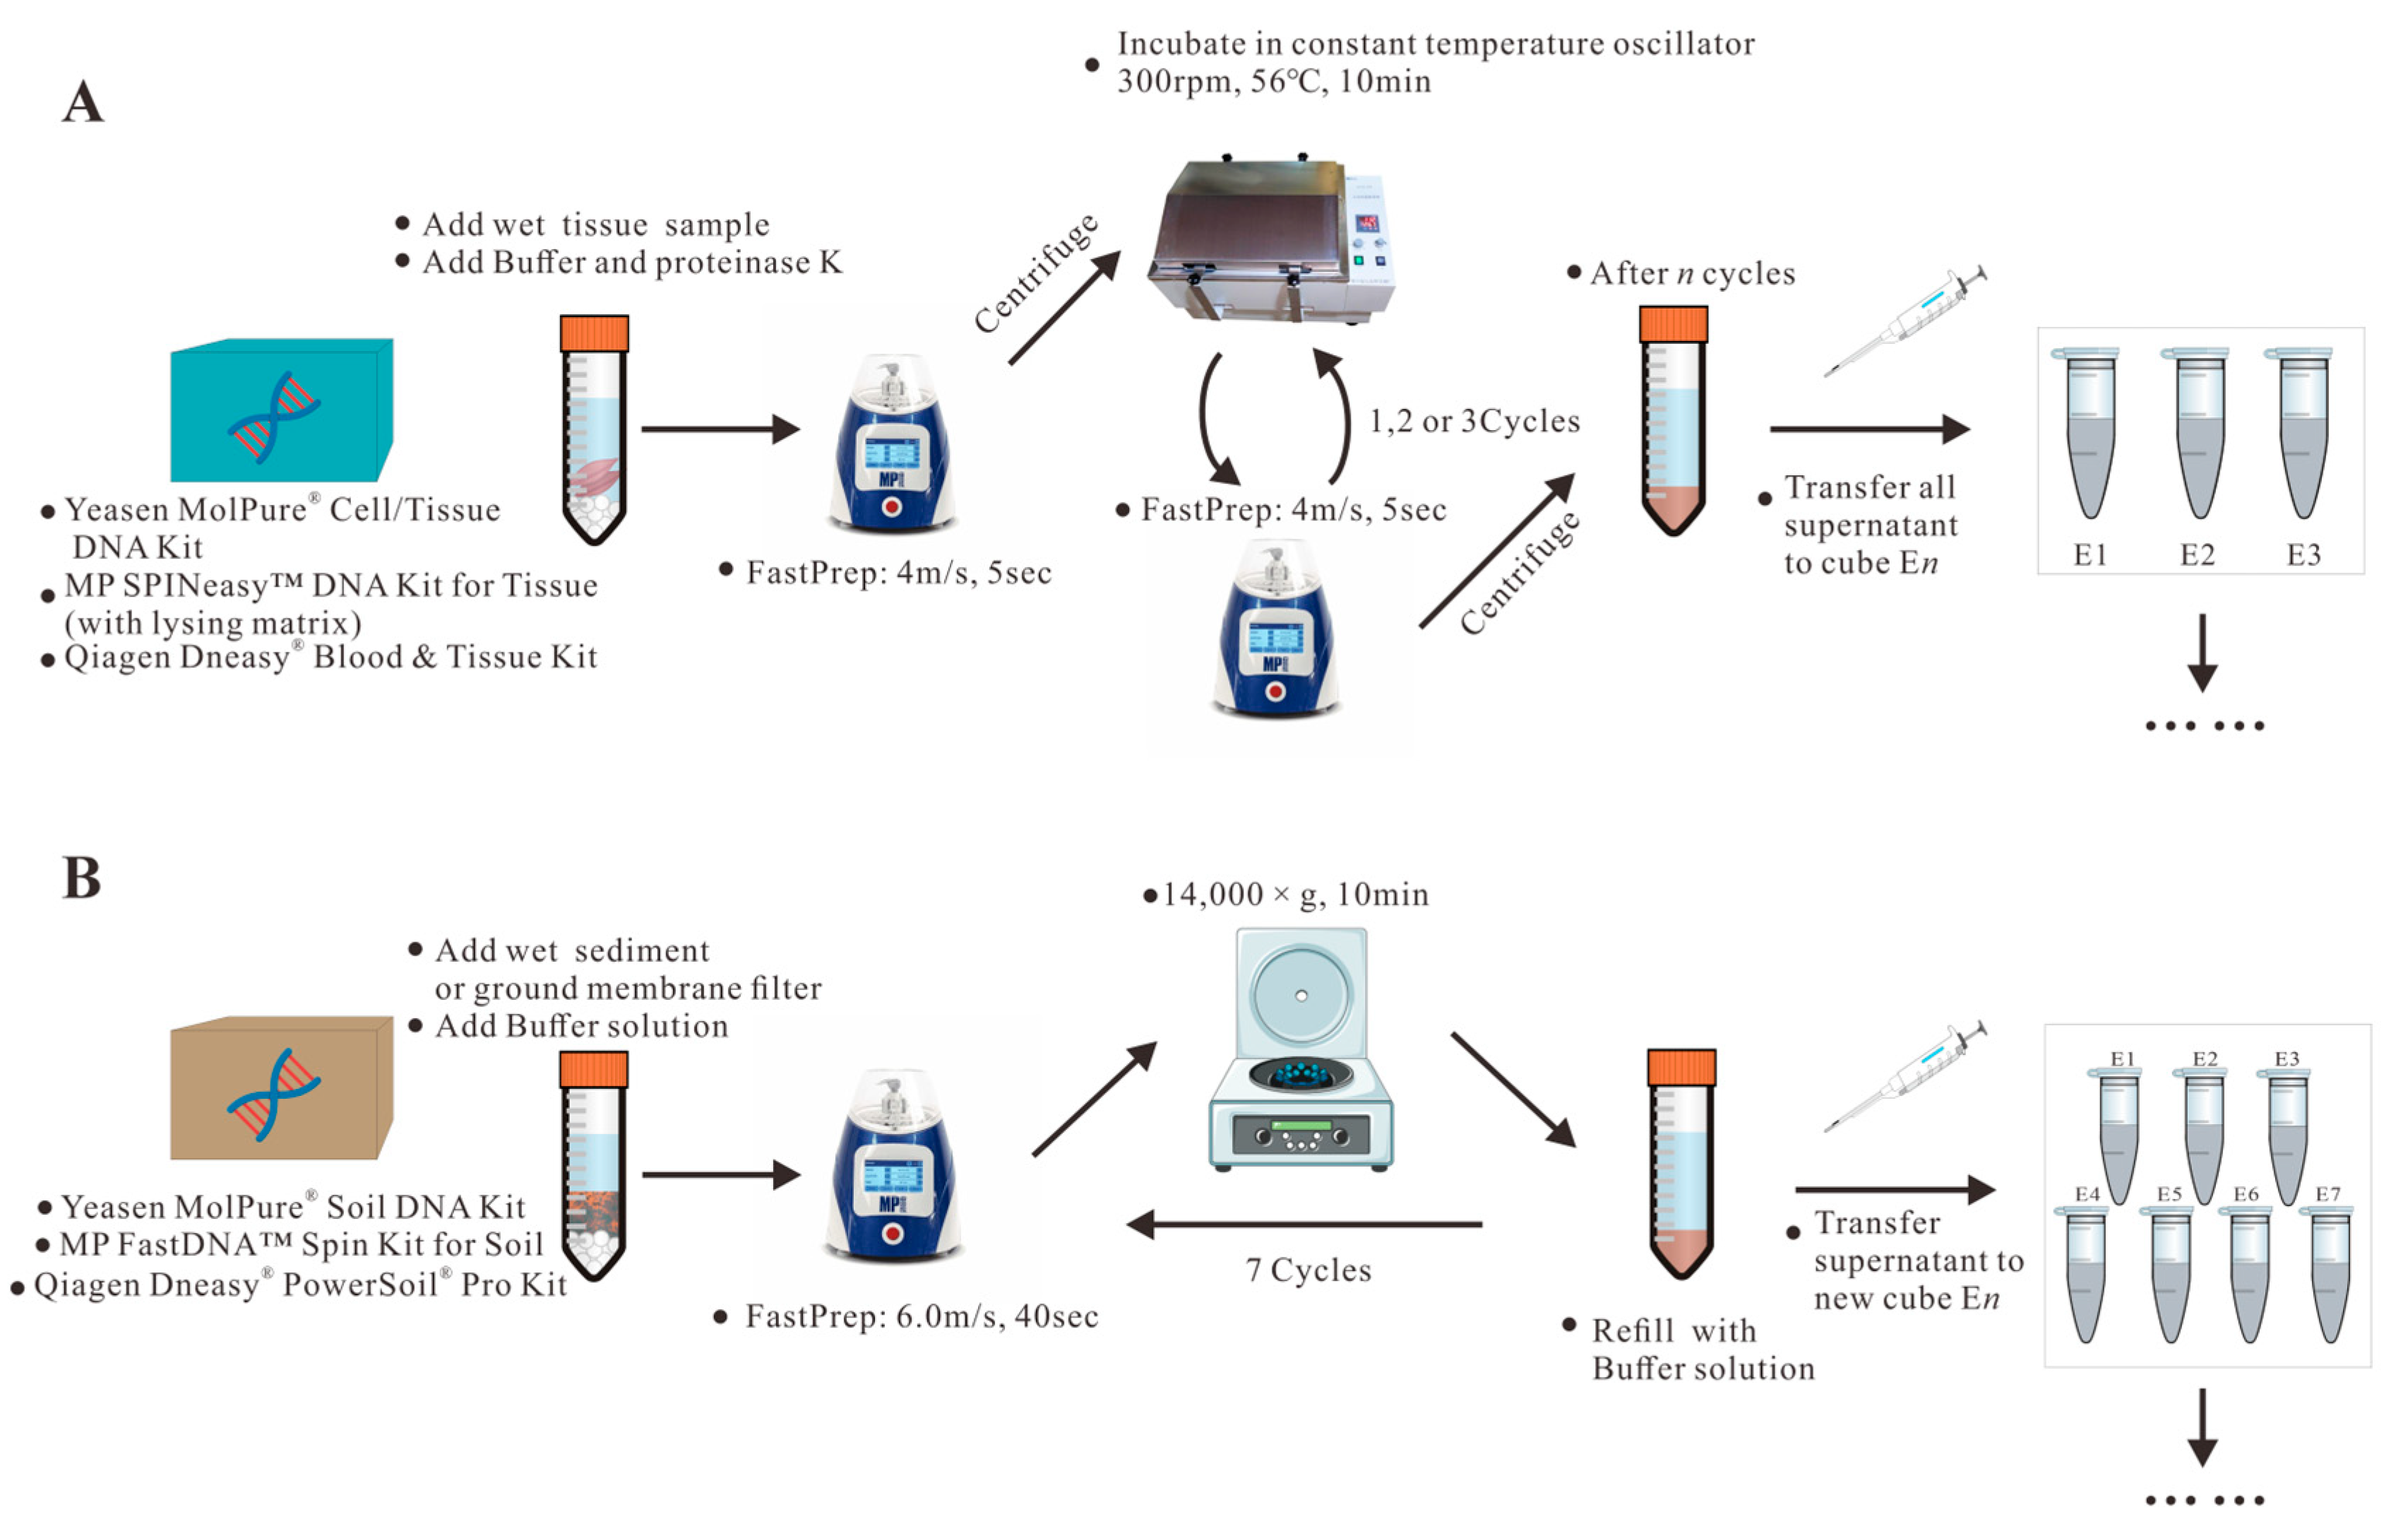
Figure 3.
DNA yield with various extraction kits in different environment media by extraction cycles. (A) DNA yield and exponential fitting results of water sample. (B) DNA yield and exponential fitting results of Sediment sample. (C) DNA yield of fish intestine samples. Only strongly significant fitting results (R2 > 0.99) are shown.
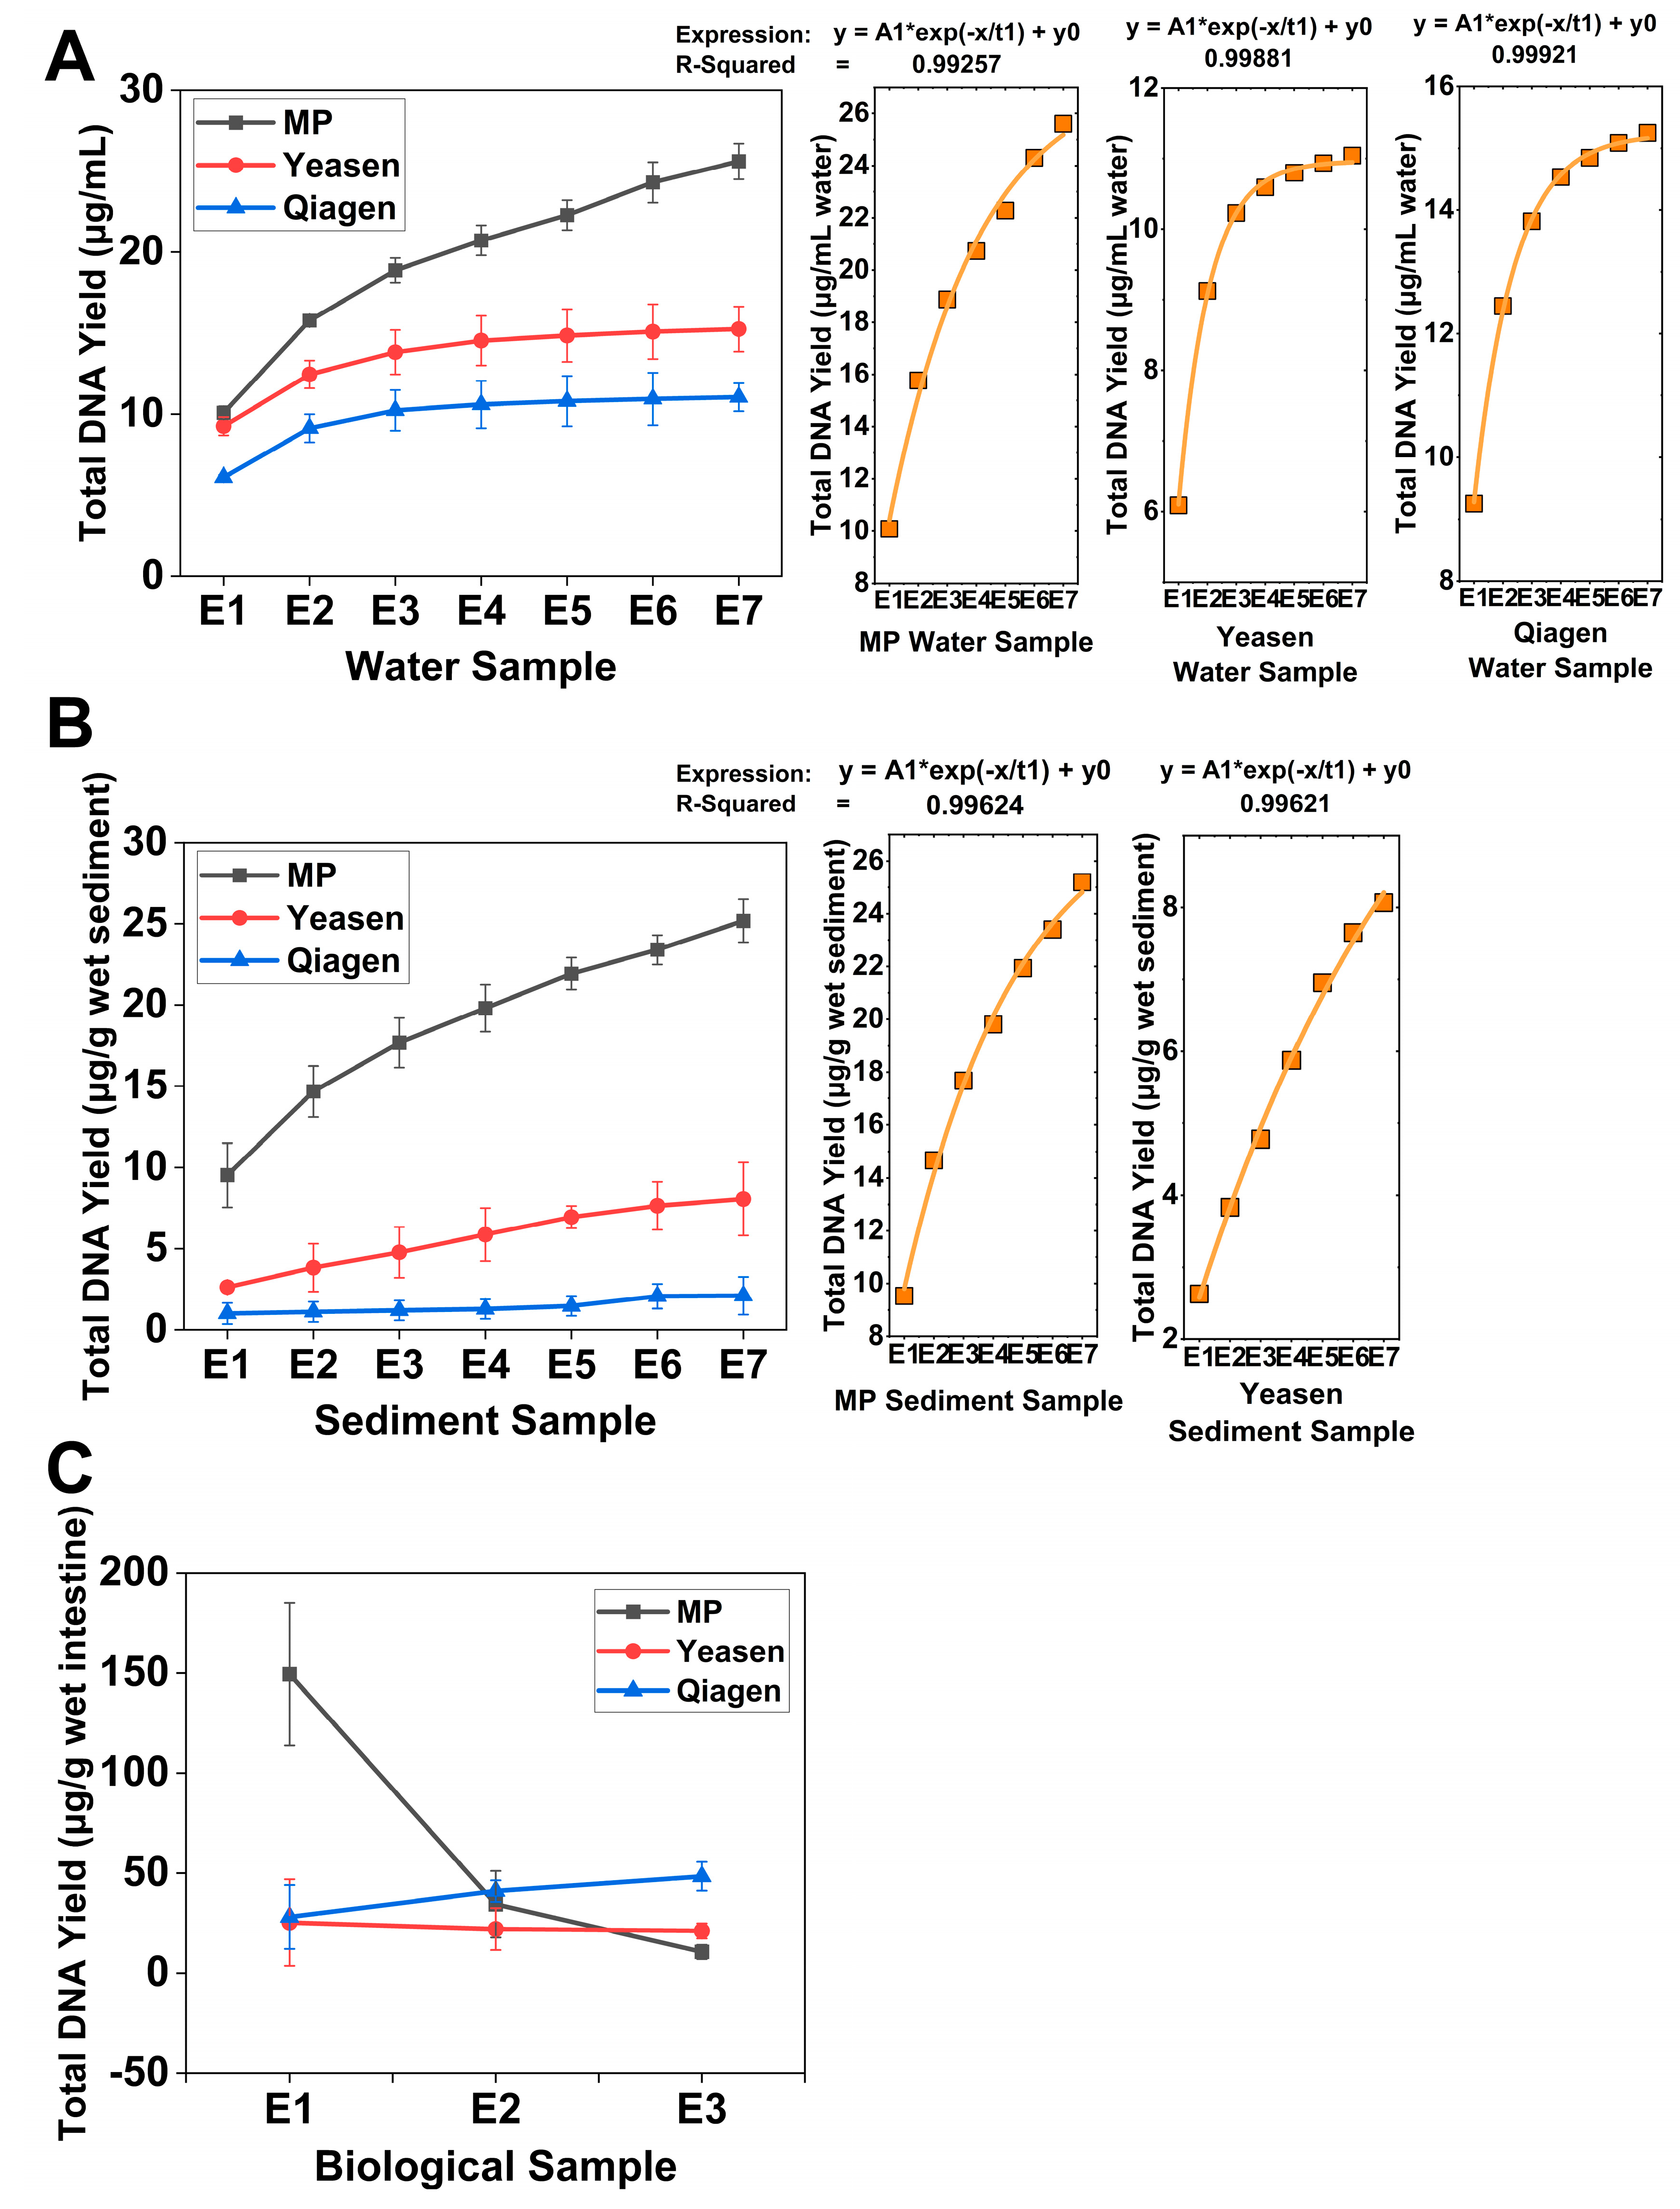
Figure 4.
The relative abundance of bacterial communities. (A) The relative abundance of bacterial communities at the phylum level. (B) The relative abundance of bacterial communities at the class level. (C) Comparison between samples of bacterial community relative abundance at the phylum level. (D) Comparison between samples of bacterial community relative abundance at the class level. The Y-axis displays species names at different taxonomic levels; the X-axis represents the log2- transformed fold change values between the treatment and control groups. * 0.01 ≤ P ≤ 0.05, ** 0.001 ≤ P ≤ 0.01, *** P ≤ 0.001.
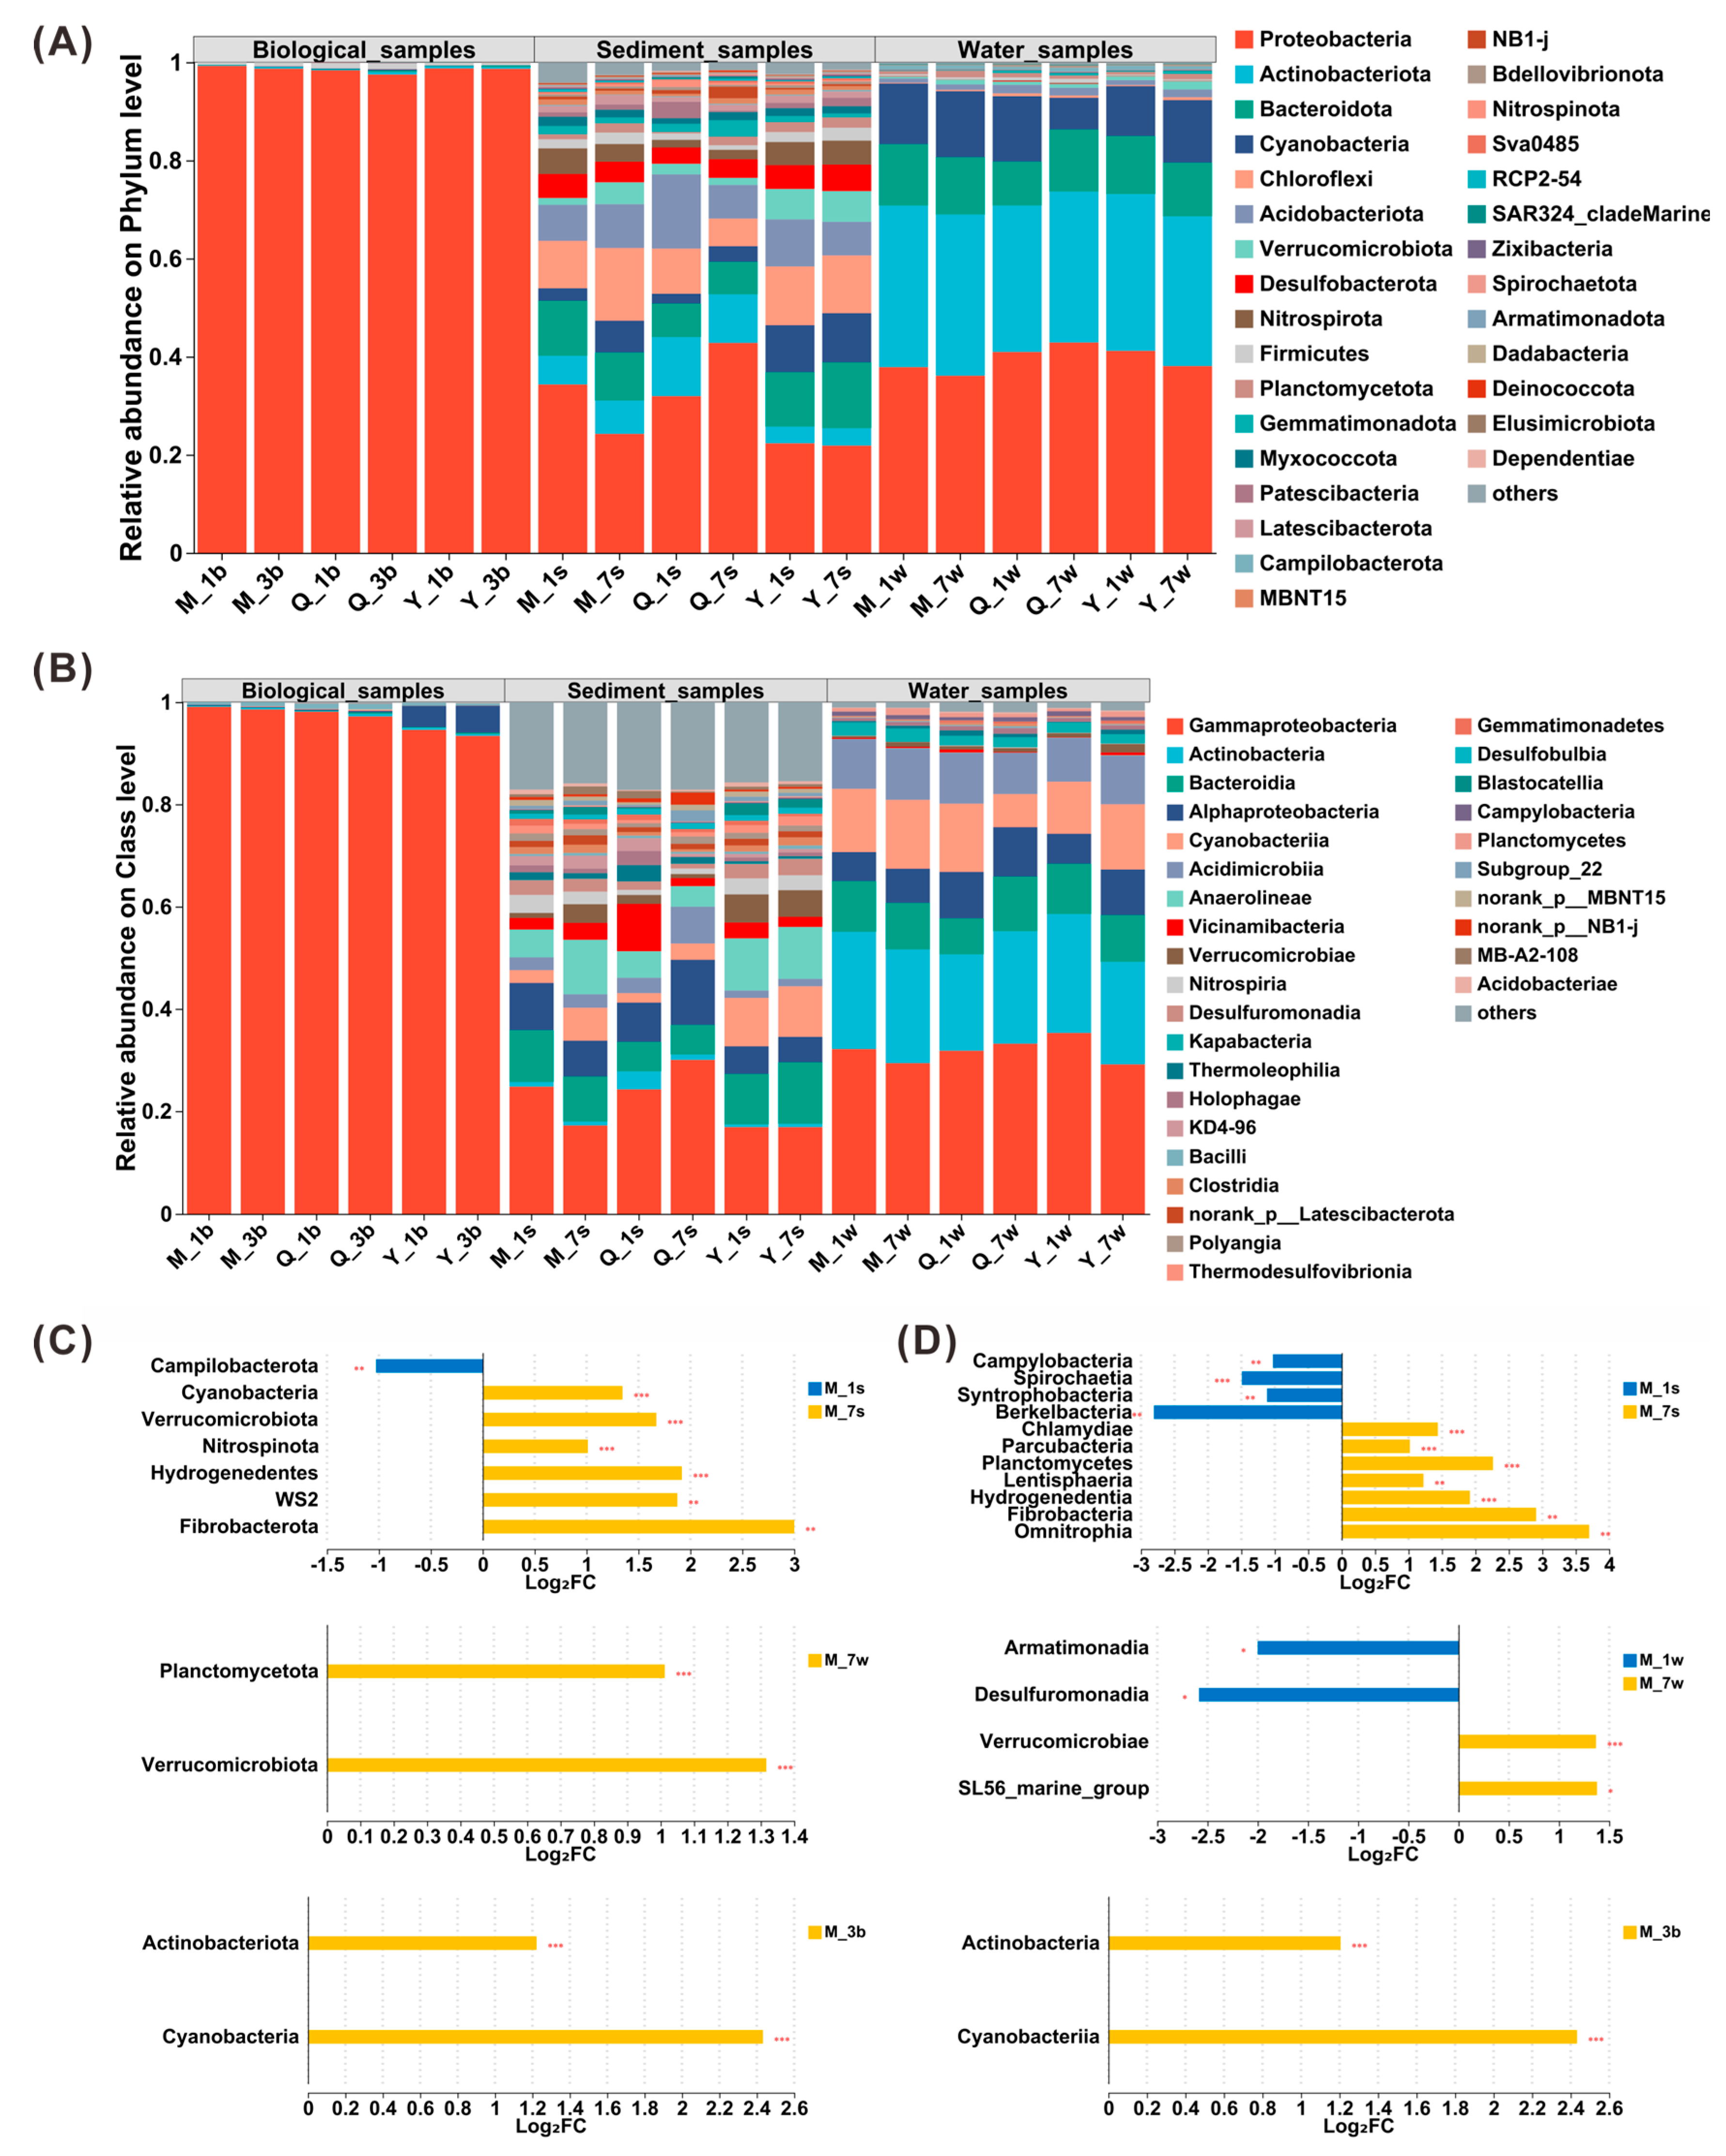
Figure 5.
The relative abundance of antibiotic resistance genes (ARGs) and intI1 after single and successive extraction with 3 brands of kits from different environmental media.
Figure 5.
The relative abundance of antibiotic resistance genes (ARGs) and intI1 after single and successive extraction with 3 brands of kits from different environmental media.
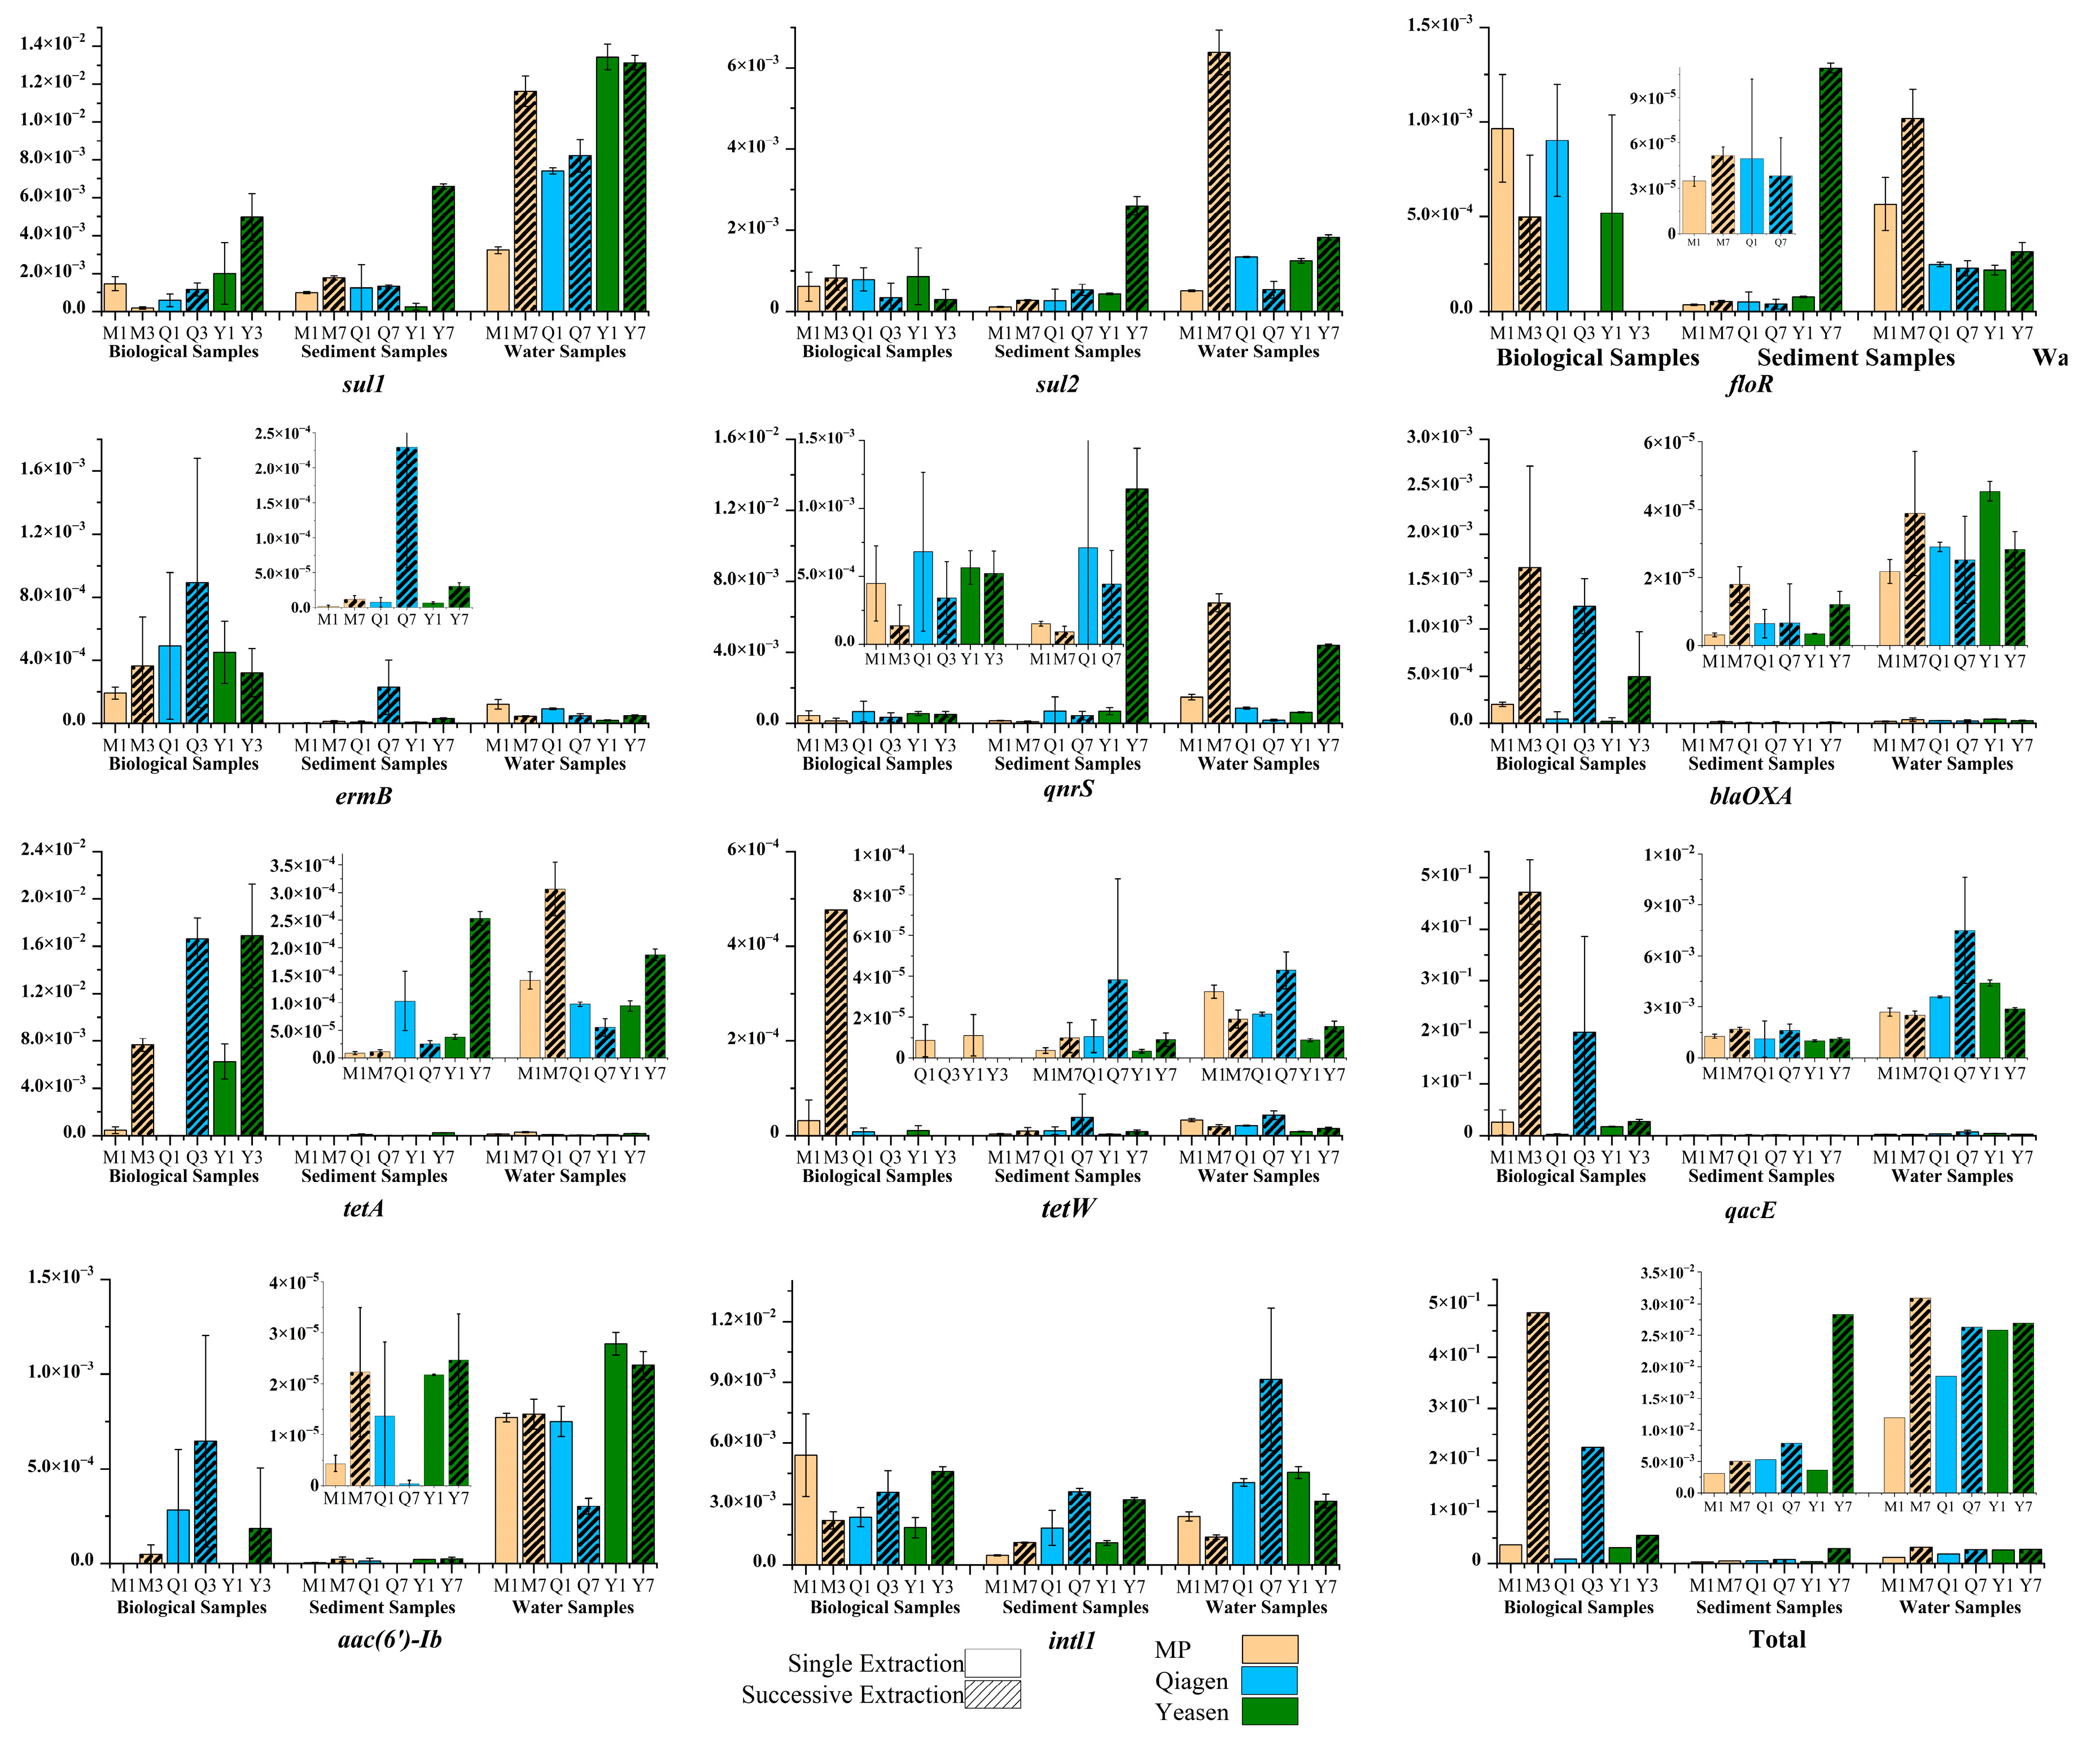
Figure 6.
Correlation of eight ARG subtypes (sul1, blaOXA, qacE, aac(6’)-Ib, floR, ermB, qnrB and tetW) and total ARGs with the class I integron-integrase gene (intI1). The absolute abundance of total ARGs was the sum of the absolute abundance of ten ARG subtypes measured in the present study. Note that only correlation coefficients (R) greater than 0.7 were included in the correlation analysis.
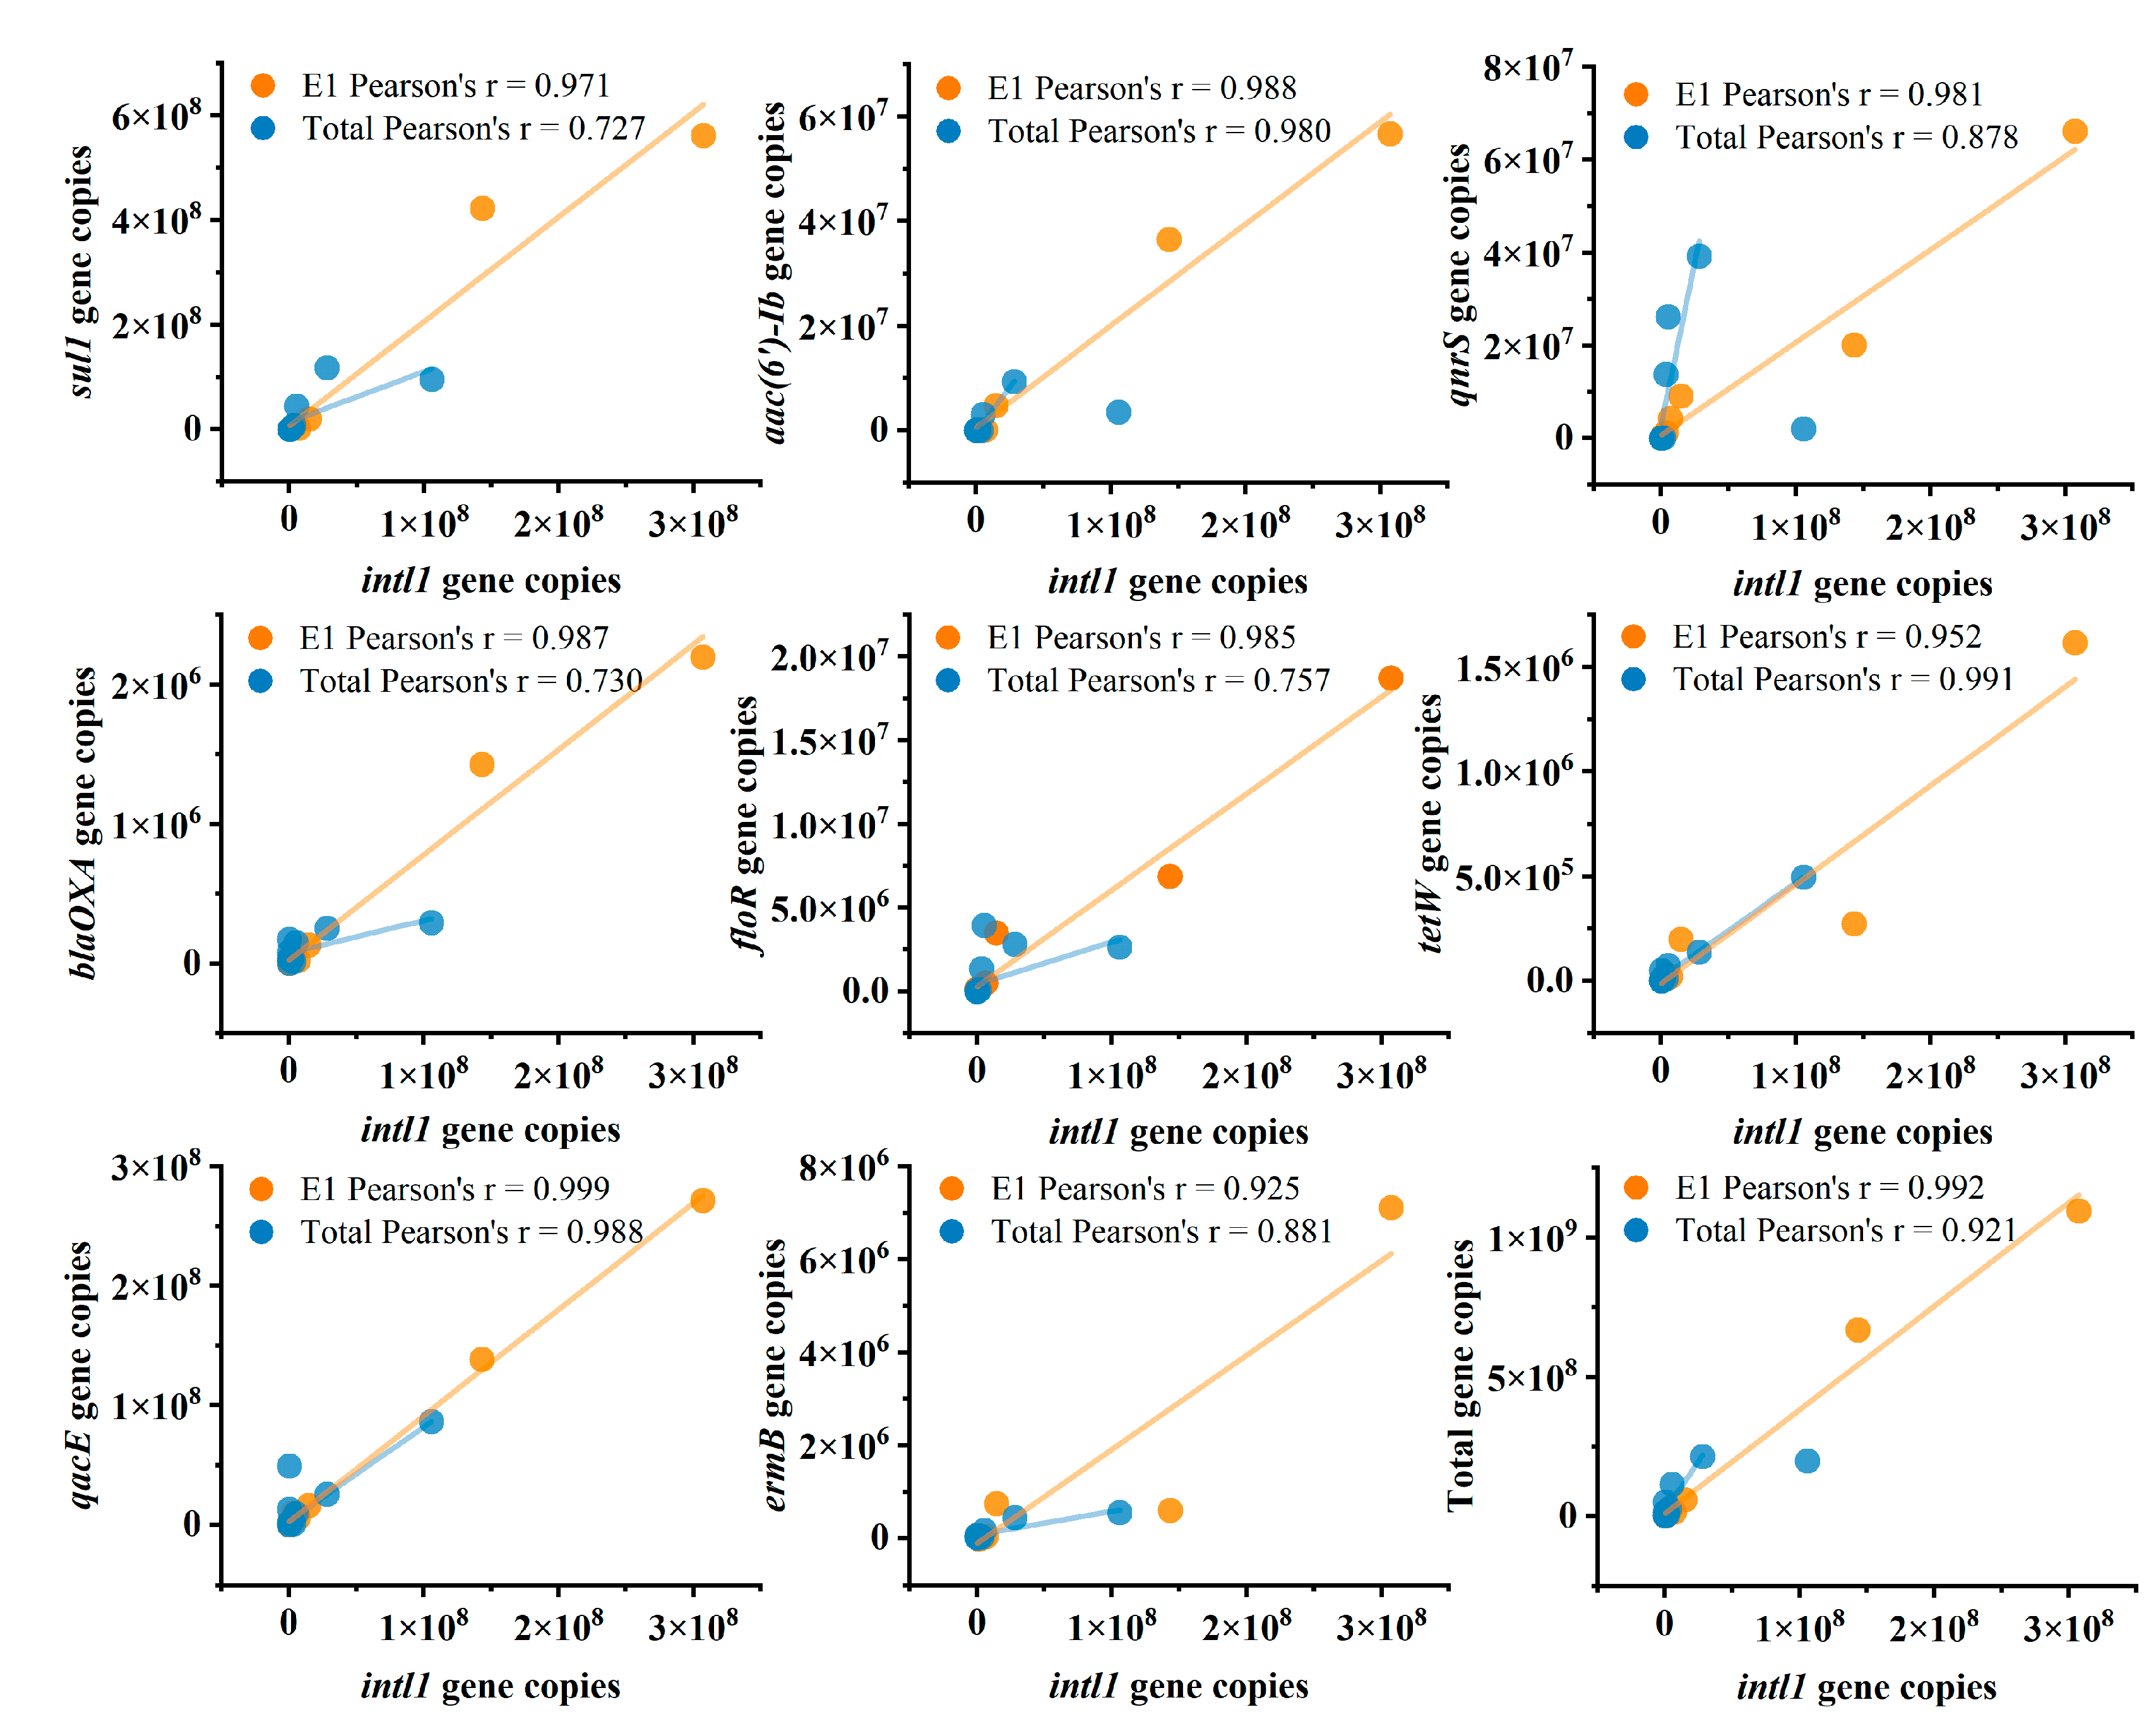
Figure 7.
Variation in absolute gene abundance detected by high-throughput quantitative PCR (HT-qPCR) across sample types and DNA extraction cycles using the MP kits. Bars represent the absolute abundance (expressed as copies/L or copies/g) of genes within four functional categories: taxonomic marker genes (e.g., 16S rRNA), mobile genetic elements (MGEs), heavy metal resistance genes (HMRGs), and antibiotic resistance genes (ARGs). Samples: W1 and W7 (water, 1 and 7 extraction cycles), S1 and S7 (sediment, 1 and 7 cycles), B1 and B3 (fish intestine, 1 and 3 cycles). The data demonstrate that absolute gene abundance varies with sample processing protocols.
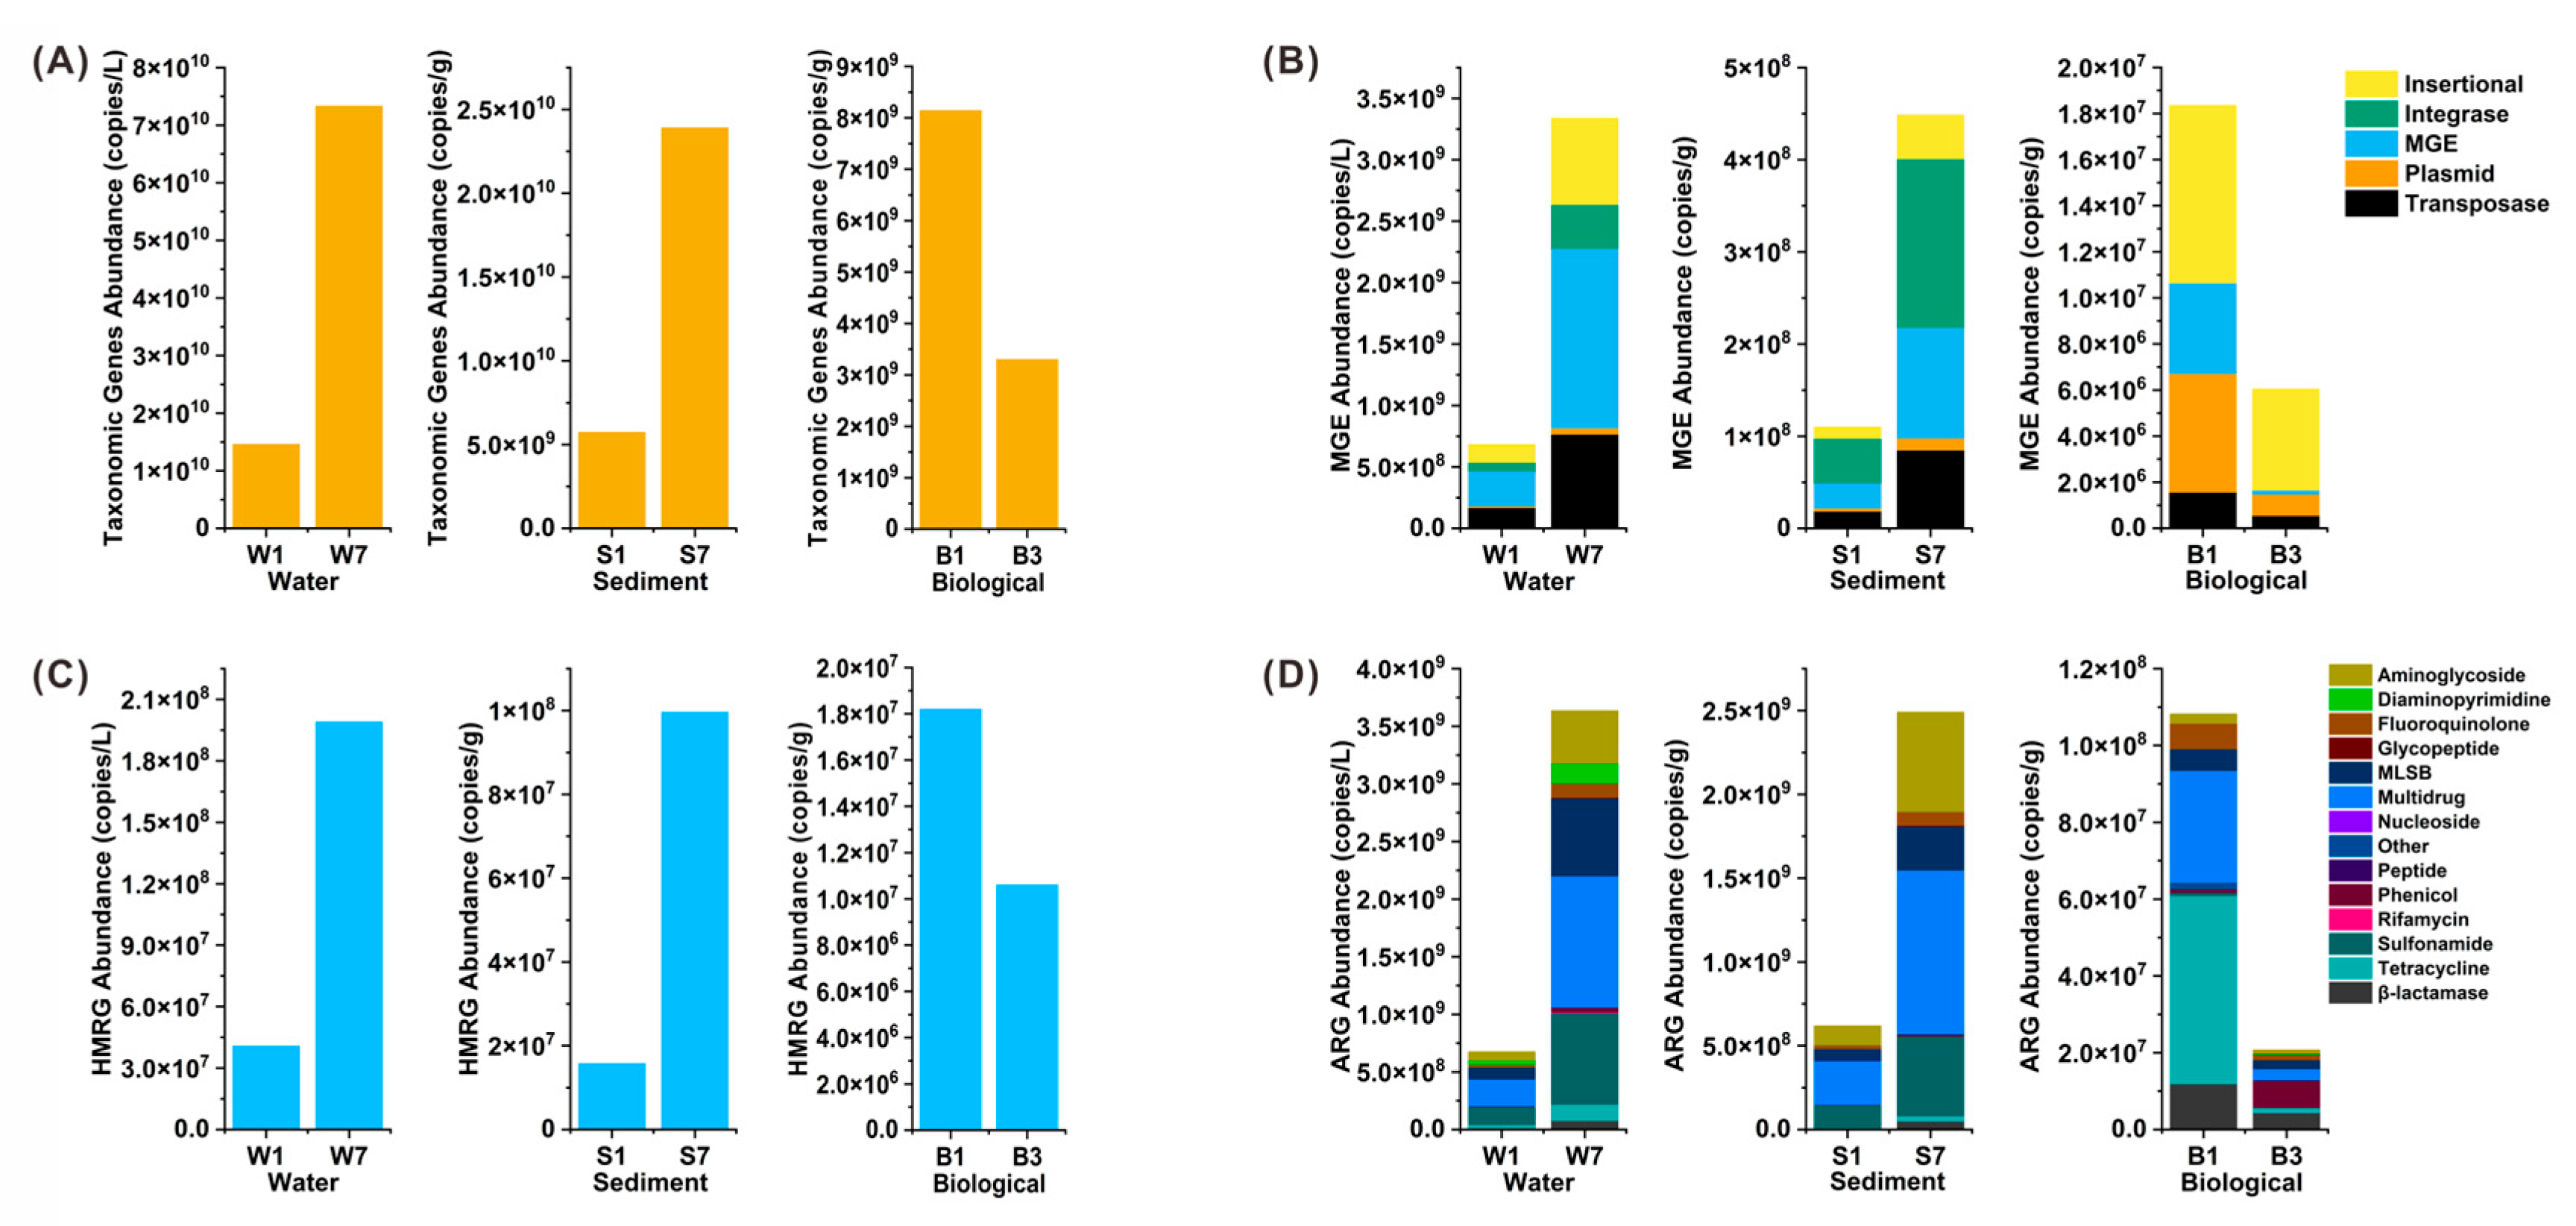
Figure 8.
RDA analysis showing the correlations among antibiotic resistance genes (ARGs), taxonomic marker genes (e.g., 16S rRNA), mobile genetic elements (MGEs), heavy metal resistance genes (HMRGs) and extraction cycles (1, 3, and 7). Arrows indicate the extraction cycles and the absolute abundances of genes within the four functional categories (normalized to 16S rRNA). Sample labels denote the absolute abundance of ARGs: W1 and W7 (water, 1 and 7 extraction cycles), S1 and S7 (sediment, 1 and 7 cycles), and B1 and B3 (fish intestine, 1 and 3 cycles).
Figure 9.
Pearson correlation analysis of the abundances of intI1, ten ARG subtypes, and bacterial communities (top 14 classes) based on (A) single DNA extractions and (B) successive DNA extractions. The abundances of ARGs, MGEs, and bacterial communities were log10-transformed prior to Pearson correlation analysis. Only strong (|R| > 0.6) and significant (p < 0.05) correlations are shown.
Disclaimer/Publisher’s Note: The statements, opinions and data contained in all publications are solely those of the individual author(s) and contributor(s) and not of MDPI and/or the editor(s). MDPI and/or the editor(s) disclaim responsibility for any injury to people or property resulting from any ideas, methods, instructions or products referred to in the content. |
© 2026 by the authors. Licensee MDPI, Basel, Switzerland. This article is an open access article distributed under the terms and conditions of the Creative Commons Attribution (CC BY) license.
Copyright: This open access article is published under a Creative Commons CC BY 4.0 license, which permit the free download, distribution, and reuse, provided that the author and preprint are cited in any reuse.


