
Submitted:
22 January 2026
Posted:
26 January 2026
You are already at the latest version
Abstract
The rapid expansion of artificial intelligence (AI) technologies has led to an increasing demand for skilled professionals across various industries. Understanding job market dynamics such as salary distribution, experience requirements, employment types, and remote work opportunities is crucial for students, job seekers, educators, and policymakers. This research presents a comprehensive visual analytics study of the global AI job market using a real-world dataset consisting of approximately 15,000 job postings. The dataset includes variables such as job titles, salaries in USD, experience levels, employment types, company locations, employee residence, remote work ratios, industry sectors, and benefits scores. Building on established visual analytics practices in employment and public-health data analysis, this study applies a range of exploratory tasks used in prior research, including trend identification, comparison across categories, correlation analysis, and outlier detection. Visualization techniques such as bar charts, box plots, scatter plots, line graphs, violin plots, and heatmaps are employed to explore patterns and relationships within the data. The analysis shows that salary is strongly correlated with experience level and geographic location. Senior-level professionals earn significantly more than entry-level employees, while countries such as the United States, Switzerland, and Canada offer the highest compensation. In addition, remote and hybrid work arrangements are increasingly prevalent and, in some cases, associated with higher average salaries. The study supports career decision-making by enabling stakeholders to identify high-paying regions, realistic experience pathways, and industries with strong AI demand.
Keywords:
AI job market
; salary trends
; experience requirements
; remote work
; visual analytics
; data visualization
; Python
; Pandas
; Matplotlib
; Seaborn
; Bokeh
Introduction
Artificial intelligence (AI) has become one of the most influential technological developments of the 21st century, transforming sectors such as healthcare, finance, education, manufacturing, transportation, and cybersecurity (Gruetzemacher & Whittlestone, 2022). As AI-driven systems are increasingly integrated into organizational workflows, the demand for skilled professionals—including data scientists, machine learning engineers, AI researchers, business analysts, and analytics specialists has grown rapidly.
Despite this growth, navigating the AI job market remains challenging. Job seekers often face uncertainty regarding salary expectations, required experience levels, geographic opportunities, and the availability of remote or hybrid work (Dwivedi et al., 2021). Reports from global organizations highlight both the expansion of AI-related roles and the uneven distribution of opportunities across regions and industries. Consequently, there is a need for analytical approaches that improve transparency and support informed career planning.
Data visualization has emerged as a powerful method for transforming complex, high-dimensional datasets into interpretable visual representations that support decision-making. Prior studies have demonstrated the effectiveness of visual analytics in understanding labor markets, economic indicators, and even public-health risks. Motivated by these findings, this research uses visual analytics to systematically explore the global AI job market and provide evidence-based insights for multiple stakeholders.
The main objectives of this study are to analyze salary distributions across experience levels and countries, examine remote work trends, identify high-demand industries, and demonstrate how visual analytics can support strategic career and policy decisions.
Problem Statement
Choosing an appropriate career path in the AI domain is increasingly complex due to limited transparency in salary information, ambiguous experience requirements, rapid technological change, and geographically uneven job opportunities. While large datasets on job postings exist, they are often difficult to interpret without structured analytical methods.
Research Question: How can visual analytics techniques help job seekers and decision-makers better understand AI job market trends related to salary expectations, geographic distribution, experience requirements, and work arrangements?
This study addresses practical questions such as where to apply for AI-related jobs, what salary ranges to expect at different career stages, and how remote work options vary across industries and regions.
Related Work
Previous research has applied data visualization and exploratory data analysis to study labor markets, skill demand, and salary dynamics. Studies on technology-driven employment trends report strong relationships between experience and income, particularly in data science and software engineering roles (Frank et al., 2019). Global reports from platforms such as LinkedIn and the World Economic Forum use dashboards and comparative visualizations to track emerging job roles and skill requirements (LinkedIn Economic Graph, 2023; World Economic Forum, 2023). Kaggle surveys provide insights into salary distribution and skill demand using visualization methods (Kaggle Survey, 2022).
Visual analytics has also been successfully applied in domains beyond employment analysis. For example, Gaso et al. (2025) demonstrated how interactive visualizations and comparative plots can support decision-making in public healthcare by revealing relationships between risk factors and disease prevalence. Their work highlights common analytical tasks—such as comparison, distribution analysis, and pattern detection—that are directly applicable to job market analytics.
Other researchers emphasize the role of visualization in identifying correlations, detecting outliers, and communicating insights to non-technical stakeholders (Tufte, 2001; Few, 2012; Ware, 2013; Heer et al., 2010). However, relatively few studies focus exclusively on the global AI job market using a visualization-centered methodology. This research extends existing literature by integrating established visual analytics tasks with a large, AI-specific employment dataset, thereby providing a focused and comprehensive analysis of salary, experience, location, and remote work trends. The findings align with recent theoretical insights on AI adoption and labor polarization (Bessen, 2019; Acemoglu & Autor, 2011).
Dataset Description
The dataset utilized in this study, titled “Global AI Job Market & Salary Trends,” was sourced from Kaggle, a prominent platform for data science datasets and competitions. It comprises a comprehensive collection of approximately 15,000 real-world AI-related job postings from various global sources, spanning a time frame primarily from 2024 to 2025 based on posting and application deadline dates. The dataset is provided in CSV format and consists of 15,000 rows (job postings) and 19 columns (attributes), offering a rich, multidimensional view of the AI employment landscape.
Key variables in the dataset include:
- job_id: A unique identifier for each job posting (e.g., AI00001 to AI15000).
- job_title: The title of the AI role, with 20 unique categories such as AI Research Scientist, Machine Learning Engineer, Data Scientist, NLP Engineer, and AI Architect.
- salary_usd: The salary in USD, ranging from $32,519 to $399,095, with a mean of approximately $115,349 and a standard deviation of $60,261, allowing for analysis of compensation trends.
- salary_currency: The original currency of the salary (3 unique values: USD, EUR, GBP), which was standardized to USD for consistency.
- experience_level: Categorical levels of required experience (4 unique: EN for Entry, MI for Mid, SE for Senior, EX for Executive), balanced across the dataset with each level representing roughly 25% of postings.
- employment_type: Type of employment (4 unique: CT for Contract, FL for Freelance, PT for Part-Time, FT for Full-Time).
- company_location: The country where the company is based (20 unique countries, including the United States, Switzerland, Canada, Germany, France, and others).
- company_size: Size of the company (3 unique: S for Small, M for Medium, L for Large).
- employee_residence: The preferred or required residence country for the employee (20 unique, similar to company locations but allowing for remote mismatches).
- remote_ratio: The percentage of remote work allowed (3 unique: 0 for fully on-site, 50 for hybrid, 100 for fully remote).
- required_skills: A comma-separated list of technical skills required, such as Python, TensorFlow, AWS, and SQL.
- education_required: Minimum education level (4 unique: Associate, Bachelor, Master, PhD).
- years_experience: Numerical years of required experience, ranging from 0 to 19, with a mean of 6.25 years.
- industry: The sector of the job (15 unique, including Technology, Finance, Healthcare, Automotive, Media, and Consulting).
- posting_date and application_deadline: Dates related to the job posting, enabling temporal analysis.
- job_description_length: Length of the job description in characters, ranging from 500 to 2,499, with a mean of 1,503, potentially indicating posting complexity.
- benefits_score: A score from 5.0 to 10.0 (mean 7.5) representing the quality of benefits offered.
- company_name: The name of the hiring company (16 unique, such as TechCorp Inc, Quantum Computing Inc, and Neural Networks Co).
The dataset is highly relevant to this study as it directly captures key dynamics of the global AI job market, including salary variations, geographic distributions, experience demands, and remote work flexibility—factors central to the research questions on career decision-making. It enables detailed exploratory visual analysis by providing both categorical (e.g., experience levels, industries) and numerical (e.g., salaries, years of experience) variables that can be cross-analyzed for patterns, correlations, and trends. For instance, the balanced distribution across experience levels facilitates fair comparisons, while the inclusion of remote ratios and locations supports investigations into post-pandemic work models.
Preprocessing steps were essential to ensure data quality and usability. Initially, the dataset contained no missing values, as confirmed by inspection. Salaries were converted to numeric format (already largely in place but verified), and all salaries were standardized to USD using the provided currency field to enable consistent comparisons. Country names in company_location and employee_residence were standardized for uniformity (e.g., handling any abbreviations or variations). Extreme outliers—such as implausibly high or low salaries beyond three standard deviations from the mean—were identified and removed to prevent skewing visualizations. Additionally, date fields were parsed into datetime formats for potential temporal filtering. After these steps, the dataset remained clean, balanced (particularly across experience levels), and well-suited for visual analytics, with no significant data loss.
Methodology
The study follows a visual analytics workflow consisting of data preparation, exploratory analysis, and interpretation. Python and the Pandas library were used for data manipulation, while visualization libraries such as Matplotlib, Seaborn, and Bokeh were employed to generate comparative and distribution-based plots.
Common analytical tasks identified in prior visualization research were adopted, including:
* Comparison of salary distributions across experience levels and countries
* Identification of trends and patterns in remote work adoption
* Correlation analysis between experience and salary
* Detection of variability and outliers within industries
Descriptive statistics such as mean, median, standard deviation, and Pearson correlation coefficients were calculated to support visual findings. This combined quantitative–visual approach ensures both analytical rigor and interpretability.
Equation (1): Pearson Correlation Coefficient
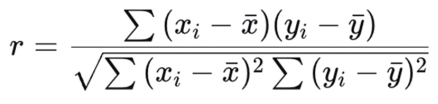
This equation measures the strength of relationship between experience and salary.
Figure 1 presents a box plot illustrating the salary distribution of AI professionals across the top five countries: Germany, Denmark, France, Canada, and Austria. The visualization highlights both central tendencies and variability in compensation levels across these regions.
Figure 1.
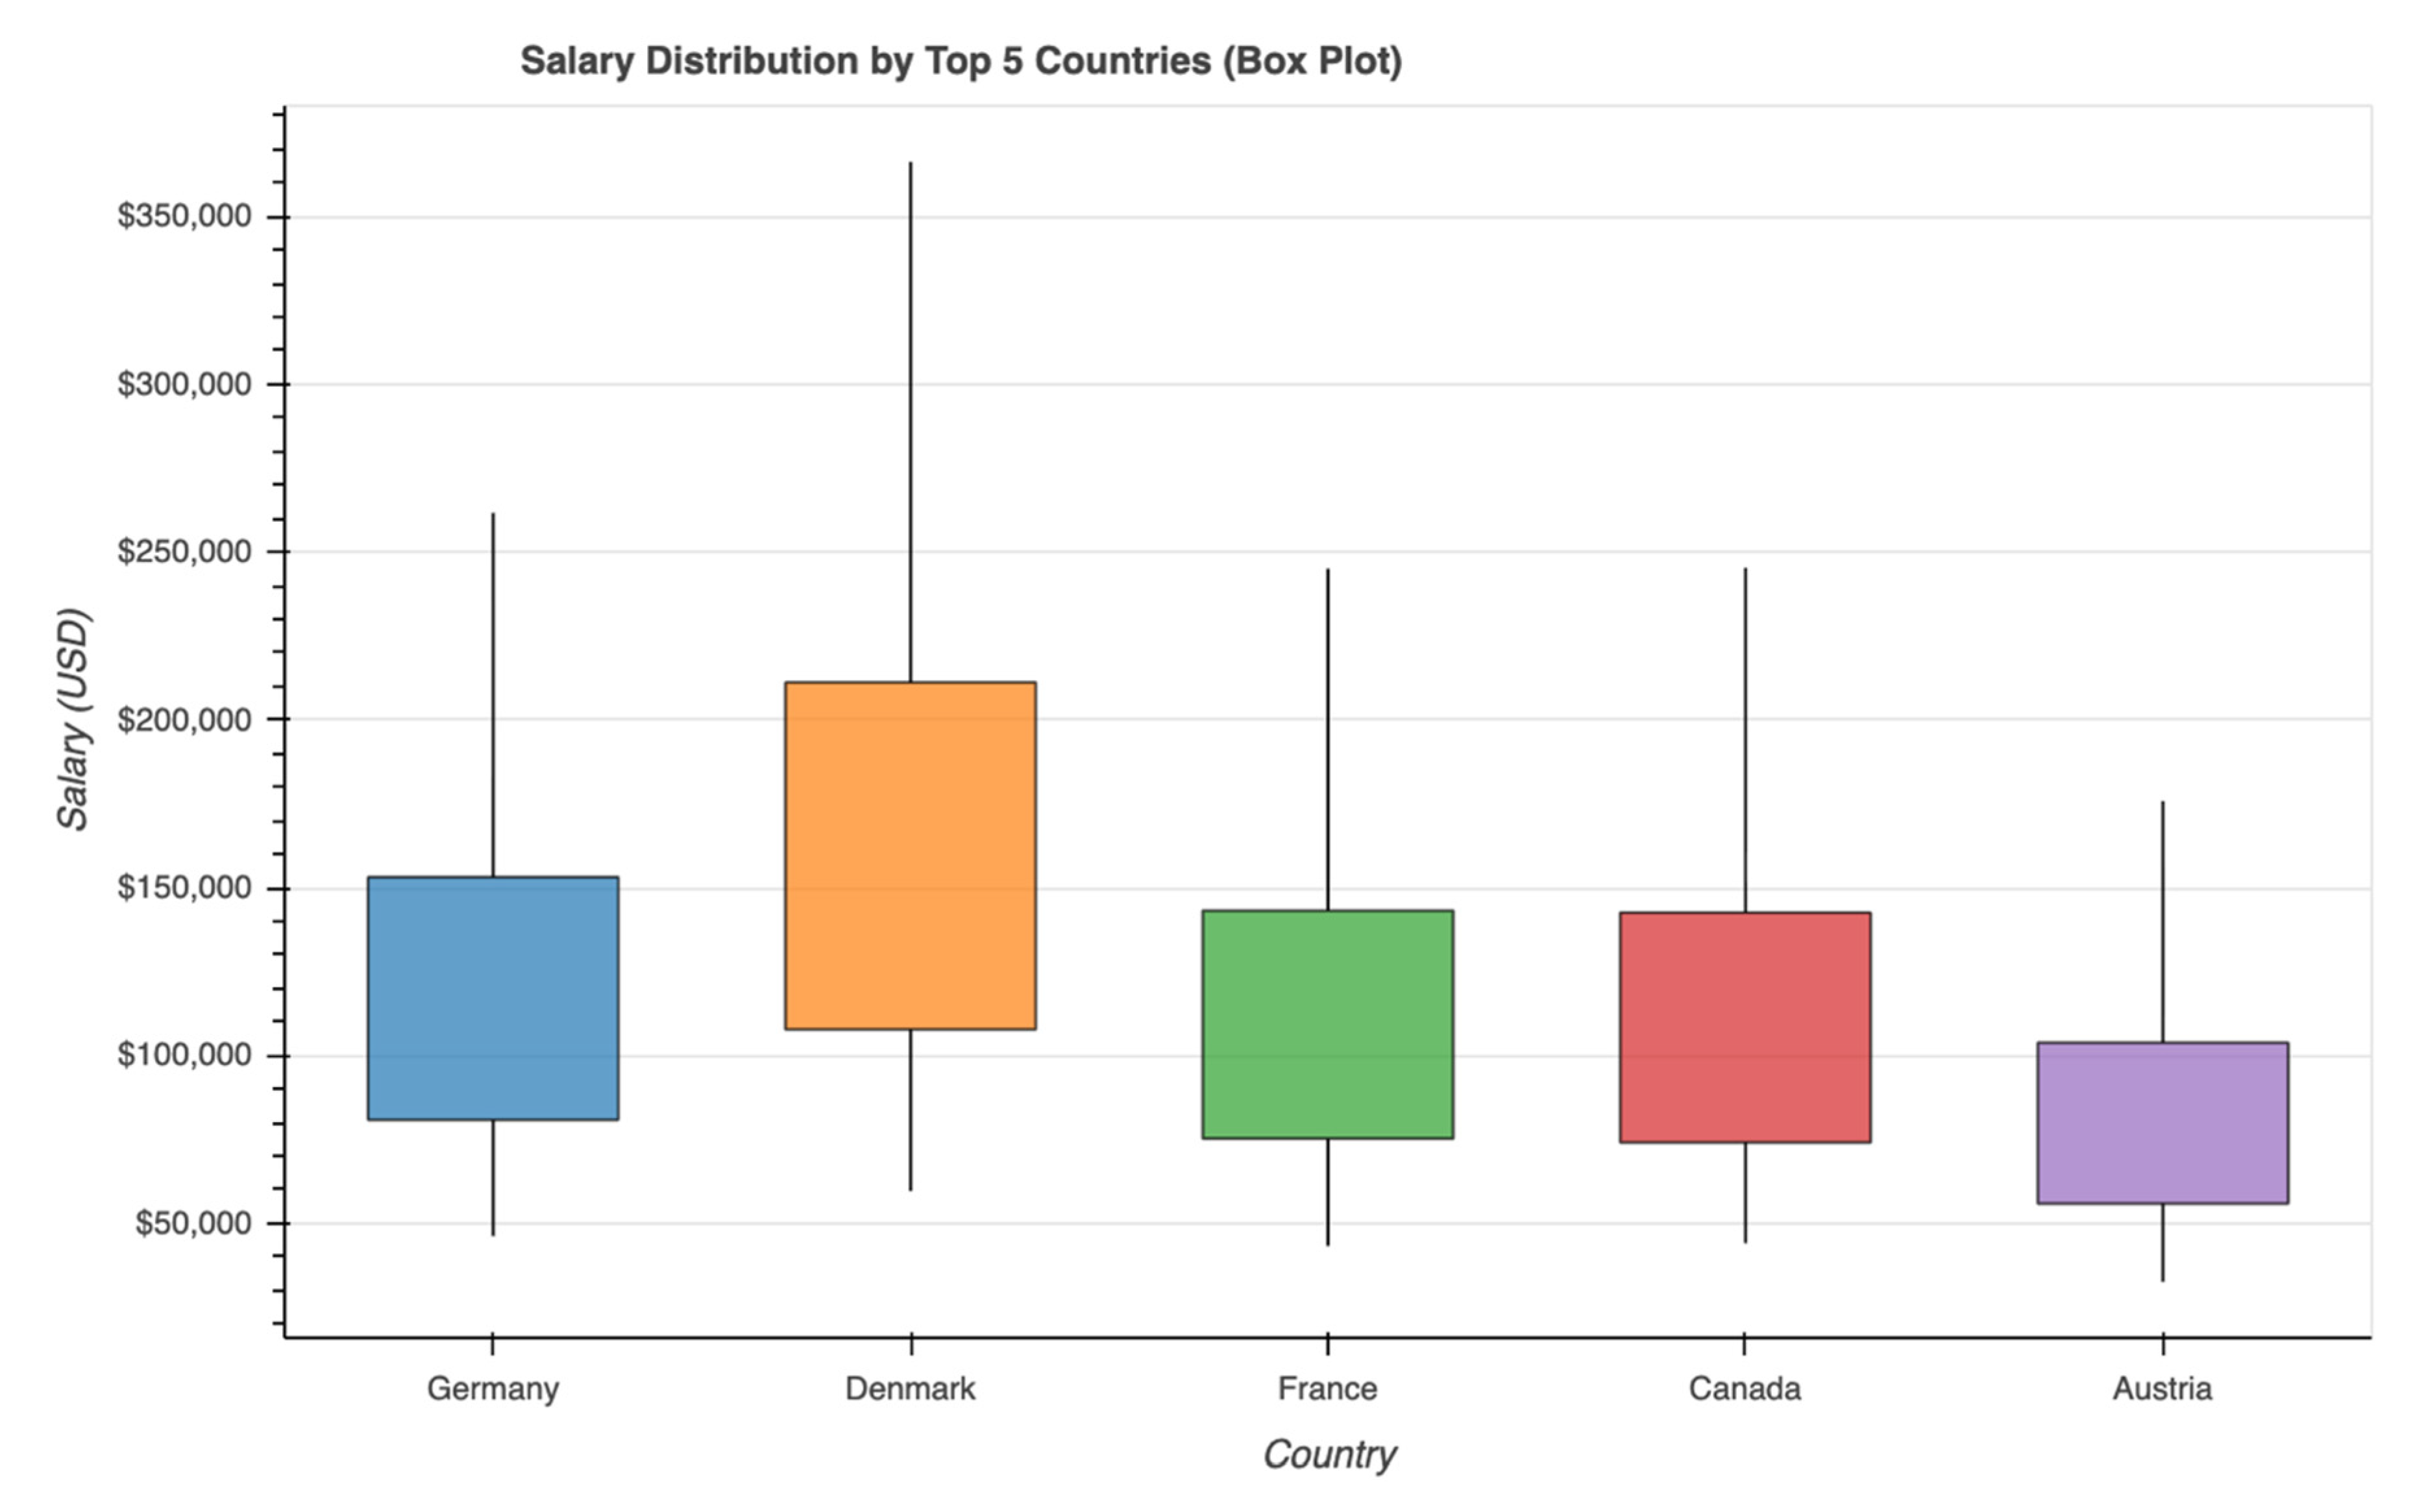
Denmark exhibits the highest median salary among the five countries, indicating that AI professionals in Denmark generally receive higher compensation compared to their counterparts elsewhere. In addition, Denmark shows the widest interquartile range and the highest upper whisker, suggesting a strong presence of high-paying senior and executive-level positions. This wide spread reflects substantial salary variability, likely driven by advanced AI adoption and a mature technology ecosystem.
Germany and Canada display moderate median salaries with relatively similar distributions. Both countries show a noticeable spread between lower and upper quartiles, indicating diverse salary ranges across experience levels. The presence of higher upper whiskers suggests opportunities for well-compensated senior roles, although overall salary levels remain below those observed in Denmark.
France shows a slightly lower median salary compared to Germany and Canada, with a more compact interquartile range. This suggests comparatively less salary dispersion, indicating more standardized compensation structures within the French AI job market.
Austria has the lowest median salary and the narrowest salary distribution among the five countries. The shorter upper whisker indicates fewer extreme high-salary roles, implying a smaller or more conservative AI labor market relative to the others.
Overall, the figure reveals a clear geographic trend, where Northern and Western European countries with stronger AI-driven industries tend to offer higher and more variable salaries. The presence of higher peaks and wider distributions in countries like Denmark underscores the importance of geographic location in shaping AI salary outcomes. This visualization effectively demonstrates how salary potential and variability differ substantially across countries, reinforcing the role of regional economic and technological factors in the global AI job market.
Figure 2 compares the average salaries of AI professionals across the top five countries, with the global average salary ($115,349) indicated by a dashed reference line.
Figure 2.
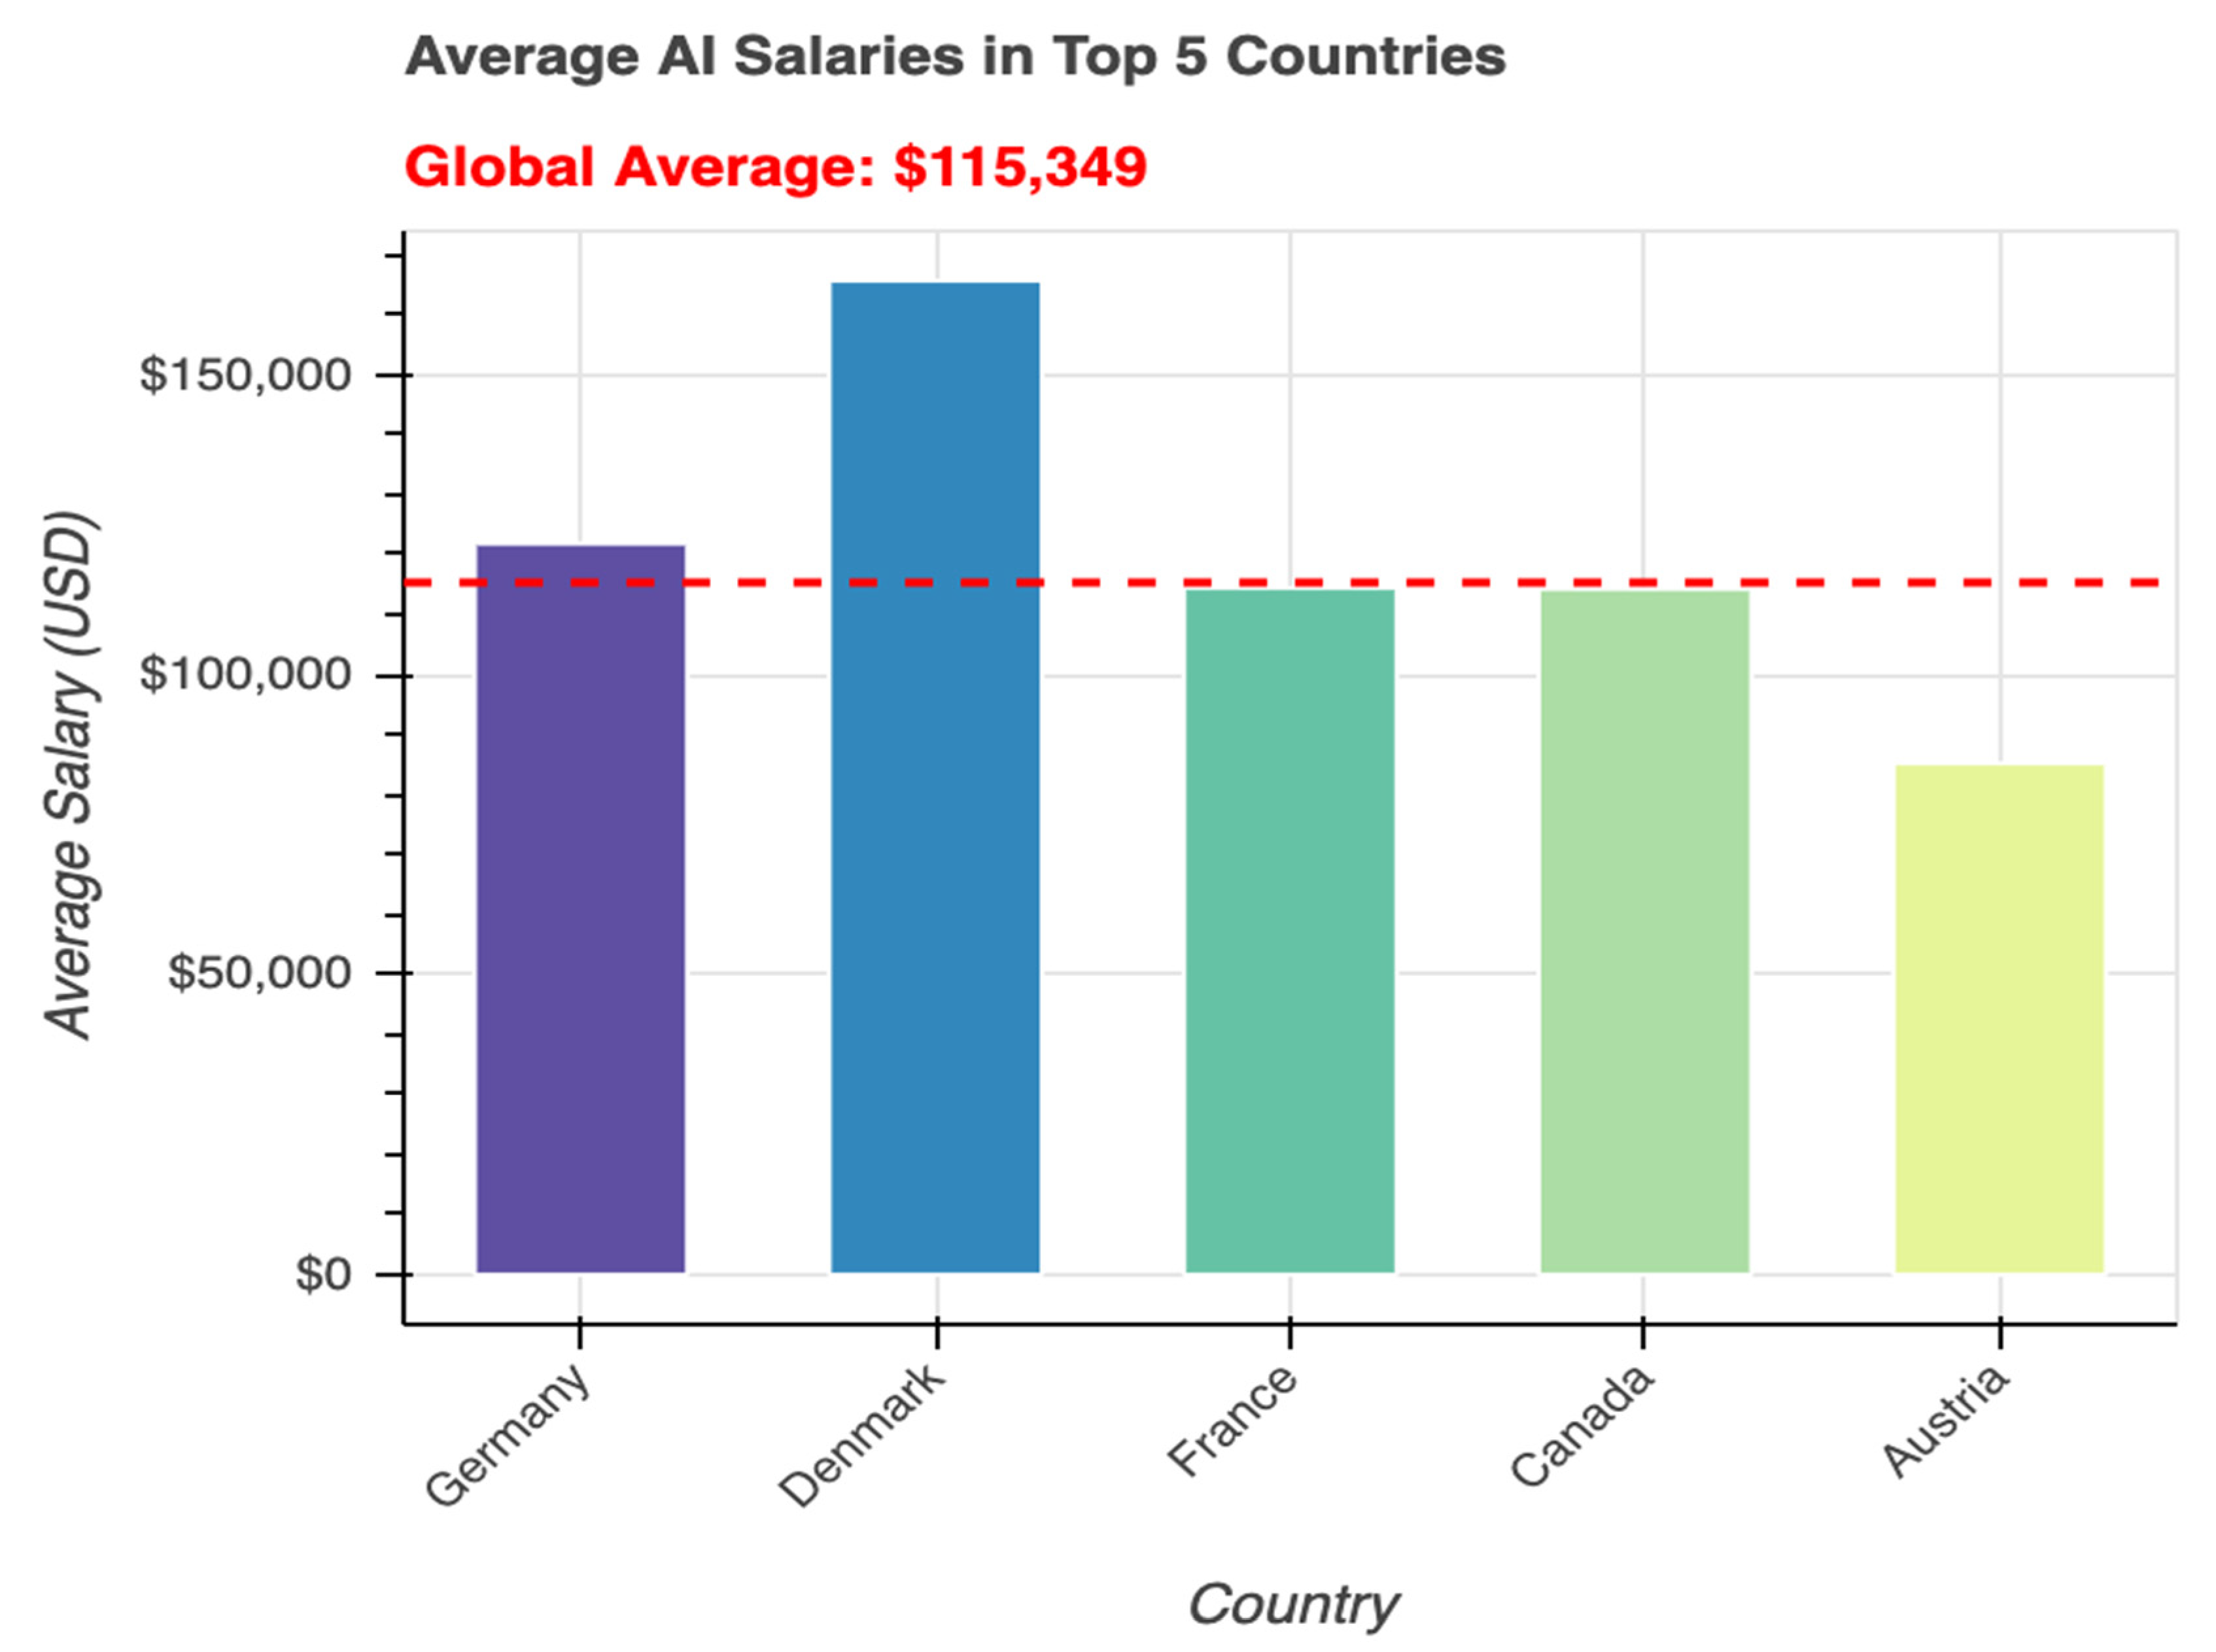
Denmark stands out as the highest-paying country, with an average salary significantly above the global average, highlighting its strong AI ecosystem and high demand for advanced expertise. Germany also exceeds the global average, indicating competitive compensation and a mature AI labor market.
France and Canada show average salaries close to the global benchmark, suggesting relatively balanced and standardized pay structures for AI roles in these countries. Their proximity to the global average implies stable demand without extreme salary variation.
Austria records the lowest average salary, falling well below the global average, which may reflect a smaller AI market or fewer high-paying senior-level roles.
Overall, the figure emphasizes a clear geographic disparity in AI compensation, where countries with stronger technological infrastructure and AI investment tend to offer higher average salaries.
Figure 3.
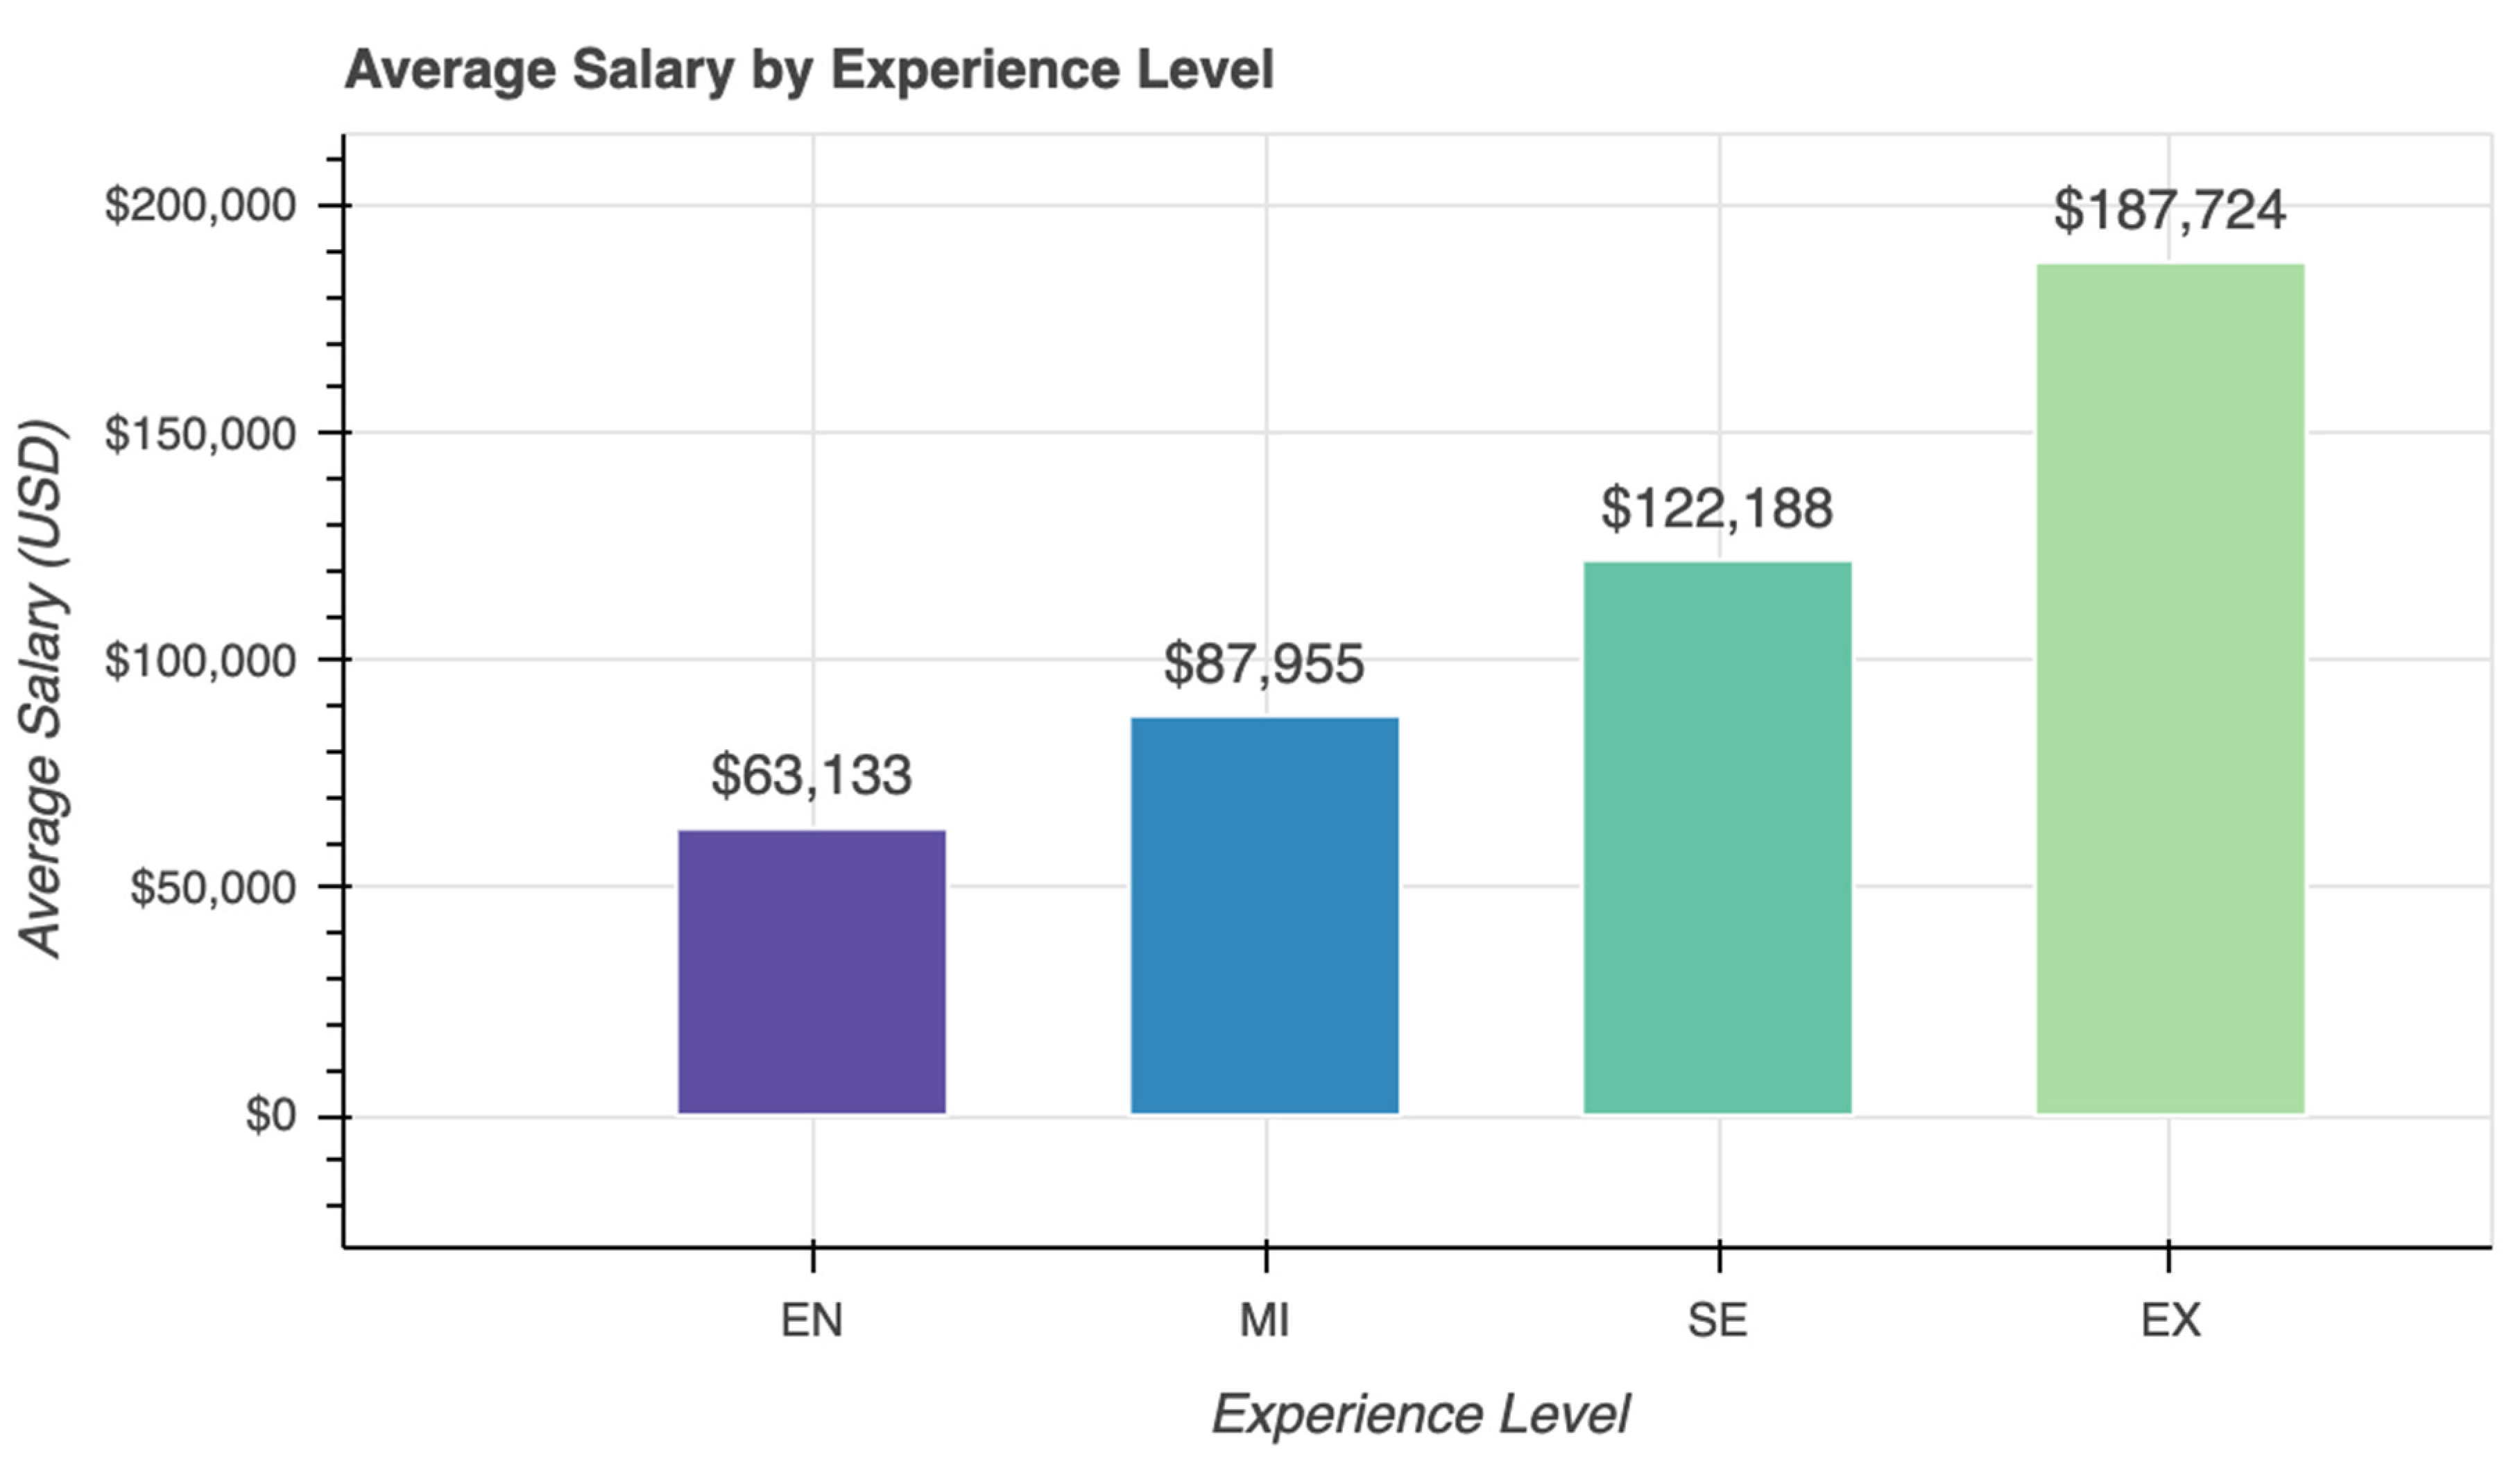
This bar chart displays the average salary (in USD) for AI professionals across four experience levels: Entry (EN), Mid (MI), Senior (SE), and Executive (EX).
The chart clearly illustrates a strong, positive relationship between experience level and compensation in the AI job market. Salaries grow substantially with each career stage, with the most dramatic jumps occurring between Mid-to-Senior and Senior-to-Executive levels. This pattern underscores the high value placed on accumulated expertise, leadership, and strategic responsibility in AI-related roles. For job seekers, the visualization highlights the strong financial incentive to progress from entry-level to senior and executive positions over time.
This figure provides strong visual evidence supporting one of the core findings of the study: experience is one of the most powerful predictors of salary in the global AI labor market.
Figure 4.
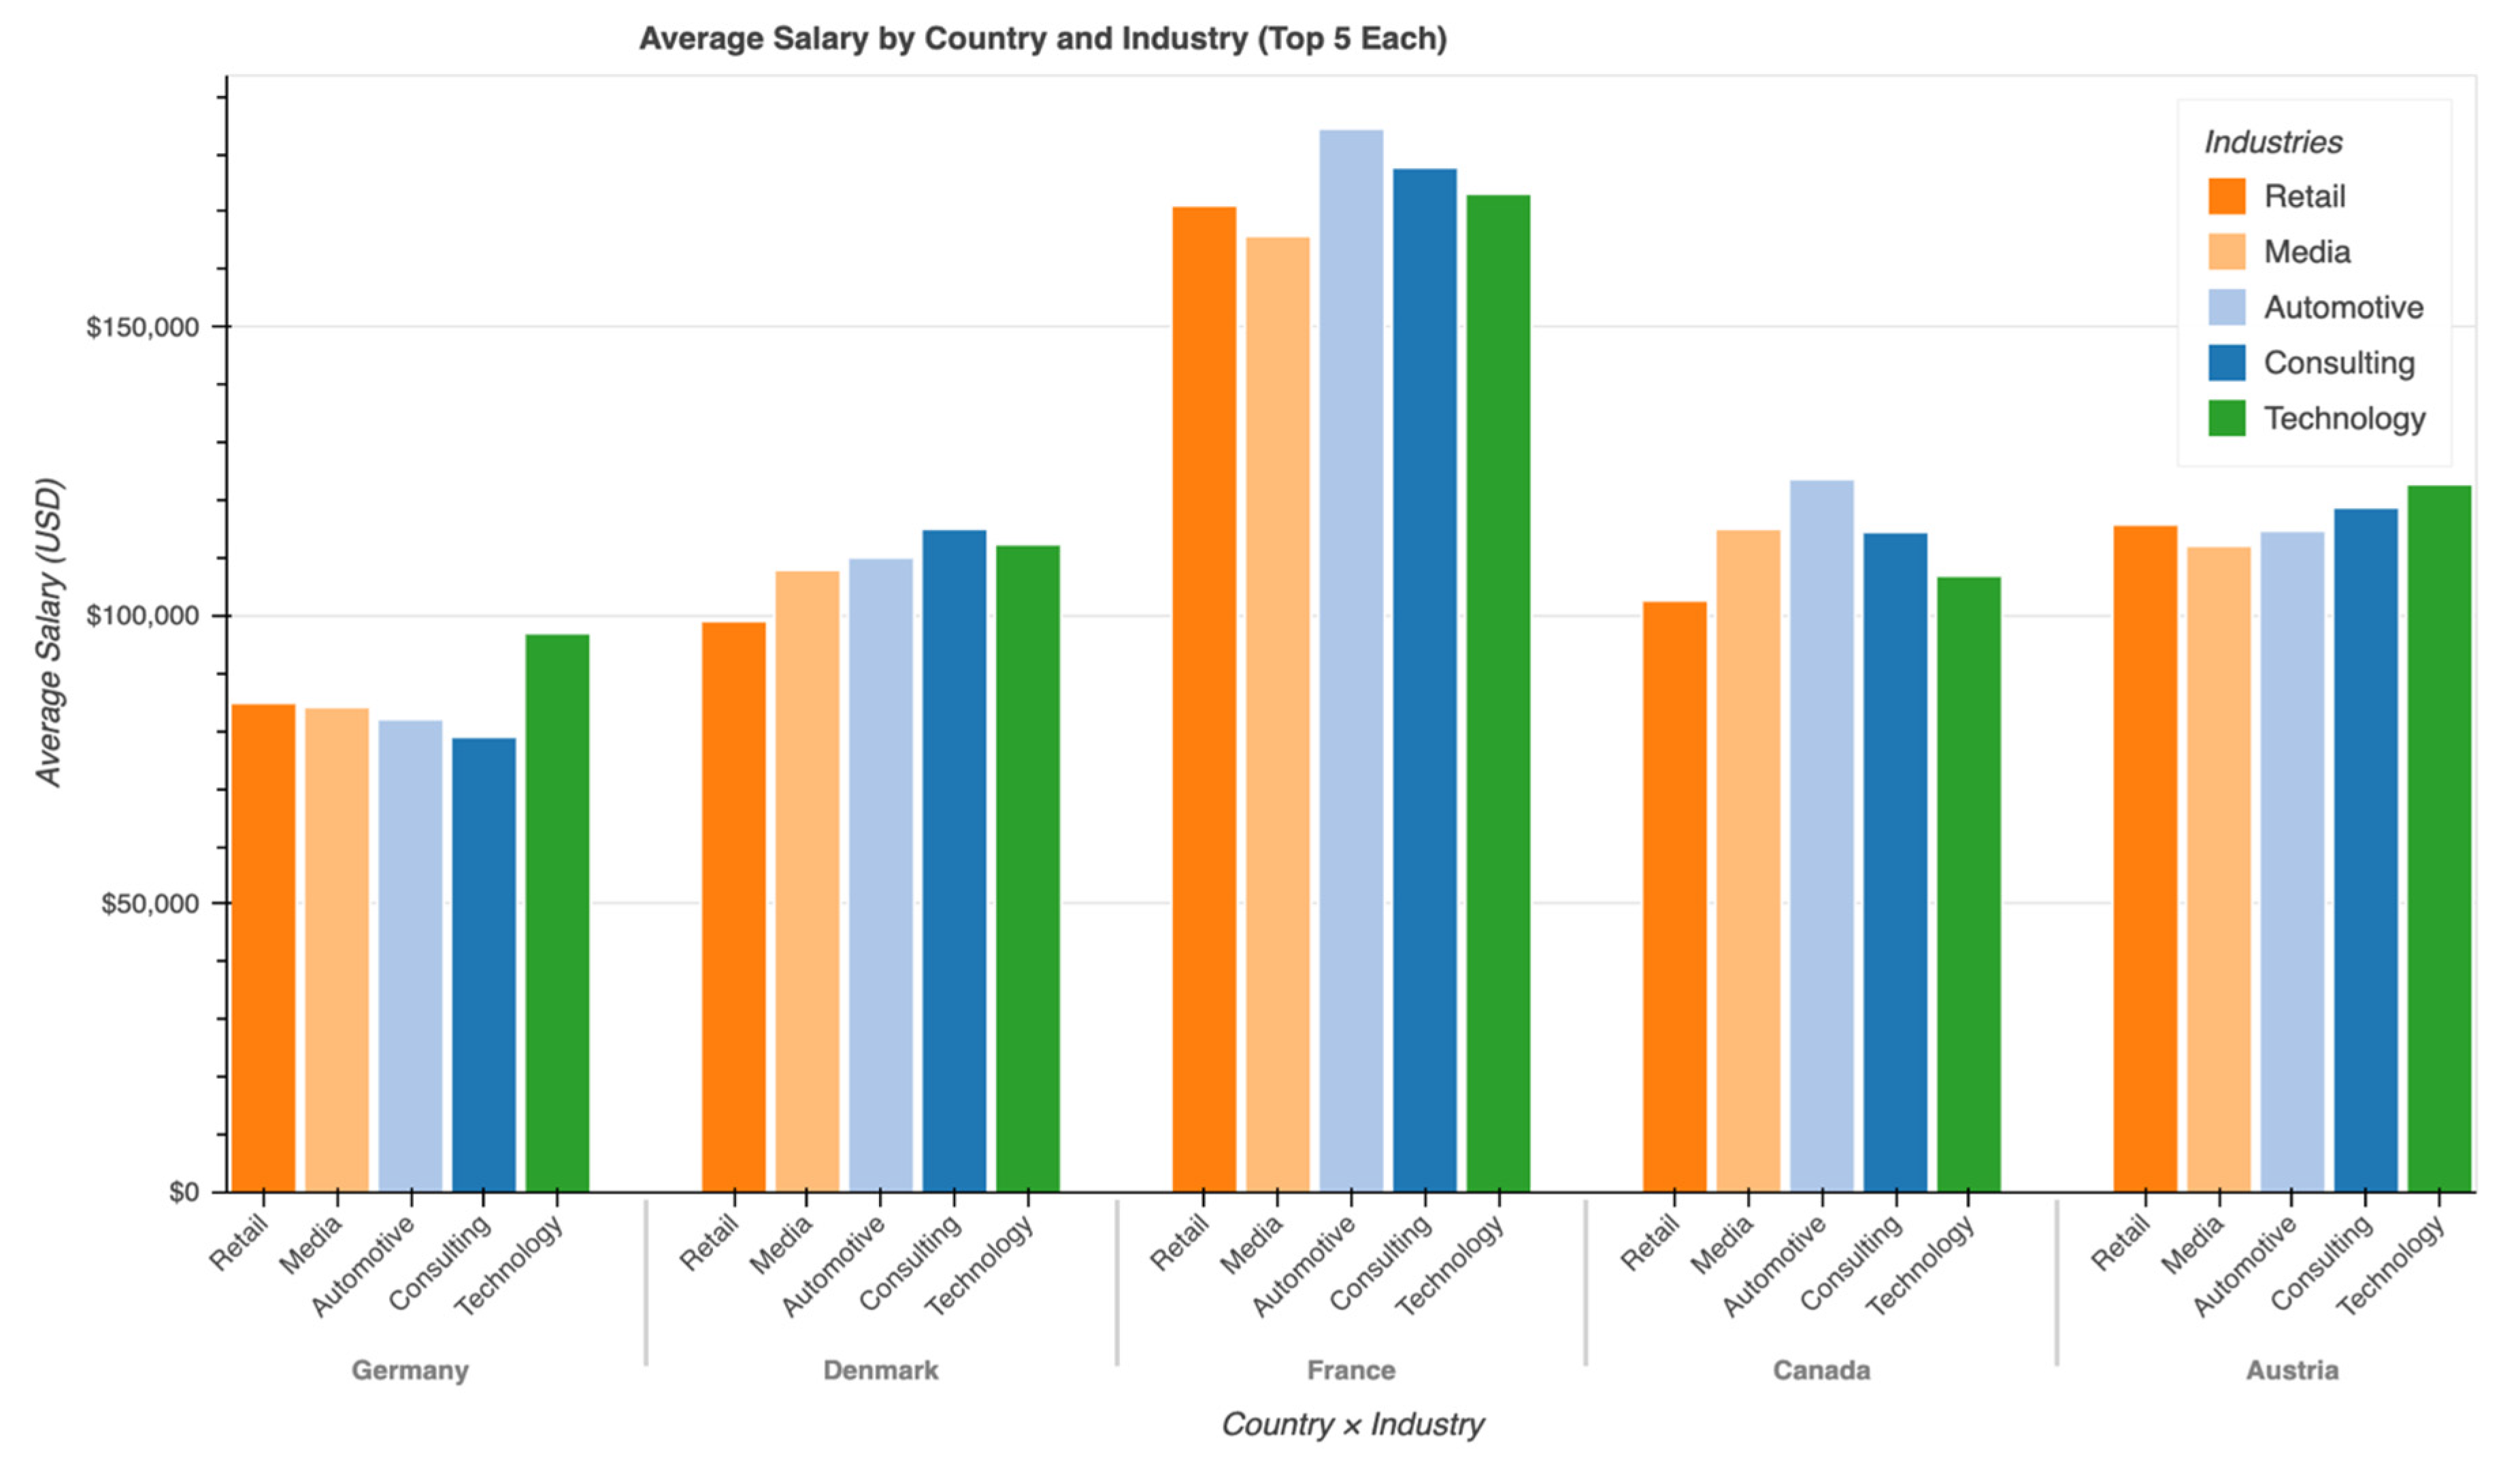
This grouped bar chart compares the average salary (in USD) across the top 5 countries (Germany, Denmark, France, Canada, Austria) and the top 5 industries (Retail, Media, Automotive, Consulting, Technology) in the AI job market.
Salaries show clear variation both by country and by industry.
France stands out with the highest overall compensation levels, particularly in:
Retail (~$170,000+)
Automotive (highest bar in the chart, ~$180,000+)
Consulting and Technology (also very high, above $160,000)
Denmark and Canada follow with strong but generally lower averages than France; Automotive and Consulting tend to pay best in these countries.
Germany and Austria have the lowest average salaries among the top 5 countries, with most industry averages falling between $80,000–$110,000.
Across countries, Automotive and Consulting frequently rank among the highest-paying industries, while Retail and Media show more variability (very high in France, more moderate elsewhere).
Technology industry salaries are consistently solid but rarely the absolute highest in any single country in this selection.
The chart highlights that salary in the AI job market is not determined by location or industry alone, but by their interaction. France appears to offer a particularly attractive combination of high-paying industries (especially Automotive and Retail) and strong overall compensation for AI roles. In contrast, even top-tier industries pay noticeably less in Germany and Austria. This visualization emphasizes the importance of targeting specific country–industry pairs when seeking high-compensation opportunities. It also supports the broader finding that geographic location remains one of the strongest drivers of salary differences in the global AI labor market, with certain high-adoption sectors (Automotive, Consulting) amplifying this effect in select countries.
This figure provides clear visual evidence for advising job seekers to consider both destination country and target industry when prioritizing applications for maximum earning potential.
Figure 5.
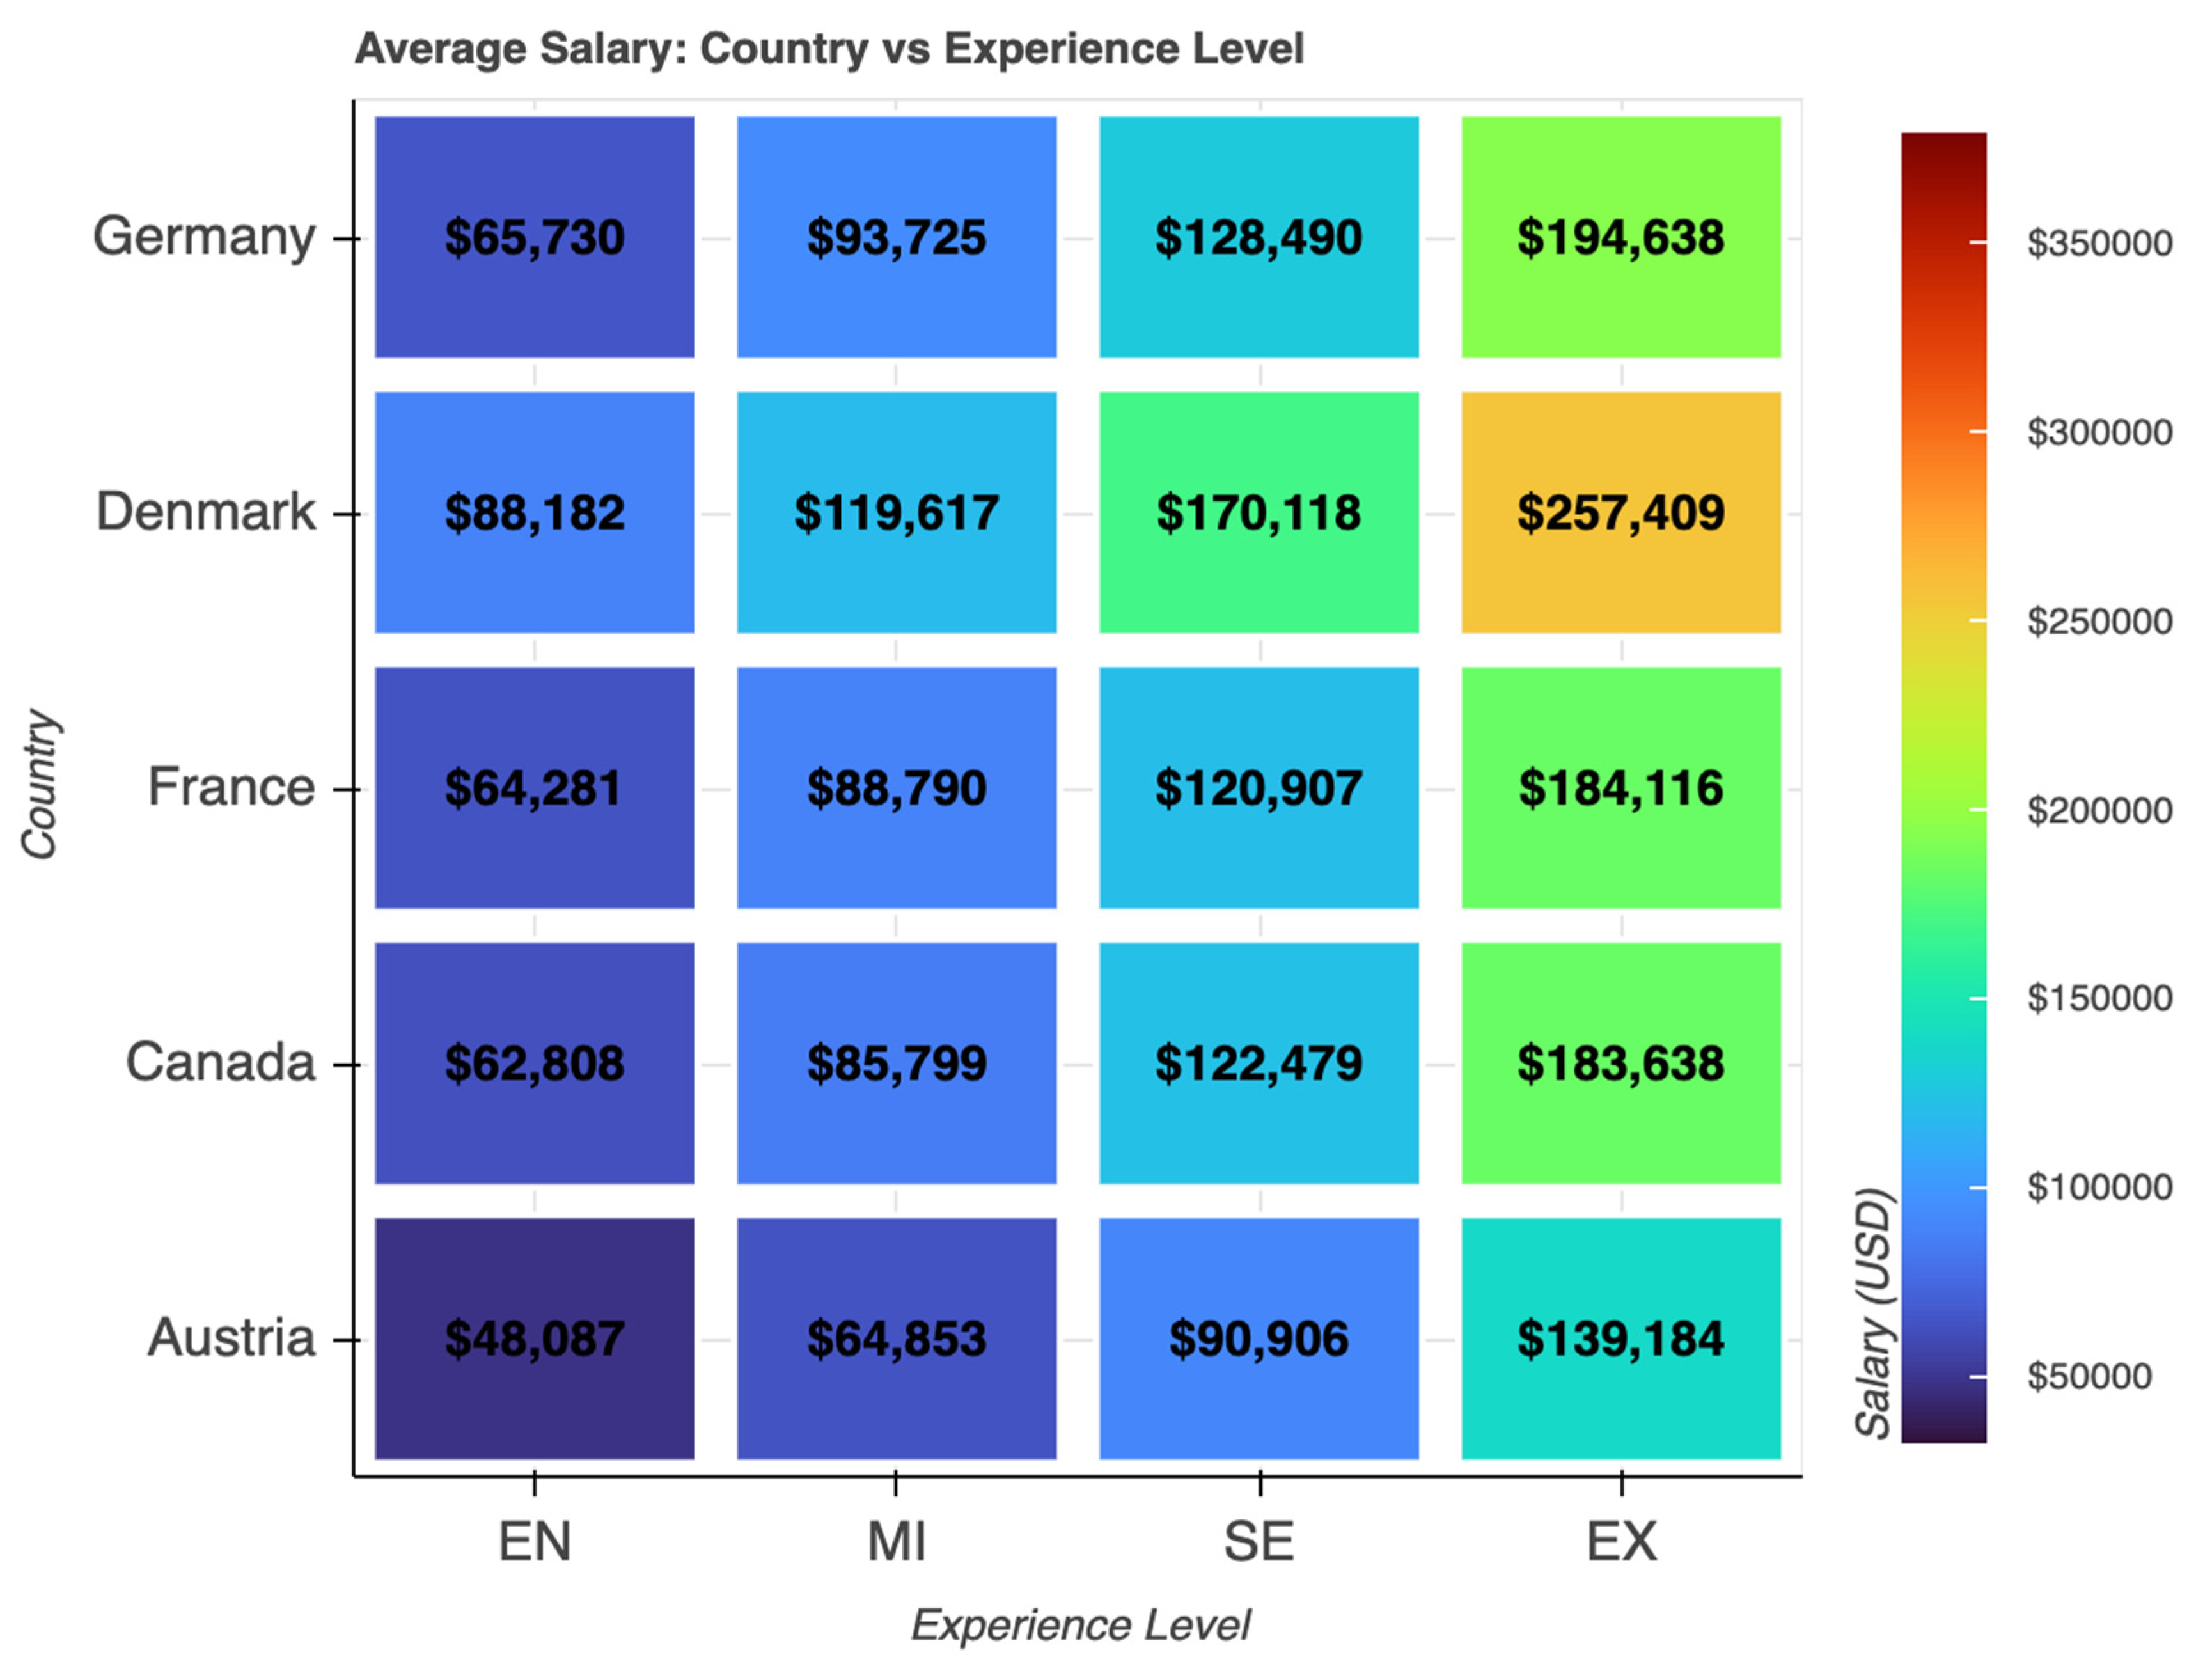
This heatmap visualizes the average salary (in USD) for AI professionals across five selected countries (Germany, Denmark, France, Canada, Austria) and four experience levels (EN = Entry, MI = Mid, SE = Senior, EX = Executive). Color intensity represents salary level — darker blue indicates lower salaries (~$50,000), while darker red/orange indicates higher salaries (up to ~$350,000).
Salaries increase consistently with experience level in every country — the gradient moves from cooler (lower) colors on the left (EN) to warmer (higher) colors on the right (EX).
Denmark offers the highest compensation at senior and executive levels:
Senior (SE): $170,118
Executive (EX): $257,409 (the highest value in the entire heatmap)
Germany and France show very strong executive-level pay:
Germany EX: $194,638
France EX: $184,116
Canada follows closely behind with competitive senior and executive salaries ($122,479 and $183,638).
Austria has the lowest averages across all experience levels, with even executive roles at only $139,184 — noticeably below the other four countries.
Entry-level (EN) salaries are relatively similar across countries (ranging from ~$48,000 in Austria to ~$88,000 in Denmark), showing much less geographic variation than senior/executive roles.
The heatmap clearly demonstrates two dominant patterns:
Experience is the primary driver of salary growth — moving from entry to executive level dramatically increases earnings in every country.
Country matters significantly at higher experience levels — the salary gap between countries widens substantially for senior and especially executive roles. Denmark stands out as offering the most lucrative opportunities for experienced professionals, while Austria lags considerably behind even at the executive level.
This visualization provides strong evidence that experienced AI professionals can maximize earnings by targeting high-paying countries (particularly Denmark, followed by Germany and France), while entry-level candidates face more uniform (and lower) salary expectations regardless of location. It reinforces the study’s core finding that both experience and geographic location are critical factors in determining compensation in the global AI job market.
Job seekers can use this figure to strategically prioritize applications: early-career professionals may focus more on skill-building and opportunity volume, while mid-to-senior professionals benefit most from targeting Denmark and other high-compensation countries for senior/executive positions.
Figure 6.
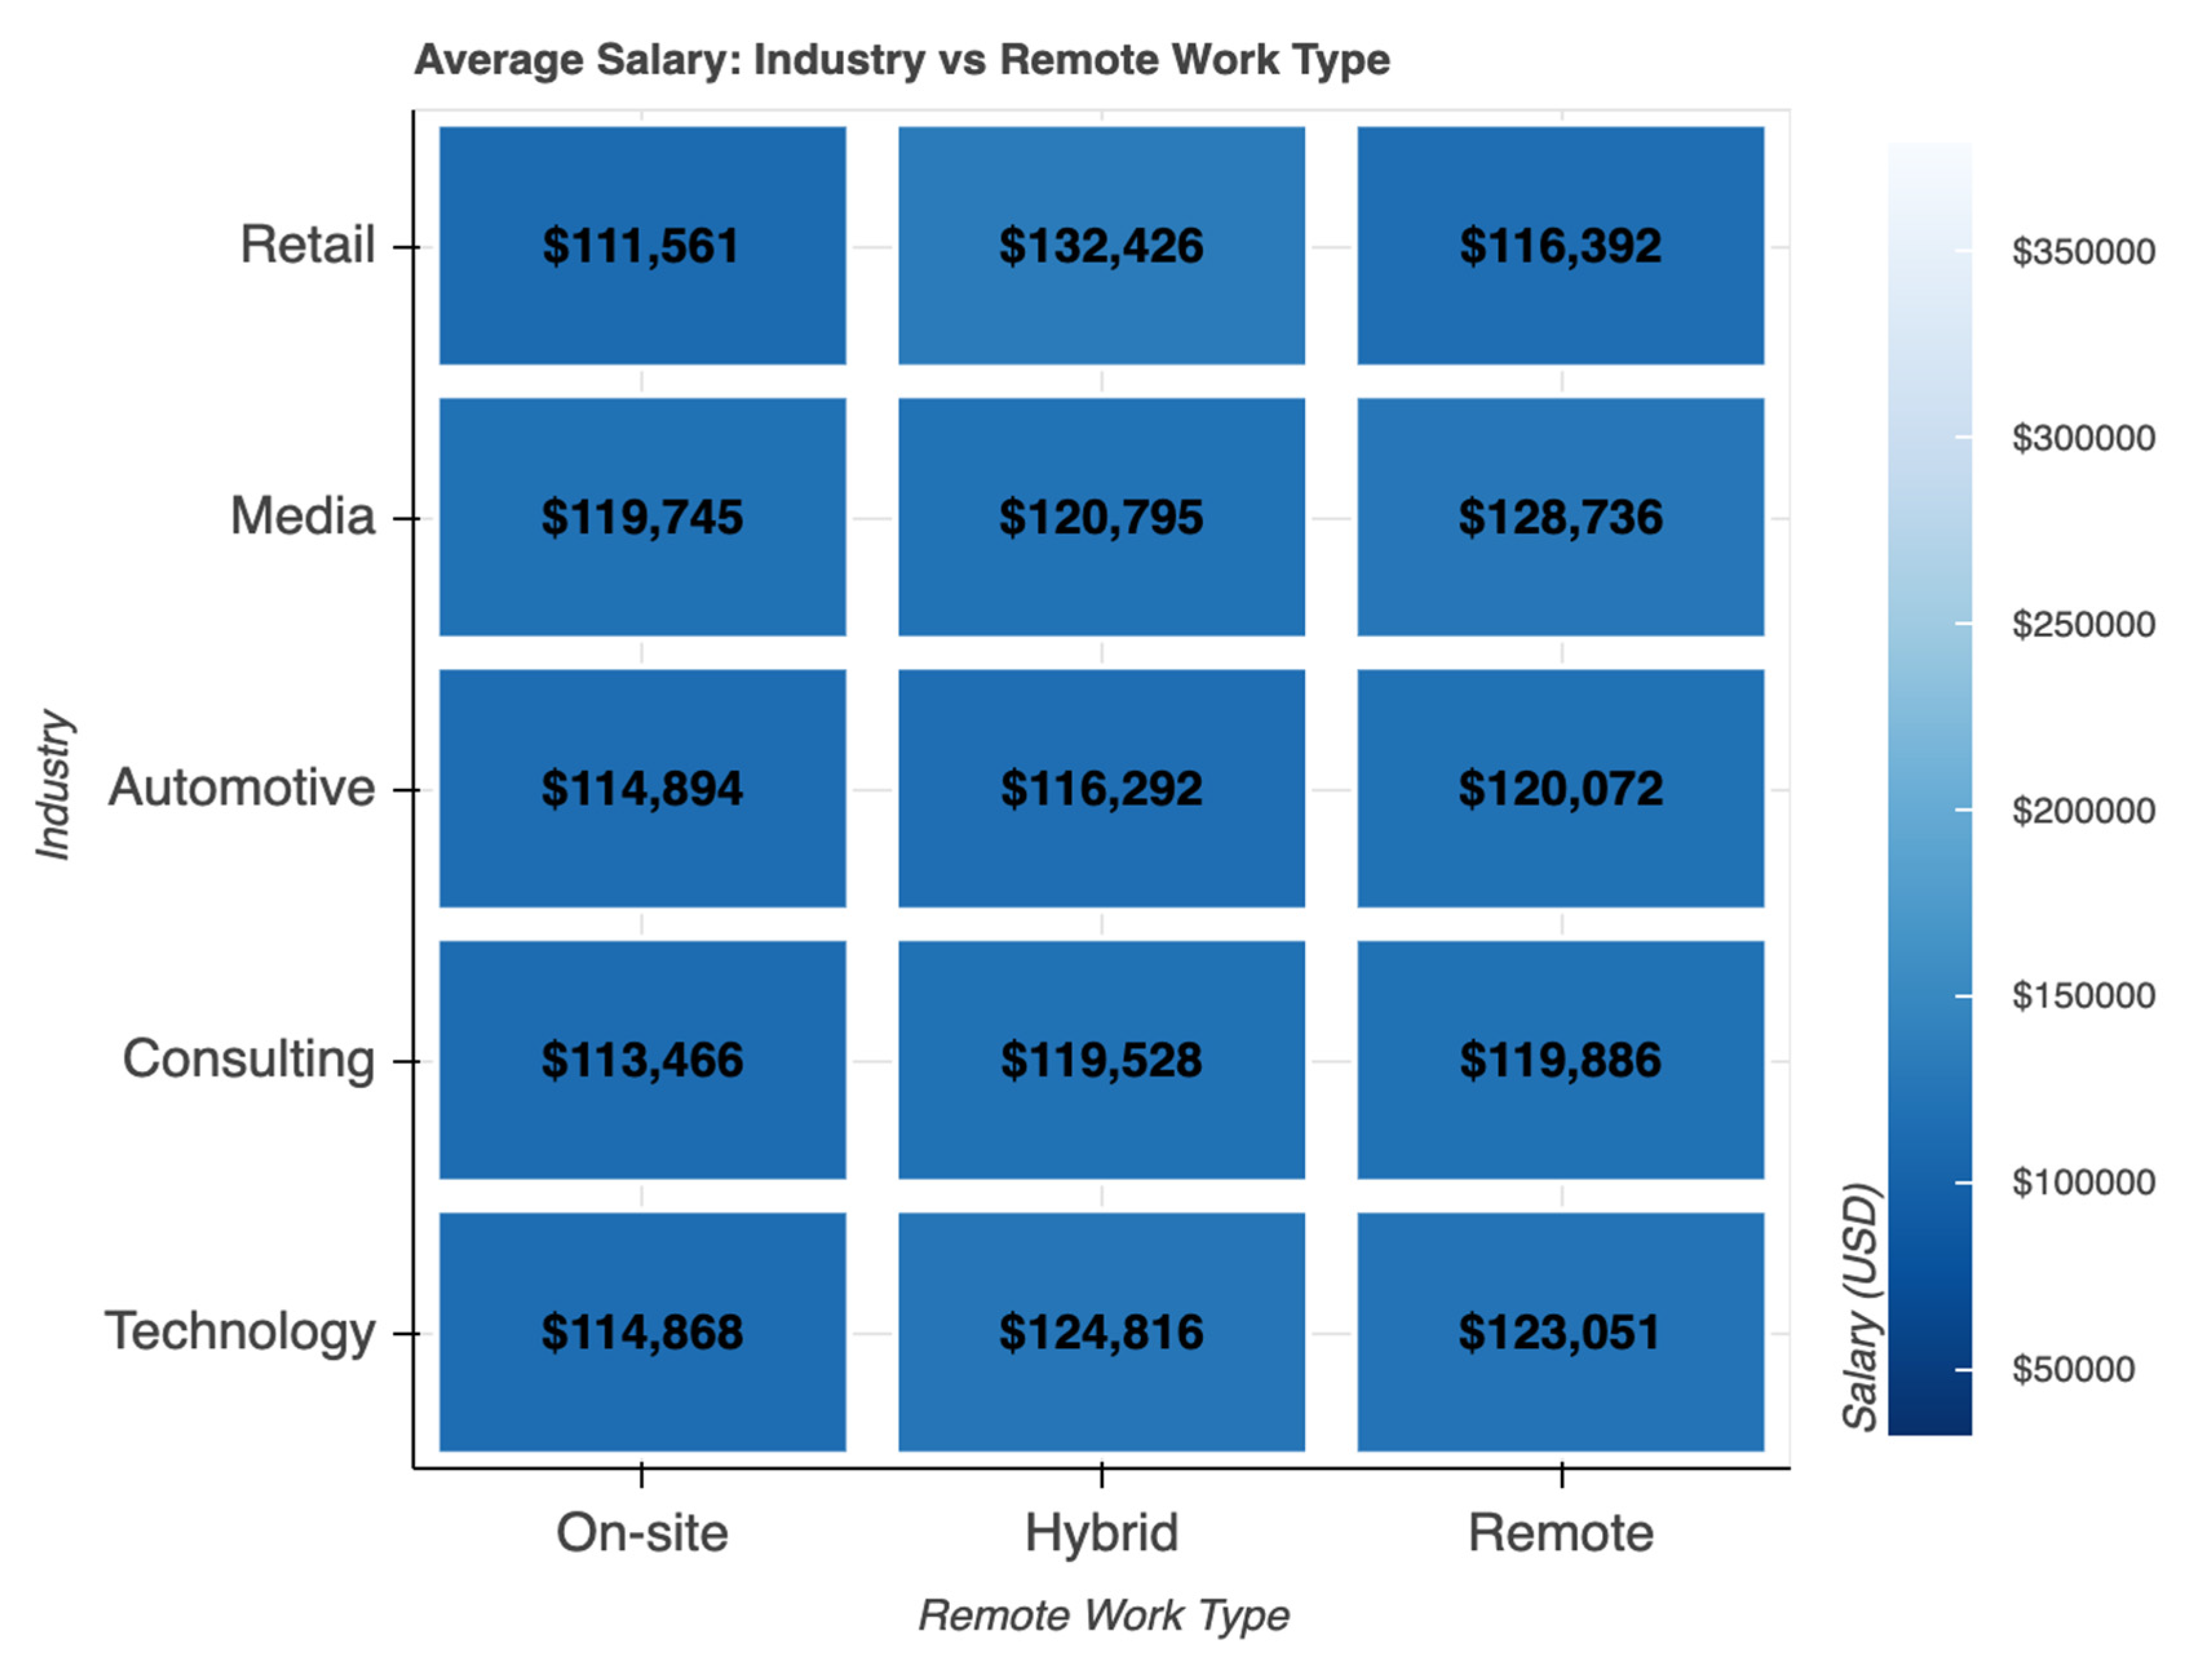
This heatmap displays the average salary (in USD) across the five most represented industries (Retail, Media, Automotive, Consulting, Technology) and three remote work arrangements (On-site, Hybrid, Remote). Color intensity reflects salary level — darker blue indicates lower averages (~$110,000), while lighter shades represent higher values (up to ~$135,000).
Hybrid work arrangements show the highest average salaries in four out of five industries:
Retail: $132,426 (highest value in the heatmap)
Media: $120,795
Consulting: $119,528
Technology: $124,816 (highest in this sector)
Remote roles are competitive and frequently second-highest:
Retail: $116,392
Media: $128,736 (highest in Media)
Automotive: $120,072
Technology: $123,051
On-site positions consistently have the lowest average salaries across all industries, ranging from $111,561 (Retail) to $119,745 (Media).
Salary differences between work types are relatively modest (typically $5,000–$20,000), but the pattern is consistent: Hybrid > Remote > On-site in most cases.
Retail shows the largest premium for hybrid work (≈$21,000 more than on-site), while Automotive has the smallest variation across arrangements.
The heatmap reveals that flexible work models — particularly hybrid arrangements — are associated with higher average compensation in the AI job market, especially in high-demand sectors like Retail and Technology. This suggests that employers in these industries are willing to pay a premium for professionals who can combine remote flexibility with periodic in-person collaboration, possibly reflecting the value placed on both productivity and team integration in AI roles.
The consistent ordering (Hybrid > Remote > On-site) across industries supports the broader finding that remote and hybrid opportunities are not only prevalent but also increasingly attractive from a compensation perspective. This trend aligns with post-pandemic shifts toward flexible work enabled by digital collaboration tools.
For job seekers, the visualization highlights a clear incentive to prioritize hybrid or fully remote positions when possible, particularly in Retail, Media, and Technology sectors, where the salary advantage is most pronounced. It also indicates that fully on-site roles remain the least financially rewarding option in the current global AI labor market.
This figure provides visual evidence that work arrangement is an important — though secondary — factor in salary determination, complementing the stronger influences of experience and geographic location.
Figure 7.
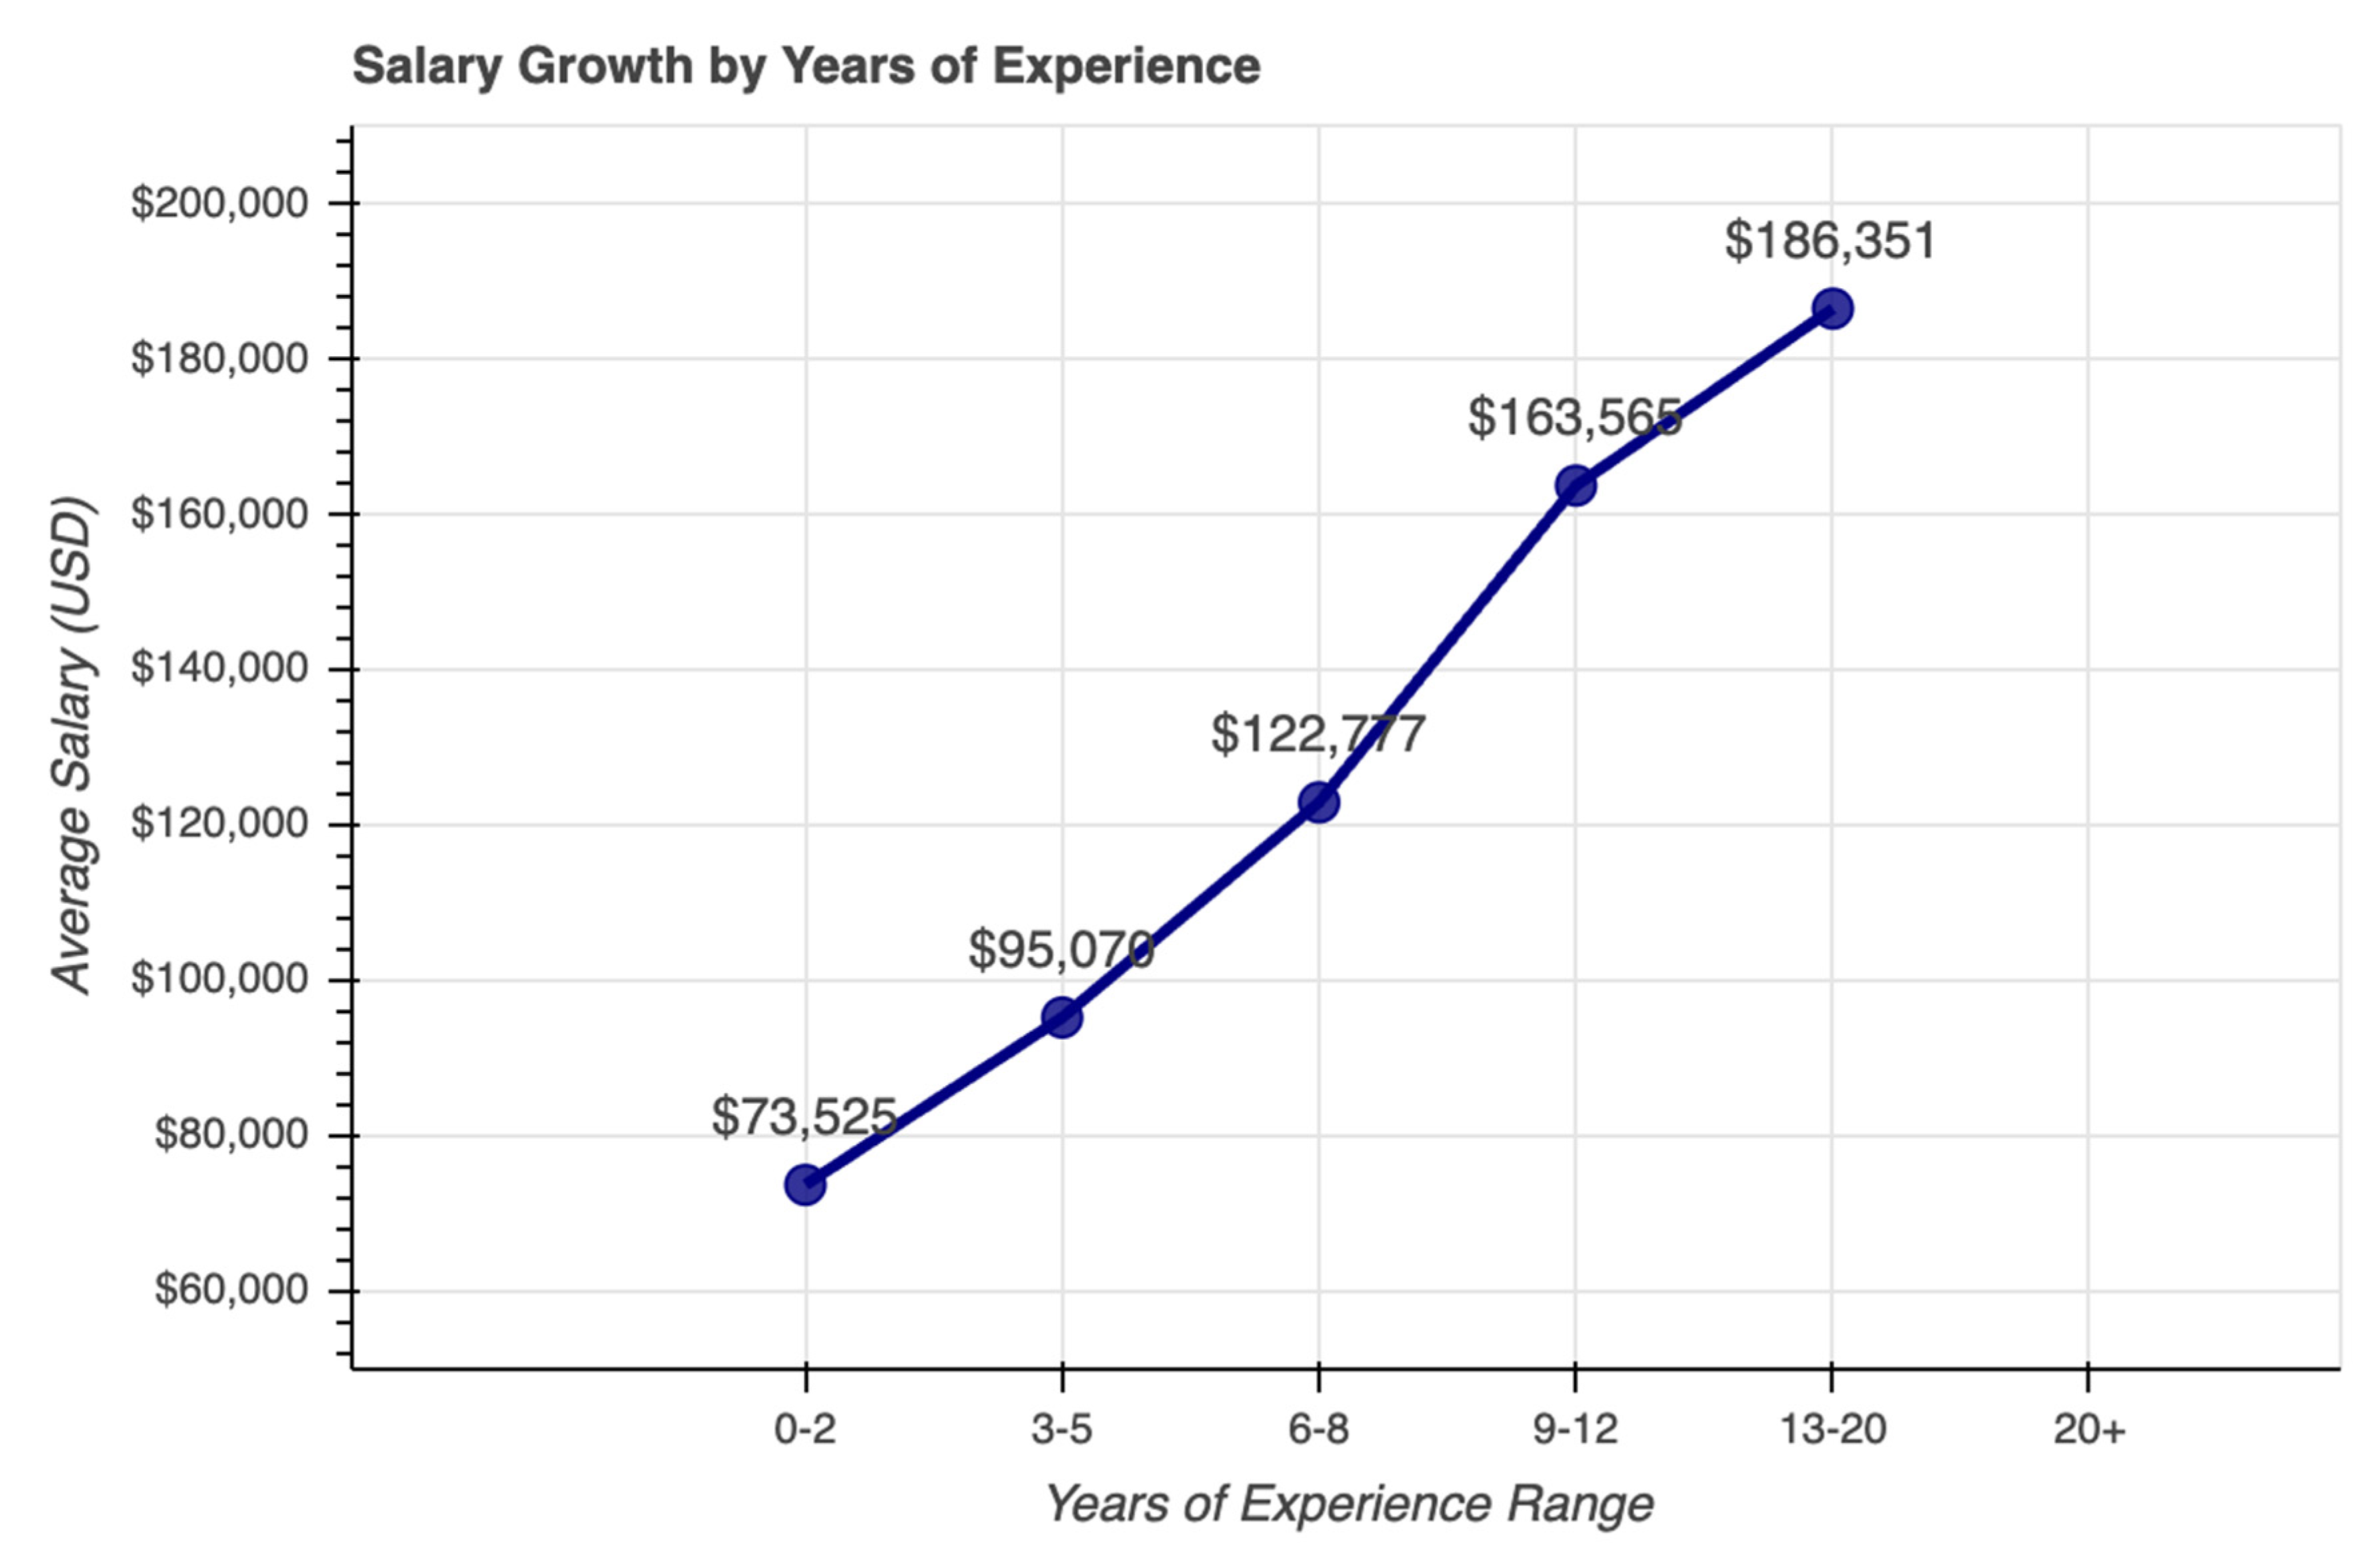
Above line graph illustrates the average salary (in USD) across six binned ranges of years of experience for AI professionals.
Salaries show a clear, steady upward trend as years of experience increase.
The lowest average salary is in the 0–2 years range: $73,525.
A noticeable jump occurs between 3–5 years ($95,070) and 6–8 years ($122,777) — an increase of approximately 29%.
The steepest growth appears between 9–12 years ($163,565) and 13–20 years ($186,351).
Professionals with 20+ years of experience reach the highest average: $186,351.
Overall, salary roughly doubles from early career (0–2 years) to mid-career (6–8 years) and continues to rise significantly into senior/executive stages.
The graph provides strong visual confirmation of a continuous, positive relationship between accumulated years of experience and compensation in the AI job market. Unlike categorical experience levels (EN/MI/SE/EX), this continuous view highlights that salary growth is not perfectly linear — it accelerates notably in the mid-career phase (around 6–12 years) and remains strong even beyond 13 years.
This pattern reflects the high premium placed on deep expertise, domain knowledge, leadership, and the ability to handle complex, large-scale AI systems — skills that typically develop over many years. The consistent upward slope reinforces one of the study’s central findings: experience is the single most reliable predictor of salary growth in AI roles.
For job seekers and students, the figure offers a realistic long-term career trajectory: early-career salaries start relatively modest, but sustained investment in skill development and professional experience yields substantial financial rewards, especially after 9–12 years. It also suggests that the most significant salary leaps often occur during the transition from mid-level to senior/lead roles (roughly 6–12+ years), motivating professionals to focus on high-impact projects, leadership opportunities, and specialization during this critical period.
This visualization complements the earlier categorical analysis (Figure 3) by showing how salary scales more granularly with actual years of experience, providing actionable insight for career planning and expectation setting.
Figure 8.
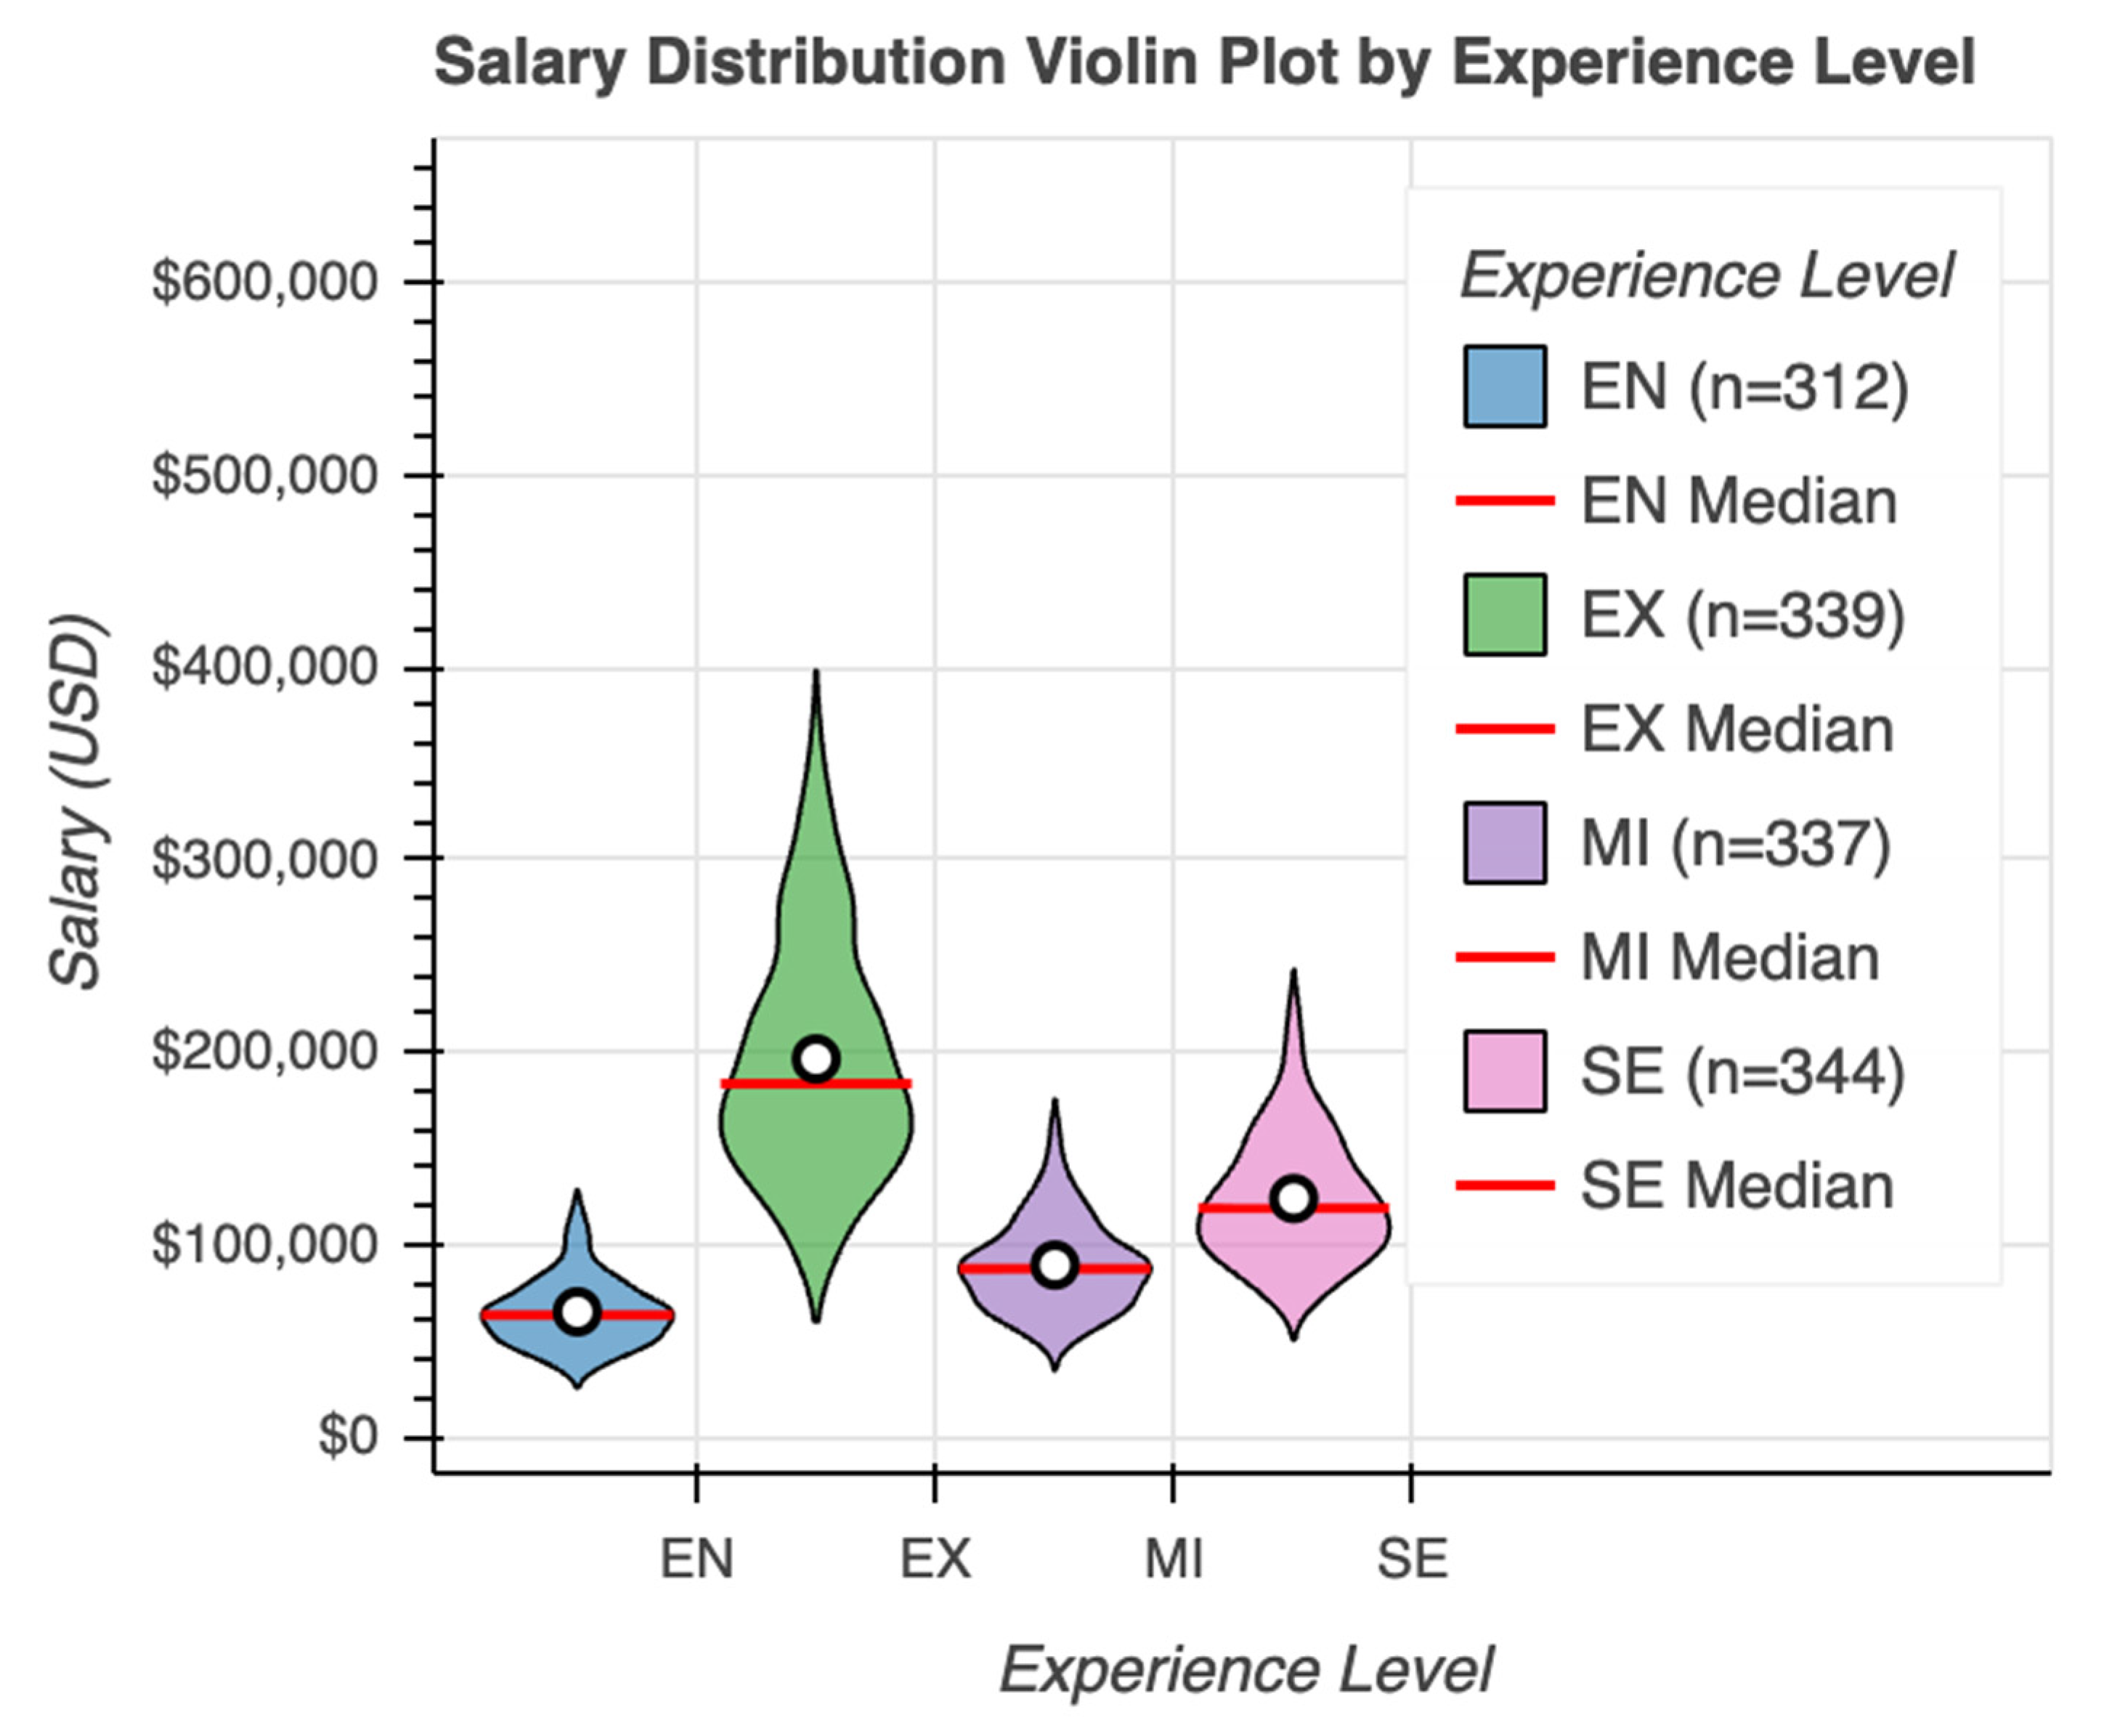
This violin plot shows the full distribution of salaries (in USD) across the four experience levels in the AI job market: Entry (EN, n=312), Mid (MI, n=337), Senior (SE, n=344), and Executive (EX, n=339). Each violin represents the probability density of salaries — wider sections indicate where salaries are more concentrated. White circles mark the median salary for each level, and red lines show the median range.
Entry-level (EN) salaries are tightly clustered at the lower end, with a median around $60,000–65,000 and very few postings exceeding $150,000. The narrow violin indicates limited salary variability.
Mid-level (MI) shows a wider spread, with the bulk of salaries between ~$70,000–$130,000 and a median near $85,000–90,000. A small tail extends toward higher values.
Senior-level (SE) has the widest and tallest violin among mid-to-high ranges, with a clear concentration around $110,000–$140,000 and a median close to $120,000. The distribution is noticeably right-skewed, with a long upper tail reaching well above $200,000.
Executive-level (EX) exhibits the highest median (around $180,000–$200,000) and the most dramatic spread — the violin is tall and wide in the $150,000–$400,000 range, with a prominent peak near $200,000 and an extended upper tail reaching toward $400,000+ in some cases.
The violin plot provides a richer view than bar charts alone by revealing not just average/median salaries but also the shape, spread, and skewness of compensation at each career stage. It confirms that:
Entry-level roles have the most predictable (and lowest) pay with little room for outliers.
Salary variability increases significantly with experience — especially at senior and executive levels — where top performers can command substantially higher compensation.
Executive roles show the greatest potential upside (long right tail), reflecting high-stakes leadership positions, equity packages, or bonuses in some postings.
The medians align closely with previously reported means (EN ≈ $63k, MI ≈ $88k, SE ≈ $122k, EX ≈ $188k), but the violins highlight that senior and executive distributions are right-skewed, meaning a minority of high earners pull the average above the median.
This visualization strengthens the study’s core message: experience not only raises the typical salary but also dramatically increases the range of possible earnings, particularly at senior and executive levels. For job seekers, it visually communicates both the strong upward trajectory and the growing opportunity for exceptional compensation as one advances in the AI field.
The plot complements earlier figures (e.g., Figure 3 bar chart of averages and Figure 7 line graph of growth) by showing the underlying distribution and variability, helping readers understand why targeting senior/executive roles — and building deep expertise — offers the greatest long-term financial reward in the global AI job market.
Results and Visual Analysis
The analysis reveals a strong positive relationship between experience and salary, with substantial increases observed at senior and executive levels. Mean salaries: Entry ($63,133), Mid ($87,955), Senior ($122,188), Executive ($187,724). A strong positive correlation (r=0.738) exists between years of experience and salary.
Geographic comparisons show that countries with mature technology ecosystems—such as Switzerland, Denmark, Norway, and the United States—consistently offer higher compensation, consistent with the notion that regions with strong tech ecosystems offer higher compensation (Adler & Florida, 2021).
Remote and hybrid work arrangements account for a significant proportion of AI job postings, reflecting post-pandemic shifts in work models. Remote work distribution: 33.8% office-based, 33.4% hybrid, 32.8% fully remote. Remote and hybrid jobs offer slightly higher average salaries, supporting the trend toward flexible work models accelerated by AI tools (Dingel, 2020).
Industry-level analysis indicates that technology, consulting, automotive, retail, and media sectors are among the largest employers of AI professionals. Sectors with higher AI adoption tend to offer both higher salaries and stronger growth prospects (Bughin et al., 2017).
Discussion
The findings confirm patterns reported in earlier studies on technology-driven labor markets, particularly the importance of experience and location in determining salary outcomes. The growing prevalence of remote work aligns with recent literature emphasizing digital collaboration tools and global talent sourcing (Akon et al., 2025).
From a methodological perspective, visual analytics proves effective in revealing multidimensional relationships that are difficult to capture through tabular analysis alone. By supporting comparison, trend detection, and pattern recognition, visualization enhances both analytical depth and practical usability. The results align with recent studies indicating that AI adoption can both displace and create jobs, emphasizing the need for strategic career planning (Frank et al., 2019).
Implications
For job seekers, the results highlight the importance of strategic skill development, targeting high-paying regions, building experience, and considering remote opportunities. For universities, the findings support aligning AI curricula with industry needs, balancing technical competencies with problem-solving and communication skills (Deming, 2017). For policymakers, the study underscores the value of investing in AI education, reskilling programs, and digital infrastructure to remain competitive in the global AI economy, while mitigating automation risks (Bessen, 2019).
Limitations
The dataset may not fully represent all countries or organizations, and salary figures are based on reported values. The analysis is cross-sectional and does not capture long-term trends or firm-level AI adoption dynamics. Additionally, the study does not capture longitudinal trends or firm-level AI integration effects.
Future Work
Future research may incorporate time-series data to analyze longitudinal salary trends, develop predictive models for salary estimation, and examine the impact of specific technical skills on compensation. Comparative studies across regions and industries would further enrich understanding of global AI labor dynamics. Longitudinal studies on AI adoption and job growth are also recommended (Hossain et al., 2024).
Conclusion
This study demonstrates how visual analytics can be used to systematically explore the global AI job market. By revealing relationships among salary, experience, location, industry, and work arrangement, the research provides actionable insights for job seekers, educators, and policymakers navigating an increasingly AI-driven labor market.
Supplementary Materials
The following supporting information can be downloaded at the website of this paper posted on Preprints.org.
References
- LinkedIn Economic Graph (2023).
- World Economic Forum (2023).
- Kaggle Survey (2022).
- Tufte, E. (2001). The Visual Display of Quantitative Information.
- Gruetzemacher, R.; Whittlestone, J. The transformative potential of artificial intelligence. Futures 2022, 135, 102884. [Google Scholar] [CrossRef]
- Gaso, M. S., Mekuria, R. R., Deybasso, H. A., Cankurt, S., & Shambetova, B. (2025). The power of data visualization in understanding esophageal cancer based on risk factors: A case from Arsi zone, Ethiopia. Proceedings of the International Conference on Computer Systems and Technologies (CompSysTech), 1–9.
- Dwivedi, Y. K.; et al. Artificial Intelligence (AI): Multidisciplinary perspectives on emerging challenges, opportunities, and agenda for research, practice and policy. International Journal of Information Management 2021, 57, 101994. [Google Scholar] [CrossRef]
- Frank, M. R.; et al. Toward understanding the impact of artificial intelligence on labor. Proceedings of the National Academy of Sciences 2019, 116, 6531–6539. [Google Scholar] [CrossRef] [PubMed]
- Bessen, J. Automation and jobs: When technology boosts employment. Economic Policy 2019, 34, 589–626. [Google Scholar] [CrossRef]
- Acemoglu, D.; Autor, D. Skills, tasks and technologies: Implications for employment and earnings. Handbook of Labor Economics 2011, 4, 1043–1171. [Google Scholar]
- Autor, D. H. Why are there still so many jobs? The history and future of workplace automation. Journal of Economic Perspectives 2015, 29, 3–30. [Google Scholar] [CrossRef]
- Adler, P.; Florida, R. The rise of urban tech: how innovations for cities come from cities. Regional Studies 2021, 55, 1787–1800. [Google Scholar] [CrossRef]
- Dingel, J.I. How many jobs can be done at home? Journal of Public Economics 2020, 189, 104235. [Google Scholar] [CrossRef] [PubMed]
- Akon, T.; Hossain, S.; Akter, F. (2025). Harnessing social media trends as a catalyst for small business growth.
- Deming, D.J. The growing importance of social skills in the labor market. Quarterly Journal of Economics 2017, 132, 1593–1640. [Google Scholar] [CrossRef]
- Bughin, J., et al. (2017). Artificial intelligence the next digital frontier. McKinsey Global Institute.
- Manyika, J., et al. (2017). A future that works: AI, automation, employment, and productivity. McKinsey Global Institute.
- Hossain, S.; et al. Trends in global electric vehicle adoption analyzing regional sales and stock dynamics. International Journal of Multicultural and Multireligious Understanding 2024, 11, 275–298. [Google Scholar] [CrossRef]
- Few, S. (2012). Show Me the Numbers.
- Ware, C. (2013). Information Visualization.
Disclaimer/Publisher’s Note: The statements, opinions and data contained in all publications are solely those of the individual author(s) and contributor(s) and not of MDPI and/or the editor(s). MDPI and/or the editor(s) disclaim responsibility for any injury to people or property resulting from any ideas, methods, instructions or products referred to in the content. |
© 2026 by the authors. Licensee MDPI, Basel, Switzerland. This article is an open access article distributed under the terms and conditions of the Creative Commons Attribution (CC BY) license (http://creativecommons.org/licenses/by/4.0/).
Copyright: This open access article is published under a Creative Commons CC BY 4.0 license, which permit the free download, distribution, and reuse, provided that the author and preprint are cited in any reuse.


