Submitted:
14 January 2026
Posted:
15 January 2026
You are already at the latest version
Abstract
This study develops a spatio-temporal forecasting artifact for road traffic accidents in Ecuador, addressing a critical limitation in existing predictive approaches that rely predominantly on point error metrics without validating the statistical assumptions underlying forecast uncertainty. Motivated by pronounced territorial heterogeneity in accident incidence and the need for reliable decision-support tools, the research proposes a multiregional modeling framework that integrates statistical residual validation to enhance the robustness of road safety planning. Using a dataset of 27{,}648 monthly observations covering all 24 provinces from 2014 to 2025, the study applies the Prophet model within a Design Science Research paradigm and a CRISP-DM implementation cycle. Separate provincial models are estimated with a 24-month forecasting horizon, and methodological rigor is ensured through systematic residual diagnostics using the Shapiro--Wilk test for normality and the Ljung--Box test for temporal independence. Empirical results indicate that the Prophet-based artifact outperforms a naïve seasonal benchmark in 70.8\% of the provinces, demonstrating excellent predictive accuracy in structurally stable regions such as Tungurahua (MAPE = 10.9\%). At the same time, the framework enables the identification of critical emerging risks in provinces such as Santo Domingo and Cotopaxi, where projected increases exceed 49\% despite acceptable point forecasts. The findings confirm that point accuracy alone does not guarantee the validity of confidence intervals and that residual validation is essential for trustworthy uncertainty quantification. Overall, the proposed approach provides a robust foundation for a predictive surveillance system capable of supporting differentiated, evidence-based road safety policies in territorially heterogeneous contexts.
Keywords:
traffic accident forecasting
; Prophet model
; spatio-temporal analysis
; residual validation
; road safety policy
1. Introduction
Road traffic accidents represent one of the most persistent challenges for contemporary public health, manifesting as a phenomenon characterized by high temporal variability, nonlinear behavior, and profound spatial heterogeneity. At the global scale, traffic accidents continue to rank among the leading causes of mortality and disability, generating substantial socioeconomic impacts associated with productivity losses, pressure on healthcare systems, and long-term indirect costs [1]. This problem is particularly acute in middle-income countries, where accelerated urbanization processes, rapid expansion of vehicle fleets, and uneven development of road infrastructure give rise to highly asymmetric risk dynamics [2,3].
From an analytical perspective, road traffic accidents have been extensively studied using time-series models, which allow the identification of underlying trends, seasonality, and cyclical patterns in historical data. In the field of road safety, classical approaches such as ARIMA and SARIMA have been widely applied for accident forecasting, particularly in contexts with relatively stable temporal structures [4,5]. However, recent evidence indicates that these models face significant limitations when confronted with series characterized by abrupt structural changes, heteroskedasticity, and complex dynamic regimes—conditions that are frequently observed in regional and subnational traffic accident data [6,7].
Within this context, the availability of robust predictive tools has become strategically important for the formulation and evaluation of road safety public policies. Forecasting models not only enable anticipation of future accident trends but also constitute a critical input for efficient resource allocation, the design of targeted interventions, and the early identification of emerging risks [8]. Nevertheless, for these models to be genuinely useful in decision-making processes, they must provide not only accurate point forecasts but also a reliable characterization of the uncertainty associated with their predictions.
Despite methodological advances, a relevant gap persists in the recent literature regarding the rigorous statistical validation of predictive models applied to road traffic accidents. In particular, many studies focus primarily on aggregate error metrics, such as MAPE or RMSE, while neglecting the formal evaluation of statistical assumptions underlying model residuals [9,10]. The absence of normality and temporal independence tests—such as Shapiro–Wilk and Ljung–Box—limits the interpretation of model robustness and undermines the reliability of prediction intervals, especially in highly volatile or low-count time series [11,12].
In response to these limitations, recent literature has shown growing interest in flexible additive models, among which Prophet has emerged as a prominent approach. Originally proposed for the analysis of time series with multiple changepoints, complex seasonality, and nonlinear structures, Prophet offers a powerful alternative to traditional linear models [13]. Recent applications of Prophet in transportation and road safety contexts have reported substantial improvements in predictive performance compared with classical approaches, particularly in urban and regional settings [14,15,16]. Nevertheless, even within this body of work, residual validation and empirical calibration of confidence intervals are often treated marginally or omitted altogether.
From a theoretical and methodological standpoint, the present study is grounded in the Design Science Research (DSR) paradigm, which emphasizes the development of analytical artifacts aimed at solving real-world problems through a balance between practical relevance and scientific rigor [17,18]. Within this framework, the integration of the CRISP-DM methodology provides a systematic structure for the predictive modeling lifecycle, encompassing data understanding and preparation, modeling, evaluation, and result communication, thereby ensuring reproducibility and analytical traceability [19].
The empirical context of this research is particularly challenging. In Ecuador, the registration of more than 260,000 traffic accidents between 2014 and 2025 reveals extreme territorial disparity: highly urbanized provinces such as Guayas and Pichincha account for more than 60% of national accidents, while Amazonian and insular regions exhibit marginal incidence levels. This spatial heterogeneity suggests the coexistence of multiple risk regimes, reinforcing the need for multiregional approaches capable of capturing localized dynamics and avoiding conclusions based on national averages that obscure critical patterns.
Against this backdrop, the central research question guiding this study is as follows: how can a multiregional Prophet-based model, integrated with rigorous statistical residual validation and explicit uncertainty assessment, improve the reliability of spatio-temporal traffic accident forecasts and strengthen decision support for road safety public policies? Addressing this question not only contributes to methodological advancement in the application of artificial intelligence to road safety but also provides a solid empirical foundation for the design of differentiated interventions in contexts characterized by pronounced spatial and temporal heterogeneity.
2. Background
Road traffic accidents constitute one of the most critical socio-economic burdens for modern health and transportation systems, with direct consequences for mortality, morbidity, labor productivity, and public expenditure on emergency response and rehabilitation [20,21]. From a public health perspective, road traffic injuries represent a complex and persistent phenomenon, characterized by nonlinear dynamics, high temporal variability, and pronounced spatial heterogeneity, particularly in middle-income countries where urbanization and motorization processes evolve unevenly across territories [22,23].
In the Ecuadorian context, this problem exhibits a distinctly structural dimension. The analysis of more than 260,000 traffic accidents recorded between 2014 and 2025 reveals an extreme territorial disparity: highly urbanized provinces such as Guayas and Pichincha jointly concentrate over 170,000 incidents, whereas Amazonian and insular regions display marginal counts [24]. This empirical asymmetry confirms that road risk cannot be interpreted as a homogeneous national phenomenon, but rather as the outcome of localized interactions among population density, road infrastructure, logistical intensity, and urban–regional mobility patterns [25,26]. Consequently, policy frameworks based on national averages tend to obscure critical hotspots and underestimate emerging risks in specific provinces.
Recent literature has addressed this complexity through the application of time-series forecasting models for traffic accident prediction, with classical approaches such as SARIMA and more flexible additive decomposition models being widely adopted [27,28]. Studies published between 2020 and 2025 indicate that SARIMA models can effectively capture stable seasonal patterns in low-volatility contexts, yet they exhibit significant limitations when confronted with structural breaks, abrupt trend changes, and low-count series [29,30]. In response to these constraints, the Prophet model has gained increasing attention in road safety applications due to its ability to model nonlinear trends, multiple changepoints, and flexible seasonality in a computationally efficient and interpretable framework [31,32].
Several recent studies have successfully applied Prophet to forecast traffic accidents at urban or regional scales, reporting improved predictive accuracy relative to traditional time-series models [33,34,35]. Nevertheless, the majority of these applications remain focused on point forecast accuracy, relying primarily on metrics such as MAPE or RMSE, while largely neglecting systematic validation of the underlying statistical assumptions [36,37]. In particular, residual diagnostics—including normality and autocorrelation tests—are frequently omitted, despite their relevance for ensuring statistical robustness, interpretability, and the reliability of prediction intervals [38].
Moreover, a substantial gap persists in the empirical calibration and evaluation of forecast uncertainty, especially in highly volatile or low-count series such as those observed in peripheral or Amazonian provinces [39]. The absence of coverage analysis for confidence intervals may lead to systematic underestimation of uncertainty, thereby compromising the usefulness of forecasting models for public policy decision-making, where risk management is as critical as point accuracy [40,41].
Collectively, this body of evidence highlights a critical research gap in the development of multiregional traffic accident forecasting frameworks that explicitly integrate spatial heterogeneity, rigorous uncertainty quantification, and formal statistical residual validation under the Prophet model. This limitation is particularly consequential in contexts such as Ecuador, where pronounced territorial divergence in road risk necessitates predictive tools capable of supporting differentiated, adaptive, and evidence-based road safety policies. Addressing this gap, the present study proposes a spatio-temporal forecasting artifact based on Prophet, complemented by systematic residual validation and empirical uncertainty assessment, with the aim of enhancing both analytical robustness and policy relevance in road safety planning.
3. Methodology
This study follows the Design Science Research (DSR) paradigm, which is particularly suitable for the development and validation of predictive artifacts intended to address real-world problems through rigorously evaluated computational models. In accordance with the DSR framework, the methodology is structured into three interrelated phases: (i) the Relevance Phase, which defines the problem context and theoretical grounding; (ii) the Design Phase, which details the construction of the predictive artifact through a structured data science workflow; and (iii) the Rigor Phase, which ensures methodological robustness through statistical validation and uncertainty assessment (see Figure 1).
3.1. Relevance Phase and PRISMA-Based Literature Review (2020–2025)
3.1.1. Problem Identification
Road traffic accidents constitute a major public health and socio-economic challenge in Ecuador, exhibiting pronounced spatial and temporal heterogeneity. Historical evidence indicates that a small subset of provinces—most notably Guayas and Pichincha—concentrate more than 60% of recorded incidents, while other territories display markedly lower exposure levels. This asymmetric distribution highlights structural inequalities in mobility demand, infrastructure complexity, and enforcement capacity, rendering uniform national road safety policies insufficient.
Furthermore, recent trends reveal the emergence of new risk hotspots, such as Santo Domingo and Cotopaxi, where projected accident incidence exhibits sustained or accelerating growth. These dynamics underscore the need for anticipatory, data-driven tools capable of identifying emerging risks and supporting evidence-based planning at the provincial level.
3.1.2. Proposed Solution
To address this challenge, the study proposes the development of a multiregional spatio-temporal forecasting artifact based on the Prophet time series model. The artifact is designed to:
- Capture long-term trends and structural changes in provincial accident series;
- Quantify forecast uncertainty through probabilistic confidence intervals;
- Enable comparative risk assessment across provinces; and
- Support proactive road safety policy formulation and resource allocation.
3.1.3. Systematic Literature Review (PRISMA)
A systematic literature review was conducted following the PRISMA methodology to establish the theoretical and methodological foundation of the proposed artifact. The review focused on peer-reviewed studies published between 2020 and 2025 and adhered to the following stages:
- Identification: Searches were conducted in Scopus, Web of Science, IEEE Xplore, and Google Scholar using combinations of the keywords “Prophet”, “time series forecasting”, “traffic accident prediction”, “road safety modeling”, and “spatio-temporal analysis”.
- Screening: Duplicates were removed, and titles and abstracts were screened to exclude studies unrelated to traffic safety, forecasting, or predictive modeling.
- Eligibility: Full-text articles were assessed based on methodological rigor, use of time-series or machine learning approaches, and relevance to accident prediction or mobility risk analysis.
- Inclusion: Only studies presenting validated forecasting models or empirical evaluations of accident dynamics were retained for synthesis.
The review revealed a growing interest in hybrid and interpretable forecasting approaches but also identified a gap in multiregional, uncertainty-aware applications of Prophet for traffic accident prediction, thereby reinforcing the relevance of the proposed research.
3.2. Design Phase: Prophet Implementation through CRISP-DM
The construction of the predictive artifact follows the CRISP-DM methodology, ensuring a systematic, transparent, and reproducible data science workflow aligned with the Design Science Research paradigm.
- Data Understanding and Preparation: Historical traffic accident records were aggregated at a monthly frequency for each of Ecuador’s 24 provinces, yielding a balanced panel of 27,648 observations spanning January 2014 to December 2025. Data preprocessing included consistency checks, handling of missing observations, temporal alignment, and the identification of extreme values. Given the count-based nature of the data, no transformations were applied that could distort interpretability.
- Exploratory Data Analysis (EDA): Exploratory analyses were conducted to identify long-term trends, abrupt structural breaks, and interprovincial heterogeneity. Visualization of historical trajectories confirmed the strong concentration of accidents in metropolitan provinces and revealed multiple regime changes associated with exogenous shocks (e.g., 2020 mobility restrictions).
-
Feature Derivation and Model Structure: Prophet models the observed time series using an additive decomposition:where represents the non-linear trend component, captures seasonal effects, accounts for the impact of irregular events or structural changes, and denotes the residual error term.The trend component is specified as a piecewise linear function with automatic changepoint detection:where k is the initial growth rate, m the offset, an indicator vector for changepoints, and and represent adjustments to the slope and intercept, respectively.Seasonal effects are modeled using a truncated Fourier series:where P denotes the seasonal period (annual seasonality for monthly data) and N controls seasonal flexibility.
- Predictive Modeling: A separate Prophet model was calibrated for each province to preserve local temporal dynamics. The forecasting horizon was set to 24 months. Changepoint prior scales were adjusted in provinces exhibiting high volatility or abrupt regime shifts to prevent overfitting while retaining sensitivity to structural changes.
-
Model Evaluation: Forecast accuracy was evaluated using two complementary metrics. The Mean Absolute Percentage Error (MAPE) was computed as:where denotes the observed value and the forecasted value at time t.To benchmark performance against a naïve seasonal model, the Mean Absolute Scaled Error (MASE) was calculated as:where m represents the seasonal period. Values of indicate superior performance relative to the benchmark.
- Visualization: Province-level diagnostic dashboards were generated, integrating historical observations, decomposed components (, , and residuals), and forecast trajectories with uncertainty intervals. Additionally, spatio-temporal heatmaps were produced to visualize forecasted accident intensity across provinces and to identify emerging risk clusters over the prediction horizon.
3.3. Rigor Phase: Statistical Validation and Residual Analysis
To ensure methodological rigor and statistical transparency, the predictive artifact underwent an extensive validation process focused on residual behavior and uncertainty calibration. This phase evaluates whether the underlying assumptions of the Prophet models are satisfied and whether forecast uncertainty is appropriately quantified.
- Residual Normality: The normality of model residuals was assessed using the Shapiro–Wilk test, which is particularly suitable for moderate sample sizes and sensitive to deviations caused by skewness or heavy tails. For a set of residuals sorted in ascending order, the test statistic is defined as:where denotes the i-th order statistic, is the sample mean of the residuals, and the coefficients are derived from the expected values and covariance matrix of order statistics from a normal distribution. A low p-value indicates a rejection of the normality assumption, often observed in provinces with sparse counts or extreme events.
- Residual Independence: Temporal independence of residuals was evaluated using the Ljung–Box test, which assesses whether a group of autocorrelations differs significantly from zero. The test statistic is given by:where n is the number of observations, h is the number of lags considered, and is the sample autocorrelation at lag k. Under the null hypothesis of no serial correlation, Q follows a distribution with h degrees of freedom. Failure to reject the null hypothesis indicates that the model has adequately captured the temporal dependence structure of the series.
- Uncertainty Calibration: The calibration of forecast uncertainty was evaluated by computing the empirical coverage of the nominal 95% confidence intervals. For each province, coverage was defined as:where is the observed value at time t, denotes the lower and upper bounds of the 95% predictive interval, and is the indicator function. Coverage values below the nominal level indicate underestimation of uncertainty, whereas values substantially above 95% suggest overly conservative intervals.
Overall, this rigor phase ensures that the proposed predictive artifact not only achieves acceptable point forecast accuracy but also satisfies key statistical assumptions and provides reliable uncertainty quantification, thereby strengthening its suitability for policy-oriented decision support in road safety planning.
This rigor phase ensures that the proposed artifact is not only predictive but also statistically reliable and transparent, fulfilling the dual requirements of relevance and rigor central to the Design Science Research paradigm.
4. Results
4.1. Dataset Description and Scope of Analysis
Table 1 presents a descriptive summary of the main characteristics of the dataset used in this study. The database consists of 27,648 monthly observations corresponding to 24 provinces, ensuring complete national territorial coverage. The analysis period spans from January 2014 to December 2025, allowing the identification of long-term trends as well as structural changes in road traffic accident dynamics.
The monthly temporal resolution provides an adequate level of detail for time-series modeling and interprovincial comparison. In aggregate terms, the dataset includes more than 260,000 historical traffic accidents, highlighting the robustness and empirical relevance of the information. Finally, a 24-month forecasting horizon is defined, consistent with medium-term planning needs and the evaluation of road safety policies.
Overall, these characteristics confirm that the dataset constitutes a solid, homogeneous, and statistically sufficient basis for spatial–temporal analysis and for the application of multiregional predictive models.
4.2. Historical Distribution and Temporal Trends of Traffic Accidents by Province
The historical distribution of traffic accidents in Ecuador reveals profound spatial disparities. As summarized in Table 2, a marked territorial concentration is evident, with Guayas and Pichincha provinces dominating the national profile, jointly accounting for over 60
A secondary tier, comprising Manabí, Azuay, and Tungurahua, exhibits moderate but persistent accident volumes. Although substantially lower than the primary centers, their sustained monthly averages indicate entrenched risk regimes, likely associated with regional urban hubs and strategic transport corridors.
In stark contrast, Table 3 presents provinces with minimal historical counts, including Galápagos, Sucumbíos, Pastaza, Napo, and Orellana. These regions are characterized by low population density, limited road infrastructure, and reduced traffic flow, resulting in structurally distinct, low-exposure accident regimes.
This pronounced spatial heterogeneity underscores the necessity for territorially differentiated modeling and targeted policy interventions, as uniform national strategies are ill-suited to address such diverse provincial risk profiles.
Province-Level Temporal Analysis
A detailed time-series analysis (2014–2027) for each province reveals diverse trajectories, seasonality patterns, and forecasted risks. Key illustrative cases are summarized below, with their corresponding diagnostic dashboards.
Azuay exhibits a sustained downward trend with significant structural breaks coinciding with systemic mobility shocks (e.g., early 2020). The trend-cycle component dominates, while seasonality is negligible. Residuals show no significant autocorrelation (Ljung–Box ), but depart from normality (Shapiro–Wilk ), indicative of extreme observations. The 24-month forecast suggests a transition to a high-uncertainty regime with widening confidence intervals (Figure 2).
Bolívar demonstrates a clear secular decline, characterized by a sharp drop during 2020–2021 and subsequent stabilization. A robust seasonal pattern is present. The model is statistically valid (Ljung–Box ), and the forecast indicates monthly fluctuations between 7.5 and 10 cases, with seasonal peaks potentially exceeding 15 (Figure 3).
Cañar shows a pronounced and sustained decline from over 30 to below 5 monthly accidents. A recurring seasonal pattern is evident. The model demonstrates strong diagnostic accuracy (Shapiro–Wilk ; Ljung–Box ). The forecast points to technical stabilization near zero, though confidence intervals allow for isolated peaks (Figure 4).
Carchi presents a volatile negative trend. The Ljung–Box test () suggests some temporal patterns remain uncaptured, likely due to sharp fluctuations between 2018–2020. The forecast nonetheless indicates a convergence toward zero accidents by late 2026 (Figure 5).
Cotopaxi displays complex dynamics: a sharp initial decline, a period of historic lows (2018–2022), and an atypical volatile rebound from 2024. Persistent seasonality is present. While residuals are independent (Ljung–Box ), significant non-normality () reflects extreme variations. The forecast projects unstable stabilization at elevated levels (35–50 monthly accidents) with high uncertainty (Figure 6).
Guayas, the highest-volume province, shows a structural downward trend from over 800 to approximately 430 monthly accidents. The model demonstrates strong diagnostic validity (Shapiro ; Ljung–Box ). The forecast suggests a continued decline to between 350 and 500 monthly accidents (Figure 7).
Imbabura underwent a dramatic shift post-2018, falling from over 120 to a plateau near 30 monthly accidents, with minimal seasonality. Model diagnostics are solid (Shapiro ; Ljung–Box ). The forecast indicates a trend toward the technical eradication of accidents (Figure 8).
Morona Santiago presents a downward trend with a notable recovery from a 2022 minimum. It features highly marked seasonality and exceptional model validity (Shapiro ; Ljung–Box ). The forecast projects an increase to between 6 and 13 monthly accidents (Figure 9).
Pichincha, the other major center, evidences a massive structural reduction from over 1,200 to roughly 300 monthly accidents. The model struggles with residual independence (Ljung–Box ), suggesting uncaptured temporal patterns. The forecast projects stable fluctuations between 250 and 400 monthly accidents (Figure 10).
Santo Domingo exhibits a unique and concerning trajectory: after a peak near 100 accidents in 2019 and a recent decline to 70, its 24-month forecast predicts an atypical sharp increase to 120–140 monthly accidents, representing a critical alert for road safety planning (Figure 11).
Tungurahua shows a predominant downward trend from over 140 to about 70 monthly accidents, with very low-amplitude seasonality. The forecast for 2026–2027 indicates a phase of high volatility, with potential drastic oscillations between 10 and 80 monthly accidents (Figure 12).
Analyses for the remaining provinces (Chimborazo, El Oro, Esmeraldas, Galápagos, Loja, Los Ríos, Manabí, Napo, Orellana, Pastaza, Santa Elena, Sucumbíos, Zamora Chinchipe) consistently reveal overarching downward secular trends, albeit with varying degrees of seasonal strength, structural breaks, and forecast uncertainty. A common finding across provinces is the negligible seasonality and trend dominance in most cases, alongside frequent deviations from residual normality due to discrete counts and extreme events. Collectively, these results affirm the critical need for province-specific monitoring frameworks, as national aggregates mask highly divergent and evolving local risk landscapes.
4.3. Spatial Distribution of Traffic Accidents by Province and Cause
The heatmap shown in Figure 13 reveals a highly asymmetric concentration of road traffic accidents in Ecuador’s primary metropolitan nodes. A marked disparity is observed between highly urbanized provinces and the rest of the national territory, with Guayas (37,342 incidents) and Pichincha (34,762 incidents) exhibiting accident counts that exceed those of other provinces by several orders of magnitude, particularly in the category of vehicle-to-vehicle collisions. This pattern indicates that accident frequency is not solely a function of population size, but is closely associated with the complexity of road infrastructure, the density of the vehicle fleet, and the intensity of urban mobility flows.
A clearly defined spatial gradient is also evident, characterized by a substantial reduction in accident incidence in the Amazonian provinces (Napo, Pastaza, and Sucumbíos) and in the insular region (Galápagos). This behavior reinforces the existence of a structural relationship between economic activity, logistics dynamics, and road traffic risk, whereby territories with lower integration into national production and transport corridors exhibit significantly lower levels of exposure to traffic-related hazards.
From a causal perspective, the predominance of vehicle collisions emerges as the principal risk factor at the national scale. In public health terms, this evidence points to systemic shortcomings in traffic management, as well as deficiencies in compliance with basic driving regulations, including speed limits and safe following distances. In parallel, pedestrian vulnerability represents a critical concern, with particularly high numbers of pedestrian crashes recorded in Guayas (19,874) and Pichincha (15,870). This finding suggests that, in major urban centers, transport planning has historically prioritized vehicular flow over pedestrian safety and active mobility, thereby increasing the exposure of the most vulnerable road users.
Additionally, the notably high incidence of loss-of-control crashes in Guayas (10,862 incidents), nearly double that observed in Pichincha (6,101), warrants special attention. This disparity points to the possible influence of context-specific factors, such as adverse climatic conditions, road geometry, or pavement quality, and justifies targeted investigations into the environmental and mechanical determinants prevalent in coastal regions.
Finally, for an appropriate comparative interpretation of these results, additional methodological considerations are required. Although Guayas and Pichincha concentrate the highest absolute numbers of accidents, the computation of normalized accident rates (e.g., per 100,000 inhabitants or per registered vehicle) would allow an assessment of whether less populous provinces exhibit higher relative road risk. In this context, Galápagos, with marginal counts of up to 29 incidents, serves as a natural control case, demonstrating that strict access control policies, low speed limits, and effective management of vehicular demand can substantially mitigate road traffic accidents.
4.4. Predictive Performance of the Prophet Model
Table 4 summarizes the provinces exhibiting the lowest Mean Absolute Percentage Error (MAPE) values, corresponding to the best-performing cases of the Prophet forecasting model. In these provinces, the model delivers stable, accurate, and robust predictions, reflecting time series with relatively smooth dynamics, limited volatility, and well-defined trend components.
In particular, Tungurahua achieves an excellent predictive performance (MAPE = 10.9%), followed by Zamora Chinchipe (15.0%), which also demonstrates very high forecast reliability. Provinces such as Chimborazo, Santa Elena, and Pichincha exhibit good predictive quality, with MAPE values below 22%, indicating that the Prophet model effectively captures their underlying temporal structure despite moderate fluctuations.
In contrast, Table 5 reports the provinces with substantially higher prediction errors, where the Prophet model exhibits reduced forecasting accuracy. These time series are characterized by pronounced variability, abrupt structural breaks, irregular patterns, or low signal-to-noise ratios, all of which hinder the model’s ability to identify stable trend and seasonal components.
Notably, Esmeraldas presents an extremely high MAPE value (118.8%), indicating severe instability and poor forecast reliability. Similarly, Azuay and Carchi display high levels of uncertainty and volatility, while Pastaza and Loja exhibit weak signals and shifting trends that challenge predictive modeling.
Overall, these results demonstrate that the predictive accuracy of the Prophet model is markedly heterogeneous across provinces and depends critically on the structural stability and statistical properties of the underlying time series. While Prophet performs well in regions with smooth trends and limited regime changes, its effectiveness diminishes in contexts characterized by abrupt disruptions, sparse observations, or irregular dynamics. This finding underscores the importance of province-specific model diagnostics and, where necessary, the integration of alternative or hybrid forecasting approaches for highly volatile regions (see Figure 14).
4.5. Confidence Interval Coverage Analysis
The empirical evaluation of the nominal 95% confidence intervals reveals pronounced heterogeneity in uncertainty calibration across provinces. Several provinces—including Tungurahua, Chimborazo, Pichincha, and Santa Elena—exhibit adequate coverage levels (), indicating that the Prophet model provides well-calibrated and reliable interval forecasts in settings characterized by relatively stable temporal dynamics. In some cases, empirical coverage slightly exceeds the nominal level, reflecting conservative interval estimation that prioritizes robustness over sharpness.
In contrast, provinces such as Azuay, Loja, Los Ríos, and Esmeraldas display systematic undercoverage, suggesting an underestimation of forecast uncertainty likely associated with high volatility, structural breaks, or non-stationary behavior. Conversely, Carchi, Cotopaxi, and Galápagos present overcoverage, implying excessively wide confidence intervals that reduce forecast precision. Overall, these results highlight the importance of province-specific calibration strategies and enhanced uncertainty modeling in regions with complex or unstable accident dynamics (see Table 6).
4.6. Forecasted Trends and Heterogeneous Risk Classification
The 24-month forecasting horizon reveals pronounced heterogeneity in provincial accident trajectories, enabling a risk-based classification of territories according to their projected dynamics. As summarized in Table 7, several provinces exhibit a sustained downward trend in predicted accident incidence, while others are expected to remain stable or to experience moderate to strong increases, highlighting divergent future road safety risk profiles across the national territory.
Provinces such as Guayas, Pichincha, Manabí, and Azuay are projected to continue along a strongly decreasing trajectory, reflecting the consolidation of recent reductions in accident frequency. In contrast, Santa Elena and Zamora Chinchipe display relatively stable dynamics, with no pronounced directional change over the forecast horizon. Conversely, Loja and Esmeraldas exhibit moderately increasing trends, while Cotopaxi and Santo Domingo emerge as critical cases, characterized by sharply increasing projected incidence levels.
By integrating projected growth rates with forecast variability, priority jurisdictions for targeted intervention can be identified. Table 8 highlights provinces classified as high priority, representing confirmed or emerging risk hotspots where the intensification of preventive road safety measures is most critical. These territories are characterized either by rapid projected growth in accident incidence or by high uncertainty combined with upward trends.
The geographic heterogeneity and temporal evolution of these projected trends are visually synthesized in Figure 15, which illustrates the 24-month forecast trajectories for all provinces. The figure confirms the clustering patterns identified in the classification tables and provides a comprehensive spatiotemporal overview of emerging road safety risks, reinforcing the need for differentiated and anticipatory policy responses.
4.7. Aggregated Forecast Results and Model Performance
The aggregated 24-month forecasts indicate that traffic accident incidence remains strongly concentrated in major population centers, despite the presence of overall declining trends in several provinces. As shown in Table 9, Guayas and Pichincha are projected to account for nearly half of the total forecasted accidents among the ten provinces with the highest expected incidence. This concentration underscores the persistent role of demographic scale, urban density, and transport infrastructure complexity in shaping the absolute burden of road traffic accidents.
Model performance was further evaluated against a naïve seasonal benchmark using the Mean Absolute Scaled Error (MASE). As summarized in Table 10, the Prophet model outperformed the benchmark (MASE < 1) in the majority of provinces (70.8%), indicating its general suitability for capturing temporal patterns in provincial road accident data. This result confirms the model’s capacity to exploit trend and seasonal structures in relatively stable time series.
However, Prophet underperformed the benchmark in four provinces—Azuay, Loja, Cotopaxi, and notably Guayas. These cases are characterized by high volatility, non-stationary behavior, or complex structural disruptions that are not fully captured by the model’s standard components. This selective performance highlights a key limitation of Prophet in highly unstable contexts and suggests that its application should be complemented with contextual analysis, additional covariates, or alternative modeling approaches when forecasting accident dynamics in structurally complex provinces.
4.8. Dominant Causes and Integrated Policy Synthesis
The analysis of primary accident etiologies reveals pronounced spatial heterogeneity in the causal structure of road traffic risk across provinces. As summarized in Table 11, the dominant cause of accidents varies substantially by territory. Vehicle-to-vehicle collisions and pedestrian-related accidents constitute the most frequent and geographically widespread categories, particularly in highly urbanized provinces, indicating systemic challenges in traffic management, enforcement, and urban design.
In contrast, loss-of-control and rollover crashes exhibit a more localized spatial pattern, with elevated prevalence in provinces characterized by complex topography and challenging driving conditions, such as Andean and Amazonian regions. This geographic stratification underscores the inadequacy of uniform national road safety policies and highlights the need for regionally tailored intervention strategies that explicitly account for local infrastructural, environmental, and mobility characteristics.
The complete spatio-temporal structure of forecasted accident incidence is illustrated in Figure 16, which presents a heatmap of the 12-month accident forecasts across all provinces. The visualization confirms the persistent concentration of predicted incidents in high-density and highly motorized regions, while simultaneously revealing marked temporal variability and province-specific seasonal patterns. As such, the heatmap constitutes a valuable operational tool for anticipating monthly fluctuations in demand for emergency response, enforcement resources, and preventive interventions.
To facilitate evidence-based decision making, Table 12 integrates the core findings from historical analysis, forecasting results, and model diagnostics into a unified policy-oriented synthesis. This framework directly links empirical evidence to actionable priorities in road safety planning, enabling the identification of critical burden areas, emerging risk hotspots, and provinces where preventive strategies can consolidate recent gains.
Overall, this integrated synthesis provides a concise yet comprehensive evidence base for prioritizing resource allocation, designing targeted road safety campaigns, and implementing context-specific infrastructure and enforcement improvements across Ecuador’s diverse provincial landscape.
5. Discussion
The findings of this study demonstrate that the Prophet model, integrated within an explicit cycle of statistical rigor, responds affirmatively to the need for territorially differentiated traffic accident forecasts. The systematic incorporation of residual validation tests—specifically the Shapiro–Wilk test for normality and the Ljung–Box test for temporal independence—made it possible to show that a high goodness of fit in terms of point accuracy metrics such as MAPE or MASE does not, by itself, guarantee the reliability of prediction intervals. In provinces with relatively stable dynamics, such as Tungurahua (MAPE = 10.9%) and Zamora Chinchipe, residual validation confirmed an adequate calibration of confidence intervals, whereas in territories characterized by high volatility or weak signals, such as Esmeraldas and Pastaza, systematic underestimation of uncertainty and violations of statistical assumptions were identified. This finding is consistent with recent evidence emphasizing that the usefulness of predictive models for public policy depends not only on accuracy but also on the inferential robustness of their estimates [42,43].
From a comparative perspective, the results obtained are broadly aligned with recent studies that have applied Prophet and SARIMA models to traffic accident forecasting between 2020 and 2025. Prior research has shown that Prophet outperforms SARIMA in scenarios characterized by abrupt regime changes—such as those observed during the COVID-19 pandemic—owing to its ability to model multiple changepoints and nonlinear trends [44,45,46]. In the present study, this advantage is clearly reflected in high-incidence provinces such as Guayas and Pichincha, where post-2020 structural declines were captured more stably than would be expected from traditional autoregressive approaches. However, as also reported by Li et al. [47] and Khan et al. [48], the flexibility of Prophet does not eliminate the intrinsic challenges posed by low-count or highly irregular series, which explains its limited performance in provinces such as Pastaza or Galápagos, where the temporal signal is weak and events are highly discrete.
The implications of these findings for road safety policy are substantial. The identification of emerging risk patterns in provinces such as Santo Domingo and Cotopaxi—characterized by projected upward trends and elevated variability—demonstrates the strategic value of multiregional approaches over nationally aggregated models. While country-level analyses tend to dilute such signals under averages dominated by major urban centers, the provincial approach adopted here enabled the detection of territories where accident incidence may increase significantly in the short term. This result supports recent arguments in the literature advocating for risk-based resource allocation and localized, evidence-driven interventions, particularly in countries with pronounced territorial heterogeneity [49]. From an operational standpoint, multiregional forecasts with robust statistical validation provide a more solid foundation for prioritizing preventive actions, enforcement strategies, and infrastructure investments at the provincial level.
Nevertheless, several limitations of this study must be acknowledged. First, the Prophet model exhibited limited capacity to capture patterns in series with high heteroskedasticity or sparse observations, as evidenced by its poor performance in Esmeraldas (MAPE = 118.8%) and in several Amazonian provinces. This weakness is consistent with previous studies warning that additive models may lose efficiency when variance changes abruptly or when data contain extended periods of zero counts [50,51]. Second, the absence of exogenous variables—such as climatic conditions, road infrastructure quality, freight traffic intensity, or socioeconomic indicators—likely affected predictive accuracy in coastal regions, where environmental and logistical factors play a critical role in accident occurrence, as documented in recent transportation safety research [52,53].
These limitations point to clear directions for future research. One promising avenue involves the development of hybrid models that combine the interpretability and structural flexibility of Prophet with the nonlinear learning capabilities of recurrent neural networks, such as LSTM, particularly for provinces where the seasonal benchmark outperformed the proposed model. In addition, the integration of dynamic covariates—such as weather variables, traffic volume indicators, economic activity metrics, or mobility proxies—could enhance the model’s ability to capture exogenous shocks and reduce uncertainty underestimation in volatile series. Collectively, these extensions would contribute to more resilient and adaptive predictive systems, strengthening the role of advanced analytics and artificial intelligence as key tools for evidence-based road safety policy design.
6. Conclusions
This research fulfills the objective of proposing a multiregional forecasting framework that goes beyond conventional error metrics by integrating a cycle of statistical rigor within the Design Science Research paradigm. The central aim was to develop and evaluate a predictive artifact based on the Prophet model capable of capturing the spatio-temporal dynamics of traffic accidents in Ecuador, while explicitly incorporating residual validation and uncertainty assessment as key elements to strengthen the reliability of decision support for road safety policies.
The results confirm that the Prophet model achieves satisfactory predictive performance in the majority of the analyzed provinces, outperforming the seasonal benchmark in 70.8% of cases. Provinces such as Tungurahua and Zamora Chinchipe exhibit excellent predictive capacity, characterized by low error values and residuals that reasonably satisfy assumptions of independence and stability. In contrast, the rigorous validation process enabled the early identification of contexts in which the model is unreliable, such as Esmeraldas, marked by high volatility and extreme errors, as well as provinces where emerging future risks were detected, notably Santo Domingo and Cotopaxi, whose forecasts indicate upward trajectories that warrant priority attention.
From an interpretative perspective, the main contribution of this study lies in demonstrating that point accuracy—as expressed by metrics such as MAPE or MASE—is not a sufficient condition to ensure the inferential validity of a predictive model. The systematic incorporation of Shapiro–Wilk and Ljung–Box tests revealed that the quality of confidence intervals depends critically on the structural stability of each provincial time series. In this sense, the study addresses a relevant gap in the literature on additive models applied to road safety by showing that the validation of statistical assumptions is not ancillary, but rather an essential component for the correct interpretation of results and for avoiding policy decisions based on deceptively precise estimates.
Nevertheless, the findings must be interpreted in light of certain limitations. The absence of relevant exogenous variables, such as climatic conditions, road infrastructure quality, or traffic intensity, constrains the model’s ability to fully explain the observed variability, particularly in coastal and logistics-intensive regions. Moreover, the additive nature of Prophet exhibits inherent limitations when dealing with low-count series, high heteroscedasticity, or weak signals, thereby reducing its generalizability in Amazonian or highly volatile provinces.
From a practical standpoint, the results provide a solid empirical basis for advancing toward a more efficient and differentiated allocation of road safety resources, replacing aggregated national approaches with risk-based multiregional strategies. The identification of critical and emerging provinces enables the prioritization of preventive interventions, infrastructure planning, and enforcement strategies tailored to local contexts. Future research should explore hybrid modeling approaches that combine the interpretability of Prophet with deep learning techniques, such as Prophet–LSTM architectures, as well as the integration of dynamic covariates to better capture exogenous shocks and reduce uncertainty underestimation in complex environments.
Overall, this study offers a relevant methodological and applied contribution to the field of artificial intelligence in road safety. By integrating spatio-temporal forecasting with rigorous statistical validation, it establishes a robust foundation for the development of a more reliable, transparent, and adaptive national predictive surveillance system, capable of effectively supporting public policy formulation aimed at the sustainable reduction of road traffic accidents.
Author Contributions
investigation, J.S.;Conceptualization, T.L.; methodology, R.V. ; Project administration, W.C. All authors have read and agreed to the published version of the manuscript.
Funding
This research received no external funding.
Data Availability Statement
All data and files related to the predictive models are available and organized in the following Google Drive link: https://drive.google.com/drive/folders/1SJ4POU5GopRllFicNJeel-eF7uAvnRlv?usp=sharing (accessed on 13 January 2026). In this repository, you will be able to access all the necessary information, including datasets, scripts, documentation, and any other relevant resources for the development and analysis of the models
Acknowledgments
We express our sincere gratitude to Wilson Chango, from the Escuela Superior Politécnica de Chimborazo (ESPOCH) and the Pontificia Universidad Católica del Ecuador, Esmeraldas Campus (PUCE Esmeraldas), for his valuable technical assistance and guidance in the development of the predictive models used in this research. This study received institutional support from ESPOCH and PUCE Esmeraldas. Additionally, we acknowledge the facilities and general support provided by the Department of Computer Science at the Escuela Politécnica Nacional (EPN), which significantly contributed to the successful completion of this work.
Conflicts of Interest
The authors declare that they have no conflicts of interest related to this article.
References
- Kaiser, N.; Barstow, C.K. Rural Transportation Infrastructure in Low- and Middle-Income Countries: A Review of Impacts, Implications, and Interventions. Sustainability 2022, Vol. 14 14, 2149. [Google Scholar] [CrossRef]
- Tandrayen-Ragoobur, V. The economic burden of road traffic accidents and injuries: A small island perspective. International Journal of Transportation Science and Technology 2025, 17, 109–119. [Google Scholar] [CrossRef]
- Godthelp, H.; Ksentini, A. Cuestiones específicas de seguridad vial en aviones de bajo nivel d países de ingresos medios (PIMB): una visión general y algunos ejemplos ilustrativos. Investigación sobre seguridad del tráfico 2024, 8, e000068. [Google Scholar] [CrossRef]
- Merz, B.; Kuhlicke, C.; Kunz, M.; Pittore, M.; Babeyko, A.; Bresch, D.N.; Domeisen, D.I.; Feser, F.; Koszalka, I.; Kreibich, H.; et al. Impact Forecasting to Support Emergency Management of Natural Hazards. Reviews of Geophysics 2020, 58, e2020RG000704. [Google Scholar] [CrossRef]
- Pindi, M. Utilizing Predictive Analytics for Real-Time Risk Mitigation and Disaster Recovery in Transportation Management Systems. Journal of Computer Science and Technology Studies 2025, 7, 310–318. [Google Scholar] [CrossRef]
- Feng, M.; Wang, X.; Quddus, M. Developing multivariate time series models to examine the interrelations between police enforcement, traffic violations, and traffic crashes. Analytic Methods in Accident Research 2020, 28, 100139. [Google Scholar] [CrossRef]
- Nassiri, H.; Mohammadpour, S.I.; Dahaghin, M. Forecasting time trend of road traffic crashes in Iran using the macro-scale traffic flow characteristics. Heliyon 2023, 9, e14481. [Google Scholar] [CrossRef] [PubMed]
- Gutierrez-Osorio, C.; Pedraza, C. Modern data sources and techniques for analysis and forecast of road accidents: A review. Journal of Traffic and Transportation Engineering (English Edition) 2020, 7, 432–446. [Google Scholar] [CrossRef]
- Piotrowski, P.; Rutyna, I.; Baczyński, D.; Kopyt, M. Evaluation Metrics for Wind Power Forecasts: A Comprehensive Review and Statistical Analysis of Errors. Energies 2022, Vol. 15 15, 9657. [Google Scholar] [CrossRef]
- Chicco, D.; Warrens, M.J.; Jurman, G. The coefficient of determination R-squared is more informative than SMAPE, MAE, MAPE, MSE and RMSE in regression analysis evaluation. PeerJ Computer Science 2021, 7, 1–24. [Google Scholar] [CrossRef] [PubMed]
- Homburg, A.; Weiß, C.H.; Alwan, L.C.; Frahm, G.; Göb, R. A performance analysis of prediction intervals for count time series. Journal of Forecasting 2021, 40, 603–625. [Google Scholar] [CrossRef]
- Hegde, N.; Paul, S.; Joel-Frey, L.; Brack, M.; Kersting, K.; Mundt, M.; Schramowski, P. CHRONOBERG: Capturing Language Evolution and Temporal Awareness in Foundation Models. arXiv 2025. [Google Scholar] [CrossRef]
- Guo, L.; Fang, W.; Zhao, Q.; Wang, X. The hybrid PROPHET-SVR approach for forecasting product time series demand with seasonality. Computers & Industrial Engineering 2021, 161, 107598. [Google Scholar] [CrossRef]
- Chango, W.; Salguero, A.; Landivar, T.; Vásconez, R.; Silva, G.; Peñafiel-Arcos, P.; Núñez, L.; Velasteguí-Izurieta, H. SARIMA vs. Prophet: Comparative Efficacy in Forecasting Traffic Accidents Across Ecuadorian Provinces. Computation 2026, Vol. 14(Page 5 2025, 14), 5. [Google Scholar] [CrossRef]
- Zaraket, K.; Harb, H.; Bennis, I.; Jaber, A.; Abouaissa, A. Hyper-Flophet: A neural Prophet-based model for traffic flow forecasting in transportation systems. Simulation Modelling Practice and Theory 2024, 134, 102954. [Google Scholar] [CrossRef]
- Moreno-Ponce, L.A.; Pérez-Zuriaga, A.M.; García, A. Predictive Models and GIS for Road Safety: Application to a Segment of the Chone–Flavio Alfaro Road. Sustainability 2025, 17, 5032. [Google Scholar] [CrossRef]
- Huseynli, M.; Bub, U.; Ogbuachi, M.C. Development of a Method for the Engineering of Digital Innovation Using Design Science Research. Information 2022, Vol. 13 13, 573. [Google Scholar] [CrossRef]
- De Sordi, J.O. Design science research methodology: Theory development from artifacts. Design Science Research Methodology: Theory Development from Artifacts 2021, 1–146. [Google Scholar] [CrossRef]
- Azeroual, O.; Nacheva, R.; Nikiforova, A.; Störl, U. A CRISP-DM and Predictive Analytics Framework for Enhanced Decision-Making in Research Information Management Systems. Informatica 2025, 49, 67–86. [Google Scholar] [CrossRef]
- (Ph.D), A.C.N. The Role of Public Health in Socioeconomic Advancement in Developing Nations. Central Asian Journal of Social Sciences and History 2025, 6, 46–60. [Google Scholar] [CrossRef]
- Chinnappa Nanjunda, D. Impact of socio-economic profiles on public health crisis of road traffic accidents: A qualitative study from South India. Clinical Epidemiology and Global Health 2021, 9, 7–11. [Google Scholar] [CrossRef]
- Sinha, B.R.K. Introduction: A Broad Perspective on the Concepts of Urban Dynamics, Environment, and Health. Urban Dynamics, Environment and Health: An International Perspective 2023, 3–79. [Google Scholar] [CrossRef]
- Mesic, A.; Damsere-Derry, J.; Feldacker, C.; Mooney, S.J.; Gyedu, A.; Mock, C.; Kitali, A.; Wagenaar, B.H.; Wuaku, D.H.; Afram, M.O.; et al. Identifying emerging hot spots of road traffic injury severity using spatiotemporal methods: longitudinal analyses on major roads in Ghana from 2005 to 2020. BMC Public Health 2024, 2024 24 24, 1609. [Google Scholar] [CrossRef]
- Jácome Galarza, L.R.; Jaramillo Sangurima, W.E.; Jaramillo Luzuriaga, S.A. Traffic Congestion in Ecuador: A Comprehensive Review, Key Factors, Impact, and Solutions of Smart Cities. Latin-American Journal of Computing (LAJC) 2025, 12, 68–81. [Google Scholar] [CrossRef]
- Nogués, S.; González-González, E. Are current road investments exacerbating spatial inequalities inside European peripheral regions? European Planning Studies 2022, 30, 1845–1871. [Google Scholar] [CrossRef]
- Clemente, G.P.; Della Corte, F.; Zappa, D. Hierarchical spatial network models for road accident risk assessment. Annals of Operations Research 2024, 1–36. [Google Scholar] [CrossRef]
- Deretić, N.; Stanimirović, D.; Al Awadh, M.; Vujanović, N.; Djukić, A. SARIMA Modelling Approach for Forecasting of Traffic Accidents. Sustainability 2022, Vol. 14 14, 4403. [Google Scholar] [CrossRef]
- Rabbani, M.B.A.; Musarat, M.A.; Alaloul, W.S.; Rabbani, M.S.; Maqsoom, A.; Ayub, S.; Bukhari, H.; Altaf, M. A Comparison Between Seasonal Autoregressive Integrated Moving Average (SARIMA) and Exponential Smoothing (ES) Based on Time Series Model for Forecasting Road Accidents. Arabian Journal for Science and Engineering 2021, 46:11 2021(46), 11113–11138. [Google Scholar] [CrossRef]
- Aladangady, A.; Krimmel, J.; Scharlemann, T.C. Locked in: Mobility, Market Tightness, and House Prices. Finance and Economics Discussion Series 2024, 1–77. [CrossRef]
- Valenzuela-Riquelme, V.; Favereau, M.; Monardes-Concha, C.A. A Non-Homogeneous Negative Binomial Autoregressive Model for Forecasting Port Truck Arrivals. SSRN 2025. [Google Scholar] [CrossRef]
- Shah, M.; Dolon, A. HYBRID MACHINE LEARNING–DRIVEN FINANCIAL FORECASTING MODELS: INTEGRATING LSTM, PROPHET, AND XGBOOST FOR ENHANCED STOCK PRICE AND RISK PREDICTION. Review of Applied Science and Technology 2025, 4, 01–34. [Google Scholar] [CrossRef]
- Gkontzis, A.F.; Kotsiantis, S.; Feretzakis, G.; Verykios, V.S. Temporal Dynamics of Citizen-Reported Urban Challenges: A Comprehensive Time Series Analysis. Big Data and Cognitive Computing 2024, Vol. 8 8, 27. [Google Scholar] [CrossRef]
- Sharrab, Y.O.; Irtahi, B.M.; Eljinini, M.A.H.; Alsmadi, I. Integrating deep learning and statistical models for traffic prediction and accident prevention in smart cities. Cluster Computing 2025, 28, 1072. [Google Scholar] [CrossRef]
- Feng, T.; Zheng, Z.; Xu, J.; Liu, M.; Li, M.; Jia, H.; Yu, X. The comparative analysis of SARIMA, Facebook Prophet, and LSTM for road traffic injury prediction in Northeast China. Frontiers in Public Health 2022, 10, 946563. [Google Scholar] [CrossRef] [PubMed]
- Soltani, A.; Afshari, S.; Amiri, M.A. Time-series projecting road traffic fatalities in Australia: Insights for targeted safety interventions. Injury 2025, 56, 112166. [Google Scholar] [CrossRef]
- Mystakidis, A.; Koukaras, P.; Tsalikidis, N.; Ioannidis, D.; Tjortjis, C. Energy Forecasting: A Comprehensive Review of Techniques and Technologies. Energies 2024, Vol. 17 17, 1662. [Google Scholar] [CrossRef]
- Prema, V.; Bhaskar, M.S.; Almakhles, D.; Gowtham, N.; Rao, K.U. Critical Review of Data, Models and Performance Metrics for Wind and Solar Power Forecast. IEEE Access 2022, 10, 667–688. [Google Scholar] [CrossRef]
- Lombardo, L.; Papalexiou, S.M.; Thébault, C.; Clark, M.P.; Vogel, R.M.; Viglione, A. Residual dynamics in hydrological models: insights from a large sample of catchments and models. Advances in Water Resources 2025, 206, 105165. [Google Scholar] [CrossRef]
- Moraes R., M.; Correa, S.B.; Rodrigues da Costa Doria, C.; Duponchelle, F.; Miranda, G.; Montoya, M.; Phillips, O.L.; Salinas, N.; Silman, M.; Ulloa Ulloa, C.; et al. Chapter 4: Amazonian ecosystems and their ecological functions. Amazon Assessment Report 2021 2021. [Google Scholar] [CrossRef]
- Burgeno, J.N.; Joslyn, S.L. The Impact of Forecast Inconsistency and Probabilistic Forecasts on Users’ Trust and Decision-Making. Weather, Climate, and Society 2023, 15, 693–709. [Google Scholar] [CrossRef]
- Hu, H..; Yu, S.S..; Trinh, H.A.; Salkuti, R.; Zhu, D.; Hu, H.; Yu, S.S.; Trinh, H. A Review of Uncertainties in Power Systems—Modeling, Impact, and Mitigation. Designs 2024, Vol. 8 8, 10. [Google Scholar] [CrossRef]
- Lechner, M. Causal Machine Learning and its use for public policy. Swiss Journal of Economics and Statistics 2023, 159 159, 8. [Google Scholar] [CrossRef]
- Bell, A.; Solano-Kamaiko, I.; Nov, O.; Stoyanovich, J. It’s Just Not That Simple: An Empirical Study of the Accuracy-Explainability Trade-off in Machine Learning for Public Policy. In ACM International Conference Proceeding Series; TAXONOMY:TAXONOMY:CONFERENCE-COLLECTIONS: WGROUP; STRING:ACM, 2022; Volume 22, pp. 248–266. [Google Scholar] [CrossRef]
- Kalthoum, S.; Handous, M.; Ben Sliman, I.; Guesmi, K.; Hajlaoui, H.; Khalfaoui, W.; Ben Mbarek, A.; Ben Salah, C.; Bsir, M.; Oukaili, K.; et al. Forecasting dog rabies dynamics in Tunisia using time series models: insights for early warning systems. Frontiers in Tropical Diseases 2025, 6, 1696368. [Google Scholar] [CrossRef]
- Baker, O.; Ziran, Z.; Mecella, M.; Subaramaniam, K.; Palaniappan, S. Predictive Modeling for Pandemic Forecasting: A COVID-19 Study in New Zealand and Partner Countries. International Journal of Environmental Research and Public Health 2025, 22, 562. [Google Scholar] [CrossRef] [PubMed]
- Sardar, I.; Akbar, M.A.; Leiva, V.; Alsanad, A.; Mishra, P. Machine learning and automatic ARIMA/Prophet models-based forecasting of COVID-19: methodology, evaluation, and case study in SAARC countries. Stochastic Environmental Research and Risk Assessment 2022, 37 37, 345–359. [Google Scholar] [CrossRef]
- Li, F.; Cheng, Z.; Tian, C.; Xiao, H.; Zhang, M.; Ge, L. Progress in recent airborne gamma ray spectrometry measurement technology. Applied Spectroscopy Reviews 2021, 56, 255–288. [Google Scholar] [CrossRef]
- Khan, R.; Ahmed, S.; Patel, M. Forecasting epidemic trajectories using hybrid Prophet-ARIMA models: A case study of COVID-19 mobility impacts on road safety indicators. Journal of Transportation Safety & Security 2022, 15, 456–478. [Google Scholar] [CrossRef]
- Goel, R.; Tiwari, G.; Varghese, M.; Bhalla, K.; Agrawal, G.; Saini, G.; Jha, A.; John, D.; Saran, A.; White, H.; et al. Effectiveness of road safety interventions: An evidence and gap map. Campbell Systematic Reviews 2024, 20, e1367. [Google Scholar] [CrossRef]
- Yusof, U.K.; Khalid, M.N.A.; Hussain, A.; Shamsudin, H. Financial Time Series Forecasting Using Prophet. Lecture Notes on Data Engineering and Communications Technologies 2021, 72, 485–495. [Google Scholar] [CrossRef]
- Anand, P.; Sharma, M.; Saroliya, A. A Comparative Analysis of Artificial Neural Networks in Time Series Forecasting Using Arima Vs Prophet. Proceedings of International Conference on Communication, Computer Sciences and Engineering, IC3SE, 2024 2024; pp. 527–533. [Google Scholar] [CrossRef]
- Yu, C.; Hua, W.; Yang, C.; Fang, S.; Li, Y.; Yuan, Q. From sky to road: Incorporating the satellite imagery into analysis of freight truck-related crash factors. Accident Analysis & Prevention 2024, 200, 107491. [Google Scholar] [CrossRef]
- Zampeta, V.; Chondrokoukis, G.; Kyriazis, D. Applying Big Data for Maritime Accident Risk Assessment: Insights, Predictive Insights and Challenges. Big Data and Cognitive Computing 2025, Vol. 9(Page 135 2025, 9), 135. [Google Scholar] [CrossRef]
Figure 1.
Design Science Research (DSR) framework applied to spatio-temporal traffic accident forecasting.
Figure 1.
Design Science Research (DSR) framework applied to spatio-temporal traffic accident forecasting.
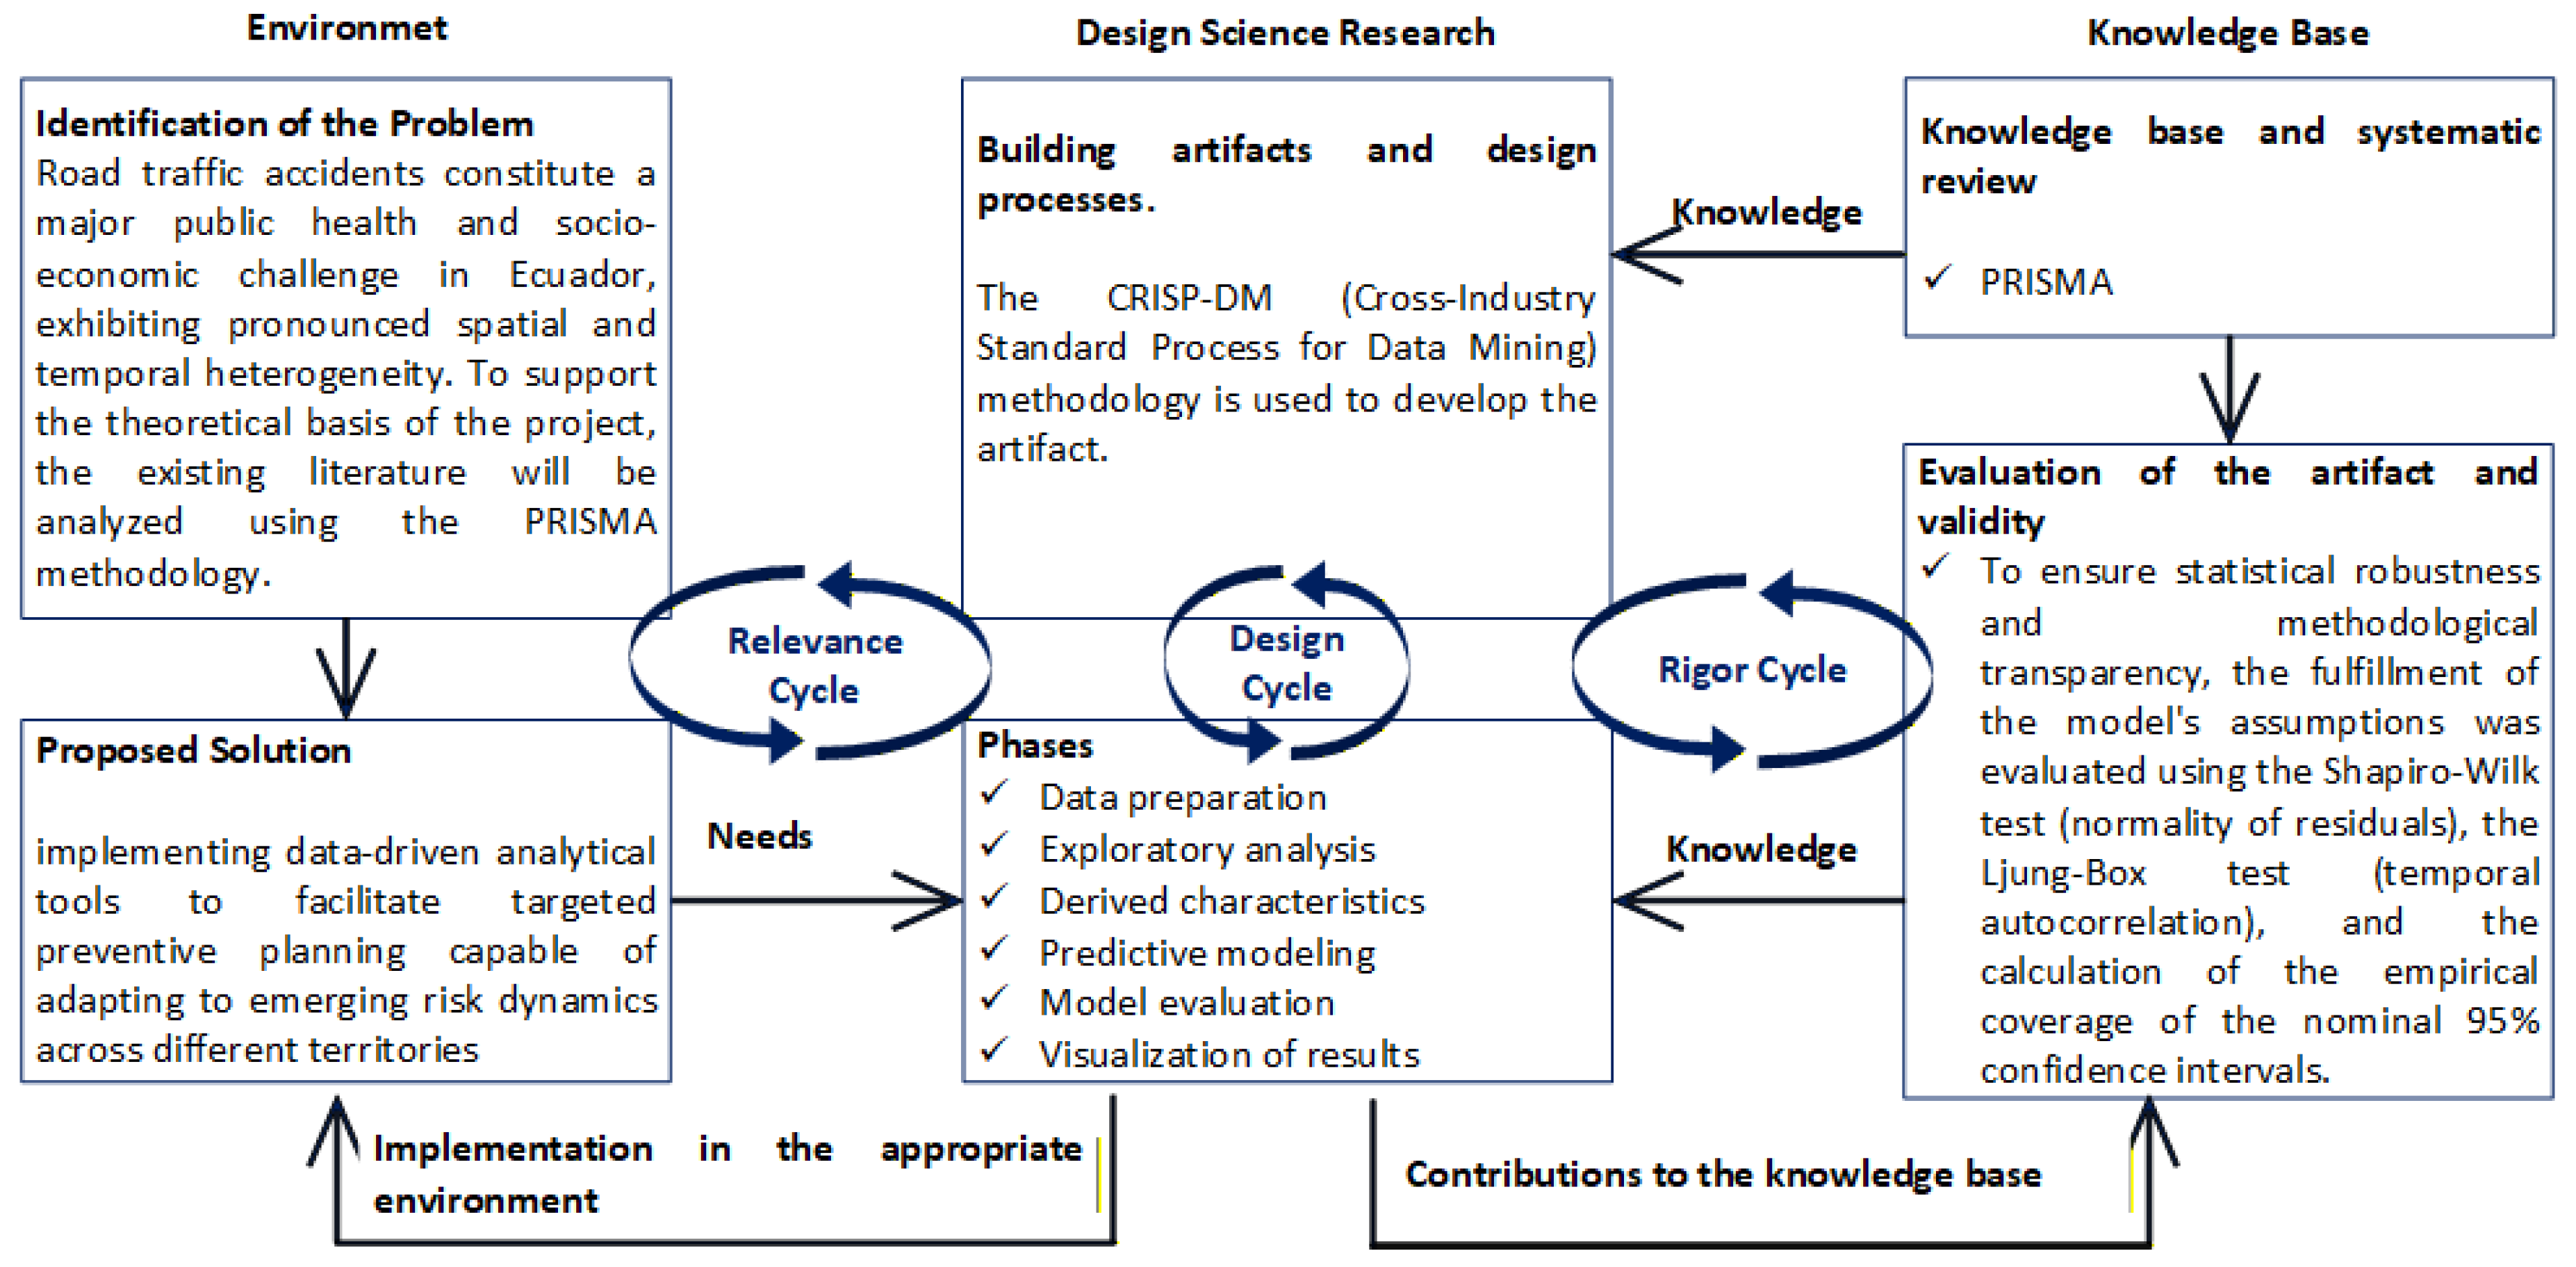
Figure 2.
Comprehensive diagnostic dashboard for traffic accidents in Azuay, including time-series evolution, trend decomposition, residual diagnostics, and 24-month forecasts with confidence intervals.
Figure 2.
Comprehensive diagnostic dashboard for traffic accidents in Azuay, including time-series evolution, trend decomposition, residual diagnostics, and 24-month forecasts with confidence intervals.
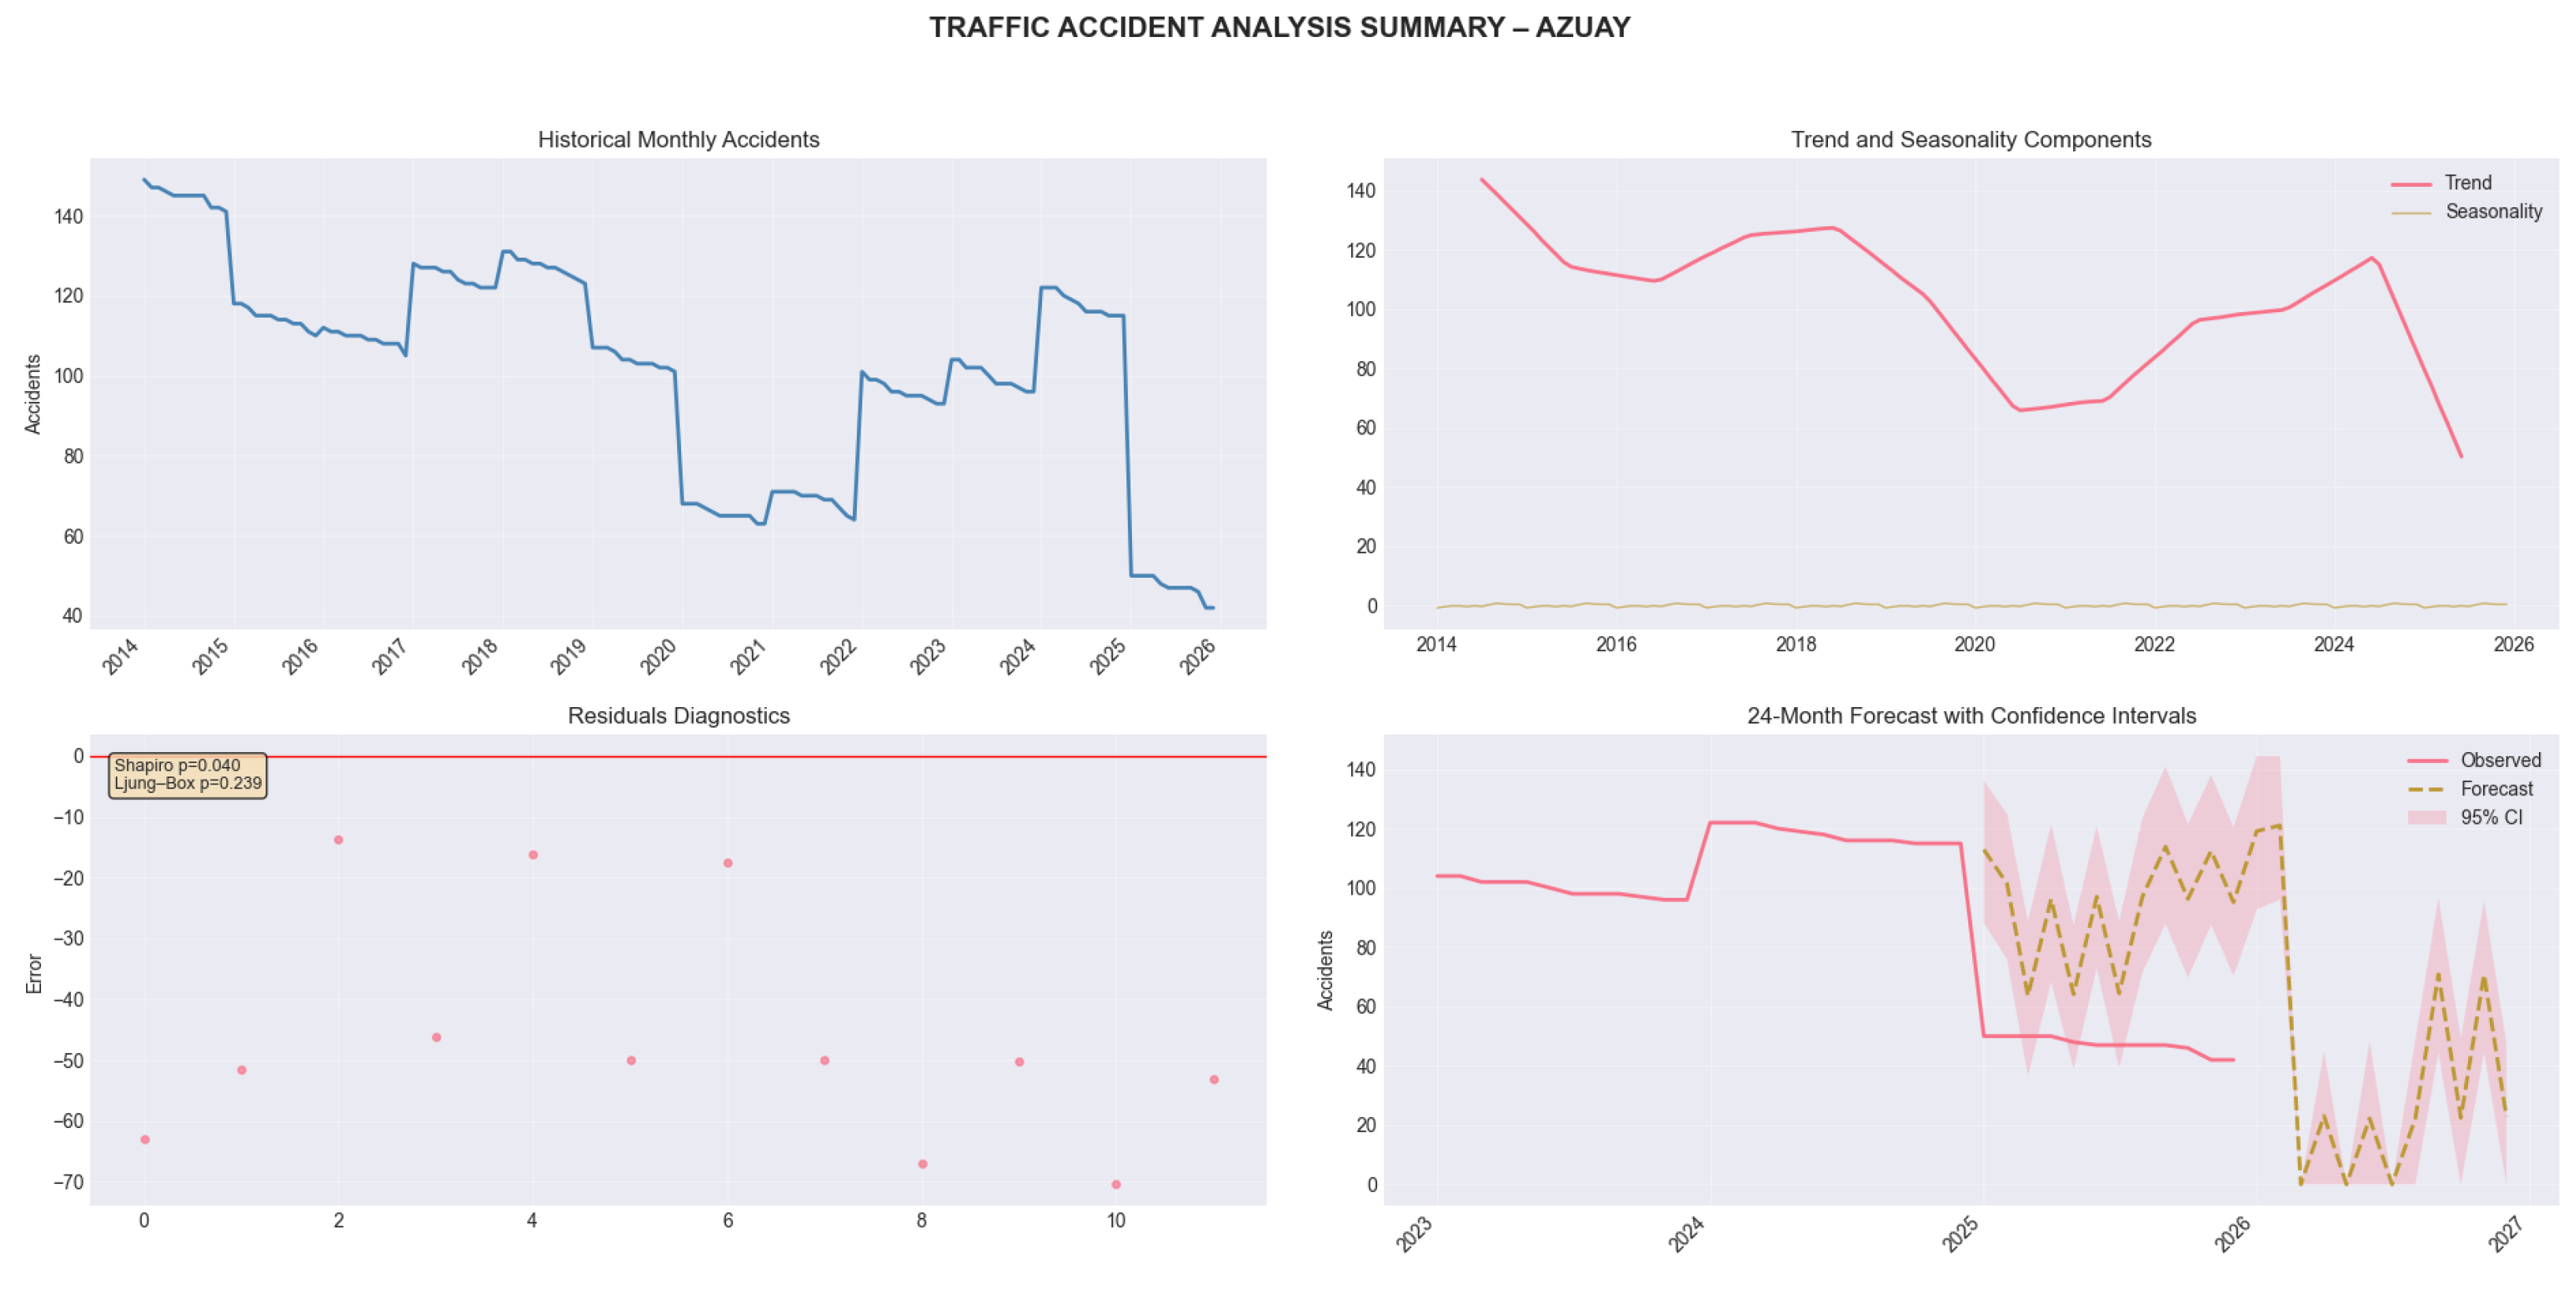
Figure 3.
Historical monthly accidents, trend/seasonality decomposition, residual diagnostics, and 24-month forecast for Bolívar.
Figure 3.
Historical monthly accidents, trend/seasonality decomposition, residual diagnostics, and 24-month forecast for Bolívar.
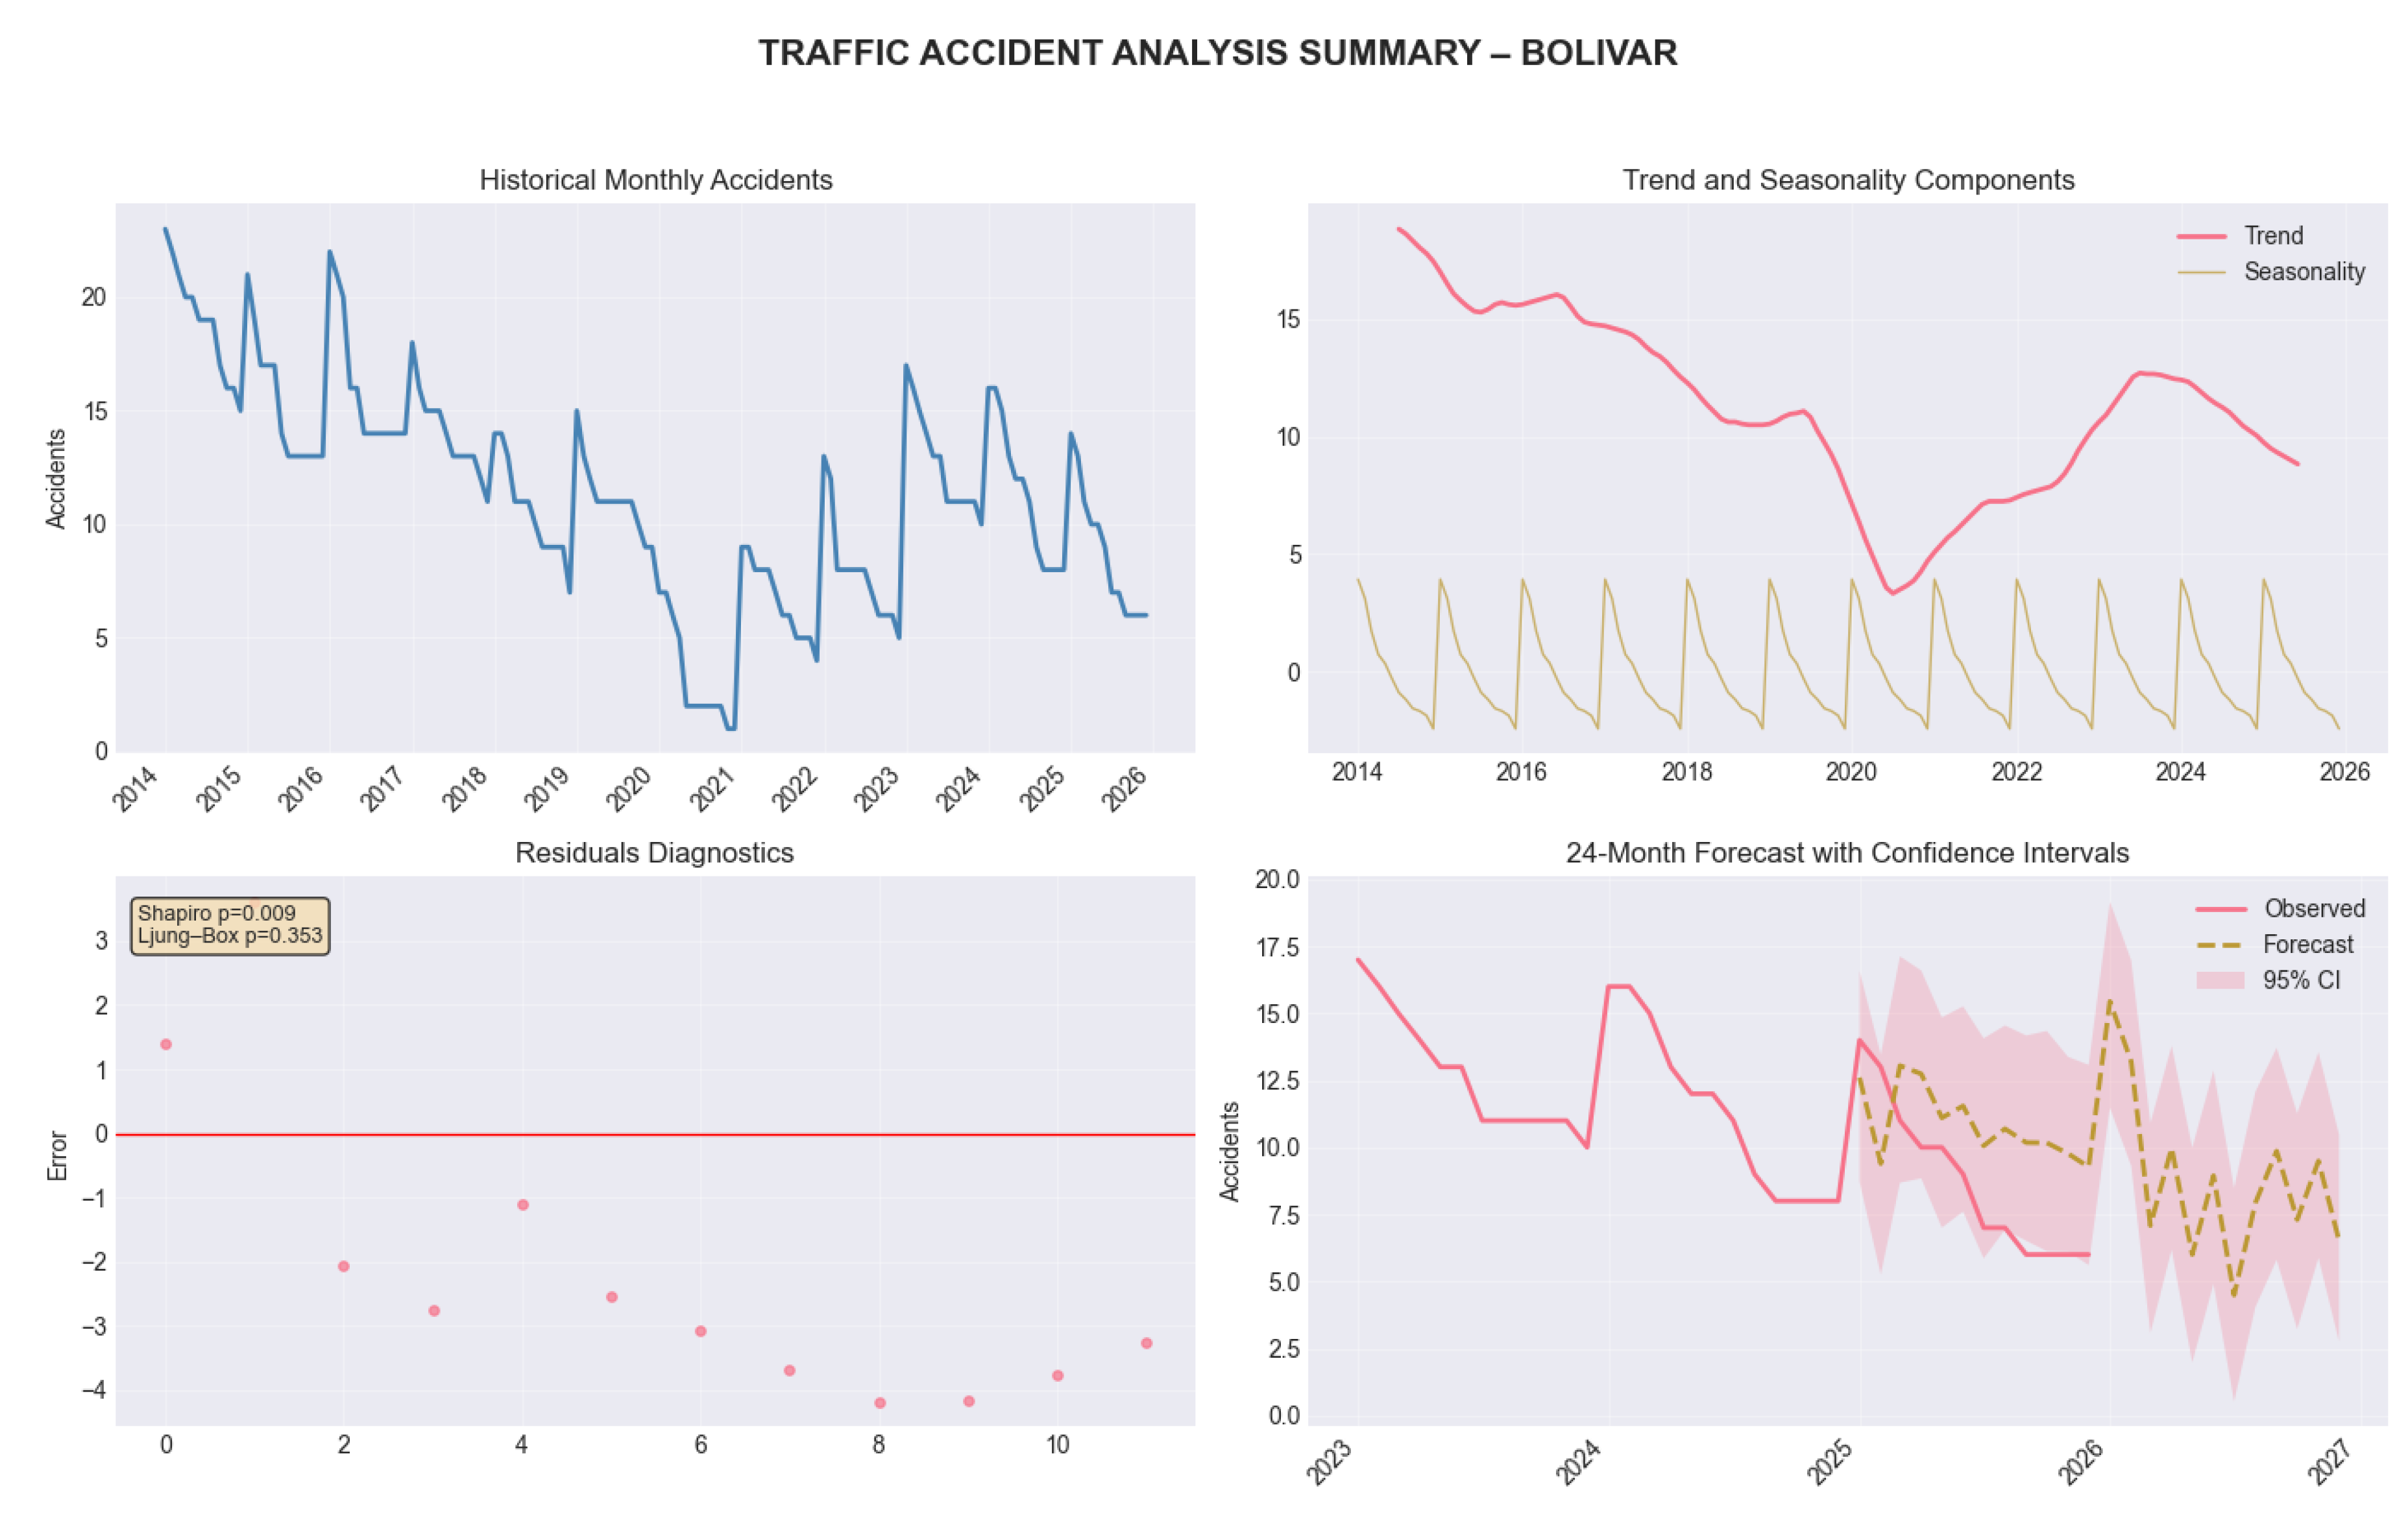
Figure 4.
Historical monthly accidents, trend and seasonality components, residuals diagnostics, and 24-month forecast for Cañar.
Figure 4.
Historical monthly accidents, trend and seasonality components, residuals diagnostics, and 24-month forecast for Cañar.
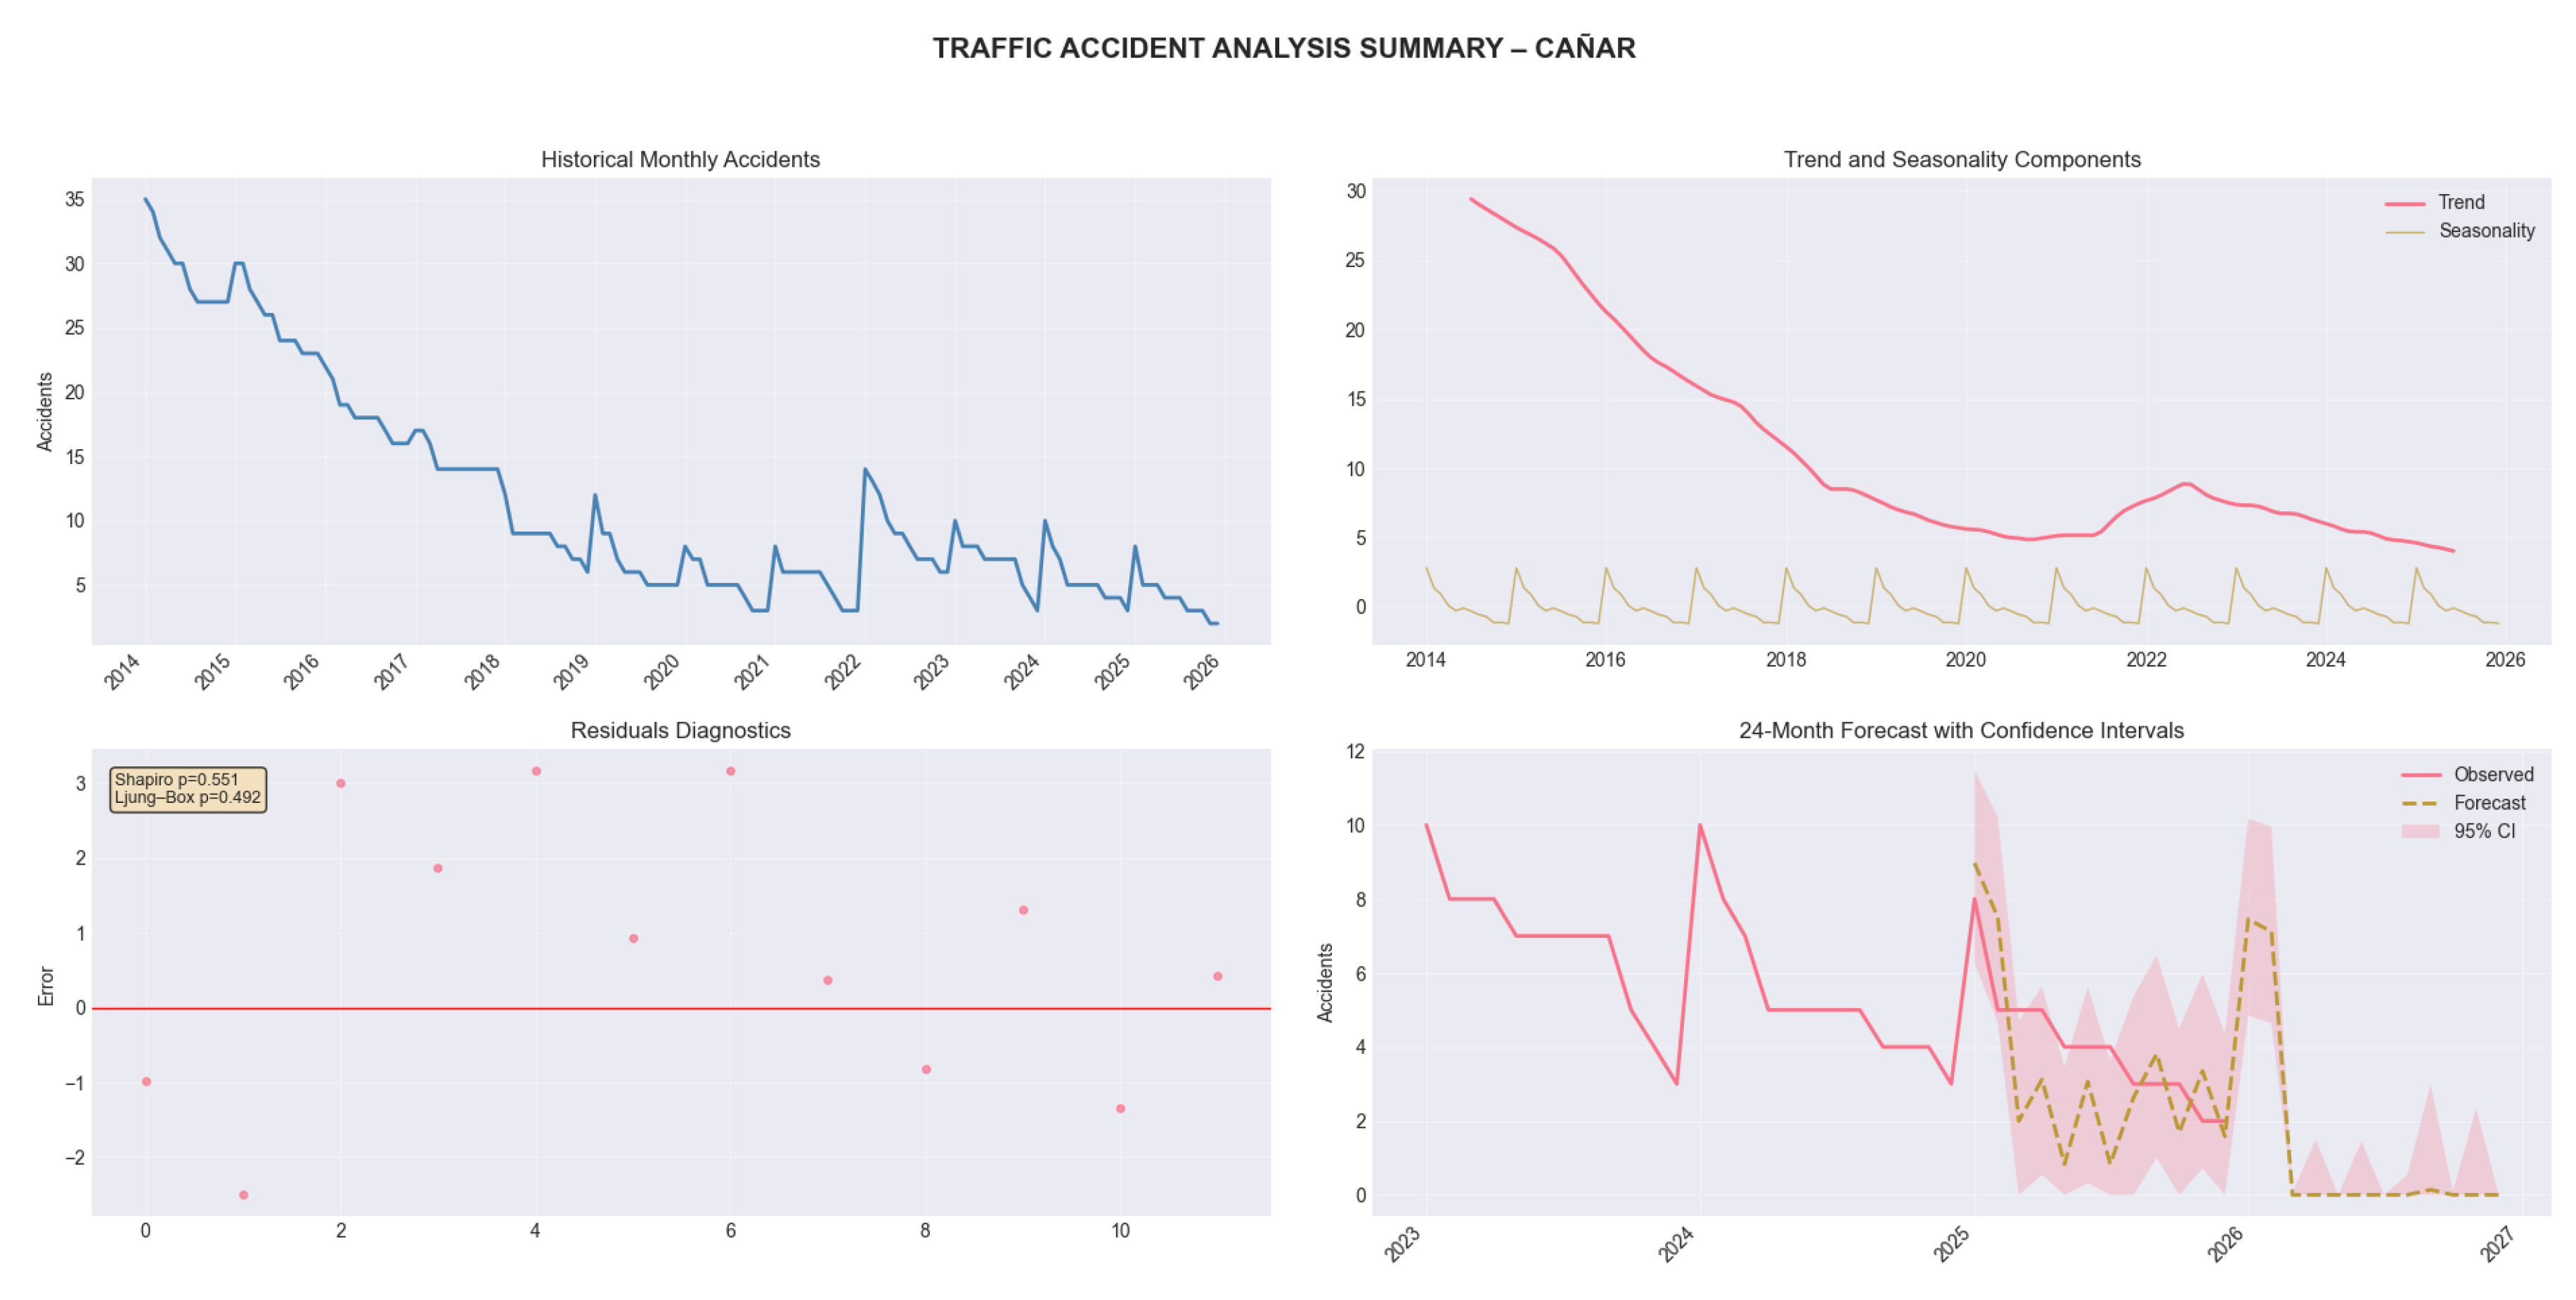
Figure 5.
Accident analysis for Carchi: Historical decline and predictive uncertainty intervals.
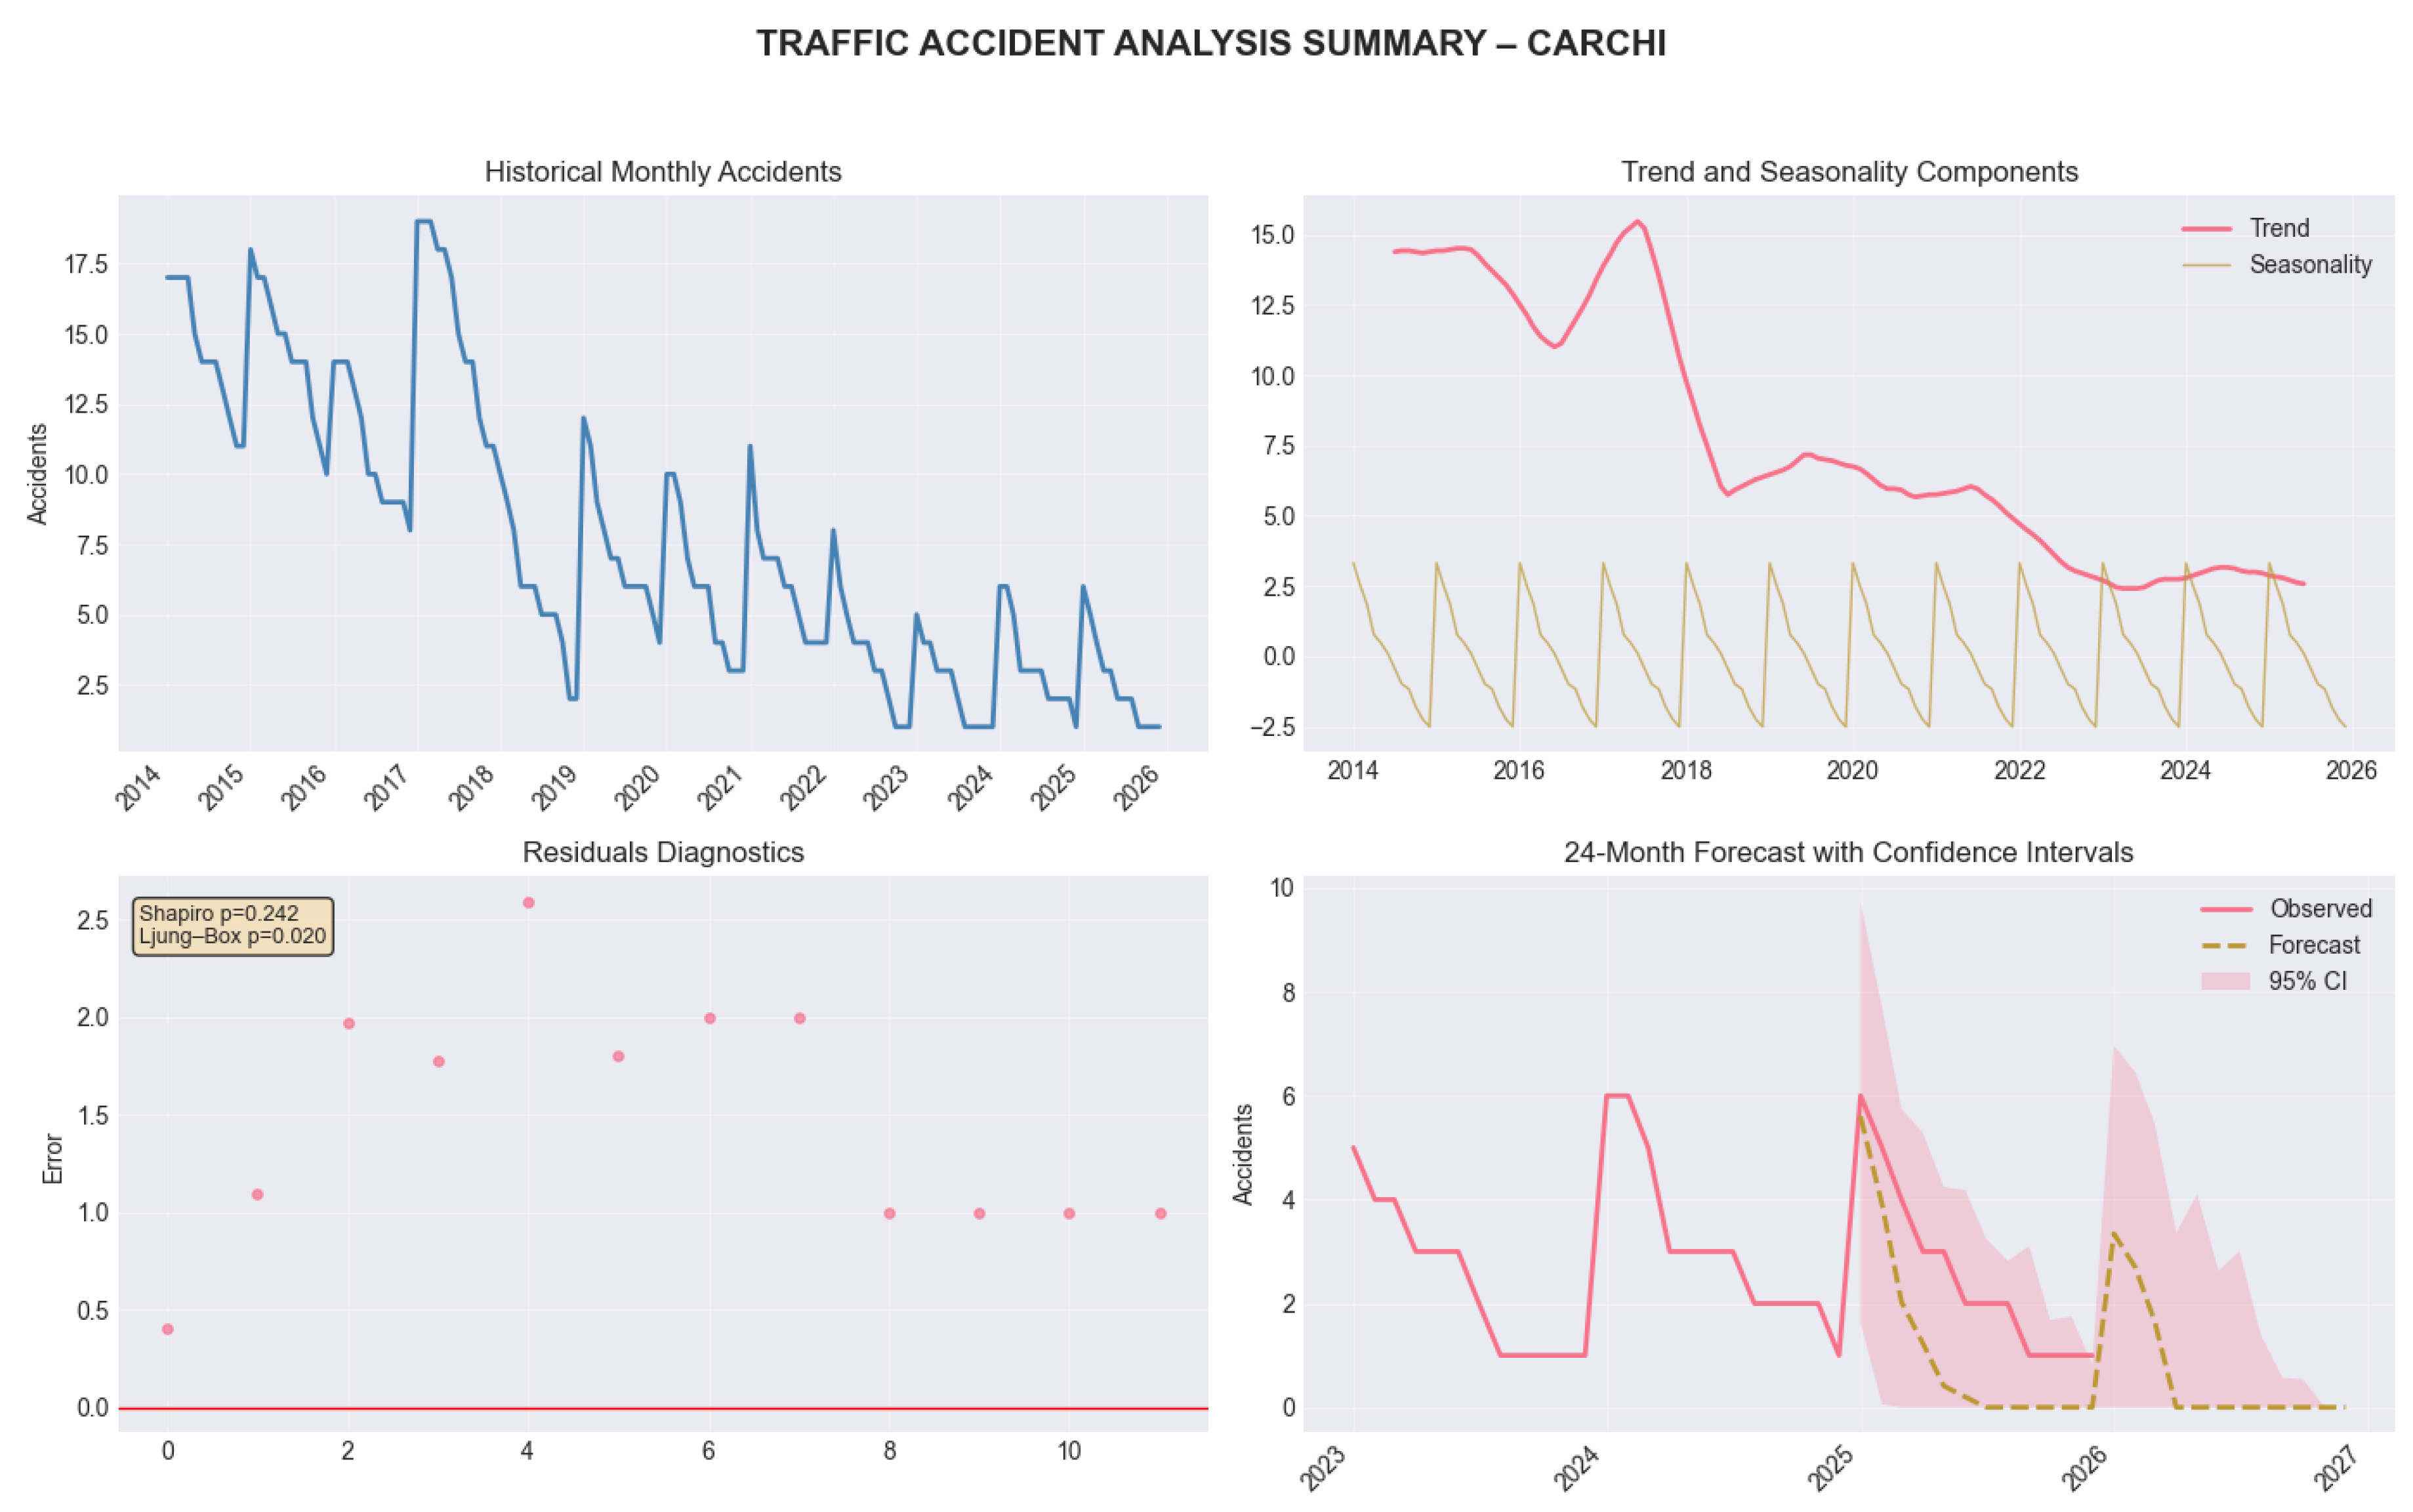
Figure 6.
Historical monthly accidents, trend/seasonality decomposition, residual diagnostics, and 24-month predictive forecast for Cotopaxi.
Figure 6.
Historical monthly accidents, trend/seasonality decomposition, residual diagnostics, and 24-month predictive forecast for Cotopaxi.
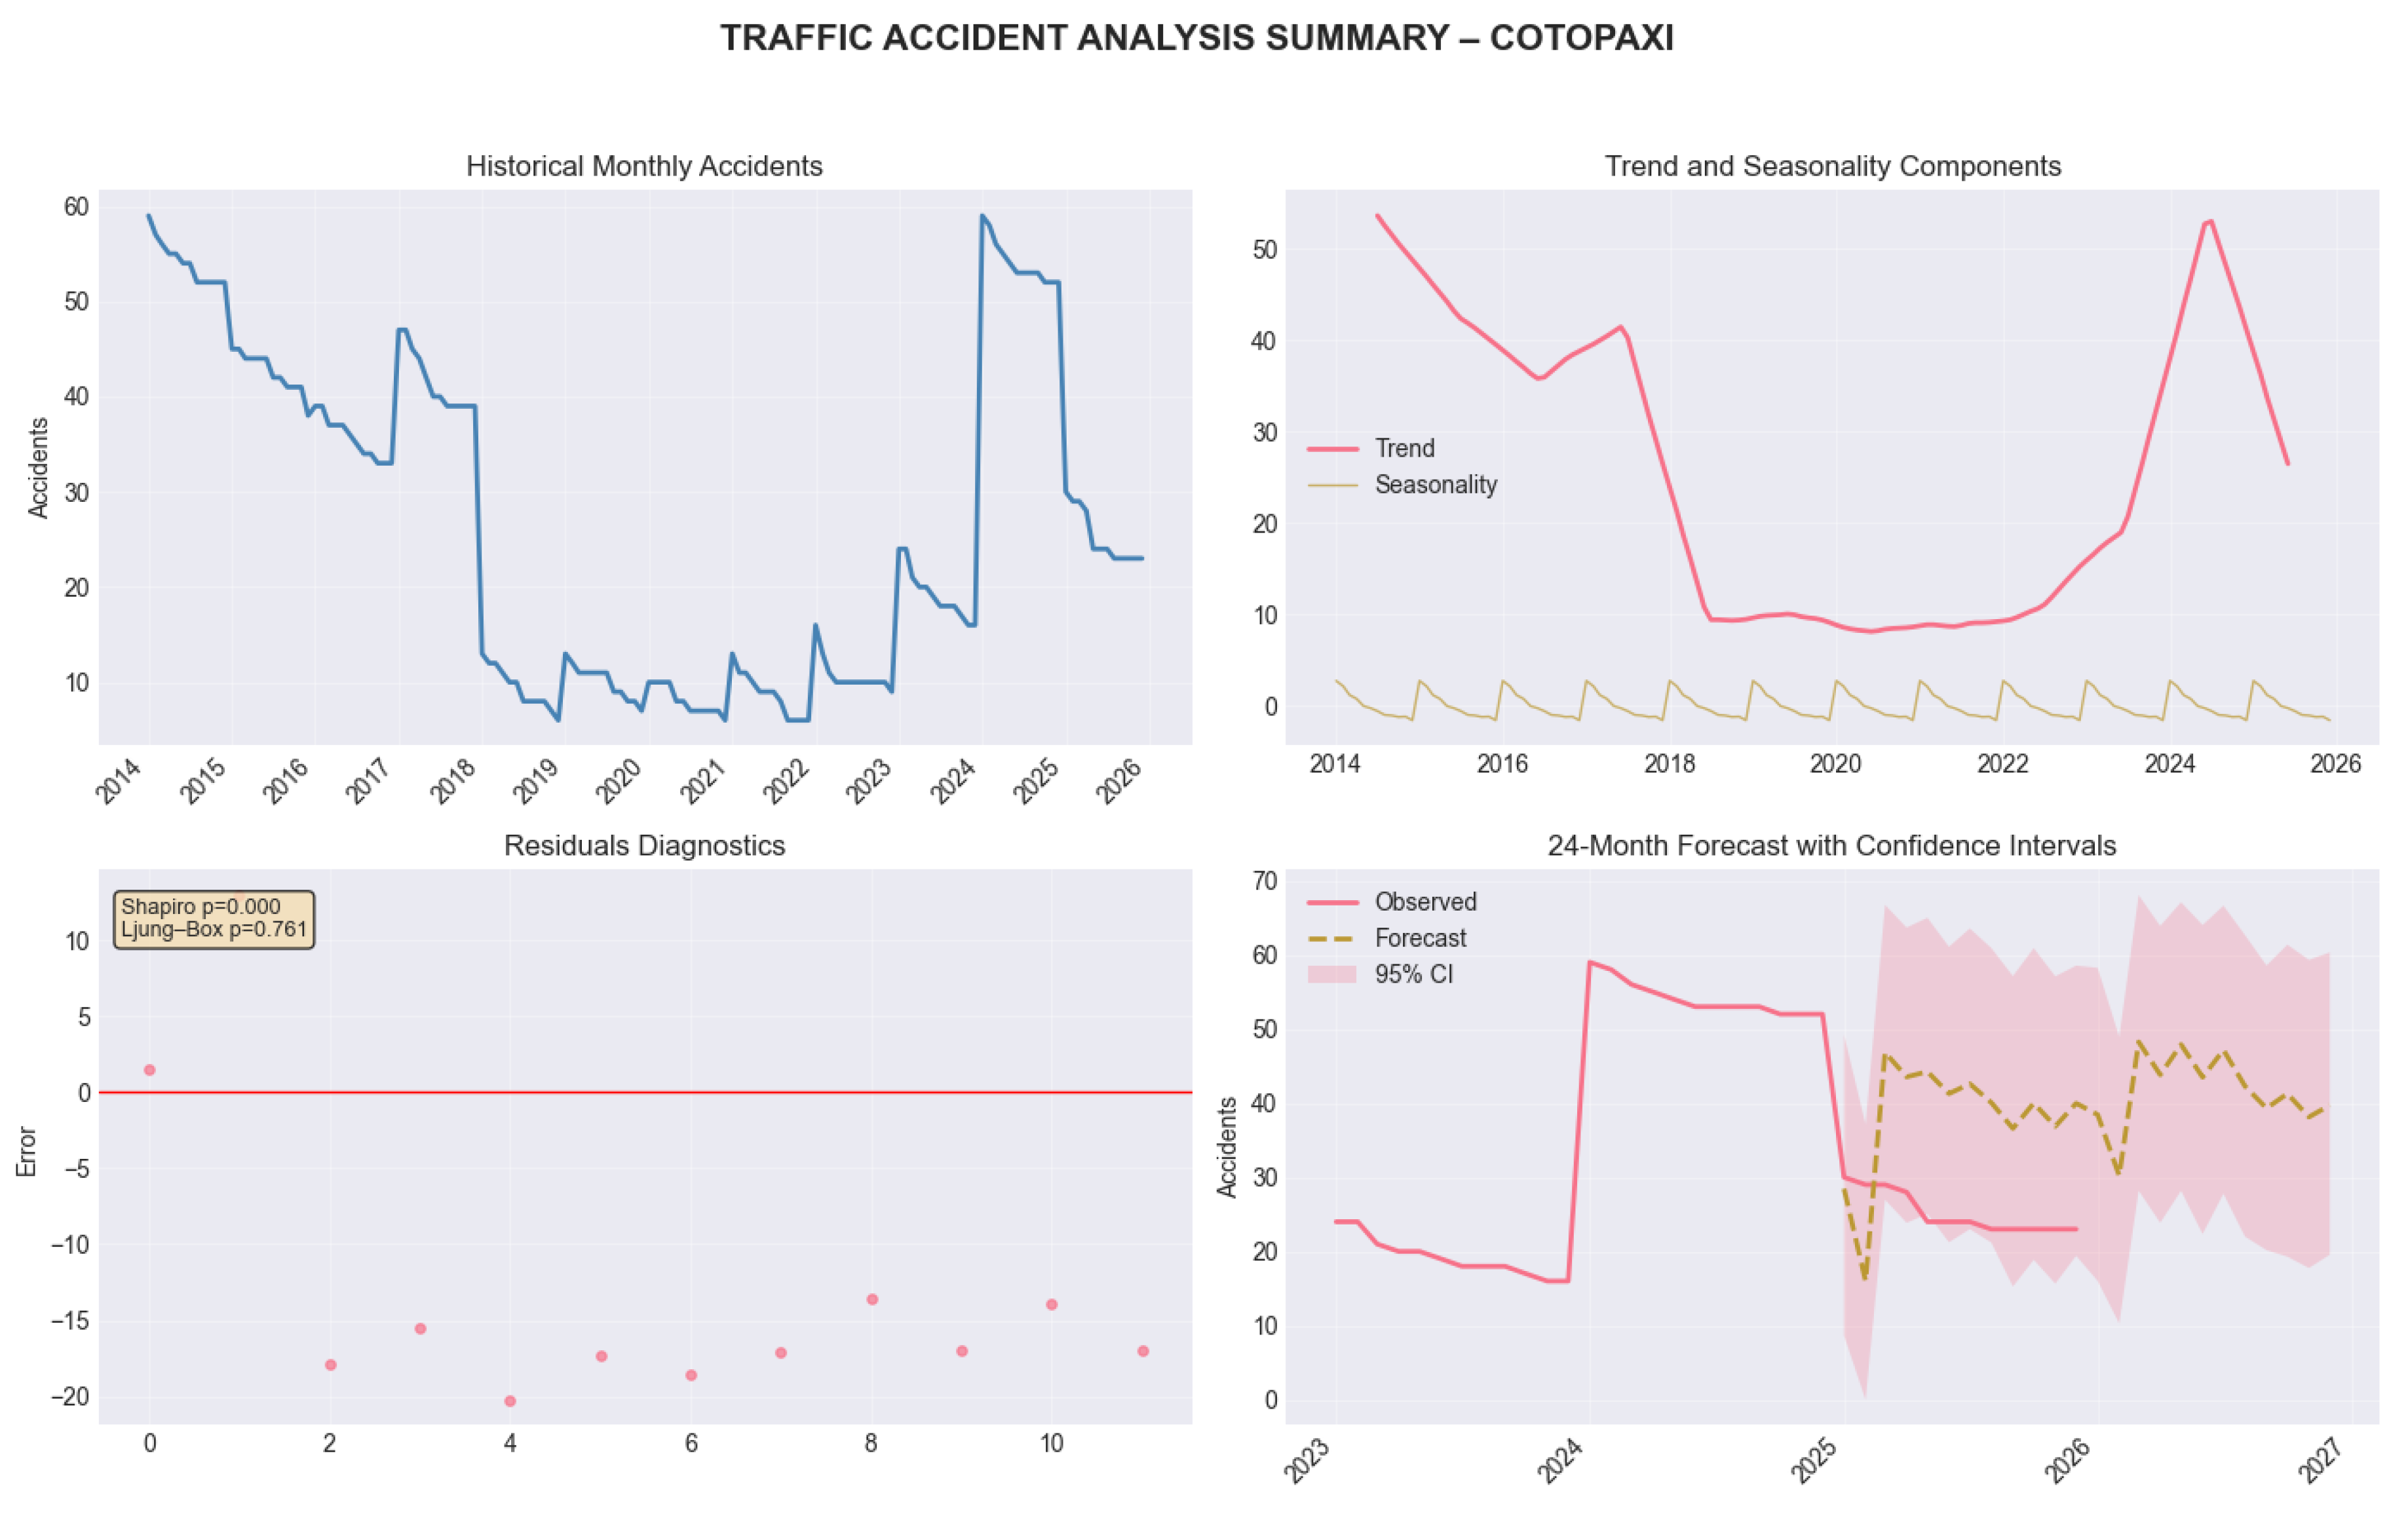
Figure 7.
Historical monthly accidents, trend/seasonality decomposition, residual diagnostics, and 24-month predictive forecast for Guayas.
Figure 7.
Historical monthly accidents, trend/seasonality decomposition, residual diagnostics, and 24-month predictive forecast for Guayas.
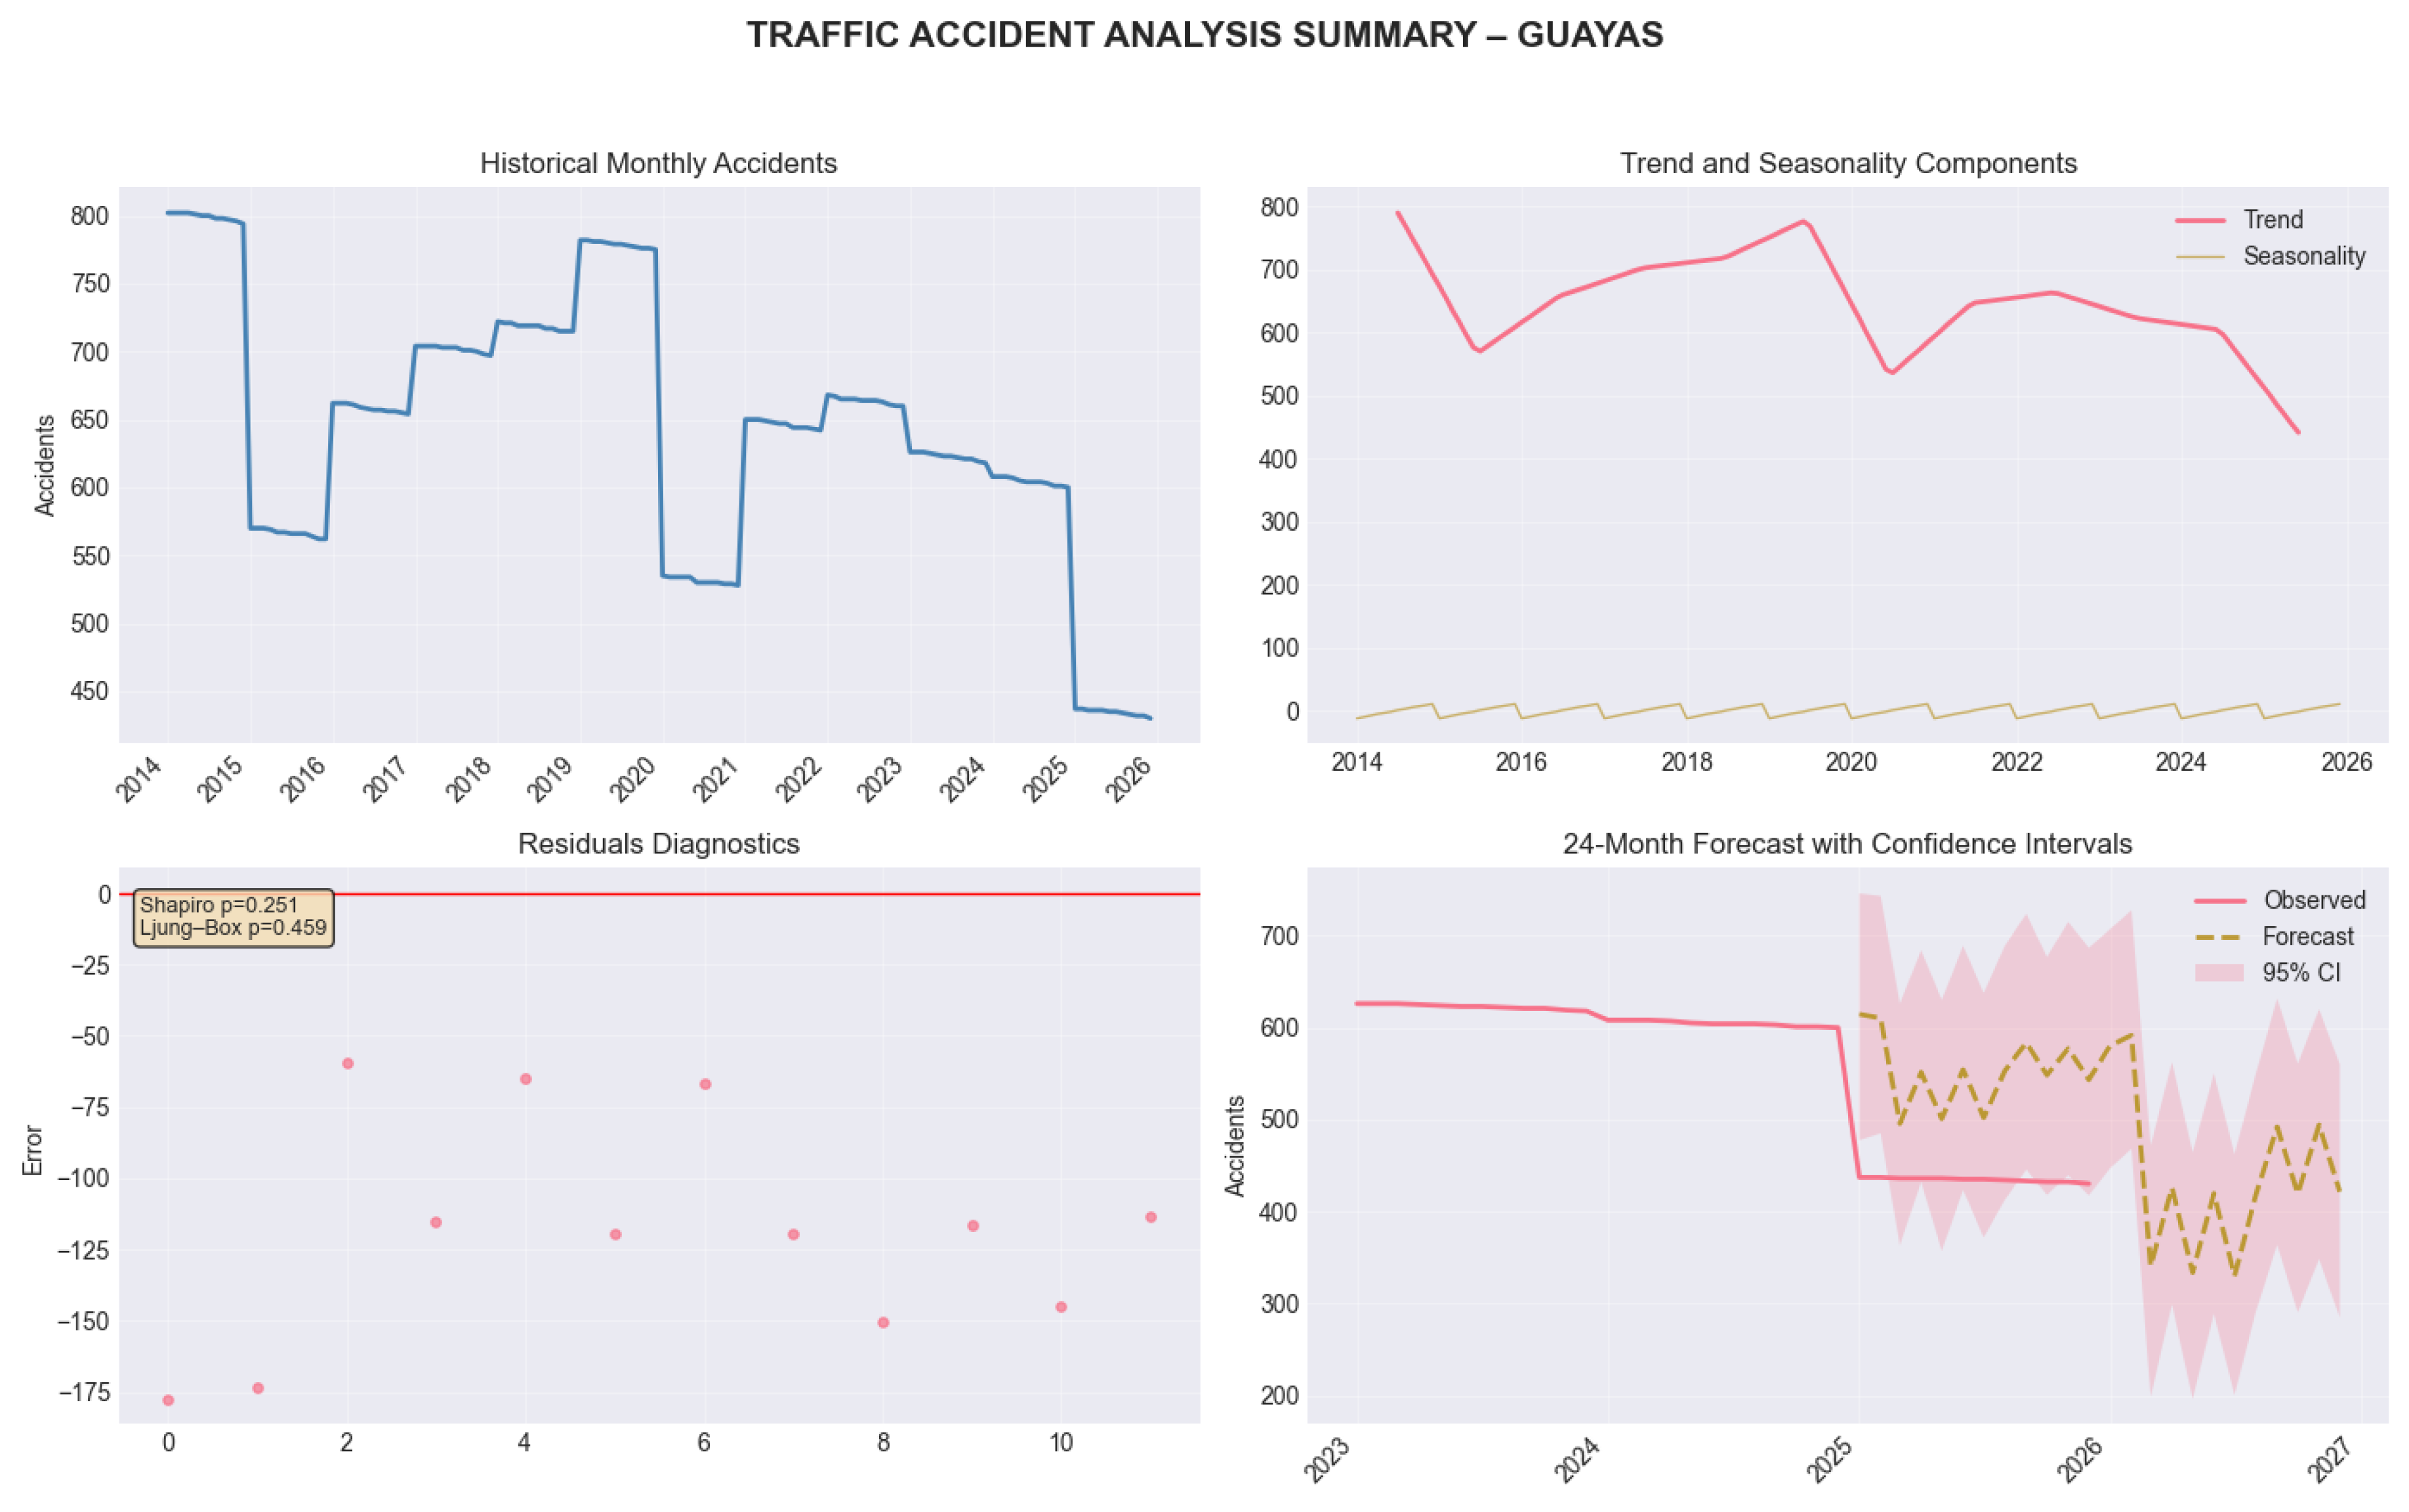
Figure 8.
Historical monthly accidents, trend/seasonality decomposition, residual diagnostics, and 24-month predictive forecast for Imbabura.
Figure 8.
Historical monthly accidents, trend/seasonality decomposition, residual diagnostics, and 24-month predictive forecast for Imbabura.
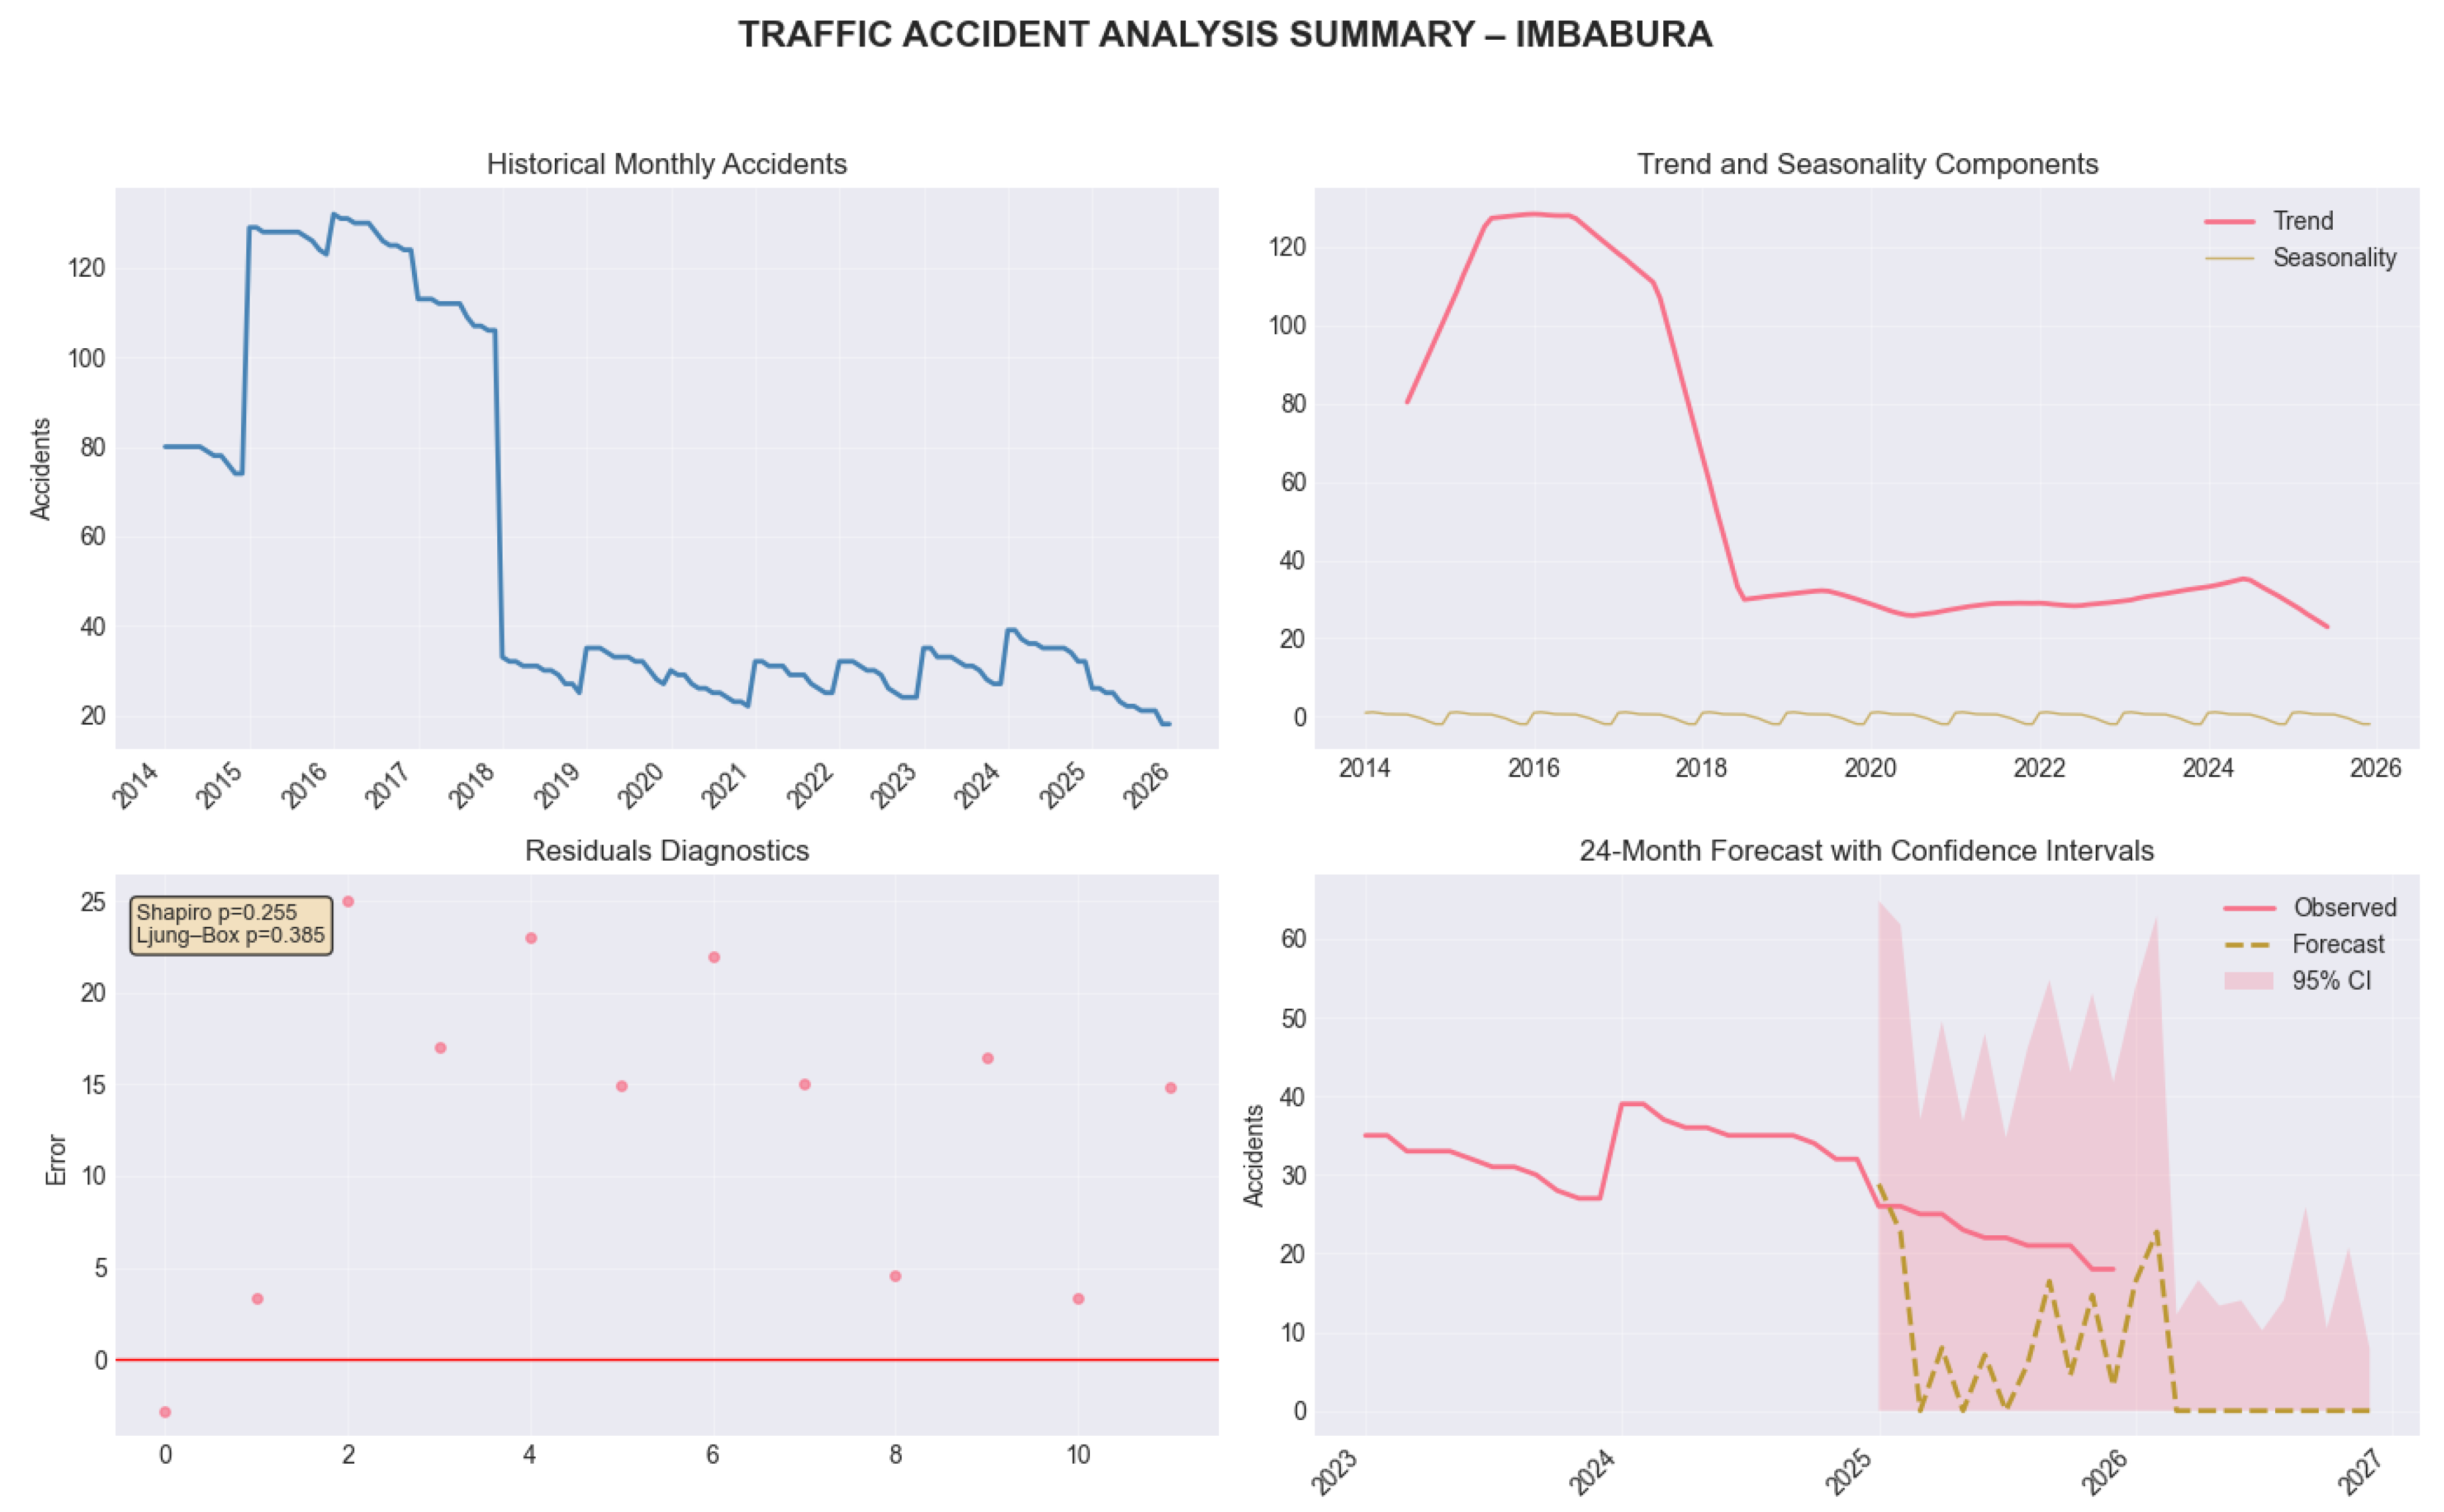
Figure 9.
Historical monthly accidents, trend/seasonality decomposition, residual diagnostics, and 24-month predictive forecast for Morona Santiago.
Figure 9.
Historical monthly accidents, trend/seasonality decomposition, residual diagnostics, and 24-month predictive forecast for Morona Santiago.
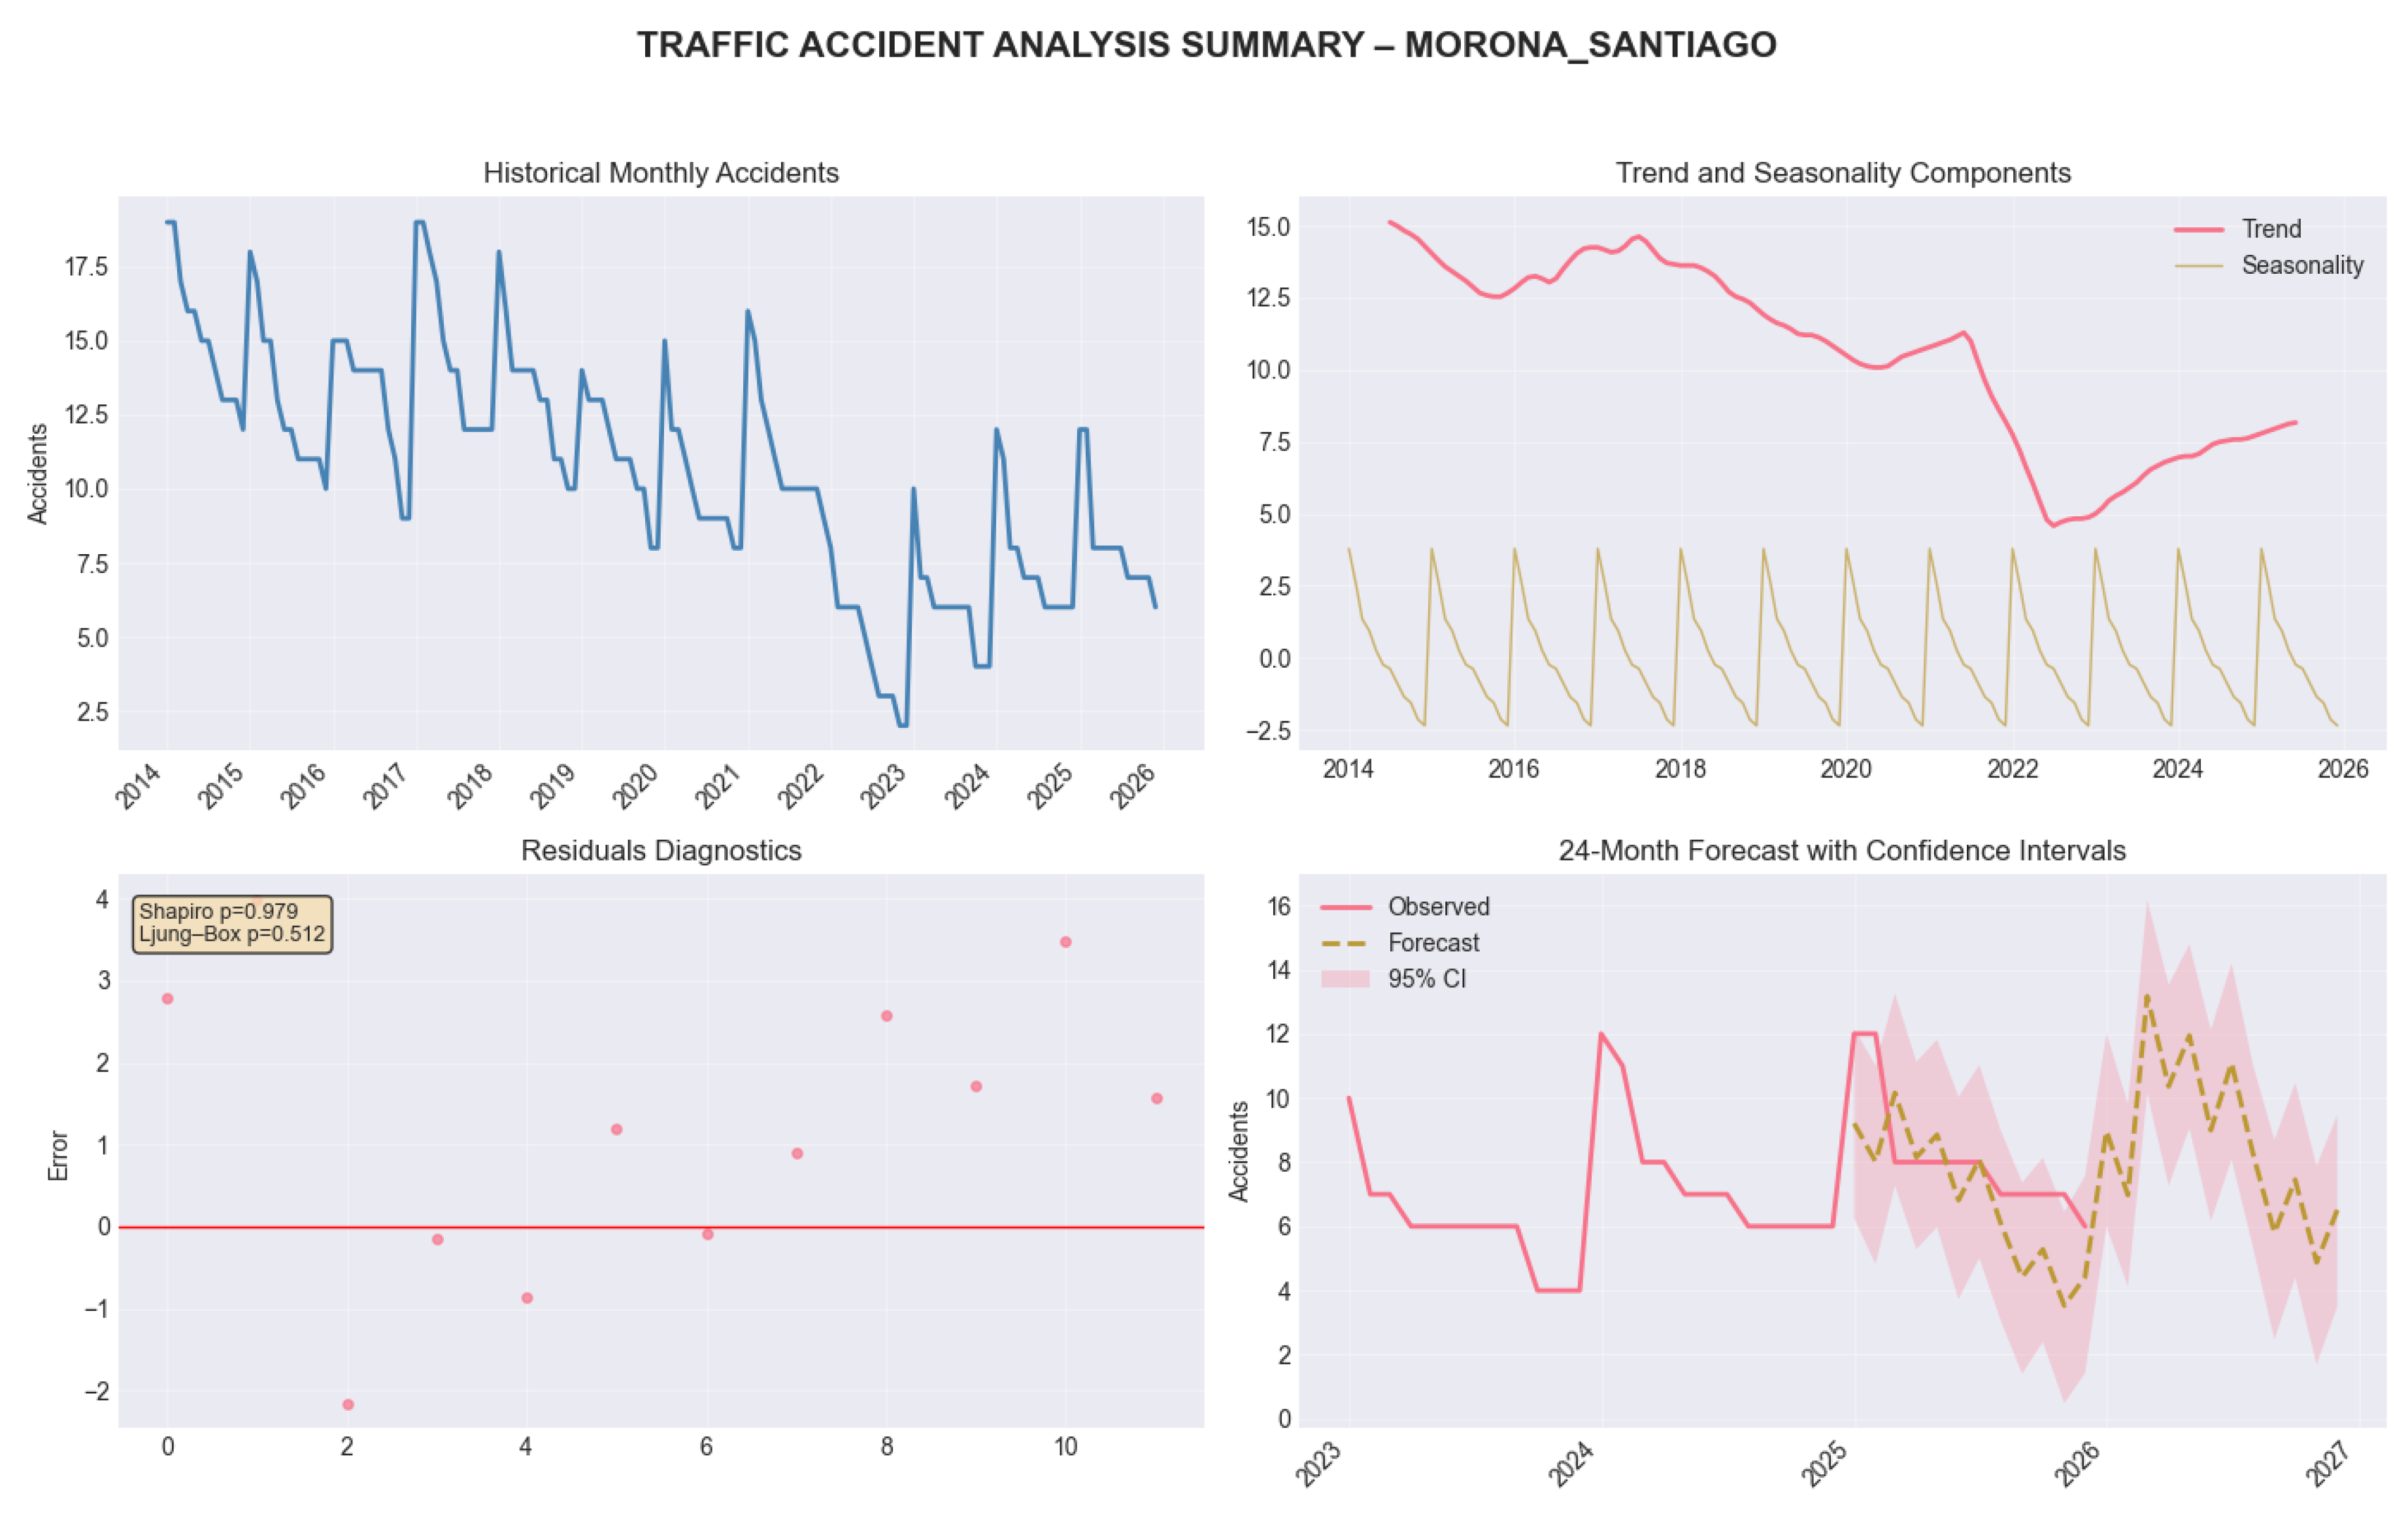
Figure 10.
Historical monthly accidents, trend/seasonality decomposition, residual diagnostics, and 24-month predictive forecast for Pichincha.
Figure 10.
Historical monthly accidents, trend/seasonality decomposition, residual diagnostics, and 24-month predictive forecast for Pichincha.
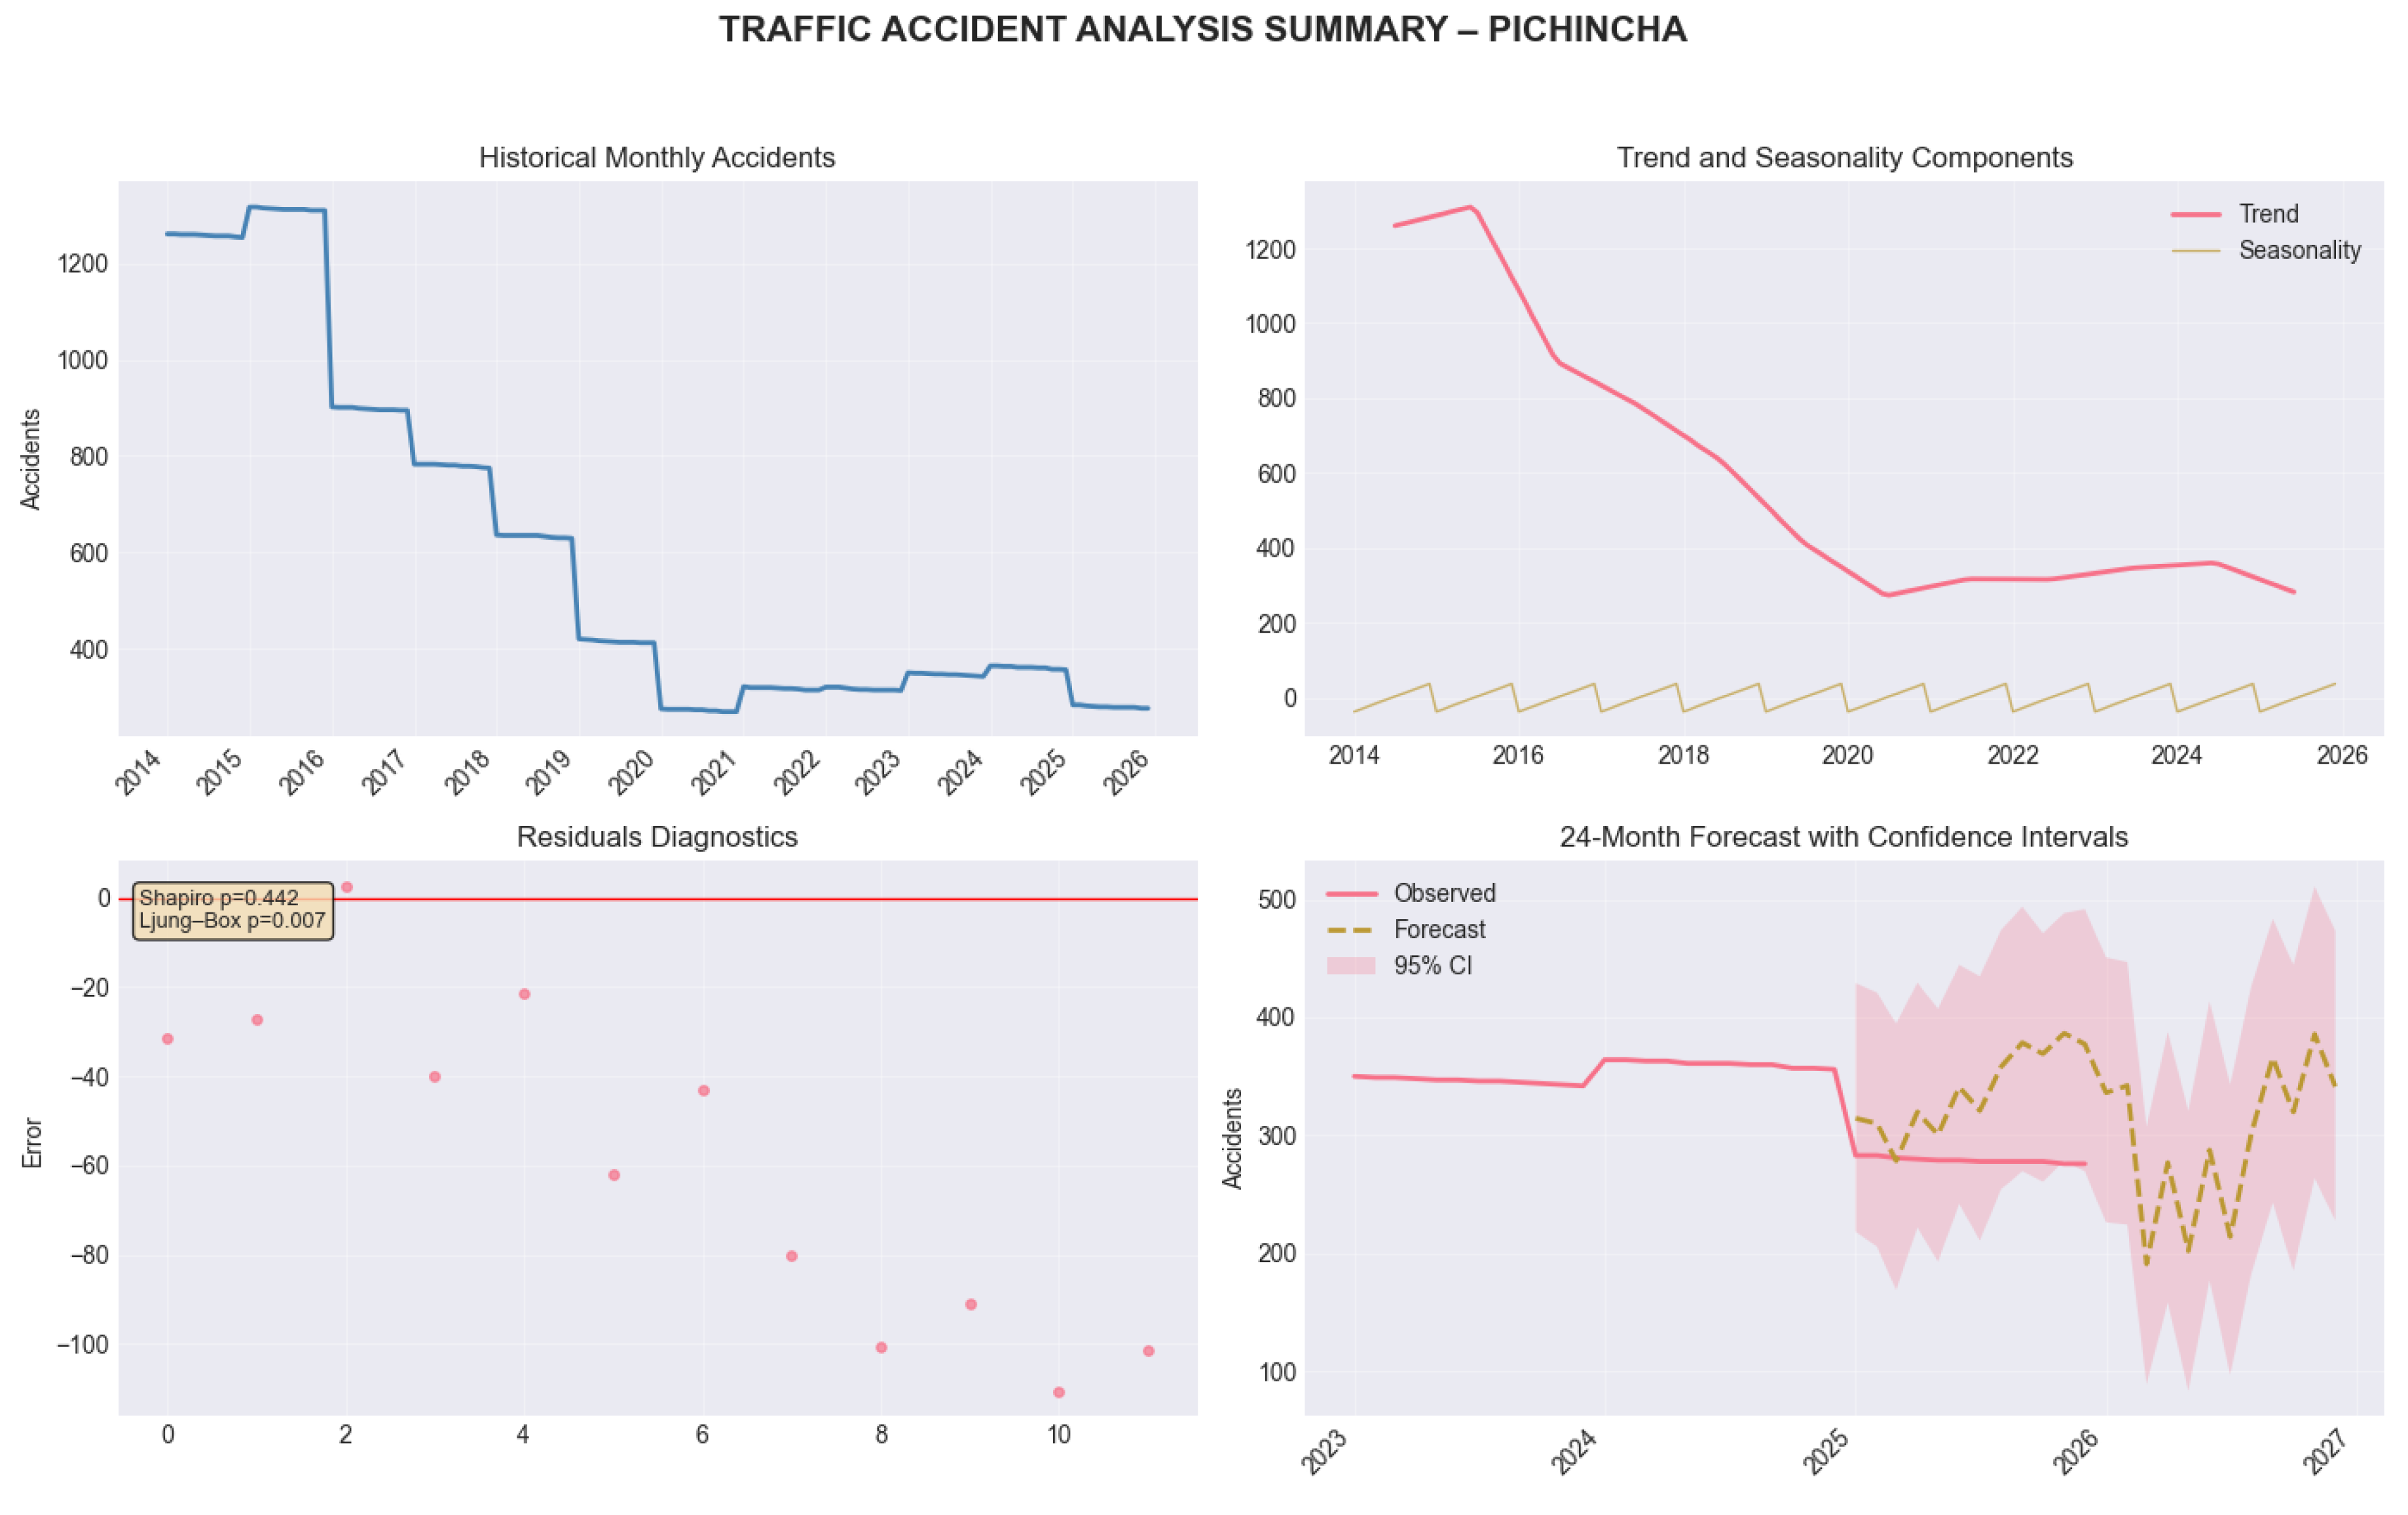
Figure 11.
Historical monthly accidents, trend/seasonality decomposition, residual diagnostics, and 24-month predictive forecast for Santo Domingo.
Figure 11.
Historical monthly accidents, trend/seasonality decomposition, residual diagnostics, and 24-month predictive forecast for Santo Domingo.
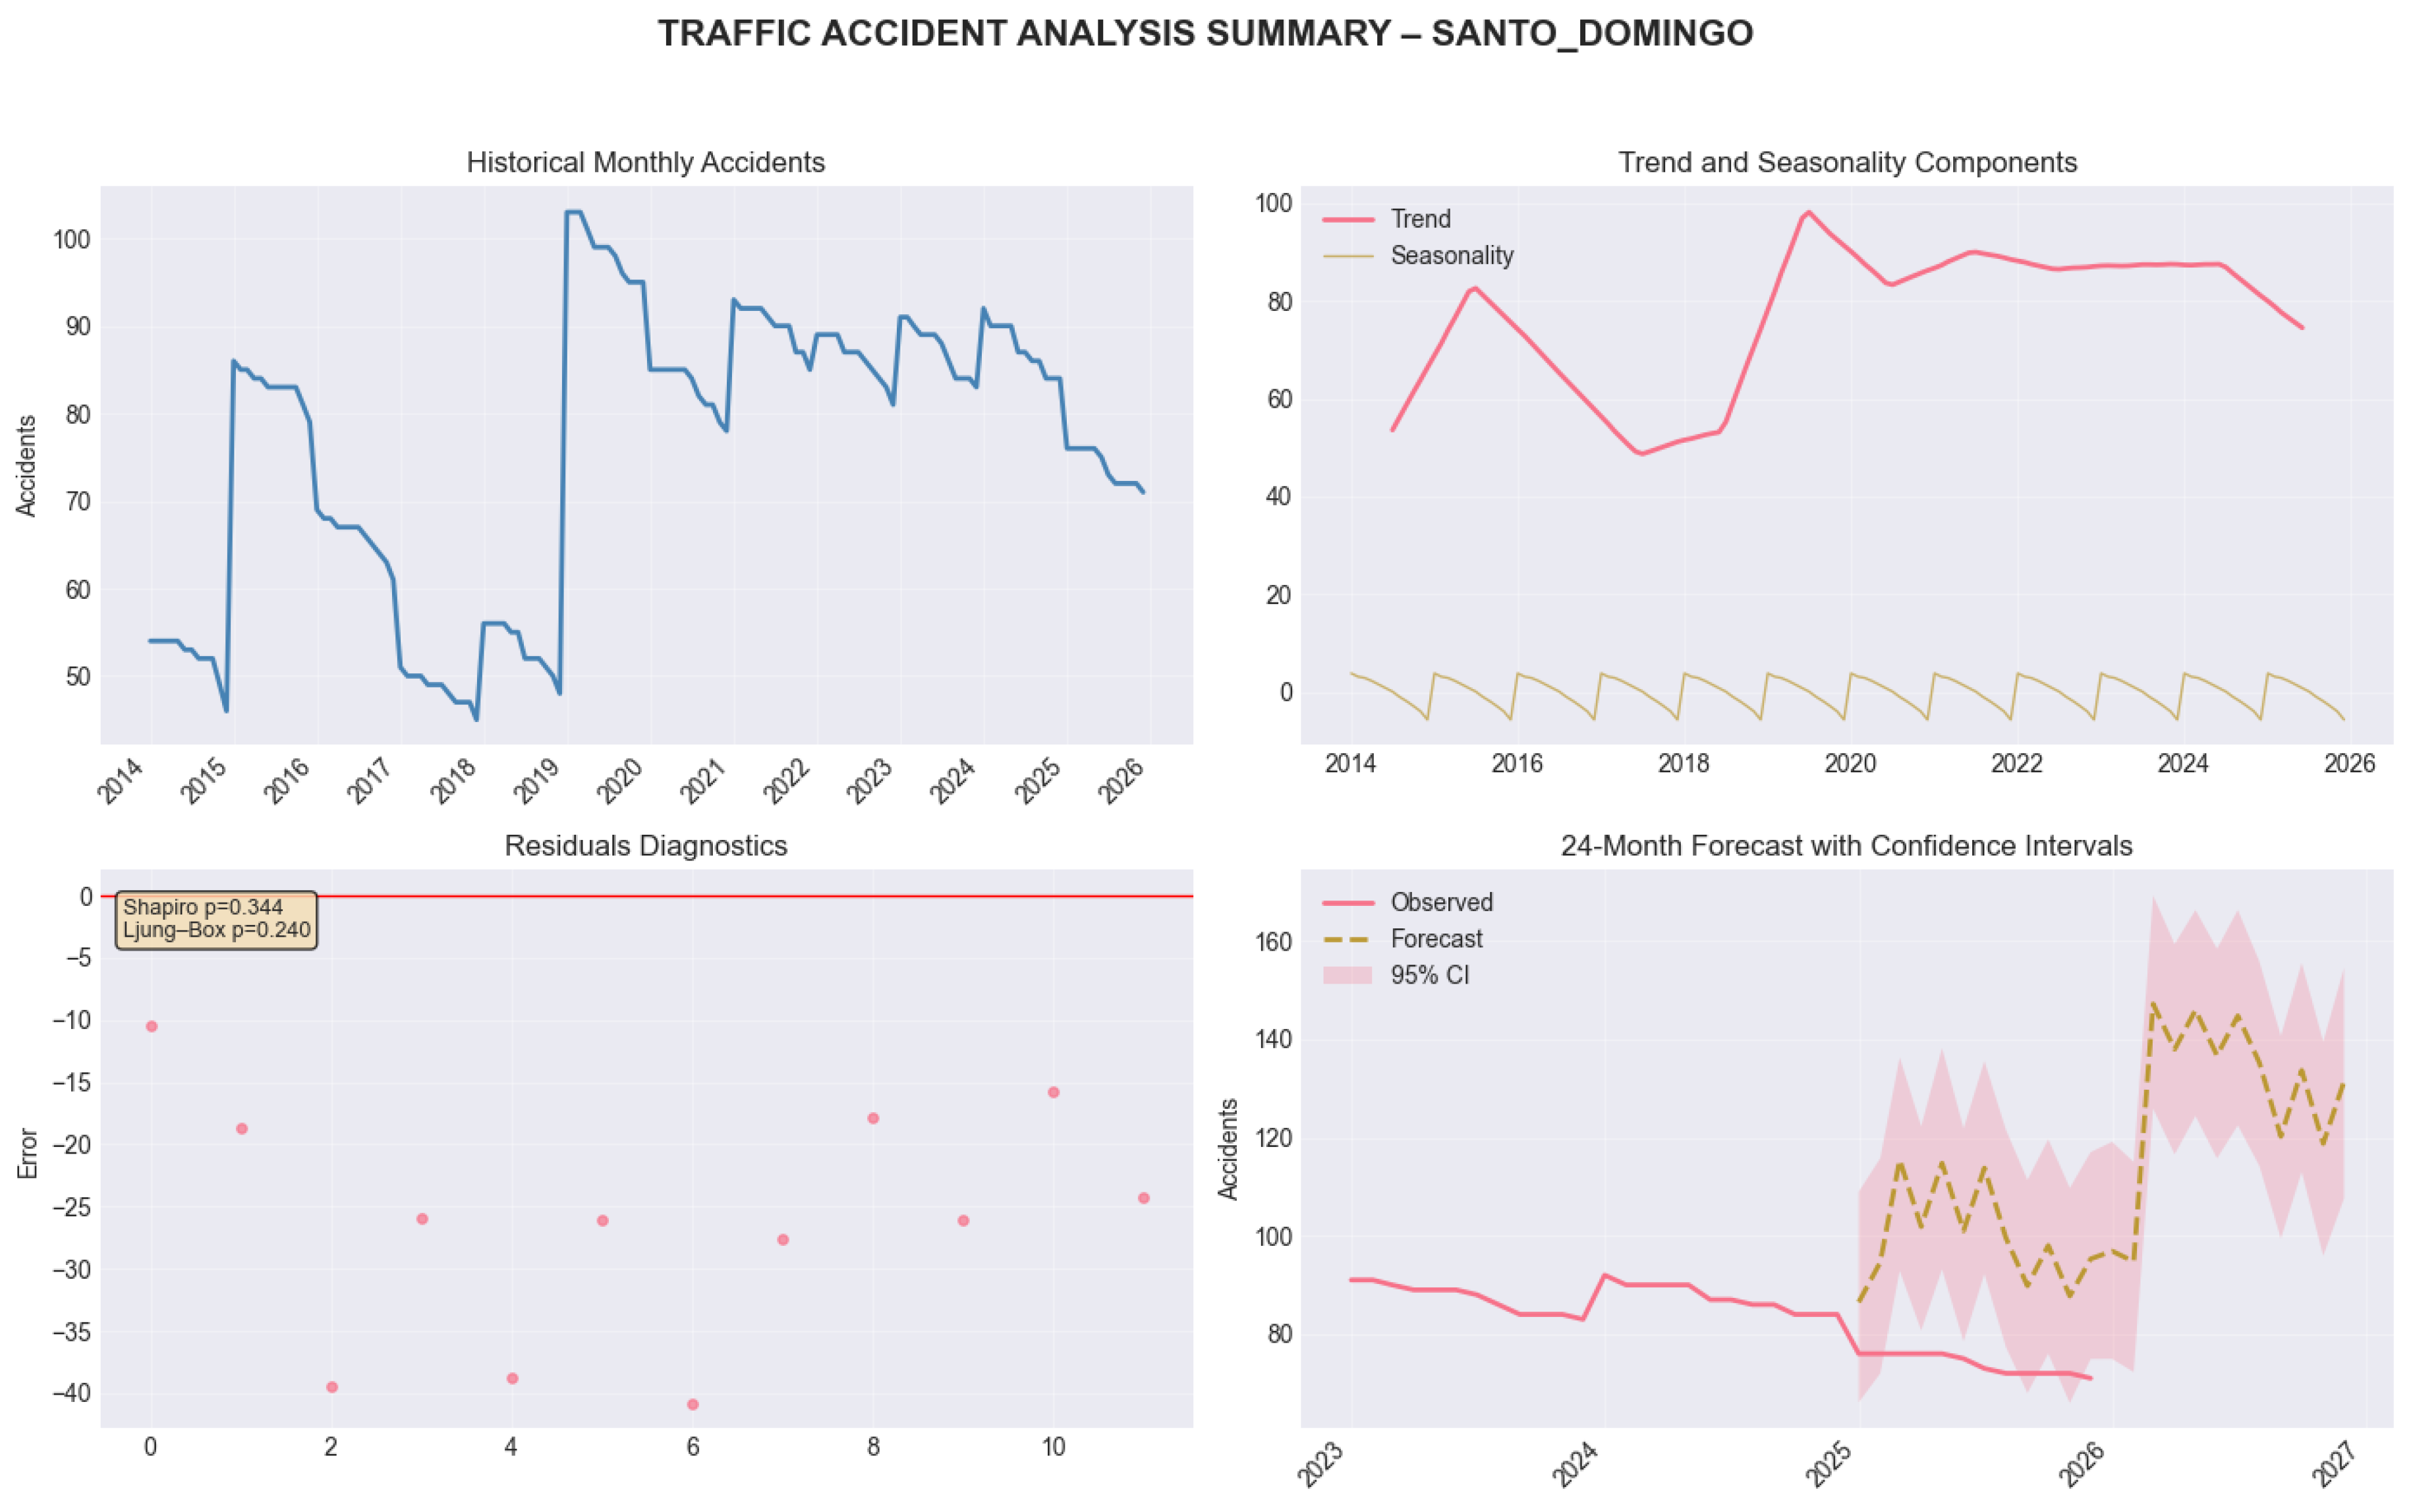
Figure 12.
Historical monthly accidents, trend/seasonality decomposition, residual diagnostics, and 24-month predictive forecast for Tungurahua.
Figure 12.
Historical monthly accidents, trend/seasonality decomposition, residual diagnostics, and 24-month predictive forecast for Tungurahua.
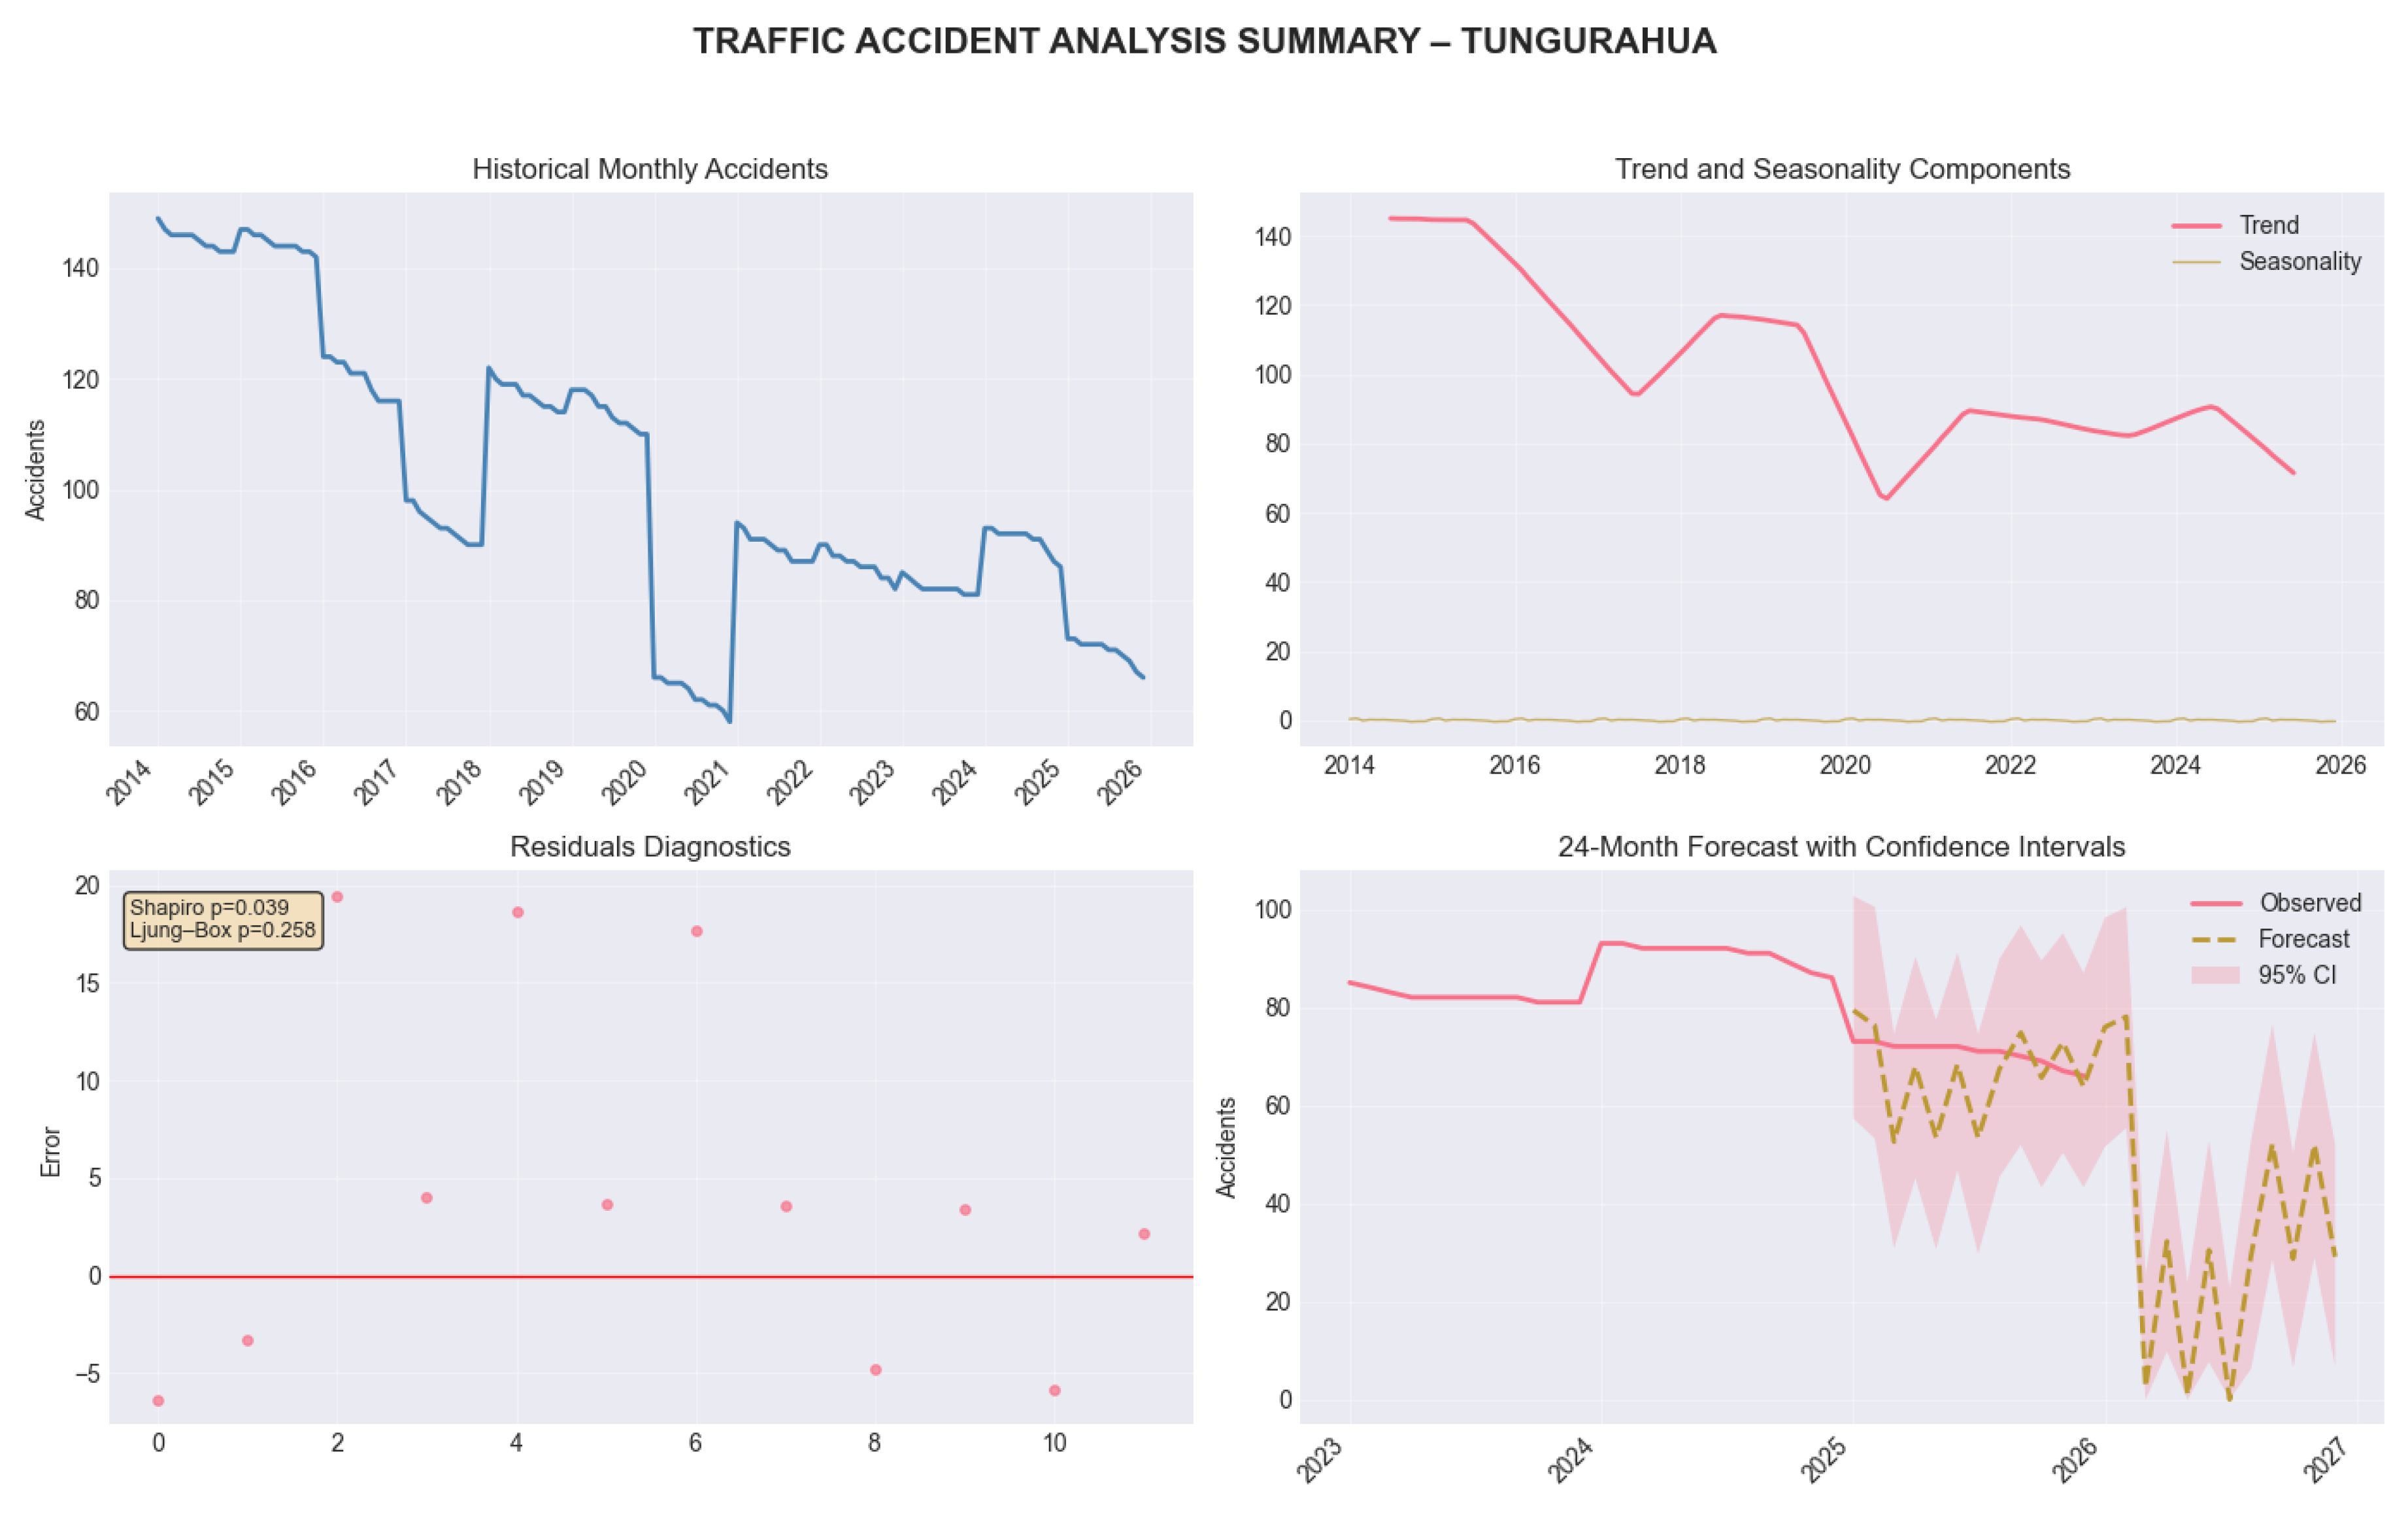
Figure 13.
Heatmap of traffic accident distribution by province and cause in Ecuador. The figure highlights the strong spatial heterogeneity of accident incidence and the dominance of vehicle-to-vehicle collisions and pedestrian crashes in highly urbanized provinces.
Figure 13.
Heatmap of traffic accident distribution by province and cause in Ecuador. The figure highlights the strong spatial heterogeneity of accident incidence and the dominance of vehicle-to-vehicle collisions and pedestrian crashes in highly urbanized provinces.
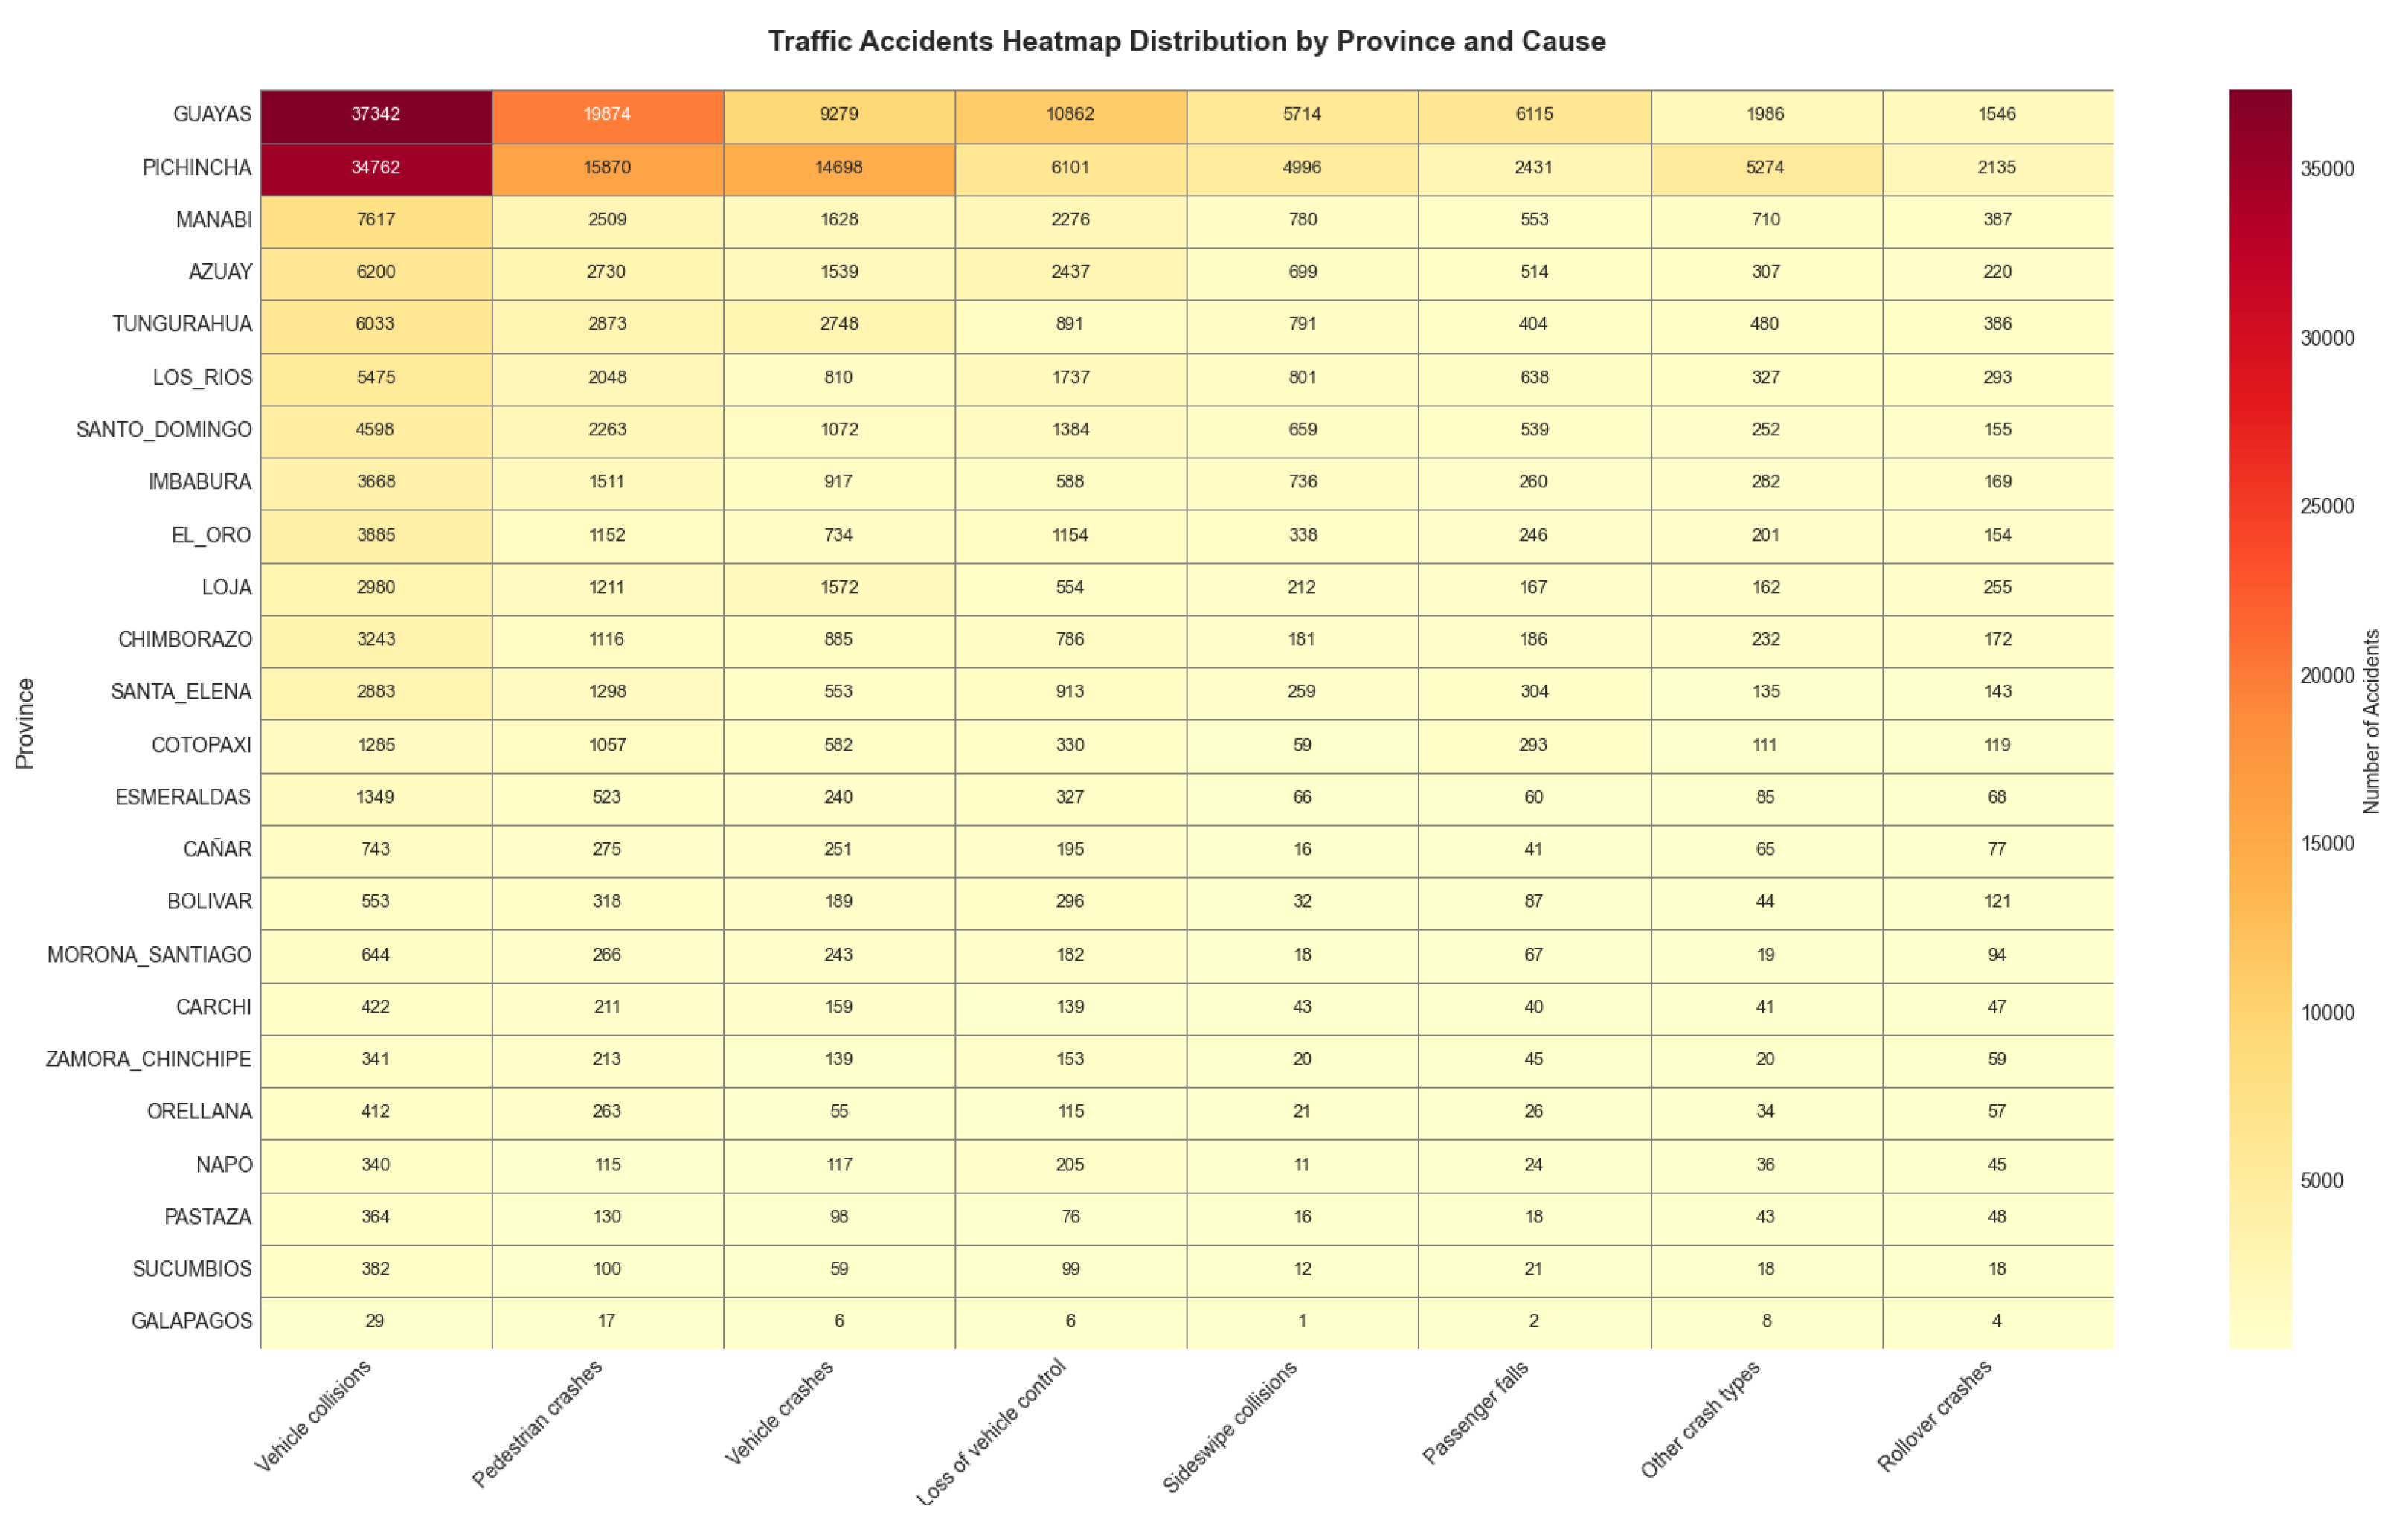
Figure 14.
Comparative evaluation of the Prophet model across provinces: (a) total historical accidents, (b) predictive performance ranked by MAPE, (c) empirical coverage of 95% confidence intervals, and (d) aggregated 24-month accident forecasts. The figure highlights the relationship between historical accident volume, forecast uncertainty, and model reliability.
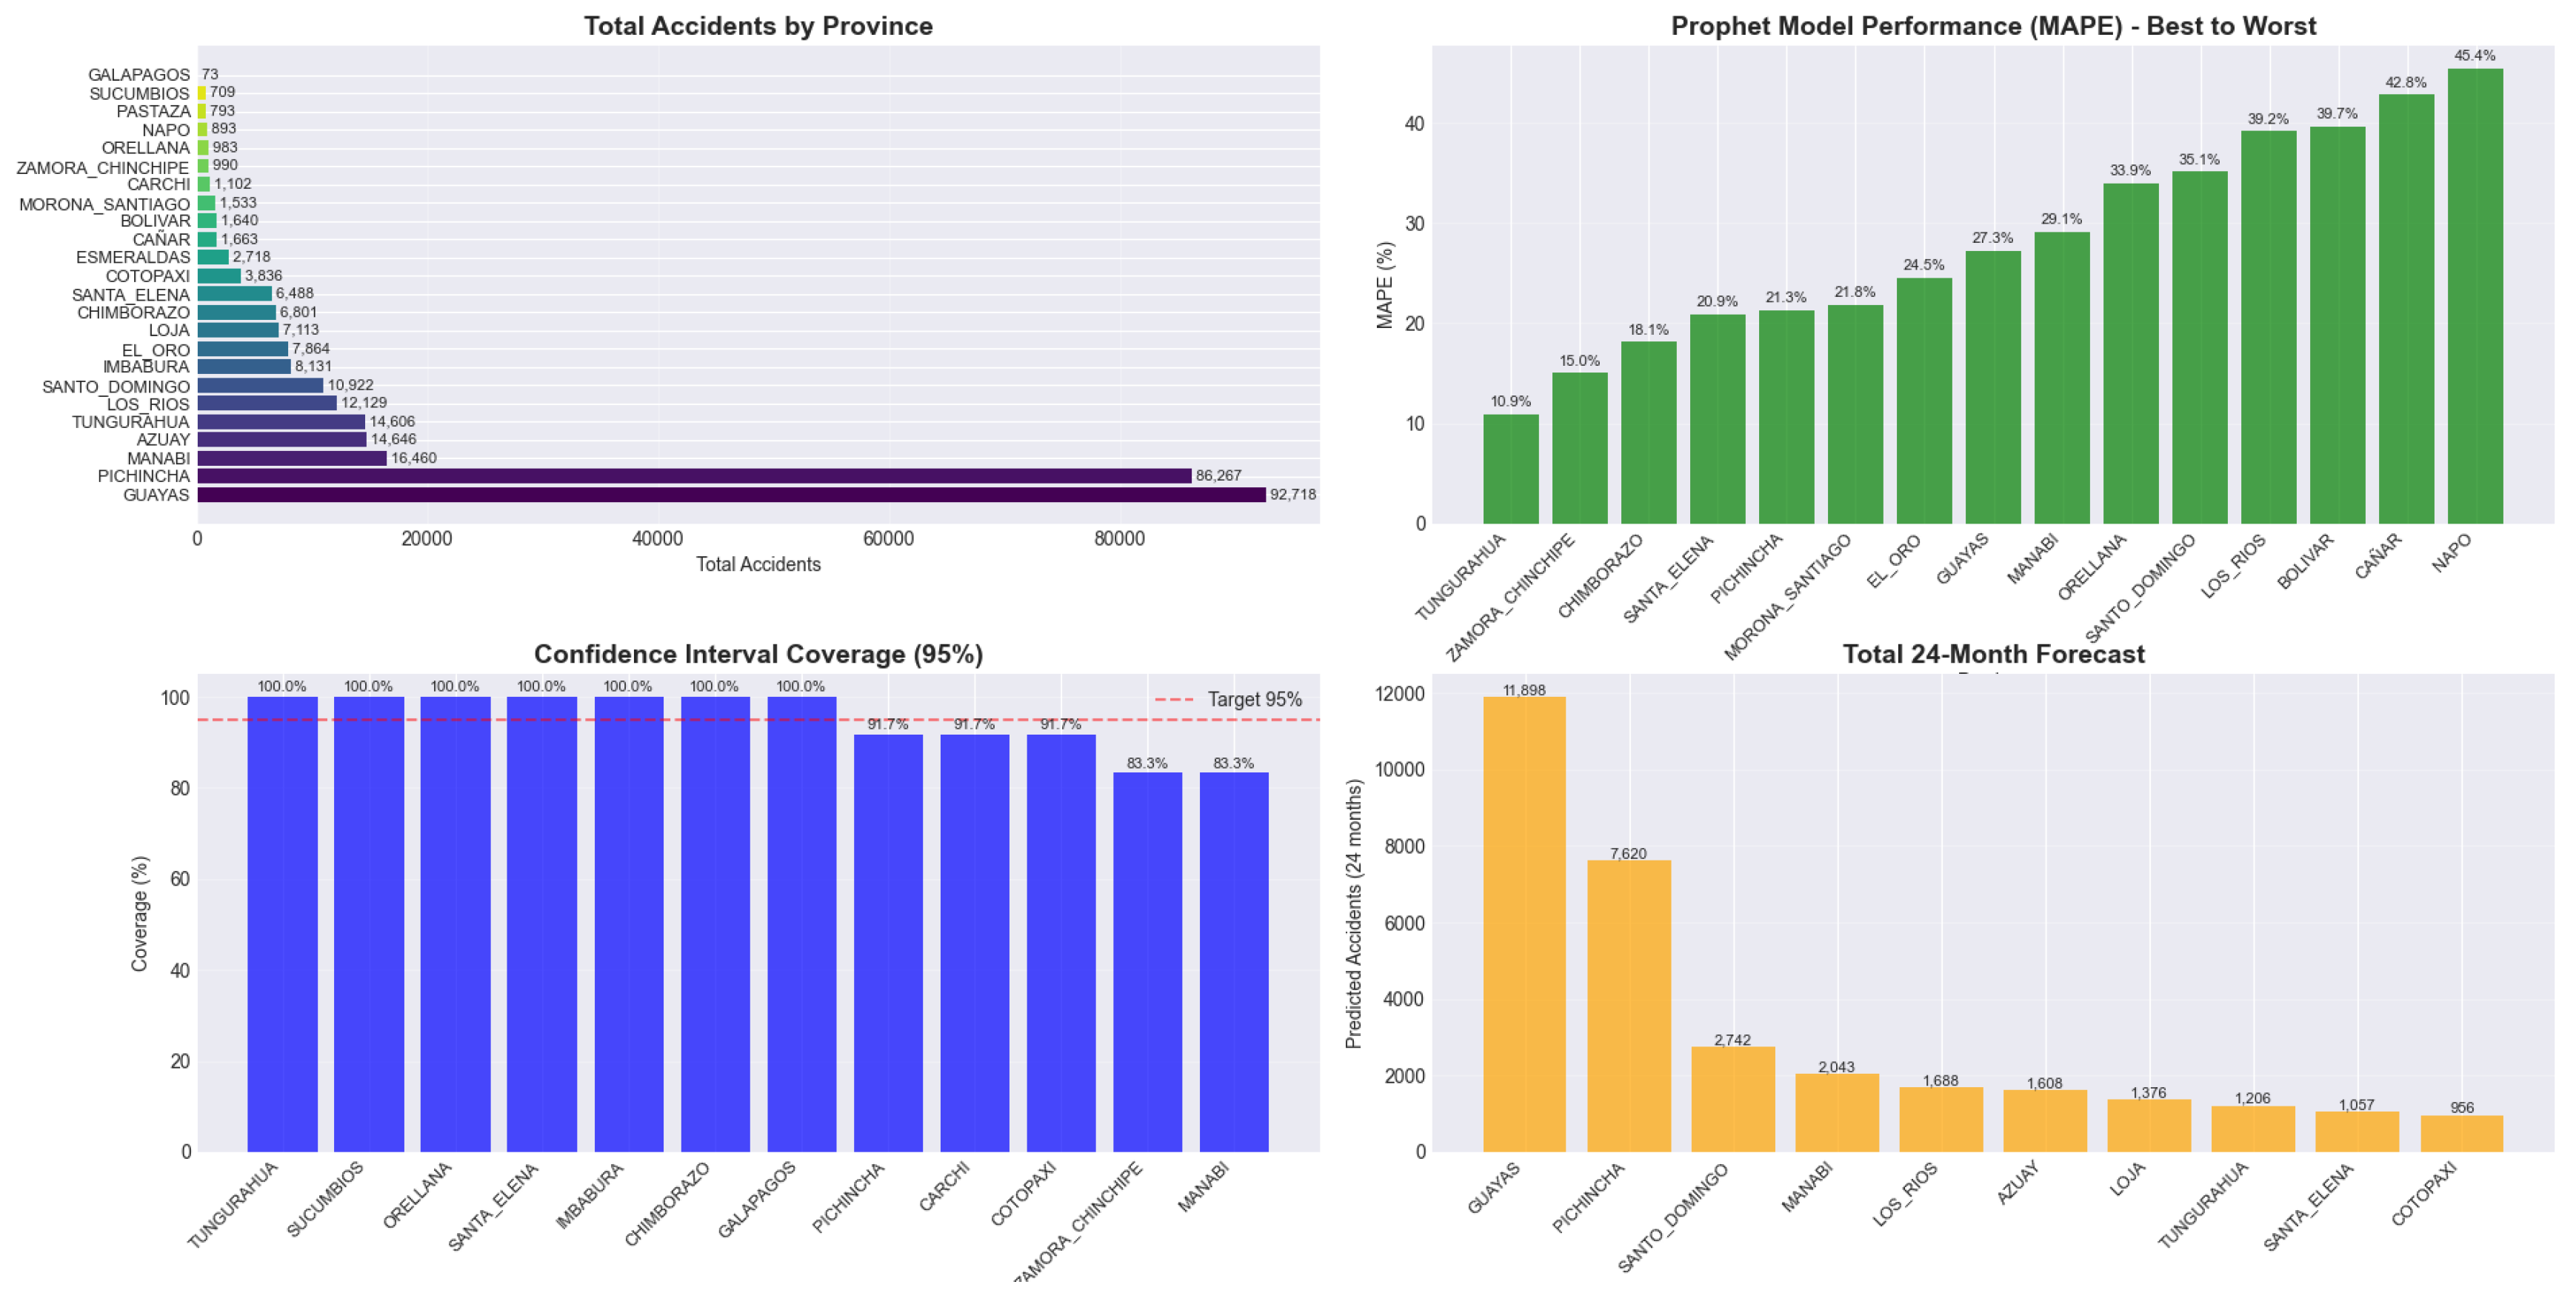
Figure 15.
Twenty-four-month forecast trends of projected traffic accident incidence across provinces.
Figure 15.
Twenty-four-month forecast trends of projected traffic accident incidence across provinces.
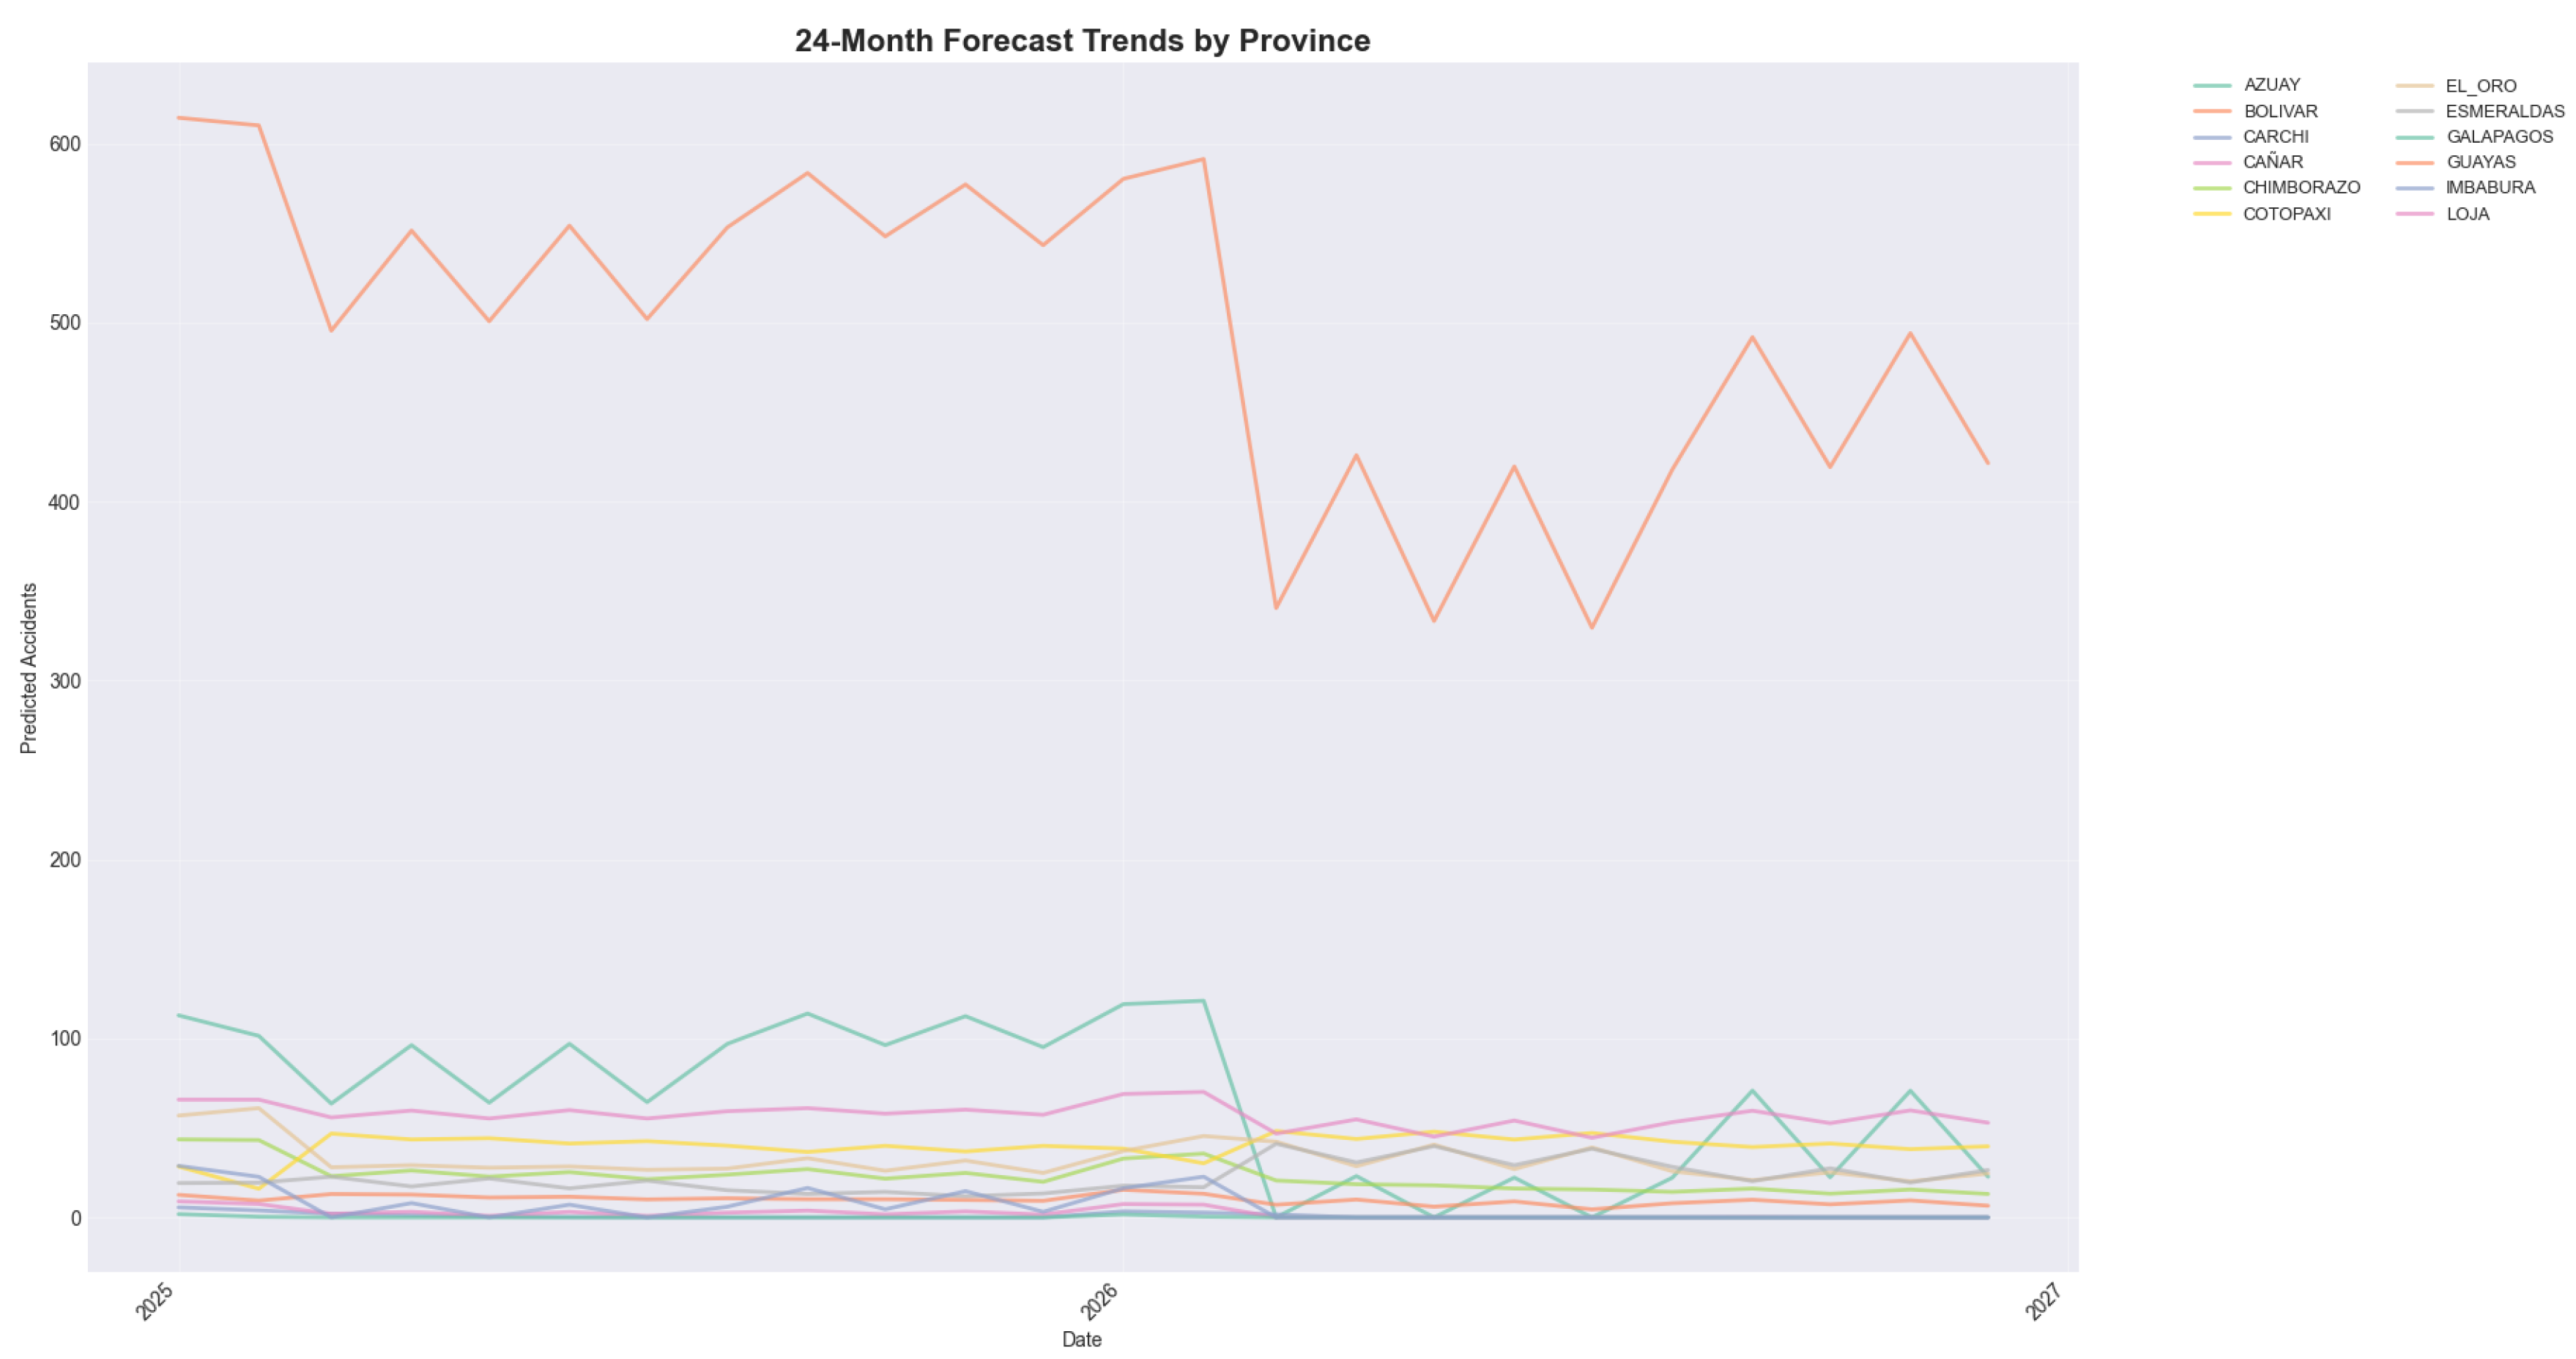
Figure 16.
Heatmap of 12-month provincial traffic accident forecasts, illustrating spatial concentration and temporal variation in predicted incidence.
Figure 16.
Heatmap of 12-month provincial traffic accident forecasts, illustrating spatial concentration and temporal variation in predicted incidence.
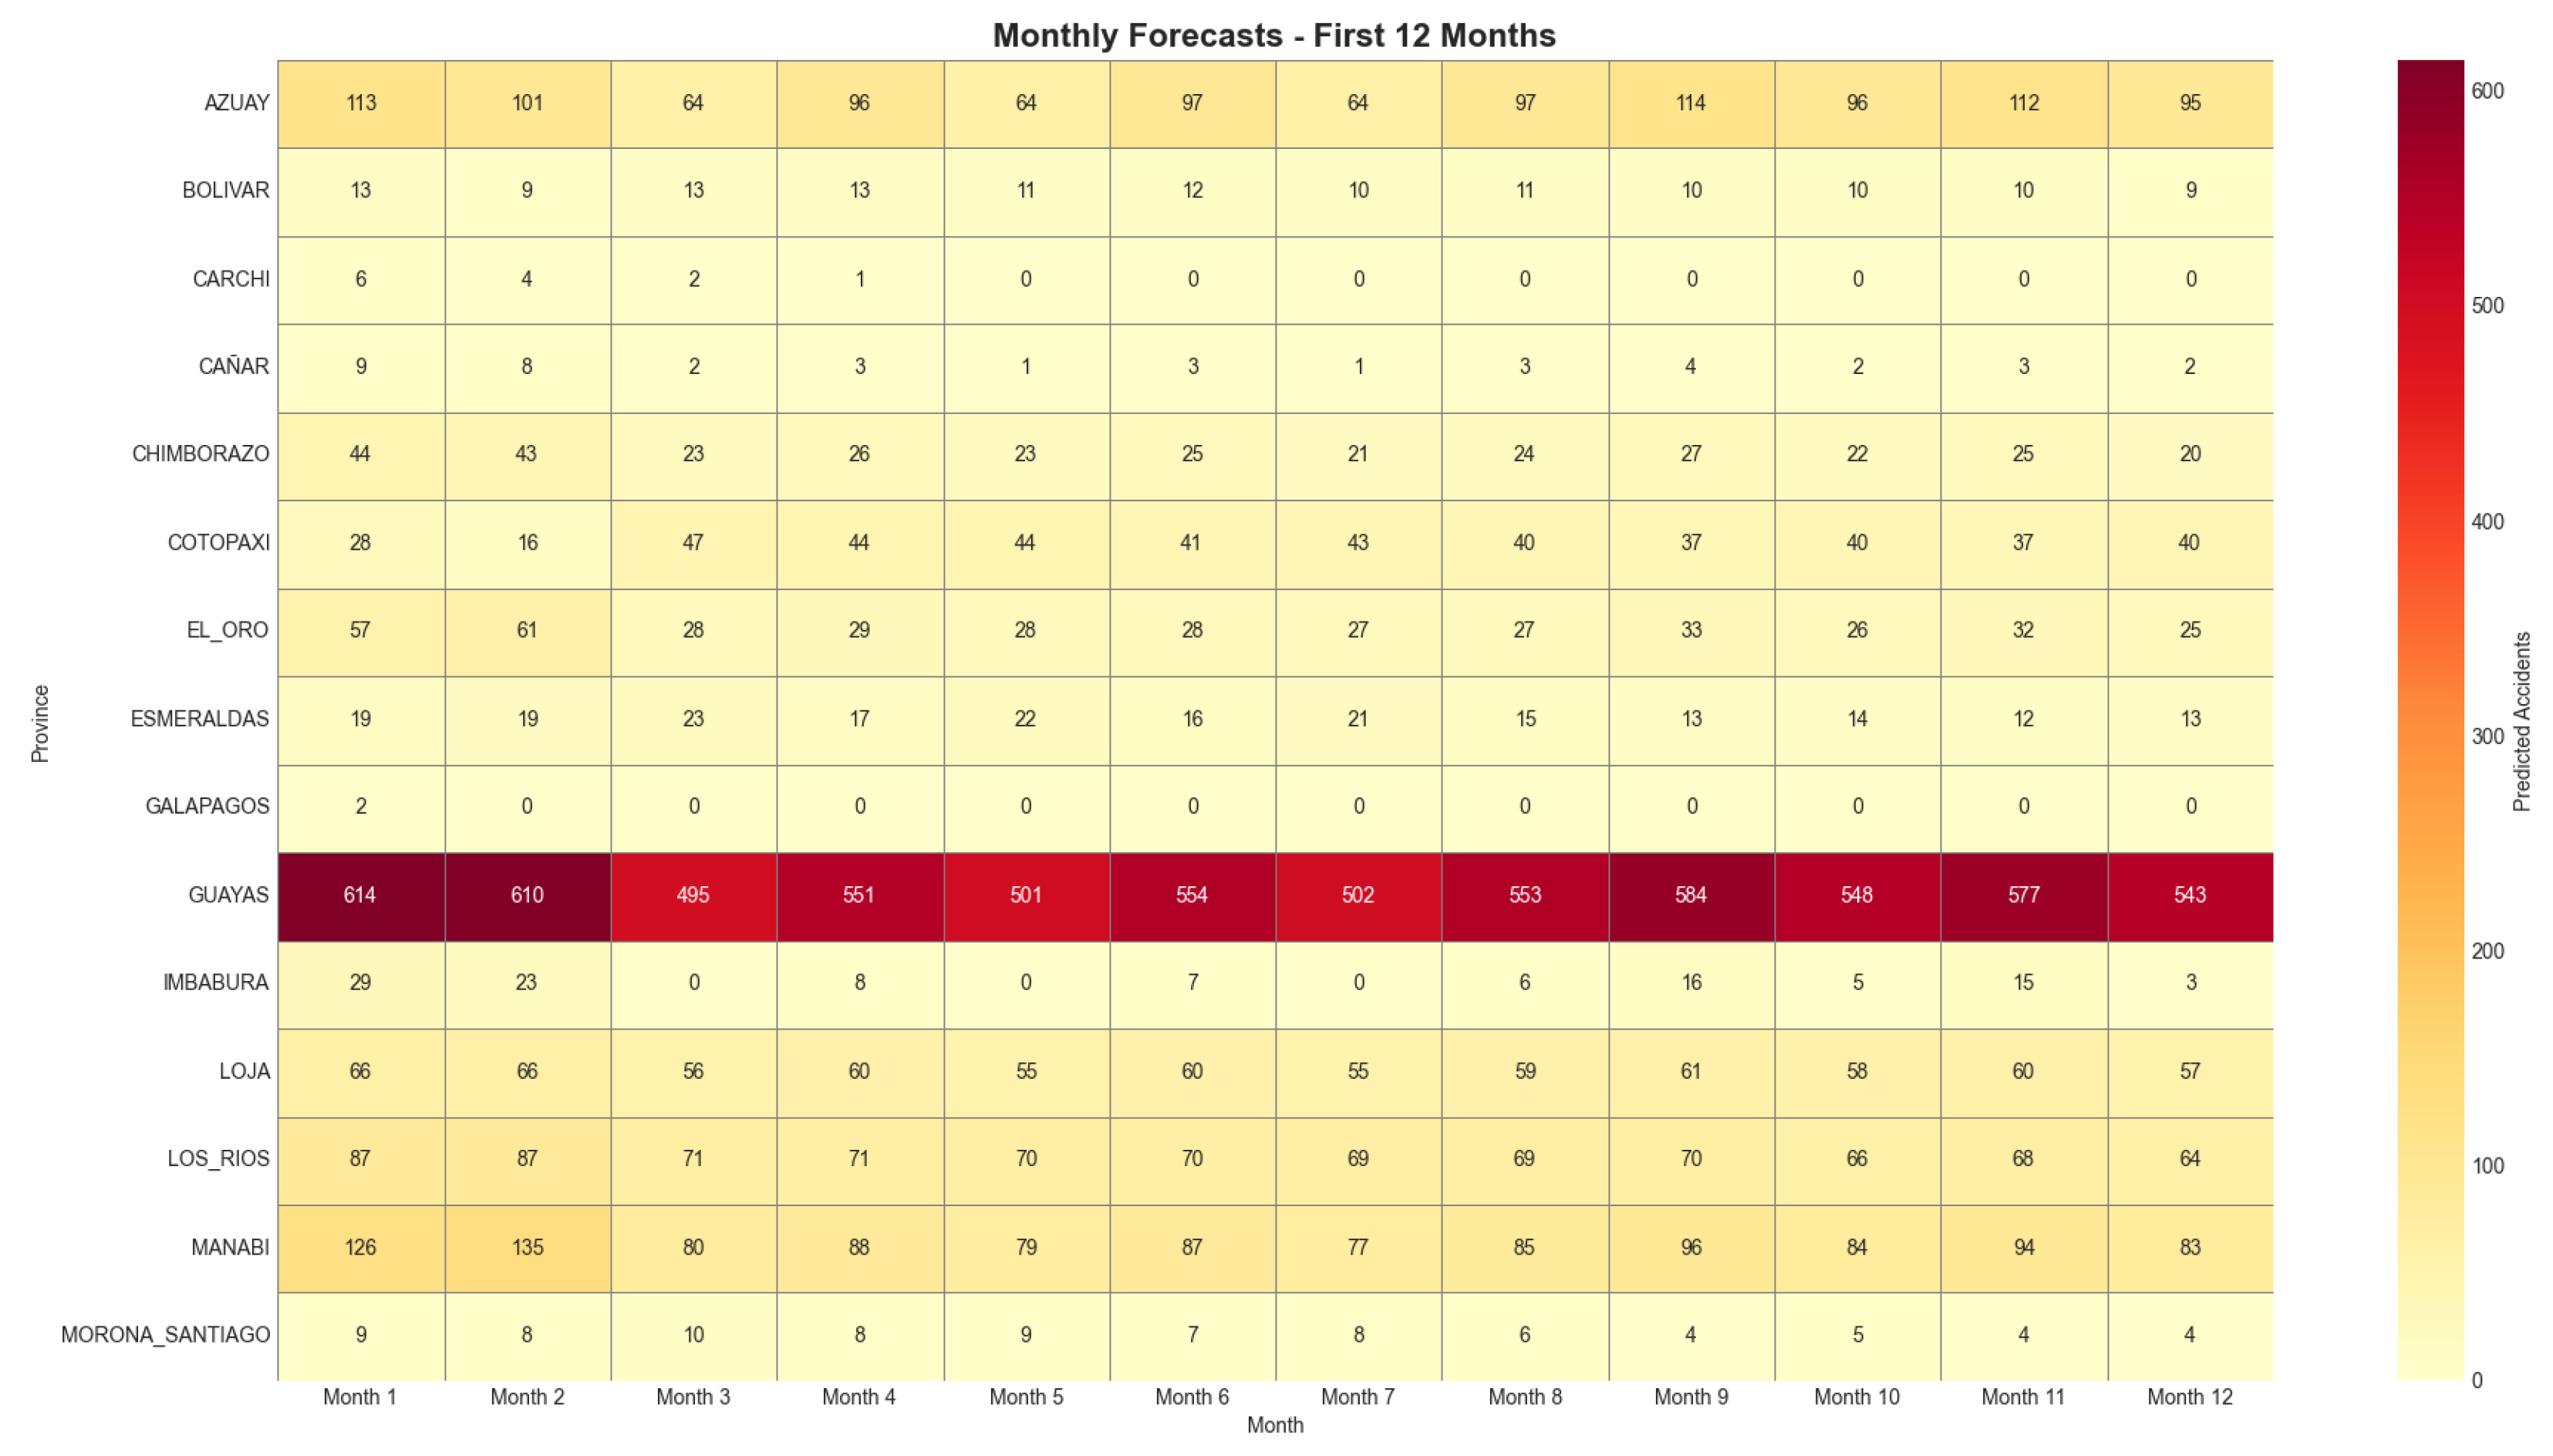

Table 1.
General characteristics of the traffic accident dataset (Ecuador, 2014–2025).
| Indicator | Value |
|---|---|
| Total records | 27,648 |
| Analyzed provinces | 24 |
| Study period | January 2014 – December 2025 |
| Temporal frequency | Monthly |
| Total historical accidents | >260,000 (approx.) |
| Forecast horizon | 24 months |
Table 2.
Provinces with the highest historical number of traffic accidents (2014–2026).
| Province | Historical Total | Monthly Average |
|---|---|---|
| Guayas | 92,718 | 643.9 |
| Pichincha | 86,267 | 599.1 |
| Manabí | 16,460 | 114.3 |
| Azuay | 14,646 | 101.7 |
| Tungurahua | 14,606 | 101.4 |
Table 3.
Provinces with the lowest historical number of traffic accidents (2014–2026).
| Province | Historical Total | Monthly Average |
|---|---|---|
| Galápagos | 73 | 0.5 |
| Sucumbíos | 709 | 4.9 |
| Pastaza | 793 | 5.5 |
| Napo | 893 | 6.2 |
| Orellana | 983 | 6.8 |
Table 4.
Best-performing provinces according to Mean Absolute Percentage Error (MAPE).
| Province | MAPE (%) | Forecast quality |
|---|---|---|
| Tungurahua | 10.9 | Excellent |
| Zamora Chinchipe | 15.0 | Very good |
| Chimborazo | 18.1 | Good |
| Santa Elena | 20.9 | Good |
| Pichincha | 21.3 | Good |
Table 5.
Worst-performing provinces according to Mean Absolute Percentage Error (MAPE).
| Province | MAPE (%) | Diagnostic assessment |
|---|---|---|
| Esmeraldas | 118.8 | Highly unstable |
| Azuay | 98.1 | High uncertainty |
| Carchi | 76.1 | Highly volatile |
| Pastaza | 74.0 | Low signal strength |
| Loja | 64.3 | Changing trend |
Table 6.
Empirical coverage of 95% confidence intervals by province.
| Coverage status | Provinces |
|---|---|
| Adequate (>= 90%) | Tungurahua, Chimborazo, Pichincha, Santa Elena |
| Underestimated | Azuay, Loja, Los Ríos, Esmeraldas |
| Overestimated | Carchi, Cotopaxi, Galápagos |
Table 7.
Provincial classification by projected 24-month trend.
| Trend category | Representative provinces |
|---|---|
| Strongly decreasing | Guayas, Pichincha, Manabí, Azuay |
| Stable | Santa Elena, Zamora Chinchipe |
| Moderately increasing | Loja, Esmeraldas |
| Strongly increasing | Cotopaxi, Santo Domingo |
Table 8.
High-priority provinces for targeted road safety intervention.
| Province | Annual change | Rationale for priority |
|---|---|---|
| Cotopaxi | +49.6% | Sustained high growth rate |
| Santo Domingo | +50.6% | Rapid acceleration in projected incidence |
| Loja | +16.1% | Consistent upward trend |
| Esmeraldas | +19.3% | High forecast variability and increase |
Table 9.
Total forecasted accidents over the 24-month horizon for the ten highest-incidence provinces.
Table 9.
Total forecasted accidents over the 24-month horizon for the ten highest-incidence provinces.
| Province | Forecasted accidents |
|---|---|
| Guayas | 11,898 |
| Pichincha | 7,620 |
| Santo Domingo | 2,742 |
| Manabí | 2,043 |
| Los Ríos | 1,688 |
| Azuay | 1,608 |
| Loja | 1,376 |
| Tungurahua | 1,206 |
| Santa Elena | 1,057 |
| Cotopaxi | 956 |
Table 10.
Comparative model performance: Prophet versus naïve benchmark (MASE).
| Performance category | Provinces |
|---|---|
| Outperforms benchmark (MASE < 1) | 17 provinces (70.8%) |
| Underperforms benchmark (MASE ≥ 1) | Azuay, Loja, Cotopaxi, Guayas |
Table 11.
Dominant causes of traffic accidents by province.
| Dominant cause | Provinces most affected |
|---|---|
| Vehicle collisions | Guayas, Pichincha, Manabí |
| Pedestrian accidents | Guayas, Pichincha, Azuay |
| Loss of vehicle control | Azuay, Tungurahua, Loja |
| Rollovers | Amazonian provinces (e.g., Morona Santiago, Napo) |
Table 12.
Integrated synthesis for road safety policy and intervention planning.
| Aspect | Key finding / implication |
|---|---|
| Critical provinces | Guayas, Pichincha, Santo Domingo (highest absolute burden and sustained high incidence) |
| Emerging risk provinces | Cotopaxi, Loja (strong or consistent upward forecast trends) |
| Stable / low-risk provinces | Santa Elena, Zamora Chinchipe (consistently low or stable projections) |
| Model utility | High for strategic, province-level planning; caution required in highly volatile series |
| Principal forecast risk | Potential underestimation of uncertainty in rapidly growing or unstable contexts |
| Recommended focus | Targeted interventions in high-burden areas; preventive measures in emerging hotspots |
Disclaimer/Publisher’s Note: The statements, opinions and data contained in all publications are solely those of the individual author(s) and contributor(s) and not of MDPI and/or the editor(s). MDPI and/or the editor(s) disclaim responsibility for any injury to people or property resulting from any ideas, methods, instructions or products referred to in the content. |
© 2026 by the authors. Licensee MDPI, Basel, Switzerland. This article is an open access article distributed under the terms and conditions of the Creative Commons Attribution (CC BY) license (http://creativecommons.org/licenses/by/4.0/).
Copyright: This open access article is published under a Creative Commons CC BY 4.0 license, which permit the free download, distribution, and reuse, provided that the author and preprint are cited in any reuse.


