
Submitted:
13 January 2026
Posted:
13 January 2026
You are already at the latest version
Abstract
Student dropout remains a critical challenge for higher education institutions, with significant implications for resource allocation, academic planning, and institutional sustainability. This study applies machine learning techniques to predict student non-continuation and attrition, with the objective of supporting data-driven retention strategies. Using a publicly available higher education student dataset (4,424 records, 34 features, multi-class outcome), a structured analytical pipeline was implemented, incorporating Winsorization for outlier mitigation, SMOTE for class imbalance handling, and targeted feature engineering. Model performance was assessed using a 5-fold nested cross-validation framework. Four classifiers, Extra Trees, Random Forest, Gradient Boosting, and Logistic Regression, were trained on an optimized subset of 28 features. Among these, the Extra Trees model achieved the strongest performance, attaining a mean AUC of 0.96 (±0.0053) and an accuracy of 87.4% (±0.012). Model interpretability was enhanced through SHAP analysis, which identified cumulative approved academic units and tuition fee payment status as the most influential predictors of student outcomes. The findings underscore the value of early predictive analytics for informing proactive institutional interventions, particularly in academic monitoring and financial support, to strengthen student retention frameworks.
Keywords:
student retention
; machine learning
; predictive modelling
; Extra Trees
; SHAP
; higher education analytics
Introduction
Student retention in higher education remains a persistent global challenge, with substantial implications for institutional sustainability, public funding efficiency, and workforce development. Rising withdrawal rates underscore the scale of this issue; for example, the UK Student Loans Company reported 39,405 student withdrawals during the 2021/2022 academic year [7]. In some higher education contexts, dropout rates have been reported to exceed 25%, frequently associated with increasing socio-economic pressures that compel students to prioritise financial survival over academic progression [6].
Student dropout reflects a complex failure to persist, influenced by a combination of academic underperformance, financial hardship, social and behavioural factors, and insufficient institutional support mechanisms [4]. Elevated attrition rates not only impose financial and operational burdens on universities but also negatively affect institutional reputation and long-term labour market outcomes, with broader implications for national economic productivity [8]. Institutions exhibiting persistently low retention rates, such as Wilmington University (60%) and Texas Southern University (52%) in the United States, continue to face substantial pressure to enhance student persistence and completion outcomes [1].
Accurate prediction and early identification of students at risk of non-continuation are therefore essential for enabling timely and targeted interventions. However, traditional statistical approaches often struggle to model the high-dimensional, non-linear relationships present in contemporary educational datasets [10,11]. In response, this study employs advanced machine learning techniques to improve predictive accuracy and robustness in student retention modelling. Both tree-based ensemble methods and linear classifiers are utilised to capture complex interactions within a comprehensive multi-class dataset encompassing academic, socio-economic, and financial attributes.
The study is guided by the following research questions:
- RQ1: Which predictors exert the greatest influence on student retention outcomes in a multi-class higher education context?
- RQ2: Which machine learning model demonstrates the strongest predictive performance, robustness, and generalisability for multi-class student retention prediction?
Contributions
This study makes several key contributions to the literature on student retention prediction in higher education. First, it develops a robust machine learning framework for multi-class student retention prediction, evaluated using a nested cross-validation strategy to ensure reliable generalization and mitigate optimistic performance bias. Second, through a comparative assessment of ensemble and linear classifiers, the study demonstrates the superior performance of the Extra Trees model, achieving an accuracy of 87.4% and an AUC of 0.96 using an optimized subset of 28 features. Third, the analysis systematically examines feature subset variation and shows that predictive performance does not necessarily improve with aggressive feature reduction, underscoring the importance of empirical feature optimisation. Ultimately, the integration of SHAP-based interpretability offers transparent, class-specific explanations of model behaviour, revealing the combined influence of early academic performance and financial stability on student persistence.
Related Literature
Student retention in higher education has been extensively studied using both traditional statistical techniques and, more recently, machine learning approaches. Prior research has explored a wide range of predictive models, datasets, and feature engineering strategies aimed at identifying students at risk of dropout and supporting data-driven retention interventions. Despite this growing body of work, substantial variation persists in terms of methodological rigor, dataset characteristics, validation strategies, and the extent to which model interpretability is incorporated. In particular, many studies prioritize predictive accuracy without adequately addressing class imbalance, model generalizability, or the transparency of prediction outcomes.
To systematically examine existing approaches and identify methodological and interpretability gaps in multi-class student retention prediction, a structured literature review was conducted in accordance with the PRISMA 2020 guidelines [17]. Records were identified through structured searches of Scopus and Google Scholar, followed by duplicate removal, title and abstract screening, and full-text eligibility assessment based on predefined inclusion and exclusion criteria. The review critically evaluated prior studies in terms of the machine learning models employed, dataset size and feature composition, and strategies for addressing class imbalance, evaluation metrics, and the application of explainable artificial intelligence techniques. The insights derived from this process directly informed the methodological design of the present study, including the selection of ensemble learning models and the adoption of SHAP-based interpretability. The study selection process is summarized in Figure 1.
The studies summarised in Table 1 represent a focused subset of the 33 articles included in the qualitative synthesis, selected to illustrate recurring methodological limitations and interpretability gaps that are directly relevant to the present study. While the broader literature demonstrates substantial interest in applying machine learning to student retention prediction, notable inconsistencies remain in modelling strategies, feature coverage, evaluation practices, and transparency.
Recent studies consistently identify academic performance as the strongest predictor of student continuation and success [11]. A variety of algorithms, including KNN, Logistic Regression, Support Vector Machines, Feedforward Neural Networks, Random Forests, and Gradient Boosting, have achieved competitive predictive accuracy. However, most of these studies provide limited analysis of non-academic predictors. In particular, the influence of demographic, socio-economic, and financial variables on predictive outcomes remains insufficiently examined. This narrow feature focus constrains interpretability and limits understanding of the multifaceted drivers of student retention.
Using a substantially larger dataset (50,095 records), one study implemented a rigorous preprocessing pipeline incorporating SMOTE-based class balancing and feature scaling [12]. Despite this methodological sophistication, the highest reported AUC was 0.75 using Random Forest, indicating moderate discriminatory capability. Moreover, the absence of model-agnostic interpretability methods, such as SHAP, restricted insight into how individual predictors contributed to model decisions, thereby limiting the practical applicability of the findings for institutional intervention design.
Other studies employing comparable multi-class datasets (Dropout, Enrol, Graduate) exhibit recurring methodological weaknesses. Some reported exceptionally high accuracies, up to 94%, without addressing class imbalance, resulting in models biased toward majority classes and therefore not genuinely predictive [13]. In contrast, another study using a similar dataset achieved approximately 70% accuracy with Random Forest [5], highlighting how inadequate handling of imbalance can substantially degrade performance. Across these studies, reliance on Accuracy as the sole evaluation metric remains common, with limited use of more informative measures such as AUC or F1-score, reducing the robustness and comparability of reported results.
Studies focused on binary classification problems (dropout versus non-dropout) frequently employ models such as Logistic Regression and K-Nearest Neighbours, often reporting strong predictive performance [3]. However, several of these studies are constrained by limited feature sets that exclude critical variables, including financial status and family background [16]. Additionally, the lack of comparison with more powerful ensemble methods, such as Extra Trees or Gradient Boosting, weakens confidence in identifying optimal modelling approaches for complex retention scenarios.
Following the PRISMA-guided review process, 33 peer-reviewed studies were identified as relevant to student retention prediction in higher education. From these, six representative studies were selected for detailed comparison in Table 1, as they exemplify common modelling practices, evaluation strategies, and recurring limitations observed across the literature. The table highlights persistent gaps related to feature coverage, class imbalance handling, validation rigour, and interpretability, which directly informed the methodological design of the present study.
Overall, the literature reveals several unresolved challenges. Existing approaches often prioritise academic variables while underrepresenting non-academic and financial factors known to influence persistence [34]. Methodological shortcomings, including limited preprocessing, inadequate treatment of class imbalance, and narrow evaluation metrics, remain widespread, particularly in multi-class settings. Furthermore, the limited adoption of explainable artificial intelligence techniques restricts transparency and reduces the real-world usability of predictive models. Addressing these gaps motivates the present study, which proposes an interpretable, rigorously validated machine learning framework for multi-class student retention prediction, integrating ensemble modelling, feature optimisation, and SHAP-based explanation.
Materials and Methods
Dataset Description
The dataset used in this study was obtained from the University of California, Irvine (UCI) Machine Learning Repository [18]. It was curated to support research on student dropout and academic success in higher education and contains detailed records of undergraduate students at the point of enrolment. The dataset includes academic performance indicators, demographic characteristics, and socio-economic attributes collected during the early stages of students’ academic trajectories.
A total of 4,424 student records were available, comprising 34 initial predictor variables and a three-class target outcome: Dropout, Enrolled, and Graduate. These outcome categories represent student status over a complete academic year spanning two semesters. The multi-class structure of the target variable enables a more realistic and granular analysis of student progression compared with binary retention formulations.
Methodological Framework
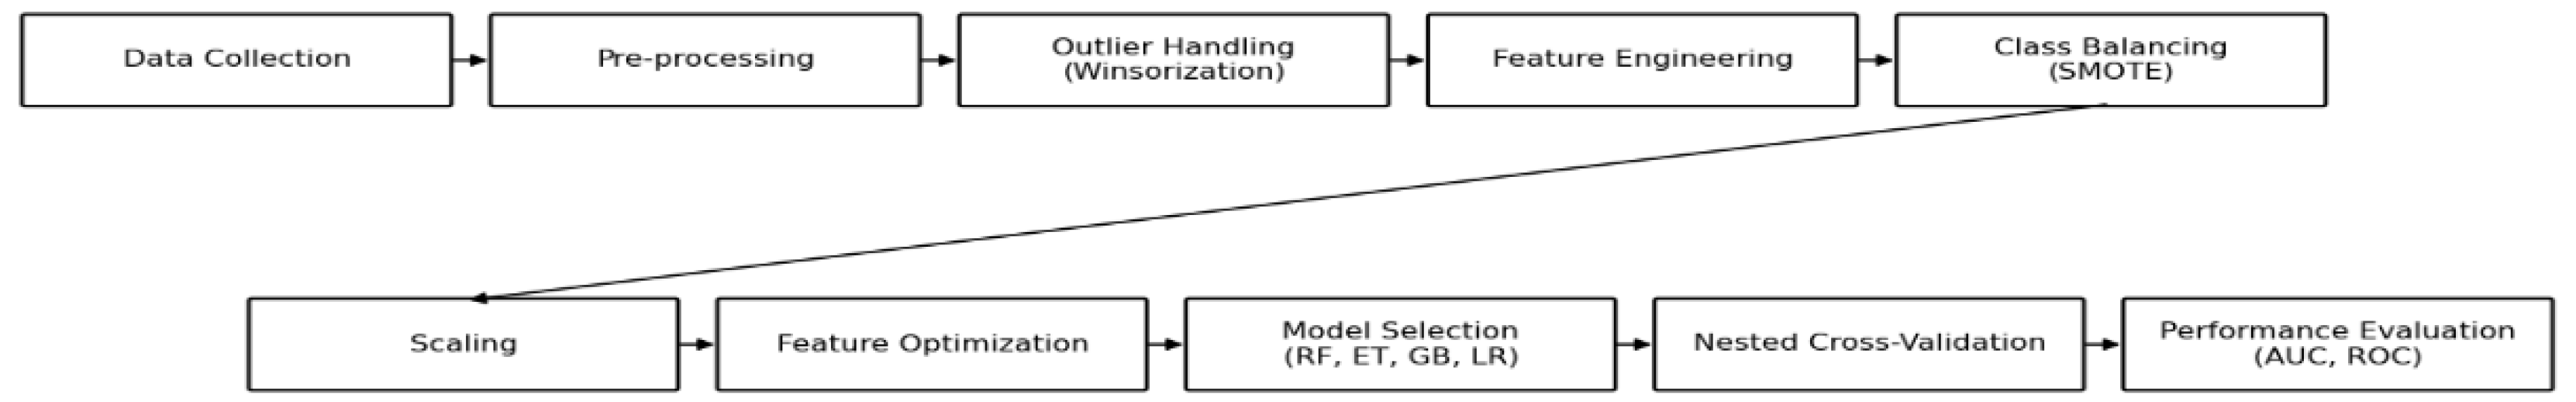
The methodological workflow followed a structured, multi-stage analytical pipeline designed to ensure robustness, generalisability, and interpretability. Following data acquisition, preprocessing procedures were applied, including Winsorization to reduce the influence of extreme outliers while preserving the underlying distribution of the data. Feature engineering was then performed, expanding the original set of 34 variables to 41 by generating additional academic and demographic predictors.
A feature optimisation stage subsequently reduced the expanded feature space to the most informative subset of 28 variables, balancing predictive performance and model complexity. To address class imbalance within the three-category target variable, the Synthetic Minority Oversampling Technique (SMOTE) was applied to the training data. Feature scaling was performed that required to ensure compatibility with distance-based and linear classifiers.
Model development and evaluation were conducted using a 5-fold nested cross-validation framework, enabling unbiased hyperparameter optimisation and reliable performance estimation. This rigorous validation strategy ensured that the final models were trained on the most relevant predictors and demonstrated strong generalisability in classifying student outcomes across all three retention categories.
Figure 2.
Schematic overview of the proposed methodological pipeline, illustrating the sequential workflow from data collection and preprocessing through outlier handling, feature engineering, class balancing, feature optimization, model selection, nested cross-validation, and performance evaluation.
Preprocessing: Outlier Handling, Encoding, and Scaling
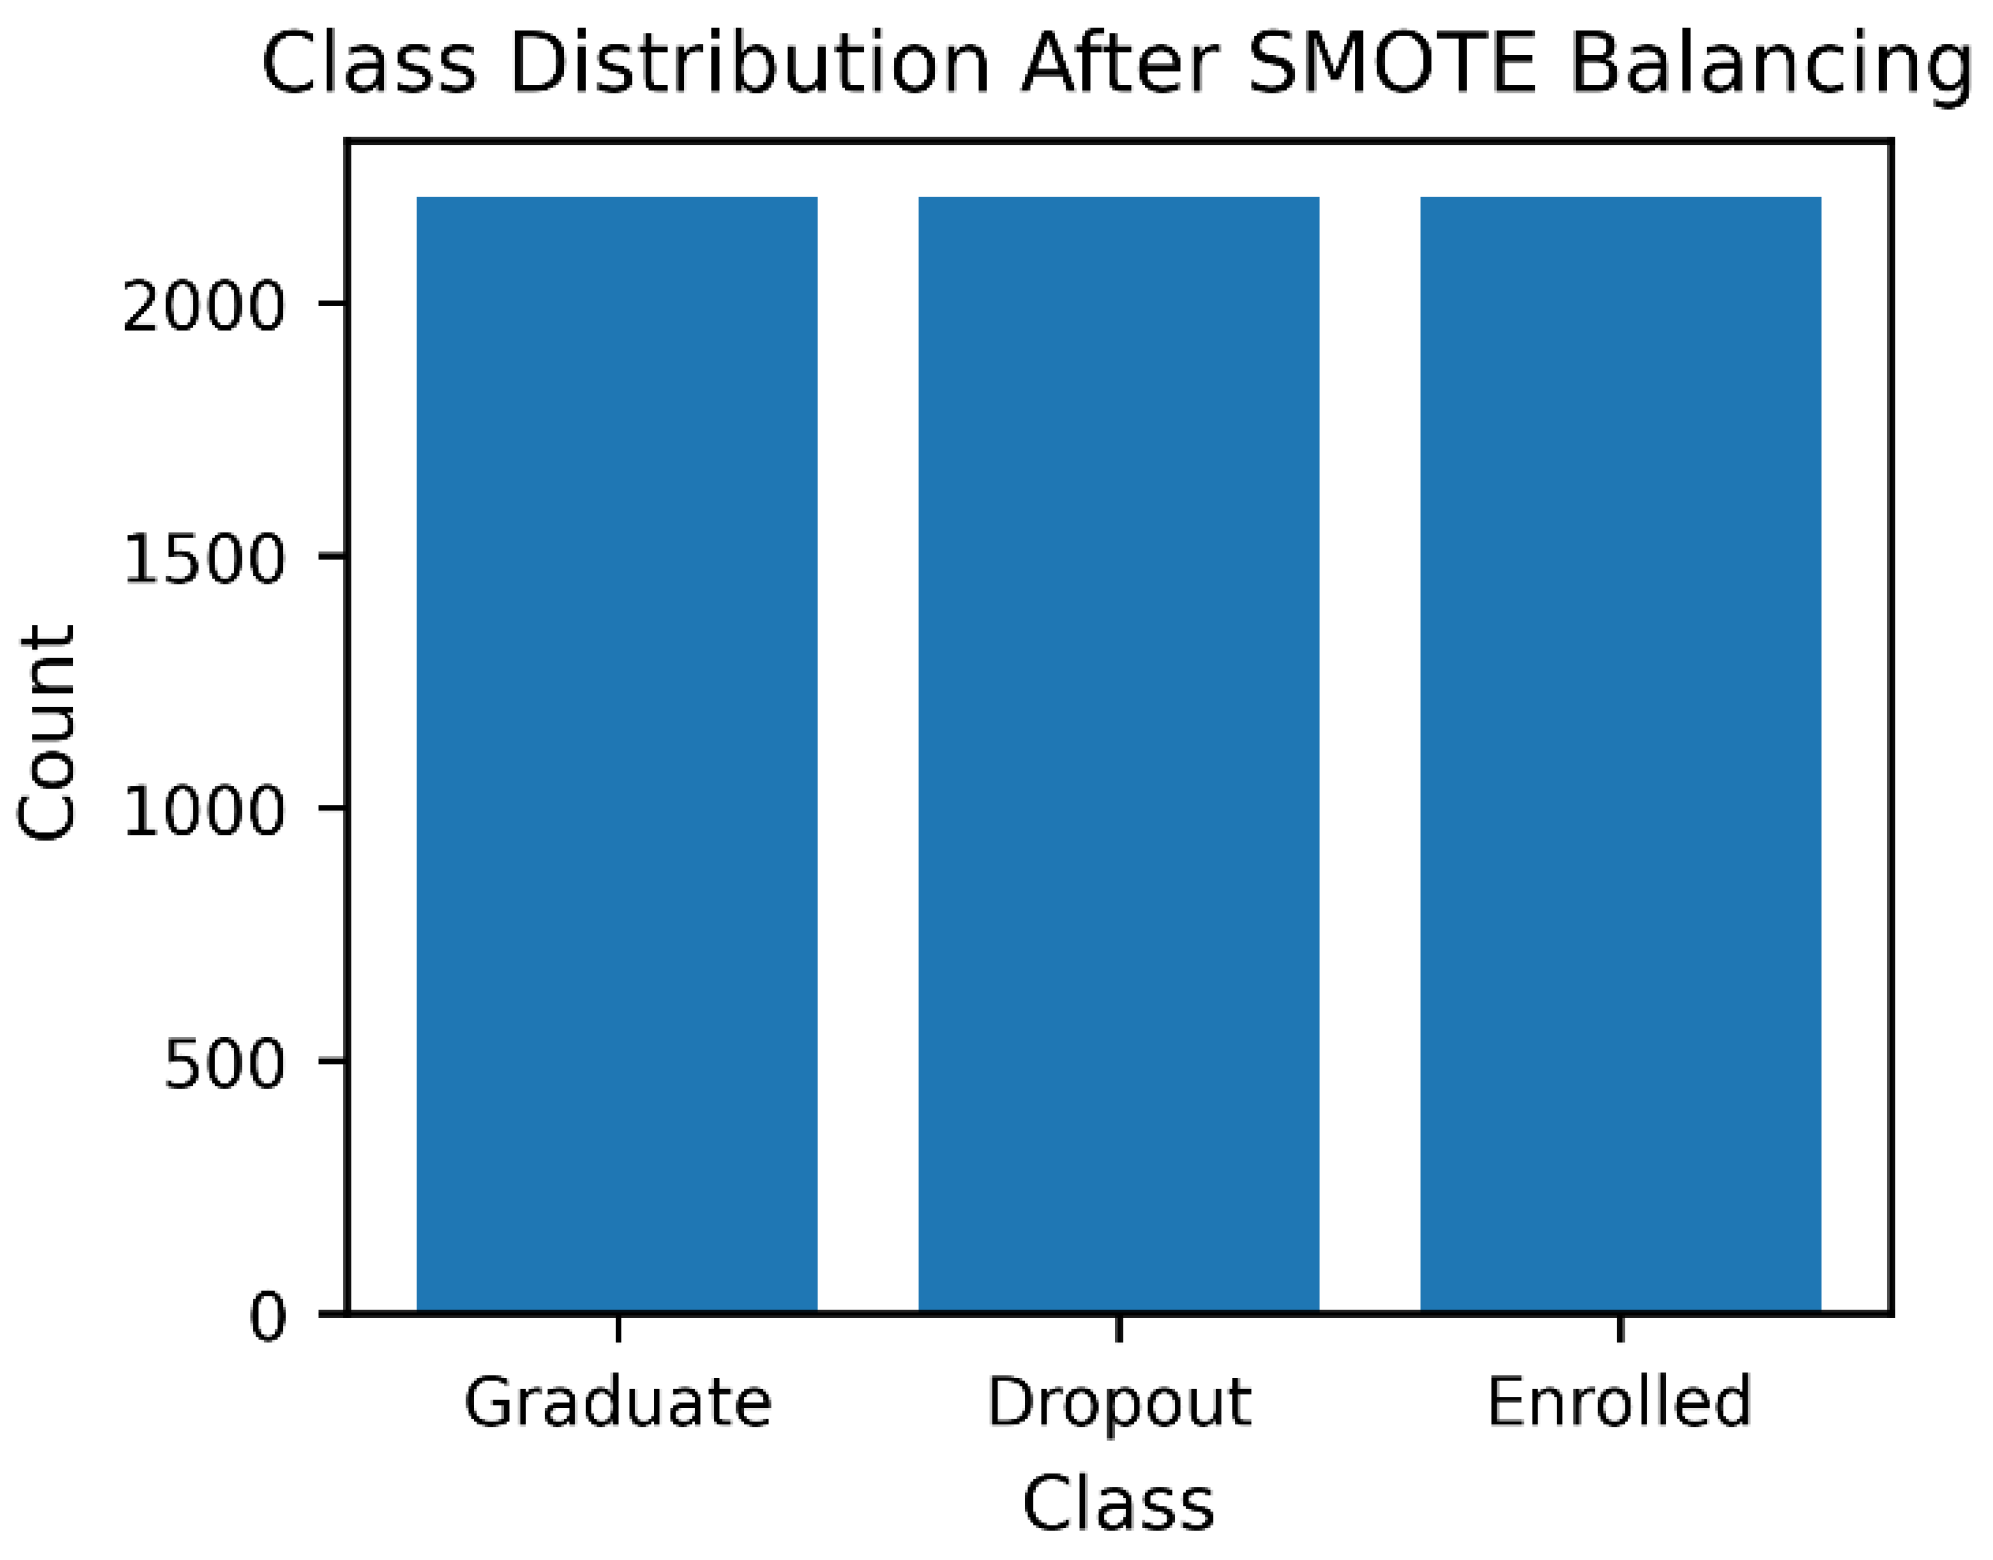
Outliers were handled using Winsorization at the 5th and 95th percentiles [2] to reduce the influence of extreme values while preserving the underlying data distribution. Categorical variables were encoded using one-hot encoding for nominal features and ordinal encoding for variables exhibiting an inherent order. Through feature engineering, the original set of 34 variables was expanded to 41 predictors, which were subsequently grouped into four conceptual categories: academic, demographic, financial, and socio-economic indicators. To address the pronounced class imbalance in the target variable (Graduate = 2209; Dropout = 1421; Enrolled = 794), the Synthetic Minority Oversampling Technique (SMOTE) [15] was applied, resulting in balanced class distributions of 2209 instances per category. Finally, feature scaling was performed to ensure that variables with larger numerical ranges did not disproportionately influence the behaviour of distance and linear-based models.
Figure 3.
Class distribution of the original dataset before class balancing, illustrating the presence of substantial class imbalance.
Figure 3.
Class distribution of the original dataset before class balancing, illustrating the presence of substantial class imbalance.
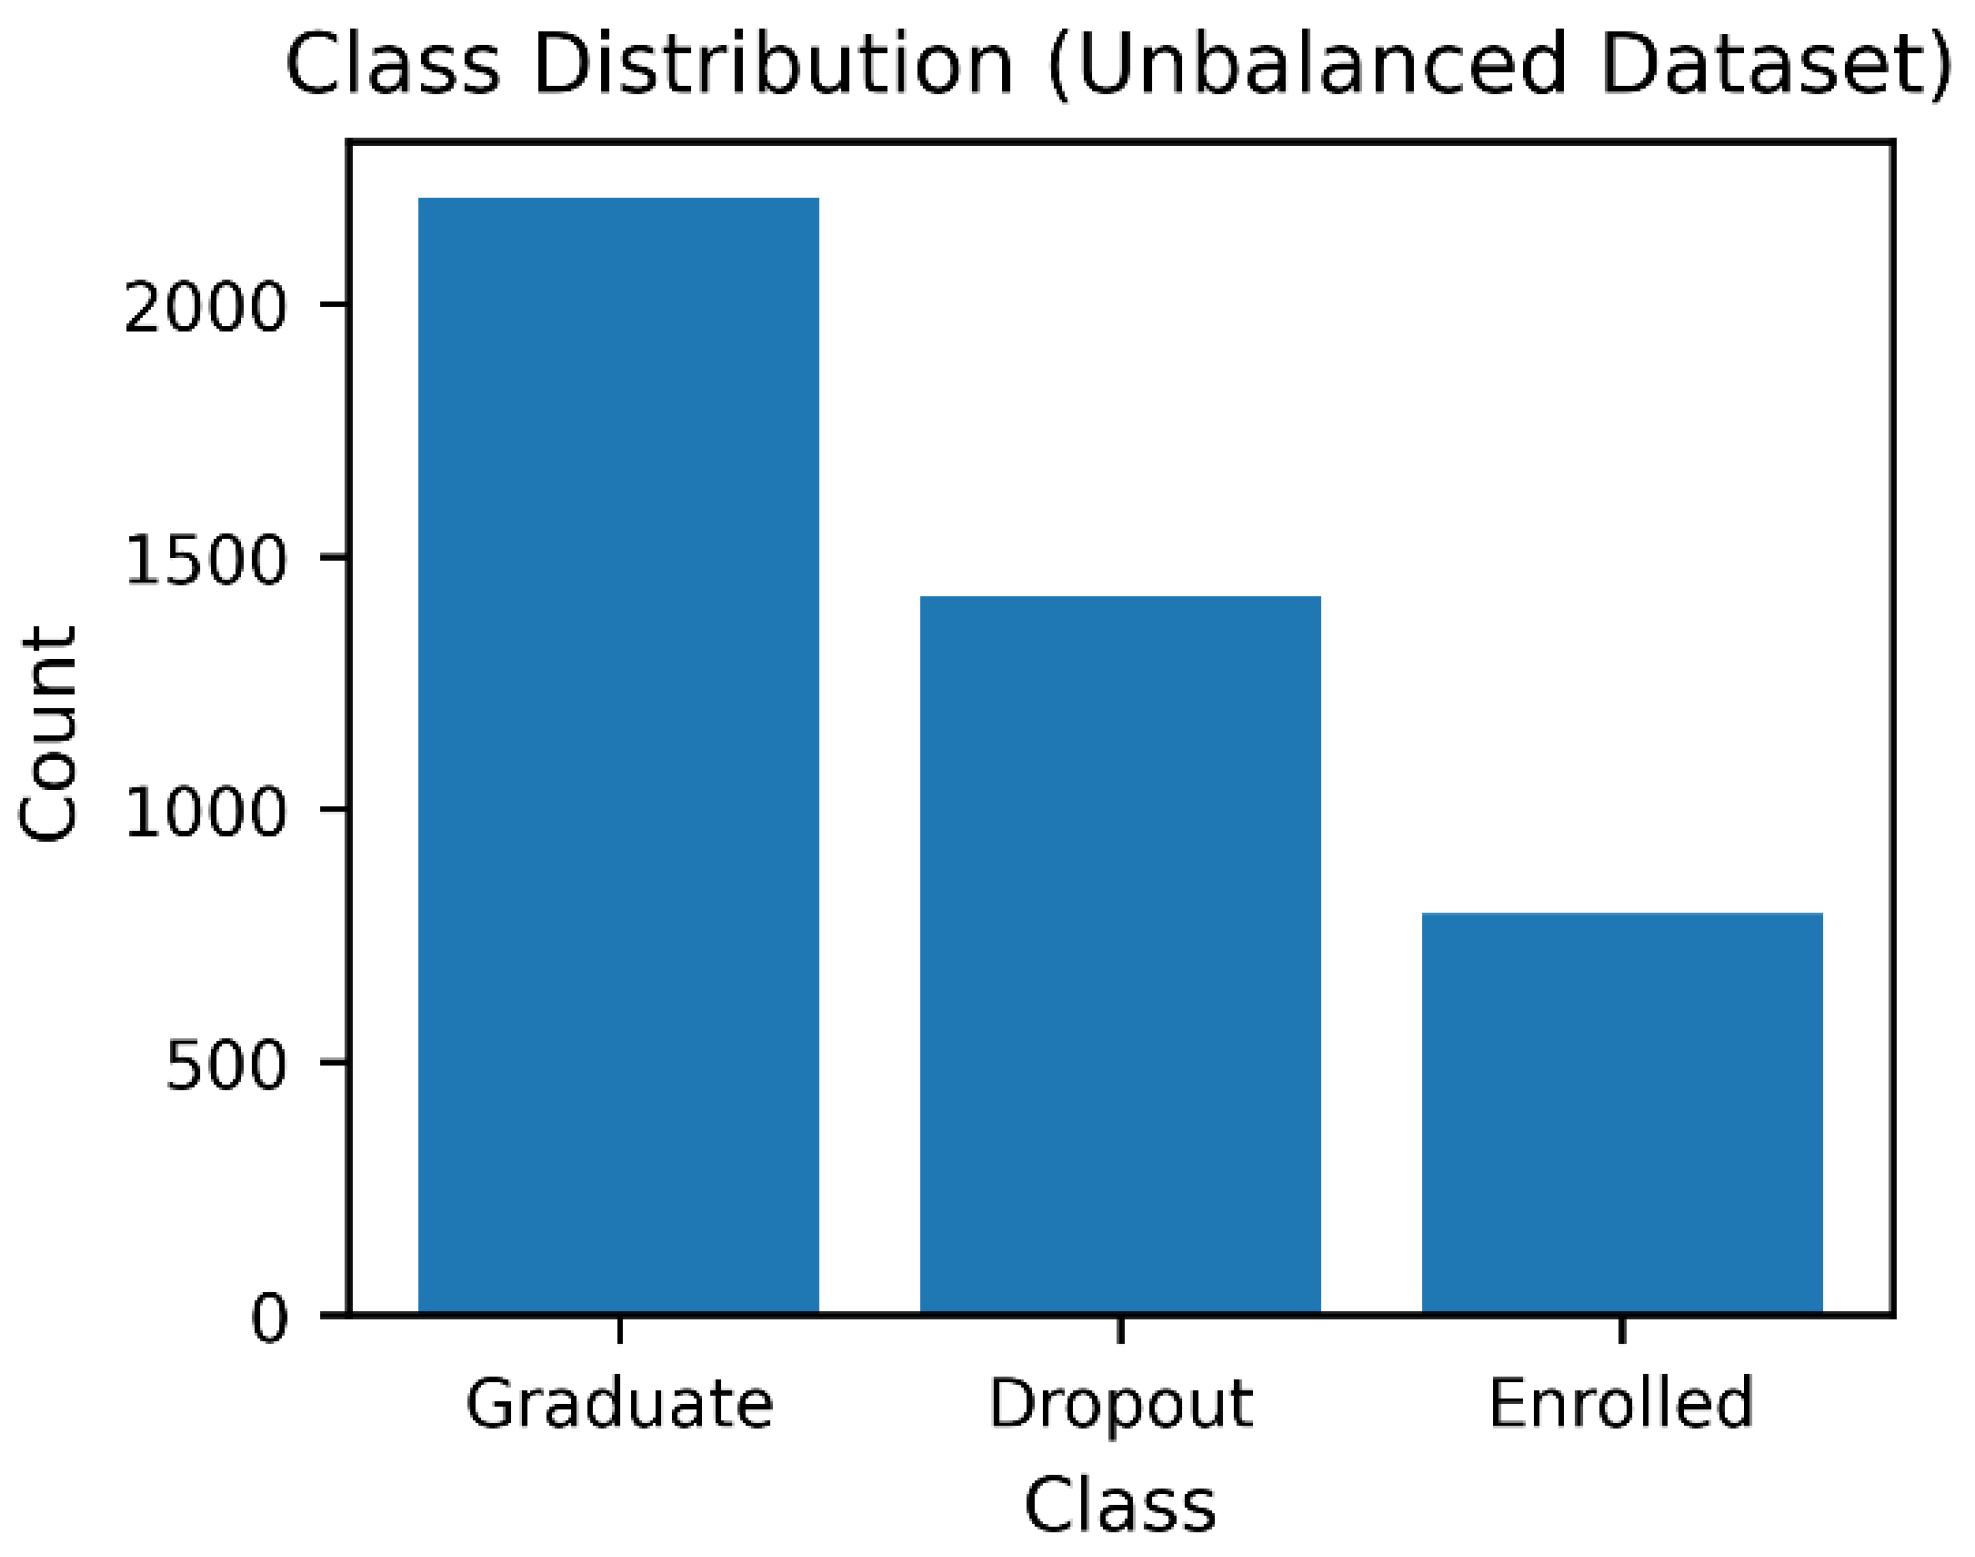
Figure 4.
Class distribution of the dataset after class balancing, showing equal representation across outcome categories.
Figure 4.
Class distribution of the dataset after class balancing, showing equal representation across outcome categories.
Feature Optimization Comparison
To assess the influence of feature selection on predictive performance, three feature configurations were evaluated: the full feature set (34 features), an optimised subset (28 features), and a reduced subset (20 features). This comparison enabled an examination of whether predictive performance improves with feature reduction or whether retaining a broader set of informative variables yields superior results [30].
For contextual reference, Table 2 also reports selected performance outcomes from prior studies that employed different datasets, feature spaces, and experimental protocols. These results are included solely to provide methodological context and are not intended for direct quantitative comparison with the findings of the present study.
The 28-feature subset was identified as the optimal feature set, achieving the highest classification accuracy (87.4%) while maintaining a consistently high mean AUC of 96.0% with low variability across validation folds (AUC SD = 0.0057). This result indicates that moderate feature optimisation can enhance predictive performance without sacrificing model stability. In contrast, although the reduced 20-feature subset retained a comparable AUC, it exhibited a slight decline in accuracy (85.0%), suggesting that excessive feature reduction may remove informative predictors essential for precise classification.
Using the full 34-feature configuration resulted in notably lower accuracy (77.0%), despite achieving a similarly high AUC. This finding highlights that retaining all available variables does not necessarily improve predictive performance and may introduce noise or redundancy that adversely affects classification accuracy.
For contextual benchmarking, Table 2 also reports baseline performance ranges commonly cited in the literature, where models such as Neural Networks (NN), Decision Trees (DT), Support Vector Machines (SVM), Logistic Regression (LR), Random Forests (RF), and Elastic Net (EN) typically achieve accuracies between 69% and 77%. These results are included solely to situate the present findings within the broader research landscape and are not intended for direct quantitative comparison, given differences in datasets, feature spaces, and experimental designs.
This study evaluates a combination of ensemble-based and linear classification models to capture both predictive performance and interpretability. Random Forest (RF) is an ensemble tree-based classifier [20] that aggregates the predictions of multiple decision trees to improve accuracy and stability. By training each tree on a bootstrap sample and selecting a random subset of features at each split, RF effectively reduces overfitting and variance.
Extra Trees (ET), also known as Extremely Randomized Trees [22], extends the Random Forest paradigm by introducing additional randomness during node splitting. Rather than optimising split thresholds, ET selects them at random for each feature, which further reduces variance and often leads to faster training. Although this approach may introduce a slight increase in bias, it frequently results in improved generalisation performance, particularly in high-dimensional feature spaces.
Gradient Boosting (GB) is a sequential ensemble learning method [21] that constructs a strong predictive model by iteratively combining weak learners, typically shallow decision trees. Each successive model is trained to correct the residual errors of the previous ensemble. While Gradient Boosting is capable of achieving high predictive accuracy, it is generally more computationally demanding and sensitive to hyperparameter selection.
Logistic Regression (LR) is a generalised linear model that estimates class probabilities using the logistic function. Despite its relative simplicity, LR provides transparent and interpretable coefficients and serves as a strong baseline classifier for comparison against more complex ensemble approaches [19,31].
All models were evaluated using a nested cross-validation framework [23] to ensure robust performance estimation and to mitigate optimistic bias. Hyperparameter tuning was conducted using an inner 3-fold cross-validation loop, while model performance was assessed using an outer 5-fold cross-validation loop [33].
Results
This section presents the empirical results of our study, focusing on model performance evaluated using Accuracy and Area Under the Curve (AUC) metrics. Comparative analysis is conducted to identify the most effective model for multi-class student retention prediction.
The Extra Trees classifier emerged as the best-performing model, achieving the highest values for both AUC and Accuracy among all evaluated classifiers. Table 3 summarises the comparative performance of the selected models, reporting the mean Accuracy and AUC, along with their corresponding standard deviations across the validation folds. The superior performance of the Extra Trees classifier highlights its robustness and predictive reliability for modelling student retention outcomes in higher education settings, consistently outperforming the alternative approaches examined in this study.
To further contextualize the predictive effectiveness of the proposed approach, Table 4 compares the results of the present study with those reported in prior research that employed the same multi-class student retention dataset [18,27,28].
Figure 5 presents the confusion matrix of the best-performing Extra Trees classifier evaluated on the balanced multi-class dataset. The model demonstrates strong discriminatory capability across all three outcome categories, correctly classifying 369 Dropout, 383 Enrolled, and 389 Graduate instances. Misclassifications are relatively limited and primarily occur between adjacent academic status categories, such as Enrolled and Graduate, reflecting realistic transitional patterns in student progression. Overall, the model achieved an accuracy of 87.4% and a macro-averaged F1-score of 0.88, indicating robust and well-balanced predictive performance across classes.
Evaluation Metrics
Model selection was guided by two primary performance metrics: Accuracy and the Area Under the Receiver Operating Characteristic Curve (AUC-ROC). Accuracy provides an overall measure of the proportion of correctly classified instances across all outcome categories. However, because accuracy alone can be misleading in the presence of class imbalance, AUC-ROC was also employed to evaluate the models’ ability to discriminate between classes.
For the multi-class classification setting, AUC-ROC was computed using a macro-averaged strategy, ensuring equal consideration of each class irrespective of its prevalence. By jointly assessing Accuracy and AUC-ROC, the evaluation framework captured both overall predictive performance and class-separation capability [29]. This complementary metric selection supports a robust and reliable comparison of models and underpins the identification of the most effective classifier for student retention prediction.
Figure 6 presents a comparative evaluation of the four selected classifiers, Logistic Regression (LR), Random Forest (RF), Extra Trees (ET), and Gradient Boosting (GB), using Accuracy, F1-score, and AUC as performance metrics [24]. Among the evaluated models, the Extra Trees classifier consistently outperformed the alternatives across all metrics, achieving the highest Accuracy (87.4%), F1-score (0.88), and AUC (0.96). This superior performance highlights the model’s strong discriminative capability and balanced precision and recall behaviour across the three outcome classes [32].
Random Forest demonstrated competitive performance, particularly in terms of AUC (0.95), but exhibited slightly lower Accuracy and F1-score compared with Extra Trees. Gradient Boosting achieved moderate results, with strong AUC performance (0.92) but reduced Accuracy and F1-score, suggesting sensitivity to class boundaries despite effective ranking ability [25]. Logistic Regression yielded the lowest overall performance, reflecting the limitations of linear models when applied to complex, non-linear relationships inherent in student retention data.
Overall, these results confirm that ensemble-based tree models, particularly Extra Trees, provide superior predictive performance and robustness for multi-class student retention prediction in comparison to both boosting-based and linear approaches.
Figure 7 illustrates the Receiver Operating Characteristic (ROC) curves for the four evaluated classifiers: Logistic Regression (LR), Random Forest (RF), Extra Trees (ET), and Gradient Boosting (GB). The ROC curves provide a visual comparison of each model’s discriminative ability across varying classification thresholds, with the diagonal line representing random performance.
The Extra Trees and Gradient Boosting models achieved the highest Area Under the Curve (AUC = 0.96), indicating excellent class separability and superior overall discrimination. Random Forest followed closely with an AUC of 0.95, while Logistic Regression achieved a slightly lower but still competitive AUC of 0.94. The consistently elevated ROC curves for the ensemble-based models demonstrate their effectiveness in capturing non-linear relationships within the student retention dataset.
These results reinforce earlier findings based on Accuracy and F1-score, confirming that ensemble tree-based approaches outperform linear classifiers in multi-class student retention prediction. In particular, the strong AUC performance of the Extra Trees model supports its selection as the most reliable and robust classifier in this study
Model Interpretation Using SHAP
To enhance model interpretability and move beyond a black-box predictive framework, SHapley Additive exPlanations (SHAP) [26] were employed to interpret the predictions of the Extra Trees classifier. SHAP provides a unified, model-agnostic approach for explaining individual predictions by quantifying the contribution of each feature to the model’s output [35]. Specifically, SHAP assigns a contribution value to each feature for every prediction, indicating the extent to which a feature increases or decreases the predicted probability relative to the model’s baseline expectation.
This approach enables the identification of both the direction and magnitude of each predictor’s influence, thereby offering transparent and consistent explanations of the model’s decision-making process. Unlike traditional feature importance measures, SHAP accounts for feature interactions and ensures additivity, making it particularly suitable for complex ensemble models. Furthermore, the decomposition of feature contributions across the three outcome classes, Dropout, Enrolled, and Graduate, facilitates a granular understanding of how individual predictors differentially influence student trajectories. This level of interpretability is essential for translating predictive insights into actionable retention strategies within higher education institutions.
SHAP Feature Plot
Figure 9 presents the SHAP-based feature importance for the Extra Trees classifier, highlighting the top 20 predictors contributing to multi-class student retention outcomes. The results demonstrate that academic performance indicators dominate the model’s decision-making process across all classes. In particular, variables related to curricular unit performance, such as approved units, grades, evaluations, and enrolment status across the first and second semesters, exhibit the highest SHAP values, underscoring their central role in distinguishing between Dropout, Enrolled, and Graduate outcomes.
Financial and institutional engagement factors also emerge as influential predictors. Tuition fee status and scholarship holding show notable contributions, particularly in differentiating dropout risk, indicating the importance of financial stability in student persistence. Demographic and socio-economic variables, including age at enrolment, gender, parental occupation and qualification, unemployment rate, and GDP, contribute more moderately but consistently across classes. While their individual effects are smaller than those of academic variables, their cumulative influence supports the multifactorial nature of student retention.
Importantly, the class-specific SHAP patterns reveal that predictors do not affect all outcomes uniformly. For example, strong academic performance indicators are positively associated with the Graduate class, whereas financial and socio-economic predictors contribute more strongly to Dropout predictions. This class-sensitive behaviour reinforces the value of SHAP in providing nuanced, interpretable insights beyond global feature rankings. Overall, the SHAP analysis confirms that student retention is driven by a combination of academic achievement, financial capacity, and background characteristics, validating the interpretability and practical relevance of the proposed modelling framework.
Discussion
The Extra Trees (ET) classifier emerged as the best-performing model in this study, achieving an accuracy of 87.4% and a macro-averaged AUC of 0.96 on the balanced multi-class dataset. It consistently outperformed Random Forest, Gradient Boosting, and Logistic Regression, demonstrating the effectiveness of the proposed methodological pipeline. In particular, the combined application of outlier mitigation, SMOTE-based class balancing, and systematic feature optimization contributed substantially to improved predictive performance. The low standard deviation observed across nested cross-validation folds further indicates strong model stability and reliable generalisation.
The comparative analysis of feature subsets revealed that the optimized 28-feature configuration achieved superior performance relative to the reduced 20-feature subset (87.4% versus 85.0% accuracy). This finding suggests that predictive performance does not necessarily improve through aggressive feature reduction. Instead, retaining a carefully selected set of complementary predictors enables the model to capture complex patterns essential for accurate multi-class classification. These results emphasise the importance of empirical, performance-driven feature selection rather than reliance on dimensionality reduction alone.
Despite these strengths, several limitations should be acknowledged. First, the dataset was derived from a single institutional context, and the influence of certain predictors, such as tuition fee status or approved curricular units, may be shaped by institution-specific academic regulations, financial policies, and demographic characteristics. As a result, the direct transferability of the findings to institutions operating under different structural or socio-economic conditions may be limited.
Second, although the Extra Trees classifier demonstrated superior predictive capability, its deployment in operational university settings may present practical challenges. Ensemble tree-based models typically require greater computational resources and technical expertise for implementation and maintenance. For smaller or resource-constrained institutions, simpler models such as Logistic Regression may represent a more feasible alternative, albeit at the cost of reduced predictive performance.
The SHAP-based interpretability analysis provided valuable insights into the drivers of student retention. Academic engagement indicators, particularly approved curricular units, grades, and evaluations across both semesters, emerged as the most influential predictors of student status. These findings are consistent with prior research identifying academic performance as a central determinant of persistence and completion [4,11,12,14]. Notably, strong first-semester academic performance exerted a particularly pronounced influence, reinforcing its role as an early indicator of continued enrolment and graduation.
In addition to academic factors, financial stability was found to play a critical role in shaping retention outcomes. The variable tuition fees up to date emerged as a significant determinant of student status, with overdue payments substantially increasing the likelihood of dropout. This aligns with existing evidence linking financial stress to student attrition in higher education [9]. Importantly, the results suggest that even academically successful students remain vulnerable to dropout when financial obligations are unmet, highlighting the compounded risks faced by financially disadvantaged students.
By integrating SHAP-based explanations, this study moves beyond black-box prediction to provide transparent, feature-level insights that support practical interpretation and institutional decision-making. The findings suggest that first-semester academic performance should be used as an early trigger for targeted intervention, while the interaction between academic difficulty and financial vulnerability underscores the need for integrated academic and financial support strategies. Measures such as flexible tuition payment plans and targeted financial assistance may therefore play a critical role in mitigating fee-related attrition and supporting student persistence.
Future research should extend the proposed framework by incorporating longitudinal and temporal data to model student risk trajectories across multiple academic periods. Such approaches would enable the identification of early warning patterns that static, cross-sectional analyses cannot fully capture. Further work should also explore advanced feature extraction methods, including deep learning architectures, to model complex non-linear relationships among academic, financial, and socio-economic variables. Additionally, investigating contextual heterogeneity, such as regional economic conditions, institutional funding models, and policy-specific factors, would enhance the generalisability of retention models. The development of fully longitudinal prediction frameworks capable of forecasting outcomes across all years of study would further strengthen the practical applicability of predictive analytics in higher education.
Overall, the findings demonstrate that the integration of robust predictive modelling with explainable machine learning can generate actionable insights into student retention, providing a strong foundation for evidence-based decision-making in higher education institutions.
Conclusions
Student retention remains a critical challenge for higher education institutions, with significant implications for workforce development, institutional sustainability, and social equity. This study evaluated four machine learning classifiers using a dataset of 4,424 student records and identified the Extra Trees classifier as the most effective approach. The model achieved an accuracy of 87.4% and an AUC of 0.96 using an optimised subset of 28 features, thereby addressing Research Question 2 and demonstrating the robustness and suitability of ensemble tree-based methods for multi-class student retention prediction. In response to Research Question 1, the findings indicate that academic performance indicators and financial status are the most influential determinants of student outcomes. The integration of SHAP-based explainability enhanced model transparency by providing clear, feature-level and class-specific explanations of predictive behaviour. This directly addresses a recurring limitation in the retention literature, where high-performing predictive models are often reported without sufficient interpretability to support actionable decision-making.
From a practical perspective, the results highlight first-semester academic performance as a critical early signal for intervention, while financial stability, particularly tuition fee compliance, emerges as a decisive factor influencing persistence and attrition. These insights suggest that higher education institutions should prioritise early academic monitoring, implement flexible tuition payment policies, and adopt integrated support mechanisms that jointly address academic and financial risk factors. Overall, this study demonstrates that combining robust machine learning techniques with explainable artificial intelligence can generate actionable insights to support evidence-based decision-making in higher education. The proposed framework offers a scalable and interpretable approach to student retention analysis and provides a strong foundation for future research incorporating longitudinal data, multi-institutional validation, and institution-specific contextual factors.
References
- Peck, A.; Callahan, K. Connecting student employment and leadership development. New Dir. Stud. Leadersh. 2019, 2019, 9–22. [CrossRef]
- Abuzaid, A.; Alkronz, E. A comparative study on science context. Ital. J. Appl. Stat. 2024, 36, 85–99. [CrossRef]
- Prasanth, A.; Alqahtani, H. Predictive modelling of student behaviour for early dropout detection in universities using machine learning techniques. In Proc. 8th IEEE Int. Conf. Eng. Technol. Appl. Sci. (ICETAS); IEEE: 2023; pp. 1–5. [CrossRef]
- Araque, F.; Roldán, C.; Salguero, A. Factors influencing university dropout rates. Comput. Educ. 2009, 53, 563–574. [CrossRef]
- Abdullah, A.; Ali, R.H.; Koutaly, R.; Khan, T.A.; Ahmad, I. Enhancing student retention: Predictive machine learning models for identifying and preventing university dropout. In Proceedings of the 2025 International Conference on Innovation in Artificial Intelligence and Internet of Things (AIIT), Dubai, United Arab Emirates, 18–20 March 2025; IEEE: New York, NY, USA, 2025; pp. 1–6. [CrossRef]
- Maples, B. Dropping out of university. Uni Compare 2021. [CrossRef]
- Chacha, B.R.C.; López, W.L.G.; Guerrero, V.X.V.; Villacis, W.G.V. Student dropout model based on logistic regression. In Int. Conf. Appl. Technol.; Springer: Cham, 2019; pp. 321–333. [CrossRef]
- Delen, D. A comparative analysis of machine learning techniques for student retention management. Decis. Support Syst. 2010, 49, 498–506. [CrossRef]
- Edvoy. UK universities in financial stress. Edvoy 2023. [CrossRef]
- Meseret, Y.M.; Sunonora, S. Global challenges of students’ dropout: A prediction model development using machine learning algorithms on higher education datasets. SHS Web Conf. 2021, 129, 09001. [CrossRef]
- Dew, M.A.; Kumiadi, F.I.; Murad, D.F.; Rabiha, S.G.; Romli, A. Machine learning algorithms for early predicting dropout student online learning. In Proc. IEEE 9th Int. Conf. Comput. Eng. Des. (ICCED); 2023. [CrossRef]
- Matz, S.C.; Bukow, C.S.; Peters, H.; Deacons, C.; Dinu, A.; Stachl, C. Using machine learning to predict student retention from socio-demographic characteristics and app-based engagement metrics. Sci. Rep. 2023, 13, 5705. [CrossRef]
- Salloum, S.A.; Basiouni, A.; Alfansal, R.; Salloum, A.; Shaalam, K. Predicting student retention in higher education using machine learning. In Using Generative Intelligence to Improve Human Education and Well-Being; 2024; pp. 197–206. [CrossRef]
- Sharma, N.; Sharma, M.K.; Garg, U. Predicting academic performance of students using machine learning models. In Proc. Int. Conf. Artif. Intell. Smart Commun. (AISC); 2023. [CrossRef]
- Sun, Z.; Song, Q.; Zhu, X.; Sun, H.; Xu, B.; Zhou, Y. Ensemble methods for classifying imbalanced data. Pattern Recognit. 2015, 48, 1623–1637. [CrossRef]
- Villegas-Ch, W.; Govea, J.; Revelo-Tapia, S. Improving student retention in higher education through machine learning. J. Innov. Sustain. Teach. High. Educ. Inst. 2023, 15, 14512. [CrossRef]
- Page, M.J.; McKenzie, J.E.; Bossuyt, P.M.; Boutron, I.; Hoffmann, T.C.; Mulrow, C.D.; et al. The PRISMA 2020 statement: An updated guideline for reporting systematic reviews. BMJ 2021, 372, n71. [CrossRef]
- Realinho, V.; Vieira Martins, M.; Machado, J.; Baptista, L. Predict students’ dropout and academic success. UCI Mach. Learn. Repos. 2021. [CrossRef]
- Lundberg, S.M.; Lee, S.-I. A Unified Approach to Interpreting Model Predictions. Advances in Neural Information Processing Systems 2017, 30, 4765–4774. [CrossRef]
- Lundberg, S.M.; Erion, G.; Chen, H.; DeGrave, A.; Prutkin, J.M.; Nair, B.; Katz, R.; Himmelfarb, J.; Bansal, N.; Lee, S.-I. From Local Explanations to Global Understanding with Explainable AI for Trees. Nature Machine Intelligence 2020, 2, 56–67. [CrossRef]
- Molnar, C. Interpretable Machine Learning; Lulu Press: 2022. https://christophm.github.io/interpretable-ml-book/.
- Breiman, L. Random Forests. Machine Learning 2001, 45, 5–32. [CrossRef]
- Geurts, P.; Ernst, D.; Wehenkel, L. Extremely Randomized Trees. Machine Learning 2006, 63, 3–42. [CrossRef]
- Friedman, J.H. Greedy Function Approximation: A Gradient Boosting Machine. Annals of Statistics 2001, 29, 1189–1232. [CrossRef]
- Pedregosa, F.; Varoquaux, G.; Gramfort, A.; Michel, V.; Thirion, B.; Grisel, O.; et al. Scikit-learn: Machine Learning in Python. Journal of Machine Learning Research 2011, 12, 2825–2830. https://www.jmlr.org/papers/v12/pedregosa11a.html.
- Varma, S.; Simon, R. Bias in Error Estimation When Using Cross-Validation for Model Selection. BMC Bioinformatics 2006, 7, 91. [CrossRef]
- Romero, C.; Ventura, S. Educational Data Mining and Learning Analytics: An Updated Survey. WIREs Data Mining and Knowledge Discovery 2020, 10, e1355. [CrossRef]
- Sokolova, M.; Lapalme, G. A Systematic Analysis of Performance Measures for Classification Tasks. Information Processing & Management 2009, 45, 427–437. [CrossRef]
- Fawcett, T. An Introduction to ROC Analysis. Pattern Recognition Letters 2006, 27, 861–874. [CrossRef]
- Hosmer, D.W.; Lemeshow, S.; Sturdivant, R.X. Applied Logistic Regression, 3rd ed.; Wiley: 2013. [CrossRef]
- Menard, S. Logistic Regression: From Introductory to Advanced Concepts and Applications; Sage: 2010. [CrossRef]
- Tinto, V. Dropout from Higher Education: A Theoretical Synthesis of Recent Research. Review of Educational Research 1975, 45, 89–125. [CrossRef]
- Bean, J.P. Dropouts and Turnover: The Synthesis and Test of a Causal Model of Student Attrition. Research in Higher Education 1980, 12, 155–187. [CrossRef]
- Pascarella, E.T.; Terenzini, P.T. How College Affects Students: A Third Decade of Research; Jossey-Bass: San Francisco, CA, USA, 2005. [CrossRef]
- Ribeiro, M.T.; Singh, S.; Guestrin, C. “Why Should I Trust You?” Explaining the Predictions of Any Classifier. Proceedings of the 22nd ACM SIGKDD International Conference on Knowledge Discovery and Data Mining 2016, 1135–1144. [CrossRef]
Figure 1.
PRISMA 2020 flow diagram illustrating the identification, screening, eligibility assessment, and inclusion of studies in the systematic literature review on machine learning approaches for student retention in higher education.
Figure 1.
PRISMA 2020 flow diagram illustrating the identification, screening, eligibility assessment, and inclusion of studies in the systematic literature review on machine learning approaches for student retention in higher education.
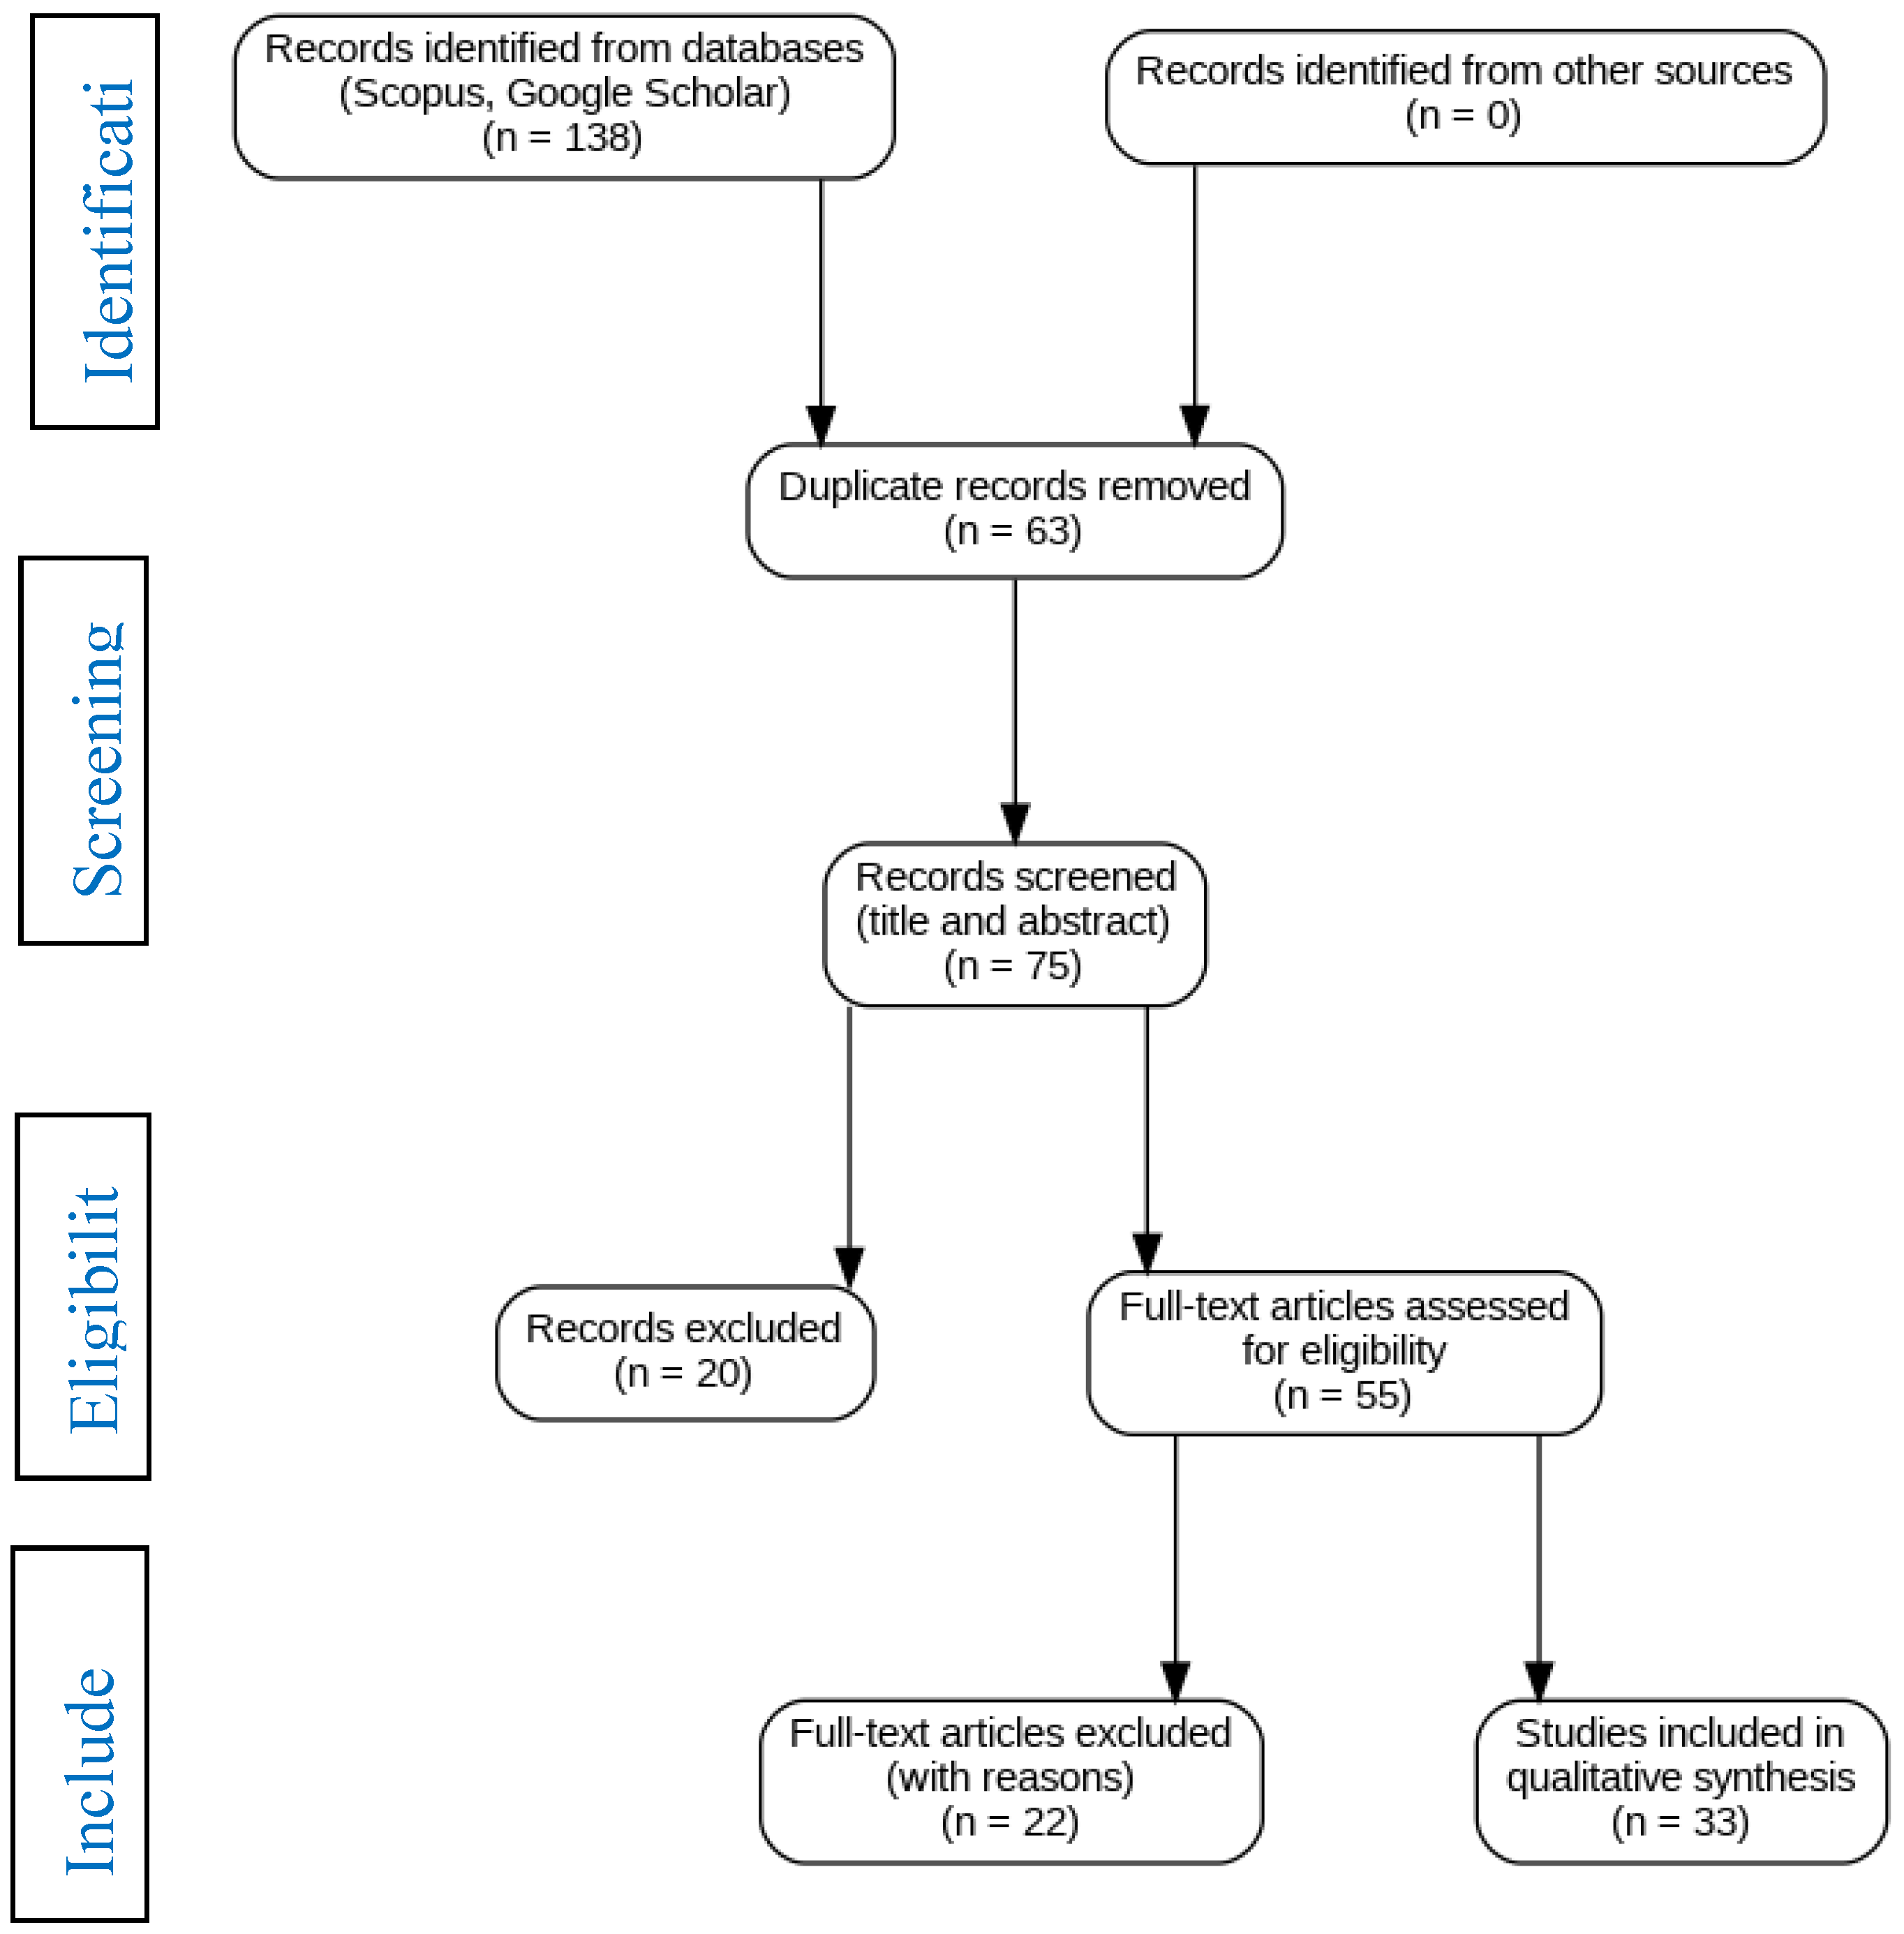
Figure 5.
Confusion matrix of the Extra Trees classifier for multi-class student retention prediction, illustrating classification performance across Dropout, Enrolled, and Graduate categories on the SMOTE-balanced dataset.
Figure 5.
Confusion matrix of the Extra Trees classifier for multi-class student retention prediction, illustrating classification performance across Dropout, Enrolled, and Graduate categories on the SMOTE-balanced dataset.
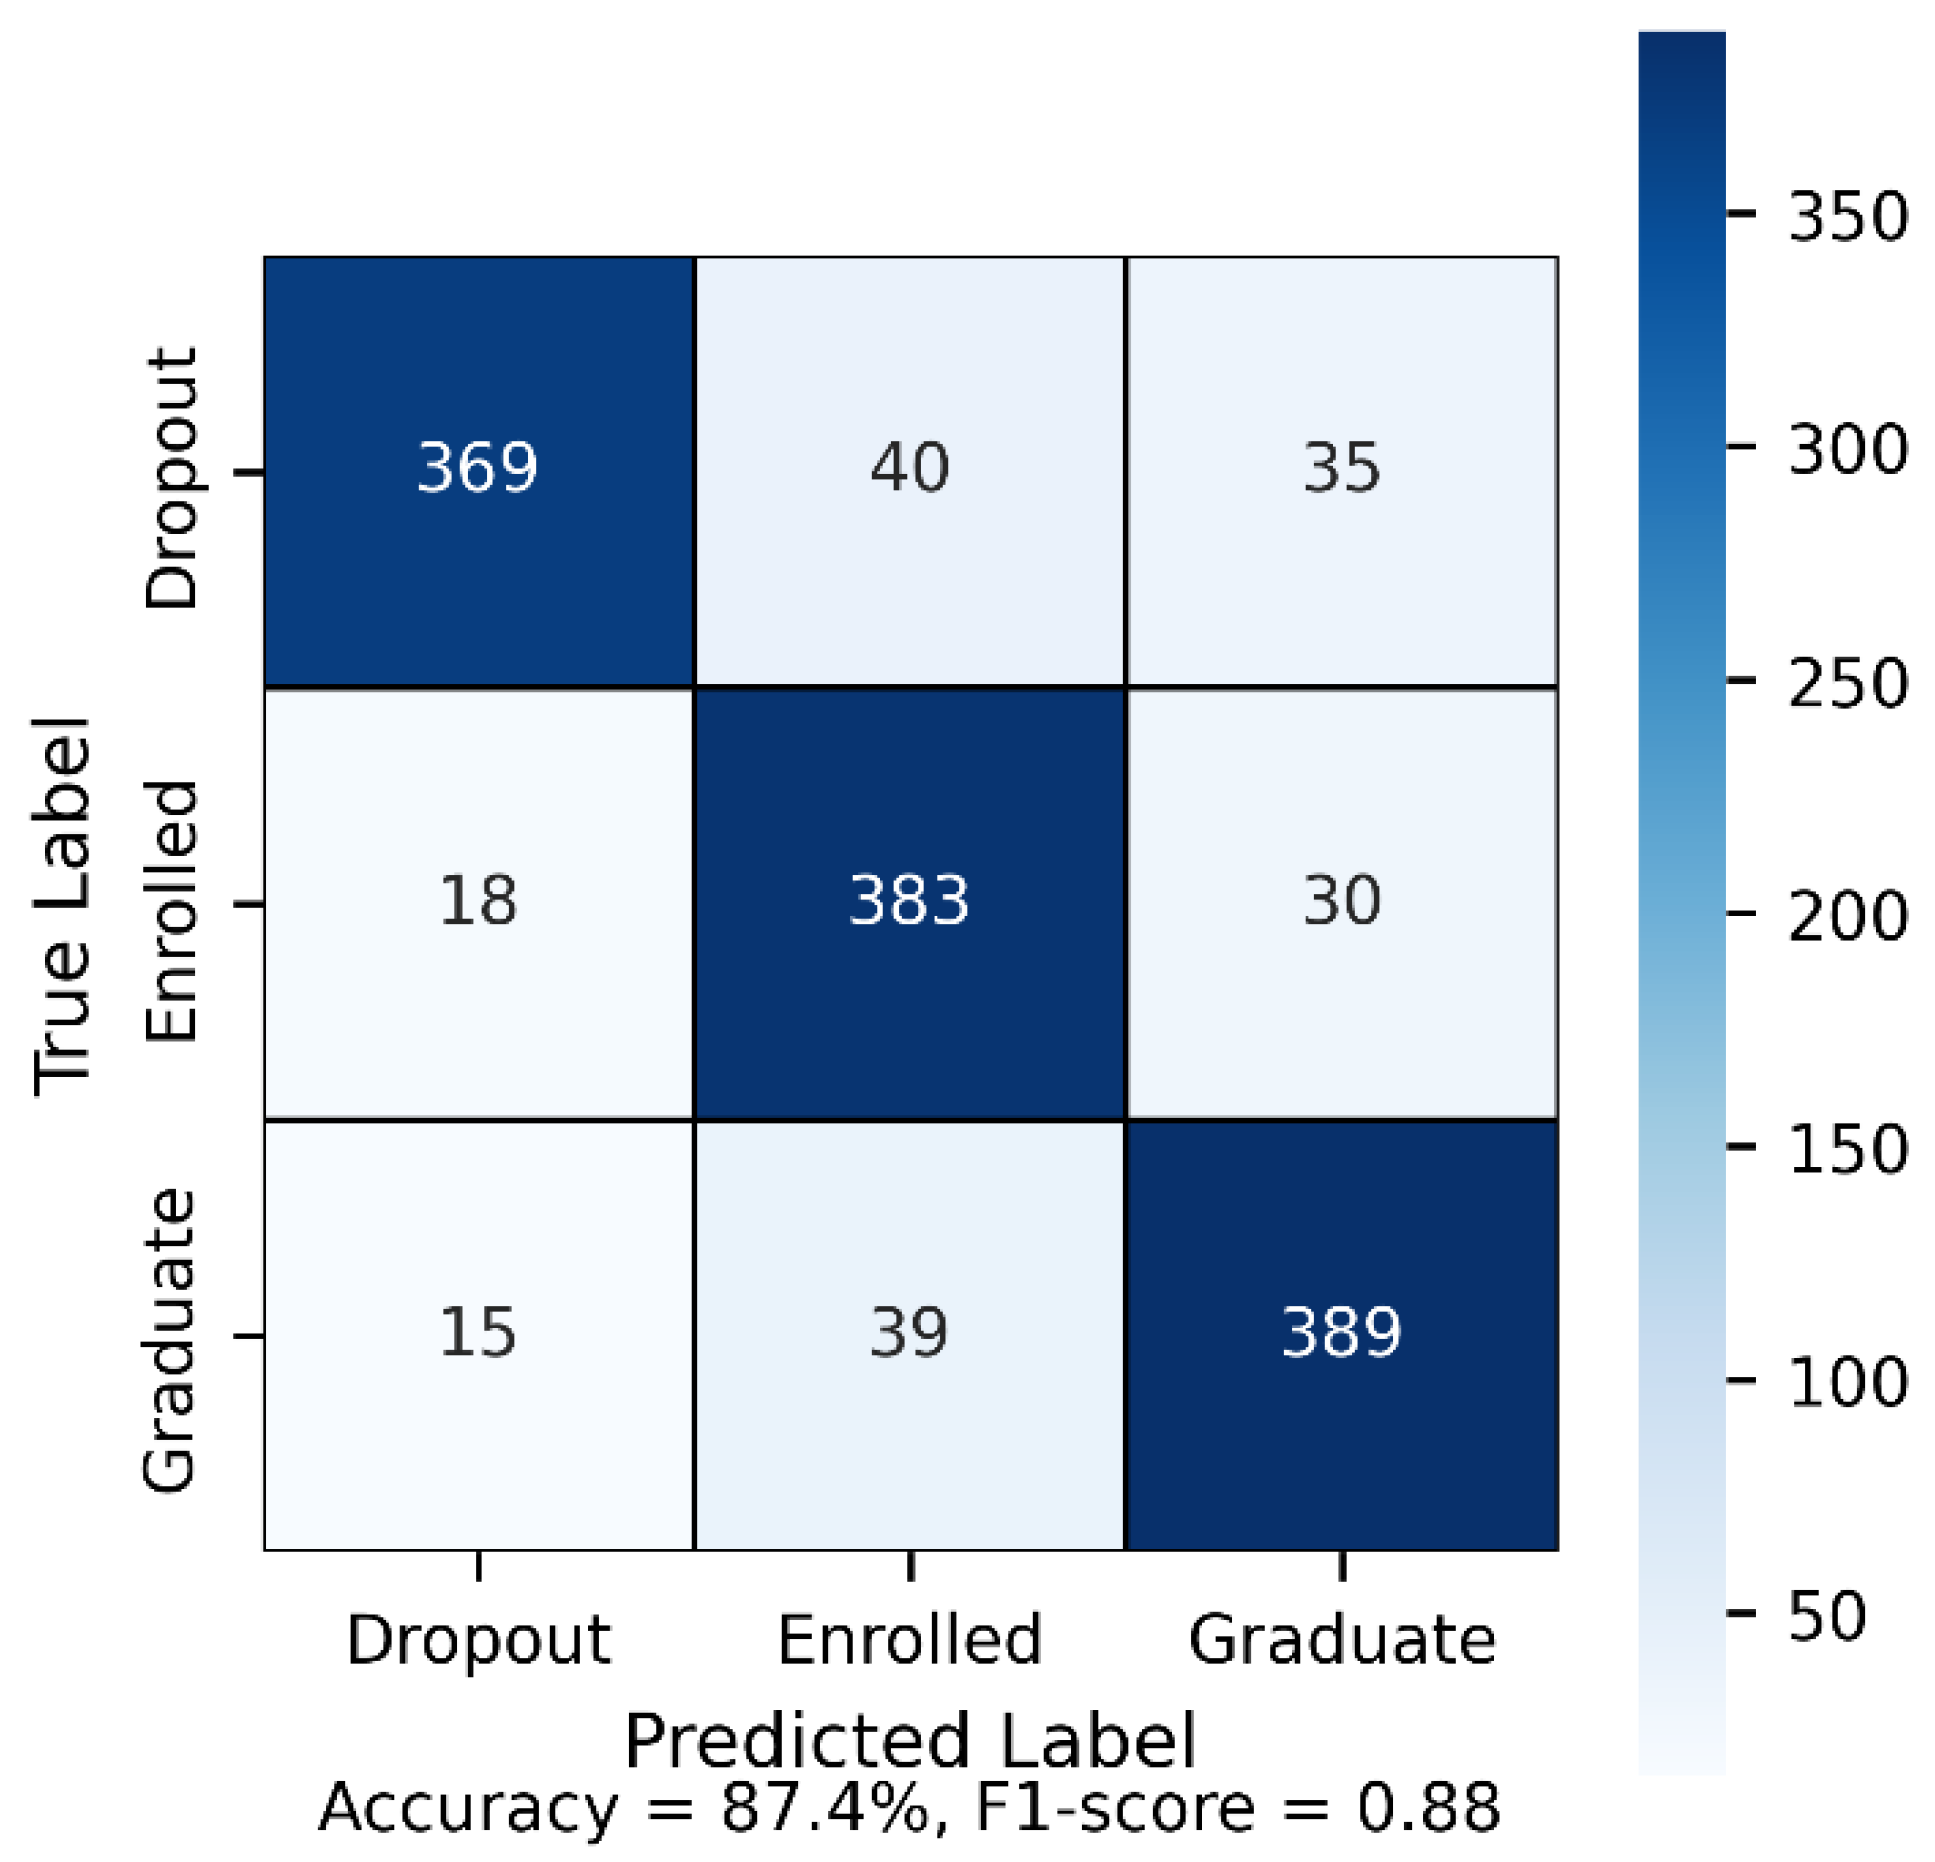
Figure 6.
Comparative performance of classification models evaluated using Accuracy, F1-score, and AUC metrics. Extra Trees achieved the strongest overall performance across all evaluation criteria.
Figure 6.
Comparative performance of classification models evaluated using Accuracy, F1-score, and AUC metrics. Extra Trees achieved the strongest overall performance across all evaluation criteria.
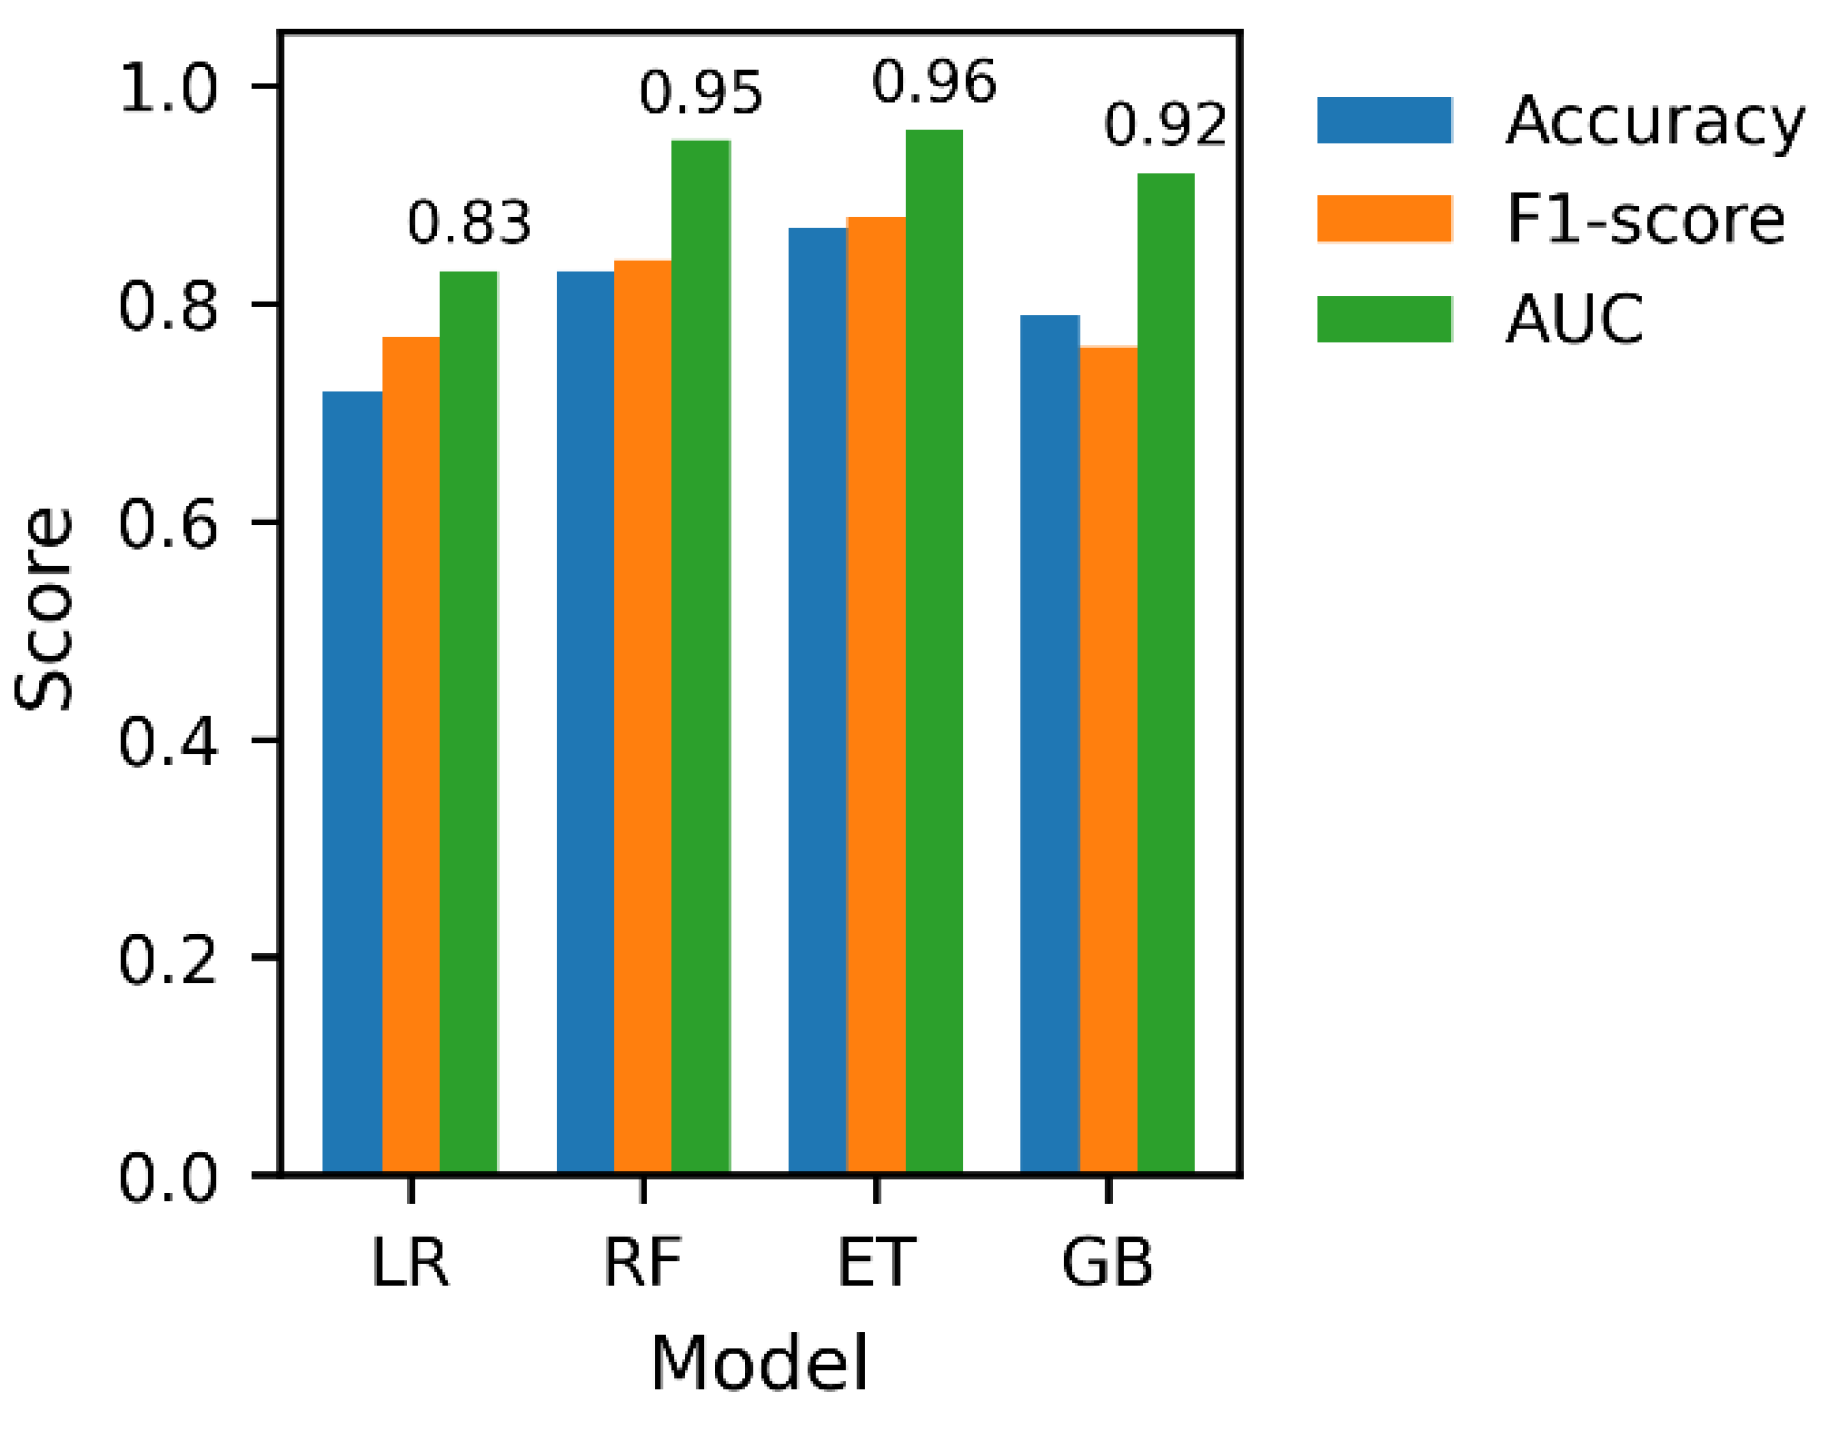
Figure 7.
Receiver Operating Characteristic (ROC) curves for the evaluated classifiers, comparing discriminative performance across classification thresholds. Extra Trees and Gradient Boosting achieved the highest AUC values, indicating superior class separability.
Figure 7.
Receiver Operating Characteristic (ROC) curves for the evaluated classifiers, comparing discriminative performance across classification thresholds. Extra Trees and Gradient Boosting achieved the highest AUC values, indicating superior class separability.
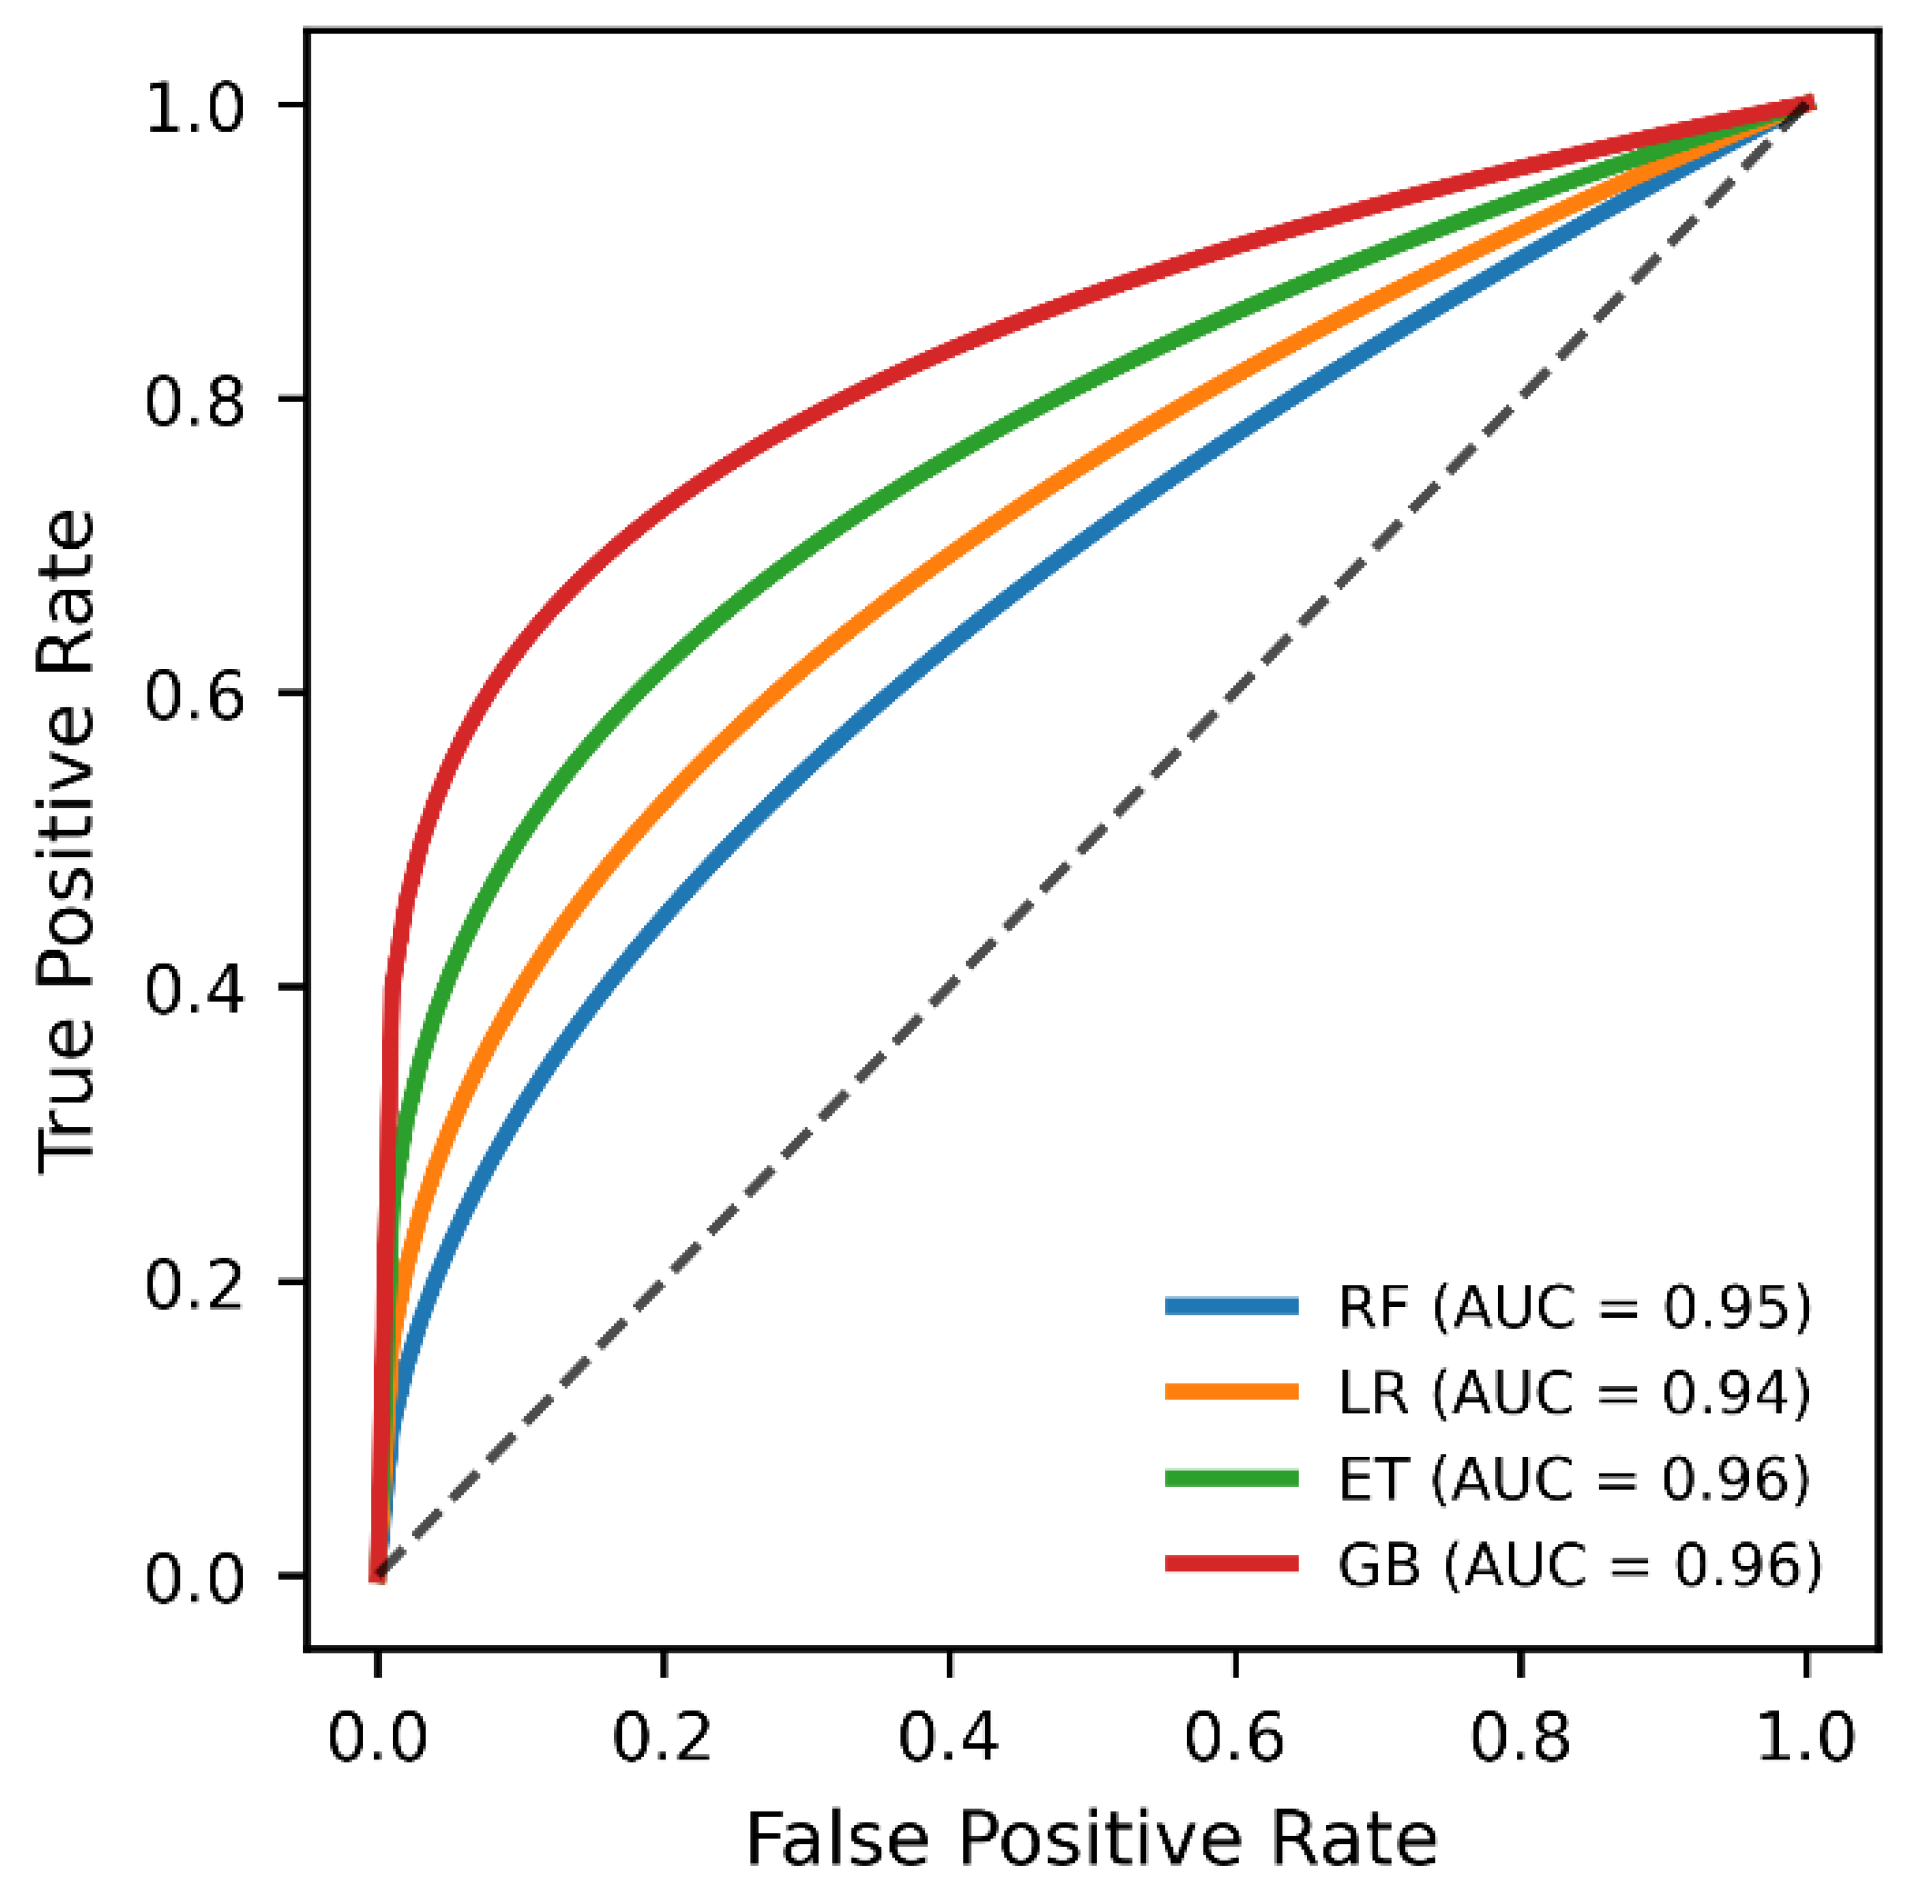
Figure 9.
SHAP-based feature importance for the Extra Trees classifier, showing the top 20 predictors ranked by mean absolute SHAP value across the three outcome classes (Dropout, Enrolled, and Graduate). Higher values indicate a greater contribution to model predictions.
Figure 9.
SHAP-based feature importance for the Extra Trees classifier, showing the top 20 predictors ranked by mean absolute SHAP value across the three outcome classes (Dropout, Enrolled, and Graduate). Higher values indicate a greater contribution to model predictions.
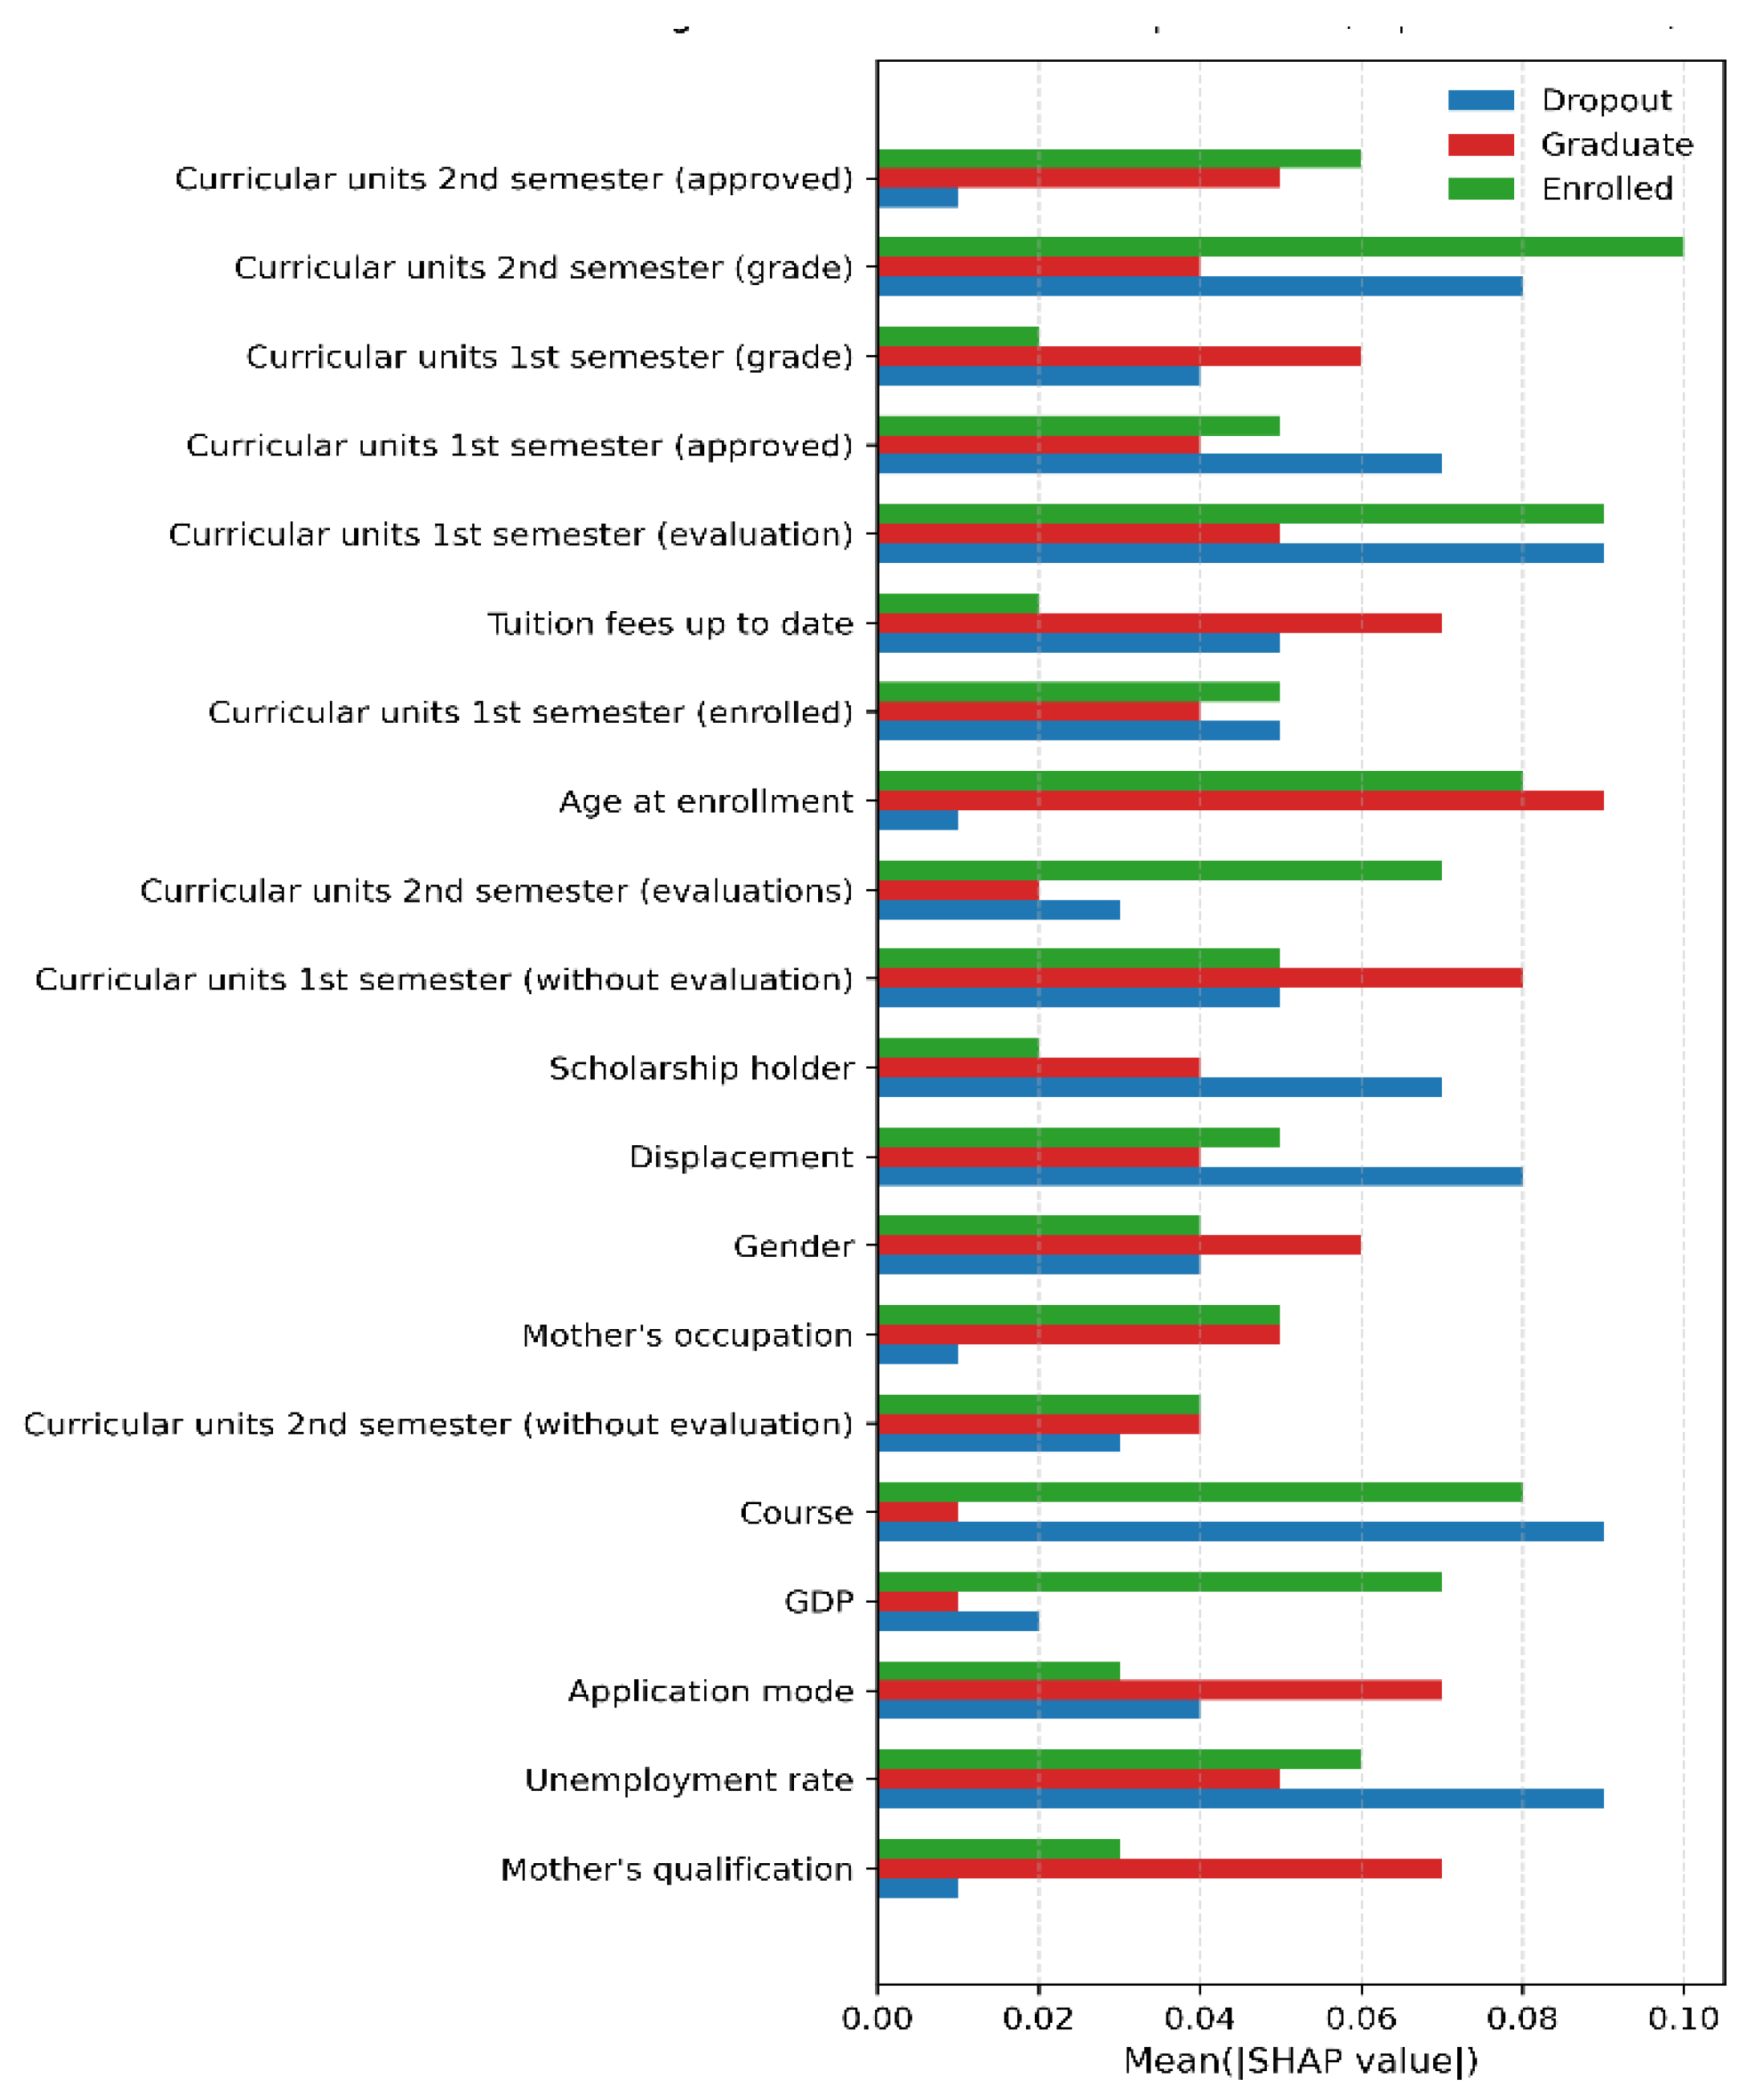

Table 1.
Summary of Selected Studies from the Systematic Literature Review Illustrating Key Methodological and Interpretability Gaps.
Table 1.
Summary of Selected Studies from the Systematic Literature Review Illustrating Key Methodological and Interpretability Gaps.
| Study (Short Form) | Dataset / Sample | Model(s) Used | Key Findings | Identified Gaps |
| Dew et al. (2023) | Dataset not reported | KNN, LR, SVM, FNN, RF, GB | Academic performance is identified as the strongest predictor of student retention | Narrow feature space; absence of non-academic predictors (e.g., financial, socio-economic); no interpretability analysis (e.g., SHAP) |
| Study (Short Form) | Dataset / Sample | Model(s) Used | Key Findings | Identified Gaps |
| Matz et al. (2023) | Large dataset (50,095 records) | EN, RF | Applied rigorous preprocessing (SMOTE, scaling); RF achieved 75% AUC | Predictive performance remained moderate; lacked interpretability; limited insight into feature contributions |
| Salloum et al. (2024) | 4,400 student multi-class dataset | Random Forest | Achieved 76% accuracy | Limited model comparison; no handling of class imbalance; reliance on accuracy alone |
| Abdullah et al. (2025) | 4,424 student records | DT, RF, SVM, MLP, XGB | Reported 94% accuracy | Accuracy inflated due to class imbalance; no class balancing (e.g., SMOTE); potential majority-class bias |
| Prasanth & Alqahtani (2023) | Unspecified dataset | LR, SVC | Achieved 82.3% and 80.9% accuracy, respectively | Missing key predictors (e.g., financial status, family background) |
| Villegas et al. (2023) | Over 10,000 student records | Machine Learning models (including Neural Networks) | Reported an accuracy of 85%. | Feature set too narrow; excluded financial and socio-economic variables; limited model diversity |
Table 2.
Model Performance across Feature Subsets (Best Model: Extra Trees Classifier).
| Method | Feature Count | Models Tested | Best Model | Accuracy (%) | AUC Mean (%) | AUC SD |
| Literature Baseline | 34 | NN, DT, SVM, LR, RF, EN | N/A | 69 - 77 | N/A | N/A |
| Initial Full Feature Set | 34 | RF, ET, GB, LR | Extra Trees | 77.0 | 96.0 | 0.0047 |
| Optimal Feature Set | 28 | RF, ET, GB, LR | Extra Trees | 87.4 | 96.0 | 0.0057 |
| Reduced Feature Set | 20 | RF, ET, GB, LR | Extra Trees | 85.0 | 96.0 | 0.0045 |
Table 3.
Model Performance Comparison.
| Models | AUC Mean (%) | AUC SD | Accuracy Mean (%) | Accuracy SD |
| Random Forest | 95.0 | 0.0057 | 86.0 | 0.0110 |
| Extra Trees | 96.0 | 0.0053 | 87.0 | 0.0120 |
| Gradient Boosting | 93.0 | 0.0060 | 79.0 | 0.0080 |
| Logistic Regression | 83.0 | 0.0074 | 72.0 | 0.0090 |
Table 4.
Comparative performance of studies using the same multi-class student retention dataset.
| Study | Target Type | Class Balancing | Model(s) | Best Metric Reported | Key Limitation |
| A.A. et al. (2025) | Multi-class (Dropout, Enrol, Graduate) | None | DT, RF, SVM, MLP, XGB | Accuracy = 93.5% | Potential performance inflation due to unbalanced class distribution |
| S.A. et al. (2024) | Multi-class | None | Random Forest | Accuracy = 76.7% | No class balancing; reliance on accuracy alone |
| This study | Multi-class | SMOTE | RF, ET, GB, LR | Accuracy = 87.4%, AUC = 0.96 | Increased computational complexity; reliance on a single-institution dataset |
Disclaimer/Publisher’s Note: The statements, opinions and data contained in all publications are solely those of the individual author(s) and contributor(s) and not of MDPI and/or the editor(s). MDPI and/or the editor(s) disclaim responsibility for any injury to people or property resulting from any ideas, methods, instructions or products referred to in the content. |
© 2026 by the authors. Licensee MDPI, Basel, Switzerland. This article is an open access article distributed under the terms and conditions of the Creative Commons Attribution (CC BY) license (http://creativecommons.org/licenses/by/4.0/).
Copyright: This open access article is published under a Creative Commons CC BY 4.0 license, which permit the free download, distribution, and reuse, provided that the author and preprint are cited in any reuse.


