
Submitted:
12 January 2026
Posted:
14 January 2026
You are already at the latest version
Abstract
Ultrasonic vibration-assisted grinding (UVAIG) is a continuous-contact grinding process. In this process, the arc length of engagement for a single abrasive grain is longer compared to conventional grinding, which enhances the quality of the processed surface and improves processing efficiency. This study aims to establish a three-dimensional model of abrasive grains in space and to theoretically deduce the trajectory of abrasive grains during axial ultrasonic vibration-assisted internal grinding (UVAIG), as well as the resulting surface quality, measured as Ra. A three-dimensional simulation tool for ultrasonic vibration grinding micro-surfaces is developed using MATLAB. This tool enables the analysis of how various processing parameters affect workpiece surface morphology. Additionally, a predictive model is established for UVAIG simulations, allowing theoretical calculation of surface topography changes induced by different processing parameters, vibration settings, and abrasive grain models.
Keywords:
ultrasonic vibration-assisted internal grinding (UVAIG)
; surface morphology
; kinematic analysis
; micro-scale surface morphology simulation
; surface roughness
1. Introduction
Ultrasonic vibration-assisted grinding has been widely adopted as a cost-effective method for machining hard and brittle materials [1,2,3,4]. It is widely acknowledged that ultrasonic vibrations during grinding promote microscopic fracture of the workpiece [5,6,7], thereby enhancing grinding efficiency and improving surface quality [8,9]. Tawakoli T et al. [10]measured and compared the surface roughness and grinding forces of ultrasonically and conventionally ground workpieces and achieved up to 60% - 70% reduction in normal grinding force and up to 30% - 50% reduction in tangential grinding force. Shen et al.[11] analyzed and found that ultrasonic vibration improves the self-sharpening of diamond grinding wheels, and ultrasonic vibration acting on diamond grits produces a micro cutting edge. Mohammad Baraheni et al.[12] investigated subsurface damage generation in ultrasonically assisted end-face grinding, and substituting the cutting force of a single diamond grit into the crack extension equation to predict subsurface damage. Cao et al. [13]investigated the mechanism of ductile-to-brittle transition in UVAIG, where ultrasonic vibration acting on the grinding spindle contributes to material removal from the workpiece surface. Liang et al. [14]explored the material removal characteristics of single diamond grits in EUAG of single crystal sapphire, where plastic mode grinding is more easily achieved at larger vibration amplitudes. Bhaduri et al. [15]experimentally demonstrated that during ultrasonic-assisted vibration grinding of nickel-based high-temperature alloys, the three-dimensional surface roughness form parameter Sa was generally low, while St and Sz were generally high.
The above research primarily investigates the influence of ultrasonic vibration on the surface topography of ground workpieces through experimental studies. For predicting the three-dimensional topography in ultrasonic-assisted grinding, two main approaches are available. The first involves directly calculating surface topography through mathematical modeling. Wang[16] combined the Fast Fourier Transform (FFT), translation process theory and the Johnson transformation system's non-Gaussian rough surface generation method, applicable to scenarios with various autocorrelation function types and large autocorrelation lengths. Additionally, Francesc Perez-Rafols[17] achieved independent specification of power spectra and height probability distributions, generating surface topographies with three distinct height probability distributions, thereby providing more flexible means for surface topography generation. The second method for predicting three-dimensional surface topography in ultrasonic vibration-assisted grinding is based on grinding kinematics. After defining the abrasive shape, surface roughness is predicted through simulation. Compared to mathematical modeling of the ground surface, simulations based on grinding kinematics offer controllability, enabling further analysis of how grinding process conditions influence surface morphology. Gao et al. [18]derived a theoretical equation for maximum surface roughness during ultrasonic-assisted grinding by analyzing adjacent grain trajectories. Dai et al. [19]established kinematic trajectory equations for single abrasive grains in longitudinal-torsional ultrasonic grinding, along with models for single-grain cutting arc length and maximum undeformed cutting thickness, providing theoretical foundations for optimizing processing parameters to achieve more efficient material removal. Chen et al. [20]considered workpiece ultrasonic vibration and abrasive particle geometry to derive a functional equation for particle trajectories over time,and they proposed a novel surface morphology simulation model for the grinding process, which divides the workpiece into a grid and calculates the minimum remaining abrasive particle at each grid point. The above studies provide systematic theoretical analysis of the kinematic process of individual abrasive grains during ultrasonic vibration grinding. However, a comprehensive kinematic model describing the relative motion between the grinding wheel and workpiece in ultrasonic vibration grinding is still lacking.
Regarding the dynamic interaction between grinding wheels and workpieces, more research exists in conventional grinding. Zhou et al. [21]considered the random distribution of abrasive protrusion heights, by identifying the intersection points of trajectories for abrasives at different heights and employing a search method starting from the highest protruding abrasive, they sequentially determined the workpiece surface profile. Ultimately, they predicted surface roughness through numerical solutions. Wang [22] employed a particle vibration method, representing particle distribution with an N*4 matrix to simulate the surface morphology of a conventional grinding wheel. Based on the simulated grinding wheel surface morphology and defined grinding parameters, he completed a simulation of the planar grinding process. Ding [23] employed the Johnson transform and its inverse to reconstruct grinding wheel surface topography, effectively expanding surface topography data and providing more accurate surface information for subsequent grinding process analysis. Liu [24] investigated the effects of different abrasive shapes and dressing methods on workpiece surface roughness during grinding, predicting outcomes through kinematic simulation. The essence of the aforementioned methods lies in solving the intersection points of any two dimensional cutting trajectories by simplifying the abrasive into a single point or discretizing it into multiple points. However, this approach is not applicable to ultrasonic-assisted grinding. Building upon conventional grinding research, Qiu [25]established a grinding wheel model through statistical analysis of actual working surface abrasive heights. By integrating this model with a tangential ultrasonic vibration grinding kinematic model, the trajectory of each abrasive grain on the wheel was calculated and mapped onto the workpiece surface, enabling modeling and prediction of surface roughness in tangential ultrasonic vibration grinding. Chen [26] proposed a surface topography simulation model for axial ultrasonic vibration grinding. This model assumes abrasive grains as rigid spheres with random diameters, divides the workpiece into a grid, and calculates the minimum value of all grains remaining at each grid point based on the trajectory surface equation as a function of time. Zhang [27] utilized the probability density function of cutting thickness to establish a formula for the maximum undeformed chip thickness under the action of multiple abrasive particles. Through grid processing and projection mapping onto the workpiece surface, the height value of residual material was roughly calculated, establishing an ultrasonic vibration internal grinding morphology prediction model. Compared with experiments, the prediction accuracy was within 13.2%. Zhao et al.[28] conducted an in-depth analysis of vibration parameters and grinding process parameters during tangential ultrasonic vibration internal grinding through a combination of theoretical analysis and experimental verification. By modifying the abrasive trajectory and tangential force, they reduced grinding heat generation, thereby improving surface residual stress and hardness.
In summary, at present, the prediction method of the surface topography of ultrasonic vibration-assisted grinding processing is more of the grinding wheel model and kinematic model modeling, and then through the mesh processing, projection mapping to the surface of the workpiece to form the surface topography, the error of this method is large, and it is not easy to analyze the individual impact of each processing parameter on the surface topography, which has great limitations, and at the same time, for the theoretical analysis of ultrasonic vibration grinding processing, more focused on plane grinding, the theoretical study of internal cylindrical grinding is rare, lacking the consideration of axial feed rate. At the same time, the theoretical analysis of ultrasonic vibratory grinding is more focused on plane grinding, and the theoretical study of internal grinding is very little, and the consideration of axial feed rate is lacking. In this paper, the theoretical derivation method is used to complete the whole process of UVAIG surface roughness modeling from a single grinding grain to multiple grinding grains. Section 2: Establishing the UVAIG Motion Model; Section 3: Based on the UVAIG motion model, performing micro-surface morphology simulation for single-abrasive ultrasonic vibration grinding, followed by multi-abrasive ultrasonic vibration grinding micro-surface morphology simulation in both axial and circumferential directions; Section 4: Based on the predicted surface roughness results of UVAIG, the effects of rotational speed, feed rate, and amplitude on surface roughness were discussed in detail. Finally, the entire paper is summarized and conclusions are drawn.
2. Motion Model Analysis of Ultrasonic Vibration Grinding
2.1. Kinematic Analysis
As shown in Figure 1, in the ultrasonic vibration-assisted internal grinding (UVAIG), the grinding wheel and the workpiece rotate in the opposite direction, the grinding wheel rotates while doing ultrasonic vibration in the axial direction and relative to the workpiece to do the lateral feeding movement, which vs is the speed of the grinding wheel, vg is the rotational speed of the workpiece, vf is the feeding speed of the spindle, and A, f is the amplitude and frequency of ultrasonic vibration [29].
As shown in the UVAIG model, the introduction of ultrasonic vibration alters the trajectory of a single abrasive grain, thereby changing the contact arc length between the grain and the workpiece [30]. As shown in Figure 2, the establishment of a spatial coordinate system, take the intersection of the plane where the random single grain is located and the axis of the grinding wheel as the coordinate origin O, and the wheel feed direction is the x-axis positive direction.
Assuming that the abrasive grain starts to contact the workpiece at point a, arrives at point b after rotating at an angle α, and finally separates from the workpiece at point c after rotating at an angle β, the trajectory of a single abrasive grain in ultrasonic internal cylindrical grinding in the spatial coordinate system is as follows:
In the formula, r is the radius of the grinding wheel; α is the angle at which a single grit turns relative to the workpiece; φ0 is the initial phase of the ultrasonic vibration; t is the time taken for the grinding wheel to rotate at angle α; ωs is the angular velocity of the grinding wheel [31].
From formula (1), the motion trajectory equation of a single grit for ordinary internal grinding is as follows:
Based on the MATLAB simulation of the two machining methods under the single grain trajectory, the results are shown in Figure 3. As can be seen in Figure 3, the motion trajectory of a single grit in UVAIG is a sinusoidal curve in space, and the motion trajectory of a single grit in ordinary internal grinding is a curve in the plane. In order to better analyze the impact of UVAIG on the surface quality of the workpiece, according to the formula (1) to establish the UVAIG single grain and workpiece contact arc length formula is as follows:
In Figure 3, the red curve represents the trajectory of an abrasive grain in ultrasonic vibration grinding, while the blue curve shows the trajectory for one revolution of the grinding wheel in conventional grinding. It can be seen from the figure that the abrasive trajectory length of ultrasonic vibration grinding is greater than that of ordinary grinding.
2.2. Surface Roughness Modeling Analysis
During UVAIG, abrasive grains on the grinding wheel cut the workpiece surface, generating micro-grooves [32]. The residual height of the adjacent groove material is an important factor affecting the surface roughness of the workpiece after grinding. Due to the random distribution of abrasive particles on the grinding wheel, the shape, distribution interval and apex angle of each abrasive particle are different, so the residual height of adjacent grooves on the surface of the workpiece is different. For simplicity, all abrasive grains are assumed to be uniformly distributed, possess identical protrusion heights, and exhibit the same contact angle 2θ. After grinding, the residual material height in adjacent grooves on the workpiece surface is identical for each grain. The surface profile of UVAIG is shown in Figure.4.
In Figure 4, the black shaded area represents the surface residual height. For UVAIG, the motion trajectory of each individual abrasive grain follows a sinusoidal curve distributed along a spatial curve, differing from the trajectory observed in conventional internal grinding. Therefore, when analyzing the surface roughness after UVAIG, it is essential to consider the impact of interference between the motion trajectories of the abrasive grains on the residual height of the workpiece surface.
In ultrasonic vibration-assisted internal grinding, the introduction of ultrasonic vibration causes the groove width formed by a single abrasive grain on the workpiece surface to exceed that of conventional internal grinding [33]. Within a single motion cycle, each abrasive grain passes over the same cross-section twice. while the interference of different abrasive particle trajectories enhances the surface quality of bearing rings. Consequently, the residual height on the workpiece surface achieved through UVAIG is identical in both the axial and tangential directions. The axial residual height for UVAIG is as follows:
In the formula, L represents the distance between surface grooves during ultrasonic grinding.
Assuming the processing time for ultrasonic internal circular grinding is t, the distance traveled by the grinding wheel is as follows:
The distance that the workpiece turns is as follows:
During ultrasonic internal cylindrical grinding, the number of abrasive grains per cross-section is as follows:
In the formula, α is the interval between two adjacent abrasive particles.
According to the formula of contact arc length of single abrasive grain in UVAIG, the cutting trace of single abrasive grain on the cross section can be obtained:
The distance between adjacent grooves on the workpiece surface is as follows:
Therefore, the surface roughness of UVAIG workpiece is as follows:
In summary, the surface roughness of ultrasonic internal rounding decreases with the increase of ultrasonic frequency and amplitude, decreases with the increase of grinding wheel rotational speed, and increases with the increase of feed rate.
3. Simulation of Surface Topography in UVAIG
UVAIG surface topography simulation primarily models the complex scratches left on the workpiece surface by abrasive grains during grinding motion in the machining zone. This process adheres to the edge-shaped reflection principle and grain interference effects. By constructing a grain kinematic model, the three-dimensional motion trajectories of discrete points on the grain surface are projected onto the workpiece machining surface. The effective cutting height of the abrasive particle is calculated based on its motion trajectory. Cutting determination is made by comparing the particle's surface coordinates with the actual workpiece surface height. If the particle cuts into the workpiece surface, the height data at the corresponding position is updated in real time. Finally, by topologically connecting the residual heights on the workpiece surface, the micro-surface topography features of the machined surface under ideal conditions can be obtained [34], as illustrated in Figure 5.
3.1. Simulation of Surface Topography in Single-Grain UVAIG
Based on the abrasive grain motion model, a MATLAB program was developed to perform kinematic simulations of a single abrasive grain, thereby obtaining the surface morphology of UVAIG under different processing parameters. In this section, in order to balance the simulation accuracy and computational efficiency, combined with the processing parameters such as ultrasonic vibration frequency and grinding wheel rotational speed, when the speed is 12000 r/min and the frequency is 20kHz, a complete motion period is 314μm, so the size of the simulation area is set to 100μm × 400μm.
Because the size of the abrasive grain is much smaller than the diameter of the grinding wheel, it is also much larger than the set simulation area. Ignoring the rotation of the abrasive grain around the axis of the grinding wheel, the motion is approximated as uniform linear motion. Among the processing parameters used in the simulation, the minimum linear speed of the grinding wheel surface in the X direction is about 4000mm/s, and the maximum radial feed rate in the Y direction is 6.67mm/ s. The grinding speed of the grinding wheel is far greater than the feed rate of the grinding wheel. Therefore, the motion of the abrasive grain is simplified, and the linear velocity of the grinding wheel surface is still maintained in the X direction for grinding, while in the Y direction, the feed length Fp of the grinding wheel per revolution is calculated according to the rotation speed and feed rate of the abrasive grain grinding wheel, which indicates that the abrasive grain moves along the X direction at a set feed rate, and the abrasive grain rotates around the axis of the grinding wheel. The distance of the abrasive grain to the grinding area after returning to the grinding area on the X axis.
A program was developed in MATLAB to simulate the micro-scale surface morphology of axial UVAIG. The micro-scale surface morphology generated by the kinematic simulation of a single abrasive particle is shown in the following picture. In the left subfigure, the red area represents the unprocessed surface, while the blue area indicates the deepest groove generated by the abrasive grain. The image on the right side is the top view of the whole processing area, which is convenient to observe the trajectory of the abrasive particles.
In the simulation test shown in Figure 6, the ultrasonic amplitude A=6μm, frequency f=20kHz, grinding depth ap=6μm, the axial feed rate in the Z-direction was νf = 200mm/min, and the initial grinding wheel rotational speed was n=8000r/min. Each test incremented the speed by 4000 r/min. It can be observed that as the grinding speed increases, the spacing of the abrasive particle trajectories in the Z-direction continuously decreases, while the feed rate in this direction remains unchanged. As the grinding wheel rotational speed increases, the rotational cycle of the abrasive grains decreases, causing them to pass through the machining zone more frequently. This ultimately reduces the feed per revolution of the grinding wheel, resulting in increasingly dense abrasive grain trajectories and a continuously expanding coverage area. In the simulation test at 20000 r/min, the program was configured for single-abrasive-grain grinding. However, the abrasive grain's trajectory already covered the entire grinding area, causing interference between the subsequent grinding trajectory and the preceding one. This occurs because at this grinding speed, the abrasive grain's feed increment becomes smaller than its own base radius. Simultaneously, it can be observed that as the grinding speed increases, the ultrasonic vibration cycle is progressively elongated. At a grinding speed of 20000 r/min, the abrasive particle trajectory approaches that of conventional grinding, and the effect of ultrasonic vibration diminishes. It can be inferred that in subsequent experiments, increasing the grinding speed will weaken the gains provided by ultrasonic vibration.
In the simulation test shown in Figure 7, the ultrasonic amplitude A=6μm, the frequency f=20kHz, the grinding depth ap=6μm, the grinding wheel rotational speed n=12000r/min, and the axial feed rate started at 100 mm/min, increasing incrementally by 100 mm/min for each test. It can be observed that the abrasive particle trajectories are densest at a feed rate of 100 mm/min, with individual particles already interfering with their previous movement paths during motion. As the feed rate increases, the spacing in the Z-direction gradually widens, and the abrasive particle trajectories become increasingly sparse. This indicates that, with other parameters held constant, increasing the feed rate reduces the time consumed by the grinding process and improves machining efficiency, but may simultaneously lead to a deterioration in the quality of the machined surface.
In the simulation test shown in Figure 8, the frequency f=20kHz, the grinding depth ap=6μm, the grinding wheel rotational speed n=12000r/min, and the initial grinding wheel rotational speed νf = 200mm/min, and the ultrasonic amplitude is sequentially set to 0, 3, 6, and 9 μm. The figure depicts the kinematic simulation results of ultrasonic vibration grinding for a single abrasive grain. At an amplitude of 0 μm, the process behaves as conventional grinding, with the abrasive particle tracing a straight-line trajectory. During ultrasonic vibration grinding, the particle's motion trajectory approximates a sine curve. Furthermore, as the amplitude increases, the coverage area of the particle's trajectory also expands. Therefore, it can be inferred that within a certain range, increasing the amplitude can enhance the grinding efficiency of ultrasonic vibration machining.
Unlike conventional grinding, which only considers the feed per revolution of the grinding wheel, several sets of grinding simulation tests that alter processing parameters were conducted under the premise that the axial position of the abrasive grains remains identical each time they traverse the same generatrix of the grinding wheel's cylindrical surface during ultrasonic vibration grinding. During actual ultrasonic vibration grinding, abrasive grains undergo both circumferential rotation and axial vibration. After introducing periodic axial motion, the axial position of the grain when reaching the grinding wheel's cylindrical generatrix is not necessarily consistent, exhibiting a phase difference each time it passes the same generatrix. At constant vibration frequency and amplitude, the axial position variation of the abrasive particle is related to the grinding wheel radius and exhibits periodic changes. Figure 9 shows the micro-scale surface morphology produced on the workpiece when the abrasive particle undergoes periodic phase changes under fixed parameters. After introducing the phase angle, the abrasive particle's trajectory shifts to some extent in the X-direction, forming a more complex micro-surface texture pattern. This texture differs from the X-directional displacement of the abrasive particle; it is an offset formed by the trajectory of the same abrasive particle itself. As seen in Figure 9, under specific phase differences, the abrasive particle can interfere with its own trajectory from the previous rotational cycle.
3.2. Simulation of Surface Morphology of Multi-Grain UVAIG
Unlike turning and milling, which involve single-edge cutting operations, grinding employs multiple abrasive grains arranged on the wheel surface, constituting a multi-edge machining process [35]. The surface morphology generated by a single abrasive grain differs significantly from the actual morphology. Therefore, building upon the single-grain micro-surface morphology simulation discussed in the preceding subsection, it is necessary to analyze the influence of multi-grain spacing on micro-surface morphology.
As shown in Figure 10, the black curve represents the schematic trajectory of conventional grinding abrasive particles, the blue curve depicts the initial abrasive particle trajectory in ultrasonic vibration grinding, the red curve illustrates the movement trajectory of abrasive particles axially adjacent to the initial particle during ultrasonic vibration, and the purple curve shows the movement trajectory of abrasive particles axially adjacent to the initial particle during ultrasonic vibration.
During ultrasonic vibration-assisted internal grinding, abrasive grains on the grinding wheel perform micro-cutting on the workpiece surface. Each grain leaves a cutting trace on the surface, and between these traces, minute uncut areas form, defined as residual areas. The presence of residual areas creates microscopic surface irregularities, larger residual areas result in higher surface roughness values. This section conducts simulation experiments based on the assumptions of uniform abrasive particle size and consistent protrusion height, investigating the effect of different abrasive spacings on residual area. Abrasive spacing encompasses both axial and circumferential spacing. Consequently, the influence of axial adjacent abrasive spacing and circumferential adjacent abrasive spacing on residual area is examined sequentially, thereby exploring the patterns of how abrasive arrangement affects micro-scale surface morphology.
As shown in Figure 11, simulation of micro-scale surface morphology during ultrasonic vibration grinding at different axial abrasive particle spacings. The grinding simulation test parameters are: grinding wheel rotational speed n=12000r/min, axial feed rate νf = 200mm/min, vibration frequency f=20kHz, and grinding depth ap=6μm. The motion trajectories of two adjacent abrasive grains differ only in their initial positions. The spacing between these grains directly influences the interference area between their trajectories. Its cross-sectional schematic is shown in Figure 12:
In the cross-section shown in Figure 12, the residual area of the ZOY plane is jointly determined by the abrasive particle spacing, grinding wheel rotational speed, feed rate, and abrasive particle cross-sectional shape. The residual area influences the final micro-scale surface morphology of the machined surface. Under the experimental machining parameters, residual areas were statistically measured for abrasive particle spacings ranging from 40 μm to 88 μm. The residual area curves for different axial spacings are shown in Figure 13:
As shown in Figure 13, under these conditions, the residual area varies periodically with axial abrasive spacing. The maximum residual area occurs at a spacing of 50 µm, while the minimum is observed at 58 µm. The period length of the curve variation in the figure is approximately 17 μm, determined jointly by the grinding wheel rotational speed and axial feed rate. Combined with Figure 12, it is evident that when the abrasive spacing is an integer multiple of the feed period length Fp, the overlapping area of abrasive trajectories is maximized, and the residual area is minimized. Conversely, when adjacent abrasives are positioned midway between the trajectories of a single grain, the overlap is minimized, material removal is maximized, and the residual area is minimized. This configuration is conducive to achieving lower surface roughness.
Figure 14 shows the simulated micro-scale surface morphology of ultrasonic vibration grinding under different circumferential abrasive particle spacings. The grinding simulation test parameters are: grinding wheel rotational speed n =12000r/min, axial feed rate νf =200mm/min, vibration frequency f =20kHz, and grinding depth ap=6μm. The motion trajectories of two adjacent abrasive grains differ only in their initial circumferential positions. The spacing between these grains directly influences the residual area on the machined surface [36].
The trajectories of circumferentially adjacent abrasive grains produce varying degrees of interference depending on their spacing. Material is removed from the regions traversed by these trajectories, while areas inaccessible to the trajectories remain as residual surfaces. Figure 15 illustrates the schematic diagram of the ultrasonic vibration grinding motion trajectories of circumferentially adjacent abrasive grains.
As shown in Figure 16, the residual area initially decreases as the circumferential abrasive spacing increases. the residual area gradually decreases. The residual area reaches its minimum at an inter-abrasive particle spacing of 170 μm. When the spacing exceeds 170 μm, the surface residual area gradually increases. Beyond 280 μm, the residual area rises sharply before declining after reaching 320 μm. This occurs because under the processing parameters of the simulation test, each ultrasonic vibration cycle spans approximately 320 μm. Consequently, the residual area of the abrasive particles also exhibits periodic variation with particle spacing. The cycle interval length is jointly determined by the grinding wheel rotational speed, vibration frequency, and wheel diameter in ultrasonic vibration grinding. The cycle interval calculation formula is as follows:
When the circumferential spacing between abrasive grains is half of Lt, the overlapping area of the two grains' trajectories is minimal, and the corresponding residual area is also minimal. Based on this conclusion, under these machining parameters, a circumferential spacing of approximately 170 μm between abrasive grains on the grinding wheel surface can achieve the lowest surface roughness without increasing the number of grains.
4. Prediction Analysis of Surface Roughness of UVAIG
4.1. Prediction of Surface Roughness of UVAIG
In traditional grinding, surface topography measurements must be performed after grinding experiments are completed. This study employs computer simulation to model the grinding process, allowing for the prediction of micro-surface topography based on specified parameters before physical experiments. By decomposing the grinding process, calculating the trajectories of single and multiple abrasive grains, and establishing a mathematical model of grinding, MATLAB programming facilitates rapid computation of the spatial motion trajectories of abrasive grains and the resulting micro-surface topography.
This program can predict surface roughness based on input machining parameters. Although there is a certain discrepancy with the actual number of abrasive grains participating in the grinding process, the trend of surface roughness variation generated still allows inference of how different parameters affect surface morphology. Figure 17 presents micro-scale surface morphology prediction results from ultrasonic vibration grinding particle motion simulations for two sets of parameters. The experimental machining conditions were: grinding wheel rotational speed n=12000r/min, grinding depth ap=5μm, ultrasonic vibration frequency f=20kHz, and ultrasonic amplitude A=6μm. Statistical analysis of the simulation results indicates a surface roughness Sa=0.701μm was obtained with the abrasive particle spacing in Figure 17(a), while the surface roughness Sa=0.741μm was achieved with the spacing in Figure 17(b). Under these processing parameters, the surface roughness obtained with the abrasive particle spacing ∆z=58μm,∆x=170μm is lower than that achieved with the spacing ∆z=40μm,∆x=40μm.
4.2. Analysis of Surface Roughness Prediction Results of UVAIG
This section investigates the relationship between wheel speed, feed rate, ultrasonic amplitude, and the surface roughness Sa. Using three-dimensional roughness Sa as the surface quality evaluation metric, bearing steel was employed as the workpiece. Surface roughness data was measured in the machined area post-processing. Numerous parameters influence surface morphology in UVAIG. To investigate their individual effects on surface characteristics, single-factor experiments were conducted by varying one parameter while keeping others constant. The experimental design is shown in Table 1:
As shown in Figure 18, under identical machining conditions, increasing the grinding wheel rotational speed in both grinding processes reduces the surface roughness of the workpiece. When the grinding wheel rotational speed increased from 8000 r/min to 20000 r/min, the surface roughness of conventional grinding decreased by 31.1%, while that of ultrasonic vibration grinding decreased by 32.9%. Moreover, the surface roughness of ultrasonic vibration grinding remained consistently lower than that of conventional grinding. At 12000 r/min, ultrasonic grinding exhibited the most significant impact on surface roughness, with 21.1% difference in Sa values compared to conventional grinding. When the speed was increased to 20000 r/min, the gap between ultrasonic and conventional grinding Sa values narrowed to 15.2%.
Increasing the wheel speed increases the number of active abrasive grains, thereby reducing the material removal volume per grain. This gradually diminishes the plastic deformation during the plowing process. In UVAIG, the abrasive grains follow longer trajectories, and ultrasonic vibration induces interference in their paths, resulting in multiple grinding passes at the same location. This effectively reduces surface roughness. Comparison with the simulation results from Section 3 reveals that, at constant vibration frequency, higher grinding speeds in UVAIG cause the grain trajectories to more closely resemble those in conventional grinding. Consequently, the improvement in surface quality achieved by ultrasonic vibration diminishes as the speed increases.
The relationship between feed rate and surface roughness is shown in Figure 19. As the feed rate increased from 100 mm/min to 400 mm/min, the surface roughness Sa value increased for both grinding methods. Ultrasonic grinding consistently produced better surface quality, with an average Sa reduction of 21.5% compared to conventional grinding under identical parameters.
As shown in Figure 20, using conventional grinding (amplitude 0 μm) as the baseline, increasing the amplitude to 3 μm, 6 μm, and 9 μm sequentially reduces the surface roughness Sa by 11.8%, 21.1%, and 27.6%, respectively, with the best surface quality achieved at the 9 μm amplitude. Increasing the amplitude enhances the periodic impact effect of abrasive particles, amplifying the interference effect between particle trajectories. This induces repeated grinding action, resulting in smaller chip volumes and reducing the impact of chips on the grinding process. Therefore, ultrasonic vibration with an appropriately sized amplitude contributes to a reduction in surface roughness.
5. Conclusions
Based on a UVAIG trajectory model, this paper investigates the influence of processing parameters and abrasive arrangement on micro-scale surface morphology. A geometric model of abrasive grains is constructed and combined with the ultrasonic vibration grinding trajectory model to form a micro-scale surface morphology model. Machining parameters are defined for UVAIG simulation, leading to the development of a surface topography prediction algorithm based on the micro-scale morphology model. The simulation program is developed using MATLAB platform to realize the prediction and analysis of micro-scale surface morphology and roughness of ultrasonic grinding. The main findings are summarized as follows:
- (1)
- Based on abrasive grain kinematics, a mathematical model is established, a grain-workpiece interaction simulation model is constructed, and a predictive tool for UVAIG micro-scale surface morphology is developed.
- (2)
- Comparative simulations show that increasing wheel speed shortens the grain feed cycle, leading to denser trajectories and expanded coverage, which alters trajectory interference and micro-surface morphology. A higher axial feed rate increases trajectory spacing and reduces density, improving efficiency at the cost of surface quality. Increasing vibration amplitude expands the trajectory coverage range, enhancing grinding efficiency within a certain range.
- (3)
- The relationship between inter-grain spacing and micro-scale surface morphology was analyzed. The correlation between spacing and residual area was explored, yielding a characteristic curve. Simulation tests identified optimal abrasive spacing under specific parameters, providing a theoretical basis for optimizing grinding wheel topography and improving surface quality.
- (4)
- Based on UVAIG surface roughness predictions, the effects of processing parameters on Sa were explored. The introduction of ultrasonic vibration reduces workpiece surface roughness. At amplitudes of 3, 6, and 9 µm, roughness decreases by 11.8%, 21.1%, and 27.6%, respectively, compared to conventional grinding. Increasing wheel speed also improves surface quality. From 8000 to 20,000 r/min, Sa decreases by 31.1% in conventional and 32.9% in ultrasonic grinding. The maximum improvement (21.1% lower Sa) occurs at 12,000 r/min. This benefit weakens at higher speeds, with the difference reduced to 15.2% at 20,000 r/min. Although a higher feed rate improves efficiency, it increases roughness. From 100 to 400 mm/min, Sa increases for both methods, but ultrasonic grinding consistently yields better surface quality.
References
- LU X, LI H, ZHANG X, et al. Magnetic-assisted self-powered acceleration sensor for real-time monitoring vehicle operation and collision based on triboelectric nanogenerator[J/OL]. Nano Energy, 2022, 96: 107094. [CrossRef]
- CHEN G, WANG J, FU K, et al. Quality enhancement and defect suppression in SiC/SiC composites by ultrasonic vibration-assisted helical grinding[J/OL]. Materials Today Communications, 2025, 49: 114244. [CrossRef]
- ZHOU Y, JIA S, LU Y, et al. Study on ultrasonic elliptical vibration-assisted grinding mechanism and surface quality of C/SiC composite material[J/OL]. Diamond and Related Materials, 2024, 149: 111565. [CrossRef]
- YANG Z, ZHU L, NI C, et al. Investigation of surface topography formation mechanism based on abrasive-workpiece contact rate model in tangential ultrasonic vibration-assisted CBN grinding of ZrO2 ceramics[J/OL]. International Journal of Mechanical Sciences, 2019, 155: 66-82. [CrossRef]
- SUN S, TANG J, SHAO W, et al. Research on the matching relationship between ultrasonic-assisted grinding parameters and workpiece surface roughness[J/OL]. The International Journal of Advanced Manufacturing Technology, 2019, 102(1-4): 487-496. [CrossRef]
- YANG Z, ZHU L, NI C, et al. Investigation of surface topography formation mechanism based on abrasive-workpiece contact rate model in tangential ultrasonic vibration-assisted CBN grinding of ZrO2 ceramics[J/OL]. International Journal of Mechanical Sciences, 2019, 155: 66-82. [CrossRef]
- WU Y B, FAN Y, TACHIBANA T, et al. Effect of Ultrasonic Elliptic Vibration on Friction between Shoe and Workpiece in Ultrasonic Elliptic-Vibration Shoe Centerless Grinding[J/OL].2005,291-292: 33-38. [CrossRef]
- MIAO Q, LU M, DING W, et al. Creep-feed grinding of single crystal nickel-base turbine blade fir-tree roots: tool wear, grinding force, temperature, and surface integrity[J/OL]. The International Journal of Advanced Manufacturing Technology, 2023, 126(3-4): 1453-1470. [CrossRef]
- ZHAO B, YOU H, MIAO Q, et al. Surface integrity characterization of third-generation nickel-based single crystal blade tenons after ultrasonic vibration-assisted grinding[J/OL]. Chinese Journal of Aeronautics, 2025, 38(1): 103138. [CrossRef]
- TAWAKOLI T, AZARHOUSHANG B. Influence of ultrasonic vibrations on dry grinding of soft steel[J/OL]. International Journal of Machine Tools and Manufacture, 2008, 48(14): 1585-1591. [CrossRef]
- SHEN J Y, WANG J Q, JIANG B, et al. Study on wear of diamond wheel in ultrasonic vibration-assisted grinding ceramic[J/OL]. Wear, 2015, 332-333: 788-793. [CrossRef]
- BARAHENI M, AMINI S. Predicting subsurface damage in silicon nitride ceramics subjected to rotary ultrasonic assisted face grinding[J/OL]. Ceramics International, 2019, 45(8): 10086-10096. [CrossRef]
- CAO J, NIE M, LIU Y, et al. Ductile-brittle transition behavior in the ultrasonic vibration-assisted internal grinding of silicon carbide ceramics[J/OL]. The International Journal of Advanced Manufacturing Technology, 2018, 96(9-12): 3251-3262. [CrossRef]
- LIANG Z, WANG X, WU Y, et al. Experimental study on brittle–ductile transition in elliptical ultrasonic assisted grinding (EUAG) of monocrystal sapphire using single diamond abrasive grain[J/OL]. International Journal of Machine Tools and Manufacture, 2013, 71: 41-51. [CrossRef]
- BHADURI D, SOO S L, ASPINWALL D K, et al. A Study on Ultrasonic Assisted Creep Feed Grinding of Nickel Based Superalloys[J/OL]. Procedia CIRP, 2012, 1: 359-364. [CrossRef]
- WANG Y, LIU Y, ZHANG G, et al. A Simulation Method for Non-Gaussian Rough Surfaces Using Fast Fourier Transform and Translation Process Theory[J/OL]. Journal of Tribology, 2017, 140(2). [CrossRef]
- PÉREZ-RÀFOLS F, ALMQVIST A. Generating randomly rough surfaces with given height probability distribution and power spectrum[J/OL]. Tribology International, 2019, 131: 591-604. [CrossRef]
- GAO G F, ZHAO B, XIANG D H, et al. Research on the surface characteristics in ultrasonic grinding nano zirconia ceramics[J/OL]. Journal of Materials Processing Technology, 2009, 209(1): 32-37. [CrossRef]
- DAI C, YIN Z, WANG P, et al. Analysis on ground surface in ultrasonic face grinding of silicon carbide (SiC) ceramic with minor vibration amplitude[J/OL]. Ceramics International, 2021, 47(15): 21959-21968. [CrossRef]
- CHEN H, TANG J, ZHOU W. An experimental study of the effects of ultrasonic vibration on grinding surface roughness of C45 carbon steel[J/OL]. The International Journal of Advanced Manufacturing Technology, 2013, 68(9-12): 2095-2098. [CrossRef]
- ZHOU X, XI F. Modeling and predicting surface roughness of the grinding process[J/OL]. International Journal of Machine Tools and Manufacture, 2002, 42(8): 969-977. [CrossRef]
- WANG S, LI C, ZHANG D, et al. Modeling the operation of a common grinding wheel with nanoparticle jet flow minimal quantity lubrication[J/OL]. The International Journal of Advanced Manufacturing Technology, 2014, 74(5-8): 835-850. [CrossRef]
- DING W, DAI C, YU T, et al. Grinding performance of textured monolayer CBN wheels: Undeformed chip thickness nonuniformity modeling and ground surface topography prediction[J/OL]. International Journal of Machine Tools and Manufacture, 2017, 122: 66-80. [CrossRef]
- LIU Y, WARKENTIN A, BAUER R, et al. Investigation of different grain shapes and dressing to predict surface roughness in grinding using kinematic simulations[J/OL]. Precision Engineering, 2013, 37(3): 758-764. DOI:doi:10.1016/j.precisioneng.2013.02.009.
- QIU Y, YIN J, CAO Y, et al. Generation mechanism modeling of surface topography in tangential ultrasonic vibration-assisted grinding with green silicon carbide abrasive wheel[J/OL]. Proceedings of the Institution of Mechanical Engineers, Part B: Journal of Engineering Manufacture, 2021, 236(6-7): 694-706. [CrossRef]
- CHEN H, TANG J. A model for prediction of surface roughness in ultrasonic-assisted grinding[J/OL]. The International Journal of Advanced Manufacturing Technology, 2014, 77(1-4): 643-651. [CrossRef]
- ZHANG H, JIAO F, LIAN X, et al. Surface quality in ultrasonic-electrolytic internal grinding of GCr15 steel[J/OL]. International Journal of Mechanical Sciences, 2025, 291-292: 110188. [CrossRef]
- ZHAO B, GUO X, YIN L, et al. Surface quality in axial ultrasound plunging-type grinding of bearing internal raceway[J/OL]. The International Journal of Advanced Manufacturing Technology, 2020, 106(11-12): 4715-4730. [CrossRef]
- CHEN F, MEI G, ZHAO B, et al. Study on the characteristics of zirconia ceramic in three-dimensional ultrasonic vibration-assisted ELID internal grinding[J/OL]. Journal of Mechanical Science and Technology, 2020, 34(1): 333-344. [CrossRef]
- ZHANG H, NIU Y, JIA X, et al. Longitudinal–Torsional Ultrasonic Grinding of GCr15: Development of Longitudinal–Torsional Ultrasonic System and Prediction of Surface Topography[J/OL]. Micromachines, 2023, 14(8): 1626. [CrossRef]
- JIE Y, JIAO F, NIU Y, et al. Effect of ultrasonic vibration on oxide layer properties in ultrasonic-assisted ELID internal cylinder grinding[J/OL]. Ultrasonics Sonochemistry, 2024, 103: 106783. [CrossRef]
- YANG S, ZHENG L, GUAN J, et al. Mechanism-based prediction of helical gear grinding Surface roughness: Integrated modeling of spatial kinematics and abrasive trajectory effects[J/OL]. Precision Engineering, 2026, 98: 49-62. [CrossRef]
- ZHOU W, TANG J, SHAO W. Study on surface generation mechanism and roughness distribution in gear profile grinding[J/OL]. International Journal of Mechanical Sciences, 2020, 187: 105921. [CrossRef]
- LI L, TANG J, WEN Y, et al. Numerical Simulation of Ultrasonic-Assisted Grinding Surfaces With Fast Fourier Transform[J/OL]. Journal of Tribology, 2020, 142(9). [CrossRef]
- KISHORE K, SINHA M K, CHAUHAN S R. A comprehensive investigation of surface morphology during grinding of Inconel 625 using conventional grinding wheels[J/OL]. Journal of Manufacturing Processes, 2023, 97: 87-99. [CrossRef]
- LEI X, XIANG D, PENG P, et al. Study on surface residual stress of hardened 12Cr2Ni4A alloy steel by ultrasonic vibration-assisted ELID grinding[J/OL]. The International Journal of Advanced Manufacturing Technology, 2021, 118(1-2): 641-649. [CrossRef]
Figure 1.
UVAIG model.
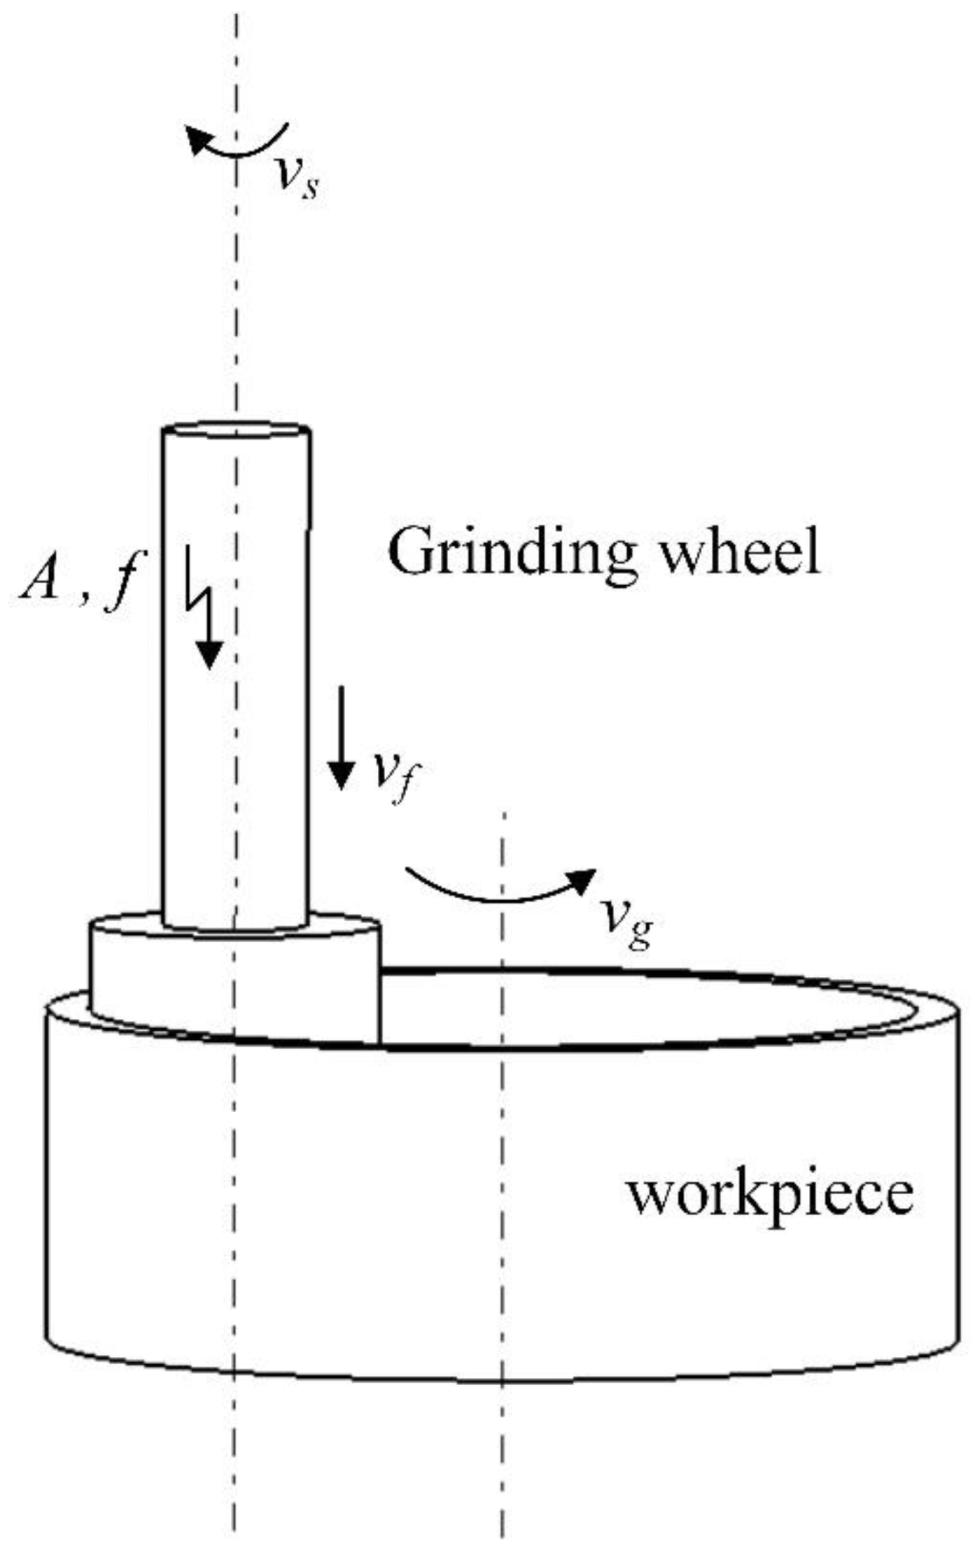
Figure 2.
Single abrasive particle trajectory diagram.
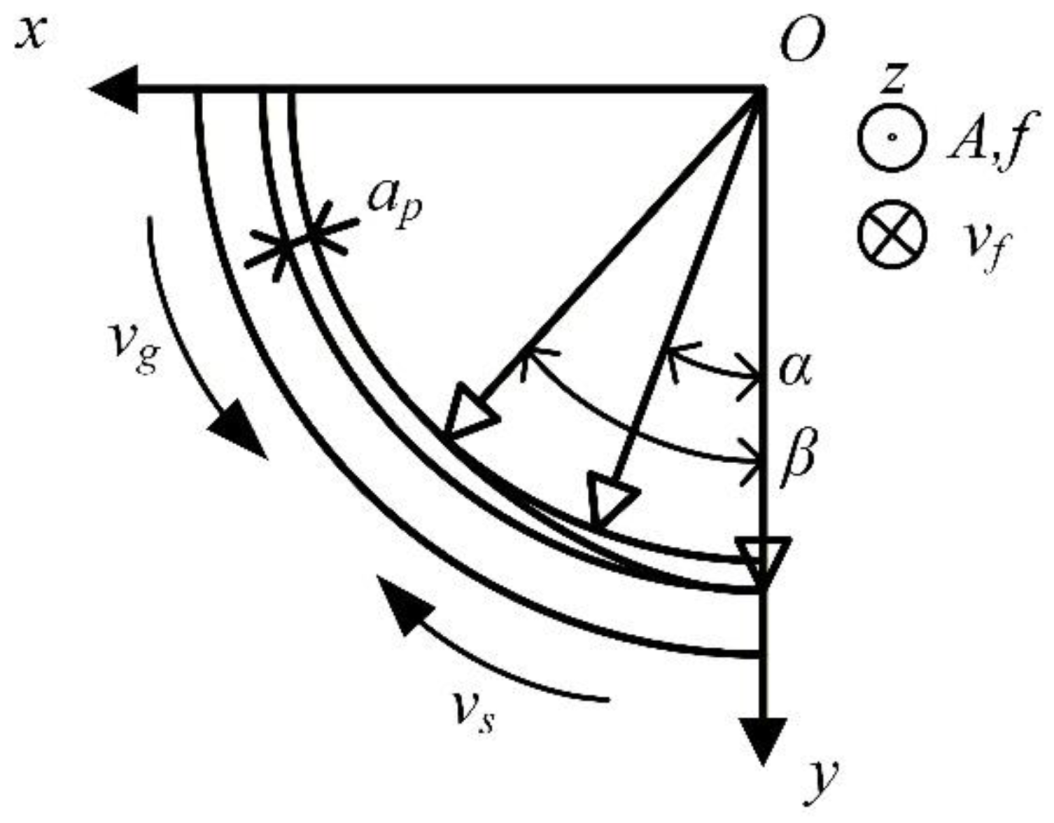
Figure 3.
Schematic of abrasive grain trajectory of the abrasive grain rotating around the axis of the grinding wheel for one circle.
Figure 3.
Schematic of abrasive grain trajectory of the abrasive grain rotating around the axis of the grinding wheel for one circle.
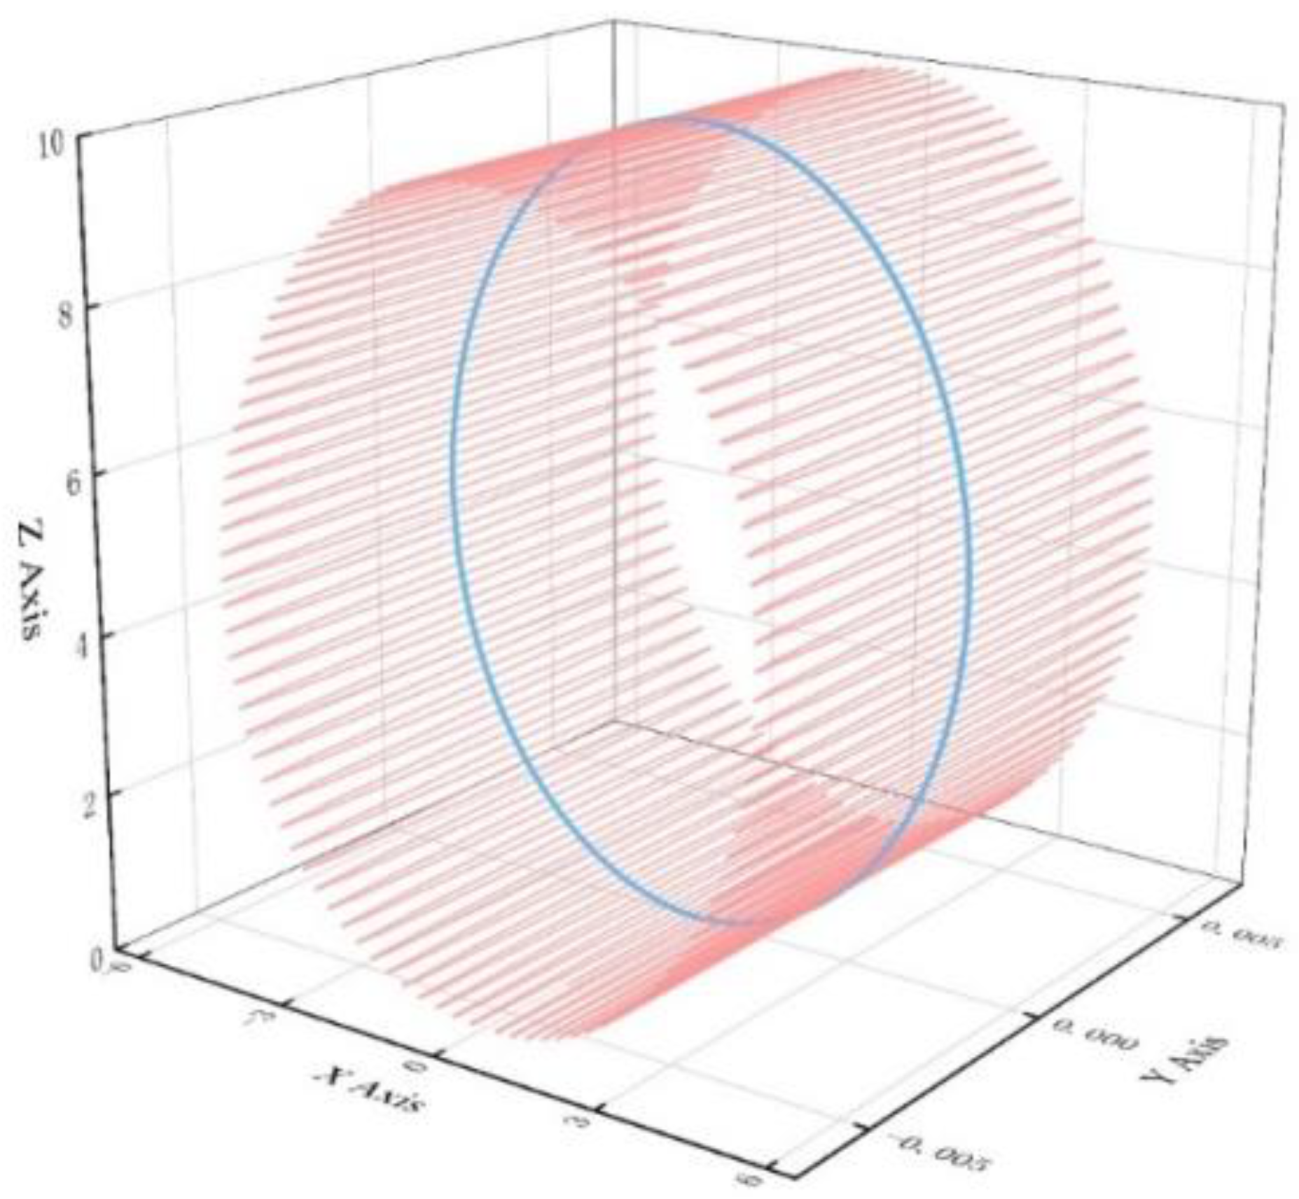
Figure 4.
Surface contour map of UVAIG.
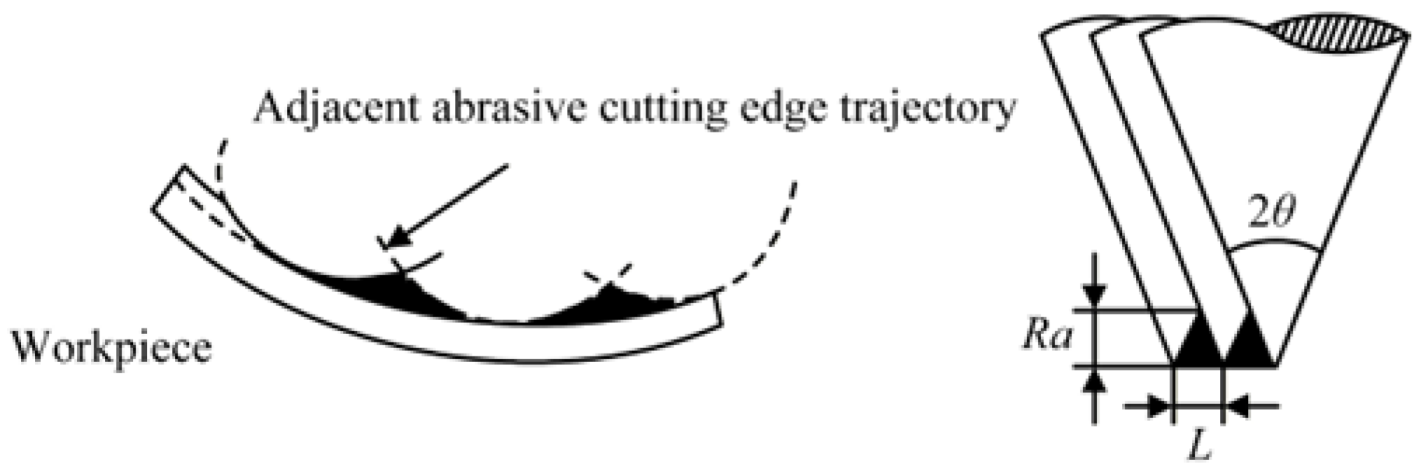
Figure 5.
Simulation flow chart of micro-scale surface morphology in UVAIG.
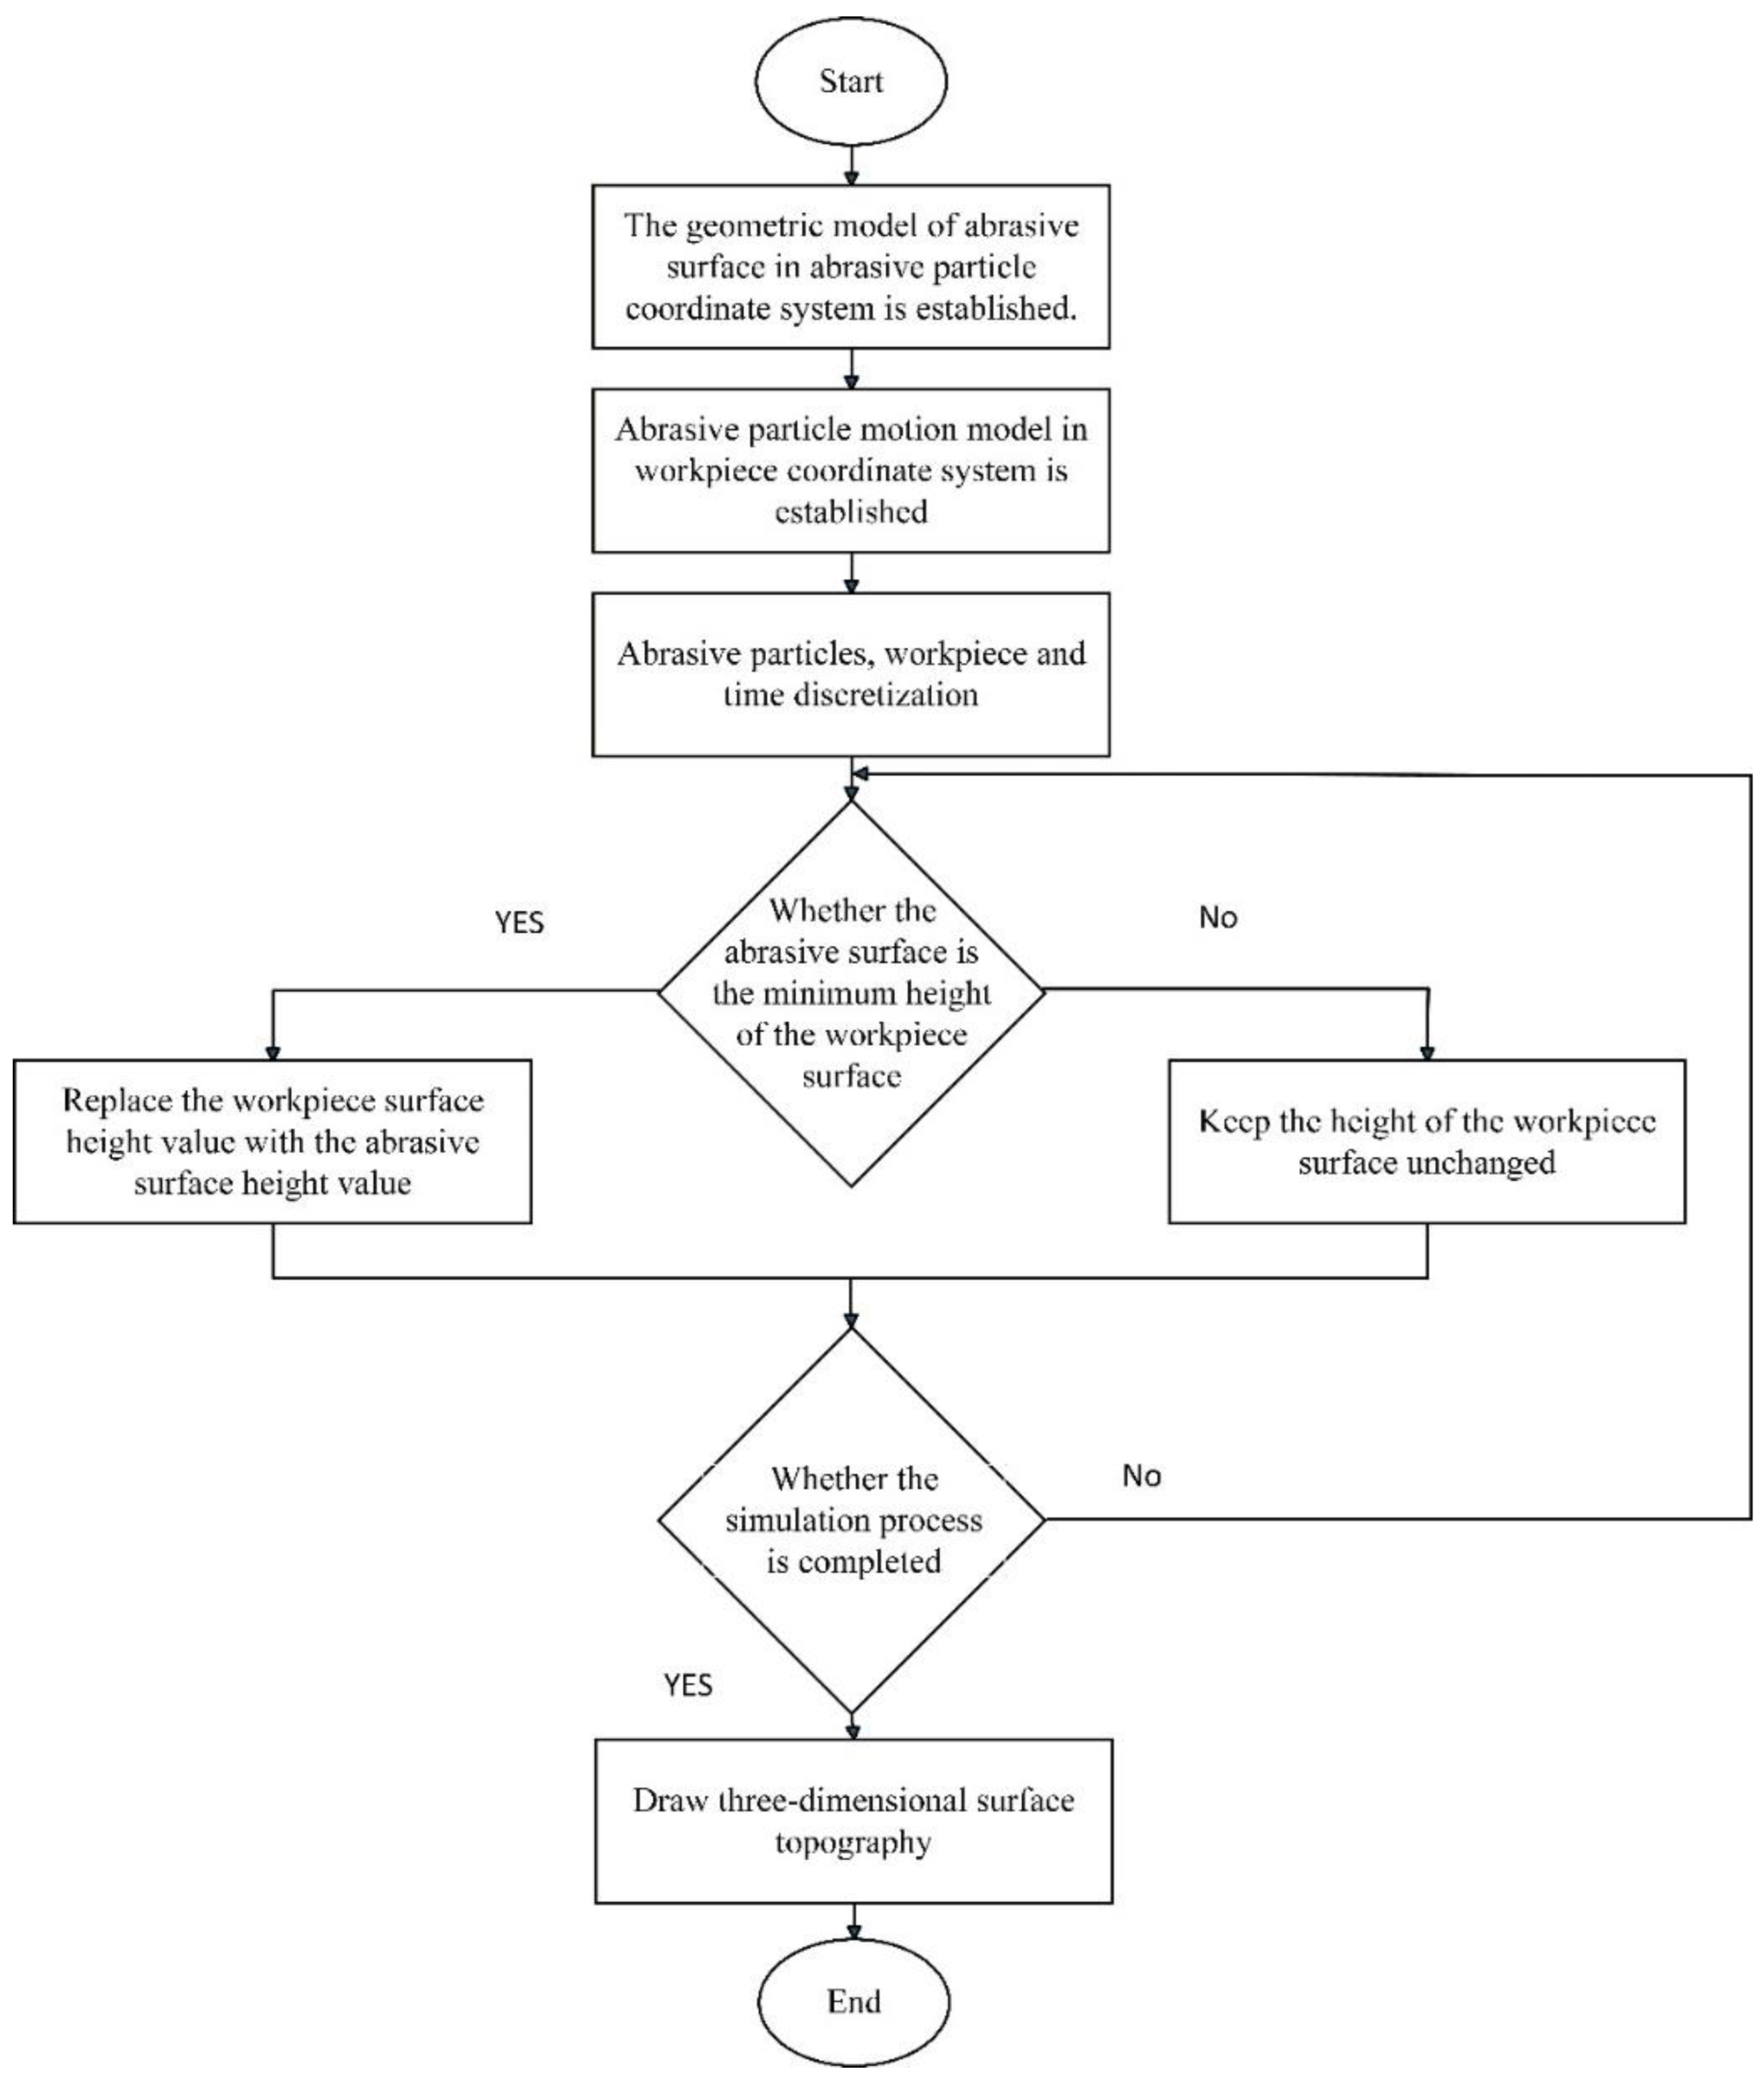
Figure 6.
Simulation of micro-scale surface morphology of UVAIG under different grinding wheel rotational speed.
Figure 6.
Simulation of micro-scale surface morphology of UVAIG under different grinding wheel rotational speed.
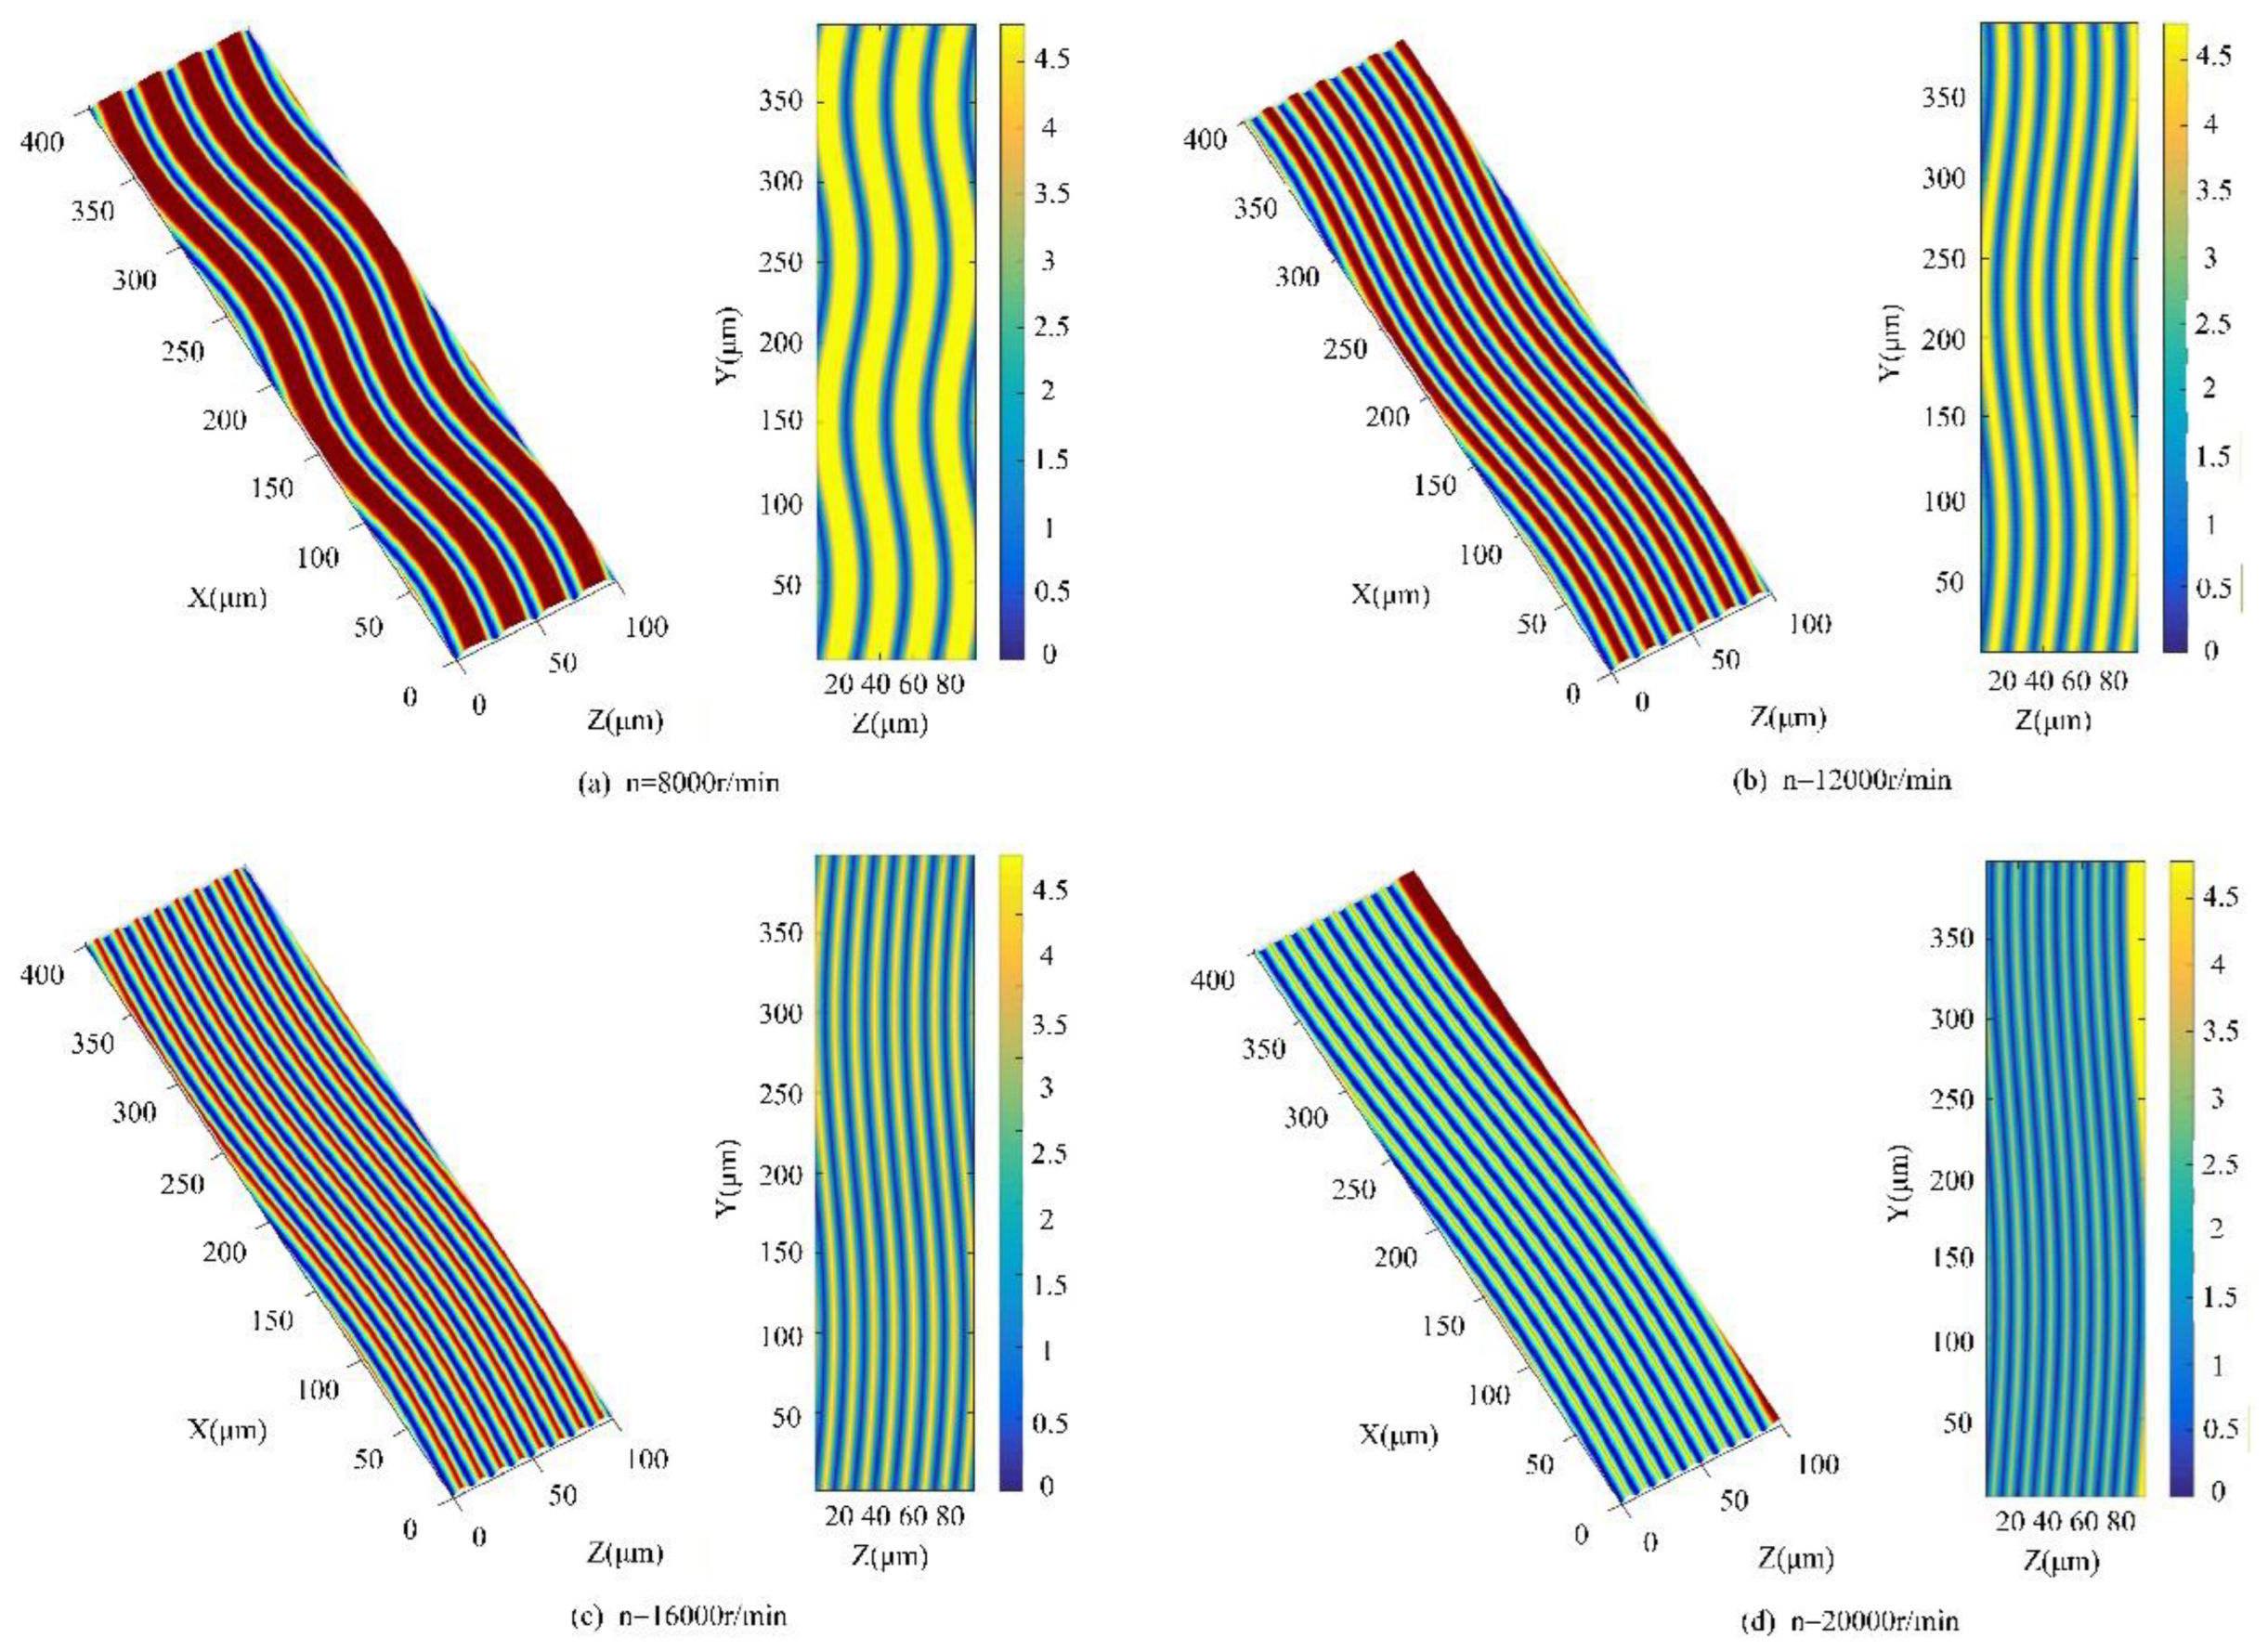
Figure 7.
Simulation of micro-scale surface morphology of UVAIG at different axial feed rates.
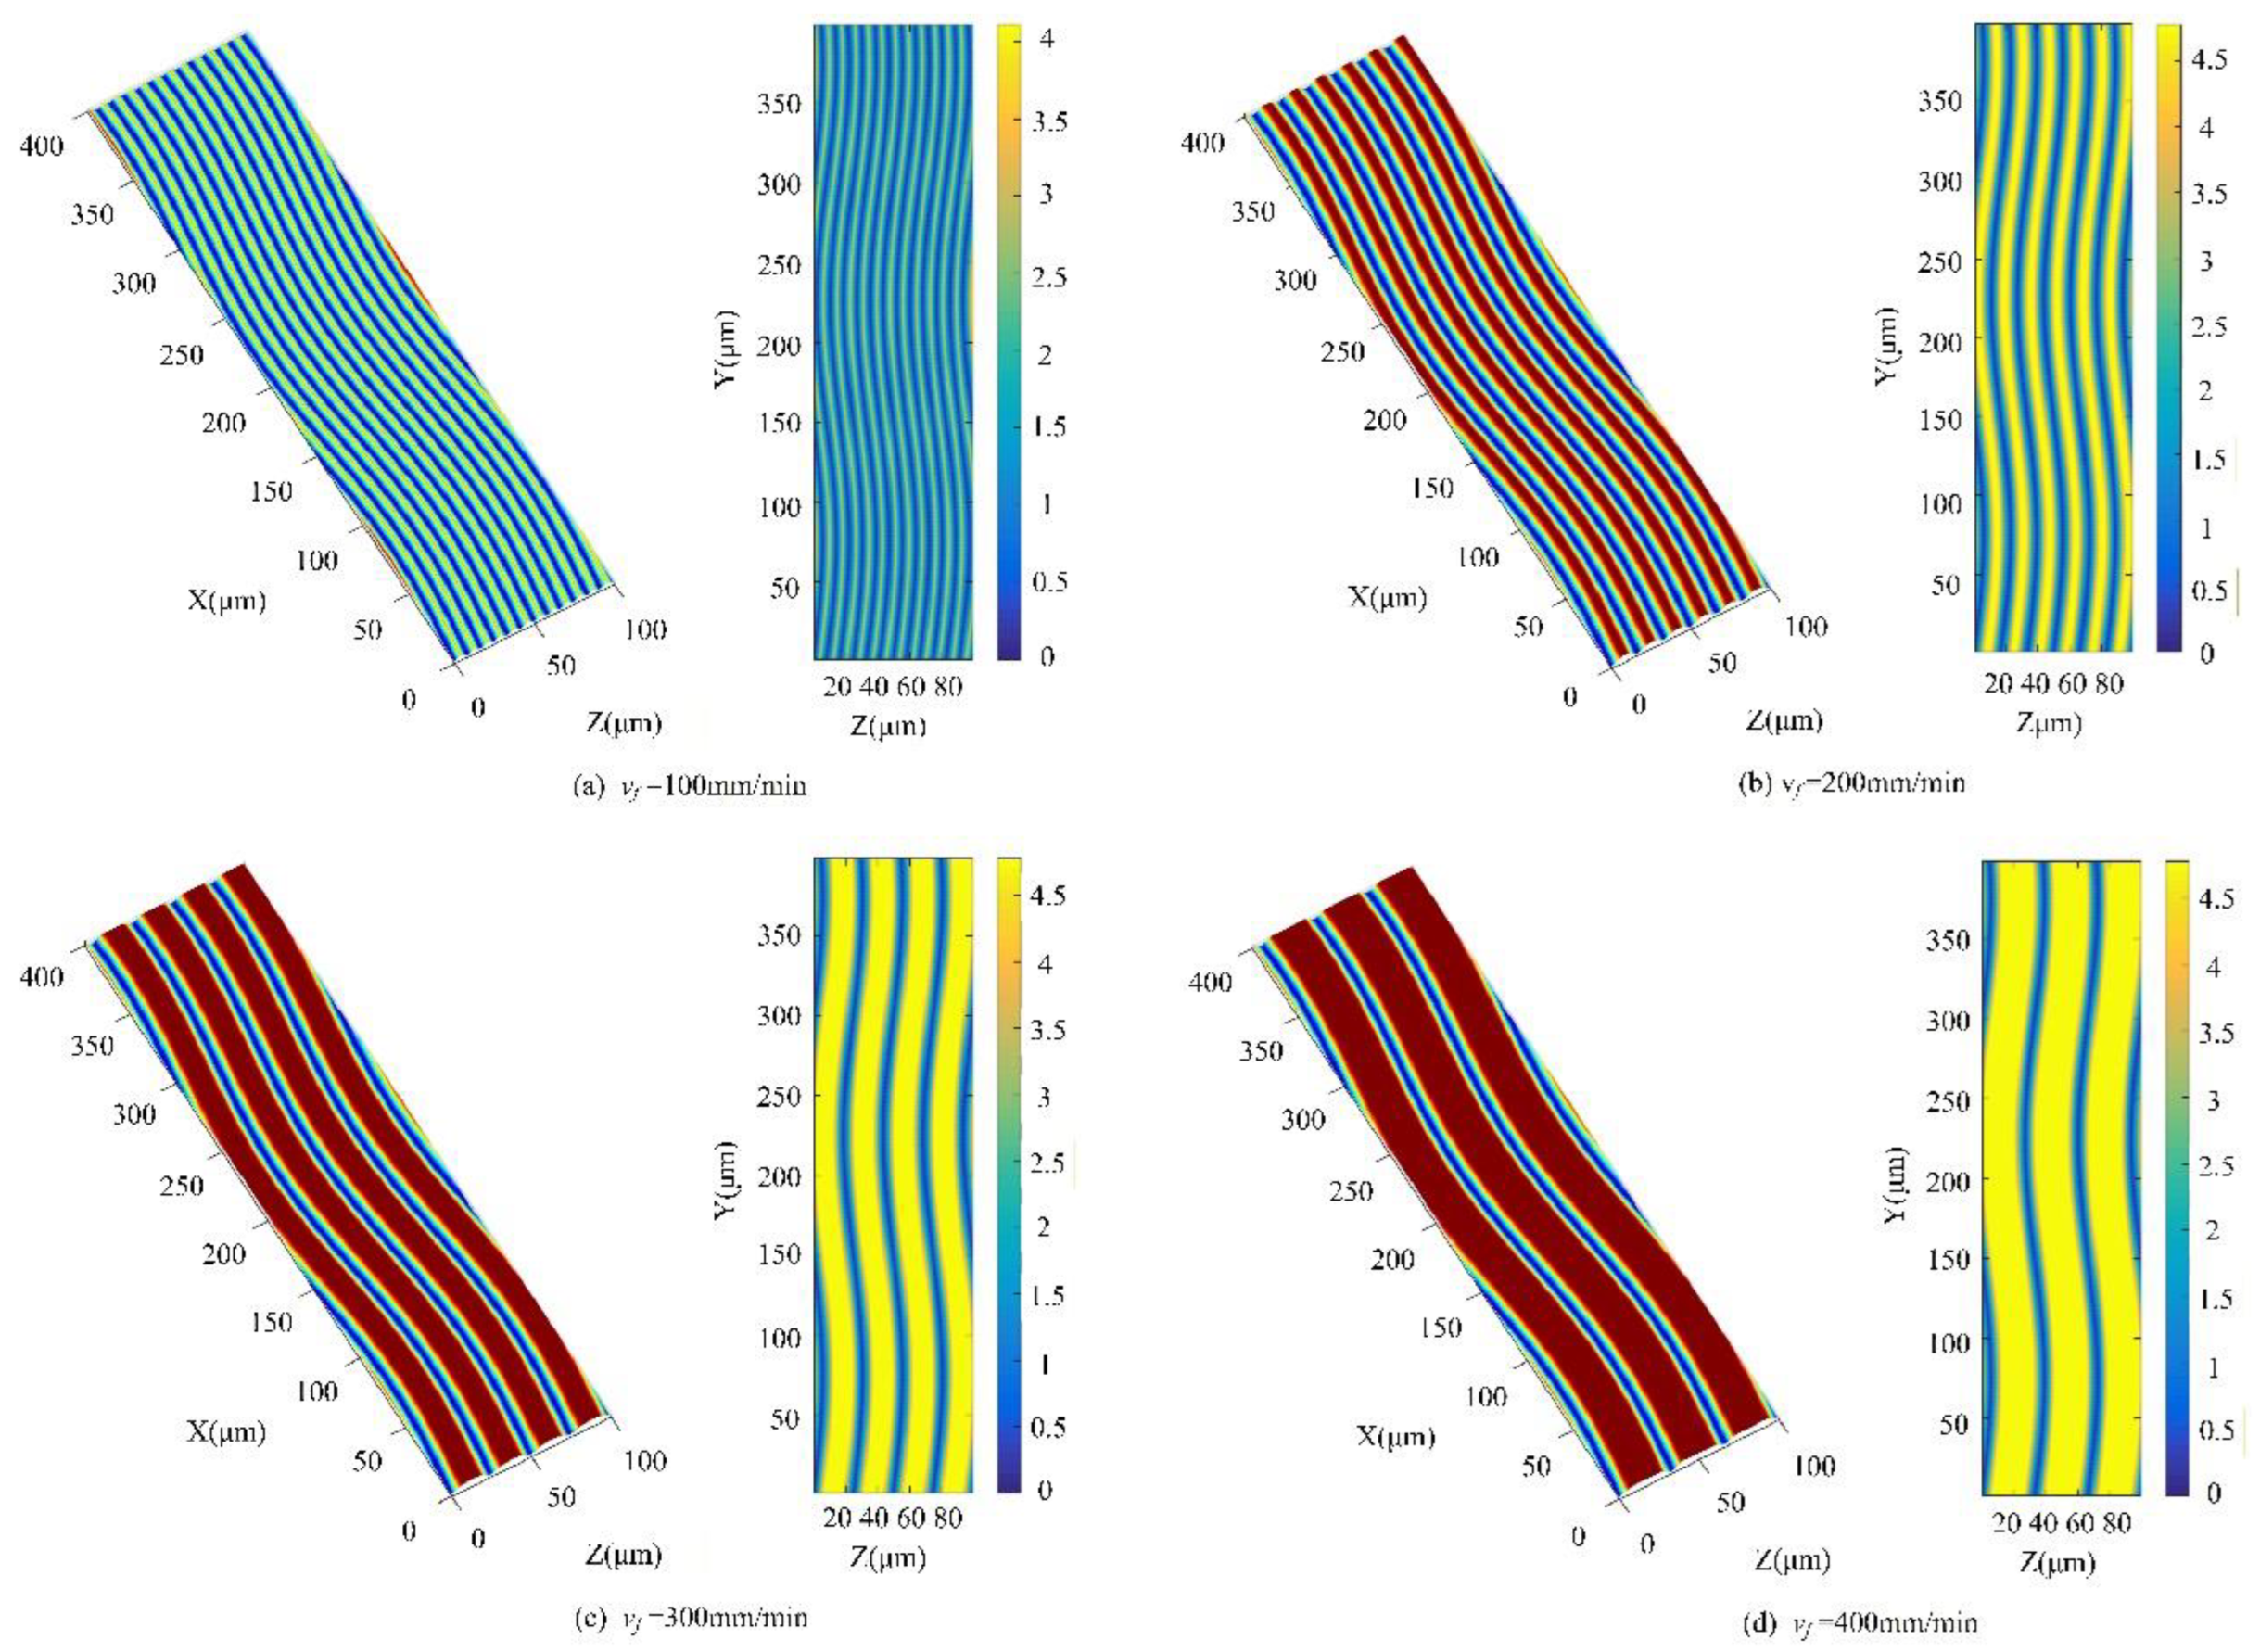
Figure 8.
Simulation of micro-scale surface morphology of UVAIG under different ultrasonic amplitudes.
Figure 8.
Simulation of micro-scale surface morphology of UVAIG under different ultrasonic amplitudes.
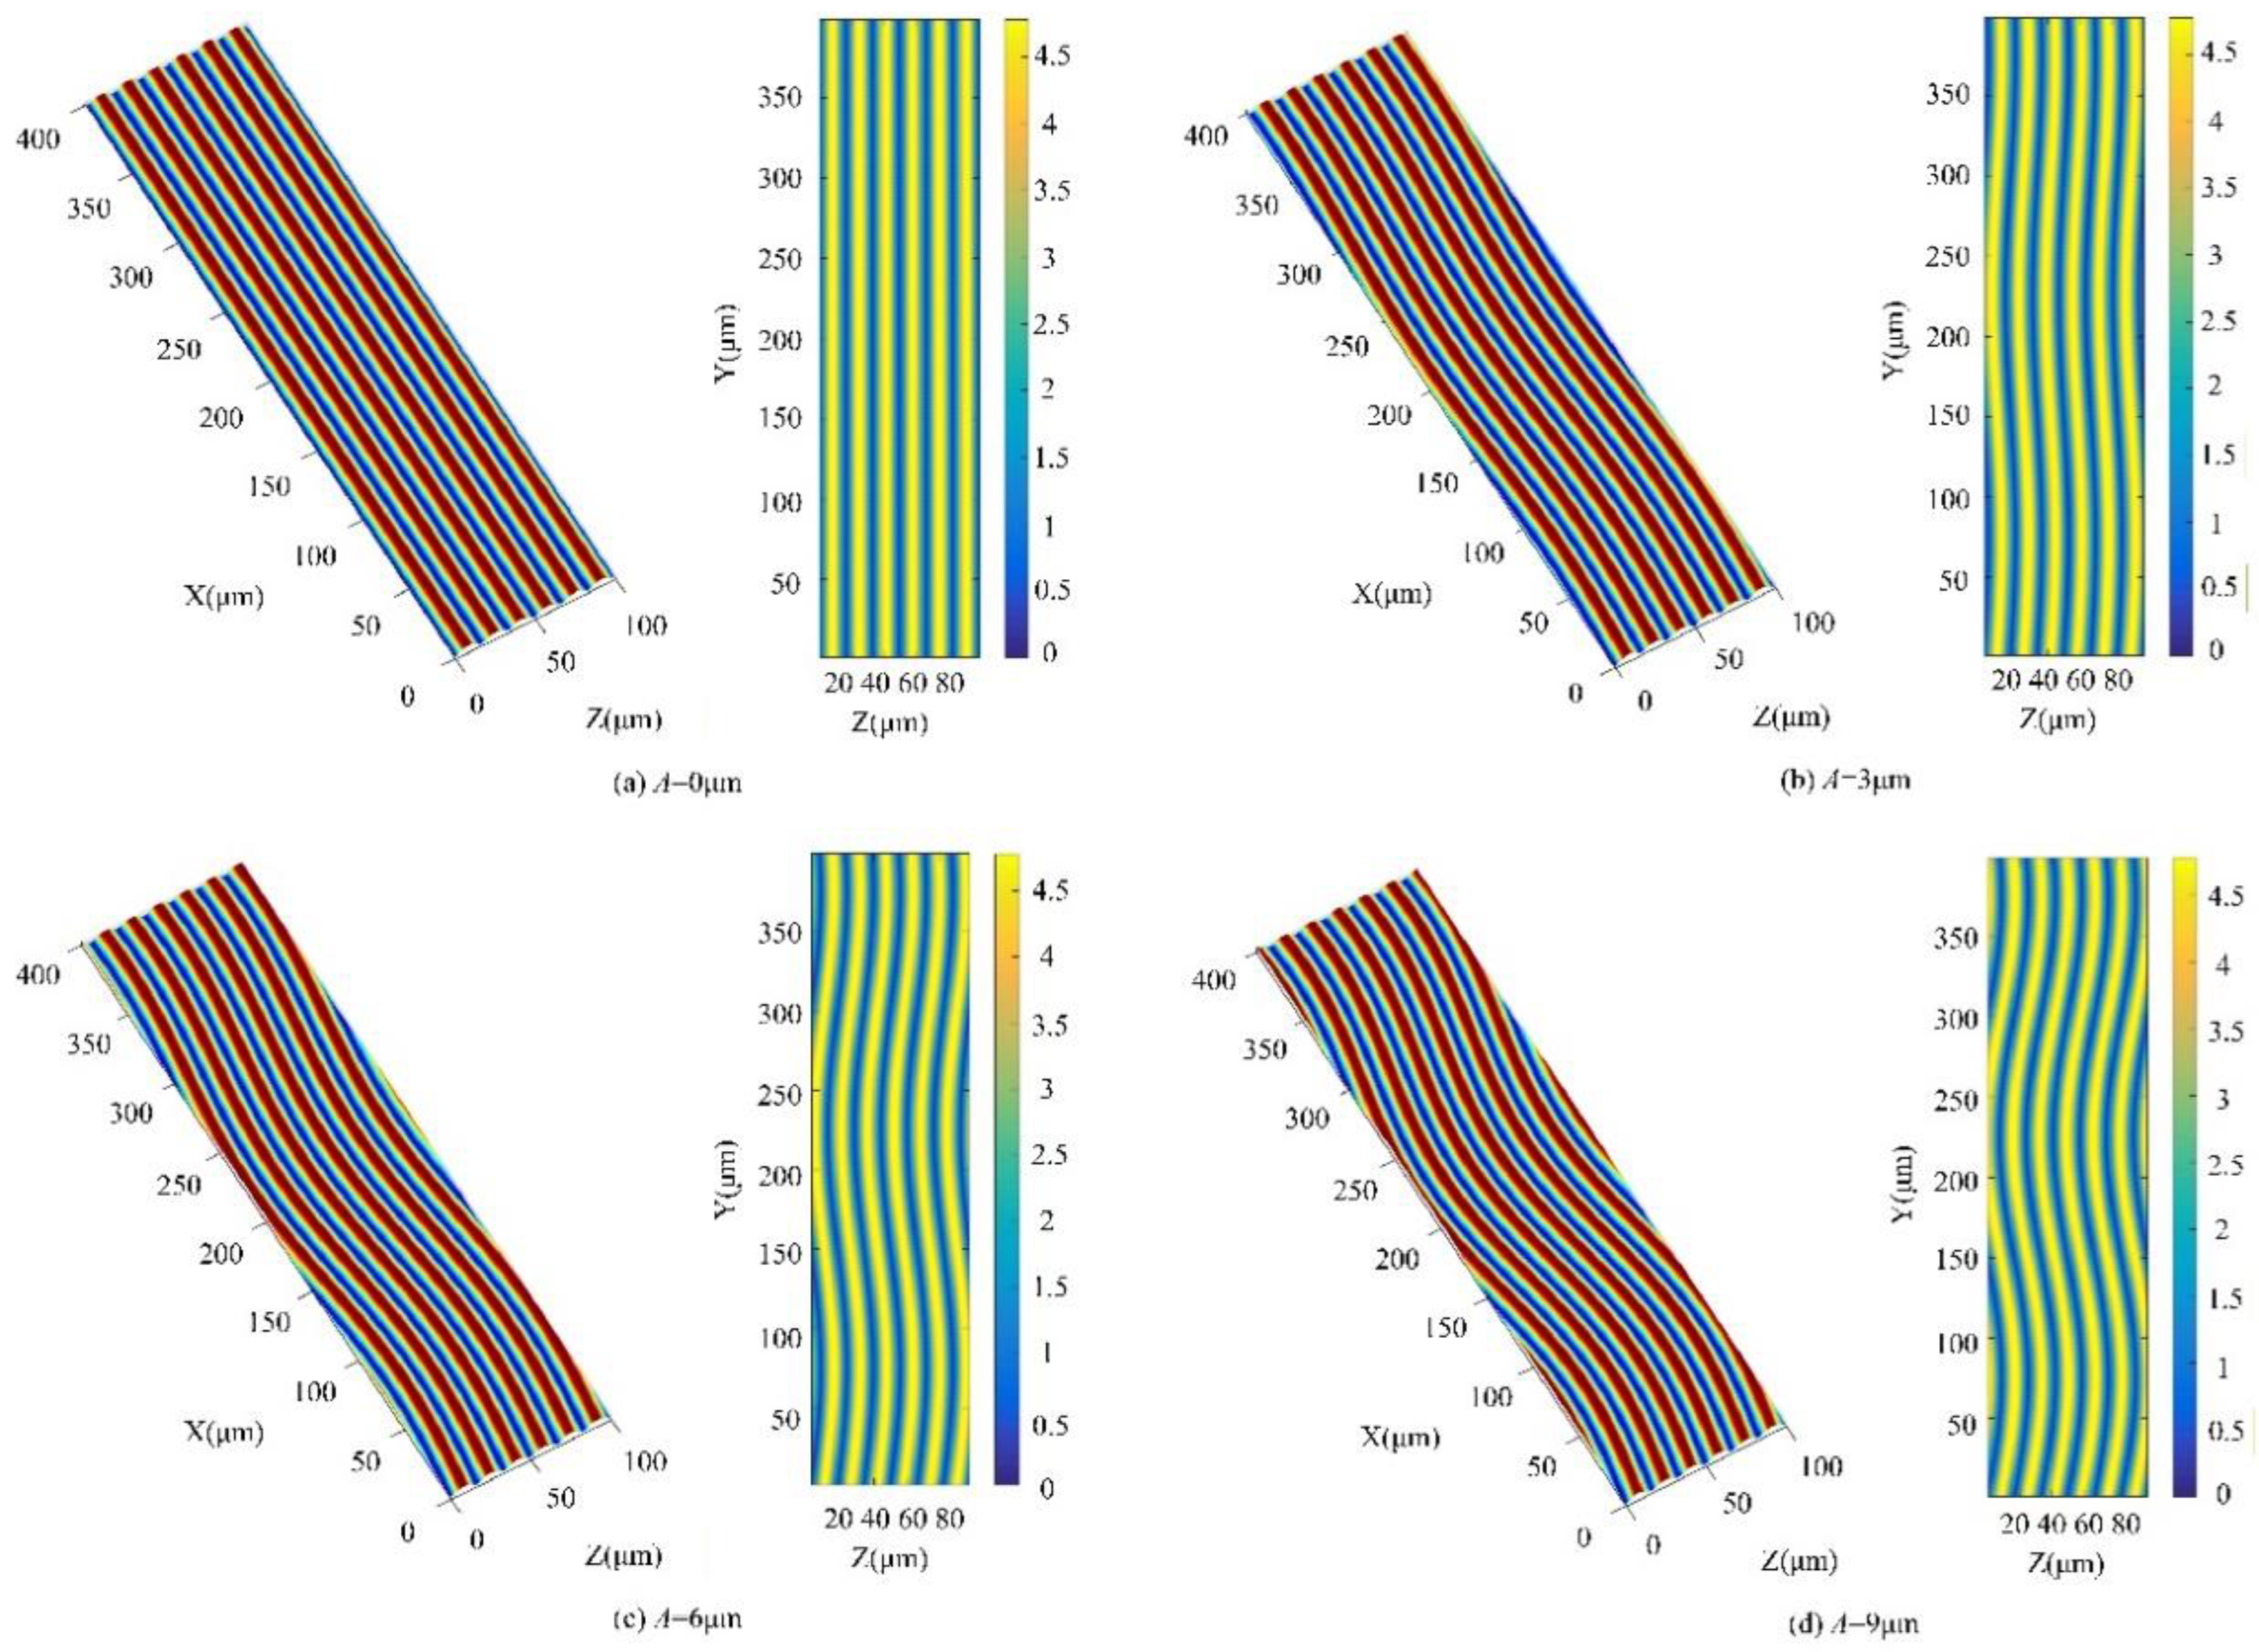
Figure 9.
Simulation of micro-scale surface morphology of UVAIG at different phase angles.
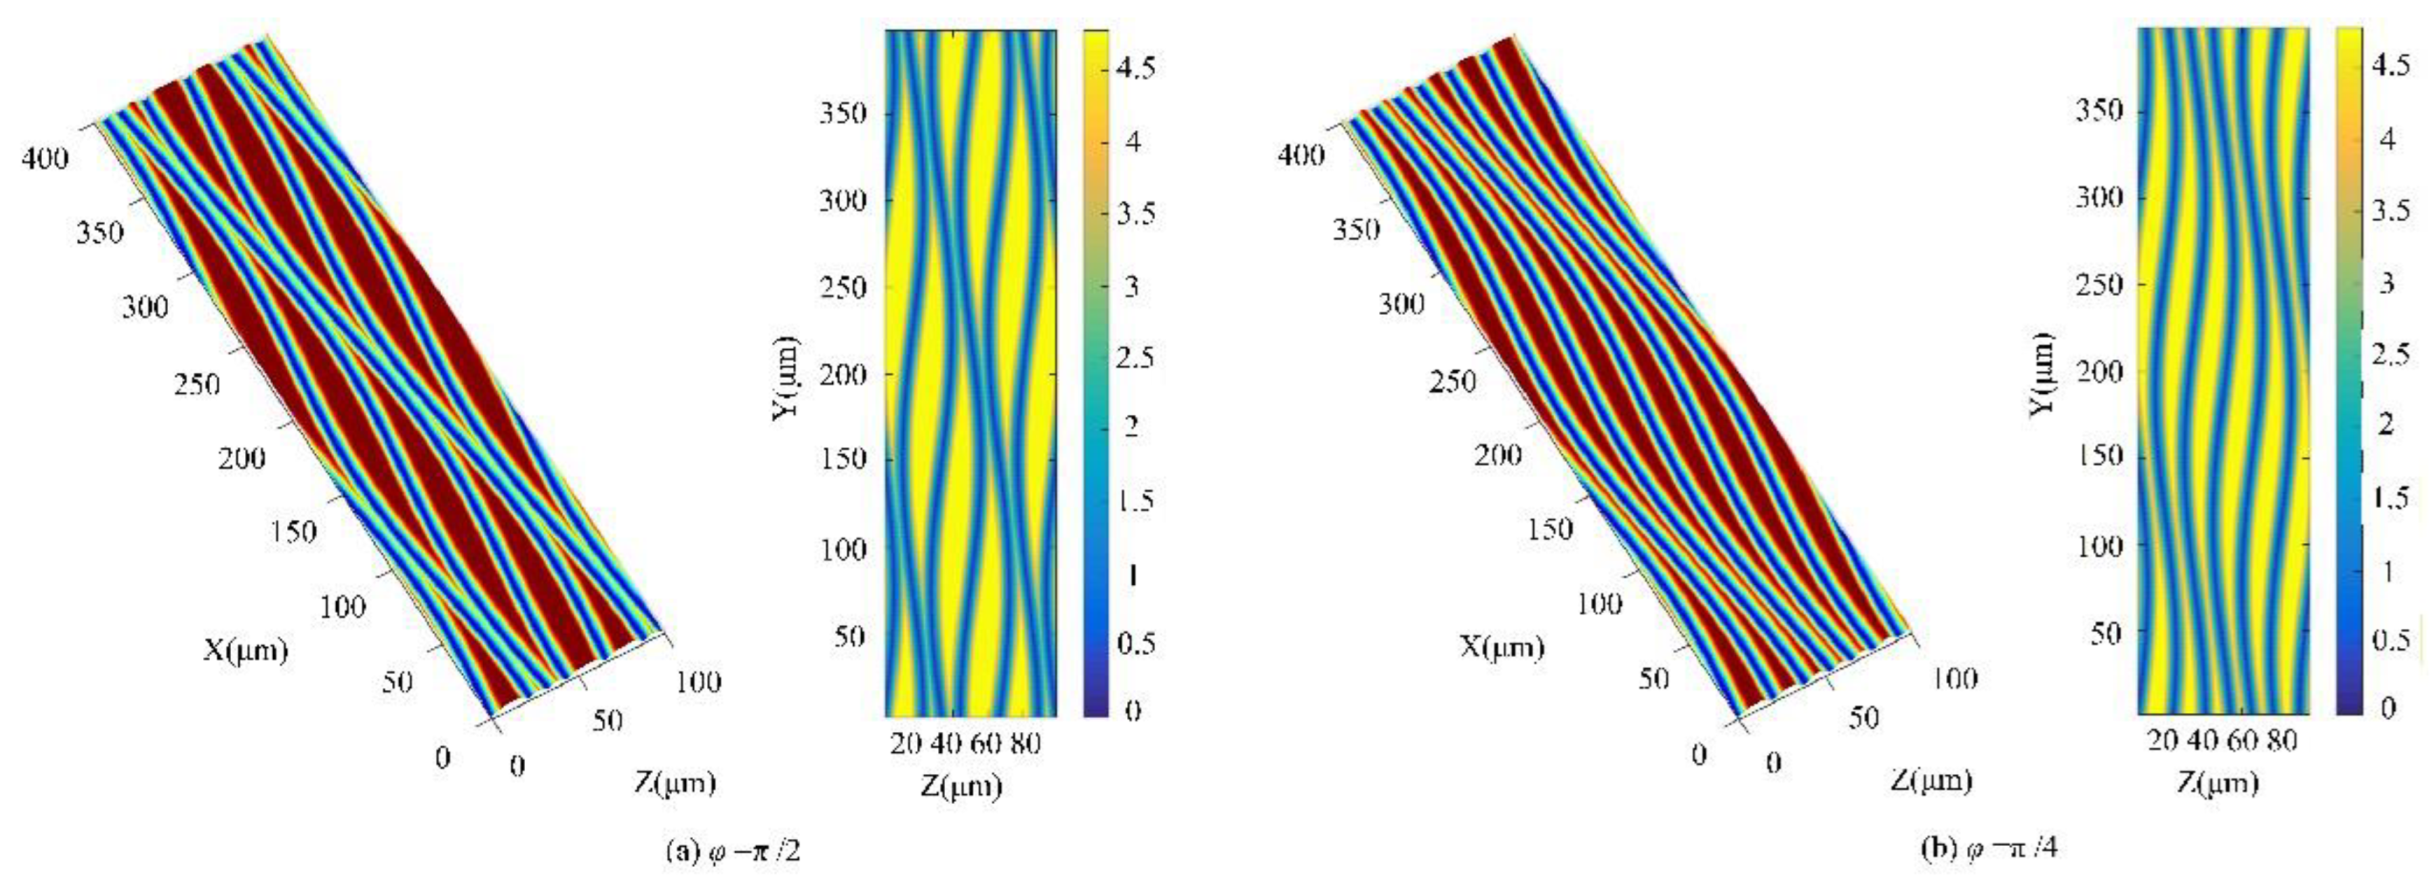
Figure 10.
The trajectory diagram of adjacent abrasive grains in UVAIG.
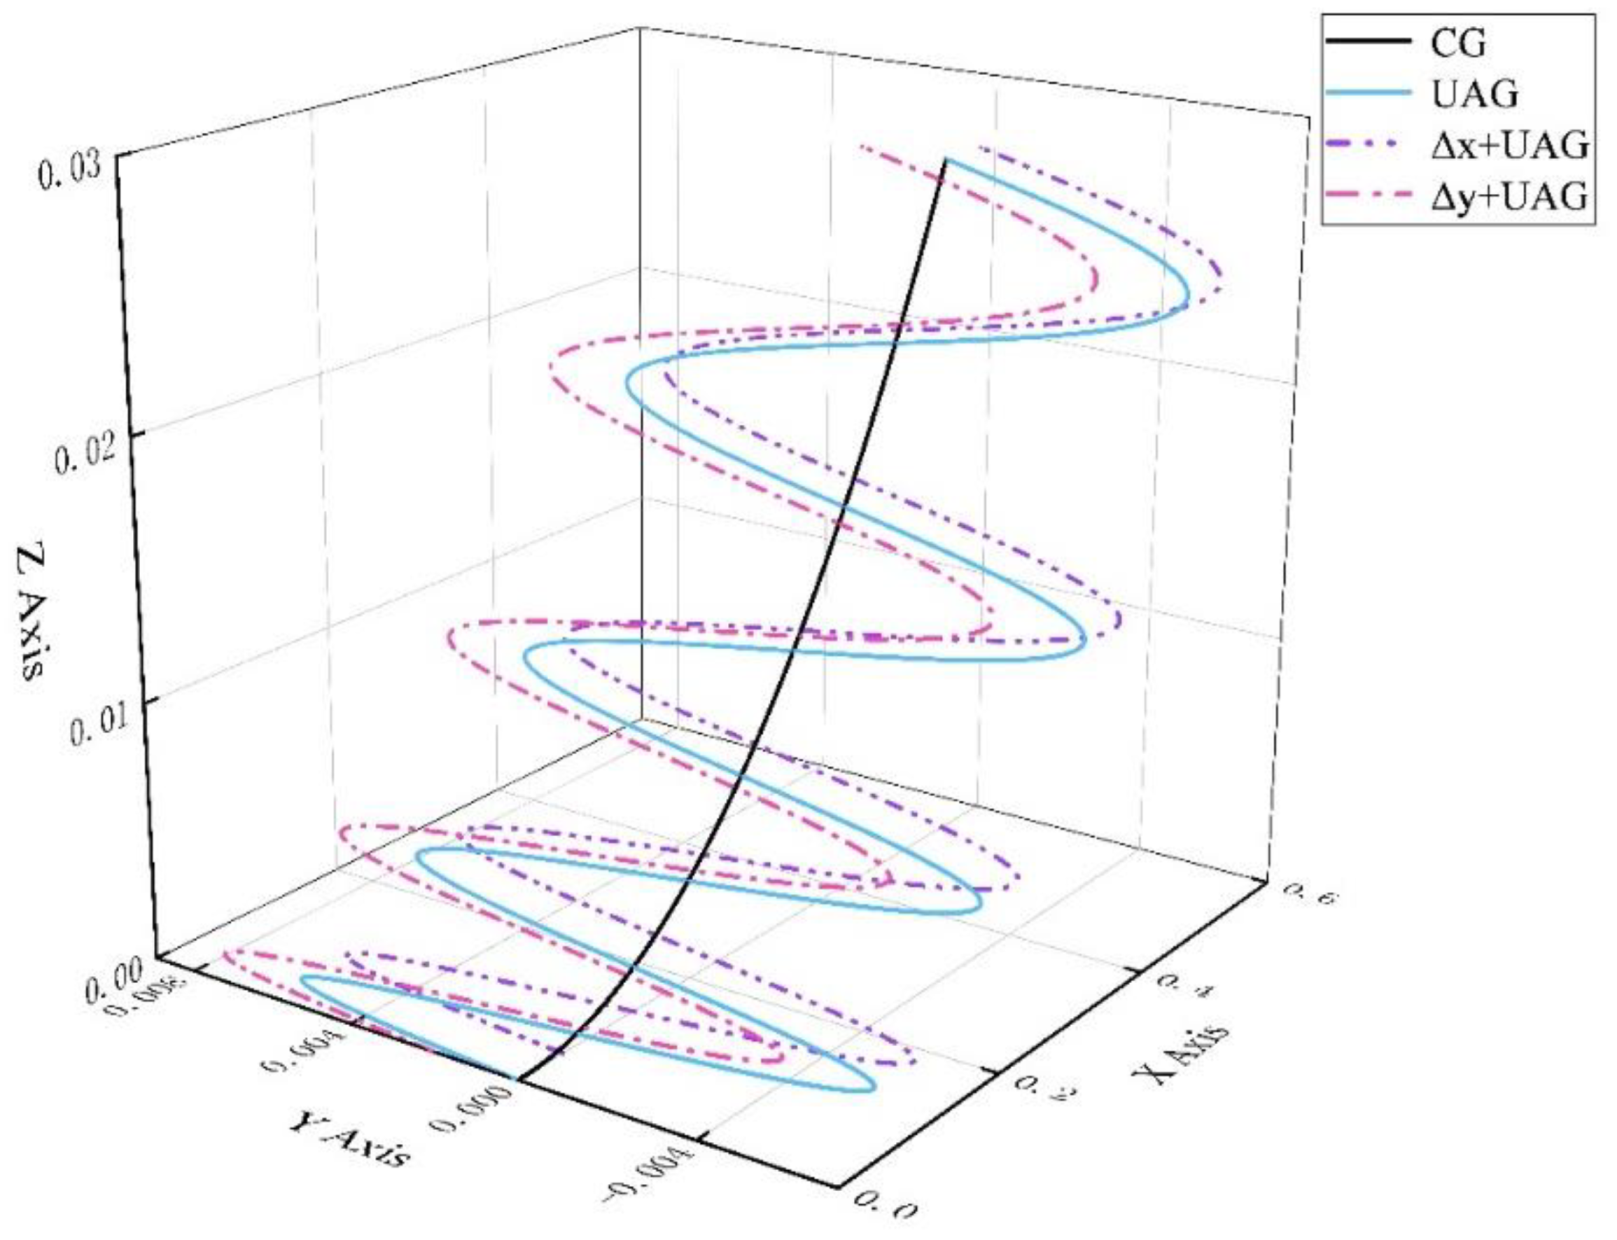
Figure 11.
Simulation of micro-scale surface morphology in UVAIG under different axial abrasive spacing.
Figure 11.
Simulation of micro-scale surface morphology in UVAIG under different axial abrasive spacing.
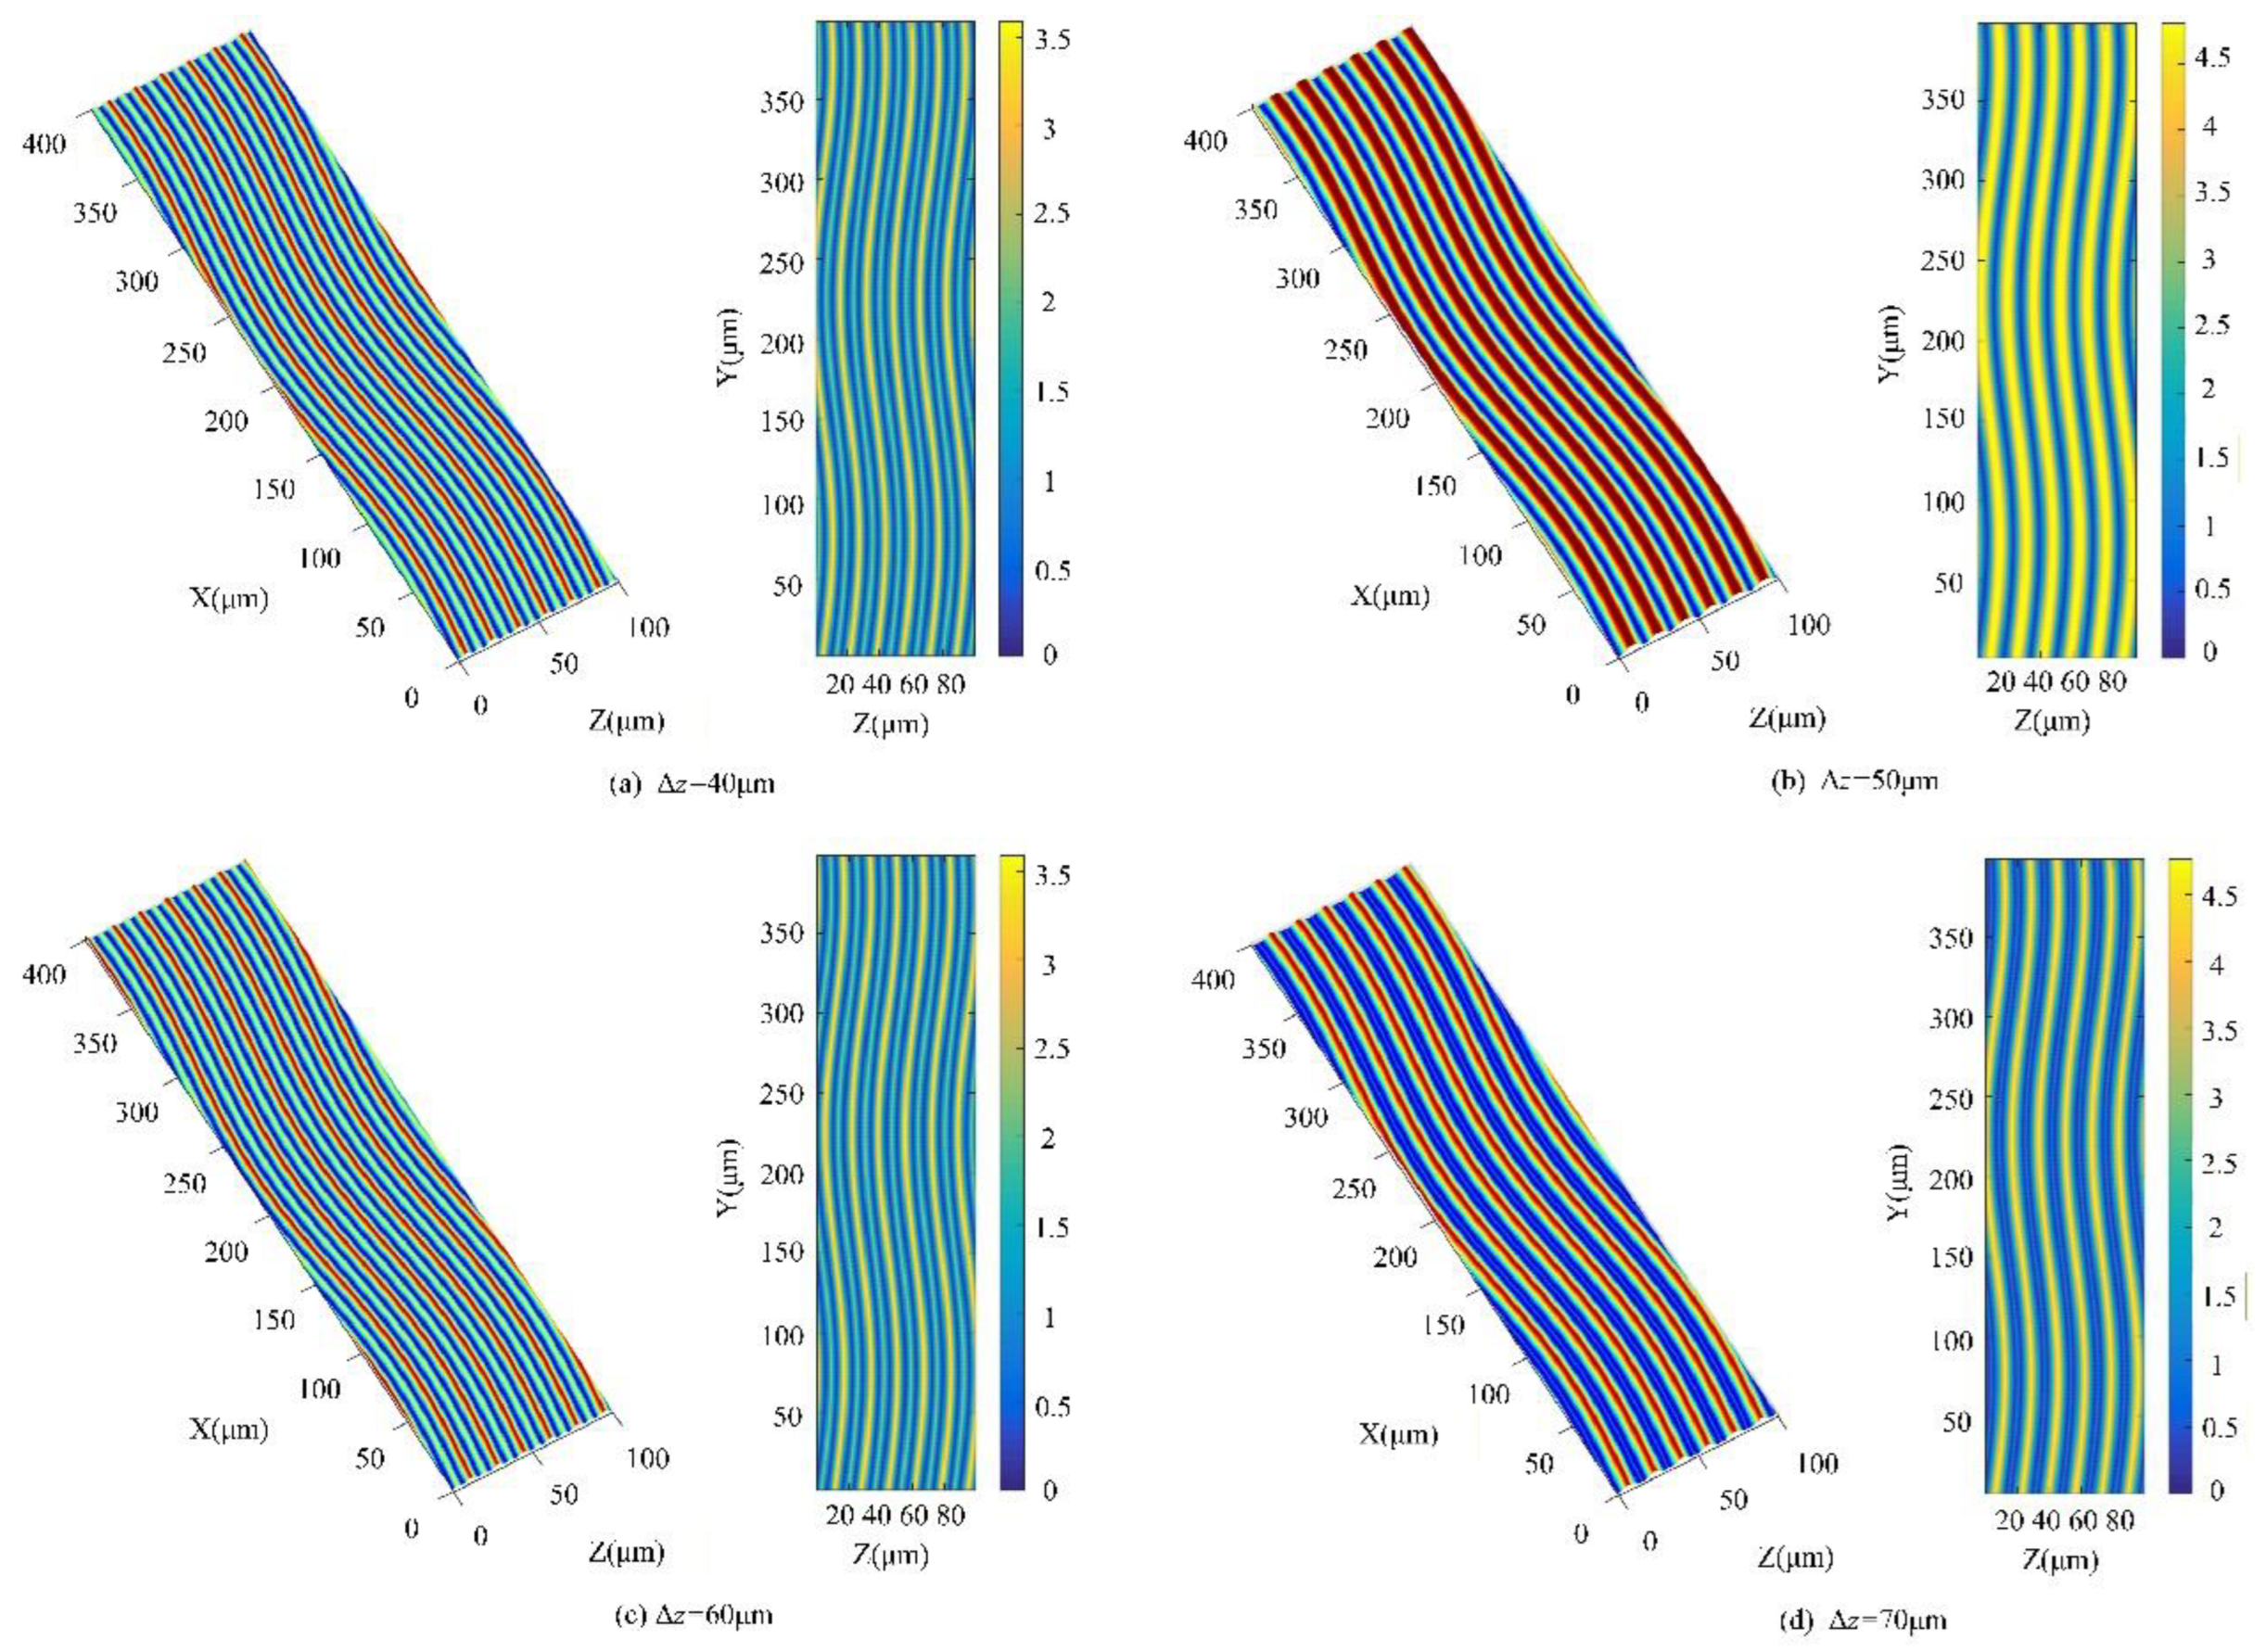
Figure 12.
The cross section diagram of UVAIG of axial adjacent abrasive grains.
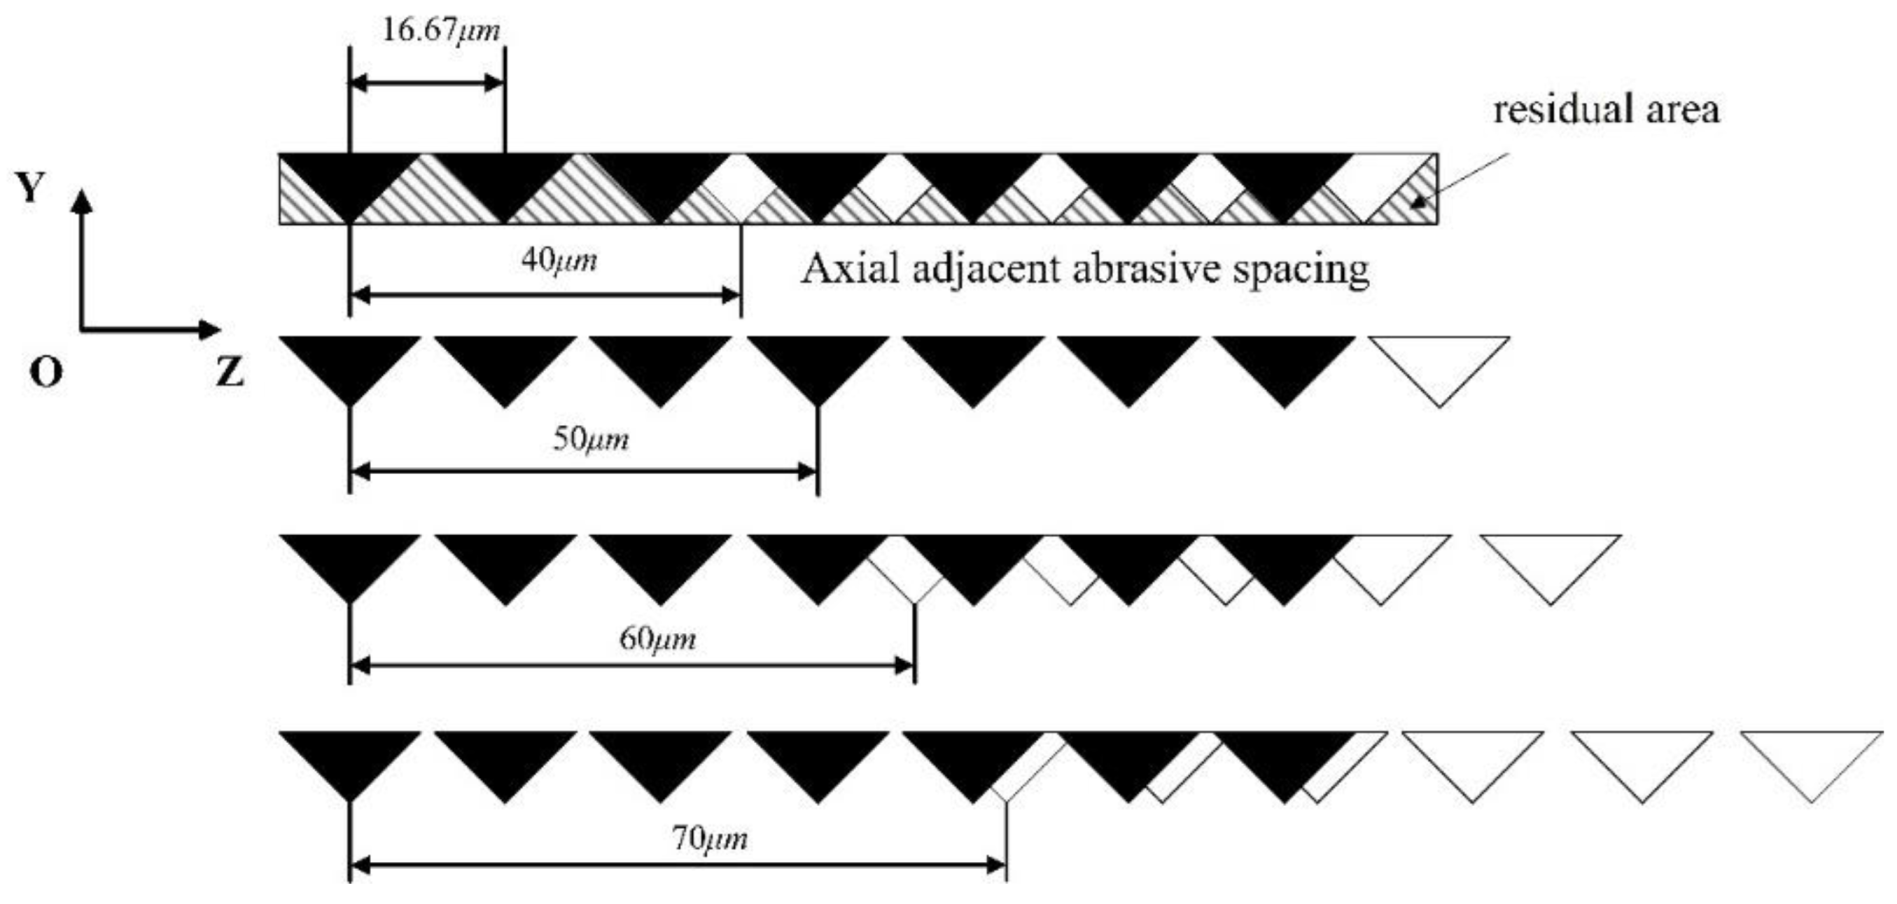
Figure 13.
Relationship between axial adjacent abrasive spacing and residual area in UVAIG.
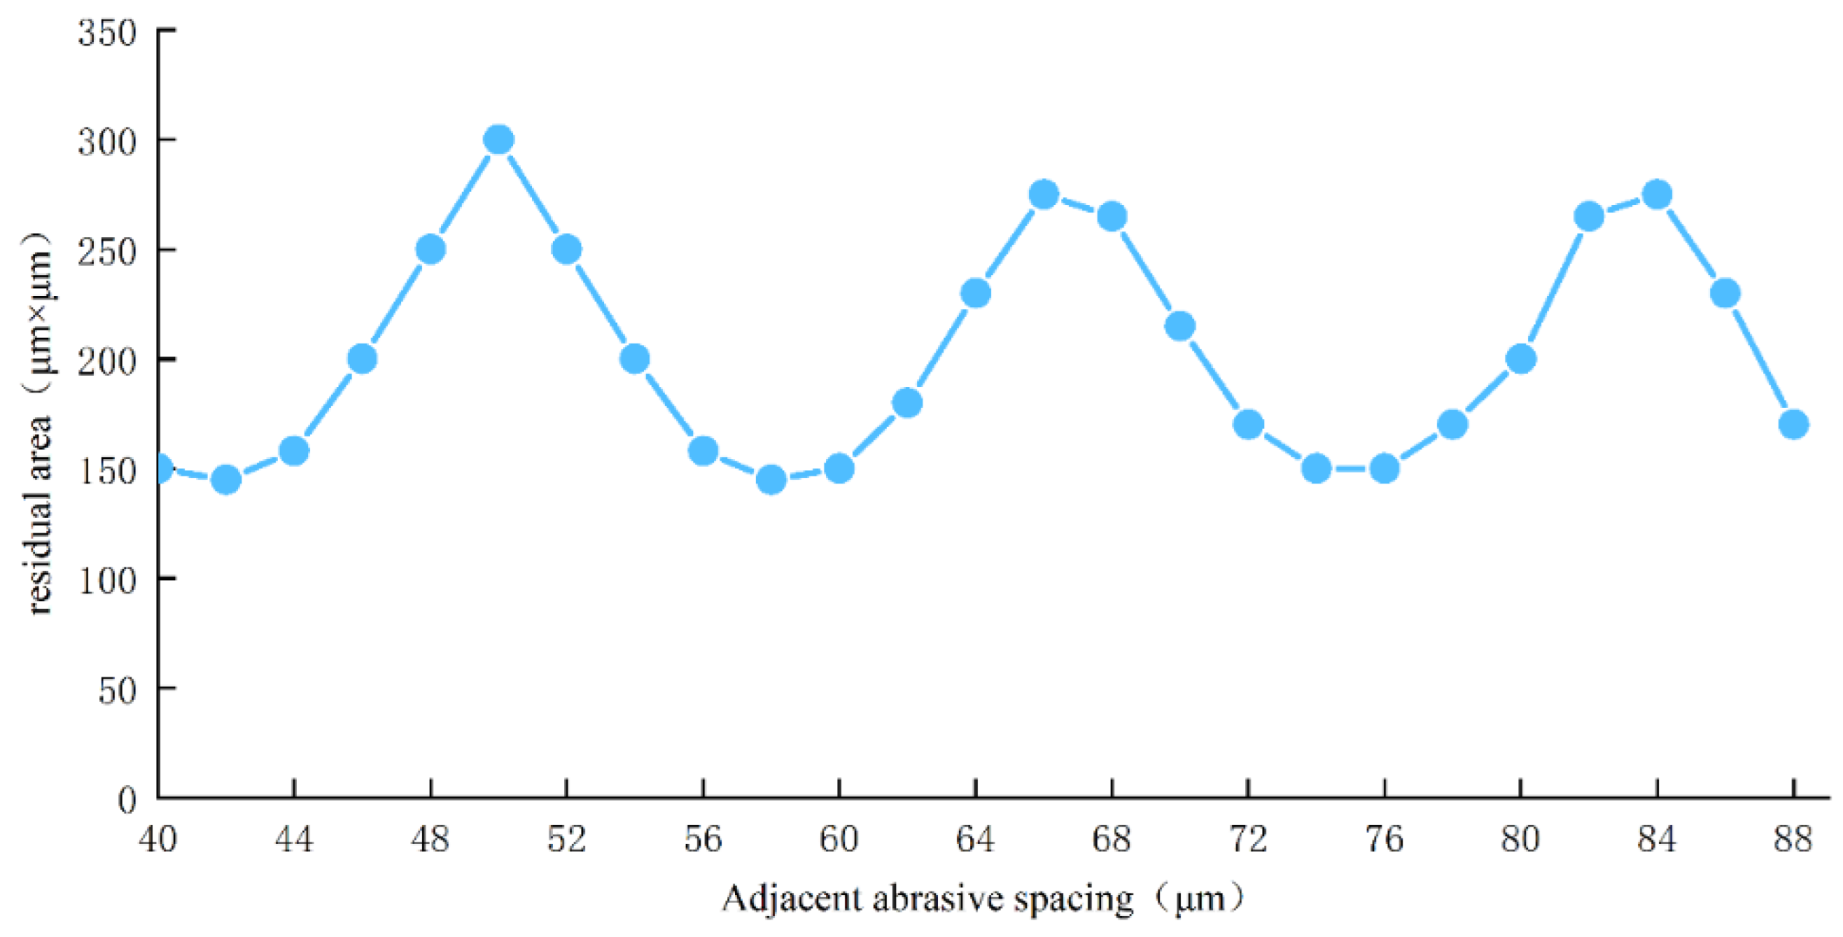
Figure 14.
Simulation of micro-scale surface morphology of UVAIG with different spacing between adjacent abrasive grains in circumferential direction.
Figure 14.
Simulation of micro-scale surface morphology of UVAIG with different spacing between adjacent abrasive grains in circumferential direction.
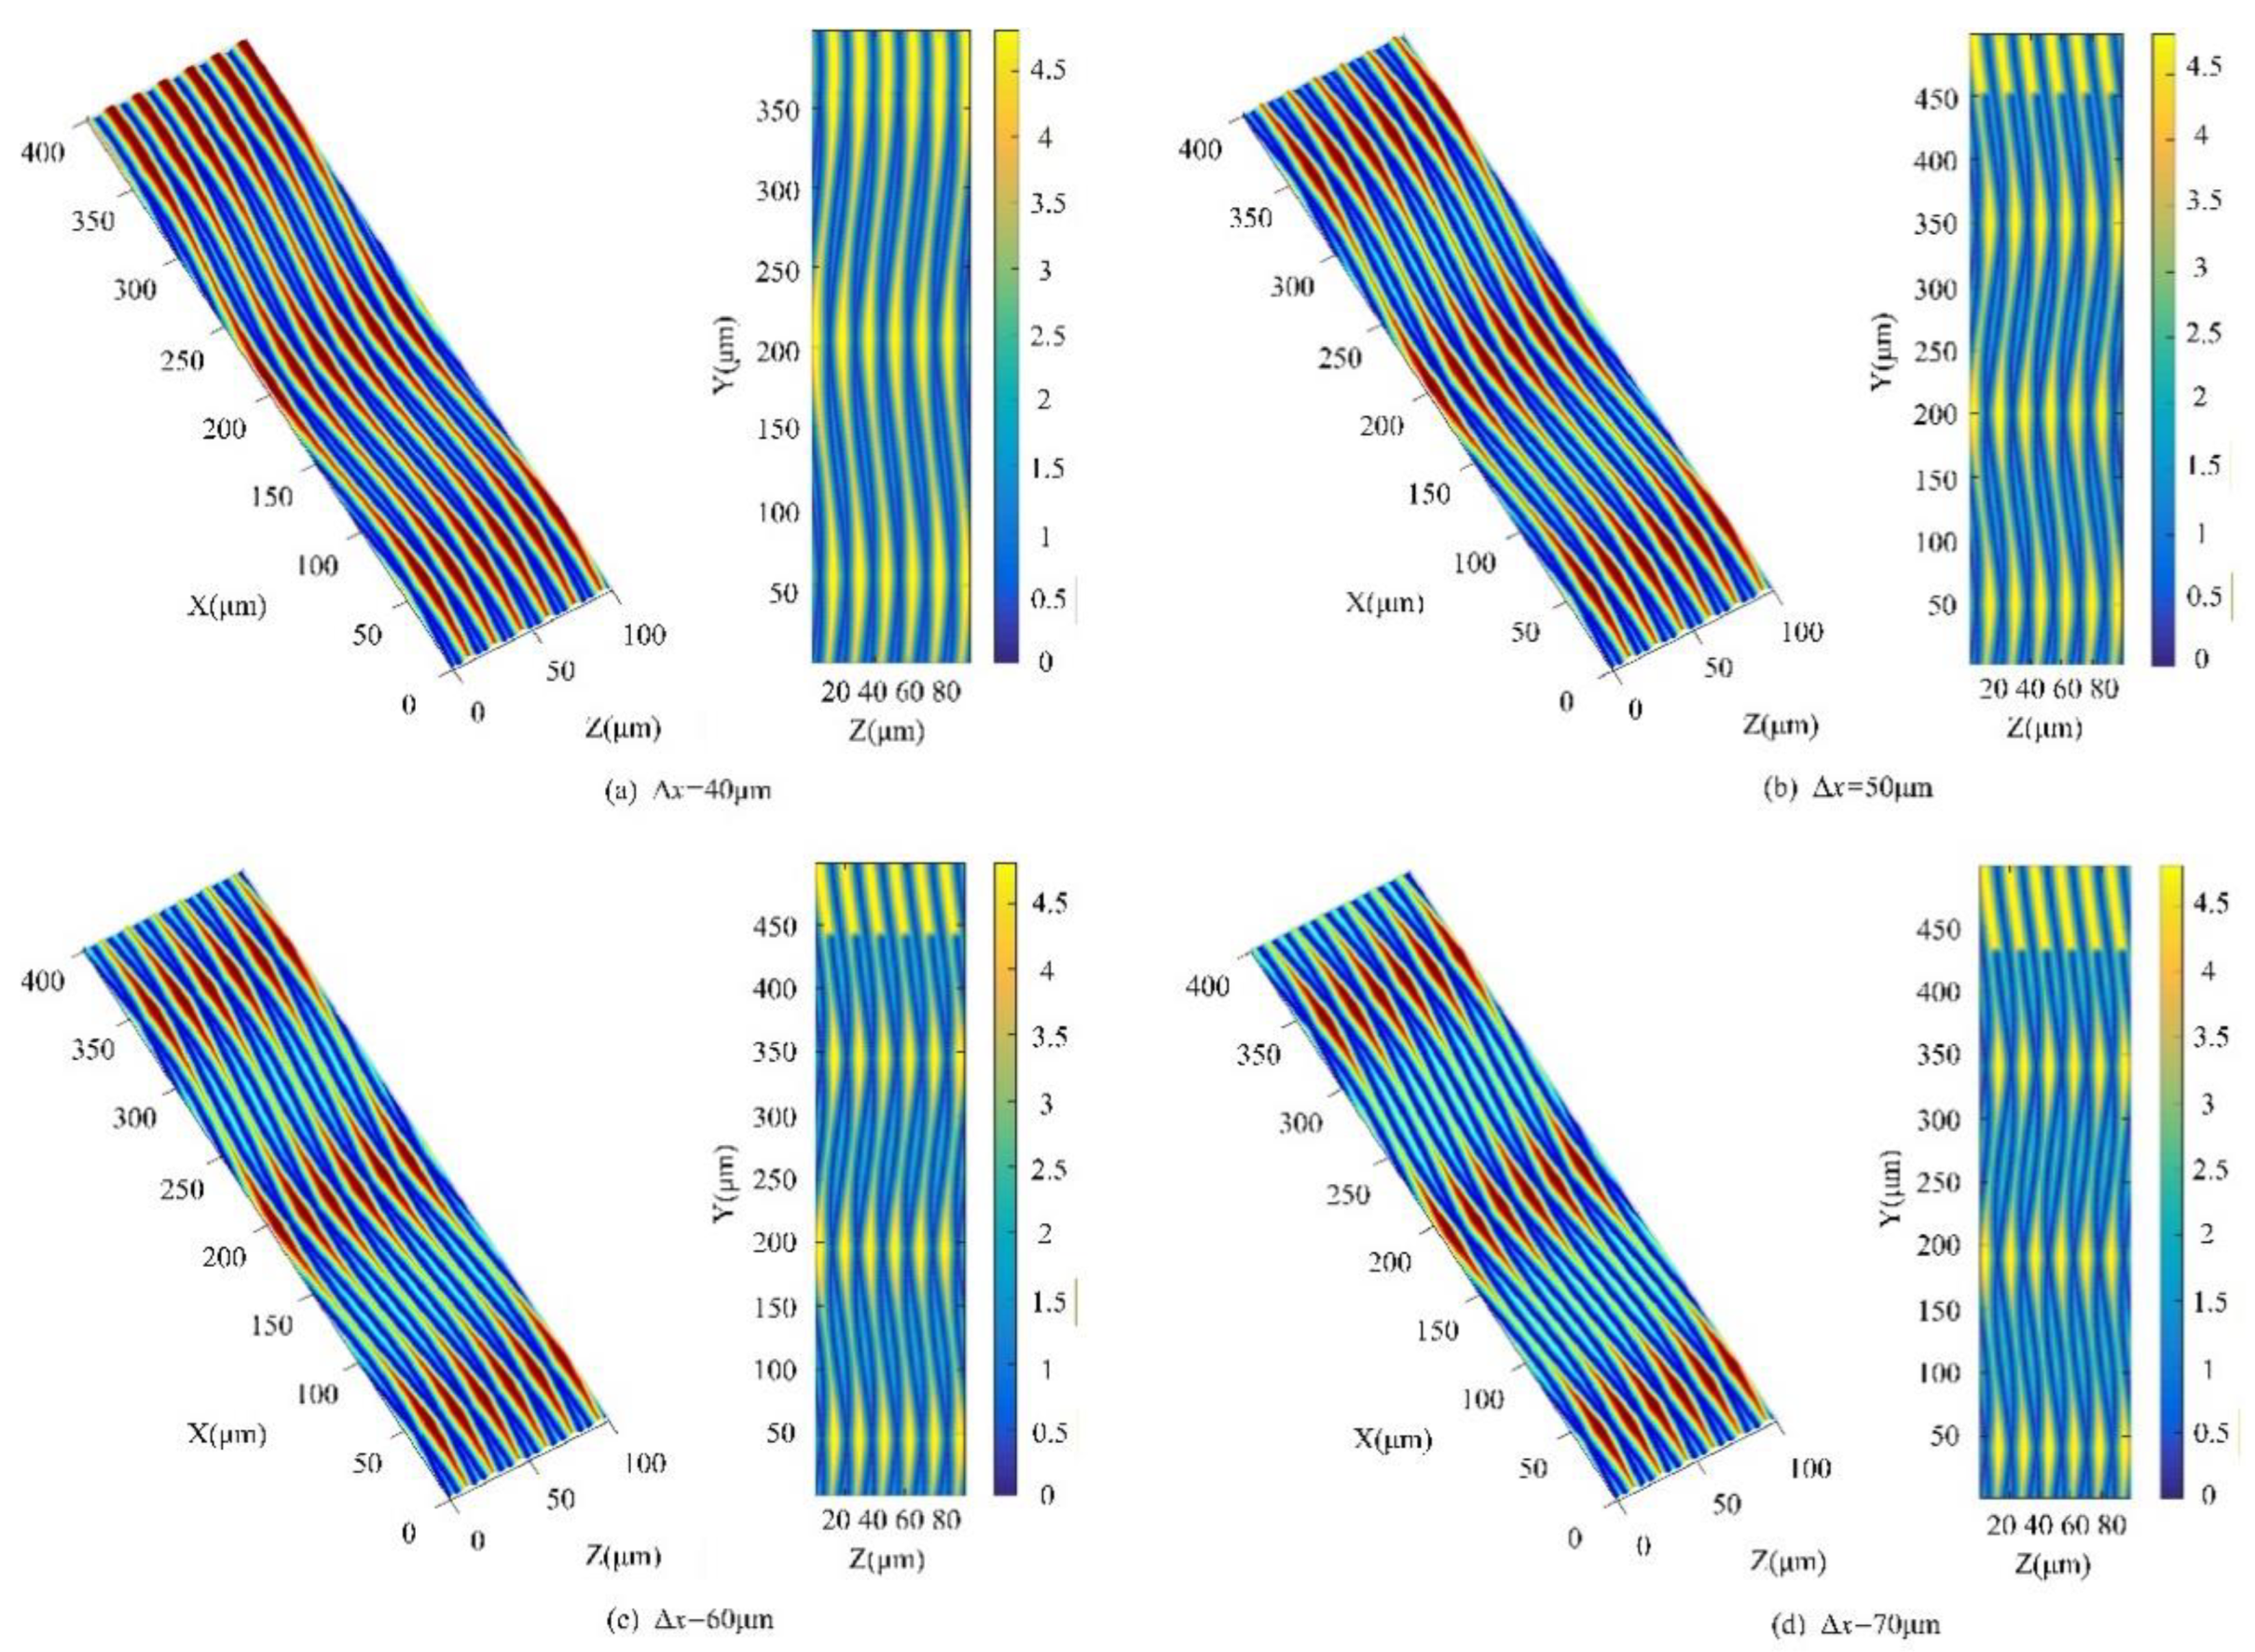
Figure 15.
Schematic diagram of UVAIG cross section of adjacent abrasive grains in circumferential direction.
Figure 15.
Schematic diagram of UVAIG cross section of adjacent abrasive grains in circumferential direction.
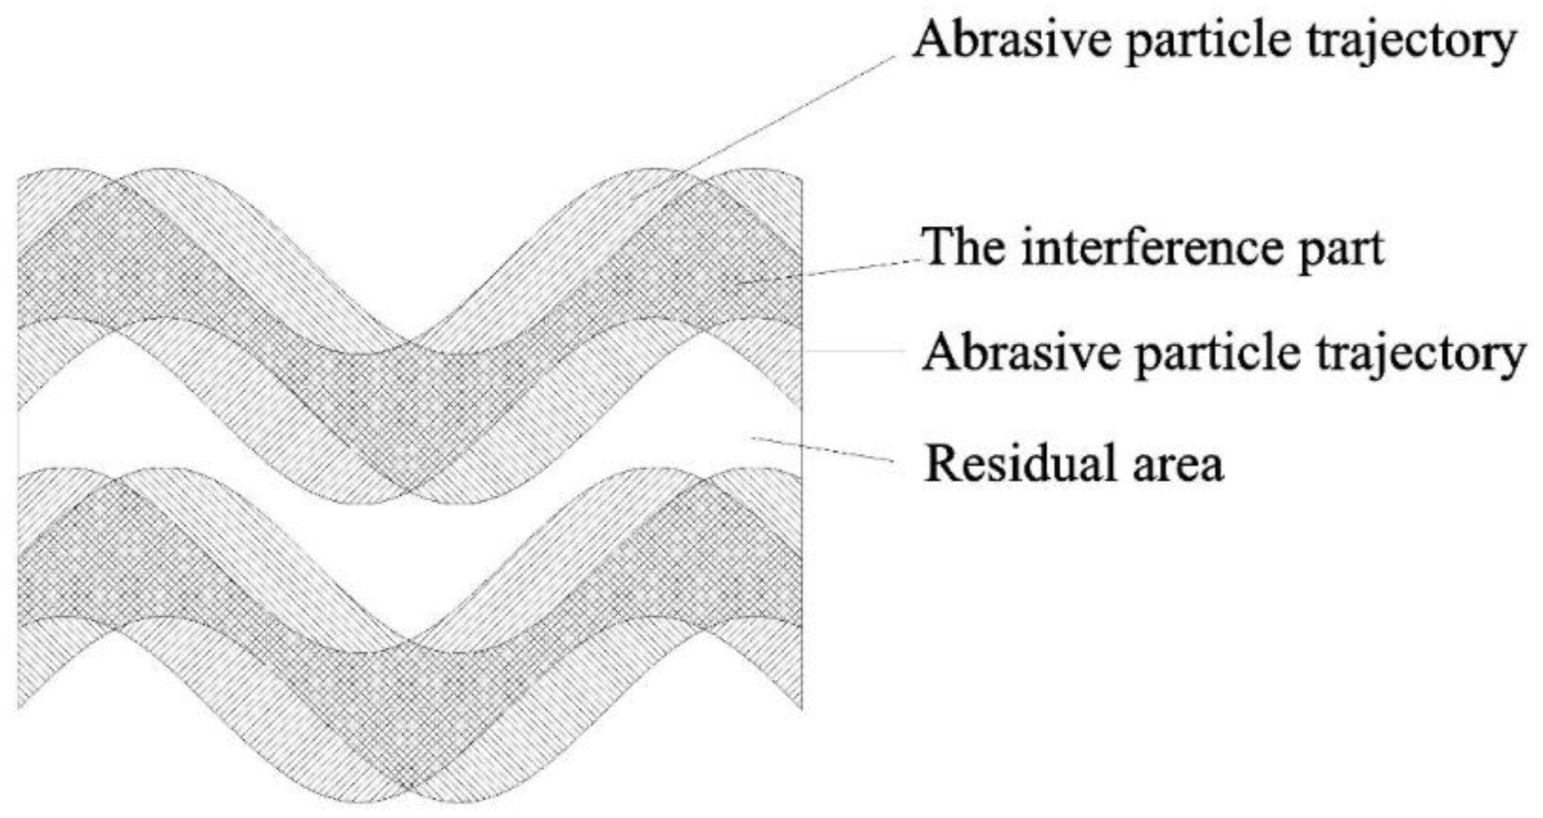
Figure 16.
Relationship between circumferential adjacent abrasive spacing and residual area in UVAIG.
Figure 16.
Relationship between circumferential adjacent abrasive spacing and residual area in UVAIG.
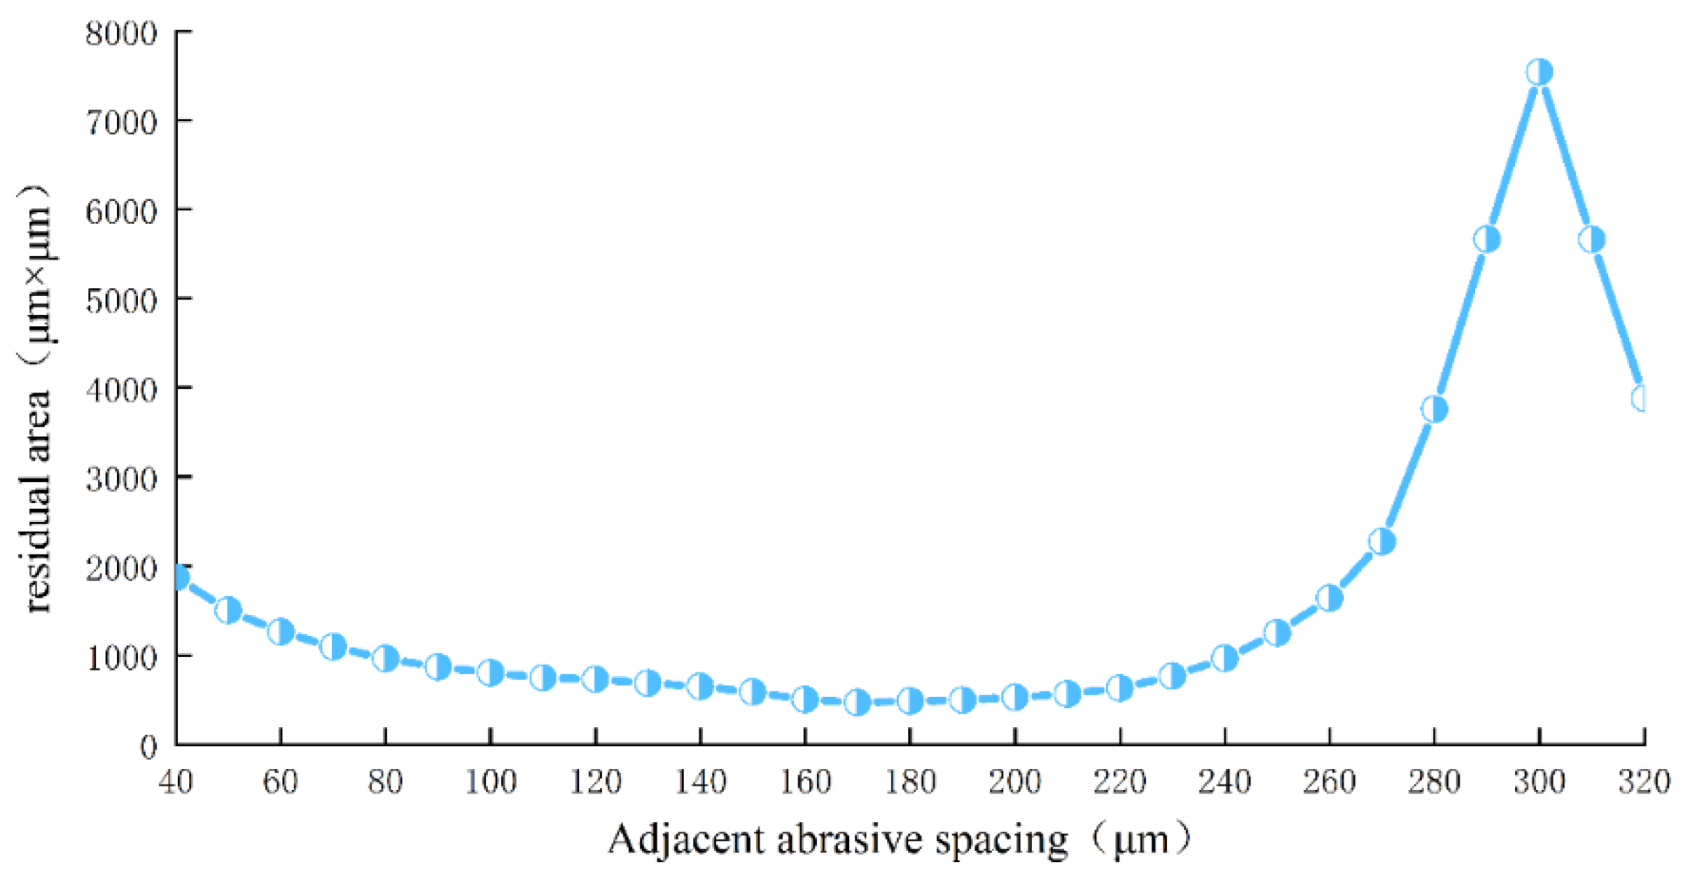
Figure 17.
Prediction of micro-scale surface morphology under different processing parameters.
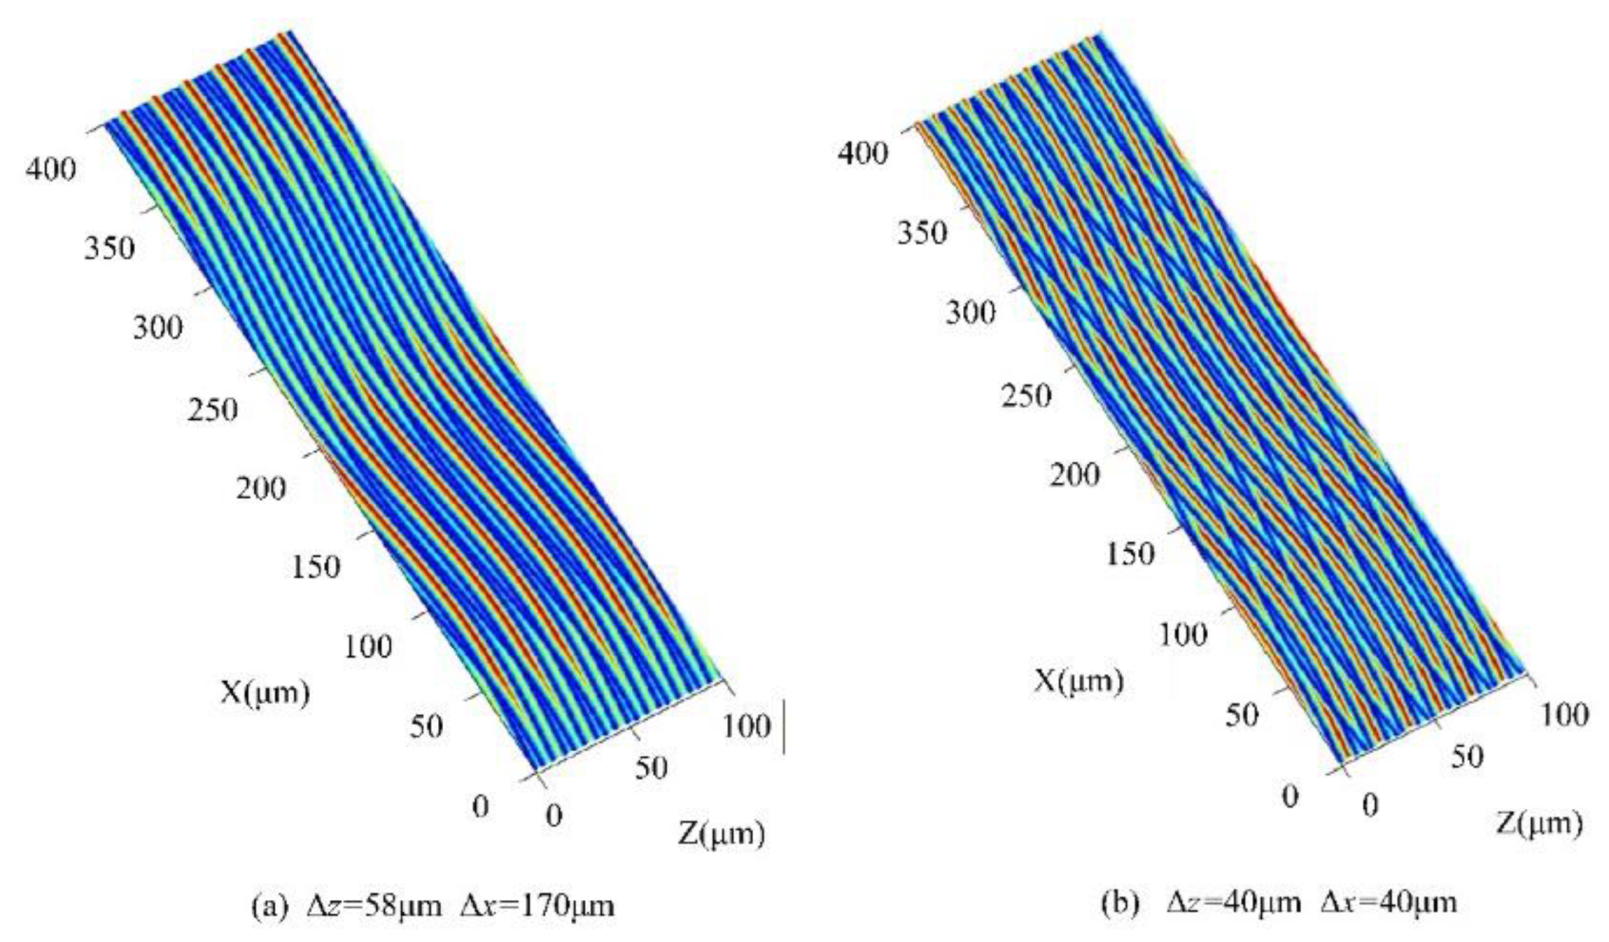
Figure 18.
Surface roughness of UVAIG under different grinding wheel rotational speed.
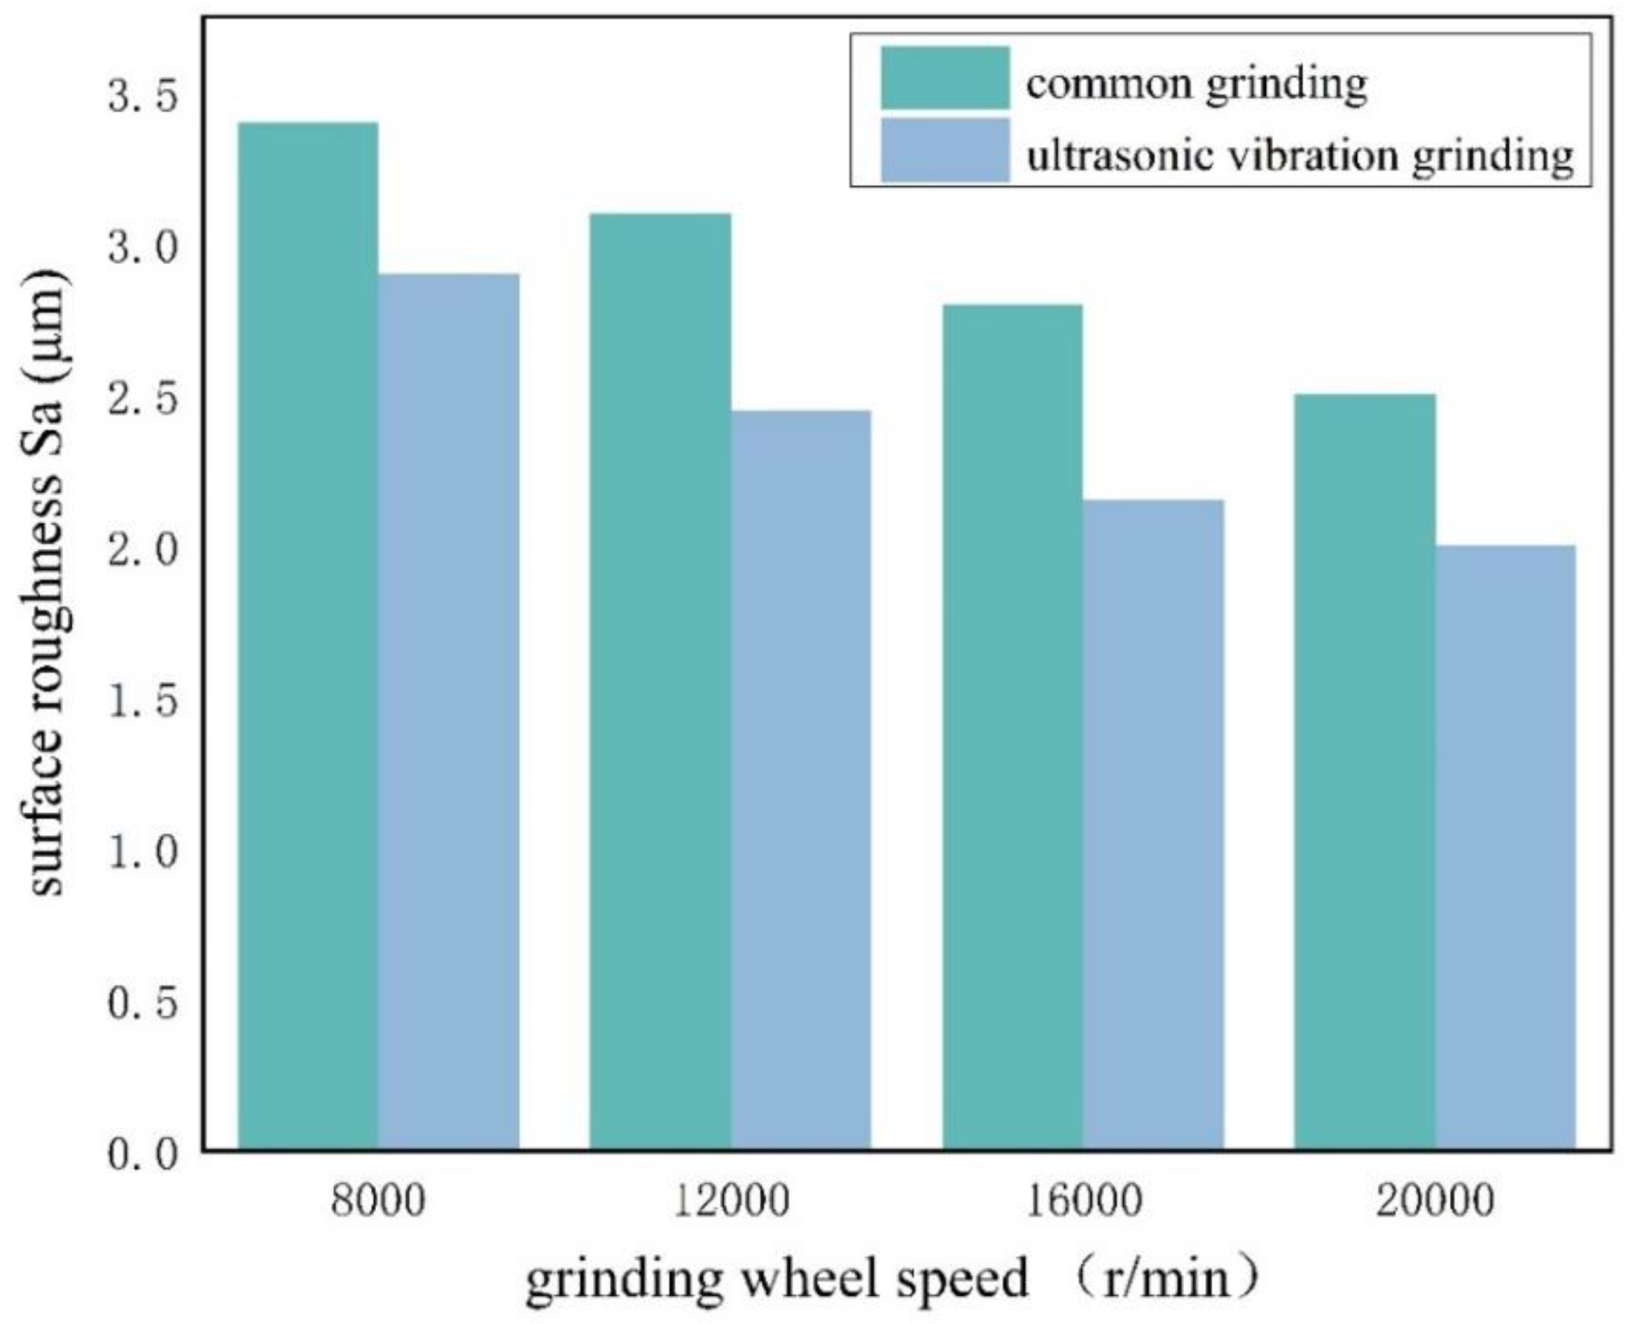
Figure 19.
Surface roughness of UVAIG under different feed rate.
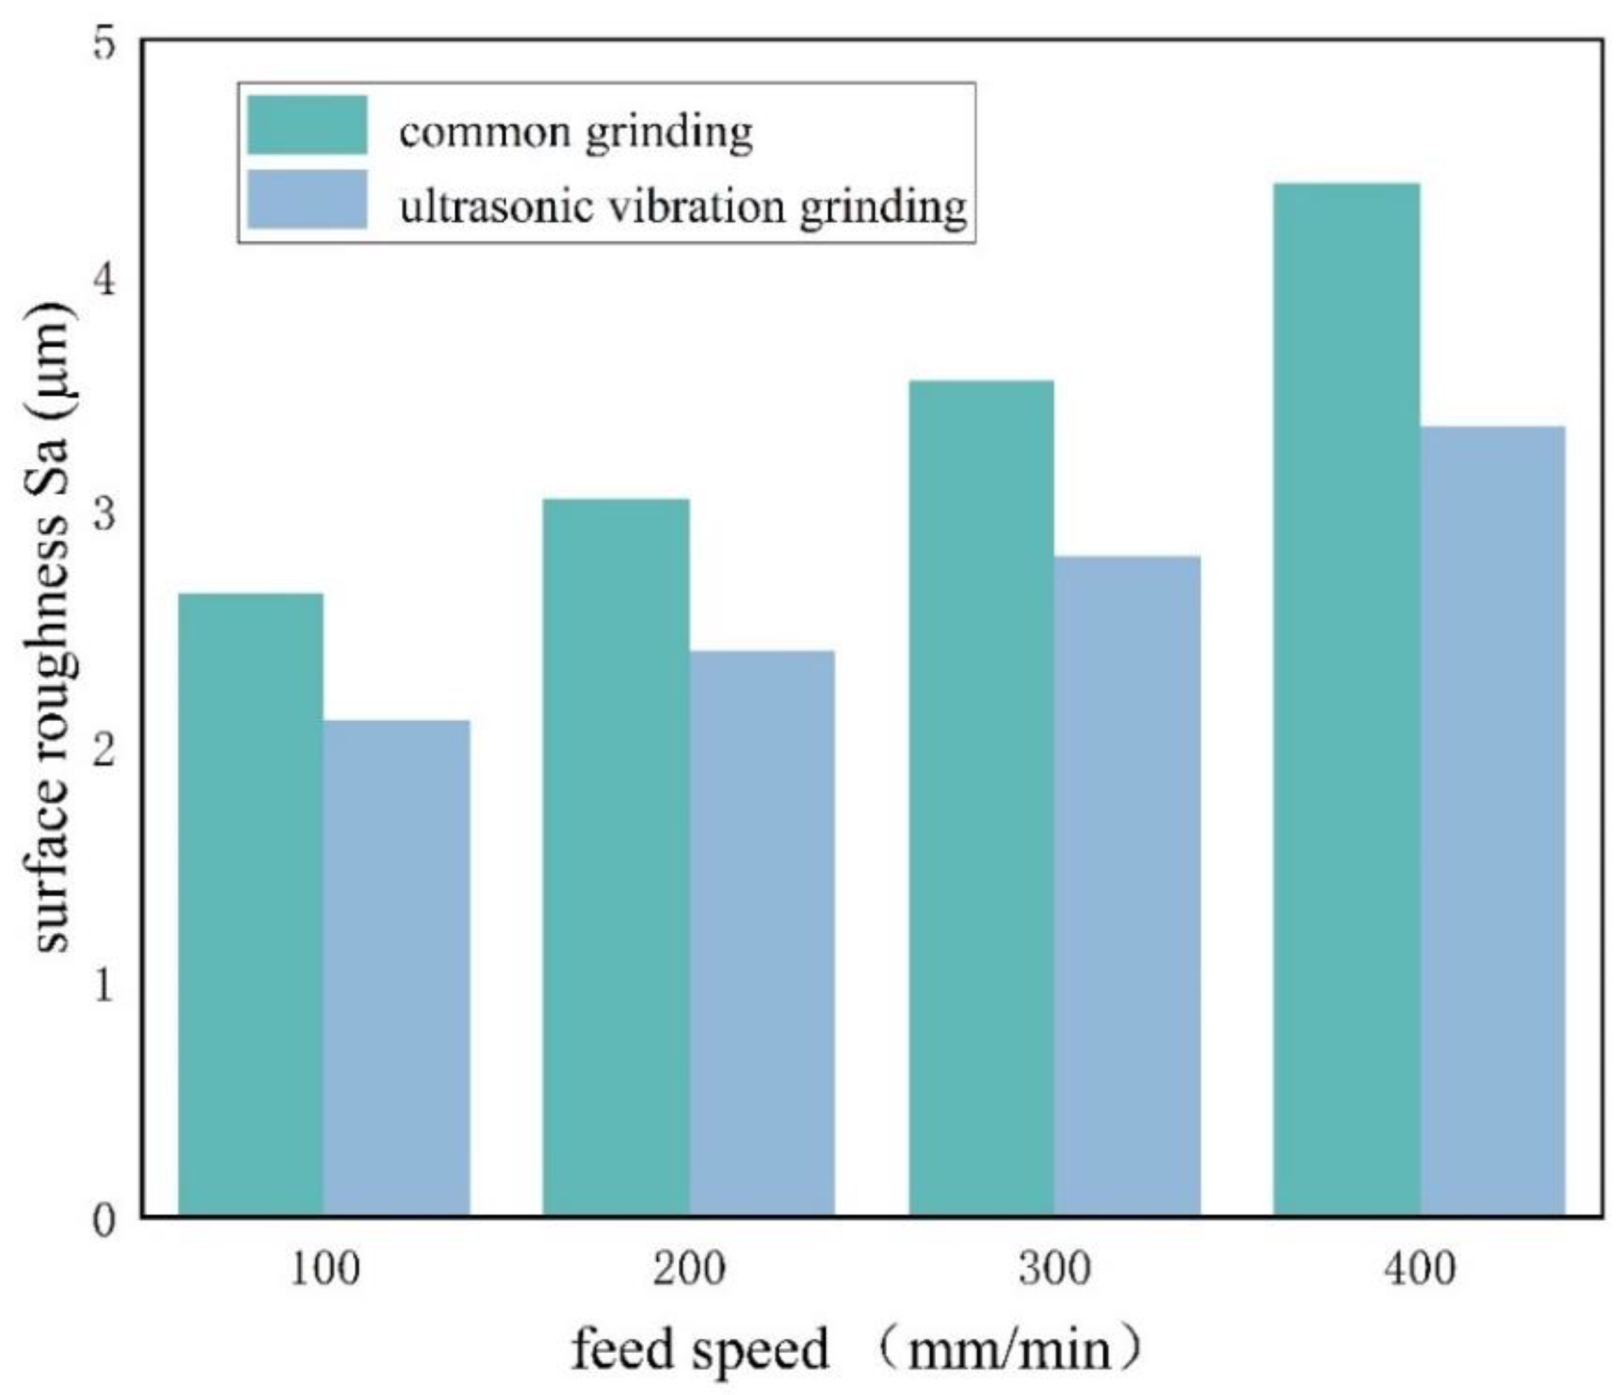
Figure 20.
Surface roughness of UVAIG under different vibration amplitude.
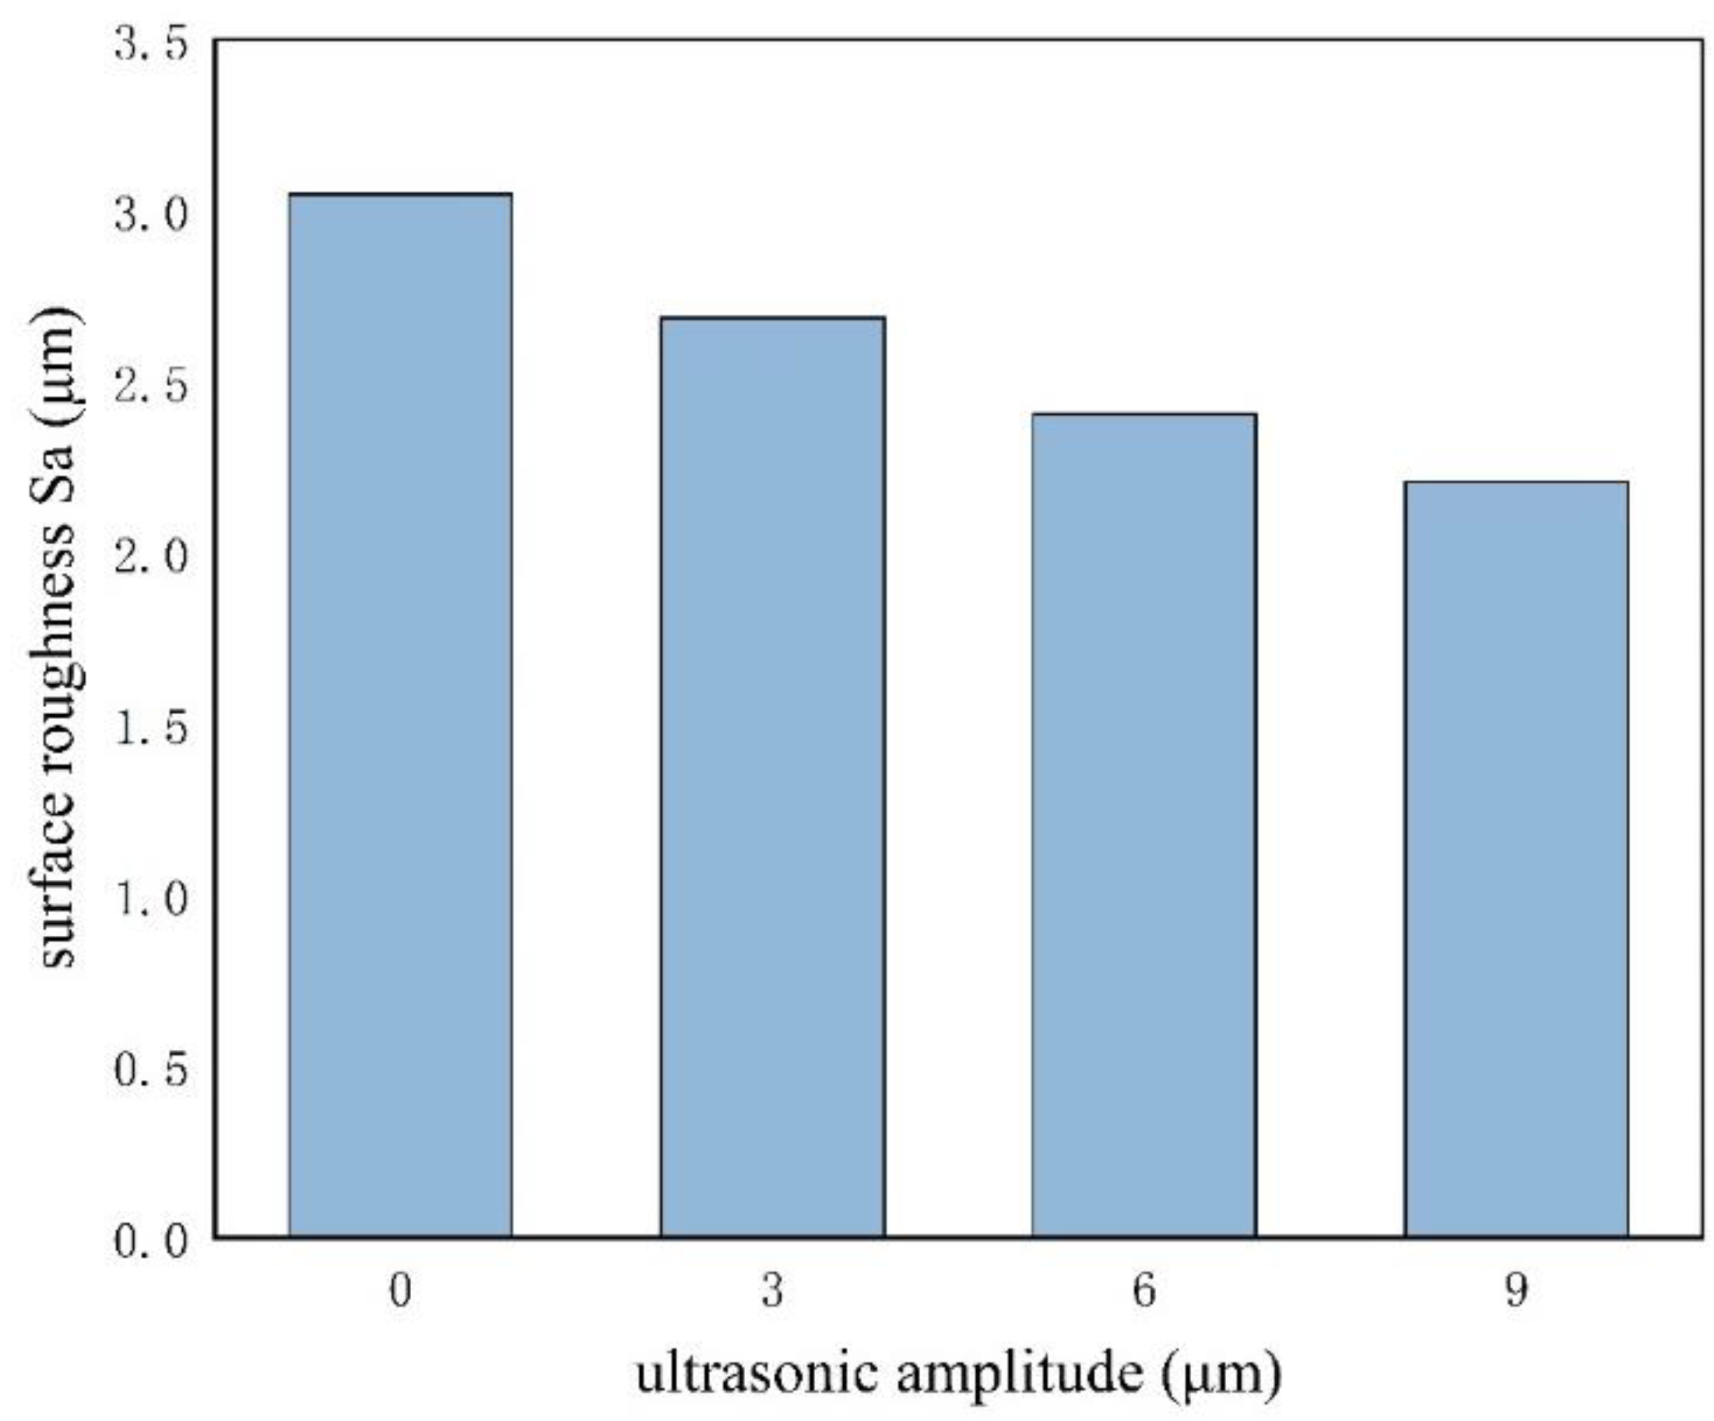

Table 1.
Single factor test parameters of UVAIG.
| Test serial number | Grinding wheel rotational speed (r/min) |
Feed rate (mm/min) |
Amplitude (μm) | Vibration frequency (kHz) |
|---|---|---|---|---|
| 1 | 8000,12000,16000,20000 | 200 | 0 | 0 |
| 2 | 8000,12000,16000,20000 | 200 | 6 | 20000 |
| 3 | 12000 | 100,200,300,400 | 0 | 0 |
| 4 | 12000 | 100,200,300,400 | 6 | 20000 |
| 5 | 12000 | 200 | 0,3,6,9 | 20000 |
Disclaimer/Publisher’s Note: The statements, opinions and data contained in all publications are solely those of the individual author(s) and contributor(s) and not of MDPI and/or the editor(s). MDPI and/or the editor(s) disclaim responsibility for any injury to people or property resulting from any ideas, methods, instructions or products referred to in the content. |
© 2026 by the authors. Licensee MDPI, Basel, Switzerland. This article is an open access article distributed under the terms and conditions of the Creative Commons Attribution (CC BY) license (http://creativecommons.org/licenses/by/4.0/).
Copyright: This open access article is published under a Creative Commons CC BY 4.0 license, which permit the free download, distribution, and reuse, provided that the author and preprint are cited in any reuse.


