
Submitted:
12 January 2026
Posted:
13 January 2026
You are already at the latest version
Abstract
Predictive pest management in urban sewer networks represents a sustainable alternative to reactive, biocide‑based methods. Using data collected through an IoT architecture and validated with manual inspections across eight manholes over 113 days, we implemented a rigorous comparative framework evaluating ten data mining algorithms, including classical methods (KNN, SVM, decision trees) and advanced ensemble techniques (XGBoost, LightGBM, CatBoost) optimized for unbalanced datasets. Gradient boosting models with explicit handling of class imbalance—where the absence of pests exceeds 77% of observations—showed exceptional performance, achieving a Macro‑F1 score above 0.92 and high precision in identifying the minority high‑risk class. Explainability analysis using SHAP consistently revealed that elevated CO₂ concentrations are the primary predictor of infestation, enabling early identification of critical zones. This study demonstrates that carbon dioxide (CO₂) acts as the most robust bioindicator for predicting severe infestations of Periplaneta americana, significantly outperforming conventional environmental variables such as temperature and humidity. The implementation of the model in a real‑time monitoring platform generates interpretable heat maps that support proactive and localized interventions, optimizing resource use and reducing dependence on biocides. This study presents a scalable, operationally viable predictive system designed for direct integration into municipal asset management workflows, offering a concrete, industry-ready solution to transform pest control from a reactive, labor-intensive process into a data-driven, proactive operational paradigm. This approach not only transforms pest management from reactive to predictive but also aligns with the Sustainable Development Goals, offering a scalable, interpretable, and operationally viable system for smart cities.
Keywords:
unbalanced data mining
; prediction of cockroach infestation
; IoT sensors
; carbon dioxide bioindicator
; sustainable smart cities
1. Introduction
Urban sanitation networks constitute the critical infrastructure underpinning public health and the sustainability of modern cities, managing millions of cubic meters of wastewater and stormwater daily. However, rapid global urbanization—with over 55% of the world’s population now residing in urban environments [1]—has exponentially increased pressure on these systems, exposing their vulnerabilities in terms of maintenance, efficiency, and resilience. One persistent yet underestimated challenge in this context is pest control, particularly regarding the American cockroach (Periplaneta americana), which not only poses a direct public health risk as a vector of pathogens [2] but also serves as a biological indicator of structural and hygiene-related issues within sewer networks [3]. Proactive management of these systems is therefore a fundamental component of urban sustainability and climate resilience [4].
Traditionally, pest management in sanitation networks has relied on reactive, chemical-intensive approaches, such as periodic biocide application [5]. While these methods may offer temporary control, they entail significant limitations, including high operational costs and adverse environmental impacts—such as soil and water contamination—and accelerate the development of pest resistance [6]. Moreover, reactive strategies fail to address the root causes of pest proliferation, such as the accumulation of organic matter in sewer systems, which creates ideal microhabitats for cockroach survival and reproduction [7]. In this context, the growing demand for sustainable urban infrastructure management has spurred the search for innovative alternatives that minimize environmental impact and optimize resource use [5,8]. Predictive modeling based on data mining algorithms has thus emerged as a key enabler for developing trained mathematical models. These techniques can uncover hidden patterns and extract actionable knowledge from the large volumes of environmental data collected via IoT sensors, thereby enabling precise parametrization of environmental bioindicators to predict public health vector problems [9,10]. This approach transforms management from reactive to proactive, converting raw data into actionable intelligence—processed, contextualized information that enables concrete, targeted interventions.
The scientific literature has established that temperature and humidity are key determinants of Periplaneta americana proliferation in sanitation networks [11]. However, this conventional perspective presents a critical gap by overlooking the potential of other indicators, such as carbon dioxide (CO₂). While CO₂ is generally recognized as an attractant for certain insects (e.g., mosquitoes), its specific relevance in the context of cockroaches—and, more importantly, its causal link to the anaerobic decomposition of organic matter, which forms the trophic foundation for these pests—has been largely underestimated [12]. Emerging research suggests that CO₂ could serve as a more precise and earlier bioindicator—not only of pest activity [13] but also of organic waste accumulation preceding infestations [14]. This ability to signal emerging problems before they reach critical levels enables preventive interventions [15,16,17], positioning CO₂ as a primary predictor that is causally more informative than conventional environmental parameters.
The identified gap in the literature is not merely about variables but is fundamentally methodological. Although well-established predictive models based on temperature and humidity exist in agricultural contexts—capable of anticipating pest outbreaks through environmental modeling and machine learning techniques [18]—these advances have not been effectively transferred to urban settings, particularly sewer networks. Most available studies on Periplaneta americana in underground environments remain limited to isolated correlational analyses, without evolving toward robust predictive systems that integrate multiple data sources [19]. This limitation is further exacerbated by the lack of models capable of adequately handling the pronounced class imbalance inherent in infestation data—where non-activity is the predominant condition—and by the difficulty of interpreting the relative contribution of each variable within complex data mining architectures [20]. Consequently, an unverified assumption persists: that temperature and humidity act as universal determinants, ignoring the possibility that their role may be secondary or context-dependent compared to more informative predictors like CO₂, whose relevance in this domain has barely been explored [21]. Addressing this gap requires closing the full data mining cycle—integrating robust multivariate data acquisition in hostile environments with predictive models capable of discovering, weighting, and operationalizing patterns in real time. In this direction, recent developments in specialized IoT architectures and data mining algorithms are beginning to challenge the traditional paradigm by prioritizing CO₂ as a key variable, establishing actionable quantitative thresholds for early detection and enabling localized, preventive interventions [22].
To address this knowledge gap, this article incorporates CO₂ as the primary bioindicator for developing a robust, operational predictive model to support the sustainable management of urban sanitation networks, offering, beyond theoretical models, a fully implemented IoT-to-decision process, validated in a real-world urban sanitation network, demonstrating its immediate applicability and economic viability for utility operators seeking to optimize resource allocation and reduce maintenance costs.. We base our work on the central hypothesis that CO₂ is the most important predictor for modeling P. americana activity and that a model derived from an appropriate data mining pipeline can deliver accurate predictions even in extremely imbalanced datasets, where the absence of events is the norm. To test this hypothesis, we conducted an exhaustive evaluation of a broad spectrum of predictive data mining algorithms, employing repeated cross-validation and performance metrics specifically designed for imbalanced settings—most notably the Macro-F1 Score and Balanced Accuracy. Finally, we employed the SHAP (SHapley Additive exPlanations) method as a model interpretability tool to analyze the relative importance of predictor variables within a robust explanatory framework. This approach not only identifies which variables contribute most significantly to predictions but also reveals how their influence varies across different levels of pest activity, thereby adding a layer of contextual understanding to the model’s behavior.
Based on the objectives of this study, the following hypotheses were formulated and subsequently evaluated:
- H1. Data mining models can be effectively used to predict cockroach activity levels in urban sewer networks using environmental sensor data.
- H2. Carbon dioxide (CO₂) concentration has a stronger influence on predicted cockroach activity than other traditional environmental indicators such as temperature and relative humidity.
- H3. Geospatial heat map–based visualizations improve the interpretability and operational usability of predictive results compared to traditional chart-based representations.
This work represents a significant step toward the development of smarter and more sustainable urban management systems, aligning with the United Nations Sustainable Development Goals (SDGs), specifically SDG 11 (Sustainable Cities and Communities) [23].
2. Materials and Methods
This study aimed to identify the optimal data mining model to predict the activity levels of Periplaneta americana in urban sanitation networks using environmental variables. The methodological approach focused on a rigorous process of modeling, cross-validation, and benchmarking of multiple algorithms.
2.1. Study Area and Sensor Deployment
The study was conducted in the urban sanitation network of the Parque Paraíso Arenal residential area, located in Córdoba, Andalusia, Spain (37.85°N, 4.75°W). Covering approximately 168,000 m², this area exhibits typical characteristics of Mediterranean urban environments, with hot summers and mild winters—conditions that favor the proliferation of Periplaneta americana in sewer systems [24]. The site was selected in collaboration with the municipal utility Saneamientos de Córdoba S.A. with the explicit goal of developing a predictive model that could be replicated in other urban zones with similar climatic conditions, where pest control remains a persistent public health and infrastructure management challenge.
To ensure representative and strategically distributed monitoring across the network, eight manholes (PC1–PC8) were selected for IoT sensor deployment, as shown in Figure 1. This selection was not random; it was guided by expert pest control technicians from the municipal company, following two key criteria: terrain topography and human activity intensity. First, manholes were chosen to span a range of elevations—from low-lying areas near a stream to progressively higher zones—to assess the influence of altitude on underground environmental conditions. Second, locations with higher wastewater discharge and potential organic matter accumulation—key drivers of pest proliferation [25]—were prioritized. Each manhole was precisely geolocated using GPS coordinates, enabling direct spatial correlation between collected environmental data and observed cockroach activity, and facilitating the generation of risk heatmaps.
2.2. IoT Architecture and Data Acquisition
Implementing a continuous, non-intrusive monitoring system in underground environments required a robust and energy-efficient IoT architecture (Figure 2), comprising three main components: IoT sensors, communication infrastructure, and a data management platform.
The sensors deployed were Milesight EM500-CO2 units (https://resource.milesight.com/milesight/iot/document/em500-co2-datasheet-en.pdf) featuring LoRaWAN® communication technology and designed to monitor CO₂ concentration, temperature, humidity, and barometric pressure in outdoor scenarios. With an estimated battery life of up to ten years (at 10-minute intervals and 25 °C), these sensors transmitted data every 10 minutes via the LoRaWAN protocol—a widely adopted IoT standard due to its low power consumption and long-range transmission capabilities, even in signal-challenged environments such as underground sewer networks [26].
Data collection and transmission were supported by a 6 dBi antenna and a 4G-connected gateway. This gateway relayed sensor data through The Things Network (TTN)—a global, open, and secure IoT network [27]—to a data management platform built on the FIWARE architecture, an open-source framework widely used in smart city solutions [28]. This design ensured reliable, real-time data transmission from manholes to the cloud, overcoming the inherent challenges of limited physical access and extreme conditions in underground settings [29]. The platform integrated several key components: the FIWARE IoT Agent (for data ingestion from TTN), the Orion Context Broker (OCB) (for storing information in virtual entities), QuantumLeap (for processing and analyzing time-series data stored in CrateDB—a database optimized for such workloads), and Grafana (for intuitive, real-time environmental data visualization) [30]. This end-to-end integration enabled not only data collection and storage but also analysis and presentation in an operator-friendly format, transforming raw data into actionable visual outputs such as predictive heatmaps [31].
2.3. Data Collection and Cleaning Protocol
Sampling was conducted daily over a 113-day period from March to June 2022, yielding an initial dataset of 904 samples. The sampling protocol was designed to simultaneously capture biological activity and environmental conditions. Each day, the lid of each of the eight selected manholes was opened, and the presence of P. americana was recorded using an operational categorical scale commonly employed by municipal sanitation services for practical and systematic infestation assessment. Within this study, the scale comprised three levels: 0 (None: no individuals observed), 1 (Low: countable individuals), and 2 (High: uncountable large numbers). This scale reflects standard observational criteria used in urban pest control campaigns, enabling rapid and consistent field assessments. Concurrently, permanently installed sensors automatically transmitted CO₂, temperature, and humidity values, ensuring precise temporal alignment between environmental conditions and pest activity.
To guarantee the highest quality and operational validity of model input data, cleaning and filtering protocols were rigorously designed and applied in strict accordance with technical criteria established both in the scientific literature [32] and by the technical department of Saneamientos de Córdoba S.A.—an entity with extensive documented experience in network management. These criteria were structured around two pillars: (1) the utility’s standardized sampling protocol and (2) the specific environmental conditions of the study area. The latter was particularly crucial for identifying and discarding anomalous measurements, such as those recorded during abrupt barometric pressure drops—a phenomenon known to alter cockroach behavior (as they tend to avoid manhole areas under such conditions) and thus potentially bias the analysis of normal underground activity. Additionally, all measurements taken within two hours following manhole lid opening were excluded, as such interventions inevitably perturb the microenvironmental conditions inside the manhole, introducing measurement bias. These exclusions ensured that the model learned genuine causal relationships between environmental predictors and cockroach activity.
Following data cleaning and preprocessing, the final dataset used for model training and evaluation comprised 904 observations. This sample strikes an appropriate balance between data integrity and statistical representativeness. The distribution of the dependent variable reveals pronounced class imbalance, with the "None" category (no activity) dominating at 77.2% (n = 699), compared to 18.7% classified as "Low" (n = 169) and only 4.0% as "High" (n = 36), confirming the highly imbalanced nature of the problem. Environmental variables exhibited substantial variability, with mean values of 23.83 °C for temperature, 82.85% for relative humidity, and 898.1 ppm for CO₂ concentration, as summarized in Table 1.
2.4. Model Selection and Variable Importance
To ensure a comprehensive evaluation, both classical and state-of-the-art data mining algorithms were considered, including linear models, instance-based methods, tree-based learners, ensemble approaches, and gradient boosting techniques [33]. Special attention was given to strategies for handling class imbalance:
- Logistic Regression (Softmax LR): Multinomial logistic regression was used as a baseline linear classifier, modeling class probabilities through a softmax function. Its simplicity and interpretability make it a useful reference model for evaluating the added value of more complex approaches.
- Logistic Regression with Class Weighting (Balanced Softmax LR): A class-weighted variant of logistic regression was employed to mitigate class imbalance by penalizing misclassification of minority classes more heavily. This approach adjusts the loss function without altering the original data distribution.
- SMOTE + Logistic Regression: To explicitly address data imbalance, Synthetic Minority Over-sampling Technique (SMOTE) was combined with logistic regression. SMOTE generates synthetic samples of the minority class in feature space, enabling the classifier to learn more robust decision boundaries.
- k-Nearest Neighbors (KNN): KNN is an instance-based learning algorithm that assigns class labels based on the majority class among the k closest samples in feature space. While simple, it can capture local data structures and non-linear patterns, particularly in low-dimensional feature spaces.
- Support Vector Machine with RBF Kernel (Balanced SVM): A Support Vector Machine with a radial basis function kernel was used to model non-linear class boundaries. Class weighting was applied to account for imbalance, allowing the model to maximize margin separation while emphasizing minority-class samples.
- Decision Tree (Balanced Decision Tree): Decision trees recursively partition the feature space using threshold-based rules, producing an interpretable hierarchical structure. Class weighting was incorporated to reduce bias toward the majority class, although single trees may still be sensitive to data variability.
- Balanced Random Forest (BalancedRF): Balanced Random Forest is an ensemble of decision trees trained on balanced bootstrap samples. By combining bagging with class-balanced sampling, this method improves robustness and reduces variance while maintaining sensitivity to minority classes.
- LightGBM (Balanced): LightGBM is a gradient boosting framework based on decision trees, optimized for efficiency and scalability. It incorporates histogram-based splitting and leaf-wise tree growth, and class weighting was applied to address imbalance during training.
- XGBoost with Balanced Sample Weights: XGBoost is a powerful gradient boosting algorithm that optimizes an additive ensemble of trees using second-order gradients. Since native multiclass class weighting is limited, balanced sample weights were applied during training to compensate for class imbalance.
- CatBoost (Balanced): CatBoost is a gradient boosting algorithm designed to reduce prediction bias and improve convergence stability. It natively supports automatic class weighting and is particularly effective in handling complex, non-linear relationships.
- Soft Voting Ensemble: A soft voting ensemble was constructed by combining the probabilistic outputs of several high-performing base models. By averaging predicted class probabilities, the ensemble aims to leverage complementary strengths of individual classifiers and improve overall generalization performance.
A repeated 10×10 cross-validation (CV) scheme was employed to ensure result robustness and mitigate overfitting [34]. Given the pronounced class imbalance—where the “None” class dominates—the evaluation prioritized metrics that penalize poor performance on minority classes, including Macro-F1 Score, Balanced Accuracy, and Weighted-F1 Score, rather than conventional accuracy [35].
To uphold methodological transparency and enable full reproducibility, all data mining algorithms were implemented in Python using the Scikit-learn library [36]. The complete source code and all experimental scripts have been made publicly available in a GitHub repository (The source code is available at https://github.com/jaguilarco/Sewer-DataMining-SoftSensors), facilitating independent verification and replication. Furthermore, the real-world dataset used for model training and validation has been openly shared via ZENODO [37], thereby fulfilling the principles of open science and enabling future benchmarking and research advancements.
Model selection followed a rigorous statistical framework. First, the Friedman test [38] was applied to assess whether significant performance differences existed among the evaluated algorithms. To identify which specific models differed significantly from one another, Nemenyi post-hoc diagrams [39] were used. These visualize the average rank of each model and the critical difference (CD) for each evaluation metric (see Figure 4).
Finally, to interpret predictor importance and test our central hypothesis regarding the role of CO₂, we employed the SHAP (SHapley Additive exPlanations) method [40]. SHAP quantifies the contribution of each predictor—CO₂, temperature, and humidity—to the model’s prediction for each specific class (“None,” “Low,” “High”), offering a contextual and granular understanding of how and why the model makes its decisions (see Figure 5).
3. Results
The systematic evaluation of multiple data mining algorithms revealed a set of robust models capable of accurately predicting Periplaneta americana activity levels in urban sanitation networks using environmental variables collected by the IoT system.
3.1. Comparative Model Evaluation and Best Model Selection
For a more detailed comparison, Table 2 presents the performance metrics of the ten evaluated models, ranked by their Macro-F1 Score. This metric was selected as the primary criterion for final model selection because it equally penalizes poor performance across all classes—a critical consideration in a highly imbalanced problem where the “High” class accounts for only 4% of the data.
As can be observed, gradient boosting–based models (XGBoost, LightGBM, CatBoost) and the soft voting ensemble (Ensemble_soft) lead the rankings, achieving Macro-F1 scores above 0.92. These models also exhibit excellent performance across other key metrics, including Balanced Accuracy (above 0.91) and AUPRC for the “High” class (above 0.97), confirming their ability to accurately predict both majority and minority classes.
Figure 3a reinforces this finding by illustrating the precision–recall trade-off specifically for the minority “High” class (severe infestation). The top five models display curves closely approaching the upper-right corner, indicating high precision and recall for this critical class. Moreover, all top models achieve AUPRC values above 0.96, confirming their capacity to identify critical infestation events with high reliability while avoiding excessive false positives.
Figure 3b shows the Macro-F1 Score of each model as a function of its rank derived from repeated cross-validation. The results clearly place gradient boosting models (XGBoost, LightGBM) and the ensemble method at the top positions, with scores exceeding 0.92, underscoring their superior performance in this highly imbalanced multiclass classification task.
The initial statistical analysis confirmed the presence of significant performance differences among the evaluated algorithms. The Friedman test yielded p-values below 0.05 for all primary metrics (Accuracy, Balanced Accuracy, Macro-F1, and Weighted-F1), indicating that the models are not statistically equivalent. These differences were clearly visualized using Nemenyi post-hoc diagrams (Figure 4).
The Nemenyi analysis was conducted across the four key metrics, using a critical difference (CD) of 4.2836—below which differences between models are not considered statistically significant. Overall, gradient boosting–based models (XGBoost, LightGBM, CatBoost) and the soft voting ensemble (Ensemble_soft) consistently emerged as the top-performing group across most metrics. Their rank intervals overlap substantially, indicating no statistically significant differences among them.
Notably, this group excelled in metrics most relevant for imbalanced classification tasks—particularly the Macro-F1 Score, which is essential given the extreme class skew (77.2% of instances abelled “None”), and Balanced Accuracy. In contrast, algorithms such as Balanced SVM, Balanced Softmax Logistic Regression, and Balanced Decision Tree consistently ranked in the lower performance groups, with statistically inferior results. Models like Balanced CatBoost and KNN exhibited intermediate behavior: while clearly separated from the top-performing group, they significantly outperformed the weakest models, occupying a distinct middle tier in the performance hierarchy.
3.2. Variable Importance Interpretation (SHAP Analysis)
To validate our central hypothesis regarding the role of CO₂, we conducted a variable importance analysis using the SHAP (SHapley Additive exPlanations) method. This analysis not only confirms that CO₂ is the most influential predictor but also reveals how its impact varies across target classes. In our case, we have selected the XGBoost prediction model generated from our dataset for applying SHAP methods due to it is one of the best algorithms, together with ensemblers.
Figure 5 concisely summarizes the mean importance of each variable per class, quantified by the mean absolute SHAP value (mean(|SHAP value|)). The results are unequivocal: carbon dioxide (CO₂) is, without doubt, the most important predictor across all classes, with an average impact exceeding 6.5. This magnitude is nearly double that of humidity (approximately 3.5) and more than double that of temperature (approximately 2.5).
This finding directly challenges the conventional assumption in the literature, which has historically focused on temperature and humidity as the primary determinants of cockroach activity [11]. In our specific context, CO₂ emerges as a robust and dominant bioindicator—its signal proving essential for the accurate prediction of pest activity levels in urban sewer networks.
However, the analysis illustrated in the beeswarm plots (Figure 6) provides a deeper and more contextualized understanding by showing how each predictor—CO₂, temperature, and humidity—influences the model’s prediction for each of the three Periplaneta americana activity classes. The results reveal the following nuanced patterns:
- In the case of the "None" class (Absence of Pests) (Figure 6a), low CO₂ values have a strongly positive impact on the prediction of this class. This means that when CO₂ is low, the model is very confident that there is no cockroach activity. Temperature and humidity have a much weaker and less consistent impact.
- For the "Low" class (Figure 6b) a more complex pattern is revealed. Average CO₂ values seem to favor the prediction of "Low", while very high or low values tend to decrease the probability of this class. In addition, high humidity has a positive impact on the prediction of "Low", suggesting that, in humid conditions, even with medium CO₂, cockroach proliferation may be limited.
- Finally, for the "High" Class (Severe Proliferation) the clearest and strongest relationship is observed in Figure 6c. High CO₂ values have a strongly positive impact on the prediction of "High". This confirms that high CO₂ is the most robust indicator of severe cockroach proliferation. Temperature also contributes positively, but to a lesser extent, while high humidity tends to decrease the likelihood of a "High” Temperature" prediction.".
These results demonstrate that, although CO₂ is the dominant predictor, temperature and humidity are not irrelevant. Their influence is contextual and secondary, varying depending on the activity level being predicted. The SHAP analysis enables a transparent understanding of the model’s internal logic, revealing non-linear and class-specific interactions that would remain hidden when relying solely on global feature importance metrics.
3.3. Pest Activity Visualization and Subjective Assessment.
The integration of the final model into the real-time monitoring platform enabled the generation of heatmaps visualizing pest activity across the study area. These maps—derived from sensor-collected data processed by the predictive model—provide municipal operators with a powerful, intuitive decision-support tool for proactive infrastructure management.
Figure 7display the heatmaps generated from the initial (a) and final data (b) of the study period, respectively, after the model had been fully trained and validated. As expected, the beginning of the study (early spring) coincided with minimal cockroach activity. In stark contrast, by mid-June, distinct hotspots of severe infestation emerged, concentrated primarily around Parque Paraíso Arenal and along Amalia Rodríguez and Sauce streets. This spatiotemporal evolution aligns with seasonal biological patterns and validates the model’s ability to capture and visualize the onset and intensification of pest proliferation in real-world urban sewer networks.
To evaluate the effectiveness of this visualization in a real operational setting, a usability assessment was conducted with 22 experts in urban sanitation management—including engineers, technical managers, and maintenance supervisors—each with more than five years of professional experience. Participants compared the heatmap-based interface overlaid on Google Maps against traditional graphical representations displayed in the Grafana dashboard (Figure 8) for interpreting predicted cockroach activity.
The evaluation followed human-centered design principles as outlined in the ISO 9241-210 standard (2019) and employed a 5-point Likert scale [Likert, 1932] to assess five key statements regarding the usefulness and intuitiveness of each visualization approach. This methodology enabled a structured, user-informed comparison of how effectively each interface supports rapid comprehension, spatial awareness, and operational decision-making in the context of pest monitoring and intervention planning.
The results of this evaluation, summarized in Table 3, show a strong consensus among experts regarding the operational advantages of the heatmap. 91% of participants agreed or strongly agreed that the map allows for faster identification of critical intervention zones (S1), 86% considered it more intuitive for understanding infestation risk (S2), and 89% judged it more suitable for daily use in control centers (S3). Furthermore, 95% of the experts confirmed that the map is appropriate for daily operational use (S4).
However, as shown in Figure 9, statement S5—that the heatmap provides more precise information than traditional graphs for detailed quantitative analysis—received a significantly lower level of agreement (64%). This finding indicates that, although the heatmap is superior for strategic decision-making and situational awareness, traditional graphs remain preferred for tasks requiring exact numerical precision.
4. Discussion
The results of this study provide a multidimensional analysis of the application of predictive data mining techniques—supported by IoT sensors—to address the complex, highly imbalanced operational problem of predicting cockroach infestation. The discussion is structured around four main interpretive axes emerging from the findings: the redefinition of the hierarchy among environmental predictors, the differential capacity of algorithms to handle extreme class imbalance, the critical role of interpretability and visualization in operational adoption, and the inherent limitations that outline the path for future research.
4.1. Algorithmic Robustness in Extreme Imbalance: Beyond Global Accuracy
The systematic comparative evaluation highlights a significant disparity in the ability of different data mining algorithms to manage the extremely skewed class distribution (77.2% “None”). The consistent statistical superiority of gradient boosting–based models (XGBoost, LightGBM, CatBoost) and the soft voting ensemble (Ensemble_soft)—confirmed by the Friedman test and Nemenyi diagrams (Figure 4)—goes beyond mere accuracy metrics.
Their exceptional performance in Macro-F1 Score (>0.92) and AUPRC for the “High” class (>0.97) (Table 2) indicates that these algorithms possess intrinsic mechanisms—such as adaptive loss functions or asymmetric tree growth—that enable them to learn robust signals from minority classes without being overwhelmed by the majority. In contrast, the significantly lower performance of classical algorithms such as KNN, SVM, or simple decision trees—even with class-balancing adjustments—demonstrates that in domains with extreme imbalance, algorithm selection is not a technical detail but a critical factor determining the very feasibility of a predictive solution. This finding has direct implications for the design of future operational systems, where effectiveness in detecting rare but critical events is paramount.
4.2. The Supremacy of CO₂: Reinterpreting Traditional Environmental Predictors
The most robust and consistently replicated finding across all metrics and interpretability methods is the identification of carbon dioxide (CO₂) as the single most influential predictor for modeling P. americana activity. This result substantially challenges the prevailing consensus in the specialized literature, which for decades has positioned temperature and humidity as the primary environmental determinants [11,15]. The SHAP analysis not only quantifies this primacy—showing a mean impact nearly double that of humidity and more than double that of temperature (Figure 5)—but also reveals its causal and contextual nature.
This dominance can be interpreted by recognizing CO₂ as a proxy for ongoing biological processes within the sewer ecosystem. While temperature and humidity define a potential habitability envelope, CO₂ concentrations constitute a direct, integrative chemical signature of active biological metabolism—particularly anaerobic decomposition of organic matter, which serves as the primary food substrate [13]. Thus, elevated CO₂ levels (above the identified threshold of 794 ppm) do not merely indicate favourable conditions but signal the active presence and metabolic activity of colonies, functioning as a more immediate and specific bioindicator than thermohygrometric parameters.
The class-wise SHAP analysis (Figure 6) adds a crucial layer of understanding by showing that temperature and humidity are not irrelevant but rather modulatory and conditional. For instance, the positive role of high humidity for the “Low” class and its negative effect for the “High” class suggests the existence of complex thresholds and interactions where these traditional factors can either amplify or attenuate the effect of the dominant predictor (CO₂), redefining their contribution as secondary and contextual rather than deterministic.
4.3. nterpretability and Visualization: From Black-Box Models to Actionable Intelligence
The ultimate utility of a predictive model in an operational setting depends not only on its accuracy but also on end users’ ability to understand and act upon its outputs. This study addressed this challenge at two complementary levels. First, the application of the SHAP method provided local and global explanations that go beyond traditional feature importance metrics. By decomposing how each variable contributes to each specific prediction (Figure 6), SHAP transforms the model into a diagnostic tool, enabling managers not only to trust an alert but also to understand the underlying environmental logic—for example, discerning whether a “High” risk alert is primarily driven by a CO₂ spike or by a combination of factors.
Second, the usability evaluation with domain experts (Table 3, Figure 9) offers strong empirical validation of the operational value of geospatial visualization. The high agreement level (≥86%) that heatmaps improve rapid identification of critical zones, intuitiveness, and suitability for daily use confirms the hypothesis that this representation better aligns with real-time situational awareness and strategic decision-making needs. The nuanced result for statement S5—where only 64% found the heatmap superior for detailed quantitative analysis—is equally revealing. It suggests that geospatial visualizations and traditional analytics (e.g., Grafana dashboards) are not mutually exclusive but complementary, each optimal for a different phase of the management cycle: heatmaps for monitoring and prioritization, and dashboards for auditing and in-depth analysis.
4.4. Limitations and Practical Considerations
Despite the methodological rigor and positive outcomes, it is important to acknowledge this study’s limitations to contextualize its scope and guide future work. A primary limitation is the geographic and climatic specificity of the study area. The external validity of the model—particularly the identified CO₂ thresholds—must be evaluated in sanitation networks across different climatic regions, topographies, and land-use patterns to ensure generalizability.
Second, the current model relies on a limited set of three environmental variables. Incorporating additional predictors—such as concentrations of other gases (CH₄, H₂S), hydraulic parameters, or external data (precipitation, seasonality)—could significantly enrich the model, capturing more complex interactions and enhancing both predictive power and explanatory capacity.
A third consideration concerns the economic and operational feasibility of large-scale deployment. The initial cost of IoT infrastructure and ongoing maintenance may pose barriers to widespread adoption. However, the anticipated development of more affordable sensors and advances in communication technologies are likely to enable faster, more cost-effective scaling of these solutions.
5. Conclusions
This work is framed within an industrial special issue, prioritizing robustness, deployability, and decision-support value over theoretical algorithmic novelty. In this sense, this study has demonstrated the viability of an integrated predictive system for proactive pest management in sanitation networks, validating the three research hypotheses through a rigorous approach combining IoT sensing, advanced data mining, and geospatial visualization.
First, Hypothesis H1 is confirmed: data mining models—particularly those based on gradient boosting (XGBoost, LightGBM, CatBoost) and ensemble methods—can be used with high efficacy to predict Periplaneta americana activity levels from environmental data. Their exceptional performance (Macro-F1 > 0.92) on a markedly imbalanced dataset—where the class of greatest interest (“High”) represents only 4%—highlights their robustness and suitability for such applications. These algorithms not only significantly outperformed classical methods but also proved capable of extracting reliable predictive patterns from complex environmental signals, establishing a methodological precedent for data mining in critical infrastructure monitoring.
Second, the results strongly support Hypothesis H2: carbon dioxide (CO₂) concentration emerges as the most influential environmental predictor, clearly surpassing temperature and relative humidity. The SHAP analysis quantified this primacy, revealing that CO₂’s average impact on model output is approximately double that of humidity and more than double that of temperature. This finding redefines the relevant bioindicator framework for sewer pest management, shifting focus from traditional thermohygrometric parameters to a direct marker of biological activity and organic matter decomposition. The identification of a ~794 ppm threshold as a cutoff for severe proliferation further provides a quantitative, actionable criterion for early warning alerts.
Finally, Hypothesis H3 is validated: geospatial heatmap visualization of predictive outputs proved significantly more effective than traditional graphical representations for operational interpretation and decision-making. The usability evaluation with 22 experts revealed overwhelming consensus (≥86% agreement) that this interface enables faster identification of critical zones, is more intuitive, and is better suited for daily use in control centers. This result confirms that effectively translating model output into an intuitive visual tool is essential for bridging the gap between technical prediction and on-the-ground preventive action.
In summary, this work not only verifies the stated hypotheses but also delivers a complete, reproducible methodological framework integrating robust IoT data capture, imbalance-resilient predictive modeling, causal variable interpretation, and operational visualization. It demonstrates that urban pest management can be transformed from a reactive, biocide-dependent paradigm to a predictive, sustainable, and data-driven approach.
The findings not only offer a concrete solution but also chart a clear path for future development. For this predictive approach to mature and scale, several research directions are valuable. Notably, CO₂ thresholds and variable importance were established in a specific network under a Mediterranean climate; the logical next step is to test the model’s adaptability in other contexts—such as sanitation networks in cities with different climates, more complex topographies, or higher urban density. This external validation is crucial to ensure the tool is robust and scalable, evolving from a successful case study into a widely applicable solution.
Simultaneously, the current predictive model has significant room to become richer and more precise—for example, by incorporating new data sources such as measurements of other decomposition-related gases (methane or hydrogen sulfide), in-pipe flow parameters, or real-time meteorological data. Such enhancements could reveal subtler environmental interactions and not only refine predictions but also deepen understanding of the complex ecology of the urban subsurface.
From a practical standpoint, the long-term economic and operational viability of the IoT infrastructure remains an open challenge. Research into active data mining strategies—for instance, algorithms that dynamically decide when and how frequently to measure based on estimated risk—could drastically optimize energy consumption and sensor lifespan, reducing maintenance costs and enhancing system sustainability.
True operational transformation, however, will come with full integration into municipal workflows. The ultimate goal is to automatically connect the predictive platform with existing asset management systems (CMMS) and digital mapping tools (GIS) already used by city authorities. In this vision, a high-risk alert would automatically generate a work order for maintenance teams, assign an optimized route, and log the completed intervention—closing the loop of intelligent management without manual intervention.
Finally, the versatility of the methodological framework developed here invites broader application. The same logic of sensorization, data mining, and visualization could be extended to predict the activity of other vectors—such as rodents or mosquitoes—or even to monitor other infrastructure issues, such as pipe corrosion or grease and sediment accumulation.
Advancing along these lines will decisively contribute to realizing the ideal of smart, resilient cities—shifting from a management model based on reaction and fixed schedules to one governed by data and anticipation, where infrastructure is not merely repaired but proactively and sustainably cared for in service of public health.
6. Patents
This work is based on a patented invention registered under number ES202300029, titled “System for detecting public health vectors in urban sanitation networks based on adapted devices for data acquisition and transmission from each selected manhole, and its application method” [22]. The patent covers the system’s integrated architecture, including sensor devices specifically adapted for underground environments, the IoT communication infrastructure, and the predictive modeling procedure—which, in the patented implementation, relies on multinomial logistic regression using carbon dioxide as the primary bioindicator. The development of this article constitutes the experimental and scientific validation of the principles outlined in the patent, demonstrating their real-world applicability and effectiveness.
Supplementary Materials
The following supporting information can be downloaded at: https://zenodo.org/records/18186918.
Author Contributions
For research articles with several authors, a short paragraph specifying their individual contributions must be provided. The following statements should be used “Conceptualization, C.R., C.C.L. and E.G.; methodology, C.C.L. and E.G.; software, J.A.; validation, J.A., C.R. C.C.L. and E.G.; formal analysis, C.C.L. E.G. and C.R.; investigation, J.A.; resources, J.A.; data curation, J.A.; writing—original draft preparation, J.A.; writing—review and editing,J.A., C.R., C.C.L. AND E.G.; visualization, J.A.; supervision, C.R.; project administration, C.C.L. and E.G.; funding acquisition, J.A. and E.G. All authors have read and agreed to the published version of the manuscript.
Funding
This work received external funding. The research was carried out with resources from the public company Saneamientos De Córdoba S.A., intended to pay for the material used and contracted management services, which provided access to the manholes and the necessary logistical support for the implementation of the monitoring system.
Data Availability Statement
The data supporting the findings of this study are available in the institutional repository of the University of Cordoba, under the Creative Commons Attribution 4.0 International (CC BY 4.0) license. The data can be accessed through the following link: https://zenodo.org/records/18022462. This dataset includes the environmental measurements (temperature, humidity, CO₂) and activity levels of Periplaneta americana recorded in the eight log wells during the 113 days of the study. Data corresponding to the two hours after the opening of the well covers and the three days with significant precipitation have been excluded, as detailed in the Methods section. Full documentation of the data sampling and cleansing protocol is also available in the same repository. The code supporting the findings of this study is available in Sewer-DataMining-SoftSensors at https://github.com/jaguilarco/Sewer-DataMining-SoftSensors.
Acknowledgments
The authors wish to express their sincere gratitude to the City of Córdoba for its collaboration and logistical support in the implementation of the IoT monitoring system and the realization of the field sampling. We also thank the technicians of the urban sanitation department of the public company Saneamientos de Córdoba as well as the Paraíso Arenal Neighborhood Association for their invaluable help in providing the technical and logistical means respectively, necessary without which this work would not have been possible. During the preparation of this manuscript, the authors used generative artificial intelligence (GenAI) tools, specifically for the grammar, spelling, and formatting check of the text. The authors have thoroughly reviewed and edited all output generated by these tools and assume full responsibility for the final content of this publication.
Conflicts of Interest
The authors declare that they have no conflicts of interest. There has been no role for funders in the design of the study; in the collection, analysis or interpretation of data; in the writing of the manuscript; nor in the decision to publish the results. This work was carried out with the authors' own resources and that of the municipal institution of Córdoba, which provided access to the manholes and the logistical support necessary for the implementation of the monitoring system. The authors have thoroughly reviewed and edited all output generated by generative artificial intelligence (GenAI) tools and take full responsibility for the final content of this post.
Abbreviations
The following abbreviations are used in this manuscript:
| CH₄ | Methane |
| H₂S | Hydrogen Sulfide |
| CMMS | Computerized Maintenance Management System |
| GIS: | Geographic Information System |
| OOF | Out-of-Fold |
| SDG | Sustainable Development Goals |
| FIWARE | Open-source framework for smart cities |
| TTN | The Things Network |
| OCB | Orion Context Broker |
| LoRaWAN | Long Range Wide Area Network |
| R² | Coefficient of Determination |
References
- Welford, M.R.; Yarbrough, R.A. Urbanization. In Human-Environment Interactions: An Introduction; Springer International Publishing: Cham, Switzerland, 2020; pp. 193–214.
- Geng, D.; Zhang, Y.; Wang, Y.; Li, X.; Liu, H. The Medical Importance of Cockroaches as Vectors of Pathogens: Implications for Public Health. Zoonoses 2025, 5, 982. [CrossRef]
- Hiscox, A.; et al. The Impact of Adverse Weather Events on Cockroaches and Flies, and the Possible Effects on Disease. Med. Vet. Entomol. 2025, 39, in press. [CrossRef]
- Alhasaani, Z.S.; Abdulameer, L.; Nile, B.K. Urban Land Use Change and Sewer System Resilience: A Comprehensive Review. Innov. Infrastruct. Solut. 2025, 10, 545.
- Dhang, P., Ed. Urban Pest Management: An Environmental Perspective; CABI: Wallingford, UK, 2023.
- Khan, B.A.; Khan, A.A.; Khan, M.A.; et al. Pesticides: Impacts on Agriculture Productivity, Environment, and Management Strategies. In Emerging Contaminants and Plants: Interactions, Adaptations and Remediation Technologies; Springer International Publishing: Cham, Switzerland, 2023; pp. 109–134. [CrossRef]
- Stuart, A.M.; et al. Alternative Domestic Rodent Pest Management Approaches to Address the Hazardous Use of Metal Phosphides in Low- and Middle-Income Countries. J. Pest Sci. 2025, 98, 89–111. [CrossRef]
- Ogwu, M.C.; Izah, S.C. Smart Technologies for Tropical Disease Prevention and Control. In Technological Innovations for Managing Tropical Diseases; Springer Nature Switzerland: Cham, Switzerland, 2025; pp. 213–235.
- Hu, K.; et al. Recent Advances of Artificial Intelligence in Aquatic Bioindicators and Ecological Assessment. Water Air Soil Pollut. 2026, 237, 306.
- Mangayarkarasi, T.; et al. Neural Network Approaches to Predicting Vector-Borne Disease Spread with IoT Environmental Sensors. In Proceedings of the 2025 3rd International Conference on Sustainable Computing and Data Communication Systems (ICSCDS); IEEE: 2025; pp. 279–284.
- Abudin, S.; Martini, M.; Nurjazuli, N. Factors That Trigger Cockroach Density: A Literature Review. Maj. Kesehat. Indones. 2023, 4, 71–76. [CrossRef]
- Dhang, P. Urban Pest Control; CABI: Wallingford, UK, 2018.
- Aboagye, I.F.; et al. Non-Insecticidal Control of Domestic and Peri-Domestic Species of Cockroach. J. Basic Appl. Zool. 2025, 86, 28.
- Yerli, C.; Cakmakci, T.; Sahin, U. Soil CO₂ Emission Linearly Increases with Organic Matter Added Using Stabilized Sewage Sludge under Recycled Wastewater Irrigation Conditions. Water Air Soil Pollut. 2023, 234, 56.
- Hajam, Y.A.; Parey, S.H.; Bhat, R.A., Eds. Insect Diversity and Ecosystem Services: Volume 2: Environmental Indicators, Molecular Approaches, and Management Strategies; CRC Press: Boca Raton, FL, USA, 2024.
- Keerthana, B.; et al. Ensuring Food Security: Strategies for Insect Pest Detection in Storage—A Review. Int. Food Res. J. 2025, 32, 2.
- Materne, N.; Inoue, M. IoT Monitoring System for Early Detection of Agricultural Pests and Diseases. In Proceedings of the 2018 12th South East Asian Technical University Consortium (SEATUC); IEEE: 2018; pp. 1–5.
- Hussain, A.; Khan, F.; Albalawi, O. Modeling and Monitoring CO₂ Emissions in G20 Countries: A Comparative Analysis of Multiple Statistical Models. Sustainability 2024, 16, 6114. [CrossRef]
- Nathan, B.; Xueref-Remy, I.; Lauvaux, T.; Yohia, C.; Piga, D.; Piazzola, J.; Oda, T.; Milne, M.; Herrmann, M.; Wimart-Rousseau, C.; et al. A Modeling Framework of Atmospheric CO2 in the Mediterranean Marseille Coastal City Area, France. Atmosphere 2024, 15, 1193. [CrossRef]
- Elshaboury, N.; Mohammed Abdelkader, E.; Al-Sakkaf, A.; Alfalah, G. Predictive Analysis of Municipal Solid Waste Generation Using an Optimized Neural Network Model. Processes 2021, 9, 2045. [CrossRef]
- Koutsoyiannis, D.; Onof, C.; Kundzewicz, Z.W.; Christofides, A. On Hens, Eggs, Temperatures and CO2: Causal Links in Earth’s Atmosphere. Sci 2023, 5, 35. [CrossRef]
- García Salcines, E.; Aguilar Cordón, J. System for Detection of Sanitary Vectors in Urban Sewer Networks Based on Devices Adapted for Data Collection and Transmission from Each Selected Manhole, and Application Procedure; ES 2982592 A1; Spanish Patent and Trademark Office: Madrid, Spain, 2024. https://patentscope.wipo.int/search/es/detail.jsf?docId=WO2024189255 (accessed on 30 December 2025).
- Caputo, F.; Magliocca, P.; Canestrino, R.; Rescigno, E. Rethinking the Role of Technology for Citizens’ Engagement and Sustainable Development in Smart Cities. Sustainability 2023, 15(13), 10400. [CrossRef]
- Lin, L.; Wen, J.; Li, S.; Liu, F. Life-History Traits from Embryonic Development to Reproduction in the American Cockroach. Insects 2022, 13(6), 551. [CrossRef]
- Zhang, Y.; Liu, X.; Wang, Y.; Zhang, J.; Wang, H. Spatiotemporal Characteristics and Influencing Factors of Urban Pest Infestation in Drainage Systems: A Case Study of a Megacity in China. Sustainability 2023, 15, 11234. [CrossRef]
- Bonilla, V.; Campoverde, B.; Yoo, S.G. A Systematic Literature Review of LoRaWAN: Sensors and Applications. Sensors 2023, 23, 8440. [CrossRef]
- The Things Network. Squeezing Every Drop of Juice from Your Energy Source. The Things Network, 13 October 2025. Available online: https://www.thethingsnetwork.org/articles (accessed on 7 January 2026)..
- Alonso, Á.; Pozo, A.; Cantera, J.M.; De la Vega, F.; Hierro, J.J. Industrial Data Space Architecture Implementation Using FIWARE. Sensors 2018, 18(7), 2226. [CrossRef]
- Calderón, D.; Folgado, F.J.; González, I.; Calderón, A.J. Implementation and Experimental Application of Industrial IoT Architecture Using Automation and IoT Hardware/Software. Sensors 2024, 24(24), 8074. [CrossRef]
- Khattach, O.; Moussaoui, O.; Hassine, M. End-to-End Architecture for Real-Time IoT Analytics and Predictive Maintenance Using Stream Processing and ML Pipelines. Sensors 2025, 25(9), 2945. [CrossRef]
- Costa, A.; Miranda, J.; Dias, D.; Dinis, N.; Romero, L.; Faria, P.M. Smart Maintenance Solutions: AR- and VR-Enhanced Digital Twin Powered by FIWARE. Sensors 2025, 25(3), 845. [CrossRef]
- Prasad, A.N. Data Quality and Preprocessing. In Introduction to Data Governance for Machine Learning Systems; Springer International Publishing: Cham, Switzerland, 2024; pp. 109–223. [CrossRef]
- Martinović, M.; Dokic, K.; Pudić, D. Comparative Analysis of Machine Learning Models for Predicting Innovation Outcomes: An Applied AI Approach. Appl. Sci. 2025, 15, 3636. [CrossRef]
- Allgaier, J.; Pryss, R. Cross-Validation Visualized: A Narrative Guide to Advanced Methods. Mach. Learn. Knowl. Extr. 2024, 6(2), 1378–1388. [CrossRef]
- Farhadpour, S.; Warner, T.A.; Maxwell, A.E. Selecting and Interpreting Multiclass Loss and Accuracy Assessment Metrics for Classifications with Class Imbalance: Guidance and Best Practices. Remote Sens. 2024, 16(3), 533. [CrossRef]
- Pedregosa, F.; et al. Scikit-learn: Machine Learning in Python. J. Mach. Learn. Res. 2011, 12, 2825–2830.
- Aguilar Cordón, J. (2025). Environmental Sensor Data from Sewer Networks for Predicting Periplaneta americana Activity Levels (v1.0) [Data set]. University of Córdoba. Spain. [CrossRef]
- Demšar, J. Statistical Comparisons of Classifiers over Multiple Data Sets. J. Mach. Learn. Res. 2006, 7, 1–30.
- García, S.; Fernández, A.; Luengo, J.; Herrera, F. Advanced Nonparametric Tests for Multiple Comparisons in the Design of Experiments in Computational Intelligence and Data Mining: Experimental Analysis of Power. Inf. Sci. 2010, 180(10), 2044–2064.
- Lundberg, S.M.; Lee, S.I. A Unified Approach to Interpreting Model Predictions. Adv. Neural Inf. Process. Syst. 2017, 30, 4765–4774.
Figure 1.
Map of the study area in Parque Paraíso Arenal, Córdoba, Spain.
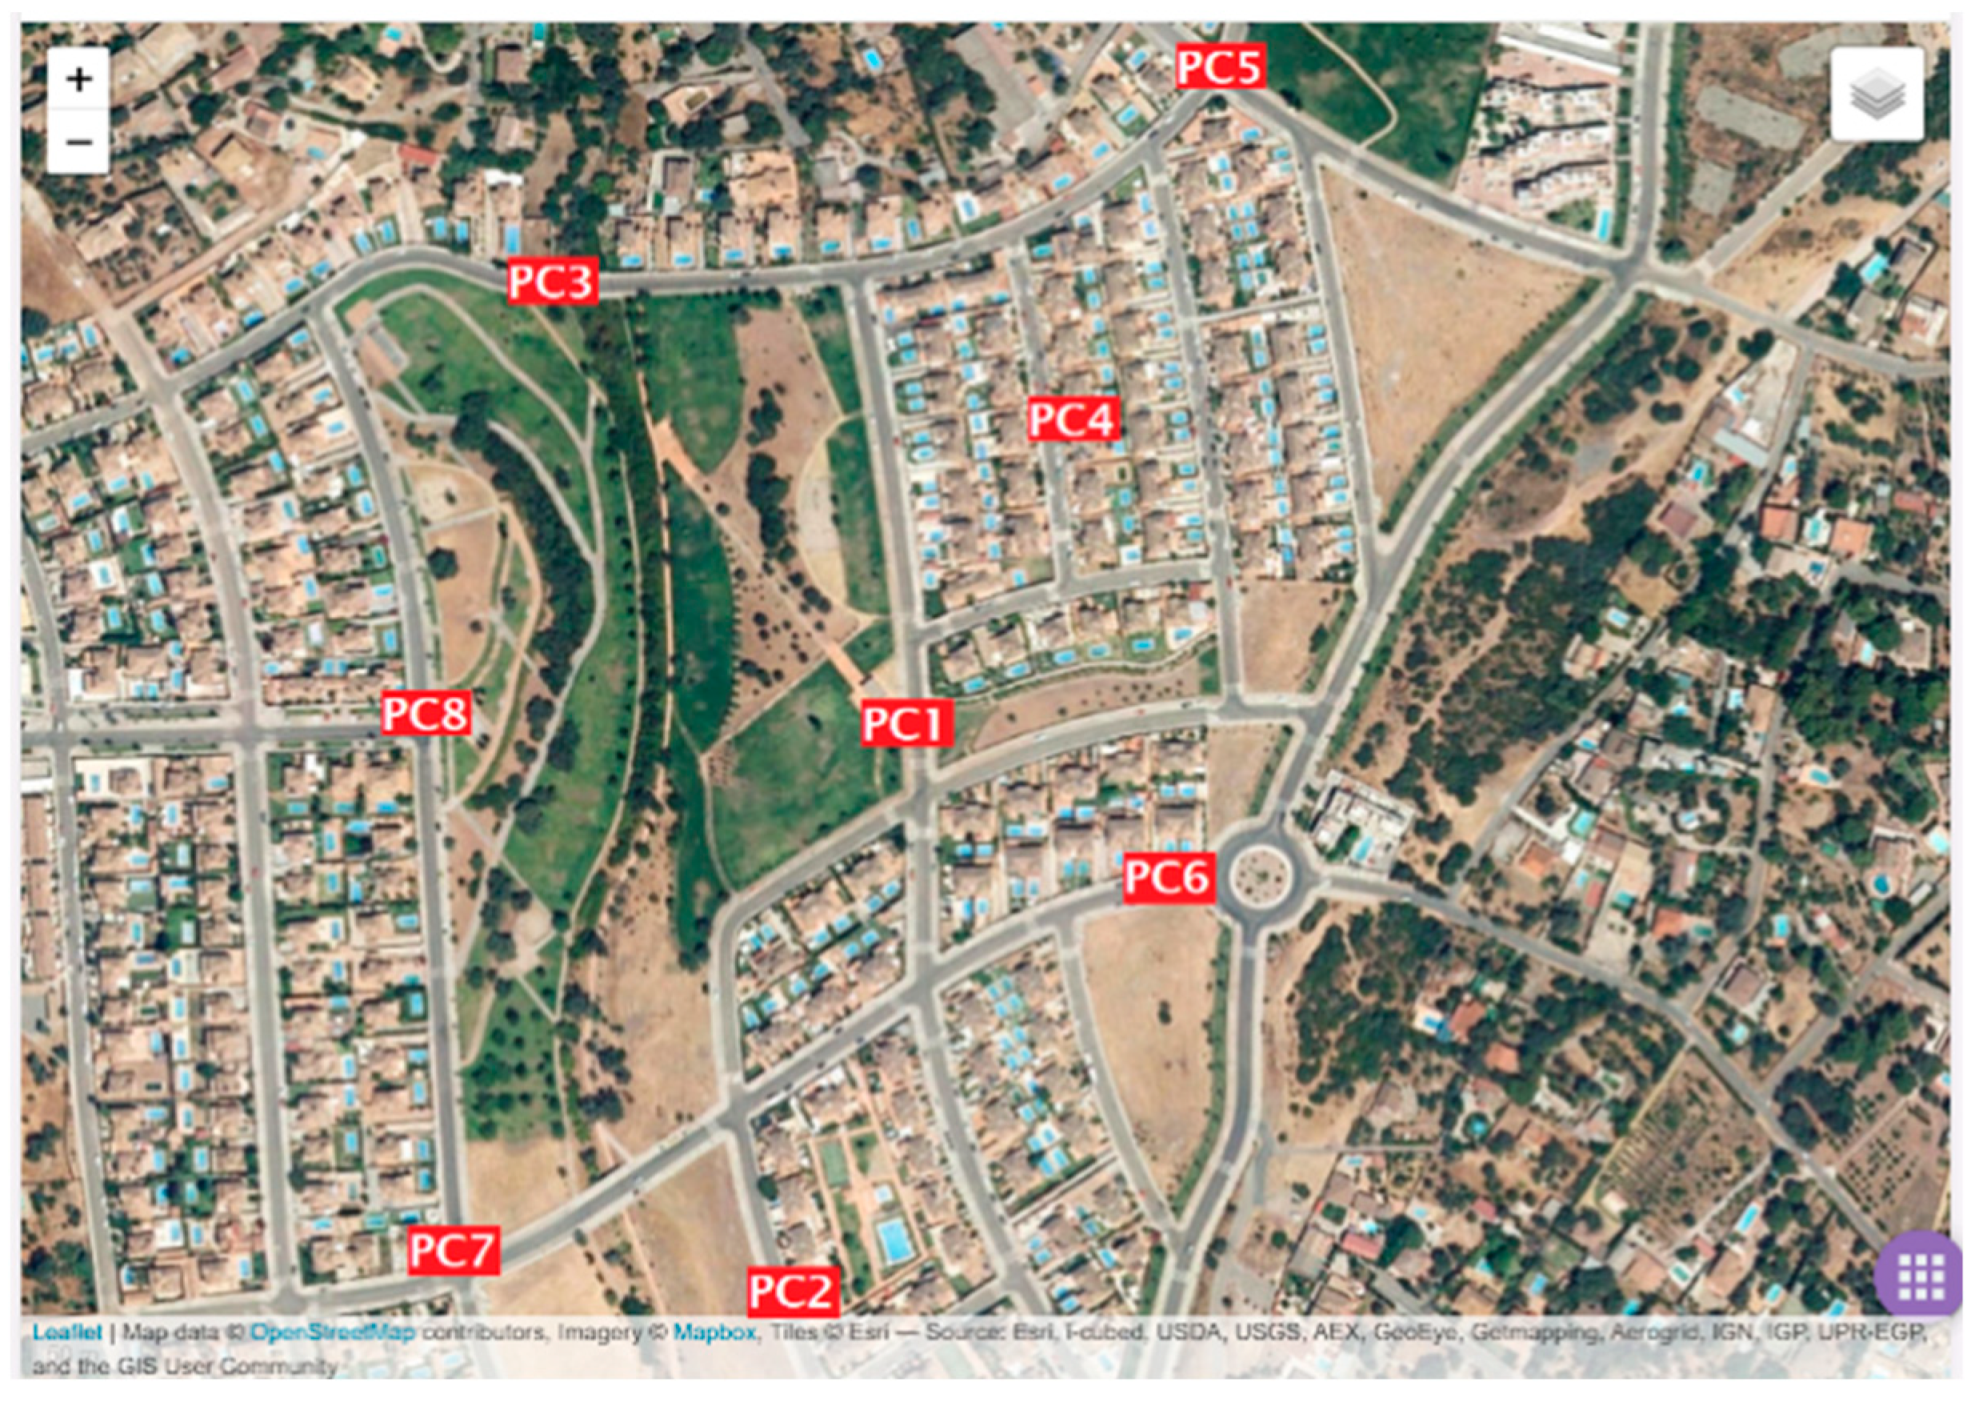
Figure 2.
Architecture of the implemented IoT system for monitoring environmental parameters.
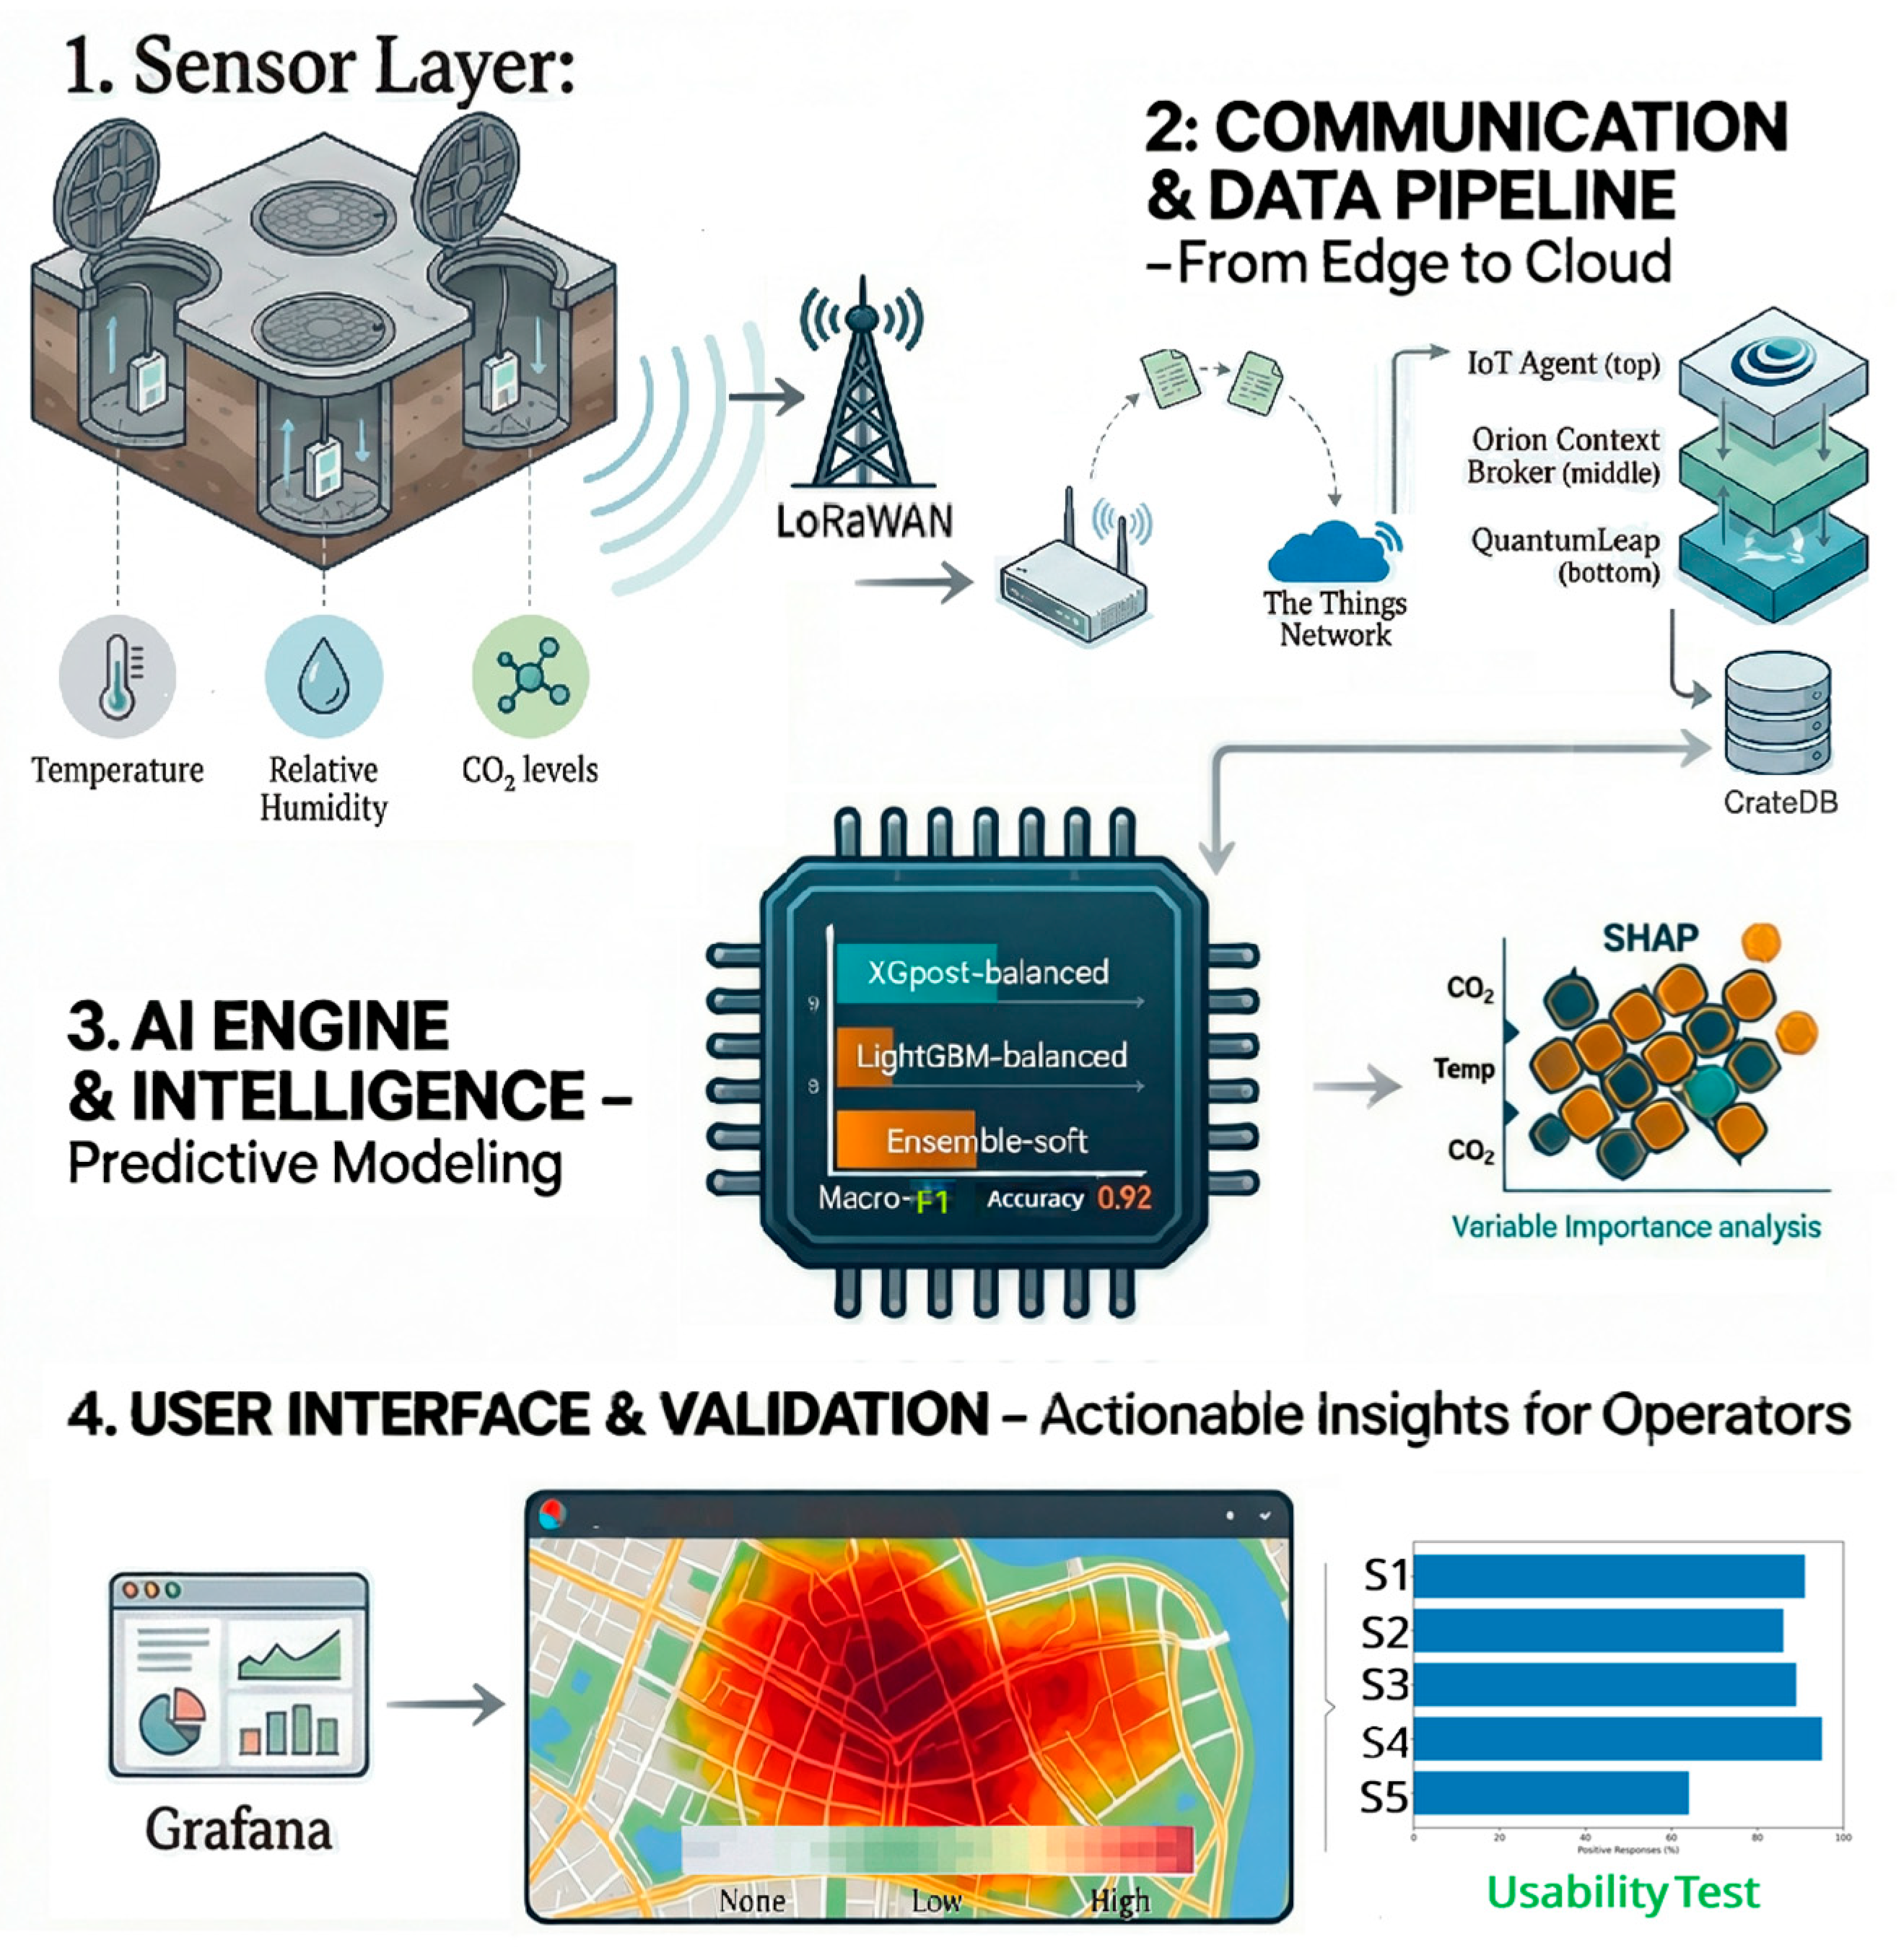
Figure 3.
Performance comparison of top data mining models for predicting high activity levels of Periplaneta americana. (a) Precision-Recall curves for the top five models, aggregated using out-of-fold (OOF) predictions. (b) Scatter plot comparing the Macro-F1 Score against the ranking position for all evaluated models within the AutoML framework.
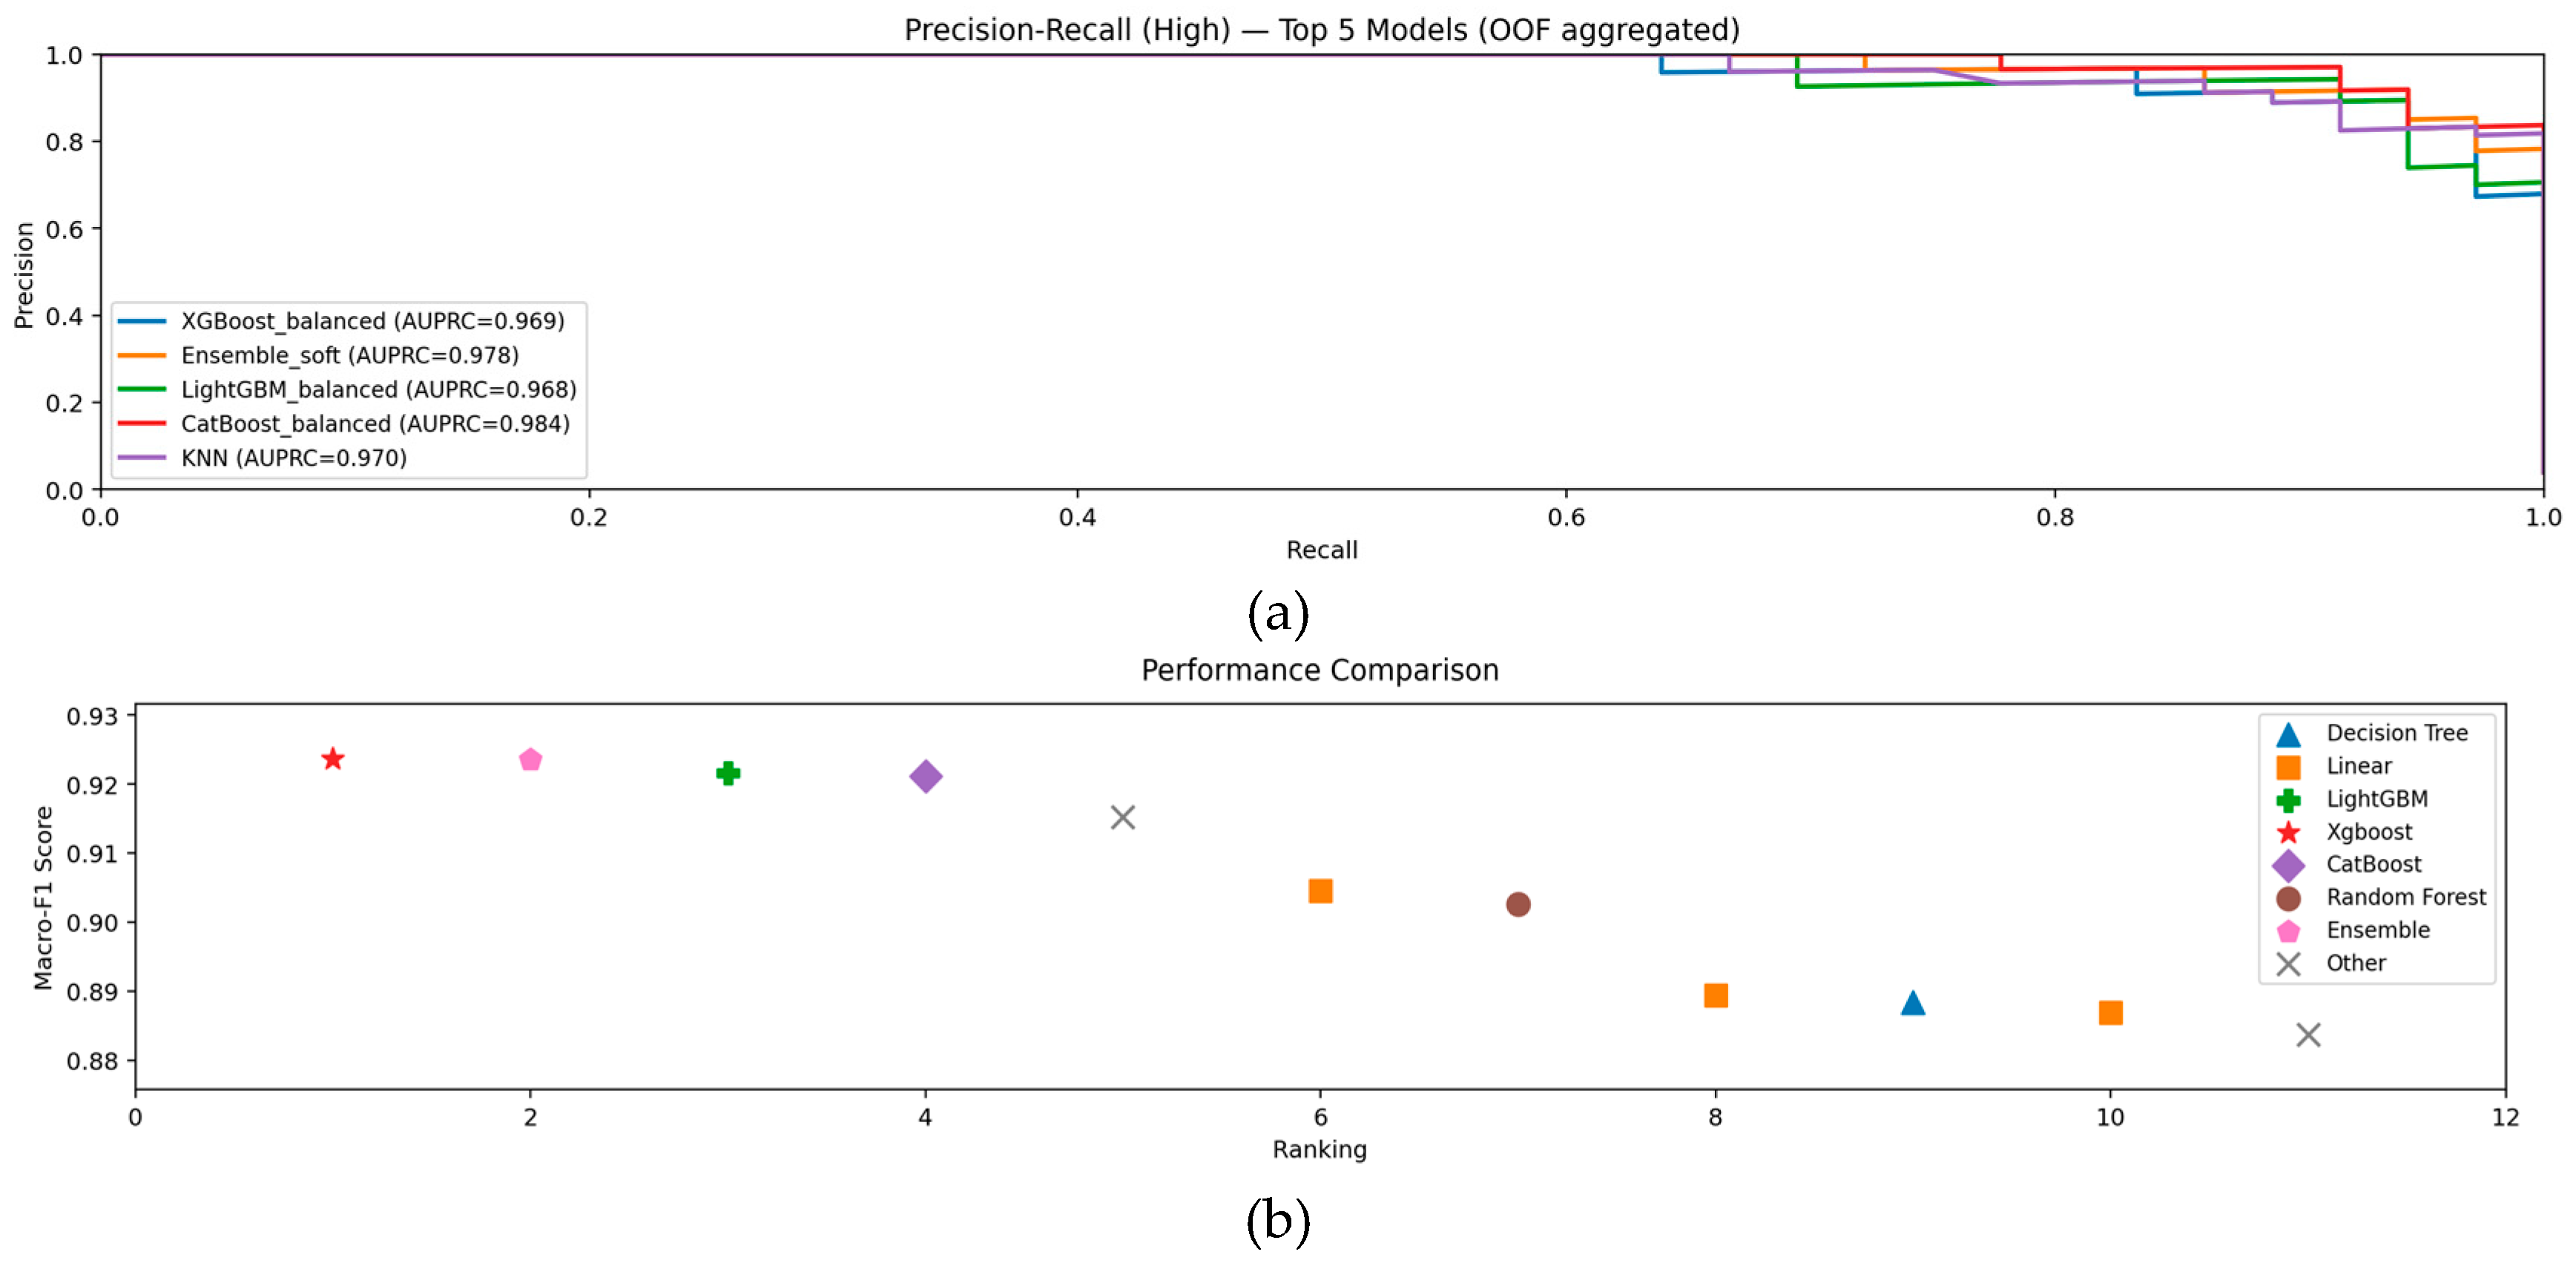
Figure 4.
Post-hoc comparison of models using Nemenyi diagrams for different performance metrics (α = 0.05). Models with horizontal lines that overlap within the critical distance (CD = 4.2836) do not show statistically significant differences. (a) Accuracy. (b) Balanced Accuracy. (c) Macro-F1 Score. (d) Weighted-F1 Score.
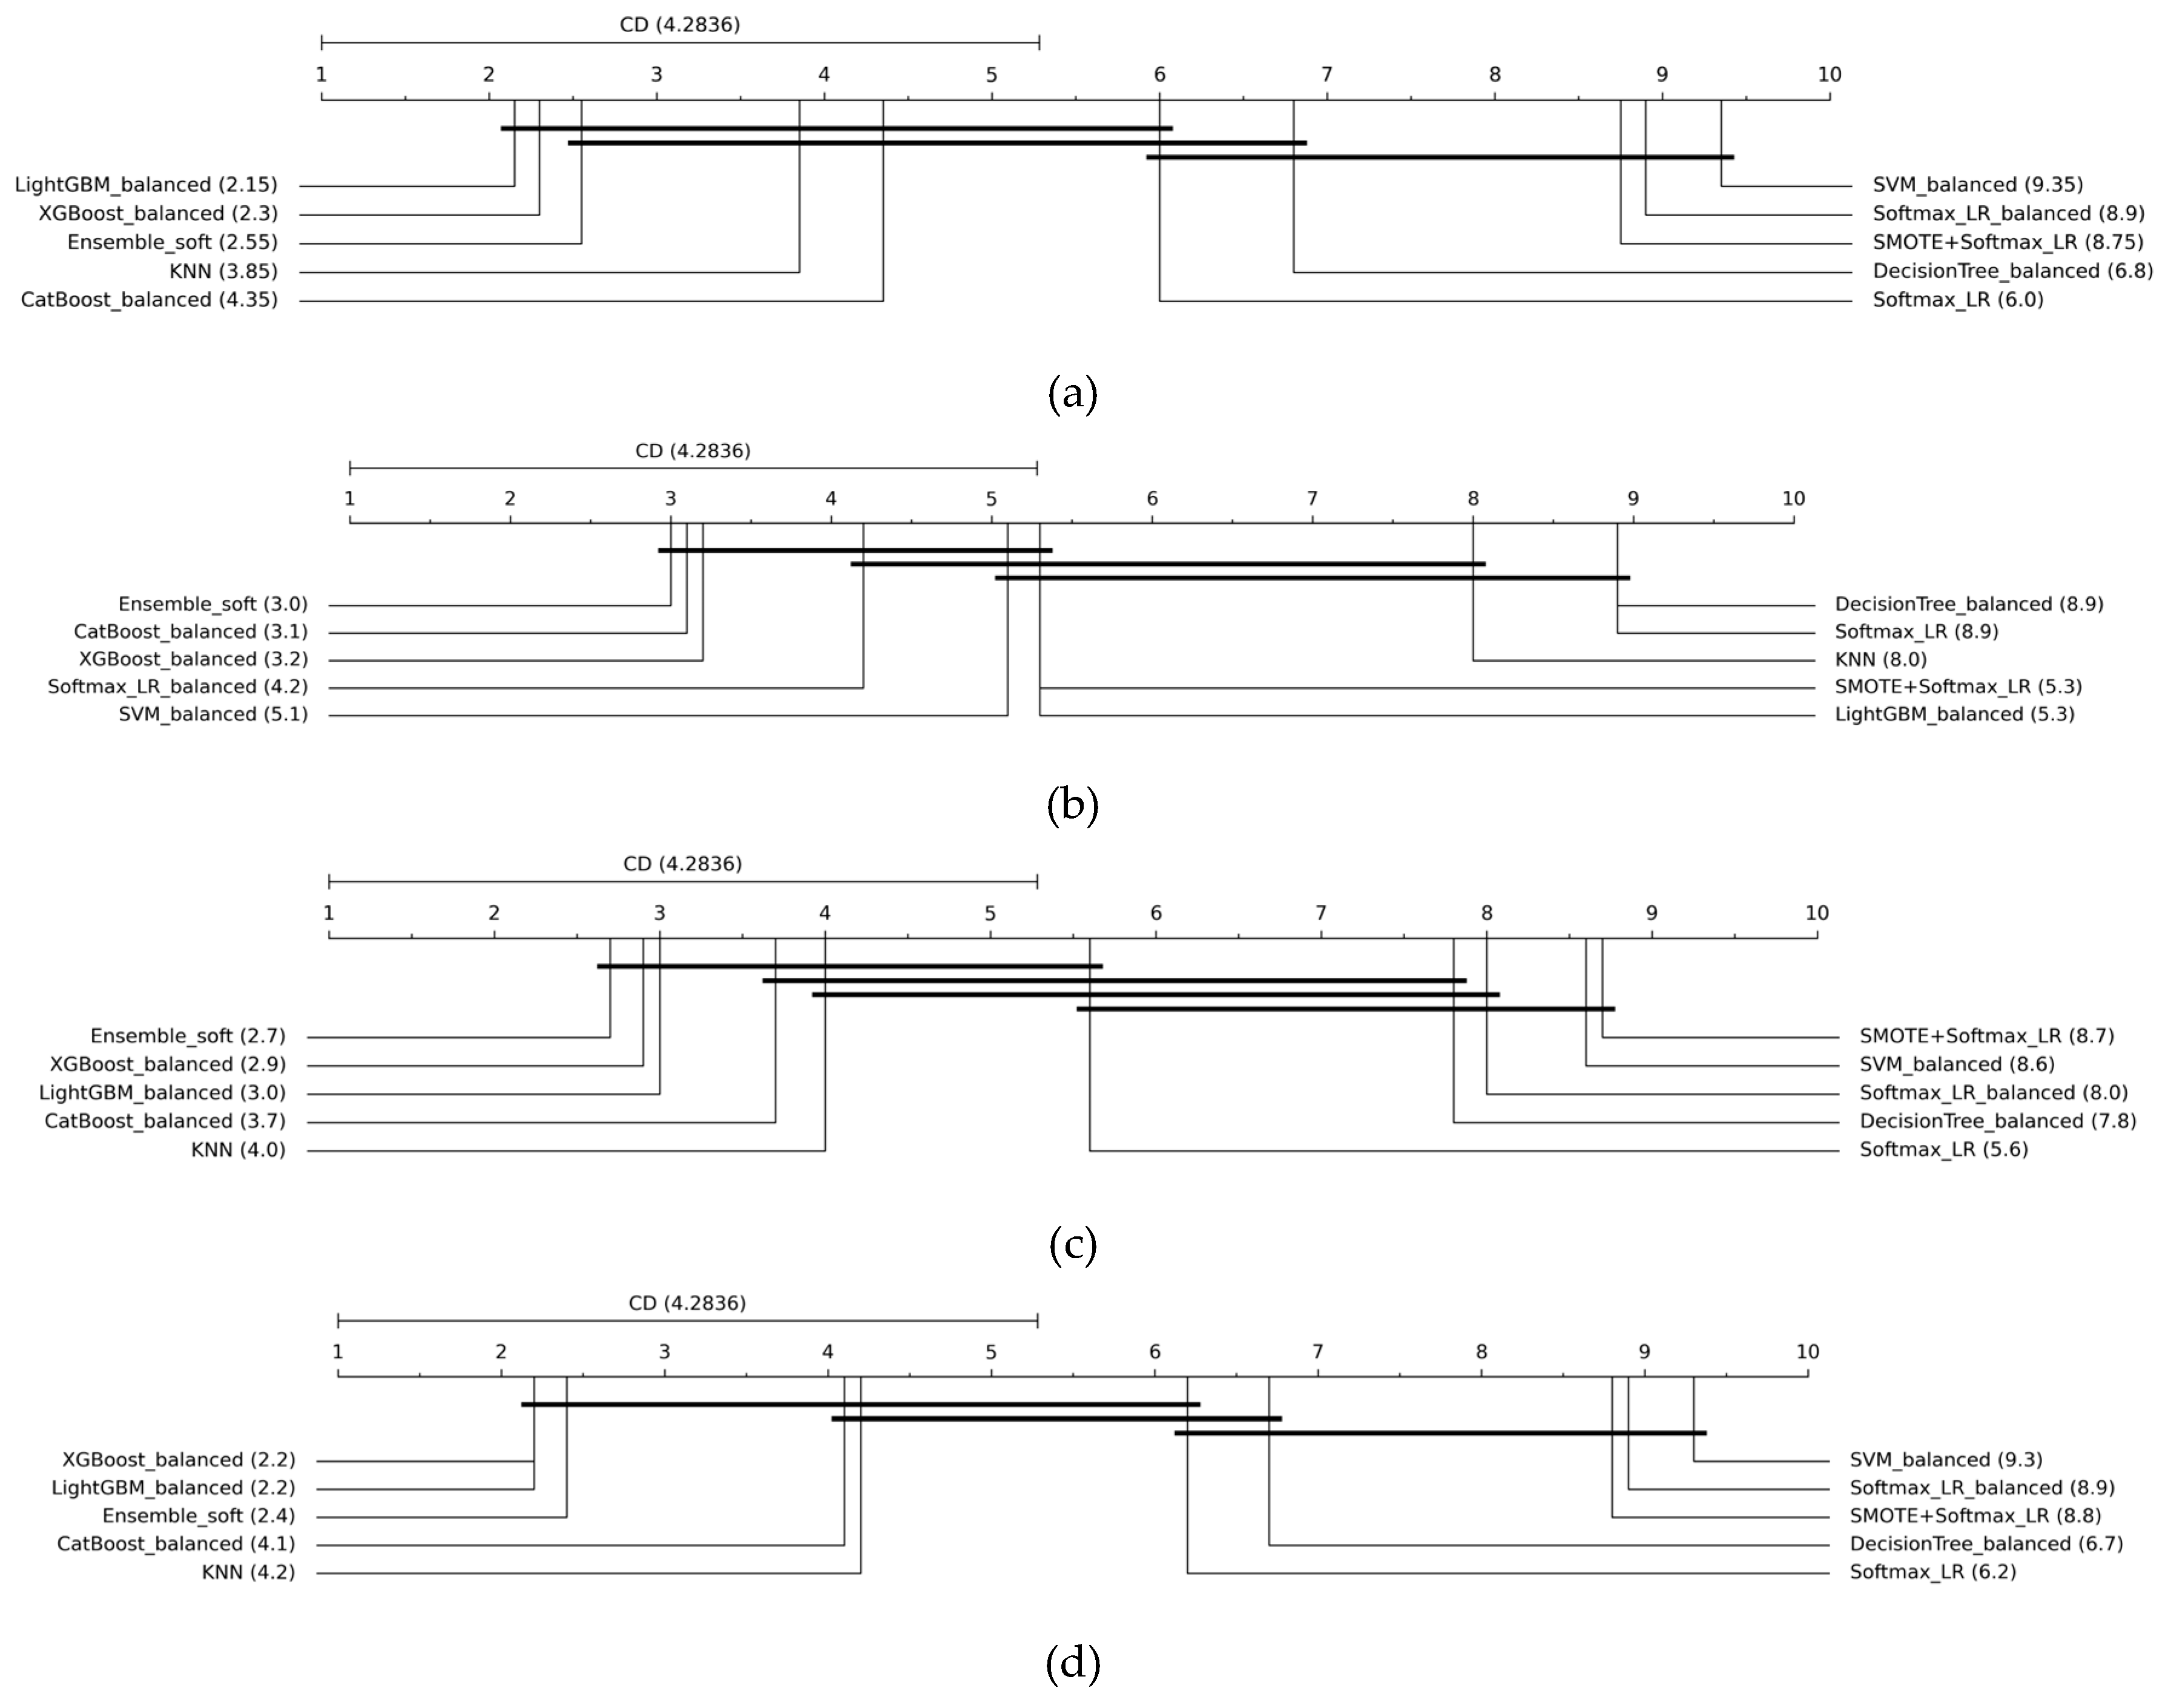
Figure 5.
Spearman’s rank correlation matrix for environmental variables in sewer manholes.
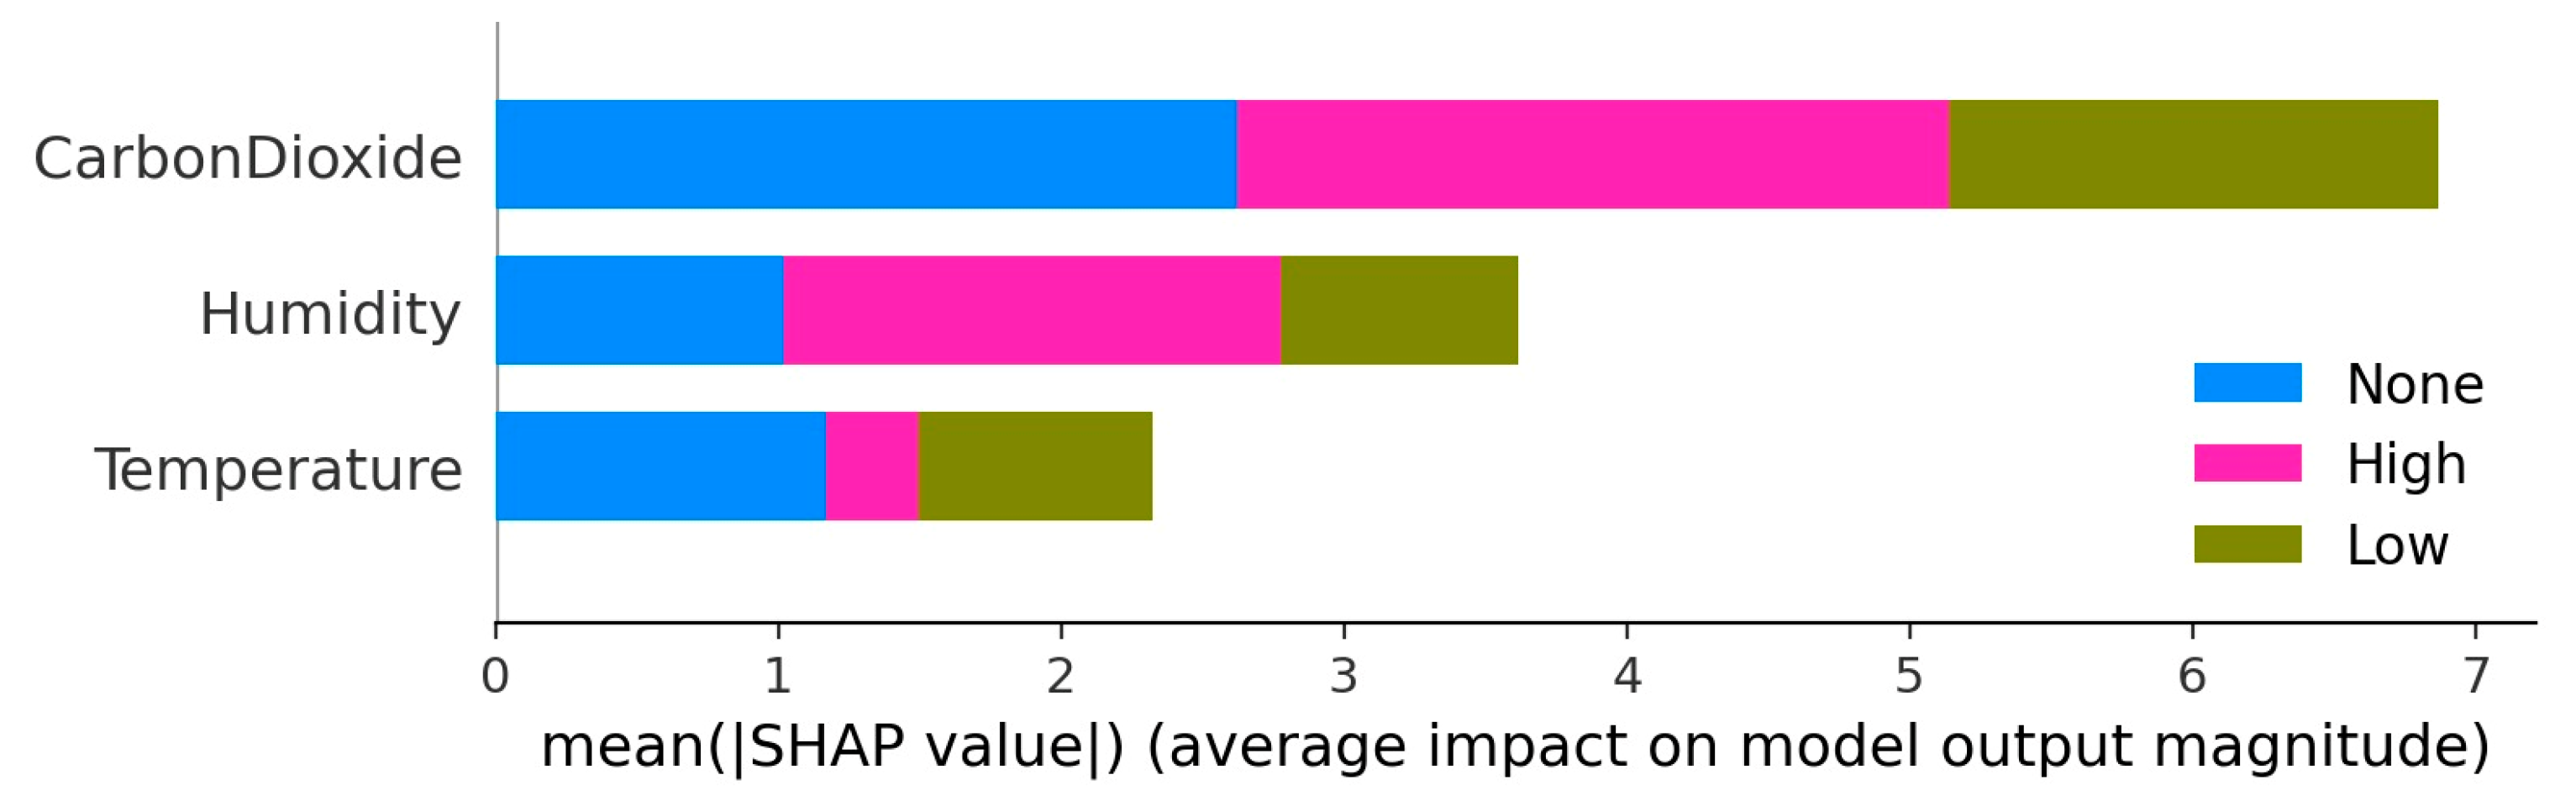
Figure 6.
SHAP analysis of variable importance by activity class. The horizontal axis represents the SHAP value, indicating the magnitude and direction of the variable’s impact on the model output (a positive value increases the probability of the class, a negative value decreases it). The color of the points reflects the actual value of the variable: red for high values and blue for low values. (a) For the “None” class (absence of pests), low CO₂ values have a strongly positive impact. (b) For the “Low” class (limited activity), medium CO₂ values and high humidity favor the prediction. (c) For the “High” class (severe proliferation), high CO₂ values have a strongly positive impact, confirming its role as the dominant predictor.
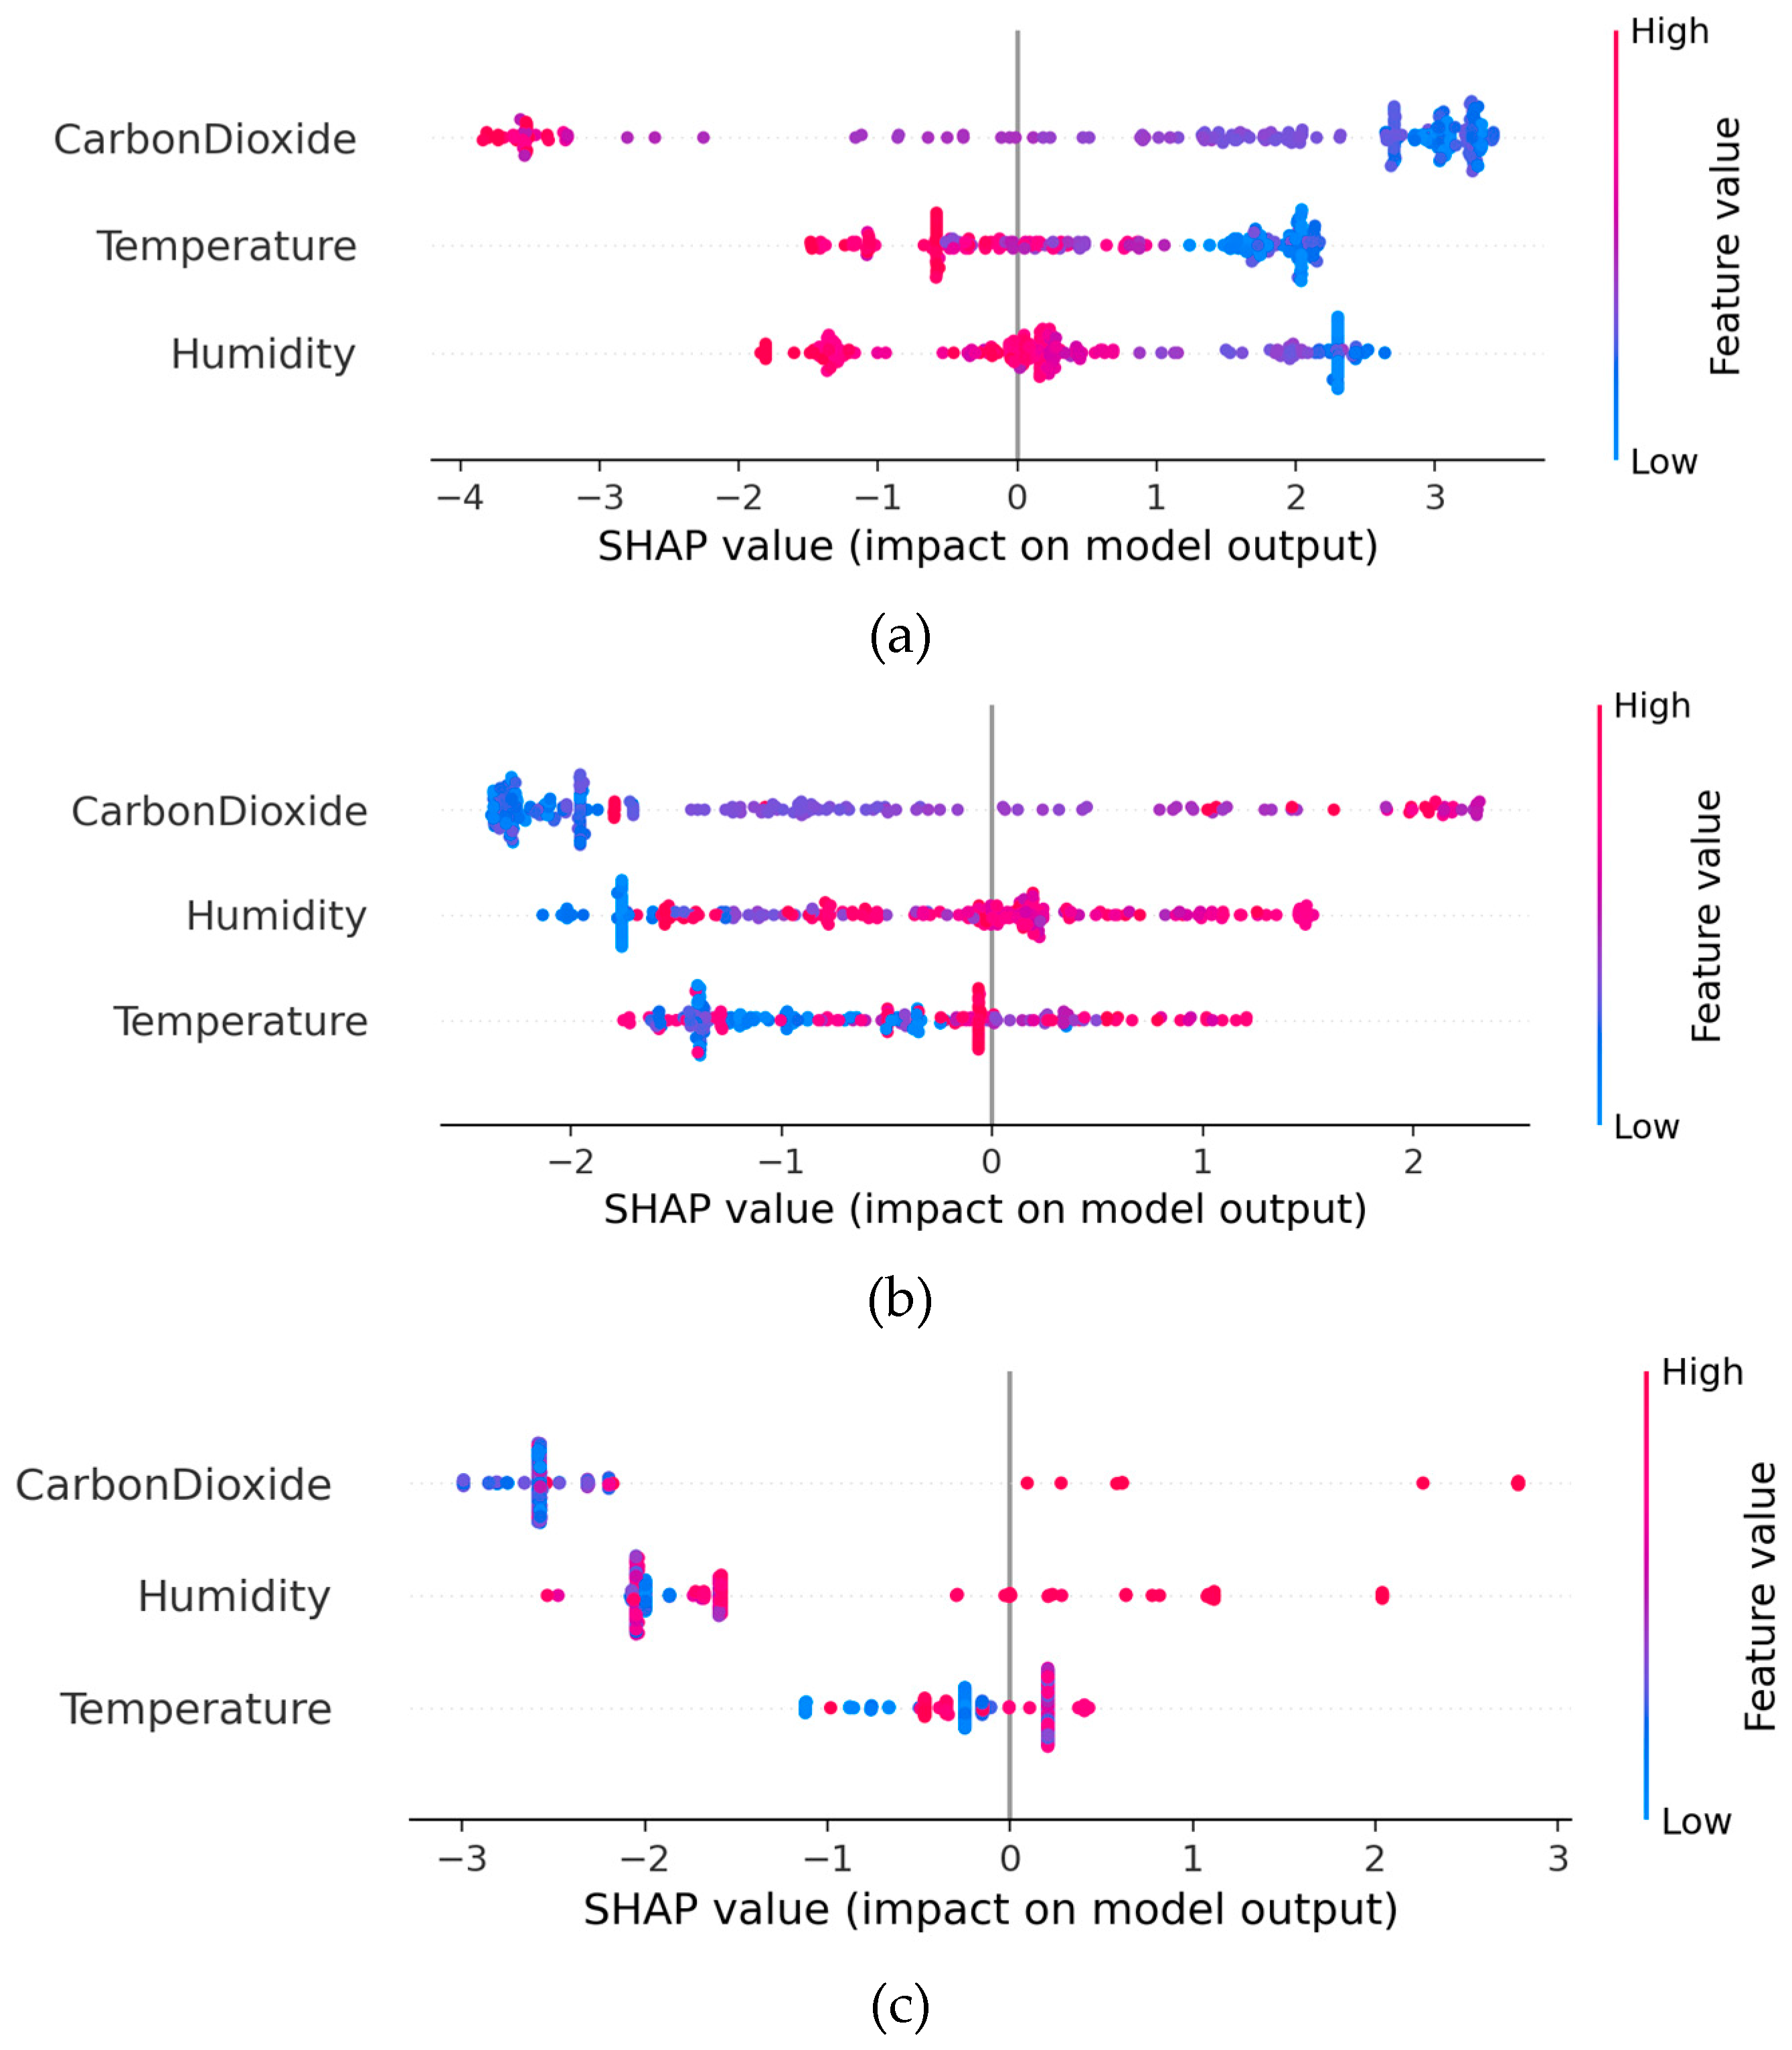
Figure 7.
Heat map of the distribution of American cockroaches generated from the environmental metrics obtained in the study: (a) First week of the study. (b) Last week of study.
Figure 7.
Heat map of the distribution of American cockroaches generated from the environmental metrics obtained in the study: (a) First week of the study. (b) Last week of study.
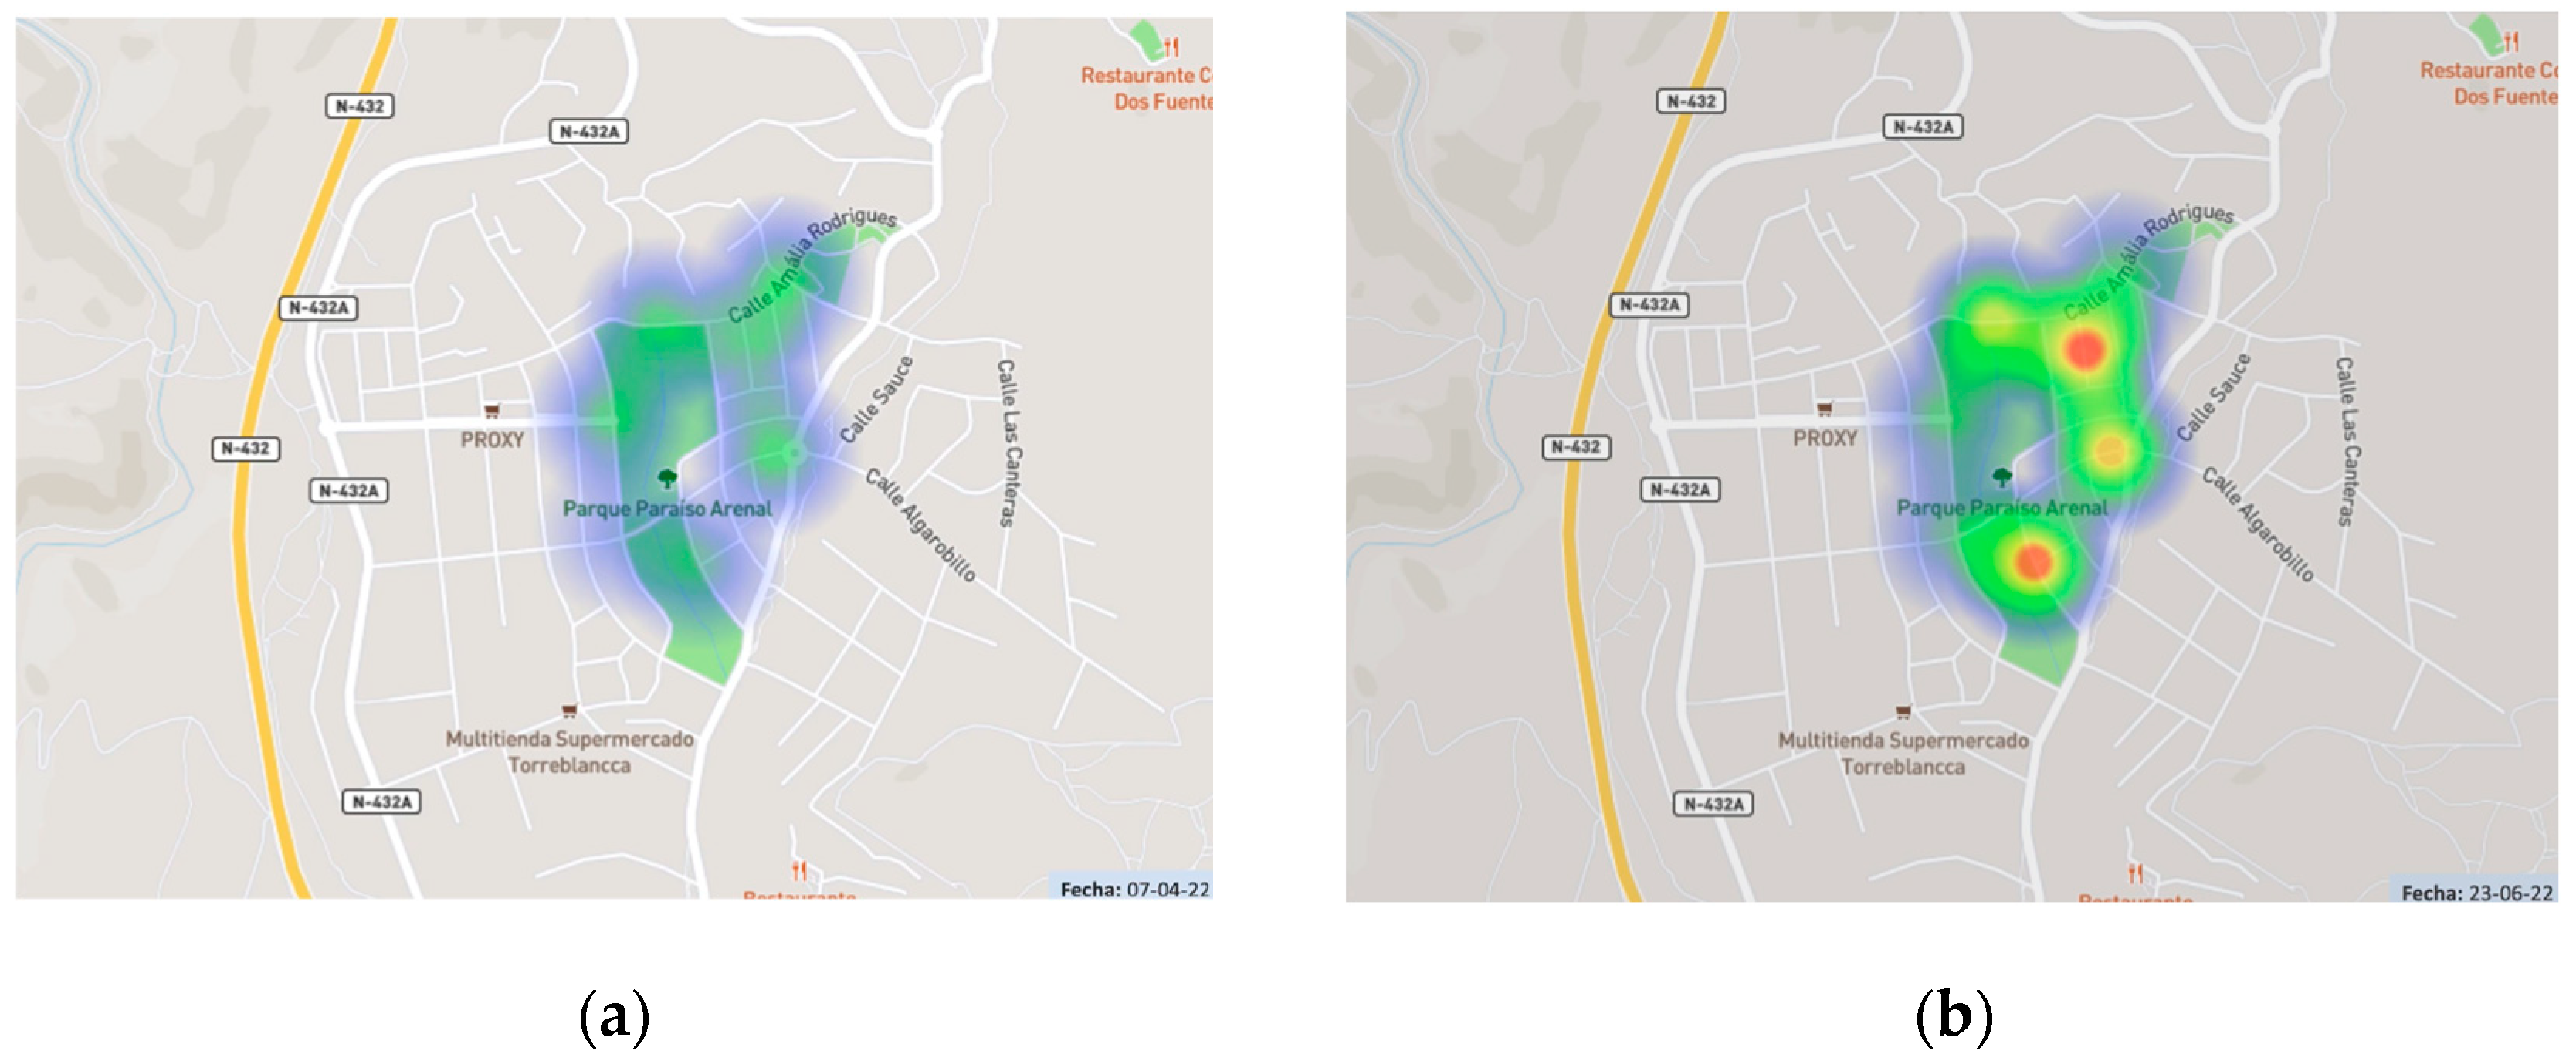
Figure 8.
Graphical representation of the environmental metrics captured during a seven-day period at the beginning of the study.
Figure 8.
Graphical representation of the environmental metrics captured during a seven-day period at the beginning of the study.
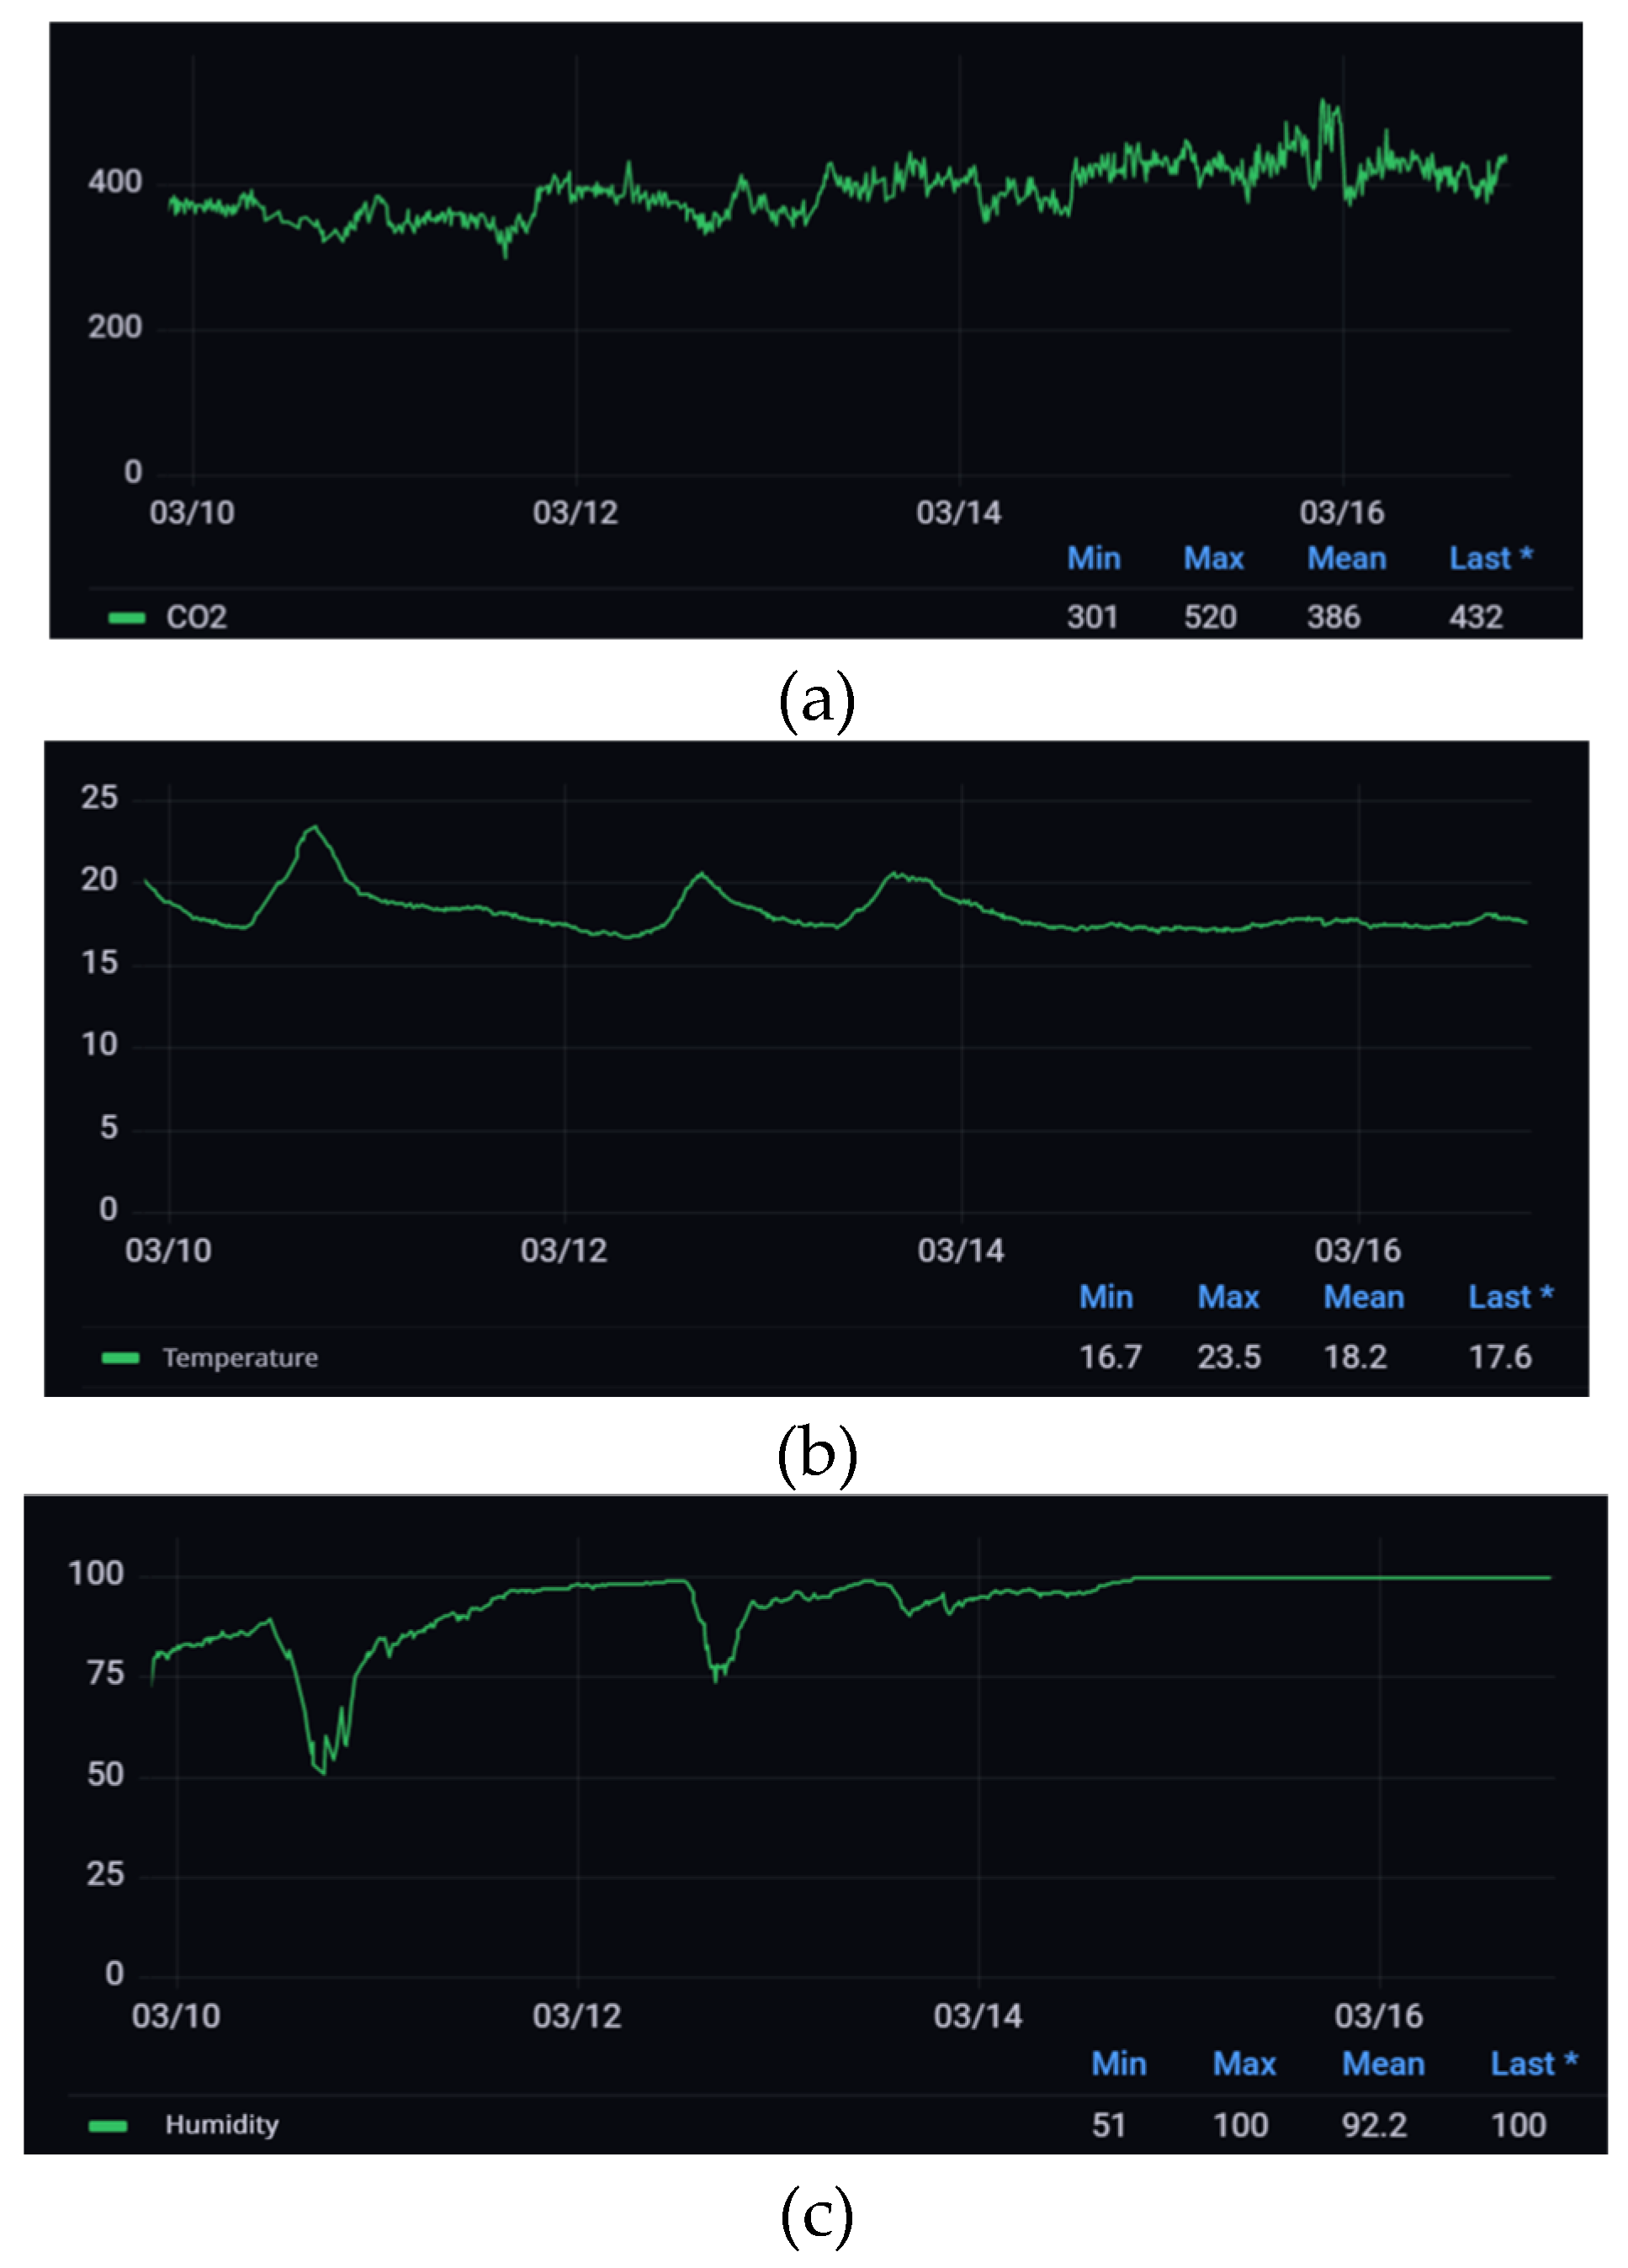
Figure 9.
Results of the usability test for the geospatial heat map interface, evaluated by 22 sanitation experts. The bar chart displays the percentage of positive responses (agreement) for five key statements.
Figure 9.
Results of the usability test for the geospatial heat map interface, evaluated by 22 sanitation experts. The bar chart displays the percentage of positive responses (agreement) for five key statements.
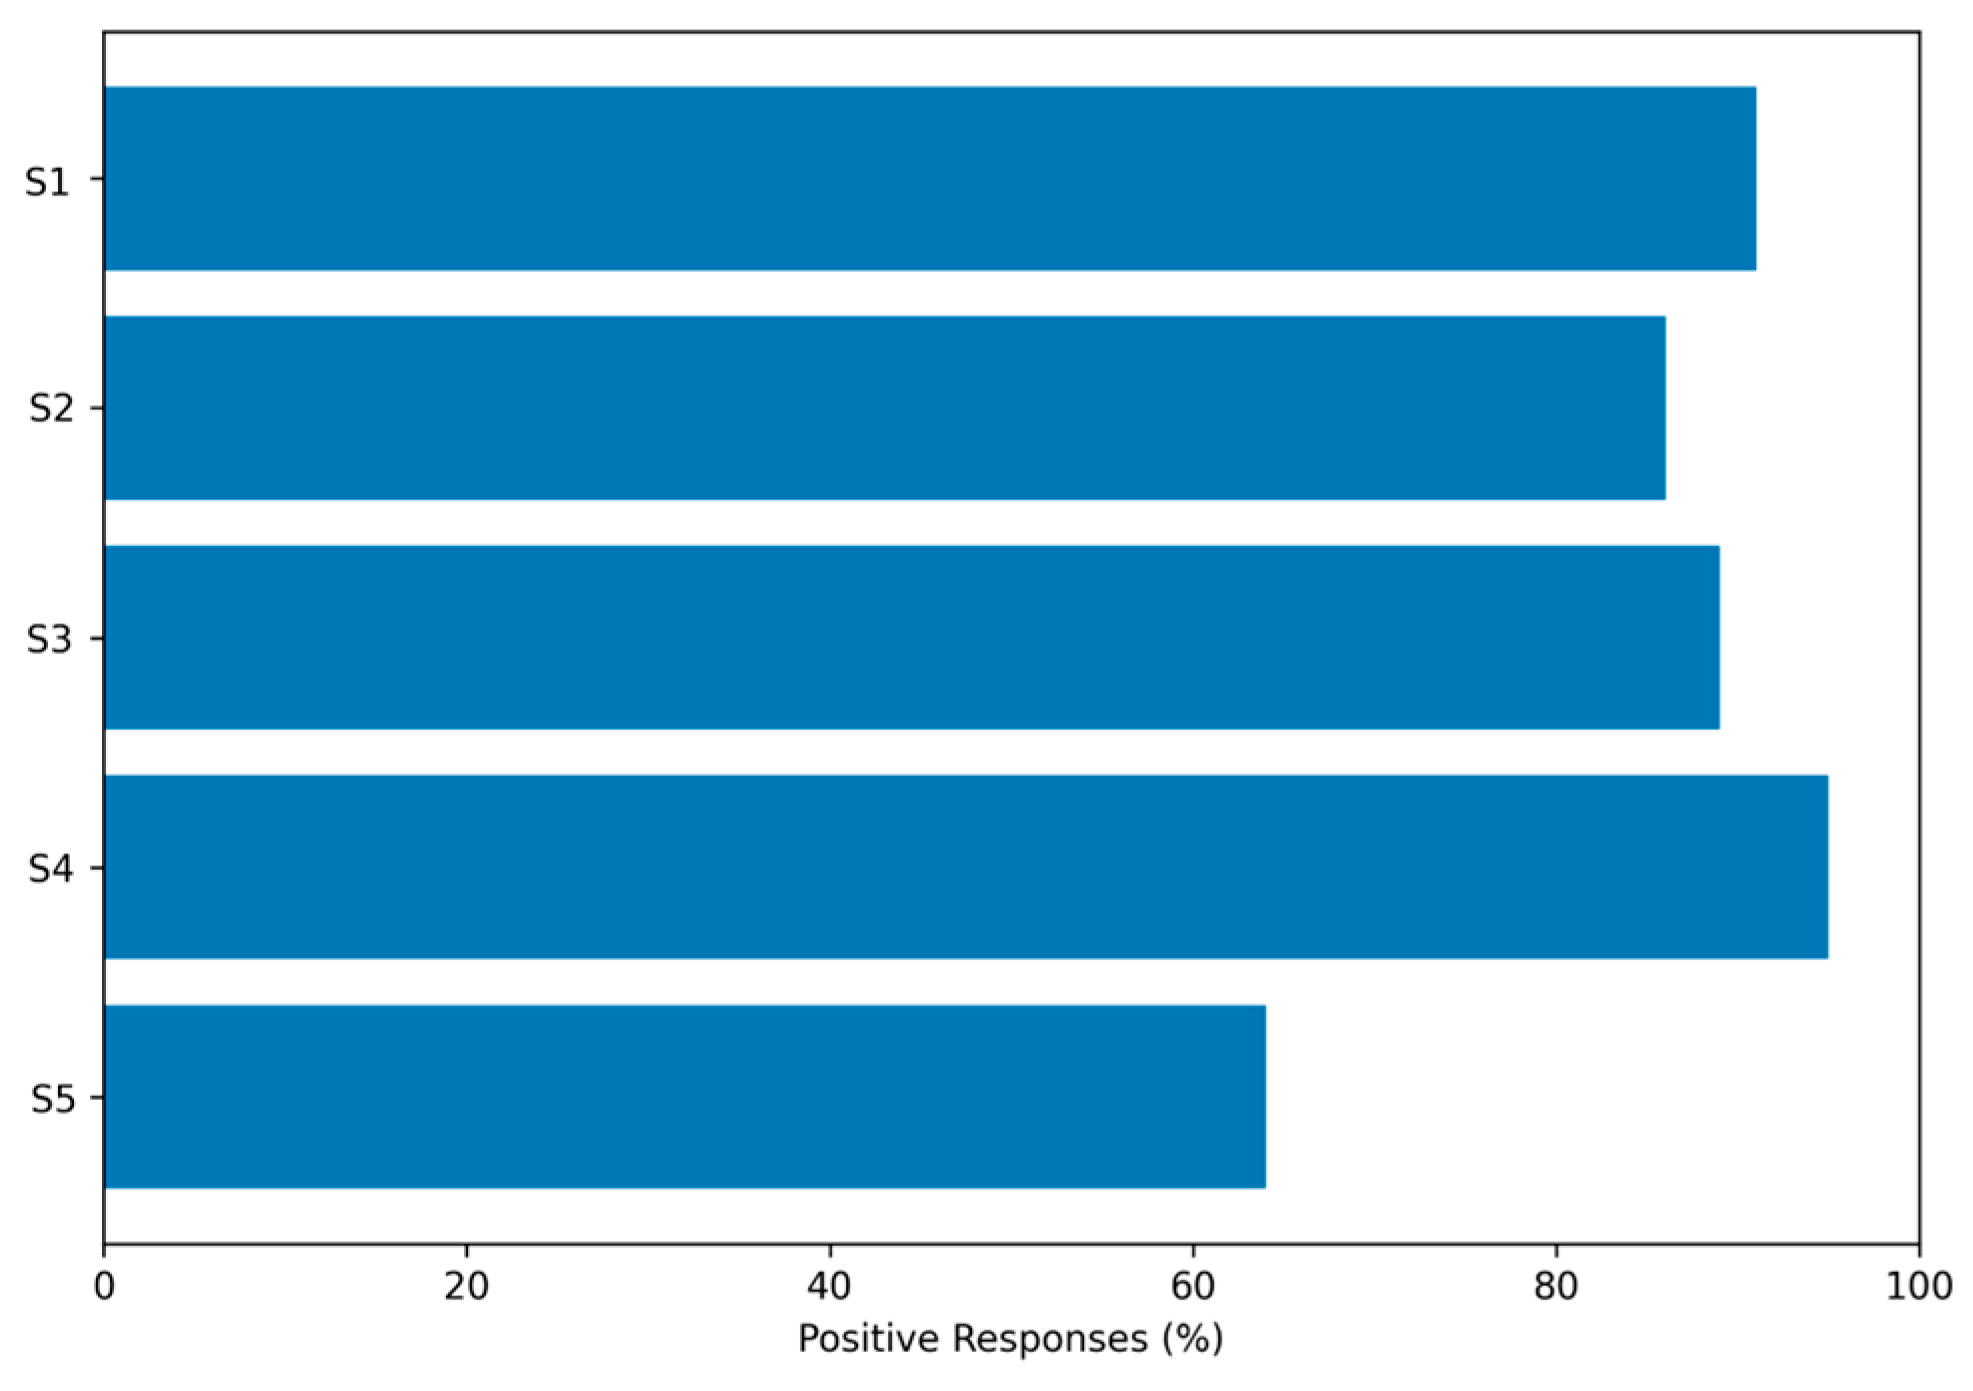

Table 1.
Descriptive Statistics for Environmental Variables and Activity Levels in Sewer Manholes.
| Statistics | Temperature (°C) | Humidity (%) | CO2 (ppm) | Activity Level |
| Min. | 15.67 | 42.51 | 196.6 | None: 699 (77.2%) |
| 1st Qu. | 19.54 | 75.80 | 775.3 | Low: 169 (18.7%) |
| Median | 22.57 | 85.66 | 857.9 | High: 36 (4.0%) |
| Mean | 23.83 | 82.85 | 898.1 | |
| 3rd Qu. | 28.63 | 91.95 | 942.5 | |
| Max. | 34.00 | 99.90 | 1653.0 |
Table 2.
Performance of the evaluated data mining models, ordered by Macro-F1 Score.
| Model | Macro-F1 | Balanced Acc. | Prec. (HIGH) | Rec. (HIGH) | F1 (HIGH) | AUPRC (HIGH) | Weighted-F1 |
| XGBoost_balanced | 0.924 | 0.927 | 0.915 | 0.917 | 0.902 | 0.973 | 0.959 |
| Ensemble_soft | 0.924 | 0.927 | 0.903 | 0.933 | 0.906 | 0.984 | 0.958 |
| LightGBM_balanced | 0.922 | 0.918 | 0.922 | 0.900 | 0.897 | 0.975 | 0.959 |
| CatBoost_balanced | 0.921 | 0.927 | 0.910 | 0.929 | 0.908 | 0.987 | 0.955 |
| KNN | 0.915 | 0.902 | 0.918 | 0.894 | 0.894 | 0.971 | 0.955 |
| Softmax_LR | 0.904 | 0.889 | 0.924 | 0.912 | 0.907 | 0.982 | 0.943 |
| BalancedRF | 0.903 | 0.933 | 0.861 | 0.966 | 0.901 | 0.969 | 0.939 |
| Softmax_LR_balanced | 0.889 | 0.927 | 0.853 | 0.973 | 0.901 | 0.982 | 0.927 |
| DecisionTree_balanced | 0.888 | 0.887 | 0.893 | 0.843 | 0.852 | 0.770 | 0.941 |
| SMOTE+Softmax_LR | 0.887 | 0.917 | 0.866 | 0.938 | 0.892 | 0.982 | 0.927 |
| SVM_balanced | 0.884 | 0.917 | 0.857 | 0.946 | 0.891 | 0.982 | 0.924 |
Table 3.
Results of the usability evaluation of visualization methods (n = 22 experts).
| Statement ID | Evaluated Statement | Positive Responses (%)1 |
| S1 | The heat map allows faster identification of critical intervention zones than traditional charts. | 91% |
| S2 | The heat map is more intuitive than traditional charts for understanding infestation risk. | 86% |
| S3 | The heat map is better suited for daily operational use in sanitation control centers than traditional charts. | 89% |
| S4 | The heat map is suitable for daily operational use in sanitation control centers. | 95% |
| S5 | The heat map provides more precise information than traditional charts for detailed quantitative analysis. | 64% |
1 “Agree” and “Strongly Agree” responses on the 5-point Likert scale were grouped as “Positive Responses.”.
Disclaimer/Publisher’s Note: The statements, opinions and data contained in all publications are solely those of the individual author(s) and contributor(s) and not of MDPI and/or the editor(s). MDPI and/or the editor(s) disclaim responsibility for any injury to people or property resulting from any ideas, methods, instructions or products referred to in the content. |
© 2026 by the authors. Licensee MDPI, Basel, Switzerland. This article is an open access article distributed under the terms and conditions of the Creative Commons Attribution (CC BY) license.
Copyright: This open access article is published under a Creative Commons CC BY 4.0 license, which permit the free download, distribution, and reuse, provided that the author and preprint are cited in any reuse.


