
Submitted:
12 January 2026
Posted:
13 January 2026
You are already at the latest version
Abstract
Assessments of extreme psychological constructs often face a persistent challenge: the ceiling effect, in which a significant proportion of respondents select the highest score on a scale, thus obscuring an important part of the population's variation. This effect may have profound consequences in studies of extreme psychological constructs. To address this limitation, we introduce a novel framework that integrates Multistage Testing (MST) with open-ended questions that are automatically analyzed by large language models (LLMs). This hybrid approach adapts the survey questions to the respondent while leveraging LLMs to efficiently and reliably interpret free-text answers in large-scale online surveys.
Using a case study on aversion toward cockroaches, we show how our method can effectively eliminate extreme ceiling effects, revealing hidden data distributions that are often obscured by extreme responses to conventional Likert-type survey questions. In addition, validation against expert human annotations of survey responses demonstrates the consistency and reliability of the LLMs' performance as evaluators of free-text answers.
This framework offers a generalizable methodology that enables more precise and sensitive quantitative measurement of extreme psychological constructs, allowing researchers to study topics that until now were inaccessible due to significant, inherent ceiling effects.
Keywords:
large language models
; multistage testing
; psychological assessment
; extreme psychological constructs
; ceiling effect
; survey analysis
; automated scoring
1. Introduction
Psychological measurements (the quantification of cognitive, emotional, and behavioral constructs) are fundamental in multiple research domains. In healthcare, psychological assessments guide diagnosis and treatment, directly impacting patient outcomes [1]. In education, assessments of both student-learning and teacher-instructional experiences play a vital role in the formative improvement and summative evaluation of teaching and learning [2]. In human-computer interaction, understanding users’ psychological states is key to user-centered design, as integrating psychological principles into system design boosts engagement, motivation, and overall user experience [3].
Studies employing self-report psychological measurements often incorporate open-ended questions, which allow individuals to express their perspectives in their own words rather than constraining their responses to predefined categories. This approach gives researchers access to rich and complex insights into participants’ perceptions and emotional experiences, facilitating the discovery of underlying processes, motivations, and context-specific phenomena that may not emerge from closed-ended items. However, these advantages come with notable trade-offs. In particular, interpreting and coding open-ended responses is labor-intensive, often resulting in smaller sample sizes and limited statistical generalizability [4,5,6,7]. In addition, the manual nature of this work can introduce subjectivity into the interpretation and classification of responses and may be susceptible to researcher bias (e.g., “confirmation bias”, where the interpretation of answers is subconsciously biased to confirm the researcher’s pre-existing beliefs or values), potentially compromising the reliability and validity of findings [8]. Furthermore, the absence of standardized response formats complicates cross-participant comparisons and poses challenges for integrating open-ended data with quantitative measures, often necessitating sophisticated mixed-methods approaches to improve the reliability of conclusions [5,9].
In contrast, the use of closed-ended items to measure psychological constructs enables researchers to collect data more efficiently, accommodate larger sample sizes, and obtain more standardized and precise measurements. This structured approach enhances the feasibility of statistical analyses and strengthens the ability to establish robust empirical relationships [5,10,11]. Although closed-ended items lack the depth and richness of open-ended formats, they are particularly suitable for large-scale internet surveys—a convenient and cost-effective means of data collection in the social sciences. Nonetheless, such items may introduce significant biases which, unless mitigated a priori or addressed post hoc, can compromise their suitability for capturing certain types of knowledge.
One such bias is known as the “ceiling effect” (or the opposite “floor effect”), which occasionally occurs in surveys that use Likert scales, when more than 15% of respondents choose the highest (or lowest, in the case of a floor effect) possible score, resulting in reduced variability and limiting the ability to detect differences between individuals [12,13]. This clustering at the upper end of the measurement scale can mask true relationships between variables, thus compromising the accuracy and interpretability of statistical analyses [14,15]. If no existing methodology can adequately address the ceiling effect in a central parameter, research on topics prone to this issue may stall, rendering even seemingly straightforward research questions intractable. A good example for this is the case of entomophobia (the fear of insects) [16,17].
In a recent study on entomophobia, Gish et al. [18] hypothesized that a higher level of entomophobia leads to greater use of insecticides in homes. Despite the seemingly trivial nature of the research question and the large scale of the study, the authors appeared to have hit a measurement wall: self-ratings of entomophobia toward common household arthropods clustered at the top end of a 7-point scale, forming a clear ceiling effect with 47%–50% of respondents choosing the highest score on the scale (Figure 1a). Even though entomophobia was prevalent and intense in the sampled population, and household insecticides were used frequently, no meaningful correlation between these two variables was detected. Rather than accepting this null result at face value, the authors suggested that the ceiling effect they observed has led to a Type II error (failure to reject a false null hypothesis). Consequentially, since there was no other self-report method that can reliably and directly measure levels of phobia toward highly aversive creatures such as spiders and cockroaches, research on entomophobia’s causes and consequences could not be advanced.
One promising solution for the ceiling effect in studies of common and extreme phobias is the computerized adaptive testing (CAT), an algorithm-based method of administering exams that adapts to the performance of the test-taker during the test itself [19,20]. One form of CAT, which takes a related but different approach, is the computerized Multistage Testing (MST): instead of selecting individual items according to item response theory (IRT), the algorithm routes respondents through fixed sets of items (modules), each calibrated to a different level of ability [21]. In recent years, MSTs have been adopted in large-scale assessments, demonstrating comparable precision to classical CAT while offering greater content control and more predictable operation [22].
However, while improving measurement accuracy, an MST will not eliminate the tendency of highly phobic respondents to select the top category on the measurement scale. A practical solution could be to replace fixed-response items within the MST with open-ended questions describing hypothetical situations, thus allowing participants to describe what their thoughts and feelings would be in those situations in a free-text form. This approach would make it more difficult for respondents to reach the highest possible score, while also eliminating the reference group effect, as respondents are not asked to rate themselves on a measurement scale. The interpretation and coding of free-text responses could reveal important variations that would otherwise be hidden at the extreme end of the measurement scale. Therefore, integrating open questions into an MST could potentially mitigate data skewness caused by the ceiling effect, thus increasing the sensitivity of the test to nuances of extreme phobia.
At the same time, the high resource demands and other limitations and potential biases involved in turning free-text responses into quantitative data by human interpreters would make it difficult to employ a hybrid MST/open-ended design in decently replicated online surveys. In order to do this, an automated interpretation of the free-text responses will be required. We propose adopting a recently popular automatic methodology from the field of Natural Language Processing (NLP), for analyzing and classifying textual responses to open-ended questions, namely, LLM-as-a-judge [23,24].
Large language models (LLMs) have demonstrated remarkable abilities in interpreting, analyzing, and reasoning about textual data [25,26,27,28]. Specifically, LLM-as-a-judge is a paradigm in which LLMs are used to annotate data and evaluate models, replacing human annotators and judges [29]. One key advantage of the LLM-as-a-judge paradigm is the scalability, speed and cost-effectiveness of LLMs. In our case, LLMs have the ability to quickly classify numerous responses to open-ended questions, based on the researcher’s instructions outlined as a prompt submitted to the LLM. This action obviates the need to manually classify responses, a task that is time-consuming and could introduce inconsistencies and subjectivity biases, which often affect the reliability of large human-annotated datasets [30,31,32].
LLMs are increasingly being employed as reasoning engines, combining their encoded knowledge with expert knowledge added via prompt to support research in various domains [33,34]. By combining a knowledge-based LLM with a structured, open-ended MST, we establish an adaptive and automated psychological assessment framework capable of mitigating ceiling effects and capturing subtle variations in extreme psychological constructs within large population samples. Our proposed framework is illustrated in Figure 1b.
The contributions of this research are threefold. First, we develop an MST-based adaptive testing framework tailored specifically for open-ended responses that mitigate the ceiling effect. Unlike traditional MST-based survey systems, which rely on predetermined item banks of closed-form questions, our approach uses open-ended questions and LLM-based analysis of free-text responses, thus supporting large-scale surveys. Second, we validate LLMs as reliable evaluators of psychological constructs by benchmarking their performance against human judgments. Third, we demonstrate the applicability of the MST–LLM framework through a case study on cockroach aversion, demonstrating how this integration mitigates the ceiling effect, thus allowing better measurement precision and richer insights, compared to what conventional self-report methods offer when used for measuring extreme psychological constructs.
2. Related Work
In this work, we address two key challenges that could be ancountered when trying to measure extreme psychological constructs. The first is the ceiling effect, which arises when traditional scales fail to capture meaningful variation because many respondents select the highest option. The second challenge is derived from our proposed solution, of using open-ended questions to mitigate the ceiling effect and relates to the analysis of open-ended survey responses in large-scale studies, where manual annotation is impractical. To tackle the latter, we adopt the emerging LLM-as-a-judge framework, in which LLMs are used to automatically evaluate and interpret free-text responses.
2.1. The Ceiling Effect
The ceiling effect is occasionally found in surveys that use Likert scales, when more than 15% of respondents choose the highest possible score, rendering their scores undistinguishable from each other [13]. The ceiling effect could be a major concern, for example, in patient satisfaction surveys [15,35,36], or when researchers apply an existing measuring instrument to a new population that tends to have higher levels of the construct being measured compared with the population for which that instrument was originally developed [37]. If unaccounted for, a ceiling effect can significantly lower the measuring instrument’s validity (the degree to which an instrument truly measures what it purports to measure), its responsiveness (the ability to detect change) and its reliability (the degree to which the measurement is free from measurement error) [37]. When research data is subject to a ceiling effect, the resulting skewed distribution often violates the normality assumptions required for many statistical tests. As a consequence, non-parametric analysis methods, which generally have lower statistical power, must be employed [38] that often mean lower statistical power. To mitigate ceiling effects, researchers use both design-based and analytical strategies.
On the design side, improving the response scale may allow, in some cases, finer distinctions among high-end responses [39]. This could be done by using an unbalanced scale with more positive labels than negative ones (a positively-packed scale), or adding textual labels to all or most values on the scale [36,37,39,40,41]. Some researchers also report lower ceiling effects when replacing Likert-type items with visual analogue scales (a continuous measure that allows respondents to indicate any position on the scale which best represents their opinions) [42,43,44]. Another approach is to switch to a mixed-methods design, integrating fixed scales with open-ended questions that are manually interpreted and coded [45]. Alternatively, researchers may choose post-hoc analytical tools for dealing with ceiling effects after the data has been collected. Treating maximum scores as censored values permits the use of Tobit or other censored regression models to adjust for the restricted range and recover more accurate estimates [46,47].
However, these methods may fail in studies of mental health extremes or when research targets particularly sensitive, emotionally charged, or taboo subjects [48,49]. In these instances, altering the response scale is often insufficient to counteract the ceiling effect, since respondents tend to provide the highest possible ratings regardless of the number of points on the scale, what descriptors are used, or how positively skewed the options might be. In such cases, the “reference group effect”, in which respondents assess themselves relative to their perceived peers rather than an absolute standard [50], should also strongly influence the accuracy of the measurement tool. Furthermore, when intense emotions or affective attitudes give rise to significant ceiling effects, post-hoc analytical techniques cannot remedy the resulting skew, since the genuine variability across much of the population is never captured in the first place. Therefore, in some cases, ceiling effects can create significant barriers to knowledge acquisition that cannot be overcome with statistical methods or by improving the response scale.
2.2. Multistage Testing
MST is essentially a form of computerized adaptive testing (CAT), an algorithm-based method of administering exams that adapts to each test-taker’s performance [19]. CAT dynamically selects test items based on the respondent’s previous answers, with the goal of reducing test length while increasing measurement precision [51]. Unlike traditional linear tests, where all participants receive the same set of items, a CAT selects each subsequent question in response to the previous answer; correct answers are followed by more difficult questions that award a greater number of points, while incorrect answers lead to easier questions that yield fewer points [52]. MST, however, takes a related but different approach: instead of selecting individual items according to item response theory (IRT), the algorithm routes respondents through fixed sets of items (modules), each calibrated to a different level of ability [21]. In recent years, MSTs have been adopted in large-scale assessments, demonstrating comparable precision to CAT while offering greater content control and more predictable operation [22].
While conventional MSTs are typically used to assess cognitive skills or abilities, our approach adapts the MST framework for measuring psychological constructs. In this adaptation, respondents are routed by an initial routing question to a module appropriate to their indicated level on the construct of interest. Rather than right-or-wrong questions, these modules employ open-ended questions. A direct consequence of implementing this hybrid MST/open-ended design in large-scale surveys is the generation of substantial volumes of free-text data that requires systematic interpretation and scoring. For instance, in Gish et al. [18], if each respondent would have provided six free-text answers (as in our proposed design), the resulting dataset would have comprised approximately 15,000 responses, rendering manual coding impractical. Thus, the feasibility of this methodology is contingent upon automated scoring of responses, making an LLM that serves as an automated evaluator an integral component of the proposed framework.
2.3. LLM-as-A-Judge
The rise of LLMs has also brought the advent of LLM-as-a-judge. Originally, the term “LLM-as-a-judge” referred to the use of LLMs for evaluating the outputs of other models within NLP tasks [23]. Over time, however, the approach has expanded to include a broader range of applications, such as general evaluation of models, annotation of datasets, and labeling of both text and image—tasks that were traditionally performed by humans [23,53,54,55]. This approach is applied not only in NLP. For example, Gilardi et al. [32] evaluate GPT as an annotator for political text classification and show it can match average annotator accuracy, and Argyle et al. [56] use LLMs to simulate survey respondents and to label attitude-relevant text.
In this work, we adopt the LLM-as-a-judge framework for a new purpose: the analysis of open-ended survey responses and the classification of respondents according to levels of a measured attribute. The use of LLMs for the analysis of survey responses is still limited [57,58]. Some similar applications use LLMs to analyze open-ended responses to test questions [59,60] and for qualitative analysis [61]. However, applications in psychological research are scarce [62], largely due to concerns about hallucinations, biases, and the difficulty of ensuring consistent and reliable judgments [63,64]. These concerns are especially pressing when working with open-ended responses, since LLMs are particularly vulnerable to hallucination, over-interpretation, and confirmation bias. Consequentially, they may impute sentiments or motives not evidenced in the text, collapse minority or ambivalent expressions into normative categories, or conflate sarcasm and figurative language with literal meaning [32,65,66].
Given these challenges, it is necessary to methodically test whether the LLM-as-a-judge performs well in the context of analyzing survey responses. In this work, we contribute to this agenda by outlining validation strategies; specifically, we adopt the alternative test outlined in Calderon et al. [29] to test if the LLM is a suitable replacement for a human judge. We also discuss the conditions under which LLM judgments can be trusted, and offer practical guidelines for prompt design and model selection that could help reduce bias and improve reliability of AI analysis.
3. Methods
The methodology presented in this paper combines a hybrid MST/open-ended design with LLM-based analysis of free-text responses. This analysis categorizes responses into predefined levels of a certain psychological construct, thus facilitating its quantitative measurement.
This methodology addresses the ceiling effect in two principal ways. First, by replacing Likert-type scale items with open-ended questions, we reduce the possibility that respondents will easily select the highest available score; achieving the highest rating now requires producing free-text responses that authentically reflect the most extreme manifestations of the measured construct, which is inherently difficult. Additionally, the open-ended format mitigates reference-group effects, as respondents are less able to benchmark their answers against perceived peer norms. Second, the MST structure increases measurement resolution at the upper end of the scale, and the tailoring of questions to each respondent’s level enhances the reliability and validity of the assessment.
3.1. Modules
An MST is composed of modules, where each module corresponds to a distinct level of the underlying trait being assessed. For example, in the case of measuring fear, the modules might represent no fear, mild fear, and extreme fear. To ensure clarity and usability, it is crucial to define a limited number of modules, with each representing a meaningfully distinct level of the trait. If the number of modules is set too high, it is difficult to formulate questions that are clearly suitable for a given module, rather than an adjacent one. Consequently, the boundaries between the modules blur, and this reduces the reliability of the survey. On the other hand, setting the number of modules too low risks making the survey indistinguishable from a standard, linear format, thereby failing to address the ceiling effect that MST is designed to overcome. Therefore, we recommend using a structure of 3–5 modules to balance accuracy with effectiveness.
3.2. Routing Question for Module Assignment
To assign each respondent to the appropriate module, we recommend starting the survey with a closed-ended routing question, since an open-ended question would require real-time, unsupervised decision-making by the LLM, which may be unreliable. A closed-ended routing question works well here, as its purpose is not to measure the trait directly but rather to classify participants into the most suitable module. While this question may be subject to a ceiling effect, the impact of such an effect would be minimal because the subsequent open-ended questions inside each module are designed to further subdivide participants into finer-grained levels. If respondents misjudge themselves in the routing question (e.g., an individual with a high level of aversion that chooses an answer that indicates a medium level), then an overlap between adjacent modules (explained below) would still allow that respondent to achieve higher final scoring.
3.3. Survey Questions
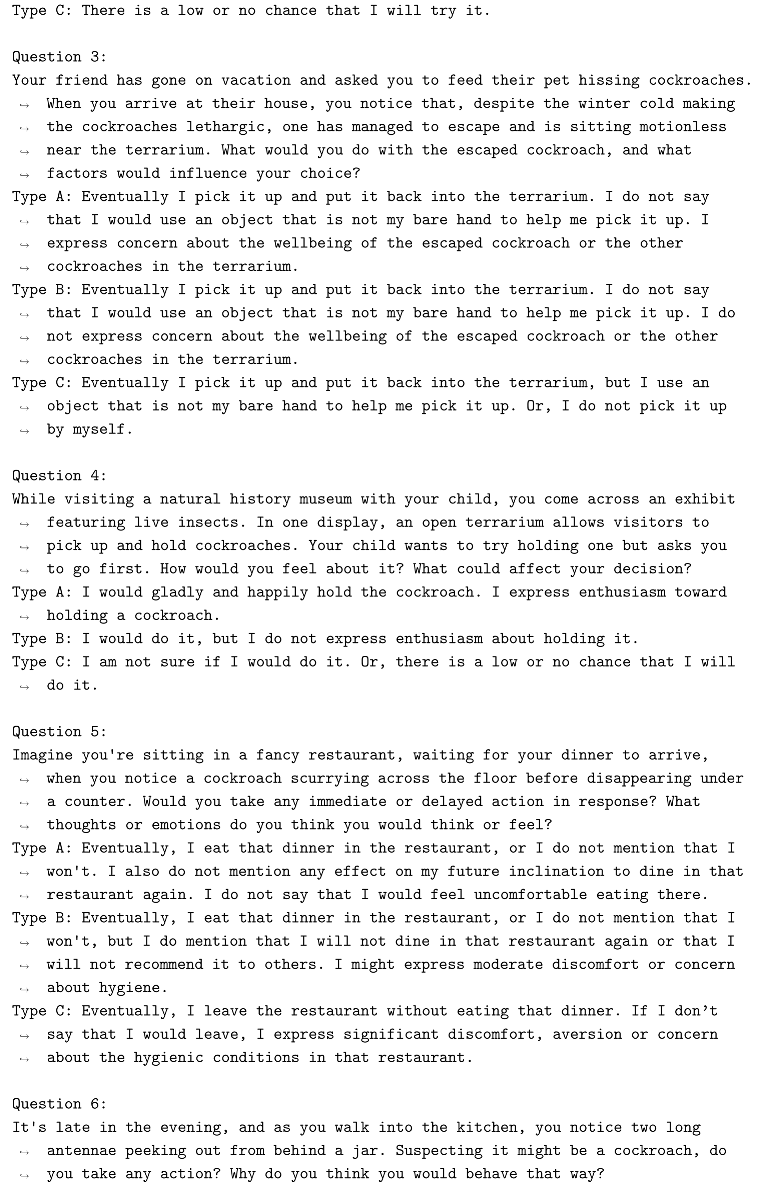
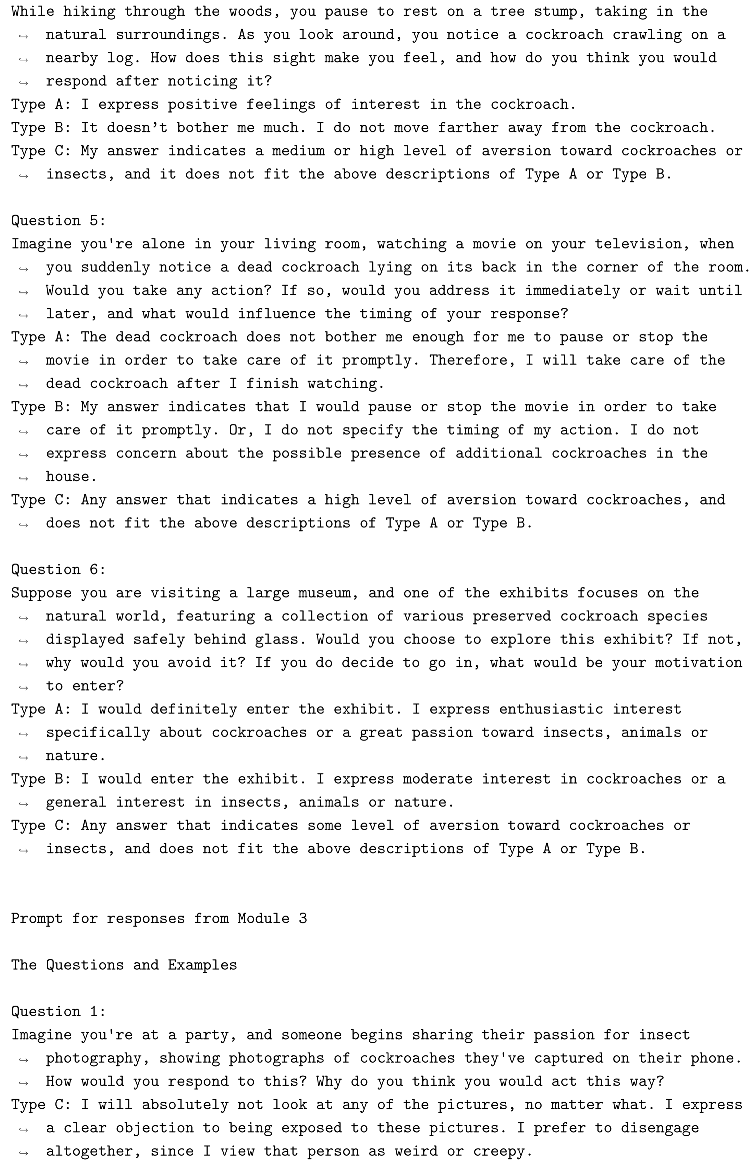
The survey is composed of open-ended questions describing various hypothetical scenarios, asking respondents to describe what their thoughts and reactions would be in such situations. The questions vary in the degree to which the described scenario aims to evoke the measured psychological construct (“harshness”). The harshness of the questions varies between modules, as a question that elicits a strong reaction from participants positioned at the higher end of the scale may generate little or no reaction from those at the lower end. Accordingly, question harshness is adapted to the module in which they are included, ensuring that the questions are relevant and appropriately challenging for respondents at different levels of the measured construct. To allow variable performance within each module, the questions it contains should elicit a certain range of possible responses; For example, in our case study (Section 3.6), two questions in each module aimed to evoke relatively low levels of the measured construct, two were aimed at medium levels, and another two targeted high levels of the measured construct. This way, each module contained a balanced set of six questions that together, covered a wide range of the measured construct. An illustration of the survey’s structure appears in Figure 2.
While conventional MSTs are typically used to assess cognitive skills or abilities, our approach adapts the MST framework for measuring psychological constructs. In this adaptation, respondents are routed by an initial routing question to a module appropriate to their indicated level on the construct of interest. Rather than right-or-wrong questions, these modules employ open-ended questions. A direct consequence of implementing this hybrid MST/open-ended design in large-scale surveys is the generation of substantial volumes of free-text data that requires systematic interpretation and scoring. For instance, in Gish et al. [18], if each respondent would have provided six free-text answers (as in our proposed design), the resulting dataset would have comprised approximately 15,000 responses, rendering manual coding impractical. Thus, the feasibility of this methodology is contingent upon automated scoring of responses, making an LLM that serves as an automated evaluator an integral component of the proposed framework.
3.4. Analysis of Survey Responses
The analysis of survey responses is conducted automatically with LLMs that classify each response to a specific level of the measured trait. The input to the LLM is a prompt that contains the survey question, the participant’s response, and instructions for classification together with the desired output format. The model’s output is a categorical decision corresponding to the evaluated level of trait intensity.
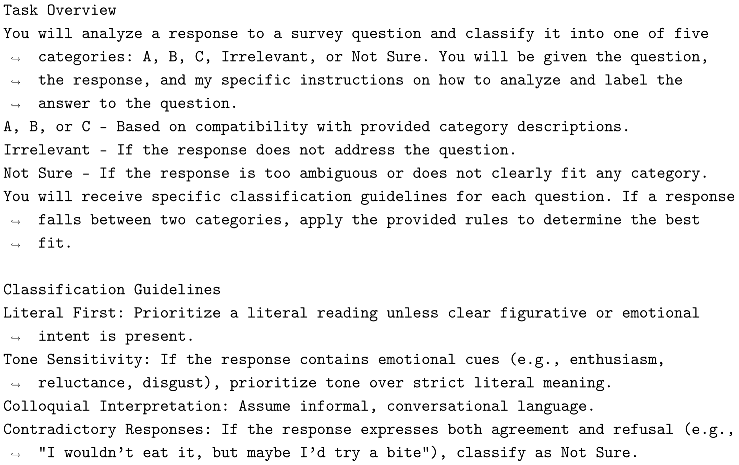
3.4.1. Classification Instructions
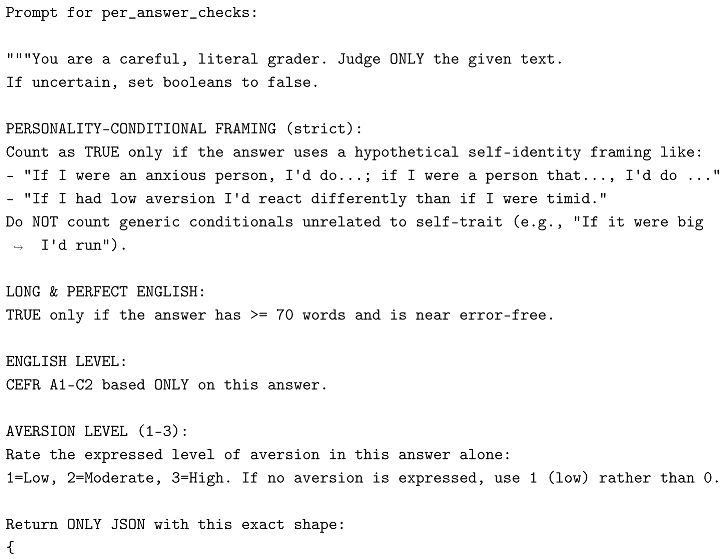
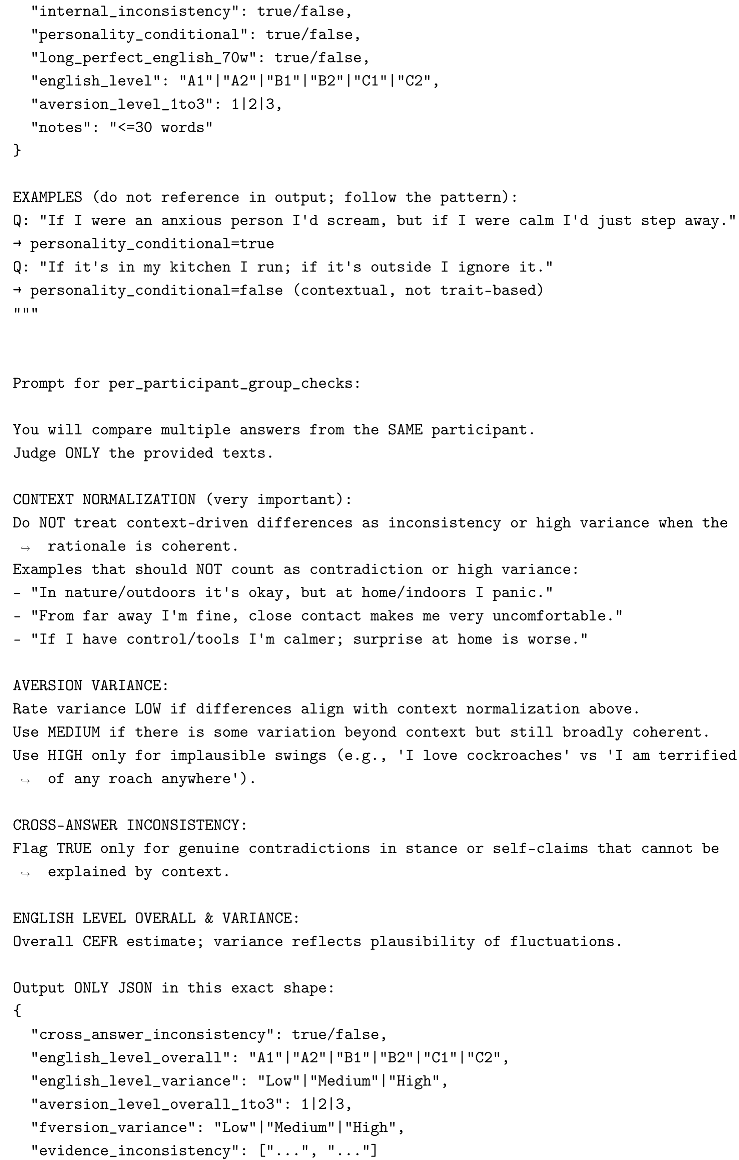
An essential component of prompt design is the clarity of classification instructions given to the LLM. The model should explicitly be directed to categorize each response into one of the predefined levels (e.g., low, medium, or high) without generating additional interpretations or free-text elaborations unless specifically requested. It is important to note that some models, such as GPT-4o, are optimized for step-by-step reasoning, which may not align with the strict adherence to instructions required in this context.
To achieve this, instructions must (a) define each level (classification label) with concrete behavioral or linguistic anchors, (b) specify the required output format, such as returning only the label or the label plus a short justification, and (c) prohibit speculative inferences about the respondent’s background, motivation, or intent beyond what is explicitly stated in the text. An example for such a prompt is given in Section 3.6. This direct approach reduces ambiguity, minimizes the risk of hallucinations, and improves consistency across responses.
In our study, we also experimented with few-shot prompting [67], a method in which the prompt includes a few labeled examples to guide the LLM in subsequent classifications. In our setting, this could involve providing sample responses representative of each label (low, medium, high) and instructing the model to classify new responses accordingly. However, since open-ended questions allow the respondents to express themselves openly and in diverse ways, we found that few-shot prompting offered no clear advantage over explicitly defining the label categories within the prompt.
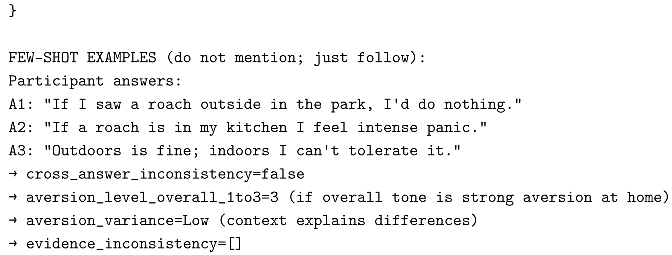
It is important to emphasize that classification is performed at the level of individual responses rather than across the full set of a participant’s answers. Providing all responses to the LLM at once and requesting a single, overall classification would encourage the model to average or infer patterns across responses, potentially amplifying biases or overlooking meaningful variation between items. In contrast, classifying each response separately preserves the item-level distinctions that are fundamental to the MST design, ensures that subtle expressions of the trait are not lost, enables to detect abnormalities and contradictions, and allows the scoring system to weight responses appropriately across modules. The final score is therefore derived from an aggregation of these independent classifications, following the differentiated scoring scheme described below, which both respects the hierarchical module structure and enhances measurement precision.
3.4.2. Filtering Non-Human Responses - Bot and AI Identification
Ensuring data quality is critical when analyzing survey responses, particularly with large-scale surveys that are deployed online. Some responses may be generated by automated agents or AI systems rather than genuine human participants. To mitigate this risk, we implement a combination of heuristic and model-based approaches for bot detection. This procedure should be applied prior to analyzing the survey responses.
Researchers should conduct a post-survey screening to identify and exclude submissions that are automated, low-effort, or intentionally contrarian. This involves removing responses that are too short, irrelevant, unserious, off-topic, or unreasonably lengthy, as well as detecting answers that appear to be LLM-generated. For example, responses that end with generic prompts to elaborate further or that provide multiple possible answers depending on a choice from several possible hypothetical personalities. Screening can be carried out both manually and with the help of AI tools to ensure greater accuracy.
When participants are recruited through online platforms such as Prolific or Amazon Mechanical Turk, researchers should also implement a verification step. Participants can be asked to report their age or another piece of demographic information stored in the platform’s database, and the reported data should be cross-checked against the platform’s metadata. Any discrepancies should be flagged as potential indicators of non-human or otherwise unreliable participants. Responses flagged using these methods can either be removed or subjected to manual inspection to confirm authenticity. This filtering step increases the chances that subsequent analysis will rely on high-quality, human-generated data.
3.4.3. Scoring Scheme
We recommend classifying each response into one of three levels—low, medium, or high—corresponding to the relative intensity of the measured trait within the context of a given module. However, these levels are not absolute across the entire survey; rather, their interpretation depends on the module in which they appear. For example, a response classified as “level 1” (low) in the extreme module does not carry the same meaning as “level 1” in the mild module. To address this, we assign differentiated numerical scores when aggregating responses across modules, thereby preserving the hierarchical structure of the MST design. Importantly, in the final calculation of the overall score, we allow overlaps between adjacent modules. This means that the highest level of one module may correspond numerically to, or even exceed, the lowest level of the next module, allowing some compensation for potential misrouting and retrospective dynamic movement between modules [68].
As an illustration of a scoring scheme, consider a participant in module provides six classified responses . We define the mapping from the LLM label to numeric points as follows:
The within-module sum of points for participant i is
To allow higher modules to contribute more strongly to the final score, we add a module-specific offset , defined as
so that , , and . The participant’s final score is therefore
Accordingly, the ranges of possible final scores for three modules are
This design creates a six-point overlap between adjacent modules (e.g., scores 6–12 are possible in both modules 1 and 2), yielding a smoother distribution across the full scale. The global range of the final scores is . This approach aligns the categorical judgments of the LLM with the continuous nature of levels of psychological constructs and enables finer-grained distinctions in measurement.
3.5. Evaluation of LLM-as-A-Judge
In this study, we adopted the methodology introduced by Calderon et al. [29] to assess the efficacy of using LLMs as evaluators of survey responses. Their framework, known as the Alternative Annotator Test (alt-test), provides a statistical approach to determine whether LLMs can reliably replace human annotators in specific tasks, including judgment tasks.
The alt-test involves comparing LLM-generated annotations against a small, curated subset of human-annotated examples. By analyzing the agreement between the LLM and human annotators, the procedure quantifies the reliability and alignment of the LLM’s judgments. This method allows researchers to justify the use of LLMs as substitutes for human evaluators in contexts where human annotation is resource-intensive or impractical.
In analyzing open-ended responses to large-scale surveys, we recommend utilizing this framework to evaluate the performance of LLMs in classifying survey responses into predefined emotional levels. By applying the alt-test, we ensure that the LLM’s classifications are statistically comparable to human judgments, thereby validating the LLM’s effectiveness as a “judge” in this context.
Furthermore, this analysis allows for the evaluation and comparison of multiple LLMs to determine which model provides the most reliable and accurate judgments. An example output is presented in Figure 3. According to the alt-test, an LLM with a winning rate greater than 0.5 can be considered a valid substitute for a human judge. In this figure, GPT-4.1, GPT-5, and Gemini-2.5-Flash meet this criterion. To facilitate comparison across models, the advantage probability score is used. This measure calculates the probability that the LLM is as good or better than a randomly chosen annotator. In Figure 3, GPT-5 achieves the highest performance as a judge. In the following section, we illustrate our proposed methodology with a case study on measuring aversion toward cockroaches.
3.6. Case Study
To test the performance of our new methodology, we chose a psychological construct which is likely to demonstrate a pronounced ceiling effect—the aversion toward cockroaches. Based on the findings of Gish et al. [18], we expected the data to show a ceiling effect when respondents rate their aversion toward cockroaches using a Likert-type question.
Although entomophobia and arachnophobia are generally defined as intense fears of insects and spiders, negative attitudes toward insects that do not sting or bite humans are more often driven by disgust than by fear [16]. In our study, the distinction between the fear component and the disgust component of entomophobia is immaterial, since it is the overall aversion and its consequences which are of interest. Therefore, instead of entomophobia, henceforth the term cockroach aversion and insect aversion will be used to refer to the general aversion toward cockroaches and insects. The next subsections describe the experimental setup and analysis models used to analyze the cockroach aversion survey responses.
3.6.1. Survey Administration
We distributed a computerized survey using the online platforms Prolific (www.prolific.com) and Qualtrics (www.qualtrics.com). We surveyed 510 adults (255 men, 255 women) between the ages 25–80, residing in the contiguous United States. We chose only participants who fulfilled the following criteria: living with spouse/partner; past approval rate: 100%; weekly working hours on Prolific: 0–5 hours; household size of 2–6 persons; no romantic partner on Prolific; fluent English; primary language: English.
The survey was given the generic name “personal views and habits” and was vaguely described as part of a study on how people interact with their everyday environment. This was important for minimizing selection bias that could have been caused by the possibility that people with a high level of cockroach aversion would skip a survey if they knew, a priori, that it focused on cockroaches. Participants were informed that the survey would take no more than 10 minutes to complete, and they were encouraged to provide honest and elaborated responses. Of 529 responses to the survey, we accepted 510. Ten respondents did not complete the survey, one was timed out, five were excluded due to very short responses, and three were identified as bots/AI by our non-human filtering procedure. The survey was conducted during June-August of 2025.
3.6.2. Questionnaire Structure
The questionnaire consisted of two parts. The first part was designed to assess and quantify participants’ level of cockroach aversion, following the methodology proposed in this paper. The second part served as a control test for this methodology, measuring cockroach aversion through a conventional Likert scale-based closed question: On a scale of 1 to 7, how would you rate the level of aversion (disgust or fear) you feel toward cockroaches? Where 1 = No aversion at all and 7 = Extreme aversion.
The survey began with a routing question that asked “How aversive (scary or disgusting) do you find cockroaches?” for which respondents could choose one of three answers: not aversive at all, somewhat aversive, or very aversive. Based on their response to this question, they were directed to one of three different modules.
In each module, two questions were designed to invoke a relatively low level of aversion, two aimed at invoking a medium level of aversion, and another two were meant to invoke a high level of aversion (see summary in Table 1, and the full survey in Appendix A). Thus, the questions in each module covered a range of potential aversion levels.
3.6.3. Survey Development
The open-ended questions were composed and refined by two experts—an expert on entomophobia and an NLP expert. All parts of the cockroach aversion quantification section of the survey were tested, corrected, and refined during multiple stages of small-scale surveys and performance analysis of our methods. These preliminary small-scale surveys included a total of 165 participants from the same target population, who were then excluded from the study. The response classification instructions provided to the LLMs were composed and refined during the development phase using the responses collected in the small-scale preliminary surveys.
3.6.4. LLM Candidates
To identify the most suitable LLM for analyzing the survey responses, we first sampled 108 responses from all open-ended survey questions (2–3 responses per question across all modules). According to Calderon et al. [29], a sample of 50–100 is sufficient for testing the LLM’s performance as a judge in various applications. In addition, we made sure that the sampled responses are from different respondents to generate a representative sample of responses and levels of aversion. The authors of this paper manually annotated these responses into three categories based on their subjective judgment: Type A for minimal to no aversion, Type B for moderate aversion, and Type C for extreme aversion. The classification into types was carried out with consideration of the module context, namely the initial aversion level that participants declared in the routing question. We evaluated the following LLMs: GPT-4.1 (OpenAI), GPT-4o (OpenAI), GPT-5 (OpenAI), Gemini-2.0-Flash (Google), Gemini-2.5-Flash (Google). Although more reasoning models are available, we avoided them after observing that during preliminary testing these models tended to over-interpret responses, occasionally inferring intentions or emotional subtext that did not align with a literal reading of the text. The full prompt provided to the LLMs appears in Appendix B.
We evaluated the LLMs’ performance using the methodology defined in Calderon et al. [29], which was specifically designed to evaluate LLM-as-a-judge models. The performance outcomes are presented in Figure 3. Based on these results, we selected GPT-4.1 and GPT-5 as judging models for the full survey analysis.
3.6.5. Data Analysis
Each participant’s open-ended responses were evaluated by the two selected LLMs. Both models were accessed via API in zero-shot mode with a temperature of 0 to ensure deterministic outputs. Responses were submitted individually, and each prompt contained the survey question, the participant’s answer, and a rubric outlining detailed classification rules. The rubric instructed the LLMs to assign responses to one of three categories: Type A (low aversion), Type B (moderate aversion), or Type C (high aversion). In addition, the LLMs could classify a response as Irrelevant if it did not address the question, or as Not Sure if it was too vague or contradictory. In these two cases, the models were required to provide an explanation. Such responses were flagged and subsequently reclassified independently by one of the researchers according to the same rubric. We evaluated the prompt and the questions in the survey by comparing the classifications of the LLMs to the researchers’ classifications on an independent set of users who answered the survey in its pilot version.
3.6.6. Score Calculation
In our case study, each module consisted of three item pairs, corresponding to three levels of cockroach aversion. We implemented the 6-point overlap scoring scheme described in Section 3.4.3. We also tested a 5-point and a 7-point overlap variants, but found no substantial differences among them that would favor one over the others in a goodness-of-fit test (Kolmogorov-Smirnov) compared to a skewed-normal distribution. We selected the skewed-normal as a reference because, when surveying a large population about their fear of cockroaches, the distribution of responses is expected to approximate normality due to the central limit theorem, while also exhibiting slight skewness. This skewness arises because many respondents report some aversion to cockroaches, resulting in most scores clustering toward the upper end of the scale, with fewer but more extreme values extending toward the lower end.
3.6.7. Bot and LLM Response Detection
To ensure that responses reflected genuine human input, we conducted a post hoc screening as recommended in Section 3.4.2. This screening was done both manually, and with the help of ChatGPT (the prompt used for bot detection is included in Appendix C). In addition, at the end of the survey, we asked participants to report their age. We compared the reported age with their registered age on Prolific, and discrepancies were flagged as possible indicators of non-human participants. All flagged responses were reviewed manually by the authors to decide if the participants who provided them should be excluded.
4. Results
4.1. Ceiling Effect Demonstration for Likert Scale Rating
As noted earlier, alongside the open-ended survey, we aimed to validate that measuring cockroach aversion with Likert-type questions is problematic, as it tends to produce a ceiling effect. Figure 4 reveals a pronounced ceiling effect: the majority of participants reported very high aversion, with most responses concentrated at values 6 and 7 on the Likert scale. While the cutoff for a ceiling effect is typically 15%, in our case 23% of the total sample selected the upper-most ranking 7, and 45% selected 6 or 7. Among men, 14.5% selected 7, and 32.5% selected 6 or 7. Among women, 33% selected 7, and 57% selected 6 or 7.
4.2. Ceiling Effect Mitigation with Open-Ended Question MST
Figure 5 presents the distribution of scores assigned by the LLMs to all survey respondents. As illustrated, the distributions of scores resembled a normal distribution with a slight right skew. Scores were generally concentrated at the upper-middle range of the scale (roughly between 15–17 for the whole sample, 15-16 for men and 16-18 for women). Importantly, the distributions show no evidence of a ceiling effect, as few respondents were classified at the extreme top values of the scale.
4.3. LLM Performance
The performance of the LLMs as judges was tested on the 108 samples that were classified by human experts. In addition to the outcomes from the alternative test (Figure 3), we also report agreement measures for these classifications. Specifically, we computed Cohen’s kappa between each LLM and the majority vote derived from the expert annotations, and calculated the overall multi-rater reliability using Fleiss’s kappa across all annotators, including the LLMs (Table 2).
Overall, the two LLMs, GPT-4.1 and GPT-5, classified 3060 responses to the questions of the survey, of which only 118 (3.8%) were classified as Irrelevant or Not Sure by at least one LLM. The counts of these responses appear in Table 3. Upon manual inspection, we identified 4 cases where GPT-4.1 should have assigned a label (A, B, or C) and 7 cases where GPT-5 should have assigned a label (i.e., the Irrelevant or Not Sure labels were not justified).
5. Discussion
In this study, we addressed a persistent challenge in psychological measurement: the ceiling effect, which can occur when traditional self-report numeric scales are used to quantify extreme emotions and affective attitudes [48,49]. This measurement artifact may obscure the real variation within a population, leading to inaccurate conclusions and hindering scientific progress [12,13,14,15]. To overcome this limitation, we introduced a novel framework that combines a multistage testing design with open-ended questions and leverages the analytical capabilities of LLMs for scalable, automated response analysis. Since this framework depends on interpreting free-text responses, its feasibility for medium- and large-scale studies requires the use of automated text evaluators, such as LLM-as-a-judge models.
Our case study on cockroach aversion allowed us to test the ability of our new framework to mitigate a clear and extreme ceiling effect, one which until now, no study was able to suppress. While the conventional Likert-type question produced a highly skewed distribution with many respondents selecting the highest possible rating, the MST-LLM framework revealed a distribution of the data that was likely obscured by the strong ceiling effect in the Likert-type question (as seen in Figure 4). This result demonstrates that the proposed method can reveal meaningful variability that fixed-choice items mask. In doing so, it supports our central hypothesis, that replacing fixed-choice items with carefully designed open-ended questions enables a more realistic and fine-grained representation of the nuances of extreme psychological constructs.
The validation process further confirmed the viability of this approach. Using the alt-test, we demonstrated that LLMs can serve as reliable and consistent substitutes for human judges when classifying open-ended survey responses. This was also supported by traditional agreement measures, such as Cohen’s and Fleiss’ kappas that showed substantial agreement with expert judgments (Table 2). The strong agreement between LLM-generated classifications and expert annotations provides empirical support for using LLMs as evaluators in this context.
Moreover, across a dataset of more than three thousand automatically classified responses, only a small number were labeled as Irrelevant or Not Sure by at least one model. Manual review of these flagged responses, in which the model was not sure in its classification, showed that almost all of them reflected true misclassifications, suggesting that the models generally interpreted respondents’ intentions and levels of aversion with minimal uncertainty. Taken together, these results suggest that the selected LLMs were capable of maintaining both precision and restraint, avoiding overinterpretation while still capturing meaningful distinctions in free-text responses.
It is important to note, however, that the success of this framework likely depends not only on the capabilities of the LLMs themselves, but also on the thoughtful design and refinement of both the survey questions and the classification prompts. In our study, these components were iteratively developed through multiple rounds of small-scale testing. Questions that elicit sub-optimal responses and prompts that allow overly permissive interpretation, could undermine classification reliability. Therefore, we recommend that future applications of the MST–LLM framework include a dedicated development phase in which question wording and prompt instructions are systematically tested and refined by experts before full deployment.
While implementing this methodology requires careful survey design, rigorous validation of LLM performance, and precise prompt engineering, it offers a robust solution to a longstanding measurement challenge. By enabling complex and extreme psychological traits to be translated into reliable quantitative measures, this approach reduces reliance on improvised combinations of qualitative and quantitative methods [5,9]. By this, it could improve the reliability of findings and enable their use in statistical hypothesis testing and empirical validation.
The implications of this work go beyond cockroach aversion or entomophobia. The proposed framework provides a generalizable, scalable methodology for researchers in psychology, sociology, mental health, and political science, fields where extreme responding may occur. By addressing ceiling effects during data collection rather than attempting to correct for them post-hoc, the framework opens up new avenues for studying phenomena that were previously difficult to quantify. Future research may expand this framework to other affective domains, explore alternative LLM architectures, and continue refining scoring methods. As LLMs continue to improve, their integration into psychological assessment paradigms like the one presented here is likely to further enhance measurement precision, thus allowing researchers to deepen their understanding of the causes and consequences of extreme psychological constructs.
Author Contributions
Conceptualization, M.G. and R.D.; methodology, M.G. and R.D.; software, A.N.; validation, A.N., M.G. and R.D.; formal analysis, R.D.; investigation, A.N., M.G. and R.D.; data curation, A.N.; writing—original draft preparation, M.G. and R.D; writing—review and editing, M.G. and R.D.; visualization, A.N.; supervision, M.G and R.D.; All authors have read and agreed to the published version of the manuscript.
Funding
This research received no external funding.
Institutional Review Board Statement
The study was approved by the ethics committee of the Faculty of Social Sciences, University of Haifa (030/25).
Informed Consent Statement
All participants gave their written informed consent to participate in online surveys when signing up to the Prolific platform.
Data Availability Statement
The raw data supporting the conclusions of this article will be made available by the authors on request from the corresponding author
Conflicts of Interest
The authors declare no conflicts of interest.
Abbreviations
The following abbreviations are used in this manuscript:
| MST | Multistage Testing |
| LLM | Large Language Model |
| NLP | Natural Language Processing |
| CAT | Computerized Adaptive Testing |
| IRT | Item Response Theory |
| AI | Artificial intelligence |
| alt-test | Alternative Annotator Test |
Appendix A. Open-Ended Questions - Full Version
Appendix A.1. Module 1
- 1.
- You’ve just finished making yourself dinner. You place the plate on the table, but before sitting down, you go to the bathroom. When you return, you see a cockroach standing on your food. As you approach, it scurries off and upon reaching the edge of the table, it spreads its wings and flies out the window. What do you do with your dinner, and why do you do that?
- 2.
- In some countries, fried cockroaches are regarded as a delicacy. Imagine a friend returning from one of these countries with a bag of fried cockroach snacks and offering you a taste. Would you try one? Under what conditions might you be willing to give it a try?
- 3.
- Your friend has gone on vacation and asked you to feed their pet hissing cockroaches. When you arrive at their house, you notice that, despite the winter cold making the cockroaches lethargic, one has managed to escape and is sitting motionless near the terrarium. What would you do with the escaped cockroach, and what factors would influence your choice?
- 4.
- While visiting a natural history museum with your child, you come across an exhibit featuring live insects. In one display, an open terrarium allows visitors to pick up and hold cockroaches. Your child wants to try holding one but asks you to go first. How would you feel about it? What could affect your decision?
- 5.
- Imagine you’re sitting in a fancy restaurant, waiting for your dinner to arrive, when you notice a cockroach scurrying across the floor before disappearing under a counter. Would you take any immediate or delayed action in response? What thoughts or emotions do you think you would think or feel?
- 6.
- It’s late in the evening, and as you walk into the kitchen, you notice two long antennae peeking out from behind a jar. Suspecting it might be a cockroach, do you take any action? Why do you think you would behave that way?
Appendix A.2. Module 2
- 1.
- You’re seated in a movie theater, waiting for the movie to begin, when you spot two cockroaches scurrying on the floor nearby. Moments later, the lights dim and the movie begins. Do you take any action in response? If so, what do you do and what motivates your choice of action?
- 2.
- You’ve just returned home in the evening. As you step into the living room and turn on the light, you spot a cockroach scurrying across the floor before it disappears under the couch. What do you do? Why would you choose that course of action?
- 3.
- While driving through town, you stop at a red light and glance to your left, noticing a bunch of cockroaches crawling out of a storm drain. Does this sight evoke any feelings in you? If so, what emotions do you think you might experience?
- 4.
- While hiking through the woods, you pause to rest on a tree stump, taking in the natural surroundings. As you look around, you notice a cockroach crawling on a nearby log. How does this sight make you feel, and how do you think you would respond after noticing it?
- 5.
- Imagine you’re alone in your living room, watching a movie on your television, when you suddenly notice a dead cockroach lying on its back in the corner of the room. Would you take any action? If so, would you address it immediately or wait until later, and what would influence the timing of your response?
- 6.
- Suppose you are visiting a large museum, and one of the exhibits focuses on the natural world, featuring a collection of various preserved cockroach species displayed safely behind glass. Would you choose to explore this exhibit? If not, why would you avoid it? If you do decide to go in, what would be your motivation to enter?
Appendix A.3. Module 3
- 1.
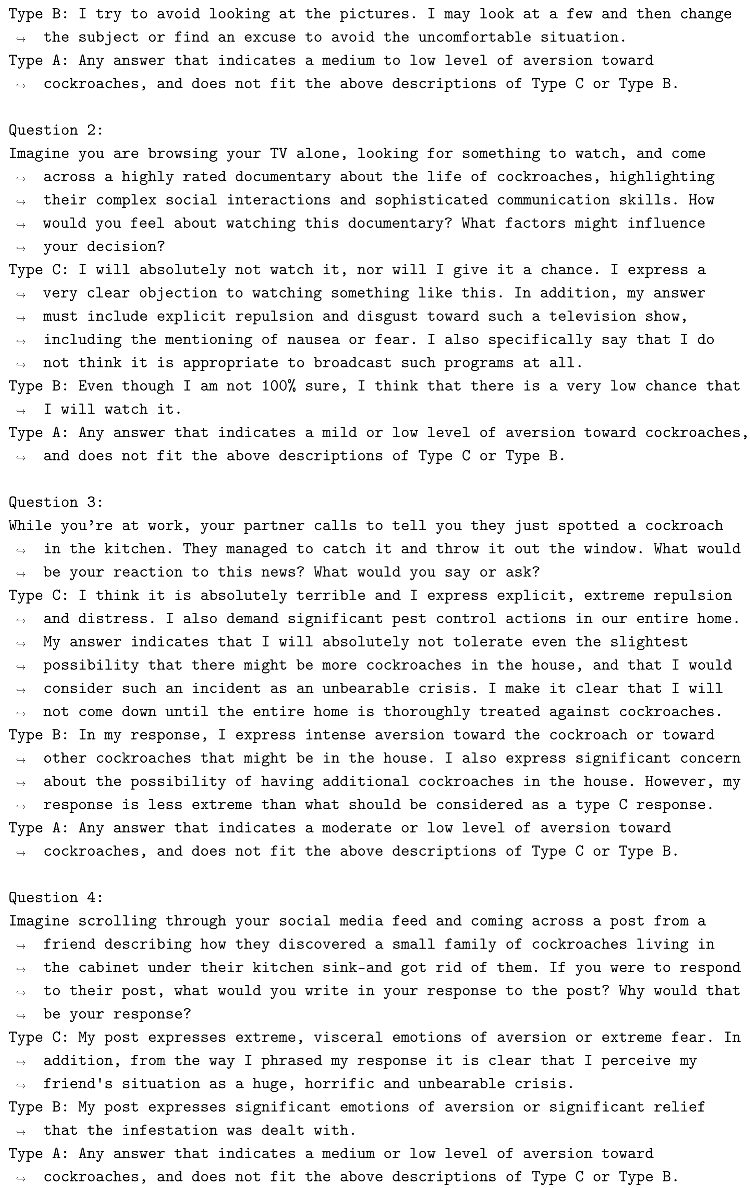
- Imagine you’re at a party, and someone begins sharing their passion for insect photography, showing photographs of cockroaches they’ve captured on their phone. How would you respond to this? Why do you think you would act this way?
- 2.
- Imagine you are browsing your TV alone, looking for something to watch, and come across a highly rated documentary about the life of cockroaches, highlighting their complex social interactions and sophisticated communication skills. How would you feel about watching this documentary? What factors might influence your decision?
- 3.
- While you are at work, your partner calls to tell you they just spotted a cockroach in the kitchen. They managed to catch it and throw it out the window. What would be your reaction to this news? What would you say or ask?
- 4.
- Imagine scrolling through your social media feed and coming across a post from a friend describing how they discovered a small family of cockroaches living in the cabinet under their kitchen sink‚ and got rid of them. If you were to respond to their post, what would you write in your response to the post? Why would that be your response?
- 5.
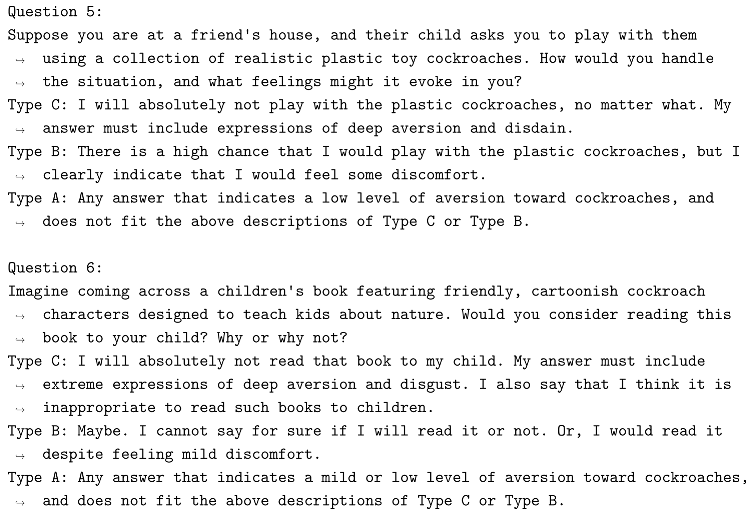
- Suppose you are at a friend’s house, and their child asks you to play with them using a collection of realistic plastic toy cockroaches. How would you handle the situation, and what feelings might it evoke in you?
- 6.
- Imagine coming across a children’s book featuring friendly, cartoonish cockroach characters designed to teach kids about nature. Would you consider reading this book to your child? Why or why not?
Appendix B. Prompt for LLM Classification


Appendix C. Bot and AI Detection Prompt
References
- Swan, K.; Speyer, R.; Scharitzer, M.; Farneti, D.; Brown, T.; Woisard, V.; Cordier, R. Measuring what matters in healthcare: a practical guide to psychometric principles and instrument development. Frontiers in Psychology 2023, 14, 1225850. [Google Scholar] [CrossRef]
- Brown, G.T. The past, present and future of educational assessment: A transdisciplinary perspective. Proceedings of the Frontiers in Education. Frontiers Media SA 2022, Vol. 7, 1060633. [Google Scholar] [CrossRef]
- Dell’Aquila, E.; Ponticorvo, M.; Limone, P.; et al. Psychological Foundations for Effective Human–Computer Interaction in Education. APPLIED SCIENCES-BASEL 2025, 15. [Google Scholar] [CrossRef]
- Hammarberg, K.; Kirkman, M.; De Lacey, S. Qualitative research methods: when to use them and how to judge them. Human reproduction 2016, 31, 498–501. [Google Scholar] [CrossRef]
- Johnson, R.B.; Onwuegbuzie, A.J. Mixed methods research: A research paradigm whose time has come. Educational researcher 2004, 33, 14–26. [Google Scholar] [CrossRef]
- Prabhu, G.N. Teaching the scope and limits of generalizability in qualitative research. New Trends in Qualitative Research 2020, 1, 186–192. [Google Scholar]
- Zhou, Y.; Wu, M.L. Reported methodological challenges in empirical mixed methods articles: A review on JMMR and IJMRA. Journal of Mixed Methods Research 2022, 16, 47–63. [Google Scholar] [CrossRef]
- Oswald, M.E.; Grosjean, S. Confirmation bias. In Cognitive illusions: A handbook on fallacies and biases in thinking, judgement and memory; 2004; Volume 79, p. 83. [Google Scholar]
- Creswell, J.W.; Creswell, J.D. Research design: Qualitative, quantitative, and mixed methods approaches; Sage publications, 2017. [Google Scholar]
- Antwi, S.K.; Hamza, K. Qualitative and quantitative research paradigms in business research: A philosophical reflection. European journal of business and management 2015, 7, 217–225. [Google Scholar]
- Stockemer, D. The nuts and bolts of empirical social science. In Quantitative methods for the social sciences: A practical introduction with examples in SPSS and Stata; Springer, 2018; pp. 5–22. [Google Scholar]
- Everitt, B.S.; Skrondal, A. The Cambridge dictionary of statistics; Cambridge university press Cambridge, UK, 2010; Vol. 4. [Google Scholar]
- McHorney, C.A.; Tarlov, A.R. Individual-patient monitoring in clinical practice: are available health status surveys adequate? Quality of life research 1995, 4, 293–307. [Google Scholar]
- Cramer, D.; Howitt, D.L. The Sage dictionary of statistics: a practical resource for students in the social sciences; Sage, 2004. [Google Scholar]
- Brinkman, N.; Looman, R.; Jayakumar, P.; Ring, D.; Choi, S. Is it possible to develop a patient-reported experience measure with lower ceiling effect? Clinical Orthopaedics and Related Research® 2022, 10–1097. [Google Scholar] [CrossRef]
- Fukano, Y.; Soga, M. Evolutionary psychology of entomophobia and its implications for insect conservation. Current opinion in insect science 2023, 59, 101100. [Google Scholar] [CrossRef]
- Lockwood, J. The infested mind: Why humans fear, loathe, and love insects; Oxford University Press, 2013. [Google Scholar]
- Gish, M.; Hisano, M.; Soga, M. Does aversion to insects affect insecticide use? An elusive answer calls for improved methods in biophobia research. People and Nature 2024, 6, 1001–1014. [Google Scholar] [CrossRef]
- Yan, D.; Von Davier, A.A.; Lewis, C. Computerized multistage testing: Theory and applications; CRC Press, 2016. [Google Scholar]
- Hung, M.; Stuart, A.R.; Higgins, T.F.; Saltzman, C.L.; Kubiak, E.N. Computerized adaptive testing using the PROMIS physical function item bank reduces test burden with less ceiling effects compared with the short musculoskeletal function assessment in orthopaedic trauma patients. Journal of orthopaedic trauma 2014, 28, 439–443. [Google Scholar] [CrossRef] [PubMed]
- Yan, D.; Lewis, C.; von Davier, A.A. Overview of computerized multistage tests. In Computerized multistage testing: Theory and applications; 2014; pp. 3–20. [Google Scholar]
- Yigiter, M.S.; Dogan, N. Computerized multistage testing: Principles, designs and practices with R. Measurement: Interdisciplinary Research and Perspectives 2023, 21, 254–277. [Google Scholar] [CrossRef]
- Li, H.; Dong, Q.; Chen, J.; Su, H.; Zhou, Y.; Ai, Q.; Ye, Z.; Liu, Y. Llms-as-judges: a comprehensive survey on llm-based evaluation methods. arXiv 2024, arXiv:2412.05579. [Google Scholar]
- Li, D.; Jiang, B.; Huang, L.; Beigi, A.; Zhao, C.; Tan, Z.; Bhattacharjee, A.; Jiang, Y.; Chen, C.; Wu, T.; et al. From generation to judgment: Opportunities and challenges of llm-as-a-judge, 2025. Available online: https://arxiv. org/abs/2411.16594.
- Kojima, T.; Gu, S.S.; Reid, M.; Matsuo, Y.; Iwasawa, Y. Large language models are zero-shot reasoners. Advances in neural information processing systems 2022, 35, 22199–22213. [Google Scholar]
- Achiam, J.; Adler, S.; Agarwal, S.; Ahmad, L.; Akkaya, I.; Aleman, F.L.; Almeida, D.; Altenschmidt, J.; Altman, S.; Anadkat, S.; et al. Gpt-4 technical report. arXiv 2023, arXiv:2303.08774. [Google Scholar] [CrossRef]
- Yang, J.; Jin, H.; Tang, R.; Han, X.; Feng, Q.; Jiang, H.; Zhong, S.; Yin, B.; Hu, X. Harnessing the power of llms in practice: A survey on chatgpt and beyond. ACM Transactions on Knowledge Discovery from Data 2024, 18, 1–32. [Google Scholar] [CrossRef]
- Tahmid Rahman Laskar, M.; Saiful Bari, M.; Rahman, M.; Amran Hossen Bhuiyan, M.; Joty, S.; Xiangji Huang, J. A systematic study and comprehensive evaluation of chatgpt on benchmark datasets. arXiv e-prints 2023, arXiv–2305. [Google Scholar]
- Calderon, N.; Reichart, R.; Dror, R. The alternative annotator test for llm-as-a-judge: How to statistically justify replacing human annotators with llms. arXiv arXiv:2501.10970.
- Uma, A.N.; Fornaciari, T.; Hovy, D.; Paun, S.; Plank, B.; Poesio, M. Learning from disagreement: A survey. Journal of Artificial Intelligence Research 2021, 72, 1385–1470. [Google Scholar] [CrossRef]
- Bartsch, H.; Jorgensen, O.; Rosati, D.; Hoelscher-Obermaier, J.; Pfau, J. Self-consistency of large language models under ambiguity. arXiv 2023, arXiv:2310.13439. [Google Scholar] [CrossRef]
- Gilardi, F.; Alizadeh, M.; Kubli, M. ChatGPT outperforms crowd workers for text-annotation tasks. Proceedings of the National Academy of Sciences 2023, 120, e2305016120. [Google Scholar] [CrossRef] [PubMed]
- Chen, T.; Xu, P. Botfip-LLM: An Enhanced Multimodal Scientific Computing Framework Leveraging Knowledge Distillation from Large Language Models. arXiv 2024, arXiv:2411.15525. [Google Scholar] [CrossRef]
- Hu, J.; Dong, T.; Gang, L.; Ma, H.; Zou, P.; Sun, X.; Guo, D.; Yang, X.; Wang, M. Psycollm: Enhancing llm for psychological understanding and evaluation. IEEE Transactions on Computational Social Systems; 2024. [Google Scholar]
- Brokelman, R.B.; Haverkamp, D.; van Loon, C.; Hol, A.; van Kampen, A.; Veth, R. The validation of the visual analogue scale for patient satisfaction after total hip arthroplasty. European orthopaedics and traumatology 2012, 3, 101–105. [Google Scholar] [CrossRef]
- Moret, L.; Nguyen, J.M.; Pillet, N.; Falissard, B.; Lombrail, P.; Gasquet, I. Improvement of psychometric properties of a scale measuring inpatient satisfaction with care: a better response rate and a reduction of the ceiling effect. BMC health services research 2007, 7, 197. [Google Scholar] [CrossRef]
- De Vet, H.C.; Terwee, C.B.; Mokkink, L.B.; Knol, D.L. Measurement in medicine: a practical guide; Cambridge university press, 2011. [Google Scholar]
- Šimkovic, M.; Träuble, B. Robustness of statistical methods when measure is affected by ceiling and/or floor effect. PloS one 2019, 14, e0220889. [Google Scholar] [CrossRef]
- Chyung, S.Y.; Hutchinson, D.; Shamsy, J.A. Evidence-based survey design: Ceiling effects associated with response scales. Performance Improvement 2020, 59, 6–13. [Google Scholar] [CrossRef]
- Pouwer, F.; Snoek, F.J.; Heine, R.J. Ceiling effect reduces the validity of the Diabetes Treatment Satisfaction Questionnaire. Diabetes Care: The Journal of Clinical and Applied Research and Education 1998, 21, 2039–2039. [Google Scholar] [CrossRef]
- Vita, S.; Coplin, H.; Feiereisel, K.B.; Garten, S.; Mechaber, A.J.; Estrada, C. Decreasing the ceiling effect in assessing meeting quality at an academic professional meeting. Teaching and learning in medicine 2013, 25, 47–54. [Google Scholar] [CrossRef]
- Harland, N.; Dawkin, M.; Martin, D. Relative utility of a visual analogue scale vs a six-point Likert scale in the measurement of global subject outcome in patients with low back pain receiving physiotherapy. Physiotherapy 2015, 101, 50–54. [Google Scholar] [CrossRef] [PubMed]
- Paap, D.; Schepers, M.; Dijkstra, P.U. Reducing ceiling effects in the working alliance inventory-rehabilitation dutch version. Disability and rehabilitation 2020, 42, 2944–2950. [Google Scholar] [CrossRef]
- Voutilainen, A.; Pitkäaho, T.; Kvist, T.; Vehviläinen-Julkunen, K. How to ask about patient satisfaction? The visual analogue scale is less vulnerable to confounding factors and ceiling effect than a symmetric Likert scale. Journal of advanced nursing 2016, 72, 946–957. [Google Scholar] [CrossRef] [PubMed]
- Andrew, S.; Salamonson, Y.; Everett, B.; Halcomb, E.J.; Davidson, P.M. Beyond the ceiling effect: using a mixed methods approach to measure patient satisfaction. International Journal of Multiple Research Approaches 2011, 5, 52–63. [Google Scholar] [CrossRef]
- van den Oord, E.J.; van der Ark, L.A. A note on the use of the Tobit approach for tests scores with floor or ceiling effects. British Journal of Mathematical and Statistical Psychology 1997, 50, 351–364. [Google Scholar] [CrossRef]
- Wang, L.; Zhang, Z.; McArdle, J.J.; Salthouse, T.A. Investigating ceiling effects in longitudinal data analysis. Multivariate behavioral research 2008, 43, 476–496. [Google Scholar] [CrossRef]
- Page, A.C.; Hooke, G.R.; Morrison, D.L. Psychometric properties of the Depression Anxiety Stress Scales (DASS) in depressed clinical samples. British Journal of Clinical Psychology 2007, 46, 283–297. [Google Scholar] [CrossRef]
- Palm, K.M.; Strong, D.R.; MacPherson, L. Evaluating symptom expression as a function of a posttraumatic stress disorder severity. Journal of Anxiety Disorders 2009, 23, 27–37. [Google Scholar] [CrossRef]
- Crede, M.; Bashshur, M.; Niehorster, S. Reference group effects in the measurement of personality and attitudes. Journal of Personality Assessment 2010, 92, 390–399. [Google Scholar] [CrossRef]
- Bjorner, J.B.; Chang, C.H.; Thissen, D.; Reeve, B.B. Developing tailored instruments: item banking and computerized adaptive assessment. Quality of life research 2007, 16, 95–108. [Google Scholar] [CrossRef]
- Van der Linden, W.J.; Glas, C.A. Elements of adaptive testing; Springer, 2010; Vol. 10. [Google Scholar]
- Zheng, L.; Chiang, W.L.; Sheng, Y.; Zhuang, S.; Wu, Z.; Zhuang, Y.; Lin, Z.; Li, Z.; Li, D.; Xing, E.; et al. Judging llm-as-a-judge with mt-bench and chatbot arena. Advances in neural information processing systems 2023, 36, 46595–46623. [Google Scholar]
- Gu, J.; Jiang, X.; Shi, Z.; Tan, H.; Zhai, X.; Xu, C.; Li, W.; Shen, Y.; Ma, S.; Liu, H.; et al. A survey on llm-as-a-judge. arXiv 2024, arXiv:2411.15594. [Google Scholar] [CrossRef]
- Voutsa, M.C.; Tsapatsoulis, N.; Djouvas, C. Biased by Design? Evaluating Bias and Behavioral Diversity in LLM Annotation of Real-World and Synthetic Hotel Reviews. AI 2025, 6, 178. [Google Scholar] [CrossRef]
- Argyle, L.P.; Busby, E.C.; Fulda, N.; Gubler, J.R.; Rytting, C.; Wingate, D. Out of one, many: Using language models to simulate human samples. Political Analysis 2023, 31, 337–351. [Google Scholar] [CrossRef]
- Rothschild, D.M.; Brand, J.; Schroeder, H.; Wang, J. Opportunities and risks of LLMs in survey research. Available at SSRN. 2024.
- Flynn, M.E. Scaling Open-ended Survey Responses Using LLM-Paired Comparisons. Available at SSRN 5112677 2025.
- Henkel, O.; Hills, L.; Boxer, A.; Roberts, B.; Levonian, Z. Can Large Language Models Make the Grade? An Empirical Study Evaluating LLMs Ability To Mark Short Answer Questions in K-12 Education. In Proceedings of the Proceedings of the Eleventh ACM Conference on Learning @ Scale, New York, NY, USA, 2024; L@S ’24, pp. 300–304. [Google Scholar] [CrossRef]
- Liew, P.Y.; Tan, I.K.T. On Automated Essay Grading using Large Language Models. In Proceedings of the Proceedings of the 2024 8th International Conference on Computer Science and Artificial Intelligence, New York, NY, USA, 2025; CSAI ’24, pp. 204–211. [Google Scholar] [CrossRef]
- Bijker, R.; Merkouris, S.S.; Dowling, N.A.; Rodda, S.N. ChatGPT for automated qualitative research: Content analysis. Journal of medical Internet research 2024, 26, e59050. [Google Scholar] [CrossRef]
- Altozano, A.; Minissi, M.E.; Gómez-Zaragozá, L.; Maddalon, L.; Alcañiz, M.; Marín-Morales, J. Enhancing Psychological Assessments with Open-Ended Questionnaires and Large Language Models: An ASD Case Study. IEEE Journal of Biomedical and Health Informatics 2025. [Google Scholar] [CrossRef]
- Wataoka, K.; Takahashi, T.; Ri, R. Self-preference bias in llm-as-a-judge. arXiv 2024, arXiv:2410.21819. [Google Scholar] [CrossRef]
- Krumdick, M.; Lovering, C.; Reddy, V.; Ebner, S.; Tanner, C. No free labels: Limitations of llm-as-a-judge without human grounding. arXiv 2025, arXiv:2503.05061. [Google Scholar]
- Wang, A.; Morgenstern, J.; Dickerson, J.P. Large language models that replace human participants can harmfully misportray and flatten identity groups. Nature Machine Intelligence 2025, 1–12. [Google Scholar] [CrossRef]
- Han, Z.; Battaglia, F.; Mansuria, K.; Heyman, Y.; Terlecky, S.R. Beyond text generation: assessing large language models’ ability to reason logically and follow strict rules. AI 2025, 6, 12. [Google Scholar] [CrossRef]
- Brown, T.; Mann, B.; Ryder, N.; Subbiah, M.; Kaplan, J.D.; Dhariwal, P.; Neelakantan, A.; Shyam, P.; Sastry, G.; Askell, A.; et al. Language models are few-shot learners. Advances in neural information processing systems 2020, 33, 1877–1901. [Google Scholar]
- Kim, S.; Moses, T. An investigation of the impact of misrouting under two-stage multistage testing: a simulation study. ETS Research Report Series 2014, 2014, 1–13. [Google Scholar] [CrossRef]
Figure 1.
Framework of the proposed methodology. (a) How a ceiling effect may arise in a survey on extreme psychological constructs. (b) A hybrid survey design combining multistage testing (MST) with open-ended items, augmented by LLM-based response interpretation and quantification.
Figure 1.
Framework of the proposed methodology. (a) How a ceiling effect may arise in a survey on extreme psychological constructs. (b) A hybrid survey design combining multistage testing (MST) with open-ended items, augmented by LLM-based response interpretation and quantification.
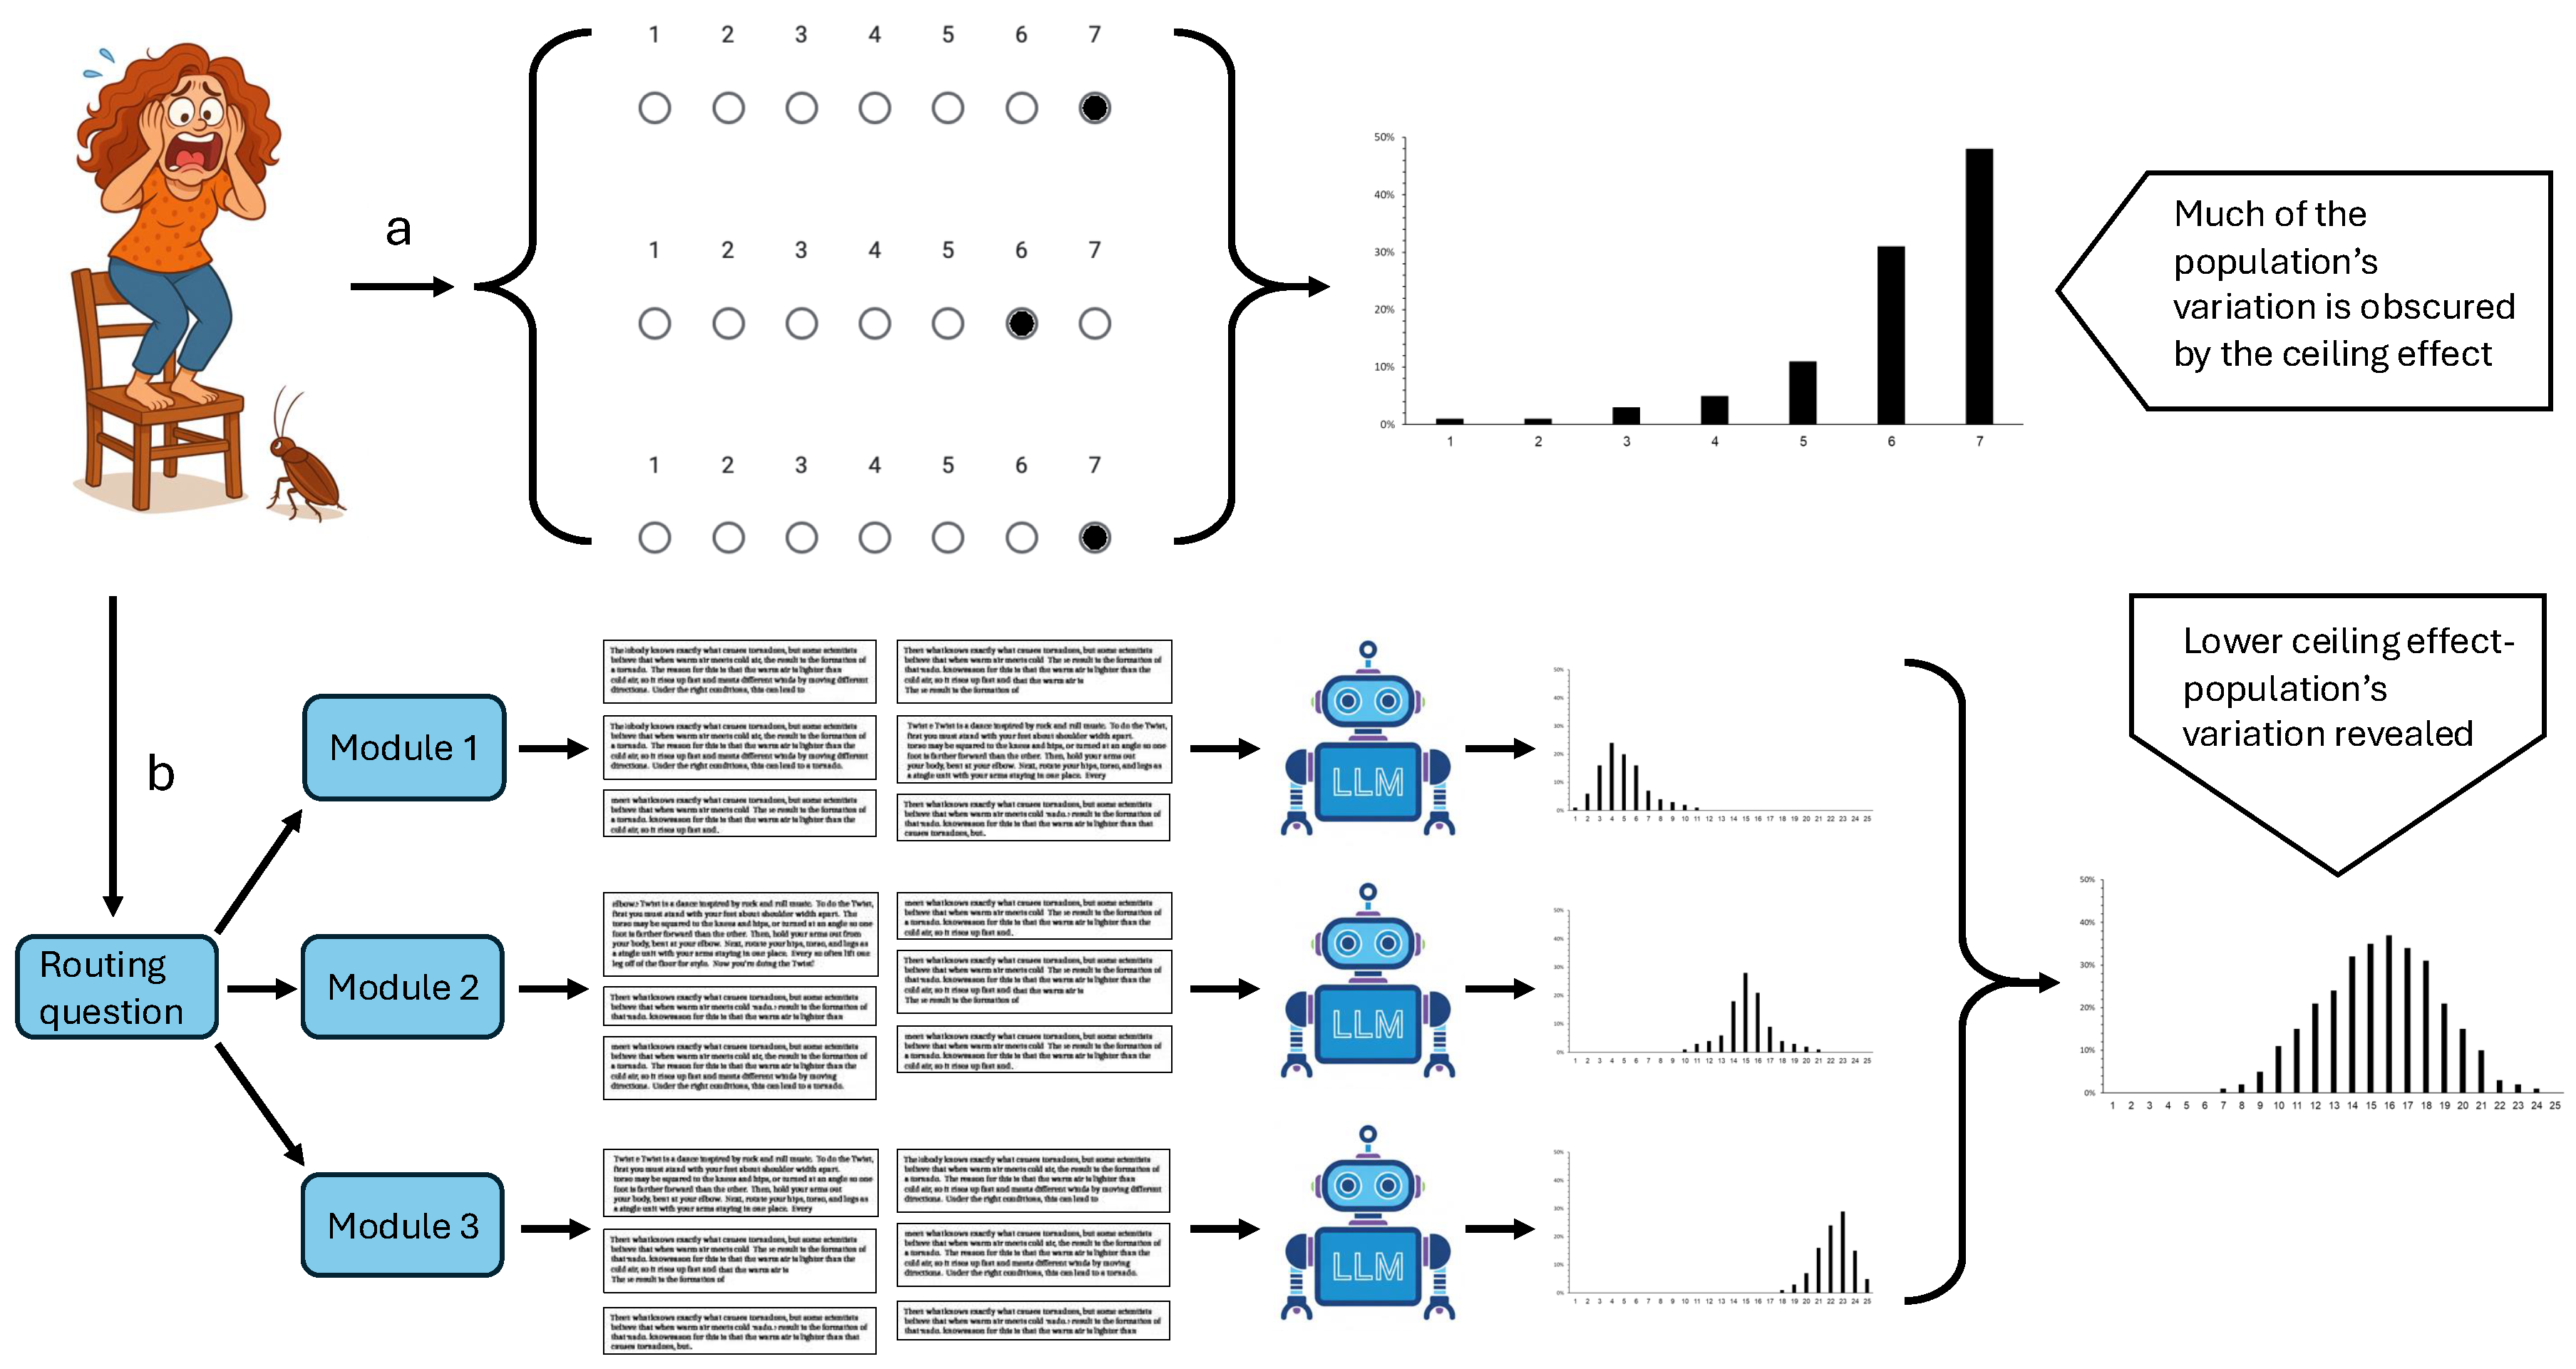
Figure 2.
Survey structure. Each module contains three pairs of questions, each designed to evoke a different level of the measured trait.
Figure 2.
Survey structure. Each module contains three pairs of questions, each designed to evoke a different level of the measured trait.
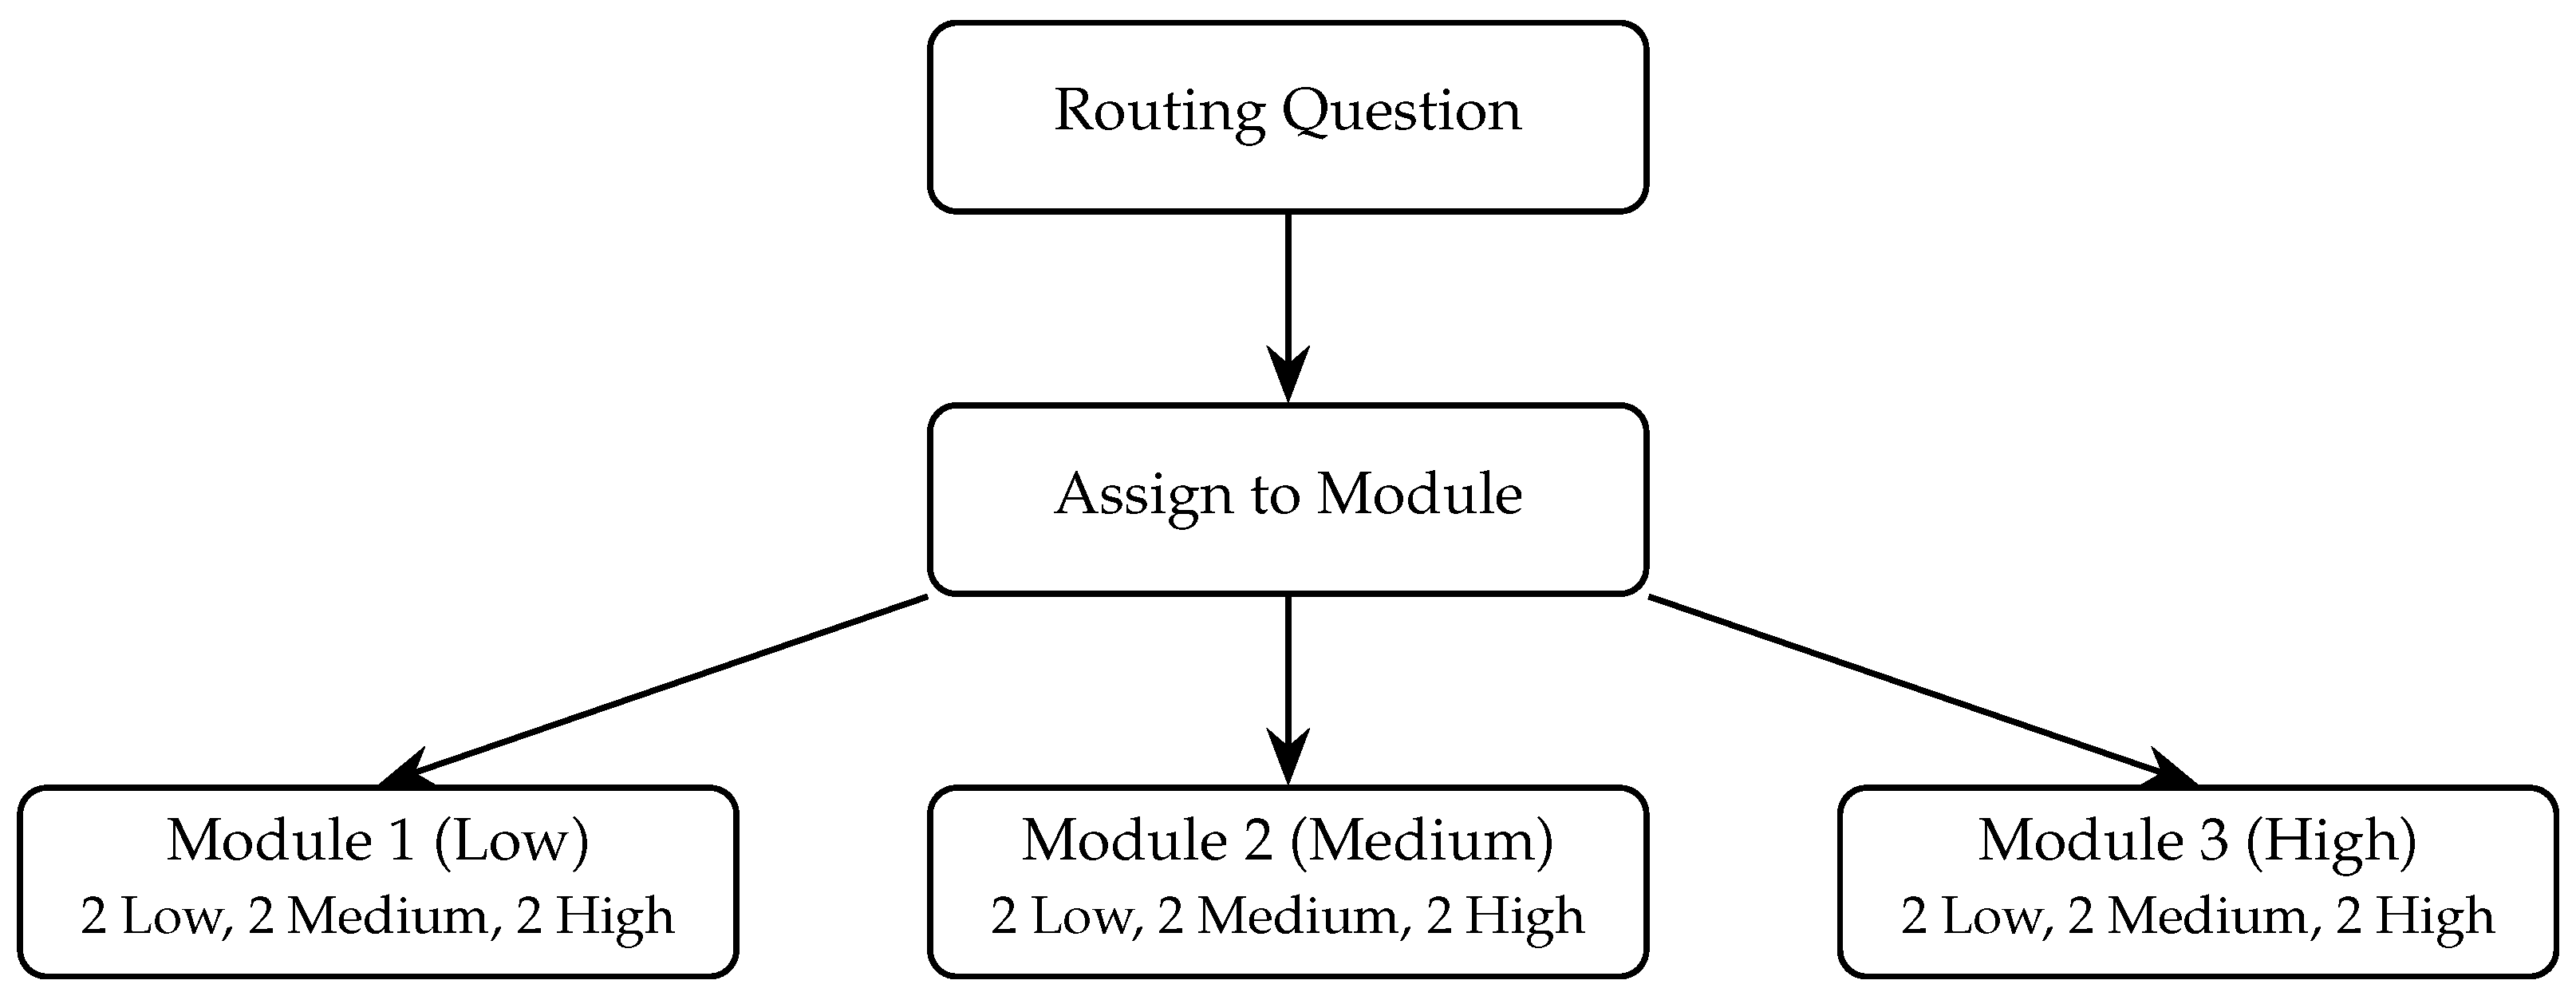
Figure 3.
Example output from the alt-test methodology.
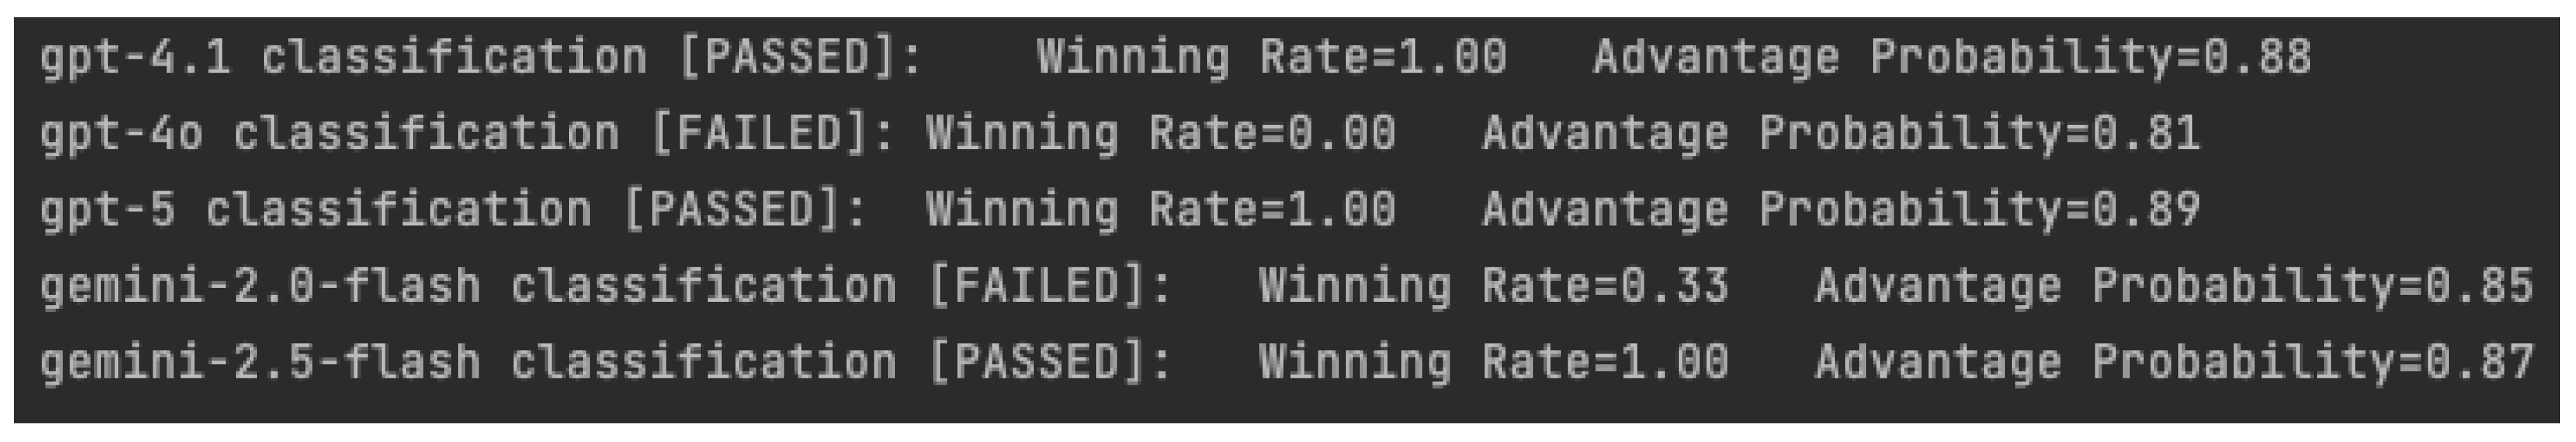
Figure 4.
Likert scale self ratings of cockroach aversion.
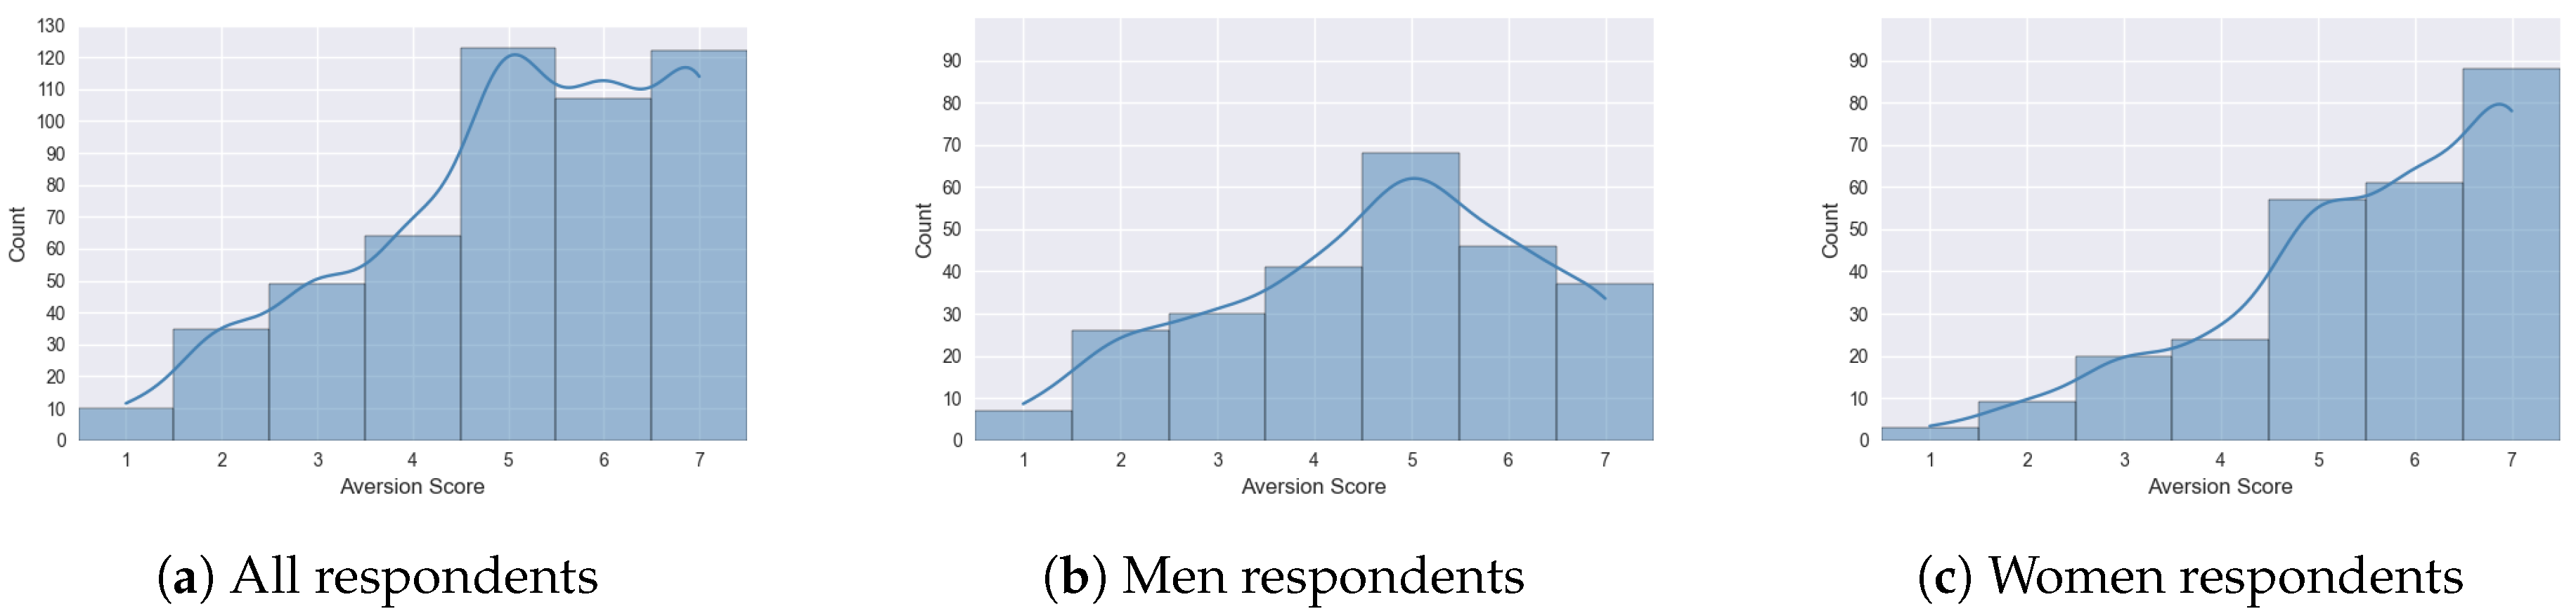
Figure 5.
Score distributions of cockroach aversion levels, based on LLM-analysis of textual responses to open-ended survey questions.
Figure 5.
Score distributions of cockroach aversion levels, based on LLM-analysis of textual responses to open-ended survey questions.
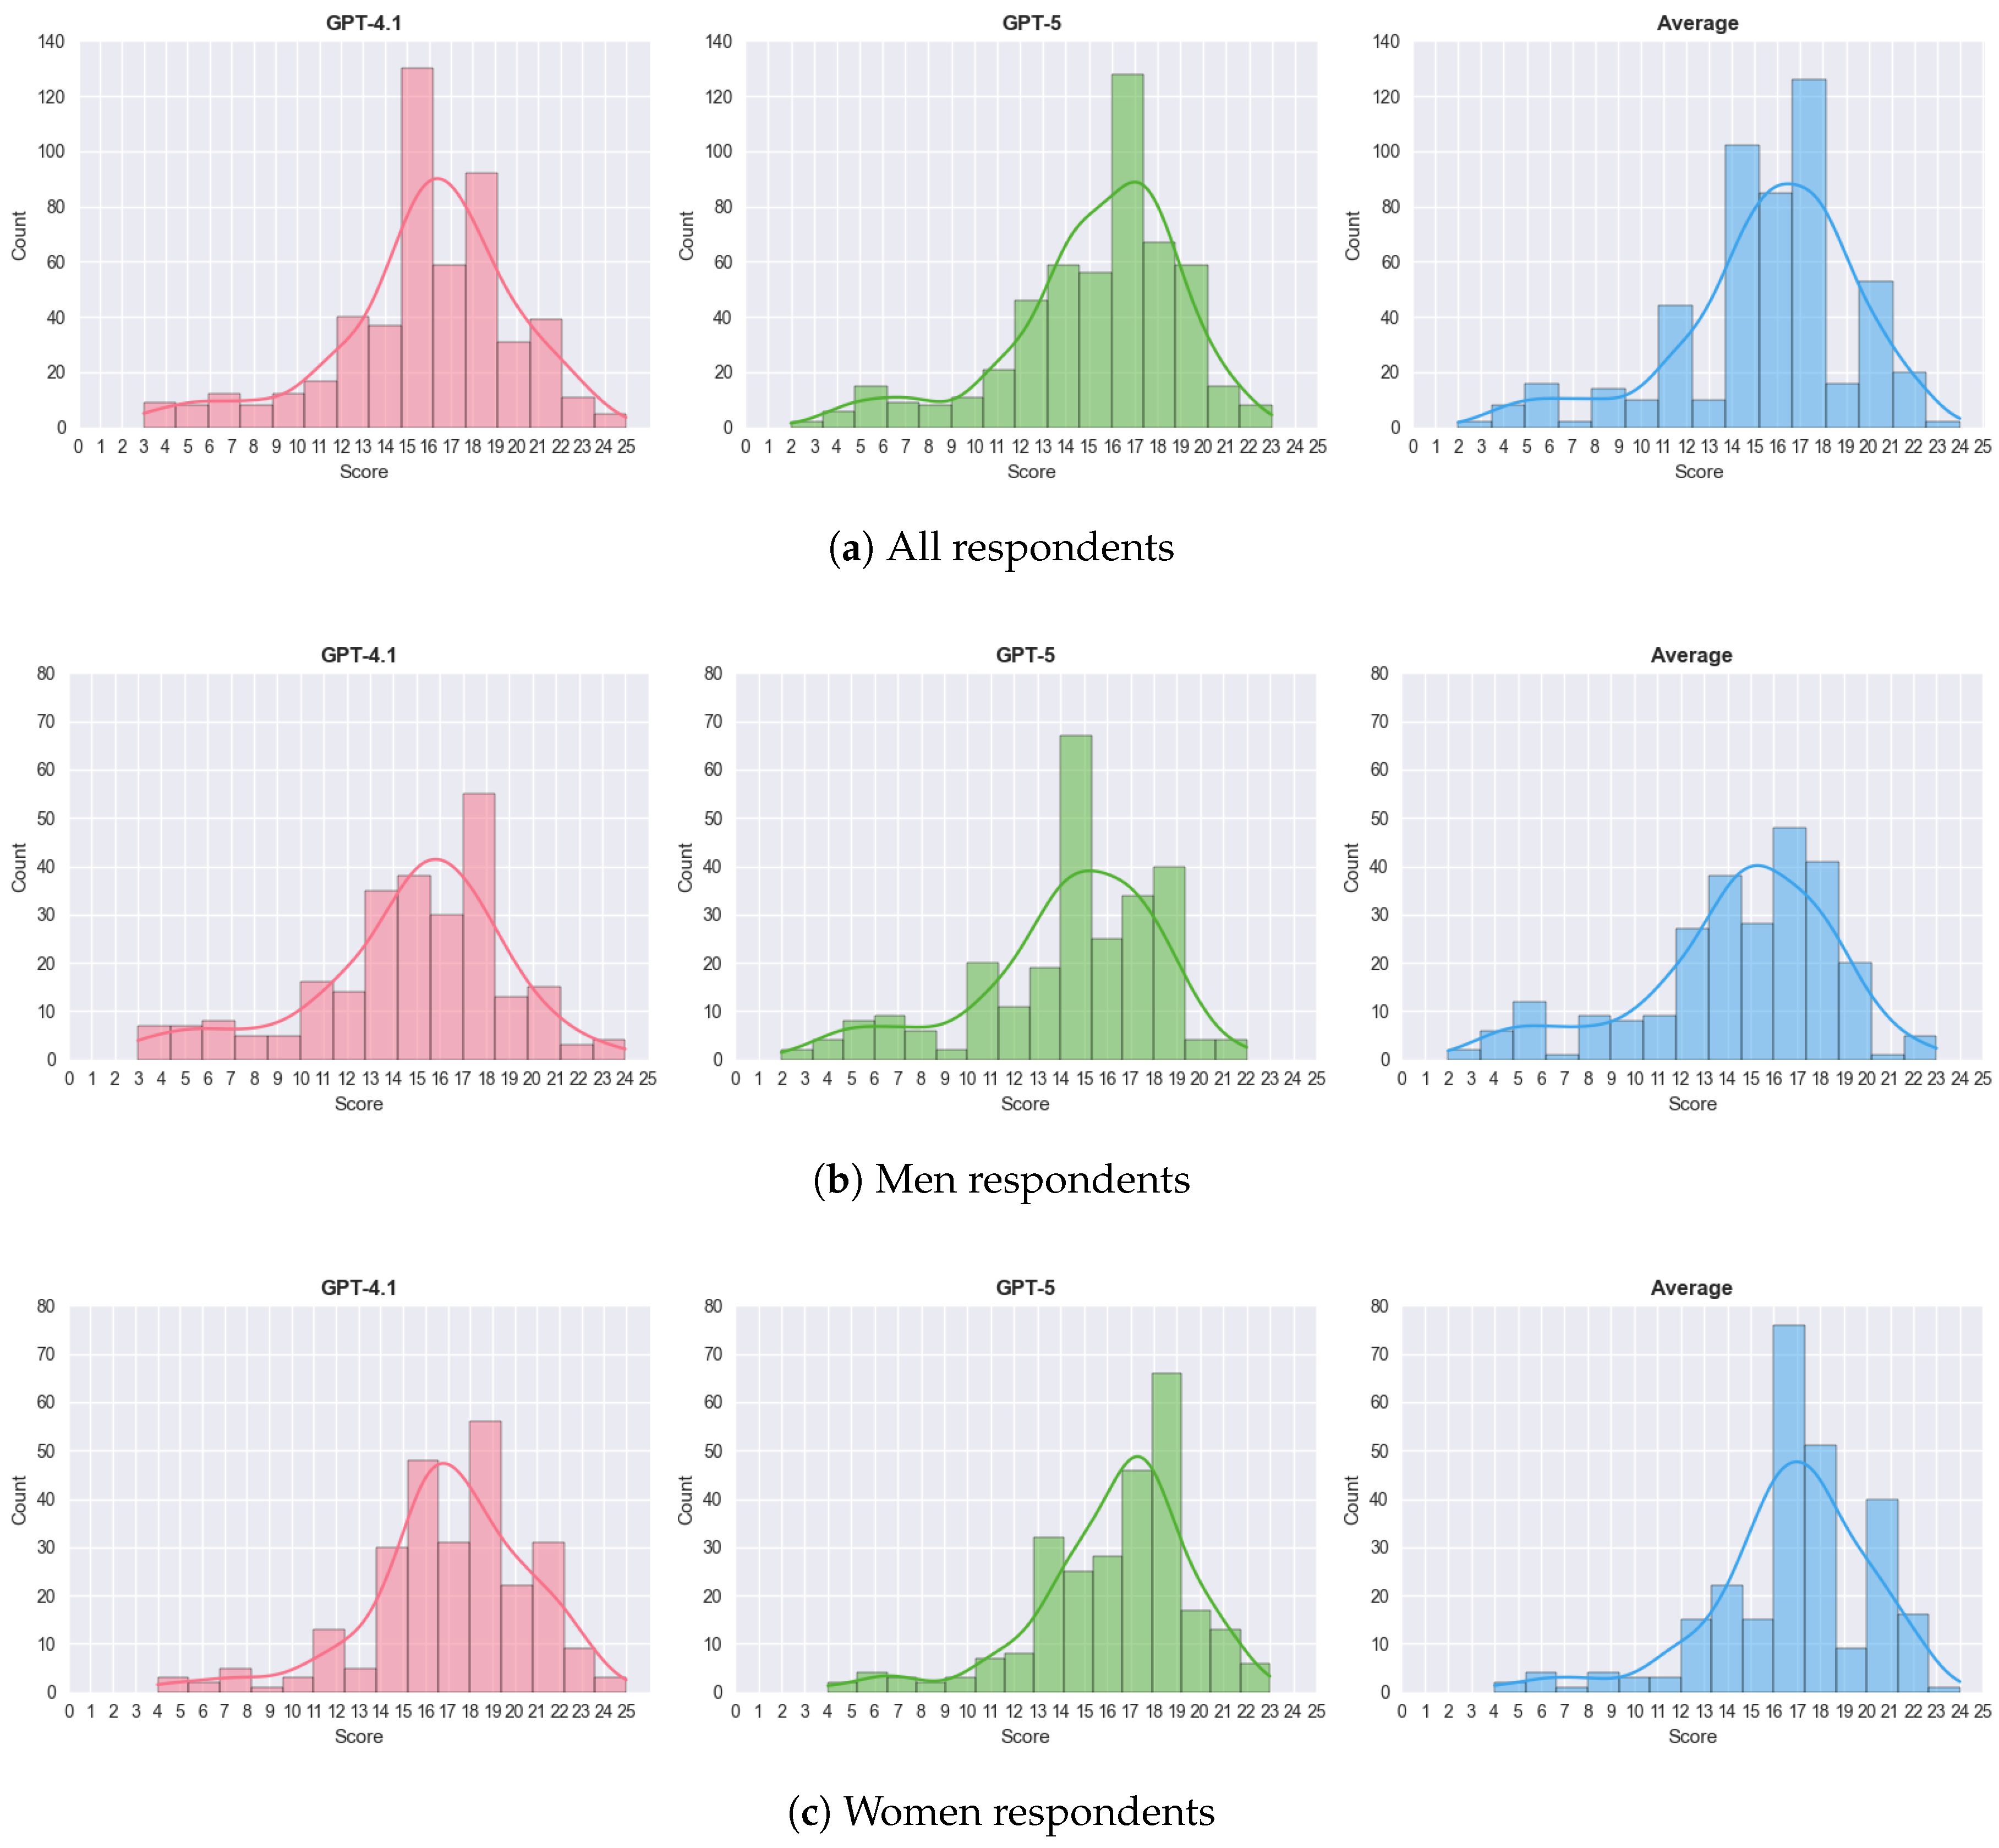

Table 1.
The topics of the open-ended questions used in the study. Each question presented a hypothetical scenario and then asked the participants to describe what they would think or do in such a situation. The topics are arranged by module and by the level of aversion each pair of questions was designed to invoke.
| Aversion level the questions were intended to invoke | Question # | Topics of the questions in module 1 | Topics of the questions in module 2 | Topics of the questions in module 3 |
|---|---|---|---|---|
| Low | 1, 2 | Seeing a live cockroach in a place where food is prepared | Being with a dead cockroach in an indoor space | Being exposed to symbolic representations of cockroaches |
| Medium | 3, 4 | Picking up or holding a live cockroach | Seeing live cockroaches outdoors | Hearing or reading about someone else’s encounter with cockroaches |
| High | 5, 6 | Ingesting a cockroach or food that came in contact with a cockroach | Being with a live cockroach in an indoor space | Looking at photography of cockroaches on a screen |
Table 2.
Agreement between LLMs and human judges. Cohen’s kappa is computed between each LLM and the majority vote of the human judges. Fleiss’ kappa includes all three human annotators and the LLM.
Table 2.
Agreement between LLMs and human judges. Cohen’s kappa is computed between each LLM and the majority vote of the human judges. Fleiss’ kappa includes all three human annotators and the LLM.
| LLM | Cohen’s kappa vs. majority vote | Fleiss’ kappa (all annotators) |
|---|---|---|
| GPT-4.1 | 0.750 | 0.782 |
| GPT-5 | 0.719 | 0.780 |
Table 3.
Counts of responses classified as “Irrelevant” or “Not Sure” by each LLM and jointly by both models.
Table 3.
Counts of responses classified as “Irrelevant” or “Not Sure” by each LLM and jointly by both models.
| LLM | Irrelevant | Not Sure |
|---|---|---|
| GPT-4.1 | 20 | 33 |
| GPT-5 | 13 | 63 |
| Both GPT-4.1 & GPT-5 | 12 | 16 |
Disclaimer/Publisher’s Note: The statements, opinions and data contained in all publications are solely those of the individual author(s) and contributor(s) and not of MDPI and/or the editor(s). MDPI and/or the editor(s) disclaim responsibility for any injury to people or property resulting from any ideas, methods, instructions or products referred to in the content. |
© 2026 by the authors. Licensee MDPI, Basel, Switzerland. This article is an open access article distributed under the terms and conditions of the Creative Commons Attribution (CC BY) license (http://creativecommons.org/licenses/by/4.0/).
Copyright: This open access article is published under a Creative Commons CC BY 4.0 license, which permit the free download, distribution, and reuse, provided that the author and preprint are cited in any reuse.


