
Submitted:
13 January 2026
Posted:
13 January 2026
You are already at the latest version
Abstract
Remote sensing inversion of water quality parameters is a critical interdisciplinary field integrating remote sensing technology, environmental science and water resources management, providing key technical support for precise water resources monitoring and ecological governance. To address the lack of comprehensive systematic reviews in this field, this study conducted a bibliometric-based narrative review, selecting 1058 valid English literatures published during 1995–2025 from the Web of Science Core Collection (WOSCC) and performing in-depth knowledge mapping analysis via CiteSpace software. The results showed that global research in this field has gone through three stages: initial exploration (1997–2009), slow growth (2010–2017) and rapid explosion (2018–2025). China ranks first in publication volume worldwide, with a collaborative research pattern dominated by core institutions including the Chinese Academy of Sciences, Wuhan University and the National Aeronautics and Space Administration (NASA). The core research hotspots focus on multi-source data fusion, AI-driven inversion model optimization, and the research shift from coastal to inland water bodies. Current research faces three key challenges: poor adaptability of multi-source data fusion technologies to water quality monitoring, inadequate integration of geospatial and thematic factors in inversion models and insufficient systematicness of inland water body research. Accordingly, future research should focus on strengthening inland water body studies, advancing remote sensing data fusion methods, and further optimizing water quality inversion models. This study clarifies the field’s development context and research characteristics, providing valuable references for subsequent academic exploration and practical applications in water resources management.
Keywords:
water quality parameters
; remote sensing inversion
; CiteSpace
; narrative review
; knowledge graph analysis
1. Introduction
As strategic resources for maintaining ecosystem balance and supporting the sustainable development of economy and society, water resources have always been a core component of the national water security guarantee system. Ensuring water quality and safety, as well as the rational utilization of water resources, has become a global consensus. 1993, the United Nations established the "World Water Day" to address the global water resources crisis, adopted resolutions to promote the protection and scientific management of water resources, and raise public awareness of water resource issues. Since 1994, China has designated March 22nd to 28th as "China Water Week", and has attached great importance to water resources management. Top-tier documents such as the State Council’s Regulations on Water Conservation and the National Development and Reform Commission’s Opinions on Further Strengthening Water Resources Management have clearly proposed the "Four Waters and Four Determinations" principle and the "Three Red Lines" institutional framework, elevating the protection and rational utilization of water resources to the national strategic level. Against this backdrop, the demand for precision and scientificity in water resources management has become increasingly urgent. As a core foundational link for grasping water body conditions and supporting water resources management, the technological upgrading of water quality monitoring has emerged as a key breakthrough point.
Currently, in response to the demand for precise and scientific water resources management, water resources research is moving towards an integrated direction of "refined dynamic monitoring - multi-factor coupling analysis - risk early warning and forecasting" [1,2,3]. Among these, the water resources monitoring system serves as the core support for water resources management, with its key breakthrough lying in refined dynamic water quality monitoring technologies. However, traditional monitoring methods are increasingly unable to meet the aforementioned monitoring requirements, manifested in two aspects: firstly, insufficient spatiotemporal coverage capability, as single-point sampling struggles to capture large-scale water quality change processes; secondly, imbalanced cost-effectiveness, as field sampling requires substantial human and material resources for cross-regional and large-scale water quality monitoring [4,5,6,7,8]. Therefore, the bottleneck of traditional monitoring methods has become prominent, and there is an urgent need for innovative technical means to promote the upgrading of the water quality monitoring system to adapt to the high standards of water resources management.
The emergence of remote sensing technology has provided a new path for breaking through the bottlenecks in water quality monitoring. Relying on the unique advantage of "air-space-ground coordinated observation", it can conduct large-scale, continuous and rapid observations of water bodies, acquire rich water spectral information, thereby spawning the efficient monitoring technology form of "remote sensing-based water quality monitoring" and bringing revolutionary breakthroughs and opportunities for the large-scale and precise development of water quality monitoring [9,10]. As an important technical extension of water quality monitoring, remote sensing-based water quality monitoring refers to the technical process of obtaining water spectral information through remote sensing technology to retrieve water quality parameters and monitor water quality conditions. It specifically includes links such as data collection (remote sensing data, ground measured data), data preprocessing, feature extraction, inversion model construction and parameter retrieval, accuracy verification, and result analysis and application [11,12]. With the development of remote sensing technology and the improvement of hyperspectral resolution, the types of data sources for remote sensing-based water quality monitoring have become increasingly abundant, and their application potential has been continuously released: Carpenter [13] successfully monitored water quality parameters of an entire lake by analyzing the correlation between measured water quality parameters from 21 sampling points and the spectra of Landsat Multispectral Scanner remote sensing images. With the development of remote sensing technology and hyperspectral refinement, the types of remote sensing data sources have been increasing. Yao [14] utilized the domestically developed Ziyuan-1 02E satellite, equipped with a new-generation hyperspectral camera (30 m spatial resolution/visible-shortwave infrared/166 bands), to successfully achieve quantitative research on chlorophyll-a concentration and transparency in Shahe Reservoir and Jinhai Lake in Beijing, China, fully demonstrating the important potential of domestic hyperspectral data sources in water quality remote sensing monitoring.
In the entire process of remote sensing-based water quality monitoring, remote sensing inversion of water quality is the core technical link, which directly determines the accuracy and reliability of water quality parameter acquisition and also serves as a key technical support for refined water resources management. Its principle is to establish a water quality inversion model by studying the relationship between measured water quality index concentrations and scattering signals (wavebands) from satellite/UAV sensors, repeatedly train the model to improve retrieval accuracy, and then infer the spatiotemporal distribution of water quality parameter concentrations across the entire study area [15,16,17]. Therefore, this paper will focus on the remote sensing retrieval of water quality parameters and conduct an in-depth study of the literature in this direction.
In recent years, the knowledge graph analysis method based on CiteSpace has become increasingly prominent and widely applied in the field of scientific research [18,19,20,21]. With its powerful data processing capabilities, CiteSpace can perform in-depth mining and detailed analysis of massive literature data, clearly present the knowledge structure of a specific research field, accurately depict the development context of the field, and vividly show the evolution of research hotspots over time. Thus, it provides researchers with a comprehensive and intuitive research perspective, helping them accurately grasp research trends.
Currently, research on the remote sensing inversion of water quality parameters is booming rapidly, yet a comprehensive and systematic review of this field is still lacking. Based on CiteSpace 6.3.R1 software (hereinafter referred to as CiteSpace), this study conducts an in-depth and systematic analysis of the latest research advances in the field of remote sensing inversion of water quality parameters. From the perspectives of annual publication output, national and institutional distribution, journal and reference co-citation, and keyword evolution, we systematically sort out the major research achievements, core research hotspots, evolutionary characteristics of research focus and overall development trends of this field, and focus on analyzing in depth the evolutionary trajectory of multi-source data fusion technology, the iterative progression of remote sensing inversion methods, as well as the variation characteristics of typical research areas, and further put forward targeted prospects for future research in this field. Through the systematic bibliometric analysis of relevant literature, this study accurately captures the cutting-edge research dynamics of the remote sensing inversion of water quality parameters, clarifies the core challenges faced by current research and the mainstream development trends in the future, and thus provides valuable references for subsequent studies on dynamic water quality monitoring.
2. Materials and Methods
2.1. Data Sources
The Web of Science Core Collection (WOSCC), developed by Clarivate Analytics, is a world-class academic citation database. Due to its comprehensive coverage of high-quality scholarly publications across various disciplines and reliable data integrity, it is widely recognized as one of the preferred data sources for bibliometric analysis [22]. In view of this, this study systematically analyzes the research progress in the field of remote sensing retrieval of water quality parameters based on literature retrieved from WOSCC.
The quality of literature retrieval largely affects the validity and accuracy of bibliometric analysis [23]. Focusing on the theme of remote sensing retrieval of water quality parameters, this study repeatedly calibrated the search terms and compared the retrieved results multiple times to verify their relevance to the research topic, thereby determining the final literature search strategy and content.
A topic-based search method was adopted, with the search formula set as TS=("Water quality") AND TS=(inversion OR retrieval) and the document types limited to research articles and reviews. The search was conducted for literature published in 1980 and later, resulting in the initial retrieval of 1,458 documents with publication dates ranging from 1981 to 2026.
Considering that the number of relevant retrieved literatures before 1997 is small (only 16 articles), while the literatures published in the past three decades (1997—2025) can more accurately reflect the publication evolution trend of this field, this study selected the literatures from 1997 to 2025 for in-depth analysis. After excluding duplicate literatures and those irrelevant to the research topic, 1055 valid English literatures were finally obtained.
2.2. Methods
This study employs CiteSpace as the research tool, integrating bibliometric analysis and knowledge graph methodology. Focusing on the publication output, national and institutional distribution, academic networks, and thematic evolution in the field of remote sensing retrieval of water quality parameters, it systematically analyzes the knowledge structure, hot topic dynamics, and development trends of the field through multi-dimensional quantitative and visual analysis, providing references for academic exploration and practical applications. The specific methods are as follows:
(1) National analysis. It is a quantitative research method focusing on the global geographical distribution of research and international cooperation patterns. Constructing a cooperation network with countries/regions of authors as units (node size corresponds to publication volume, and line thickness corresponds to cooperation intensity), it can present the "core-periphery" structure of global research, reveal international cooperation models and network structures, and identify research expertise and characteristic directions of different regions through dimensions such as publication volume ranking, cooperation intensity, betweenness centrality, and regional research thematic differences.
(2) Institutional analysis. It is a quantitative method for evaluating the research output, cooperation networks, and academic influence of scientific research institutions. After standardizing institutional names, a cooperation network is constructed (node size corresponds to publication volume, and line thickness corresponds to collaborative publication volume). Through dimensions including publication volume, citation frequency, cooperative network characteristics, and institution-thematic correlation, it can sort out the distribution of core research institutions in the field, reveal the collaborative ecology among institutions, clarify the research expertise of core institutions, and provide a basis for research cooperation docking.
(3) Co-cited journal analysis. It is a method to quantify the co-citation relationships between journals and analyze their academic influence and disciplinary correlation. Constructing a network based on the co-citation data of source journals, combined with dimensions such as citation frequency, betweenness centrality, disciplinary attributes, and network density, it can identify the core journal cluster in the field, reveal interdisciplinary integration trends, provide references for researchers in selecting submission journals, and identify the core carriers of knowledge dissemination in the field.
(4) Co-cited literature analysis. It is a method to analyze the academic inheritance and correlation intensity between literatures based on the co-citation relationship where "two literatures are simultaneously cited by the same subsequent literature". Constructing a co-citation network using reference lists as data sources (node size corresponds to citation frequency, and line thickness corresponds to co-citation intensity), it can identify foundational achievements and key technological breakthrough nodes in the field, sort out the evolutionary path of academic thoughts, and clarify the formation and transformation of research paradigms through dimensions such as citation frequency, betweenness centrality, and citation temporal characteristics.
(5) Keyword co-occurrence analysis. It is a method of constructing networks and conducting quantitative analysis based on the co-occurrence relationships of keywords in literatures. As a concise expression of the core content of literatures, keyword co-occurrence frequency and intensity directly reflect the correlation degree of research topics [24]. By constructing a network through statistical co-occurrence frequency (node size corresponds to keyword frequency, and line thickness corresponds to co-occurrence intensity), and combining dimensions such as frequency, betweenness centrality, and time-series evolution, it can effectively identify core hot topics in the field, reveal the correlation structure between themes, sort out the overall research pattern, and trace the evolution trajectory of hot topics [25].
(6) Keyword burst analysis. It is a frontier identification method that focuses on burst keywords with sharply increasing or decreasing frequencies within a specific time window to capture emerging trends in the field. Using the Burst Detection algorithm to calculate burst strength for quantifying the magnitude of frequency mutations, and dividing the life cycle of hot topics based on the start and end times of bursts, it can quickly lock in emerging research hotspots, predict potential research directions, and reveal the driving factors behind the rise of frontier issues [26].
(7) Keyword clustering analysis. It is a method to visually decompose the field’s knowledge structure by aggregating keywords with closely related semantics and similar research themes into several clusters using clustering algorithms such as Latent Semantic Indexing (LSI), Log-Likelihood Ratio (LLR), and Latent Semantic Analysis (LSA). The validity of clustering results is verified by two core indicators: ① Modularity Q (Q > 0.5 indicates significant cluster structure); ② Weighted Mean Silhouette S (S > 0.7 indicates reliable and efficient clustering). Combined with cluster size and labels, it can systematically sort out the knowledge branch system of the field, clarify the research focus and boundaries of each sub-field, and intuitively present the integrity and correlation of the knowledge structure [27].
3. Results
3.1. Global Publication Trend
The time span of the literature selected in this study was set from 1997 to 2025. The statistical results of annual publication volumes are shown in Figure 1. The trend of annual publication volumes in the field of remote sensing retrieval of water quality parameters can be clearly divided into three stages: the initial exploration stage (1997–2009), the slow growth stage (2010–2017), and the rapid explosion stage (2018–2025).
During the initial exploration stage, this field was still in the early embryonic period. The core technical system, including remote sensing retrieval algorithms and water quality monitoring data sources, had not yet taken shape. Academic attention and research investment remained limited, and the scale of publication volumes stayed at a low level for a long time.
In the slow growth stage, the average annual publication volume was 22. During this period, the gradual popularization of remote sensing technology and the continuous improvement of demand for water quality environmental monitoring drove a steady rise in research attention to this field, thus facilitating the initial expansion of relevant studies. However, constrained by technical maturity and application scenarios, the overall growth momentum remained relatively moderate.
The publication output during the rapid explosion stage showed a trend of explosive growth, with annual publication volumes exceeding 100 since 2021 and reaching 155 in 2025, which was mainly driven by multiple key factors. First, breakthroughs in core technologies, such as the introduction of artificial intelligence algorithms and the popularization of hyperspectral remote sensing and UAV monitoring data, provided strong support for the innovative development of the field. Second, the growing global attention to water quality environmental governance formed a robust policy-driven impetus. In addition, the increasingly prominent trend of interdisciplinary integration among remote sensing science, environmental science and computer science further boosted the upsurge of research. The growth momentum during this stage indicates that the field of remote sensing retrieval of water quality parameters has entered a period of high academic activity.
3.2. Analysis of Country and Region Distribution of Published Articles
From the publication volume distribution in Figure 2a, research in this field has spread across multiple countries, with variations in the level of participation among different nations, which demonstrates strong global research coverage. China ranks first with 570 publications, followed by the United States with 189 publications, and Italy comes in third with 47 publications. Additionally, six other countries: Germany, the United Kingdom, India, France, Australia, and Brazil have each published over 30 articles.
For the country collaboration network map in Figure 2b, it consists of 86 nodes and 117 connections, with a network density of 0.032, a modularity Q of 0.7118, and a weighted mean silhouette S of 0.9176. These metrics reflect that certain collaborative links have been established among countries in this field, presenting an international research interaction pattern involving diverse participants.
3.3. Analysis of Institutions Distribution of Published Articles
Based on data from the WOSCC database, 248 institutions (over 200) have published relevant research papers in the field of remote sensing inversion of water quality parameters. Figure 4a focuses on institutions with more than 15 publications. Among them, the Chinese Academy of Sciences, Wuhan University, National Aeronautics and Space Administration (NASA), Consiglio Nazionale delle Ricerche (CNR), Nanjing Normal University, and Centre National de la Recherche Scientifique (CNRS) are all top publishing institutions in this field.
Figure 3.
Analysis of the institutional distribution of global publications in the field of remote sensing inversion of water quality parameters: (a) Top 15 institutions by publication volume; (b) Network visualization map.
Figure 3.
Analysis of the institutional distribution of global publications in the field of remote sensing inversion of water quality parameters: (a) Top 15 institutions by publication volume; (b) Network visualization map.
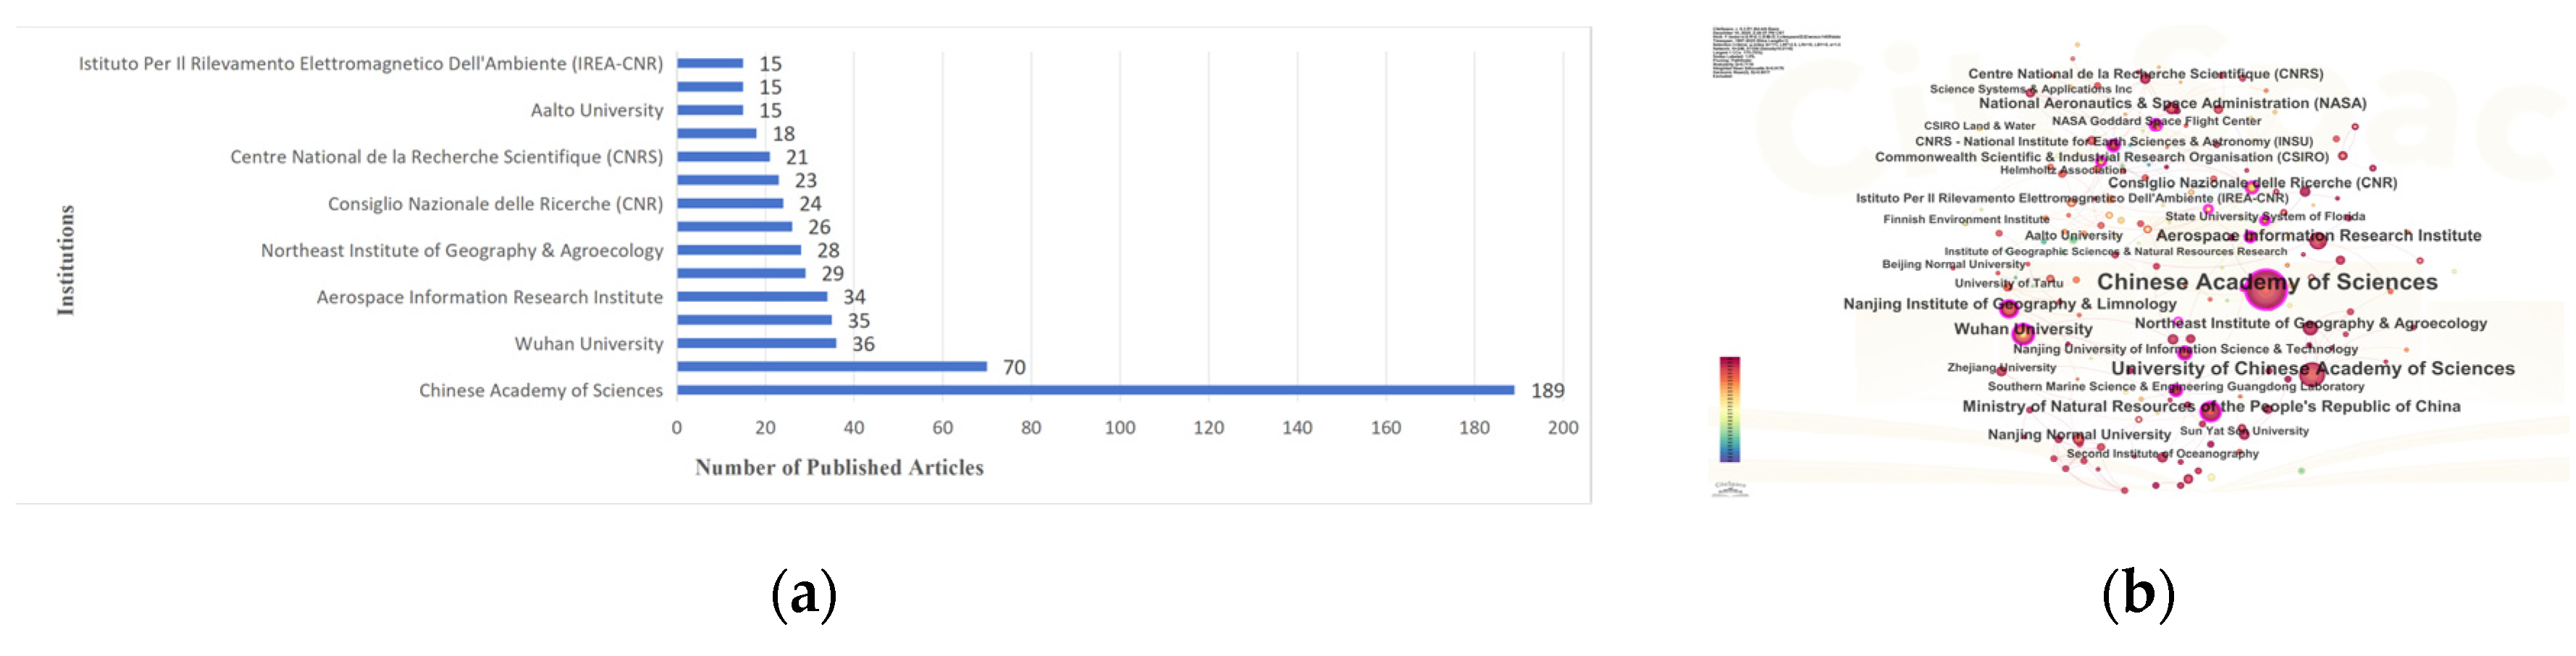
Figure 4.
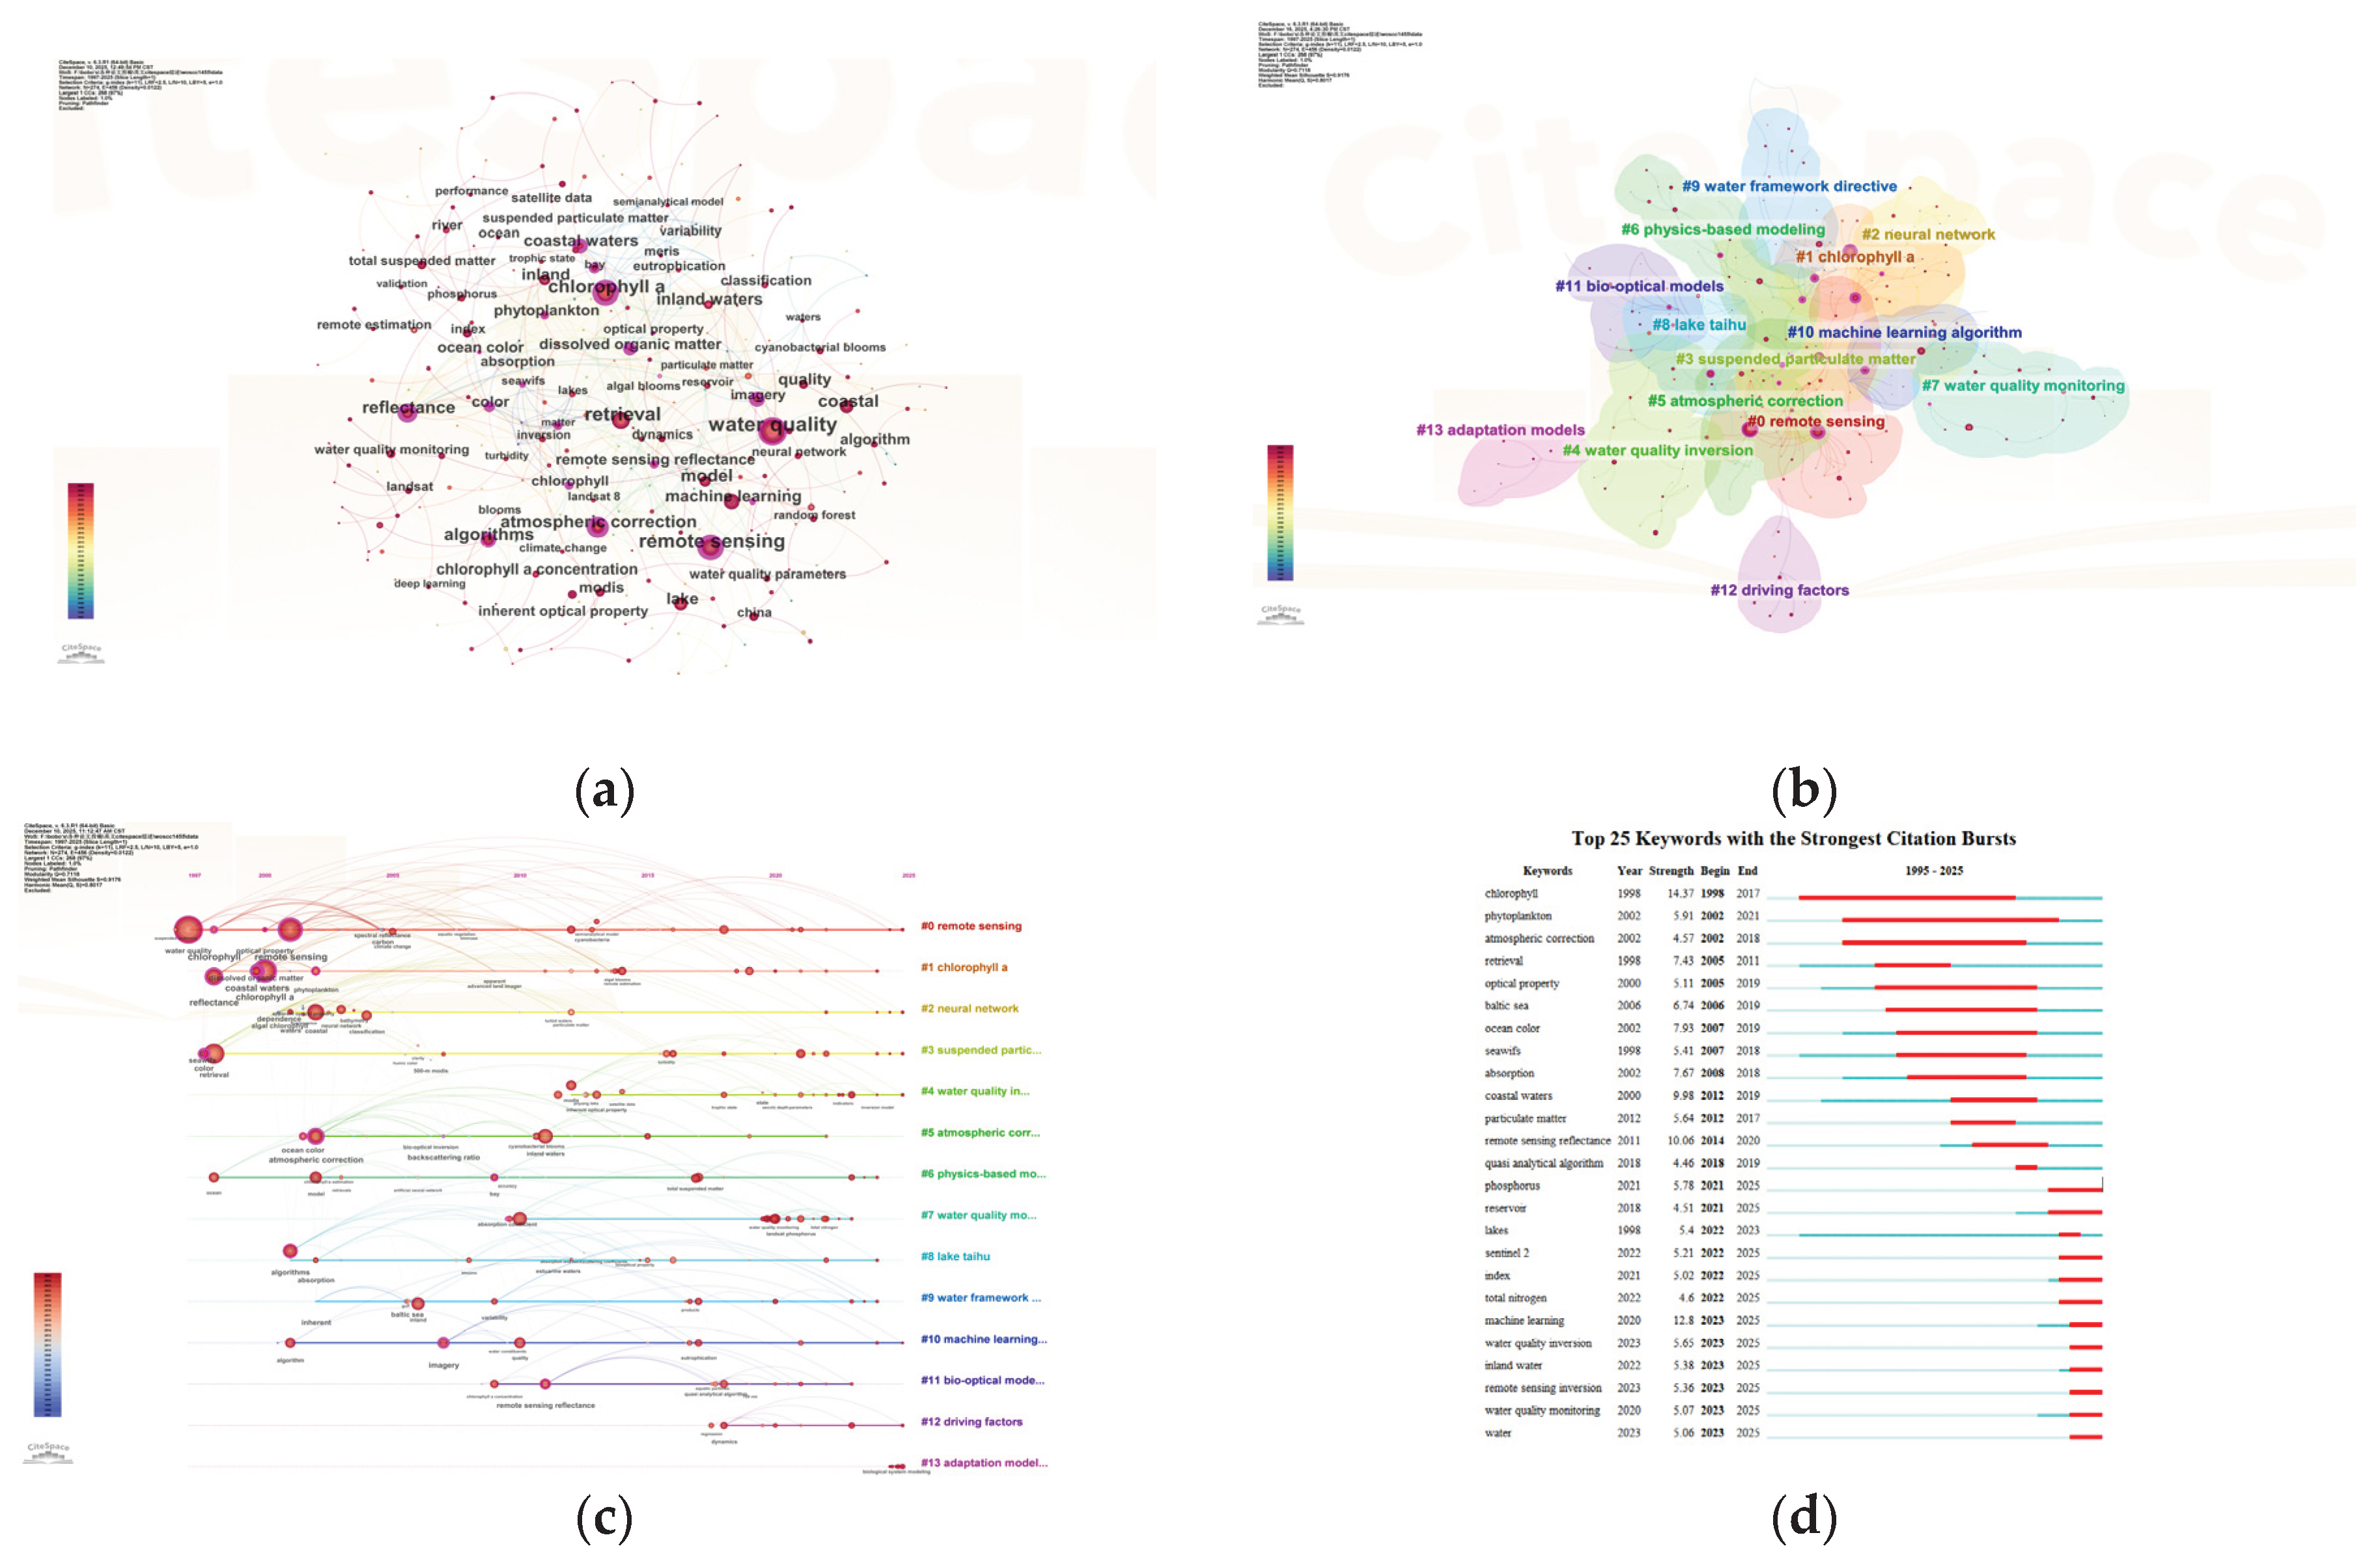
Analysis of the keyword distribution of global publications in the field of remote sensing inversion of water quality parameters: (a) Keyword co-occurrence map; (b) Keyword clustering map; (c) Keyword timeline map; (d) Keyword burst map.
Figure 4.
Analysis of the keyword distribution of global publications in the field of remote sensing inversion of water quality parameters: (a) Keyword co-occurrence map; (b) Keyword clustering map; (c) Keyword timeline map; (d) Keyword burst map.
The institutional collaboration map corresponding to Figure 4b consists of 248 nodes and 354 connections, with a network density of 0.0116, a modularity Q of 0.7118, and a weighted mean silhouette S of 0.9176. This map visually depicts the collaboration network among institutions: the denser or thicker the connections between nodes, the stronger the collaborative ties between the corresponding institutions. This feature also reflects that research in the field of remote sensing inversion of water quality parameters not only relies on the leading role of core institutions, but also forms an interactive pattern of multi-institutional collaborative participation.
3.4. Analysis of Co-Cited Journals
A co-cited journal map is a valuable tool for researchers, enabling them to evaluate the influence and status of different journals [28]. As shown in Table 1, in terms of the number of publications, the academic journals Remote Sensing of Environment, International Journal of Remote Sensing, and Remote Sensing have relatively high publication volumes, with 928, 780, and 738 articles respectively. It is demonstrated that these three international journals enjoy a high standing in the field of remote sensing inversion of water quality parameters. In addition, the journals Science of the Total Environment, Limnology and Oceanography, and IEEE Transactions on Geoscience and Remote Sensing have a relatively high degree of centrality, at 0.34, 0.2, and 0.12 respectively.
3.5. Analysis of Co-Cited Literature Network
Within the framework of co-citation literature network analysis, literature continuously cited at a high frequency is usually defined as classic literature in this field. This characteristic can not only clearly reflect the development context of the field of remote sensing inversion of water quality parameters, but also reveal the core research foundation of this field. Table 2 lists the top 10 research papers ranked by co-citation frequency, and also indicates the number of citations of each paper in the WOS database. From the perspective of the title characteristics of these 10 papers, studies focusing on chlorophyll inversion account for a relatively prominent proportion; in addition, papers conducting analysis based on Sentinel-2 satellite data also make up a considerable proportion. Pahlevan proposed the Mixture Density Network machine learning model, relying on Sentinel-2 and Sentinel-3 satellite data, and successfully achieved the seamless retrieval of chlorophyll-a concentration in inland and coastal waters [29]. Cao proposed the Extreme Gradient Boosting Tree machine learning algorithm. Using Landsat-8 OLI data and the SeaBASS dataset, he conducted chlorophyll-a retrieval research for lakes in eastern China, demonstrating that the algorithm outperforms random forest and band ratio algorithms. He further applied this model to reveal the spatiotemporal distribution characteristics of chlorophyll-a in hundreds of lakes in eastern China from 2013 to 2018 [30].
3.6. Analysis of Keywords Distribution of Published Articles
Keyword analysis is an important method for identifying research hotspots in a field. With the help of CiteSpace, this study constructed a keyword co-occurrence visualization map for the field of remote sensing inversion of water quality parameters from 1997 to 2025, using a 1-year time slice (see Figure 4a). Table 3 presents the top 15 high-frequency keywords in this field. Research hotspots are jointly determined by the frequency and centrality of keywords. Therefore, based on a comprehensive analysis of these two indicators, the core hot keywords in this field include: water quality, remote sensing, chlorophyll a, atmospheric correction, reflectance, algorithms, coastal waters, and machine learning. The above analysis shows that the research thread of remote sensing inversion of water quality parameters is clear and definite, with remote sensing technology serving as the core means for conducting water quality parameter inversion research. The research focuses on two major aspects: first, the remote sensing data preprocessing link centered on atmospheric correction and reflectance calculation, and the inversion method construction link focused on algorithm optimization; second, the monitoring and analysis of key water quality parameters, with chlorophyll a as a typical representative. Meanwhile, coastal waters act as the main application scenario, highlighting the close integration between research in this field and practical water quality monitoring needs.
To further clarify the thematic structure and evolutionary context of the field, this study conducted an in-depth investigation by combining the keyword clustering analysis results in Figure 4b and the clustering labels in Table 4, supplemented by the cluster timeline map in Figure 4c. The modularity Q value of this clustering is 0.7118, which is higher than the critical value of 0.5, indicating an excellent clustering structure division effect. The mean silhouette value S is 0.9176, exceeding the standard threshold of 0.7, which confirms the high confidence level of the clustering results and provides a reliable basis for the analysis conclusions. The network is clustered into 14 research themes in total, with the corresponding clustering labels listed in Table 4. The cluster numbers range from #0 to #13, where a smaller number indicates a larger quantity of keywords contained in the cluster. From the perspective of connection relationships, most keyword connections are concentrated within clusters, while clusters such as #0, #5, #3, and #1 have numerous cross-cluster connections. This indicates that these research directions are highly similar in terms of thematic scope, with high co-citation frequencies in the field, thus showing strong correlation in the field of remote sensing inversion of water quality parameters. In the cluster timeline map, the color of each growth ring corresponds to the citation time interval, and the thickness of the growth ring is positively correlated with the citation frequency in the corresponding period. Further analysis based on this characteristic reveals that Cluster #0 represents the core research direction of the field, covering remote sensing and its sub-directions such as data models and optical sensors. It has been continuously active since the initial stage of research, confirming that remote sensing technology is the core supporting foundation of this field. Cluster #5 focuses on preprocessing content in the early stage of inversion and ceased to be active around 2021, indicating that the technical system of this direction has become relatively mature, and the attention of subsequent research has gradually decreased. Cluster #13 centers on the optimization of inversion algorithms such as transfer learning and porcupine optimizer, emerging around 2025, and it is a new research hotspot in the current field.
The keyword burst detection map (see Figure 4d) reveals the burst dynamics of 25 keywords from 1997 to 2025. The concentrated emergence of such keywords usually corresponds to a period of rising attention in the field driven by changes in research trends or technological breakthroughs. Among them, the burst strengths of "chlorophyll", "remote sensing reflectance", and "machine learning" all exceed 10, indicating that these directions have experienced explosive growth in attention. In particular, the burst duration of "chlorophyll" is as long as 10 years, entering a period of explosive research starting from 1998. This result shows that as a core indicator of water quality parameters, the remote sensing inversion research of chlorophyll has a long-term core position in this field and is a sustainable research hotspot formed in the early stage. In addition, the burst strength of "coastal waters" reaches 9.98, and the academic community has begun to focus on this topic with emphasis starting in 2012. This reflects that the demand for water quality monitoring in coastal waters increased significantly after 2012, driving the rapid development of remote sensing inversion research in this scenario. Among the burst keywords in the past two years, the strength of "inland water" also reaches 5.38, which means that the research scenario is expanding from coastal areas to inland waters, embodying the continuous expansion of the application scope of the field.
4. Discussion
This study conducted a bibliometric analysis of existing research in the field of remote sensing inversion of water quality parameters by CiteSpace, focusing on an in-depth analysis of the following key issues: Which countries and research institutions have ranked among the top in research activity in this field? What are the most influential journals in the field? What constitutes the classic research outputs of remote sensing inversion of water quality parameters? What characteristics are presented in the mainstream research topics and development trends of this field over the past three decades?
Given the long cycle of data collection and collation, as well as the inevitable time lag in the academic dissemination of new research findings, bibliometric analysis can effectively identify the long-term research hotspots and evolutionary trends in this field, yet it is unable to cover innovative emerging research directions in a real-time and comprehensive manner. Based on this, combined with the results of keyword co-occurrence, clustering and burst detection derived from CiteSpace analysis, this study systematically reviewed the relevant research papers recently published in this field, and the core evolutionary directions of the remote sensing inversion of water quality parameters field in recent years can be summarized into three dimensions: the transition of data sources, the iteration of inversion models, and the shift of typical research areas.
4.1. Transition of Remote Sensing Data Sources
As the most widely used remote sensing data in monitoring applications, multispectral images have been employed by scholars at home and abroad to conduct extensive research on water quality parameter retrieval. Common multispectral remote sensing data for water quality monitoring include Landsat series satellite data, Sentinel satellite data, as well as domestic Gaofen (GF) series satellite data and Ziyuan-1 02C satellite data [31,32]. Due to resolution limitations, multispectral remote sensing water quality retrieval models are mainly constructed using empirical methods, making them more suitable for specific periods or water bodies. Hyperspectral satellite remote sensing data are acquired by hyperspectral sensors mounted on satellites, featuring high resolution and large data volume. They can capture continuous surface feature spectral information and provide more refined remote sensing data. Typical hyperspectral data include Hyperion data from the United States (the world’s first satellite-borne hyperspectral sensor satellite), Compact Airborne Spectrographic Imager/Shortwave infrared Airborne Spectrographic Imager (CASI/SASI) sensors from Canada, and HyperSpectral Imager (HSI) data from China’s HJ-1A satellite, all of which have been applied in water quality retrieval research [33]. With high spectral resolution and abundant data bands, hyperspectral data overcome the shortcomings of previous remote sensing data in spectral resolution, enabling the accurate and optimal selection of water quality retrieval methods and distinguishing spectral mixing differences in multispectral data. This significantly improves the accuracy of water quality parameter retrieval and demonstrates excellent application potential [34].
In recent years, high spatial resolution remote sensing data such as various airborne remote sensing data and ground-measured spectral data have been widely used. With the rapid development of UAV technology, lightweight UAV systems equipped with multispectral cameras, hyperspectrometers, infrared sensors, and lidar have emerged. High-resolution data acquired by these airborne systems show significant improvements in imaging timeliness and quality, gradually becoming an important data source for remote sensing monitoring of water quality in small water bodies [35]. Typical UAV-borne sensors include Airborne Visible InfraRed Imaging Spectrometer (AVIRIS) from the United States, CASI from Canada, and Pushbroom Hyperspectral Imager (PHI) from China. In addition to airborne spectrometers, portable spectrometers have also played a certain role in water quality monitoring due to their convenience and flexibility. In general, non-satellite spectral remote sensing data offer advantages of higher spectral and spatial resolution, and can continuously and accurately depict the spectral curves of surface features. Compared with satellite data, non-satellite remote sensing data are less affected by atmospheric interference but have higher data acquisition costs and smaller coverage, resulting in relatively insufficient comprehensive observation capabilities.
Each type of remote sensing data has more or less limitations in depicting or expressing surface feature characteristics, and it is difficult for a single data source to meet the needs of water quality remote sensing monitoring in most study areas. Therefore, some scholars have recently begun to attempt fusing remote sensing data from different sources for water quality monitoring [36]. Data fusion can yield more accurate and abundant information than any single data source, thereby providing more reliable basic data for water quality parameter retrieval and monitoring. Feng [37] used GF-1 WFV data (with a short revisit cycle and high spatial resolution) and Landsat 8 OLI data (with high spectral resolution) to explore the optimal combination method for collaborative retrieval of WFV and OLI data, aiming to improve retrieval accuracy. Dona [38], Essam [39], and other scholars have attempted to obtain water quality parameters by integrating satellite remote sensing data fusion and artificial intelligence methods, using this approach to address several issues in inland water quality retrieval. The information pertaining to different types of remote sensing data is compared in Table 5.
4.2. Iteration of Remote Sensing Retrieval Methods
Traditional water quality retrieval methods are roughly classified into three categories: analytical models, empirical models, and semi-empirical models. Analytical models are constructed based on physical principles, featuring strong theoretical foundations and the ability to deeply elaborate the intrinsic relationships between water quality parameters and measurable variables such as spectra. However, they often require numerous assumptions and simplifications, and exhibit poor adaptability to complex water environments. Empirical models rely on the empirical relationships between water quality parameters measured synchronously in situ and remote sensing reflectance, offering relatively simple operation and the ability to quickly obtain results when data are sufficient and water bodies are relatively stable. Nevertheless, their universality is low, and differences in water body characteristics across different regions may easily render the models ineffective. Although semi-empirical models integrate certain advantages of both analytical and empirical models—considering physical mechanisms to a certain extent while optimizing model parameters using measured data—they still suffer from drawbacks such as complex model construction, high requirements for data volume and quality, and difficulty in accurately reflecting the complex and variable characteristics of water quality. Therefore, traditional water quality retrieval methods demonstrate obvious limitations in terms of accuracy, universality, and efficiency when addressing the monitoring needs of modern complex water environments [40,41]. Yuan [42] established regression models between chlorophyll-a, total phosphorus (TP), and total nitrogen (TN) using Landsat 8 data, and the final results indicated that the binomial algorithm performed optimally. Xu [43] constructed linear regression models to retrieve the concentrations of inorganic nitrogen and dissolved inorganic phosphorus using Beijing-1 multispectral images and data from 60 sampling points near the Sheyang Estuary. The results showed that the cubic polynomial model achieved high retrieval accuracy.
In recent years, artificial intelligence (AI) algorithms have been extensively applied in water quality parameter retrieval. Compared with the aforementioned traditional empirical algorithms, AI algorithms possess powerful nonlinear fitting capabilities and robustness, enabling them to effectively cope with complex and diverse background effects from water surfaces, combinations of water quality parameters and sediments, and explore implicit relationships to improve retrieval accuracy. Commonly used AI algorithms for water quality retrieval include convolutional neural networks (CNN) [44,45], support vector regression (SVR) [46,47], and random forest regression (RF) [48,49]. In addition, Extreme Gradient Boosting (XGBoost) regression and Categorical Boosting (CatBoost) regression have been increasingly applied in water quality retrieval. XGBoost integrates regularization techniques to control model complexity and exhibits considerable capabilities in handling missing values and feature engineering. CatBoost is specifically designed to process categorical features and automatically performs feature transformation without the need for additional preprocessing steps, which gives it advantages in certain fields [50,51]. A comparison of different remote sensing inversion methods is presented in Table 6. Pang [52] established four mathematical statistical models and an XGBoost model to retrieve water ammonia nitrogen concentrations using three phases of UAV multispectral image data. Comparative experiments showed that the XGBoost model outperformed the mathematical statistical models, demonstrating strong fitting ability and high prediction accuracy, with the retrieval accuracy (R²) of ammonia nitrogen in all three phases exceeding 0.84. Wang [53] proposed a remote sensing retrieval model for nitrate and phosphate concentrations using backpropagation neural networks (BPNN) in the coastal waters of the East China Sea. The retrieval accuracies (R²) of nitrate and phosphate concentrations were 0.98 and 0.83, respectively. Yu [54] developed a stacked random forest (SRF) model for surface seawater nitrate (SSN) using MODIS data as the data source and the central and southern regions of the California Current System as the study area to simulate the relationship between SSN and relevant environmental parameters. The retrieval accuracy (R²) of this model was 0.87.
4.3. Shift of Typical Research Areas
Based on the burst detection results of keywords and systematic combing of relevant literature, it can be found that in 2012, the typical research areas in this field focused on coastal waters, with the research core centered on the exploration of water color characteristics in coastal waters. The research scope mainly covered typical coastal bay waters including Shenzhen Bay, the Pearl River Estuary, Hangzhou Bay, Chesapeake Bay in the United States, the coastal waters of the Baltic Sea, and Moreton Bay in Australia. Whereas inland waters have exhibited a prominent burst characteristic since 2022, which indicates a sharp surge in research achievements related to inland waters. This shift in the focus of research areas is the combined effect of policy guidance, technological breakthroughs, practical demands and disciplinary development. Specifically, the national-level policies that continuously strengthen the protection of inland aquatic ecology have provided directional guidance for the research on inland water bodies; technological innovations in hyperspectral remote sensing, UAV monitoring and machine learning algorithms have broken through the technical bottlenecks caused by the complex optical characteristics and high inversion difficulty of inland water bodies; the increasingly prominent ecological problems such as eutrophication and nitrogen and phosphorus pollution in inland rivers, lakes and reservoirs have spawned the demands for large-scale and high-precision monitoring research; meanwhile, a mature theoretical and methodological system has been formed in the research on water quality monitoring of coastal waters, which has prompted scholars to gradually turn to inland water bodies as an important research gap and hot spot in this field.
Reflecting this shift in research focus, relevant research practices in both coastal and inland waters are illustrated through typical case studies below: Zhao [64] conducted transparency inversion in research areas including Lake Chagan. They monitored the spatio-temporal pattern changes of water transparency in Lake Chagan over a long time scale via remote sensing, and further analyzed the variation characteristics and regularities of water transparency. Chen [65] used Sentinel-2 satellite images to invert the water quality indicators of Lake Gaoyou, and obtained the spatio-temporal distribution characteristics of chlorophyll-a (Chl-a) and total suspended solids in the lake. Taking Taihu Lake and its surrounding rivers as the research area, Lin [66] constructed a remote sensing inversion model for permanganate index (CODMn) concentrations in Taihu Lake and adjacent rivers based on Sentinel-2 multispectral images and synchronous in-situ CODMn data, by adopting multiple linear regression and machine learning methods. This study demonstrated the feasibility of remote sensing inversion for CODMn, a non-optically active water quality parameter. Based on MODIS satellite data and 4038 sets of in-situ measured data, Zhu [67] inverted the water quality of coastal waters in the northern South China Sea using machine learning methods such as Classification and Regression Tree and XGBoost, and the results indicated that the XGBoost algorithm yielded the optimal performance.
5. Conclusions
5.1. Summary of Knowledge Graph Analysis Results Based on CiteSpace
As revealed by the bibliometric analysis via CiteSpace, research on the remote sensing inversion of water quality parameters has exhibited distinct interdisciplinary characteristics over the past three decades, yielding fruitful outcomes that integrate academic research with practical applications. The annual publication output of this field has gone through three prominent stages: the initial exploration stage (1997–2009), the slow growth stage (2010–2017), and the rapid explosion stage (2018–2025). The annual number of publications has exceeded 100 since 2021 and reached 155 in 2025. This vigorous development of the field can be attributed to technological breakthroughs, policy-driven impetus and interdisciplinary integration. In light of the current trend, the field is set to embrace an even more thriving development.
In the global ranking of publications by country, China ranks first, followed by the United States and Italy, with research coverage extending across the globe. Collaborative networks have been formed at both national and institutional levels. The Chinese Academy of Sciences, Wuhan University and the NASA serve as the core publishing institutions, presenting a research pattern featured by the leadership of core organizations and multi-agent collaboration. The field is characterized by distinctive core journals and classic literature. Highly cited papers focus on chlorophyll-a inversion and the application of Sentinel satellite data, and machine learning algorithms have become the mainstream technical methods, laying a solid foundation for research in this field.
Analyses of keyword co-occurrence, clustering and burst detection show that research hotspots concentrate on water quality, remote sensing, chlorophyll-a, atmospheric correction and machine learning, forming two main research threads: the optimization of preprocessing technologies and the monitoring of water quality parameters. Research scenarios have expanded from coastal waters to inland water bodies, and algorithm optimization has emerged as an emerging research hotspot in recent years. Overall, the application scope and technical system of this field are continuously developing and improving.
5.2. Research Challenges and Prospects
Remote sensing inversion of water quality parameters is a vital research direction at the interdisciplinary frontier of remote sensing technology, environmental science and water resources management, as well as a key technical support for the precise monitoring of water resources and ecological environment governance. This study is a bibliometric-based narrative review that systematically sorts out the research achievements in the global field of remote sensing inversion of water quality parameters over the past three decades, aiming to present the research status, development trends and core hotspots of this field for researchers, and provide references for subsequent academic exploration and practical applications. Multi-source data fusion and artificial intelligence-driven optimization of inversion models constitute the core research hotspots in this field, spawning numerous innovative interdisciplinary designs and studies integrating remote sensing science, computer technology and environmental science. It is found that the advancement of multi-source remote sensing data fusion technologies (including satellite, UAV and ground-measured spectral data) has provided richer data sources and more reliable basic information for the remote sensing inversion of water quality parameters. Intelligent algorithms represented by machine learning and deep learning have broken through the limitations of traditional inversion models, significantly improved the inversion accuracy of water quality parameters, and offered promising solutions for achieving large-scale and high-precision dynamic monitoring of water resources. However, the field is currently confronted with three core challenges: first, the adaptability of multi-source remote sensing data fusion technologies is insufficient, and existing methods are difficult to meet the practical demands of water quality monitoring; second, the optimization of water quality inversion models is not in-depth enough, with inadequate integration of geospatial and thematic factors, leading to the need for further improvement in the universality and adaptability of the models; third, the research on inland water bodies lacks systematicness, and there is a shortage of inversion models adapted to their complex optical characteristics; In response to the above research gaps, future research in this field can be advanced with a focus on the following three aspects:
(1) Conduct in-depth research on remote sensing data fusion methods. With the continuous advancement of remote sensing technology, an increasing number of remote sensing images have become available for water quality monitoring. However, the sensors used to acquire these images differ in design objectives and observation characteristics: satellite data feature a wide coverage but suffer from limited spatiotemporal resolution and high susceptibility to weather conditions; UAV images boast high resolution and flexible acquisition, being free from weather interferences such as cloud cover, yet are constrained by a narrow observation range, poor endurance and high costs. In this regard, different datasets exhibit respective strengths and weaknesses in characterizing water quality features. Therefore, data fusion has become a key approach to improving the efficiency of water quality monitoring. Existing fusion methods include the Curvelet transform, wavelet transform and weighting-based methods, but their practical application in the field of water quality monitoring remains inadequate. Future research needs to conduct in-depth exploration of image data fusion methods tailored to the demands of water quality monitoring. By fusing image data captured by different sensors—such as the integration of satellite-borne, airborne remote sensing data and ground-measured spectral data, as well as remote sensing data with high spatial resolution and high spectral resolution—we can fully exploit the unique advantages of various sensors, construct an air-space-ground collaborative fusion framework, and develop algorithms that balance spectral matching and spatial detail preservation. Differentiated fusion strategies should be designed to drive the evolution of multi-source data from simple superposition to deep coupling, which can better characterize water quality features and provide more reliable fundamental data for water quality remote sensing inversion.
(2) Further optimize water quality inversion models. Previous research on water quality inversion has over-relied on the spectral characteristics of water quality, while neglecting the auxiliary effects of geospatial factors (e.g., distance to lake shorelines, distance to river estuaries or lake inlets) and thematic factors (e.g., water temperature, flow velocity and water depth) on water quality inversion. Future research can integrate the aforementioned geospatial and thematic factors to further improve the inversion accuracy of water quality remote sensing. On the other hand, given the great potential of machine learning methods in enhancing the inversion accuracy of water quality parameters, it is recommended to further strengthen research on machine learning-based water quality inversion methods. In the future, existing research data can be utilized to train and construct large artificial intelligence models for the field of water quality inversion, so as to improve the universality and adaptability of water quality inversion models.
(3) Strengthen research on inland water bodies. Research on coastal water bodies started early and has formed a well-established technical system, while studies on inland water bodies have boomed in recent years with a growing number of relevant achievements, yet the research systematicness remains to be improved. Future research should focus on targeted investigations of inland water bodies, develop specific water quality inversion models in combination with their unique water body characteristics, and address the technical challenges in remote sensing monitoring of inland water quality. In the meantime, efforts should be made to advance the cross-integration of research on coastal and inland water bodies, explore the common rules and individual differences of inversion in the two water types, and realize mutual learning and integration of technical methods. This will help build a land-sea coordinated water quality remote sensing monitoring system, and further provide scientific support for the comprehensive management of water ecological environment and regional sustainable development.
Author Contributions
Conceptualization, Q.C.; methodology, Q.C., H.L. and X.C.; software, X.C. and C.T.; validation, S.L. and H.L.; formal analysis, Q.C. and S.L.; investigation, C.T.; resources, H.L.; datacuration, X.C. and C.T.; writing-original draft preparation, H.L.; writing-review and editing, Q.C. and H.L.; visualization, H.L.; supervision, Q.C. and S.L.; project administration, Q.C.; funding acquisition, Q.C. All authors have read and agreed to the published version of the manuscript.
Funding
This research was supported by Key R&D Program of Zhejiang under Grant No. 2024C03234.
Conflicts of Interest
The authors declare no conflicts of interest.
Abbreviations
The following abbreviations are used in this manuscript:
| UAV | Unmanned Aerial Vehicle |
| WOSCC | Web of Science Core Collection |
| LSI | Latent Semantic Indexing |
| NASA | National Aeronautics and Space Administration |
| CASI | Compact Airborne Spectrographic Imager |
| XGBoost | Extreme Gradient Boosting |
| CatBoost | Categorical Boosting |
| SSN | Surface Seawater Nitrate |
| CODMn | Permanganate Index |
References
- Wu, H.; Chen, Q.H. An Integrated Approach Using Multi-source Data for Effective Pollution Risk Monitoring of Urban Rivers: A Case Study of Hangzhou. Water Science & Techonlogy 2023, 88(2), 454–467. [Google Scholar]
- Lu, Q.K.; Si, W.; Wei, L.F.; et al. Retrieval of Water Quality from UAV-Borne Hyperspectral Imagery: A Comparative Study of Machine Learning Algorithms. Remote Sensing 2021, 13(19), 3928. [Google Scholar] [CrossRef]
- Nguyen, V.H.; Duong, V.T.; Le, A.; et al. Machine Learning–Based Early-Warning Systems for Salinity Intrusion in the Mekong River Delta, Vietnam. Journal of Hydrologic Engineering 2024, 29(5). [Google Scholar] [CrossRef]
- Fu, Q.H.; Gu, Z.J.; Feng, J.F. Research Progress in Water Resources Monitoring Based on Satellite Remote Sensing Images. China Water Resources 2024, (01), 28–33. [Google Scholar]
- Yan, Y.; Yu, C.; Wamg, Y.; et al. Research on Water Quality Parameter Inversion Based on UAV Multispectral Remote Sensing. Hydrographic Surveying and Charting 2023, 43(05), 67–72. [Google Scholar]
- Zhao, Z.Q. Remote Sensing Inversion of Water Quality Level in the Songhua River Basin of Heilongjiang Province Based on GEE. Value Engineering 2023, 42(35), 133–135. [Google Scholar]
- Hu, W.T.; Gu, W.Q.; Liu, X.B.; et al. Inversion of Total Phosphorus in Small Waterbodies Based on UAV Multispectral Images. Yangtze River 2025, 56(09), 107–114. [Google Scholar]
- Qiao, Z.; Jiang, Q.O.; Lv, K.X.; et al. Retrieval Model for Water Quality Parameters of Miyun Reservoir Based on UAV Hyperspectral Remote Sensing Data and Deep Neural Network Algorithm. Spectroscopy and Spectral Analysis 2024, 44(07), 2066–2074. [Google Scholar]
- Gao, J.X.; Lin, Y.K.; Tu, Y.R.; et al. Current Status and Prospects of Remote Sensing Inversion Technology Applied to Monitoring Water Quality Parameters of Surface Water. Remote Sensing Information 2023, 38(06), 1–14. [Google Scholar]
- Xu, X.J.; Wei, X.D.; Cheng, P.X.; et al. Stereoscopic Network Monitoring for Water Quality Integration of Satellite, UAV, and Ship Observations: A Case Study of Dianshan Lake. Environmental Monitoring and Forewarning 2024, 16(06), 8–14. [Google Scholar]
- Ma, R.H.; Duan, H.T.; Tang, J.W.; et al. Lake Water Environment Remote Sensing; Science Press: Beijing, China, 2010. [Google Scholar]
- Morel, A.; Prieur, L. Analysis of Variations in Ocean Color. Limnology and Oceanography 1977, 22(5), 709–722. [Google Scholar] [CrossRef]
- Carpenter, D.J.; Carpenter, S.M. Modeling inland water quality using Landsat data. Remote Sensing of Environment 1983, 13(4), 345–352. [Google Scholar] [CrossRef]
- Yao, H.X.; Xiao, X.; Chen, P.X.; et al. Application of China′s New Generation of ZY1-02E Hyperspectral Satellite in the Inversion of Water Quality Parameters in Inland Waters. Journal of North China University of Water Resources and Electric Power(Natural Science Edition) 2024, 45(01), 11–20+30. [Google Scholar]
- Liu, M.Y.; Feng, D.W. Spatiotemporal Characteristics of Pearl River Water Environment in Guangzhou Based on Remote Sensing. Pearl River 2025, 46(04), 65–75. [Google Scholar]
- Zhu, S.T.; Fan., Y.; Liu, Y.; et al. Research on Parameter Inversion Methods for Water Quantity and Quality Models Based on FCLPSO. Water Resources and Hydropower Engineering 2025, 56(07), 54–66. [Google Scholar]
- Zhang, S.H.; Zhao, Q.C.; Han, B.H.; et al. Inversion of Chlorophyll a Concentration in Baiyangdian Lake Based on Measured Spectra. Journal of Atmospheric and Environmental Optics 2024, 19(04), 468–478. [Google Scholar]
- Wang, N.; Sun, Y.N.; Ll, Z.; et al. Advances of Floodrisk Research Field——Visible Analysis Base on CiteSpace. Hydro Science and Cold Zone Engineering 2021, 4(05), 185–188. [Google Scholar]
- Huo, H.; Liu, Y.; Li, Y. Hot Spot Tracking of Flood Remote Sensing Research Over the Past 22 Years: Abibliometric Analysis Using CiteSpace. Journal of Earth Environment 2024, 15(04), 612–623. [Google Scholar]
- Li, H.J.; Gao, C.G. Research Hotspots and Trend of Karst Wetland Based on CiteSpace Knowledge Map Analysis. Journal of Green Science and Technology 2023, 25(04), 23–32. [Google Scholar]
- Jia, G.L.; Ma, R.G.; Hu, Z.H. Review of Urban Transportation Network Design Problems Based on CiteSpace. Mathematical Problems in Engineering 2019, 5735702. [Google Scholar] [CrossRef]
- Ding, X.; Yang, Z. Knowledge Mapping of Platform Research: A Visual Analysis Using VOSviewer and CiteSpace. Electronic Commerce Research 2022, 22, 787–809. [Google Scholar] [CrossRef]
- Chen, Y.H.; Zhang, D. Research on the Data Preparation of Bibliometric Analysis. Library Development 2012, (5), 90–92. [Google Scholar]
- Xu, Y.C.; Zhang, H.Z.; Lu, L. A Review of International Leisure Research: Statistical Analysis based on Journal of Leisure Research, Leisure Sciences and Leisure Studie. Tourism Tribune 2019, 34(3), 134–148. [Google Scholar]
- Zhang, M.X.; Zheng, X.Q.; Wang, K.J. Analysis on the Knowledge Mapping of Foreign Research on Urban Underground Space. Science of Surveying and Mapping 2018, 43(7), 180–186. [Google Scholar]
- Yang, G.; Xie, Y. Research on Innovation Culture in Chinese Situation: Review, Trends and Prospects ——Bibliometric Analysis Based on CiteSpace. Journal of Guizhou University (Social Sciences) 2019, 37(04), 128–137. [Google Scholar]
- Chen, C. Science Mapping: A Systematic Review of the Literature. Journal of Data and Information Science 2017, 2(02), 1–40. [Google Scholar] [CrossRef]
- Zhang, X.C.; Huang, X.Y.; Ding, Y.R.; et al. Advancements in Smart Wearable Mobility Aids for Visual Impairments: A Bibliometric Narrative Review. Sensors 2024, 24, 7986. [Google Scholar] [CrossRef] [PubMed]
- Pahlevan, N.; Smith, B.; Schalles, J.; et al. Seamless Retrievals of Chlorophyll-a From Sentinel-2 (MSI) and Sentinel-3 (OLCI) in Inland and Coastal Waters: A Machine-learning Approach. Remote Sensing of Environment 2020, 240, 111604. [Google Scholar] [CrossRef]
- Cao, Z.G.; Ma, R.H.; Duan, H.T.; et al. A Machine Learning Approach to Estimate Chlorophyll-a From Landsat-8 Measurements in Inland lakes. Remote Sensing of Environment 2020, 248, 111974. [Google Scholar] [CrossRef]
- Batur, E.; Maktav, D. Assessment of Surface Water Quality by Using Satellite Images Fusion Based on PCA Method in the Lake Gala, Turkey. IEEE Transactions on Geoscience and Remote Sensing 2018, 57, 2983–2989. [Google Scholar] [CrossRef]
- Shang, P.; Shen, F. Atmospheric Correction of Satellite GF-1/WFV Imagery and Quantitative Estimation of Suspended Par-ticulate Matter in the Yangtze Estuary. Sensors 2016, 16. [Google Scholar] [CrossRef]
- Cao, Y.; Ye, Y.; Zhao, H.; et al. Remote Sensing of Water Quality Based on HJ-1A HSI Imagery with Modified Discrete Binary Particle Swarm Optimization-partial Least Squares (MDBPSO-PLS) in Inland Waters: A case in Weishan Lake. Ecological Informatics 2018, 44, 21–32. [Google Scholar] [CrossRef]
- Kudela, R.M.; Palacios, S.L.; Austerberry, D.C.; et al. Application of Hyperspectral Remote Sensing to Cyanobacterial Blooms in Inland Waters. Remote Sensing of Environment 2015, 167, 196–205. [Google Scholar] [CrossRef]
- Ouma, Y.O.; Waga, J.; Okech, M.; et al. Estimation of Reservoir Bio-Optical Water Quality Parameters Using Smartphone Sensor Apps and Landsat ETM+: Review and Comparative Experimental Results. Journal of Sensors 2018, 2018, 1–32. [Google Scholar] [CrossRef]
- Li, D.W.; Wu, T.Z.; Jiang, X.L.; et al. Study on Chlorophyll a Monitoring of Inland Water based on Remote Sensing. Journal of Chifeng University(Natural Science Edition) 2022, 38(03), 14–20. [Google Scholar]
- Feng, H.E.; Li, J.G.; Zhu, Y.F.; et al. Synergistic Inversion Method of Chlorophyll a Concentration in GF-1 and Landsat8 Imagery: A Case Study of the Taihu Lake. Remote Sensing for Natural Resources 2019, 31(04), 182–189. [Google Scholar] [CrossRef]
- Dona, C.; Chang, N.B.; Caselles, V.; et al. Integrated Satellite Data Fusion and Mining for Monitoring Lake Water Quality Status of the Albufera de Valencia in Spain. Journal of Environmental Management 2015, 151, 416–426. [Google Scholar] [CrossRef]
- Essam, S.E.D.; Zhang, Y.; Suliman, A. Mapping Concentrations of Surface Water Quality Parameters Using a Novel Remote Sensing and Artificial Intelligence Framework. International Journal of Remote Sensing 2017, 38(4), 1023–1042. [Google Scholar] [CrossRef]
- Gao, Y.; Gao, J.; Yin, H.; et al. Remote Sensing Estimation of the Total Phosphorus Concentration in a Large Lake Using Band Combinations and Regional Multivariate Statistical Modeling Techniques. Journal of Environmental Management 2015, 151, 33–43. [Google Scholar] [CrossRef]
- Soomets, T.; Toming, K.; Jefimova, J.; et al. Deriving Nutrient Concentrations from Sentinel-3 OLCI Data in North-Eastern Baltic Sea. Remote Sensing 2022, 14(6), 1487. [Google Scholar] [CrossRef]
- Yuan, X.Y.; Wang, S.R.; Fan, F.Q.; et al. Spatiotemporal Dynamics and Anthropologically Dominated Drivers of Chlorophyll-a, TN and TP Concentrations in the Pearl River Estuary Based on Retrieval Algorithm and Random Forest Regression. Environmental Research 2022, 215, 114380. [Google Scholar] [CrossRef] [PubMed]
- Xu, Y.; Cheng, C.C.; Zhang, Y.; et al. Monitoring of Inorganic Nitrogen and Phosphorus Nutrients in the Sheyang Estuary Based on Beijing-1 Satellite Imagery. Oceanologia et Limnologia Sinica 2013, 44(06), 1486–1492. [Google Scholar]
- Yan, X.; Guo, Z.H.; Shi, T.T.; et al. Construction of Water Quality Index Inversion Model of Yuehai Lake Based on Convolutional Neural Network. Water Resources and Power 2024, 42(07), 48–52. [Google Scholar]
- Feng, C.J.; Fang, C.Q.; Yuan, G.Y.; et al. Water Pollution Monitoring Based on Unmanned Aerial Vehicle (UAV) Hyperspectral and BP Neural Network. Chinese Journal of Environmental Engineering 2023, 17(12), 3996–4006. [Google Scholar]
- Sun, Y.Y.; Cao, H.T.; Zhang, J.B.; et al. Research on Remote Sensing Inversion of Water Quality Parameters Using Support Vector Machine Based on Particle Swarm Optimization. Environmental Protection Science 2025, 51(04), 86–95. [Google Scholar]
- Ren, Z.J. Water Quality Retrieval of Yunlong Lake Based on SSA-BP-SVM Model. Journal of Nanjing University of Information Science & Technology 2024, 16(02), 279–290. [Google Scholar]
- He, W.Q.; Wu, Z.J.; Wang, Z. Inversion of Urban River Water Quality Based on UAV Multispectral Image. The Administration and Technique of Environmental Monitoring 2024, 36(05), 51–55. [Google Scholar]
- Yang, X.N.; Jing, Y.; Wu, M.Q.; et al. Retrieval of Non-optically Active Water Quality Parameters for Rivers Based on UAV Multispectral Remote Sensing. China Water Transport 2024, 24(10), 56–58. [Google Scholar]
- Xiong, J.; Lin, C.; Cao, Z.; et al. Development of Remote Sensing Algorithm for Total Phosphorus Concentration in Eutrophic Lakes: Conventional or Machine Learning? Water Research 2022, 215, 118213. [Google Scholar] [CrossRef]
- Dong, L.; Gong, C.L.; Huai, H.Y.; et al. Retrieval of Water Quality Parameters in Dianshan Lake Based on Sentinel-2 MSI Imagery and Machine Learning: Algorithm Evaluation and Spatiotemporal Change Research. Remote Sensing 2023, 15(20), 5001. [Google Scholar] [CrossRef]
- Pang, J.Y.; Zhang, A.B.; Wang, H.F.; et al. Inversion of Urban River Water Quality Parameters Based on UAV Multi-spectral Imagery and XGBoost Model. China Rural Water and Hydropower 2023, (03), 111–119. [Google Scholar]
- Wang, D.F.; Cui, Q.Y.; Gong, F.; et al. Satellite Retrieval of Surface Water Nutrients in the Coastal Regions of the East China Sea. Remote Sensing 2018, 10, 1896. [Google Scholar] [CrossRef]
- Yu, X.L.; Chen, S.L.; Chai, F. Remote Estimation of Sea Surface Nitrate in the California Current System From Satellite Ocean Color Measurements [J]. IEEE Transactions on Geoscience and Remote Sensing 2022, 60. [Google Scholar] [CrossRef]
- Gordon, H.R.; Clark, D.K. Clear Water Radiances for Atmospheric Correction of Coastal Zone Color Scanner Imagery. Applied Optics 1981, 20(24), 4175–4180. [Google Scholar] [CrossRef]
- Hoge, F.E.; Wright, C.W.; Krabill, W.B.; et al. Airborne Lidar Detection of Subsurface Oceanic Scattering Layer. Applied Optics 1995, 34(21), 4389–4398. [Google Scholar] [CrossRef]
- Gitelson, A.A.; Dall’Olmo, G.; Moses, W.; et al. A Simple Semi-analytical Model for Remote Estimation of Chlorophyll-a in Turbid Waters: Validation. Remote Sensing of Environment 2008, 112(9), 3582–3592. [Google Scholar] [CrossRef]
- Cheng, S.H.; Zhang, S.J.; Zhang, D.F. Water Quality Monitoring Method Based on Feedback Self-correcting Dense Connected Convolution Network. Neurocomputing 2019, 349(15), 301–313. [Google Scholar]
- Cao, Z.G.; Hu, C.M.; Ma, R.H.; et al. MODIS Observations Reveal Decrease in Lake Suspended Particulate Matter Across China Over the Past Two Decades. Remote Sensing of Environment 2023, 295, 113724. [Google Scholar] [CrossRef]
- Xu, J.L.; Xu, Z.; Kuang, J.J. An Alternative to Laboratory Testing: Random Forest-Based Water Quality Prediction Framework. Water 2021, 13(22), 3262. [Google Scholar] [CrossRef]
- Li, X.; Liu, S.; Chen, F.M.; et al. Remote Sensing Hyperspectral Inversion of Chlorophyll a in Water Quality Based on SSA-XGBoost Algorithm. Environmental Science & Technology 2024, 47(12), 169–176. [Google Scholar]
- Chen, D.D.; Chen, Y.Z.; Feng, X.F.; et al. Retrieving Suspended Matter Concentration in Rivers based on Hyperparameter Optimized CatBoost Algorithm. Journal of Geo-information Science 2022, 24(04), 780–791. [Google Scholar]
- Zhang, Y.S.; Wu, L.; Ren, H.Z.; et al. Retrieval of Water Quality Parameters from Hyperspectral Images Using Hybrid Bayesian Probabilistic Neural Network. Remote Sensing 2022, 12(10), 1567. [Google Scholar] [CrossRef]
- Zhao, F.R.; Wang, Q.; Mu, C.S.; et al. Changes in Transparency of Lake Chagan and its Surrounding Lakes from 1984 to2019 Based on Remote Sensing. Journal of Lake Sciences 2025, 37(01), 328–338. [Google Scholar]
- Chen, Y.J.; Chen, Z.F.; Zou, L.; et al. Remote Sensing Inversion of Chlorophyll-a Concentration and Total Suspended Matter Concentration in Gaoyou Lake Based on Sentinel-2 MSI Data. Environmental Monitoring and Forewarning 2024, 16(06), 21–28. [Google Scholar]
- Lin, L.; Zhang, Y.L.; Li, N.; et al. A Satellite-based Remote Sensing Algorithm for Estimating CODMn Concentration in Lake Taihu and its Surrounding Rivers. Acta Scientiae Circumstantiae 2025, 45(03), 283–294. [Google Scholar]
- Zhu, L.D.; Cui, T.W.; Runa, A.; et al. Robust Remote Sensing Retrieval of Key Eutrophication Indicators in Coastal Waters Based on Explainable Machine Learning. ISPRS Journal of Photogrammetry and Remote Sensing 2024, 211, 262–280. [Google Scholar] [CrossRef]
Figure 1.
Publication trend of research on remote sensing inversion of water quality parameters.
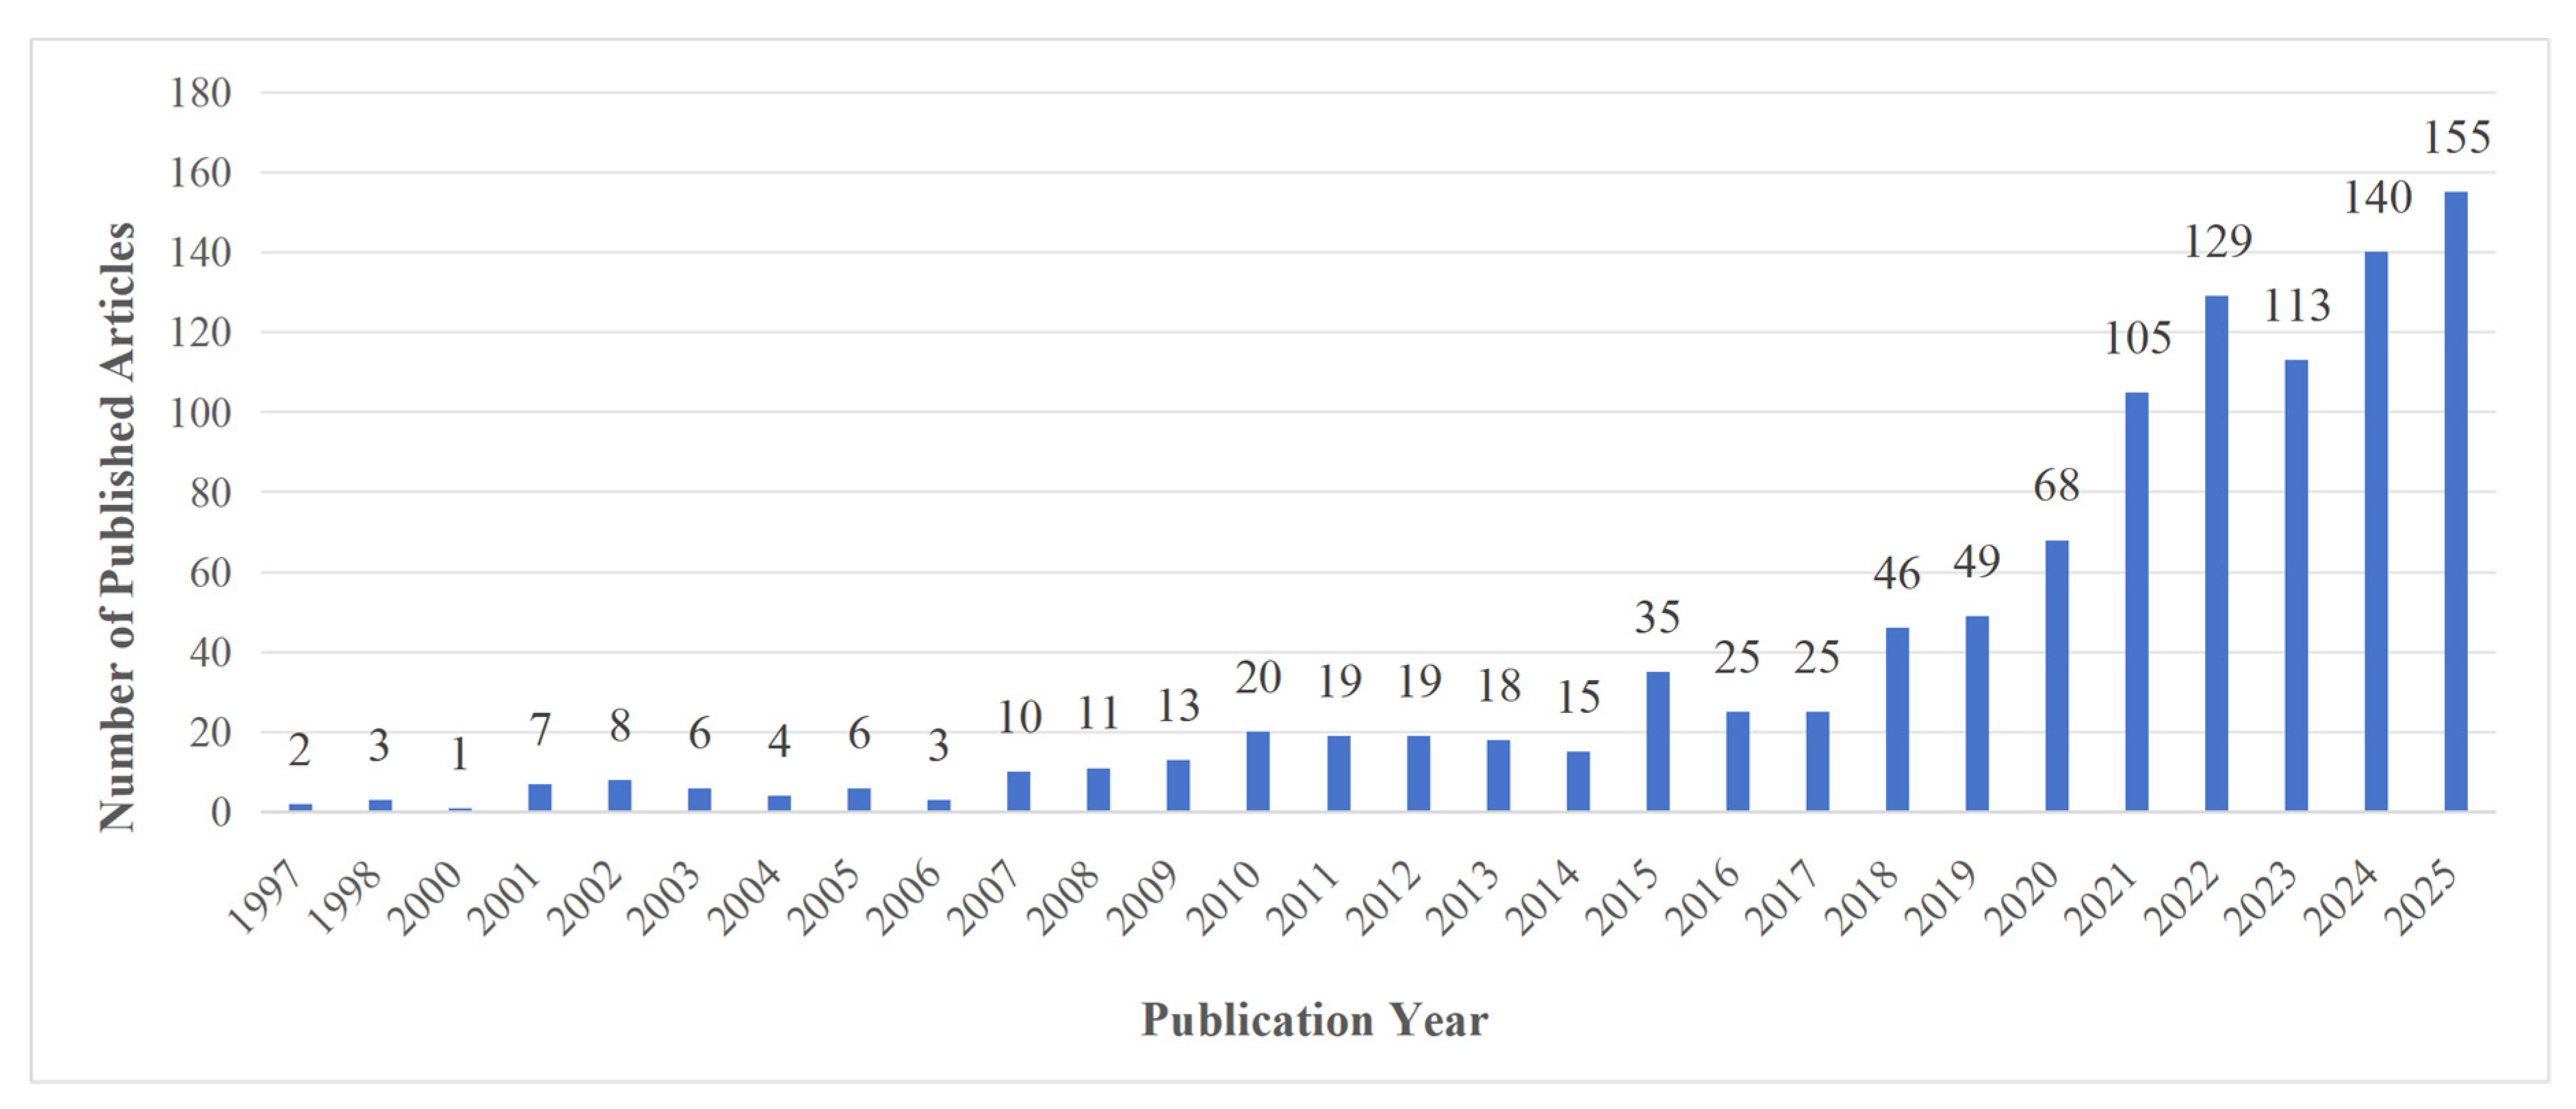
Figure 2.
Analysis of the country/region distribution of global publications in the field of remote sensing inversion of water quality parameters: (a) Top 16 countries/regions by publication volume; (b) Network visualization map.
Figure 2.
Analysis of the country/region distribution of global publications in the field of remote sensing inversion of water quality parameters: (a) Top 16 countries/regions by publication volume; (b) Network visualization map.
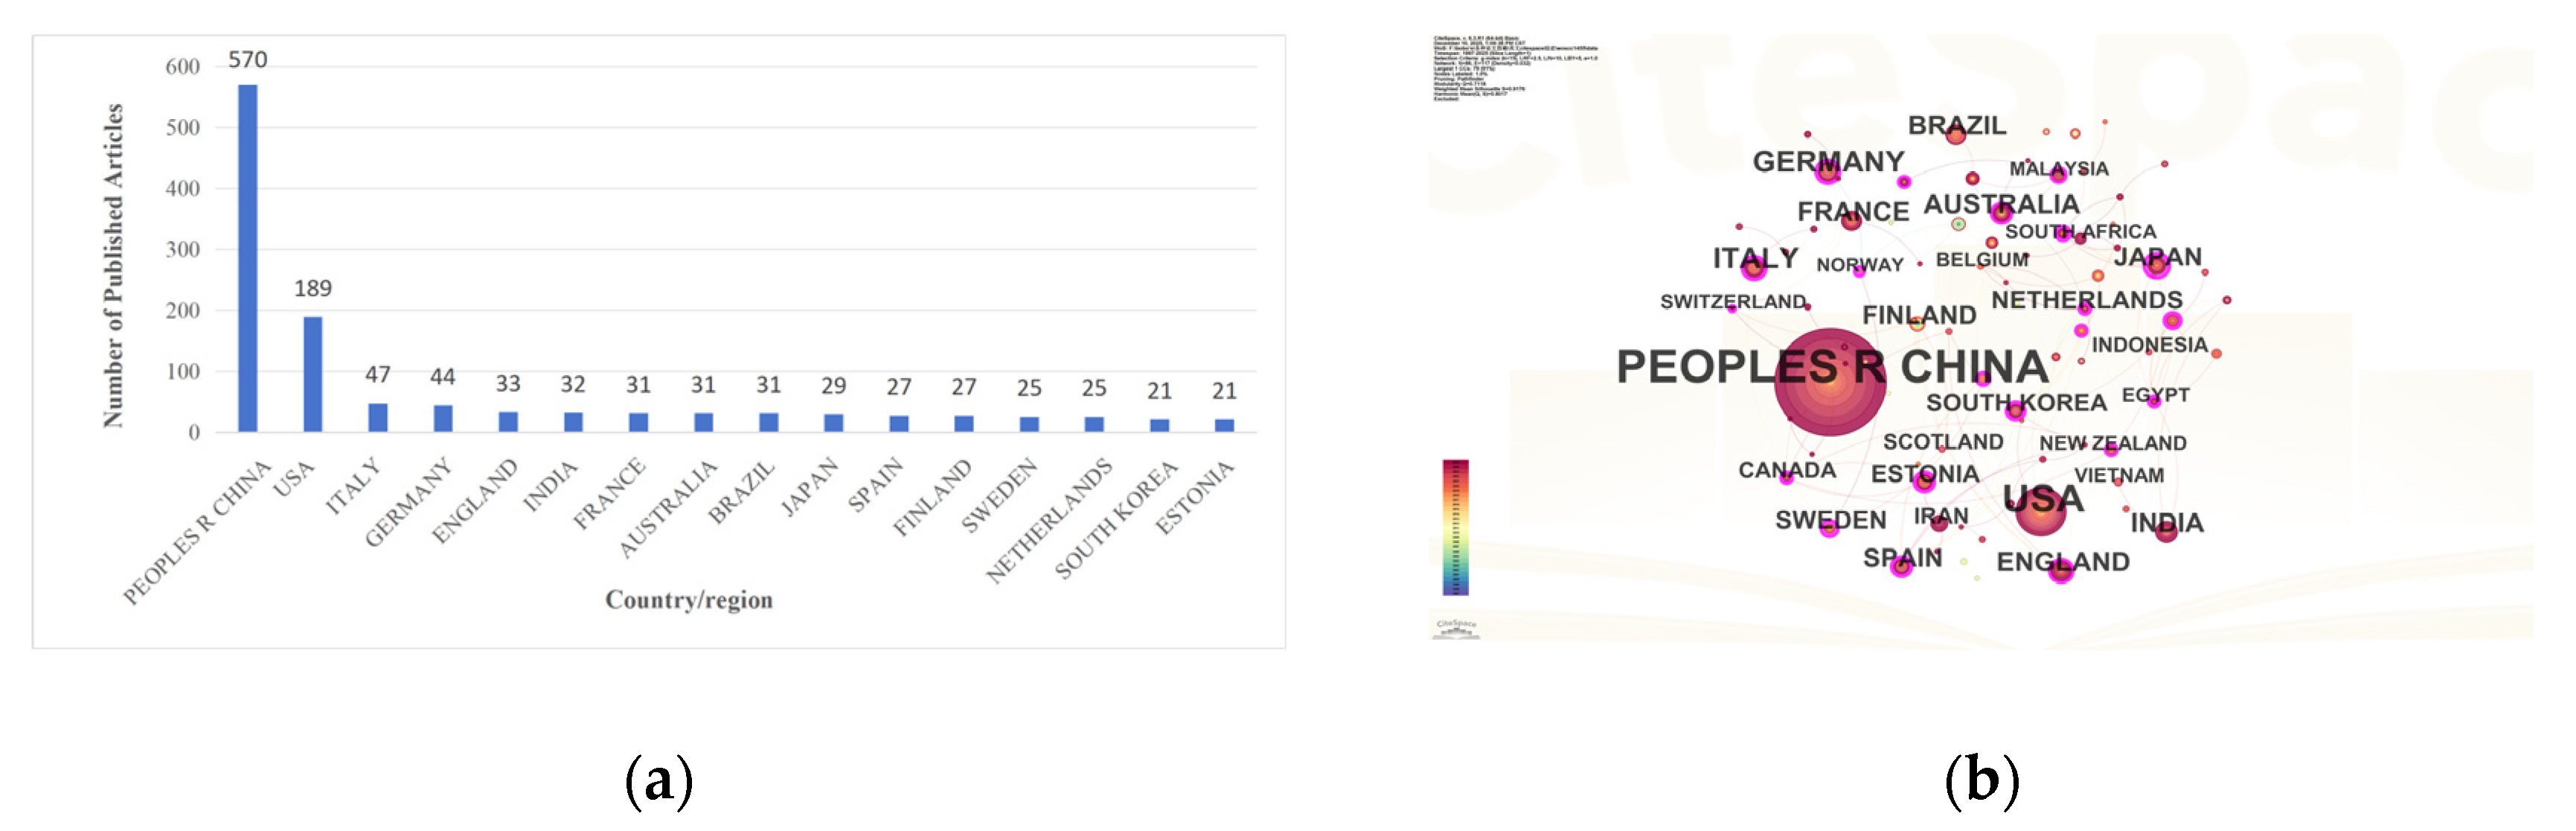

Table 1.
Top 10 co-cited journals of the studied publications from 1997 to 2025.
| Rank | Number of Articles Published | Centrality | Year | Journal |
|---|---|---|---|---|
| 1 | 952 | 0.36 | 1998 | Remote Sensing of Environment |
| 2 | 780 | 0.2 | 1997 | International Journal of Remote Sensing |
| 3 | 738 | 0.17 | 2014 | Remote Sensing |
| 4 | 656 | 0.34 | 2001 | Science of the Total Environment |
| 5 | 526 | 0.08 | 1998 | Applied Optics |
| 6 | 507 | 0.2 | 1998 | Limnology and Oceanography |
| 7 | 495 | 0.12 | 2001 | IEEE Transactions on Geoscience and Remote Sensing |
| 8 | 440 | 0.07 | 2000 | Journal of Geophysical Research: Oceans |
| 9 | 405 | 0.1 | 2010 | ISPRS Journal of Photogrammetry and Remote Sensing |
| 10 | 373 | 0.03 | 2009 | Water Research |
Table 2.
Top 10 co-cited literature of the studied publications from 1997-2025.
| Rank | Freq | Centrality | Year | Title | Citations |
|---|---|---|---|---|---|
| 1 | 121 | 0.33 | 2020 | Seamless retrievals of chlorophyll-a from Sentinel-2 (MSI) and Sentinel-3 (OLCI) in inland and coastal waters: A machine-learning approach | 398 |
| 2 | 118 | 0.27 | 2020 | Monitoring inland water quality using remote sensing: potential and limitations of spectral indices, bio-optical simulations, machine learning, and cloud computing | 443 |
| 3 | 83 | 0.32 | 2020 | A machine learning approach to estimate chlorophyll-a from Landsat-8 measurements in inland lakes | 302 |
| 4 | 66 | 0.01 | 2022 | A Review of Remote Sensing for Water Quality Retrieval: Progress and Challenges | 238 |
| 5 | 62 | 0.02 | 2020 | Robust algorithm for estimating total suspended solids (TSS) in inland and nearshore coastal waters | 195 |
| 6 | 57 | 0.09 | 2019 | A global approach for chlorophyll-a retrieval across optically complex inland waters based on optical water types | 220 |
| 7 | 53 | 0.08 | 2020 | Deep learning-based water quality estimation and anomaly detection using Landsat-8/Sentinel-2 virtual constellation and cloud computing | 172 |
| 8 | 50 | 0 | 2020 | Research Trends in the Use of Remote Sensing for Inland Water Quality Science: Moving Towards Multidisciplinary Applications | 211 |
| 9 | 49 | 0.05 | 2021 | Machine learning-based inversion of water quality parameters in typical reach of the urban river by UAV multispectral data | 101 |
| 10 | 49 | 0.02 | 2021 | Quantification of chlorophyll-a in typical lakes across China using Sentinel-2 MSI imagery with machine learning algorithm | 135 |
Table 3.
Top 15 keywords by frequency for the publications studied from 1997 to 2025.
| Rank | Count | Centrality | Year | Keywords |
|---|---|---|---|---|
| 1 | 374 | 0.18 | 1997 | water quality |
| 2 | 292 | 0.35 | 2001 | remote sensing |
| 3 | 285 | 0.08 | 1998 | retrieval |
| 4 | 232 | 0.24 | 2000 | chlorophyll a |
| 5 | 164 | 0.21 | 2002 | atmospheric correction |
| 6 | 161 | 0.07 | 2002 | coastal |
| 7 | 152 | 0.03 | 2002 | model |
| 8 | 149 | 0.39 | 1998 | reflectance |
| 9 | 141 | 0.11 | 2001 | algorithms |
| 10 | 117 | 0.04 | 2020 | machine learning |
| 11 | 115 | 0.04 | 2010 | lake |
| 12 | 113 | 0.04 | 2011 | inland waters |
| 13 | 94 | 0.24 | 2000 | coastal waters |
| 14 | 93 | 0.03 | 2006 | inland |
| 15 | 92 | 0.04 | 2010 | quality |
Table 4.
Classification of keyword clusters for the studied publications from 1997 to 2025.
| Cluster ID | Name | Size | Silhouette | Top Terms (LSI) |
|---|---|---|---|---|
| 0 | remote sensing | 40 | 0.931 | water quality; data models; spatiotemporal phenomena; optical sensors; image color analysis/machine learning; global modeling; inflow rivers; bio-optical model; oceanographic techniques |
| 1 | chlorophyll a | 30 | 0.943 | water quality; radiative transfer models; look-up table; quasi-analytical algorithm; bio-optical property/machine learning; episodic events; urban estuaries; tidal exchanges; data partition |
| 2 | neural network | 24 | 0.957 | water quality; data models; spatiotemporal phenomena; optical sensors; ensemble model/machine learning; water quality monitoring; harmful algal blooms; water resources; biological system modeling |
| 3 | suspended particulate matter | 23 | 0.877 | water quality; bio-optical model; quasi-analytical algorithm; complex shallow waters; spectral denoising/particulate matter; retrieval; ocean; color; algorithms |
| 4 | water quality inversion | 19 | 0.781 | water quality; empirical model; lake management; quasi-analytical algorithm; particle size/machine learning; data models; predictive models; biological system modeling; coastal waters |
| 5 | atmospheric correction | 19 | 0.942 | atmospheric correction; ocean color; remote sensing reflectance; sediment resuspension; tampa bay estuary/water quality; bio-optical model; quasi-analytical algorithm; semianalytical algorithms; western channel observatory |
| 6 | physics-based modeling | 18 | 0.833 | water quality; hyperspectral camera; multiespectral camera; guadalquivir estuary; total phosphorus/machine learning; yangtze river basin; temporal representativeness; guadalquivir estuary; total phosphorus |
| 7 | water quality monitoring | 17 | 0.878 | water quality monitoring; machine learning; harmful algal blooms; spatiotemporal fusion model; missing-data scenario/water quality; new area; surface waterbody; spatio-temporal fusion model; quasi-analytical algorithm |
| 8 | lake taihu | 16 | 0.934 | water quality; virgin islands; model-based method; chlorophyll a concentration; bio-optical model/machine learning; absorption coefficient; hyperspectral imagery; reflectance band selection; spatiotemporal distribution |
| 9 | water framework directive | 16 | 0.954 | water quality; bio-optical model; absorption coefficient; artificial neural network; environmental monitoring/machine learning; coastal areas; three-band models; genetic algorithms; optical sensors |
| 10 | machine learning algorithm | 14 | 0.981 | water quality; routine observations; inflow rivers; quasi-analytical algorithm; environmental monitoring/machine learning; temporal representativeness; yangtze river basin; routine observations; inflow rivers |
| 11 | bio-optical models | 14 | 0.921 | water quality; ocean color; temperate regions; spatio-temporal dynamics; chlorophyll a concentration/machine learning; water quality monitoring; remote sensing inversion; poyang lake; ensemble learning |
| 12 | driving factors | 7 | 0.984 | water quality; water pollution; sea measurements; pearl river delta; data models/machine learning; hyperspectral modeling; pearl river estuary; quasi-analytical algorithm; sea measurements |
| 13 | adaptation models | 7 | 0.992 | transfer learning; coastal waters; porcupine optimizer; atmospheric modeling; water quality assessment/artificial intelligence; atmospheric modeling; optical imaging; spectral ambiguities; physics-based inversion |
Table 5.
Comparison of Information of Different Remote Sensing Data.
| Data Type | Usage Scale | Advantages & Disadvantages |
|---|---|---|
| Multispectral | Medium scale, covering tens to hundreds of square kilometers; suitable for regional monitoring of large water bodies (e.g., lakes, oceans). |
Advantages: Easy sensor acquisition, low cost; multi-band data supports model construction for macro analysis. Disadvantages: Low spectral resolution, long revisit period; hard to monitor dynamic changes timely. |
| Hyperspectral | Small-to-medium scale, usually covering several hundred to several thousand square kilometers; applicable to small lakes, estuaries, etc. | Advantages: High spectral resolution, enabling accurate detection of water quality parameters and identification of trace substances. Disadvantages: Large data volume (hard to process), high cost; limited spatial resolution; complex interpretation. |
| UAV | Small scale, generally covering several square meters to several thousand square kilometers; used for small water bodies (e.g., small ponds, urban rivers). |
Advantages: High flexibility; real-time high-resolution data acquisition, suitable for emergency monitoring. Disadvantages: Limited flight range/duration; weather-dependent; complex data processing. |
| Multi-source Data | Medium-to-large scale, covering hundreds to tens of thousands of square kilometers; applicable to large river basins, broad oceans, etc. for comprehensive monitoring. |
Advantages: Integrates multi-data advantages; monitoring is more comprehensive/accurate with reliable results. Disadvantages: Complex fusion technology; difficult management/processing; errors/uncertainties affect analysis. |
Table 6.
Comparison of Different Remote Sensing Inversion Methods.
| Remote Sensing Inversion Methods | Applicable Scenario | Sample Requirement | Accuracy (R²) |
Computational Cost | Advantages & Disadvantages | |
|---|---|---|---|---|---|---|
| Traditional Inversion Methods | Analytical Model [55] | Large-scale water bodies (e.g., lakes, oceans) for long-term monitoring | 100-300 | 0.70-0.85 | High |
Advantages: Strong theoretical foundation, wide applicability, high interpretability; Disadvantages: Complex model, difficult parameter acquisition, requires large amounts of measured data |
| Empirical Model [56] | Small-scale areas for short-term monitoring (e.g., small rivers) | 20-50 | 0.60-0.8 | Low | Advantages: Simple construction, low computational load, high accuracy under specific conditions; Disadvantages: Regional limitations, data-dependent, poor applicability when the environment changes | |
| Semi-Empirical Model [57] | Medium-scale areas for seasonal monitoring | 50-200 | 0.70-0.85 | Medium |
Advantages: Combines the advantages of both models, simultaneous improvement in accuracy and applicability; Disadvantages: Regional adaptability issues, requires certain data quality and quantity |
|
| AI Algorithms | Convolutional Neural Network (CNN) [58] | High-resolution images, complex nonlinear water quality parameters | >500 | 0.85-0.95 | High |
Advantages: Strong feature extraction capability, suitable for complex data patterns; Disadvantages: High computational resource requirements, poor model interpretability |
| Support Vector Regression (SVR) [59] | Small-to-medium scale, nonlinear, non-normal water quality parameter inversion | 50-300 | 0.80-0.9 | Medium-High |
Advantages: Good performance with small samples, strong resistance to noise and outliers; Disadvantages: Complex computation, cumbersome parameter adjustment, poor interpretability |
|
| Random Forest Regression (RF) [60] | Multi-parameter, high-dimensional scenarios | 100-500 | 0.80-0.9 | Medium |
Advantages: Good generalization, not prone to overfitting, can handle outliers and missing values; Disadvantages: Limited interpretability |
|
| Extreme Gradient Boosting (XGBoost) [61] | Large-scale, high-complexity water quality parameter inversion | 100-500 | 0.85-0.95 | Medium-High |
Advantages: Optimal timeliness, anti-overfitting, strong feature processing capability; Disadvantages: Slow training speed, many parameters, complex parameter tuning, poor interpretability |
|
| Categorical Boosting (CatBoost) [62] |
Water quality data containing categorical features | 100-400 | 0.85-0.92 | Medium |
Advantages: Handles categorical features, more accurate prediction, fast training; Disadvantages: Poor interpretability, hyperparameters affect performance |
|
| Backpropagation Neural Network (BPNN) [63] | Complex nonlinear, non-normal water quality parameter inversion | >500 | 0.80-0.95 | High | Advantages: Good nonlinear fitting, can learn complex functions; Disadvantages: Slow convergence to local optimum, parameter-sensitive | |
Disclaimer/Publisher’s Note: The statements, opinions and data contained in all publications are solely those of the individual author(s) and contributor(s) and not of MDPI and/or the editor(s). MDPI and/or the editor(s) disclaim responsibility for any injury to people or property resulting from any ideas, methods, instructions or products referred to in the content. |
© 2026 by the authors. Licensee MDPI, Basel, Switzerland. This article is an open access article distributed under the terms and conditions of the Creative Commons Attribution (CC BY) license.
Copyright: This open access article is published under a Creative Commons CC BY 4.0 license, which permit the free download, distribution, and reuse, provided that the author and preprint are cited in any reuse.


