
Submitted:
12 January 2026
Posted:
14 January 2026
You are already at the latest version
Abstract
The orbital drift of the Fengyun 4B (FY-4B) satellite from 133°E to 105°E in early 2024 significantly altered its viewing geometry over China, providing a unique opportunity to evaluate the impact of satellite positioning on retrieval accuracy. (1) Methods: This study systematically evaluates the performance of FY-4B surface downward shortwave radiation (DSSR) products before and after the drift, using ground radiation observation data from the China Meteorological Administration (CMA) as a reference, including 165 stations. (2) Results: The results demonstrate a substantial improvement in product accuracy post-drift. The correlation coefficient (R) increased from 0.93 to 0.95, while the root mean square error (RMSE) decreased by 11.8% (from 112.46 to 99.24 W/m²). The mean bias error (MBE) shifted from a negligible negative bias to a slight positive bias (2.68 W/m²), indicating reduced systematic deviation. Spatially, the "East-West" accuracy disparity was mitigated, attributed to the reduced viewing zenith angles (VZA) and minimized geometric distortions over western China. While performance over water bodies and urban areas is robust, challenges persist in complex terrains due to 3D topographic effects. (3) Conclusions: Ultimately, the validated high-fidelity radiative records position FY-4B as a reliable data source for solar energy resource assessment, while the demonstrated geometric benefits offer strategic guidance for the orbital deployment of future geostationary constellations.
Keywords:
FY-4B satellite
; shortwave radiation
; satellite-ground consistency
; land cover type
; elevation
1. Introduction
Surface downward shortwave radiation (DSR), encompassing wavelengths from 0.3 μm to 2.5 μm, constitutes a fundamental physical quantity describing the solar energy reaching the Earth's surface. It serves as a core parameter in the study of the Earth's energy balance and climate system [1,2]. Beyond its critical role in climate monitoring, agrometeorology, and hydrological modeling, DSSR is an indispensable input for resource assessment and forecasting in the rapidly growing photovoltaic (PV) power generation sector. Consequently, acquiring high-precision, continuous, and high-spatiotemporal-resolution DSSR data is essential for optimizing energy utilization patterns and enhancing the performance of numerical weather prediction models [3]. In recent years, the advanced observational capabilities of China’s new-generation geostationary meteorological satellites, the "Fengyun–4" (FY–4) series, have provided unprecedented opportunities for deriving high-frequency, wide-coverage surface shortwave radiation products [4,5].
As the pioneer operational satellite of the FY–4 series, FY–4A has seen its surface shortwave radiation products extensively validated. Previous studies indicate that these products effectively capture diurnal and seasonal variations, maintaining high consistency with ground-based observations [6]. Validations have been conducted across diverse regions, from the mountainous Guizhou Plateau [7] and the Shanxi Plateau [8] to the monsoon region of Eastern China [9]. On a national scale, consistency has been shown to vary across different climatic zones [10,11]. Furthermore, comparative studies with international satellites, such as Himawari-8, have verified the general applicability of FY–4A products in East Asia [12,13]. These studies laid a solid foundation for assessing the successor satellite, FY-4B.
FY-4B represents the second generation of the FY–4 operational series, features significant upgrades in platform stability and payload performance [4,14]. While existing research on FY-4B has focused on atmospheric environmental parameters [15] and lightning data applications [16], there is a notable gap in the systematic validation of its surface radiation products. Crucially, in early 2024, the FY-4B satellite underwent a significant orbital drift, adjusting its sub-satellite point from 133°E to 105°E. This strategic maneuver was executed to assume the primary operational duties from the aging FY–4A satellite, thereby ensuring continuous and optimized monitoring coverage over the Chinese landmass and the surrounding regions. This orbital adjustment offers a unique opportunity to evaluate the impact of satellite viewing geometry on radiation retrieval accuracy.
Theoretically, the position of the sub-satellite point fundamentally determines the viewing zenith angle (VZA) for a given target region. When located at 133°E, the satellite observes the majority of the Chinese landmass, particularly the western regions, at high slant angles. Large VZAs result in longer atmospheric optical paths, which amplify uncertainties related to aerosol extinction and cloud parallax effects [17]. Furthermore, oblique viewing geometries exacerbate pixel distortion and spatiotemporal mismatches between satellite pixels and ground stations, complicating the validation of surface radiation [18]. The shift to 105°E places the satellite directly over central China, significantly reducing the VZA for the entire country. This near-nadir view is expected to minimize geometric distortions and atmospheric attenuation errors.
However, despite the operational transition, a critical knowledge gap remains: the quantitative impact of the massive orbital drift (from 133°E to 105°E) on surface radiation retrieval accuracy has not yet been systematically evaluated. To the best of our knowledge, this study presents the first comprehensive national-scale assessment focusing on the performance evolution of FY-4B DSSR products pre- and post-drift. By utilizing high-quality reference data from the CMA network, we aim to: (1) establish a rigorous accuracy benchmark for FY-4B's new operational orbit; (2) isolate the geometric contributions to retrieval improvements, validating the 'observation geometry optimization' hypothesis; and (3) dissect error characteristics across complex terrains and varying cloud regimes. Crucially, this work is not merely a validation exercise; it serves as a foundational quality assurance for the application of FY-4B data in the booming photovoltaic (PV) industry and numerical weather prediction (NWP). The findings will provide a scientific blueprint for correcting historical satellite datasets and offer vital guidance for the deployment of future geostationary constellations.
2. Materials and Methods
2.1. Datasets
2.1.1. Satellite and Ground-Based Radiation Data
Fengyun Satellite Data: The Fengyun–4B (FY-4B) satellite, launched on June 3, 2021, serves as the first operational satellite of the FY–4 series. Between February 1 and March 5, 2024, the satellite underwent a planned orbital drift, adjusting its sub-satellite point from 133°E to 105°E, thereby replacing FY–4A as the primary operational satellite. The DSSR products utilized in this study are derived from observations by the Advanced Geostationary Radiation Imager (AGRI) onboard FY-4B. The product features a nadir spatial resolution of 4 km and a temporal resolution of 15 minutes. The dataset comprises 95 daily files, with a scheduled maintenance gap at 14:15 UTC.
To rigorously isolate the impact of the orbital drift from seasonal variabilities, this study focuses exclusively on the comparative analysis between the boreal summers (June–August) of 2023 (pre-drift) and 2024 (post-drift). This temporal selection strategy serves to control for critical confounding factors: it ensures consistency in the solar zenith angle (SZA) and minimizes environmental discrepancies related to atmospheric composition and surface phenology (e.g., snow cover), thereby allowing any observed performance shifts to be attributed primarily to the optimization of the satellite's VZA. Additionally, as FY-4B commenced stable operations at 105°E in March 2024, the subsequent summer period represents the first continuous and reliable dataset available for validation, ensuring a robust 'apple-to-apple' comparison.
Ground-based Radiation Data: Ground-based radiation measurements were obtained from the China Meteorological Administration (CMA) observation network. The network comprises National Reference Stations, First-order stations, Second-order stations, and Third-order stations, strategically distributed across all provinces in China. The network design focuses on climate-sensitive regions (e.g., the Tibetan Plateau), economically developed zones (e.g., the Yangtze River Delta), and ecologically fragile areas (e.g., the arid Northwest). The spatial spacing ranges from approximately 300 km for national-level stations to 50 km in regionally densified networks. Historical records from select reference stations date back to 1991, offering a temporal resolution of 1 minute.
For this study, 148 stations were selected for the June–August 2023 period, and 165 stations for the June–August 2024 period. Data were acquired from the CMA Data Service Centre. Spatially, the network exhibits a density gradient, being highly concentrated in the eastern and central regions, while remaining relatively sparse yet representative in the western and northwestern regions. A limited number of observation points cover the southern coastal areas and Hainan Island (Figure 1).
2.1.2. Auxiliary Datasets
ERA5 total cloud cover: The ERA5 total cloud cover (TCC) dataset, the fifth generation of ECMWF atmospheric reanalysis, is employed to characterize sky conditions. It assimilates multi-source observations to provide a comprehensive description of cloud coverage. Although FY-4B provides operational cloud products, ERA5 was selected in this study to serve as an independent atmospheric classifier. Specifically, it is utilized to stratify the matched satellite-ground samples into different sky conditions (e.g., clear-sky vs. cloudy) for the regime-dependent error analysis in Section 3. This approach avoids the potential circular dependency where errors in the satellite's internal cloud detection algorithm might mask biases in the radiation retrieval. To mitigate the scale mismatch between the coarse-resolution ERA5 (0.25°) and the fine-resolution satellite product (4 km), bilinear interpolation was applied to the ERA5 grids to spatially align with the ground stations. We acknowledge that this resolution discrepancy may introduce uncertainties, particularly at cloud edges and under broken cloud conditions. However, for the purpose of categorizing general sky conditions (e.g., clear-sky vs. overcast) at a statistical level, ERA5 provides a robust and consistent baseline [19].
Land cover: The land cover type product from the Moderate Resolution Imaging Spectroradiometer (MODIS) is a primary data source for global environmental monitoring. The MODIS land cover dataset offers a long temporal record and diverse classification schemes [20]. This study utilizes the classification scheme based on the Leaf Area Index (LAI), which defines 11 land cover types, including: water bodies (Water), grasses and cereal crops (Grass), shrublands (Shrubs), broadleaf crops (B.Crops), savannas (Savannas), evergreen broadleaf forests (EBF), deciduous broadleaf forests (DBF), evergreen needleleaf forests (ENF), deciduous needleleaf forests (DNF), unvegetated lands (Unvegetated), and urban and built-up areas (Urban). In this study, this dataset serves as the reference for site classification. By extracting the land cover type corresponding to the geographic coordinates of each CMA ground station, we stratified the matched satellite-ground samples into different surface categories. This enables a regime-dependent evaluation to quantitatively assess how surface heterogeneity (e.g., albedo differences and canopy structures) impacts the retrieval accuracy of FY-4B DSR.
2.2. Validation Strategy
2.2.1. Satellite Retrieval Algorithm
The retrieval algorithm for the FY-4B surface shortwave radiation product is based on radiative transfer simulations. It accounts for significant physical processes in the shortwave spectrum, including multiple scattering, absorption, and thermal radiation, to generate a shortwave radiation retrieval Look-Up Table (LUT). Observations from Channels 1–6 of the FY-4B AGRI, combined with the FY-4B L2 Snow product, are used to characterize instantaneous atmospheric and surface states, primarily extinction parameters and surface reflectance. After determining these states and integrating solar and viewing geometries, the surface shortwave radiation is retrieved using the pre-computed LUT. The operational product generates eight parameters, including surface solar radiation, direct/diffuse radiation, and UV components [21]. In this study, the surface solar radiation (DSR) parameter is utilized for validation.
2.2.2. Data Collocation and Quality Control Scheme
To ensure spatial consistency between satellite and ground observations, the FY-4B grid points were first converted from the geostationary projection (GEOS) to the WGS84 coordinate system (latitude/longitude) to align with station coordinates. Subsequently, using station coordinates as indices, the nearest neighbor method was employed to extract the corresponding satellite radiation values. Pixels located in invalid satellite data regions were identified and excluded from the analysis.
To ensure temporal consistency, ground-based radiation records (originally in Beijing Time, BJT) were converted to Coordinated Universal Time (UTC) based on station longitude. To address the temporal mismatch between hourly integrated ground measurements and instantaneous satellite observations, the ground-based processing strategy was refined. Specifically, minute-level ground observations were averaged over the first 15 minutes of each hour (0–15 min) to strictly align with the FY-4B observation window. To ensure data reliability, a validity threshold was applied: the 15-minute average was calculated only if valid data existed for more than 80% of the time steps within the window. Finally, data from both sources were matched by UTC hour, and only time steps containing valid values from both sides were retained to form the paired "station×time" dataset.
Quality control (QC) followed the sequence of first eliminating obvious anomalies, then controlling observation stability, and finally screening matching differences. First, a check based on physical and threshold limits was performed: the valid range for FY-4B is 0–1500 W/m², and for ground observations is 0–2000 W/m²; values exceeding climatic extremes (e.g., higher than the solar constant of 1361 W/m²) were treated as anomalies and removed; nighttime samples (e.g., radiation approaching 0 before sunrise or after sunset) were excluded from the evaluation. Secondly, observation stability was checked to remove constant values (unchanged over consecutive time steps) and obvious abrupt changes. Finally, after spatiotemporal matching, the 3σ rule (three-sigma rule) was applied to the differences between satellite and ground pairs to identify and remove gross errors, thereby reducing the impact of extreme anomalies on the evaluation results. The flowchart of the spatiotemporal matching and quality control is shown in Figure 2.
2.2.3. Statistical Metrics
To evaluate the consistency between FY-4B shortwave radiation products and ground-based observations, the correlation coefficient (R), root mean square error (RMSE), and mean bias error (MBE) were adopted [22,23]. The specific formulas are calculated as follows:
where is the number of matched samples, i is the index of the matched sample, is the satellite value with a mean of and is the observed ground value with a mean of . To comprehensively analyze the discrepancies and patterns between FY-4B shortwave radiation products and ground-based observations, and combining relevant meteorological principles, this study analyzes the consistency of FY-4B products across different dimensions, including elevation, land cover type, and cloud amount.
3. Results
3.1. Overall Accuracy Assessment
To evaluate the performance of FY-4B satellite radiation products before and after the orbital drift, Figure 3 presents the scatter plot comparison between FY-4B shortwave radiation estimates and ground-based observations, along with the corresponding statistical metrics. Overall, the scatter plots align closely with the 1:1 line, confirming the general reliability of the satellite retrievals. However, systematic characteristics are evident in the pre-drift data: the satellite tends to slightly overestimate in the low-radiation range (<100 W/m²) and underestimate in the medium-to-high radiation range (>600 W/m²).
Following the orbital drift, the satellite-ground consistency significantly improved. The R increased from 0.93 to 0.95, while the RMSE decreased from 112.46 W/m² to 99.24 W/m², representing a reduction of approximately 11.8%. MBE shifted from −0.01 W/m² to 2.68 W/m². Although the sign changed, the magnitude remained negligible, suggesting that post-drift errors primarily stem from random scattering rather than systematic bias. The dispersion at high radiation values (>1000 W/m²) increased slightly, indicating that factors such as cloud discrimination uncertainties, aerosol optical variability, or sensor non-linearity might amplify uncertainties under peak radiation conditions [24]. In summary, the FY-4B radiation products post-drift exhibited substantial improvements in correlation, RMSE, and regression slope, while maintaining a near-zero systematic bias.
The monthly scatter plots for June–August (Figure 4) further illustrate that evaluation metrics improved consistently across all summer months after the drift, although the magnitude of improvement varied. The RMSE for June and July decreased significantly from ~120 W/m² to ~102 W/m² (a reduction of ~15%), while August saw a decrease from 112.38 W/m² to 99.79 W/m² (~11%). This demonstrates a comprehensive enhancement in product stability and seasonal robustness following the drift. Regarding bias, monthly variations remained well within ±10 W/m². Regression parameters also indicated an overall upward adjustment in slope post-drift (increasing from 0.84–0.86 to 0.85–0.89). Notably, in August, the slope rose to 0.89 and the intercept dropped to 43.97 W/m², suggesting that the underestimation problem in high-value areas during summer is significantly alleviated.
These improvements are closely linked to the satellite's orbital adjustment. The westward shift of the sub-satellite point to 105°E optimized the viewing geometry for Northwest China, reducing geometric distortions and atmospheric path lengths. Consequently, the post-drift FY-4B radiation products demonstrated higher correlation, lower RMSE, and regression relationships closer to ideal consistency.
3.2. Spatial Distribution of Errors
While the overall metrics confirm a nationwide improvement post-drift, it is crucial to investigate whether these performance gains are spatially uniform across the vast and heterogeneous Chinese territory. In terms of spatial distribution, the FY-4B shortwave radiation products exhibited a distinct "East-West disparity" (Figure 5). Before the drift, the plains in the eastern and central regions generally showed high consistency (R ≥ 0.93), whereas the western mountainous and plateau regions showed significantly lower correlations. The RMSE was generally below 110 W/m² in the southeast coast, North China, and Central China, but was significantly elevated in the inland northwest and the Tibetan Plateau, reaching 150–200 W/m² at some stations.
After the drift, FY-4B DSSR products quality improved significantly nationwide. In the eastern and central regions, R values rose above 0.95, RMSE generally decreased by 10–30 W/m², and the positive bias converged. While consistency in the western and plateau regions also improved (R rebounded to 0.92–0.94) and RMSE dropped to 120–140 W/m², systematic underestimation persisted. These spatial changes highlight a typical regional mode where high consistency and low error prevail in the eastern plains, while lower consistency and underestimation characterize the western plateau.
The aforementioned spatial distribution is closely related to terrain influence and atmospheric environment variations. The eastern region features gentle terrain and relatively stable aerosols, facilitating accurate retrievals. Conversely, in the Tibetan Plateau and other complex terrain areas, variations in slope, aspect, local shading, and sky view factor significantly modulate surface shortwave radiation. If the satellite retrieval algorithm ignores these three-dimensional effects, it is prone to systematic underestimation [25]. Furthermore, the high variability in snow cover and surface albedo on the plateau may lead satellites to misclassify snow or high-albedo areas as clouds [26]. Additionally, potential underestimation of aerosol loads in the eastern region in the retrieval algorithm could contribute to the observed overestimation of satellite radiation [27,28].
Figure 6 further presents the sequence of evaluation metrics for each station, sorted by longitude and latitude. Overall, R shifted upwards and converged noticeably after the drift, with most stations stabilizing in the 0.94–0.97 range. The distribution of RMSE values narrowed significantly: pre-drift outliers exceeding 200 W/m² were largely eliminated. Isolated peaks remained near longitude 115°E and latitude 30–35°N, likely related to complex terrain and cloud fields in these specific locations. The Bias converged from large fluctuations to a narrower range (predominantly within ±50 W/m²). The west negative and east positive longitudinal gradient weakened significantly after the drift.
The observed convergence indicates that the stability and consistency of FY-4B shortwave radiation products on a national scale have improved after the drift, characterized by increased R, reduced extreme high RMSE values, and diminished MBE fluctuations. This has resulted in more balanced performance across stations in different longitudinal and latitudinal zones. The remaining RMSE peaks are mostly located in areas with complex terrain and cloud fields, likely related to factors such as local terrain undulation, cloud edges, and spatiotemporal mismatches. The residual negative bias in high latitudes is also consistent with the background of low solar elevation angles and extended optical paths in winter. Overall, the improvements post-drift are more obvious in the eastern, central, and plain regions, while the western plateau and complex terrain areas, despite showing progress, remain relatively concentrated.
3.3. Dependence on Environmental Factors
To further understand the sources of errors, we analyzed the satellite-ground consistency under different conditions of land cover, elevation, and cloud amount.
3.3.1. Land Cover Types
Figure 7 illustrates the performance discrepancies across different land surfaces. Pre-drift, water bodies, broadleaf crops, and urban areas exhibited robust performance (R > 0.93, RMSE: 90–120 W/m²). In contrast, deciduous broadleaf forests (DBF) and non-vegetated lands showed significant errors, with RMSE reaching 173.9 W/m² and 170.7 W/m², respectively. Post-drift, improvements were substantial in homogeneous regions: R for water bodies and crops increased to 0.96-0.97, and RMSE dropped to 80–97 W/m². Urban areas also maintained high accuracy (RMSE ~94.66 W/m²). However, challenges persisted in complex canopies: while correlation improved in forests, systematic biases remained unstable (e.g., DBF MBE shifted from +29.86 to −37.46 W/m²). Non-vegetated lands continued to suffer from severe underestimation (Bias: −92.03 W/m²), indicating limited improvement over high-albedo surfaces.
3.3.2. Elevation Dependence
The error characteristics show a clear altitudinal gradient (Figure 8). Low-altitude regions (1–60 m) consistently performed best, maintaining high R (0.94–0.96) and low RMSE (85–105 W/m²) both pre- and post-drift. In medium-to-high altitudes (960–2800 m), the orbital drift brought significant gains: R rose from 0.84 to 0.93–0.95, and RMSE decreased from 150 W/m² to 101–122 W/m². However, in extremely high-altitude regions (>2800 m), despite a reduction in RMSE (from 167.5 to 139.6 W/m²), a strong negative bias persists (−50 W/m²), highlighting the difficulty of retrieval over the Tibetan Plateau.
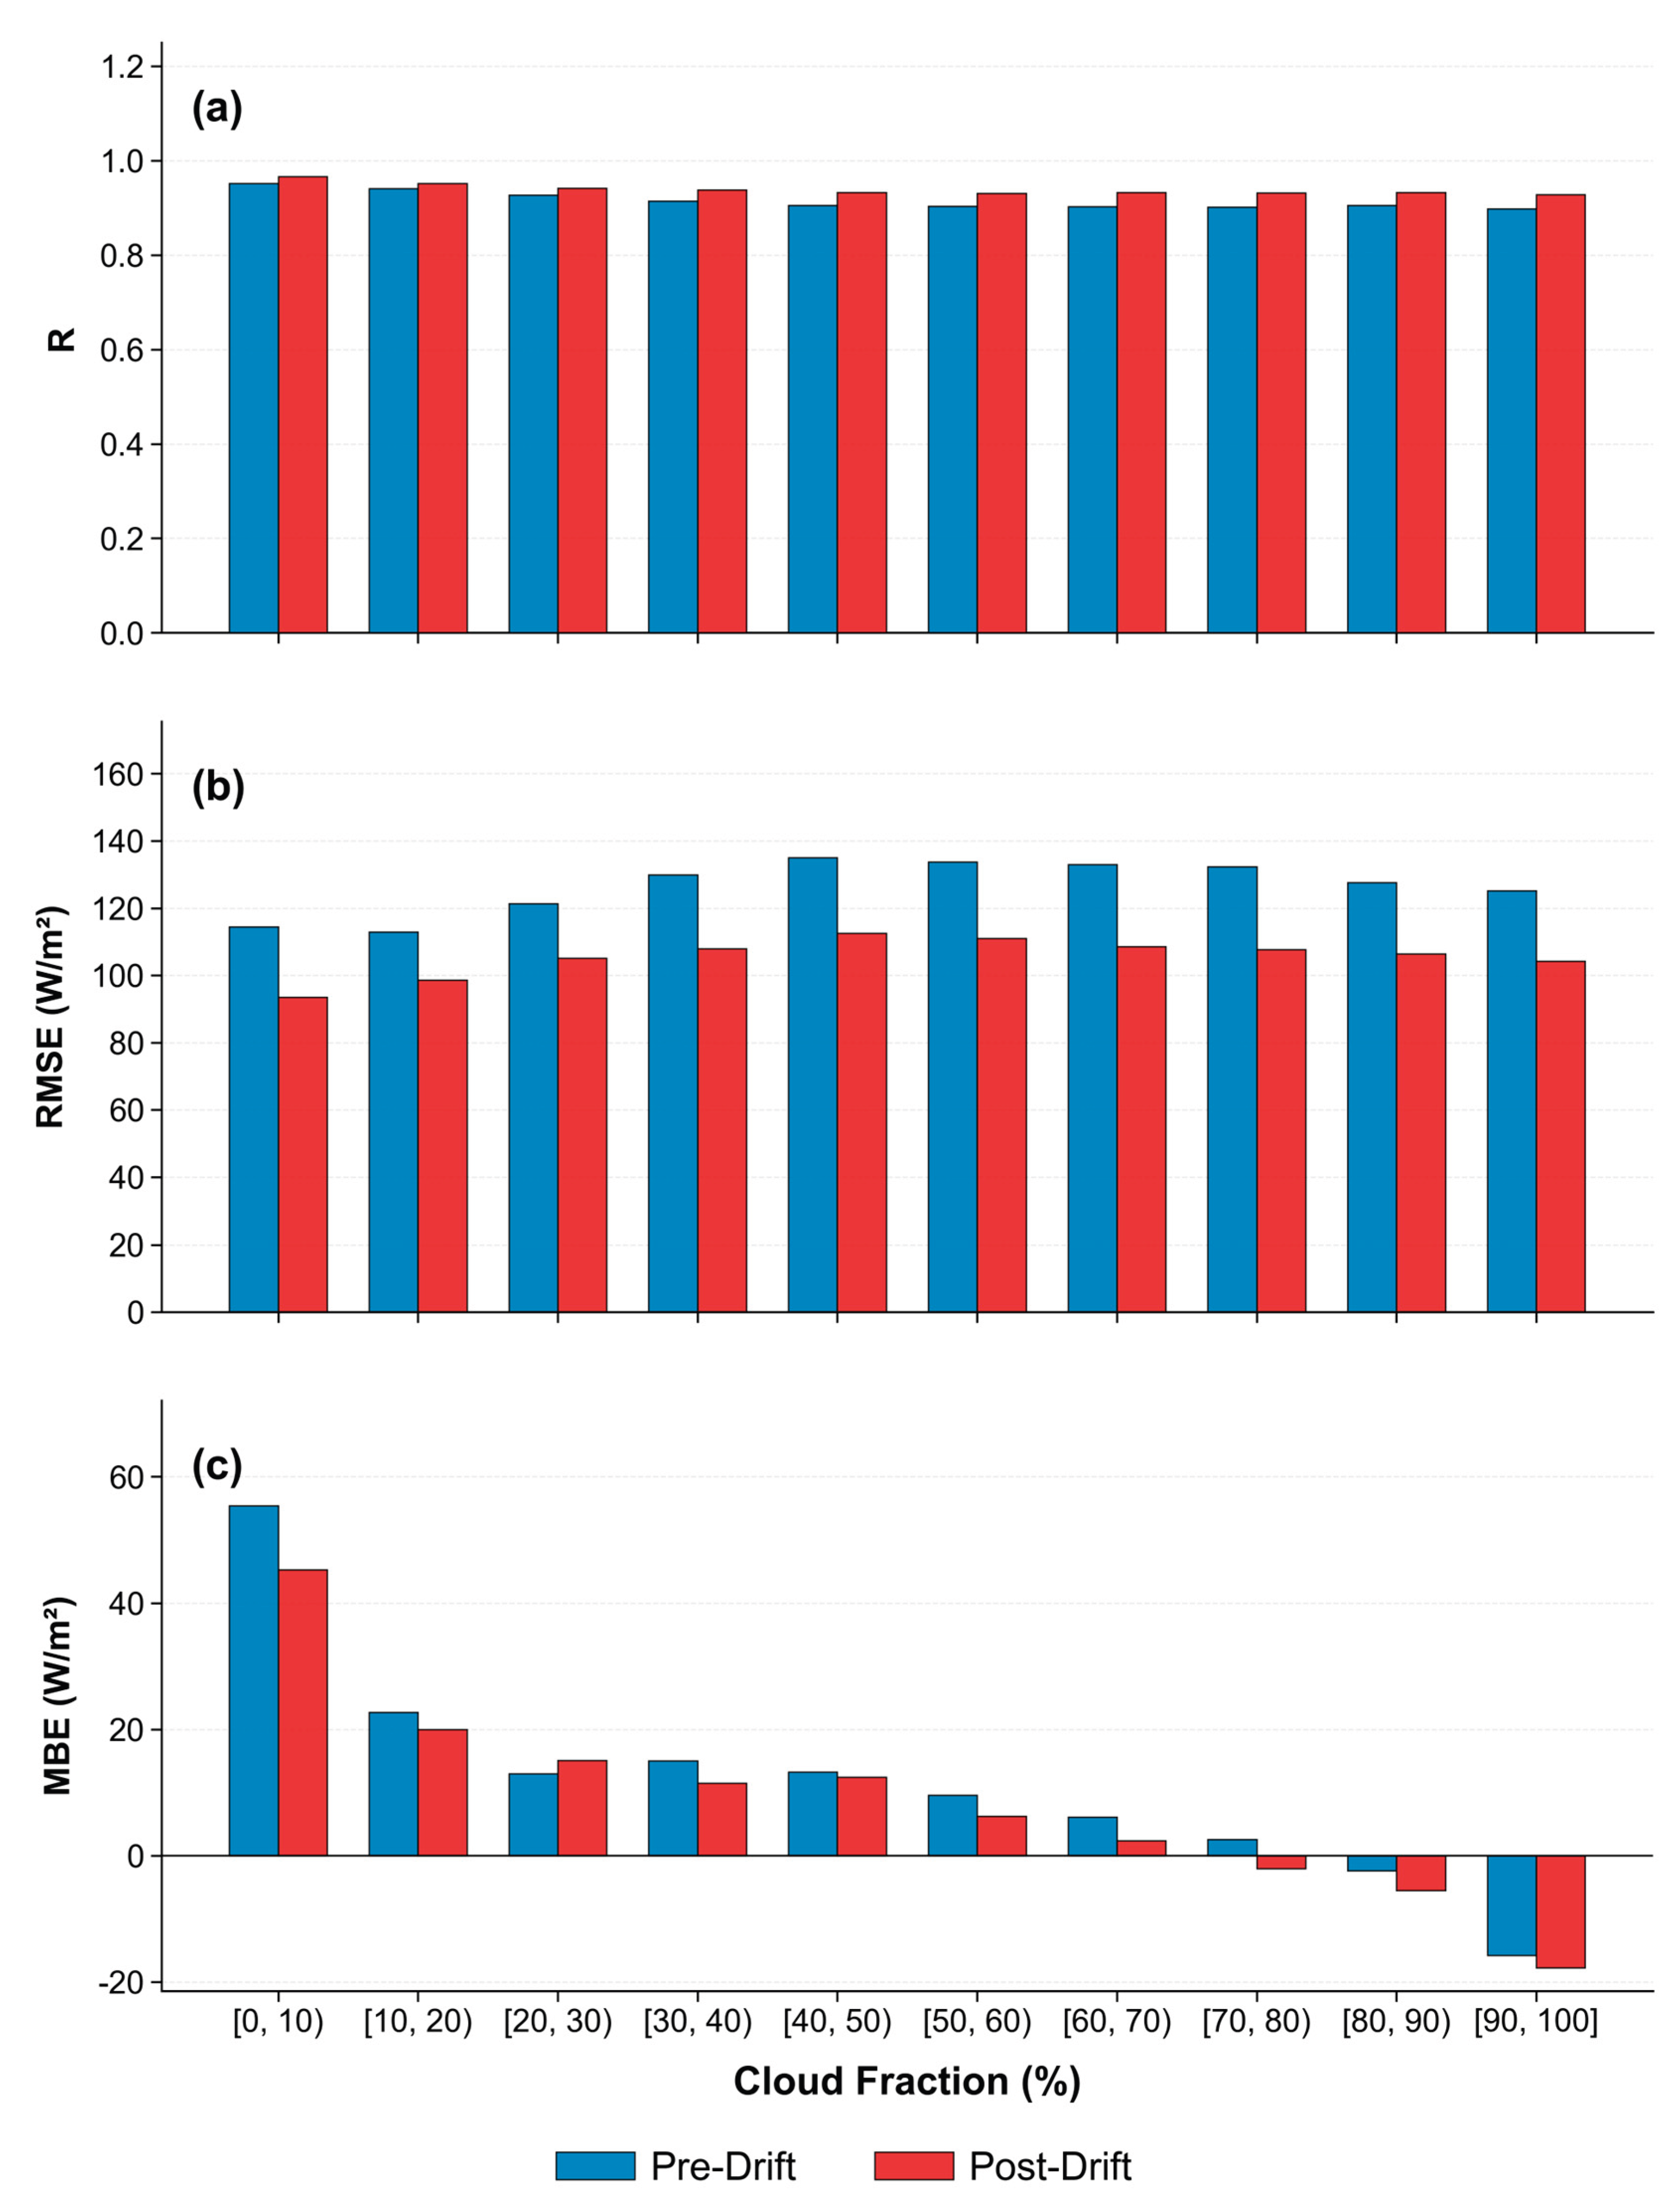
3.3.3. Cloud Conditions
Categorized by ERA5 total cloud cover (Figure 9), the product shows marked sensitivity to sky conditions. Post-drift, performance improved across all regimes. Under clear-sky conditions (Cloud < 0.1), R increased to 0.97, and RMSE dropped to 93.5 W/m², although a positive bias (+45.3 W/m²) remained. Under overcast conditions (Cloud > 0.9), the previous underestimation was mitigated (MBE narrowed to −17.8 W/m²), and RMSE decreased by about 20 W/m². The positive MBE in clear-sky/negative bias in overcast pattern persists but has been significantly dampened by the orbital optimization.
4. Discussion
4.1. Impact of Observation Geometry on Retrieval Accuracy
The most significant finding of this study is the marked improvement in satellite-ground consistency following the orbital drift of FY-4B to 105°E. This enhancement is theoretically driven by the optimization of the VZA. When positioned at 133°E, FY-4B observed the majority of China, particularly the western regions, at high slant angles. Large VZAs amplify the "bowtie effect" (pixel expansion) and geometric distortions, leading to substantial spatiotemporal mismatches between satellite pixels and ground stations [18]. Furthermore, longer atmospheric optical paths at high VZAs exacerbate signal attenuation by aerosols and water vapor [17]. The shift to 105°E places the satellite directly over Central China, providing a near-nadir view that minimizes these geometric and atmospheric path-induced errors. This geometric optimization explains the nationwide convergence of RMSE and the reduction of systematic bias observed in our results.
4.2. Physical Sources of Residual Errors
Despite the orbital optimization, challenges persist in regions with complex surface and atmospheric conditions. Our analysis identifies two primary physical sources for these residual errors:
(1) Surface Anisotropy and Topographic Effects: The notable errors in forest areas (e.g., Deciduous Broadleaf Forests) and high-altitude terrains suggest limitations in the current algorithm's handling of surface heterogeneity. Forests exhibit complex canopy structures that generate strong bidirectional reflectance distribution function (BRDF) effects, causing non-Lambertian reflection that satellites may misinterpret [29,30]. Similarly, in rugged terrains like the Tibetan Plateau, neglecting 3D topographic effects (e.g., slope, aspect, and mountain shadowing) leads to the systematic underestimation observed in our high-altitude results (Figure 8), consistent with findings by Xian et al. [31], as well as classic topographic models [32,33] and recent simulations by Hao et al. [34].
(2) Cloud 3D Effects and Parallax: The performance disparity under varying cloud conditions (Figure 9) highlights the impact of cloud heterogeneity. While the orbital drift reduced general geometric mismatches, the cloud parallax effect where the satellite-observed cloud position shifts relative to the ground station remains a source of error under thick cloud conditions. Additionally, spatiotemporal mismatches are exacerbated by fast-moving or broken clouds, leading to the observed instability in transition zones [18]. Future algorithms must incorporate rigorous topographic corrections and 3D cloud radiative transfer models to address these physical limitations.
4.3. Benchmarking Against International Standards
To contextualize the quality of the post-drift FY-4B product, we compared our metrics with existing validations of the Himawari-8/9 satellites, which are widely regarded as the benchmark for East Asian geostationary observations. The post-drift RMSE (99.24 W/m²) and Correlation Coefficient (0.95) of FY-4B are highly comparable to those reported for Himawari-8 over China (RMSE ~90–110 W/m²) [11,35]. This indicates that FY-4B has achieved a level of radiometric accuracy and product stability that aligns with international operational standards [36]. Furthermore, compared to its predecessor FY–4A [6,9,37], FY-4B demonstrates a clear generation-over-generation improvement. These validated high-fidelity records confirm that FY-4B is operationally ready to support critical applications, including photovoltaic energy assessment and data assimilation in numerical weather prediction models.
5. Conclusions
This study systematically evaluated the FY-4B surface shortwave radiation product using ground observations from the CMA network. By comparing performance before and after the satellite's orbital drift from 133°E to 105°E, and analyzing dependencies on environmental factors, we drew the following conclusions:
1.Significant improvement in retrieval accuracy and spatial homogeneity. Following the orbital drift, the overall accuracy of the FY-4B DSSR product in summer significantly improved. The correlation coefficient (R) increased from 0.93 to 0.95, and the RMSE decreased by 11.8% (from 112.46 to 99.24 W/m²), with the Mean Bias Error converging to a negligible level (2.68 W/m²). Crucially, the orbital optimization mitigated the historical "East-West accuracy disparity," significantly reducing geometric distortions and retrieval errors in Western China.
2.Performance variations across land covers. The product demonstrated high robustness over homogeneous surfaces such as water bodies, croplands, and urban areas (R > 0.94, RMSE: 80–100 W/m²). However, challenges persist over complex canopies. Specifically, forest regions exhibited a polarity shift in bias (from overestimation to underestimation), and non-vegetated lands remained systematically underestimated. These residual errors suggest limitations in the current algorithm's handling of surface anisotropy (BRDF) and albedo variability.
3.Elevation dependence and topographic limitations. A clear altitudinal gradient in performance was observed. While the orbital drift significantly improved accuracy in medium-to-high altitude regions (960–2800 m) by optimizing the Viewing Zenith Angle, extremely high-altitude regions (>2800 m) continue to suffer from significant underestimation. This underscores the necessity of incorporating 3D topographic effects (e.g., mountain shadowing) into future retrieval algorithms.
4.Sensitivity to cloud regimes. The consistency between satellite and ground observations improved under all sky conditions post-drift. Notably, the systematic negative bias under overcast conditions was effectively mitigated, and clear-sky accuracy reached high levels (R=0.97). However, instability remains in transition zones (cloud edges) and under low solar elevation angles, indicating room for improvement in cloud 3D radiative transfer modeling.
In summary, the orbital drift to 105°E has fundamentally optimized the viewing geometry of FY-4B over China, elevating its DSSR product accuracy to a level comparable with international benchmarks like Himawari-8. While this study confirms the product's readiness for operational applications in solar energy assessment and NWP, the specific validation over the summer season points to the need for a full-year assessment. Future work will focus on addressing the identified challenges in complex terrains and extending the validation to winter conditions to account for seasonal variations in solar geometry and snow cover.
Author Contributions
Conceptualization, M.W. and W.Z.; methodology, M.W.; software, M.W.; validation, M.W., B.L. and Y.C.; formal analysis, Y.C.; investigation, M.W.; resources, W.Z.; data curation, M.W.; writing—original draft preparation, M.W.; writing—review and editing, W.Z.; visualization, M.W.; supervision, W.Z.; project administration, W.Z.; funding acquisition, M.W. and W.Z. All authors have read and agreed to the published version of the manuscript.
Funding
This research was funded by the Hubei Provincial Natural Science Foundation Youth Project (grant number 2023AFB543), the Natural Science Foundation of Hubei Province (grant number 2022CFD017), the Joint Research Project for Meteorological Capacity Improvement (grant number 24NLTSQ017), and the CMA Key Open Laboratory of Transforming Climate Resources to Economy (grant number 2025004K).
Data Availability Statement
Publicly available datasets were analyzed in this study. The FY-4B satellite data can be found here: [http://satellite.nsmc.org.cn]. ERA5 reanalysis data can be found here: [https://cds.climate.copernicus.eu]. MODIS Land Cover products are available here: [https://search.earthdata.nasa.gov]. The ground-based radiation observations from the CMA network are available upon request from the China Meteorological Administration (http://data.cma.cn) due to privacy restrictions.
Acknowledgments
We express our sincere gratitude to the National Satellite Meteorological Center (NSMC) for providing the FY-4B satellite products and technical support. We also thank the China Meteorological Administration (CMA) for maintaining the high-quality ground radiation observation network, which served as the ground truth for this validation. We acknowledge the European Centre for Medium-Range Weather Forecasts (ECMWF) for providing the ERA5 reanalysis datasets and the NASA Land Processes Distributed Active Archive Center (LP DAAC) for the MODIS land cover products. During the preparation of this work, the authors used ChatGPT/Claude in order to improve readability and language editing. After using this tool/service, the authors reviewed and edited the content as needed and take full responsibility for the content of the publication.
Conflicts of Interest
The authors declare no conflict of interest.
Abbreviations
The following abbreviations are used in this manuscript:
| FY-4B | Fengyun-4B Satellite |
| AGRI | Advanced Geostationary Radiation Imager |
| DSSR | Downward Surface Shortwave Radiation |
| CMA | China Meteorological Administration |
| NSMC | National Satellite Meteorological Center |
| VZA | Viewing Zenith Angle |
| SZA | Solar Zenith Angle |
| RMSE | Root Mean Square Error |
| MBE | Mean Bias Error |
| UTC | Coordinated Universal Time |
| BJT | Beijing Time |
| ERA5 | ECMWF Reanalysis v5 |
| MODIS | Moderate Resolution Imaging Spectroradiometer |
| BRDF | Bidirectional Reflectance Distribution Function |
| NWP | Numerical Weather Prediction |
References
- Sharifi, E.; Steinacker, R.; Saghafian, B. Multi time-scale evaluation of high-resolution satellite-based precipitation products over northeast of Austria. Atmos. Res. 2018, 206, 46–63. [Google Scholar] [CrossRef]
- Tang, W.; Yang, K.; He, J.; Qin, J. Quality control and estimation of global solar radiation in China. Sol. Energy 2010, 84, 466–475. [Google Scholar] [CrossRef]
- Tang, W.J.; Yang, K.; Qin, J.; Cheng, J.; He, J. First effort for constructing a direct solar radiation data set in China for solar energy applications. J. Geophys. Res. Atmos. 2018, 123, 1724–1734. [Google Scholar] [CrossRef]
- Yang, J.; Zhang, Z.; Wei, C.; Lu, F.; Guo, Q. Introducing the new generation of Chinese geostationary weather satellites, Fengyun–4. Bull. Am. Meteorol. Soc. 2017, 98, 1637–1658. [Google Scholar] [CrossRef]
- Chen, L.; Xu, N.; Wang, J.; et al. FengYun satellites: From observations to quantitative applications. Natl. Remote Sens. Bull. 2025, 29, 1462–1479. (In Chinese) [Google Scholar]
- Sun, X.D.; Li, Z.G.; Ma, Y.; et al. Accuracy evaluation of FY–4A shortwave radiation products based on the national radiation network. Meteorol. Sci. Technol. 2021, 49, 665–673. (In Chinese) [Google Scholar]
- Ding, L.G. Applicability of FY–4A surface solar radiation products in the Guizhou Plateau mountainous area. Plateau Meteorol. 2022, 41, 1550–1561. (In Chinese) [Google Scholar]
- Liang, J.Q.; Shen, Y.B.; Hu, L.Q.; et al. Applicability of FY–4A surface downward shortwave radiation products in the Shanxi Plateau. Meteorol. Mon. 2020, 46, 1575–1585. (In Chinese) [Google Scholar]
- Wang, C.H. Validation and correction of FY–4A surface solar radiation products: A case study in Anhui Province. Meteorol. Mon. 2021, 47, 1123–1135. (In Chinese) [Google Scholar]
- Liu, J.J.; Shi, C.X.; Jia, B.H.; et al. Retrieval and dataset evaluation of FY-2E surface solar radiation. J. Remote Sens. 2018, 33, 104–110. (In Chinese) [Google Scholar]
- Liu, C.; Ren, L.Q.; Li, X.J.; et al. Solar energy resource assessment over the northern sandy regions of China during 1990–2019. Plateau Meteorol. 2021, 40, 1213–1223. (In Chinese) [Google Scholar]
- Huang, C.; He, J.; Yang, K.; et al. Intercomparison of surface solar radiation products from Fengyun–4A and Himawari-8 over East Asia. Remote Sens. 2021, 13, 2315. [Google Scholar]
- Habte, A.; Sengupta, M.; Lopez, A.; et al. Evaluation of the National Solar Radiation Database (NSRDB): 1998–2015; NREL/TP-5D00-67461; National Renewable Energy Laboratory (NREL): Golden, CO, USA, 2017. [Google Scholar]
- Letu, H.; Ma, R.; Xu, J.; Wang, T.; Shang, H.; Chen, L. …& Shi, J. Surface solar radiation compositions observed from Himawari-8/9 and Fengyun–4 series. Bull. Am. Meteorol. Soc. 2023, 104, E1772–E1789. [Google Scholar] [CrossRef]
- Tian, L.; Chen, L.; Zhang, P.; Hu, B.; Gao, Y.; Si, Y. The Ground-Level Particulate Matter Concentration Estimation Based on the New Generation of FengYun Geostationary Meteorological Satellite. Remote Sens. 2023, 15, 1459. [Google Scholar] [CrossRef]
- Huang, S.Y.; Xu, G.Q. Impacts of FY–4A LMIE lightning data on cloud initialization and NWP experiments. Plateau Meteorol. 2020, 39, 378–392. (In Chinese) [Google Scholar]
- Yang, L.; Zhang, X.; Xu, J.; Liang, S. Validation of the Himawari-8 surface downward shortwave radiation product over China. Remote Sens. 2022, 14, 682. [Google Scholar]
- Urraca, R.; Lanconelli, C.; Gobron, N. Impact of the spatio-temporal mismatch between satellite and in situ measurements on validations of surface solar radiation. J. Geophys. Res. Atmos. 2024, 129, e2024JD041007. [Google Scholar] [CrossRef]
- Hersbach, H.; Bell, B.; Berrisford, P.; et al. The ERA5 global reanalysis. Q. J. R. Meteorol. Soc. 2020, 146, 1999–2049. [Google Scholar] [CrossRef]
- Xu, Y.; Liu, Y.; Wei, M.; et al. Land-cover classification of the Yangtze River Delta region based on MODIS data. Acta Geogr. Sin. 2007, 62, 649–658. (In Chinese) [Google Scholar]
- Hu, L.; Li, B.; Si, Y.; et al. Instruction Manual for FY-4B Surface Shortwave Radiation Product; National Satellite Meteorological Center: Beijing, China, 2023. (In Chinese) [Google Scholar]
- Ma, R.; Husiletu; Shang, H.Z.; et al. Calculation of surface downward shortwave radiation based on Himawari-8 atmospheric products. J. Remote Sens. 2019, 23, 924–934. (In Chinese) [Google Scholar]
- Qin, W.; Wang, L.; Lin, A.; Zhang, M.; Xia, X.; Hu, B.; Niu, Z. Comparison of deterministic and data-driven models for solar radiation estimation in China. Renew. Sustain. Energy Rev. 2018, 81, 579–594. [Google Scholar] [CrossRef]
- Si, Y.; Gao, L.; Chen, L.; et al. An adaptive dark-target algorithm for retrieving land AOD applied to FY-4B/AGRI data. IEEE J. Sel. Top. Appl. Earth Obs. Remote Sens. 2024, 17, 3408251. [Google Scholar] [CrossRef]
- Wu, S.; Yan, G.; Mu, X. Characterization of remote sensing albedo over sloped surfaces. J. Geophys. Res. Atmos. 2018, 123, 9367–9382. [Google Scholar] [CrossRef]
- He, T.; Liang, S.; Song, D.-X.; Jia, K. Analysis of global land surface albedo climatology and spatial-temporal variation. J. Geophys. Res. Atmos. 2014, 119, 10281–10298. [Google Scholar]
- Xu, J.; Guo, J.; Zhao, C.; Min, M.; Li, J. Impact of aerosol optical depth on surface solar radiation in the Shanghai megacity, China. Atmos. Chem. Phys. 2011, 11, 3281–3295. [Google Scholar] [CrossRef]
- Song, Y.; Zhou, T.; Xu, Z.; Huang, G. Aerosol direct radiative and cloud adjustment effects over eastern China. J. Clim. 2019, 32, 4951–4967. [Google Scholar] [CrossRef]
- Schaaf, C.B.; Gao, F.; Strahler, A.H.; Lucht, W.; Li, X.; Tsang, T. …Roy, D. First operational BRDF, albedo nadir reflectance products from MODIS. Remote Sens. Environ. 2002, 83, 135–148. [Google Scholar] [CrossRef]
- Yang, J.; Wang, Z.; Xing, H.; et al. Impact of BRDF spatiotemporal smoothing on land surface albedo. Remote Sens. 2022, 14, 2001. [Google Scholar] [CrossRef]
- Xian, Y.; Wang, T.; Leng, W.; Letu, H.; Shi, J.; Wang, G. …Zheng, Y. Can topographic effects on solar radiation be ignored: Evidence from the Tibetan Plateau. Geophys. Res. Lett. 2024, 51, e2024GL108653. [Google Scholar] [CrossRef]
- Dubayah, R.; Rich, P.M. Topographic solar radiation models for GIS. Int. J. Geogr. Inf. Syst. 1995, 9, 405–419. [Google Scholar] [CrossRef]
- Ruiz-Arias, J.A.; Cebecauer, T.; Tsuruta, T.; Huld, T. A comparative analysis of DEM-based general solar radiation models. J. Geophys. Res. Atmos. 2009, 114, D17. [Google Scholar]
- Hao, D.; Li, L.; Liu, Y.; et al. A parameterization of sub-grid topographical effects on solar radiation in the E3SM Land Model version 1.0: Implementation and evaluation over the Tibetan Plateau. Geosci. Model Dev. 2021, 14, 6273–6293. [Google Scholar] [CrossRef]
- Damiani, A.; Irie, H.; Horio, T.; Takamura, T.; Khatri, P.; Takenaka, H.; Cordero, R.R. Evaluation of Himawari-8 surface downwelling solar radiation by ground-based measurements. Atmos. Meas. Tech. 2018, 11, 2501–2521. [Google Scholar] [CrossRef]
- Huang, G.; Liu, Q.; Liang, S. Estimating surface solar irradiance from satellites. Remote Sens. Environ. 2019, 233, 111278. [Google Scholar] [CrossRef]
- Chen, L.-H.; Zhang, Y.-L.; Song, Y.-Y. Accuracy analysis of FY–4A shortwave radiation products in the Heihe River Basin. Chin. J. Ecol. 2021, 40, 292–300. (In Chinese) [Google Scholar]
Figure 1.
Spatial distribution of ground−based radiation observation stations in China.
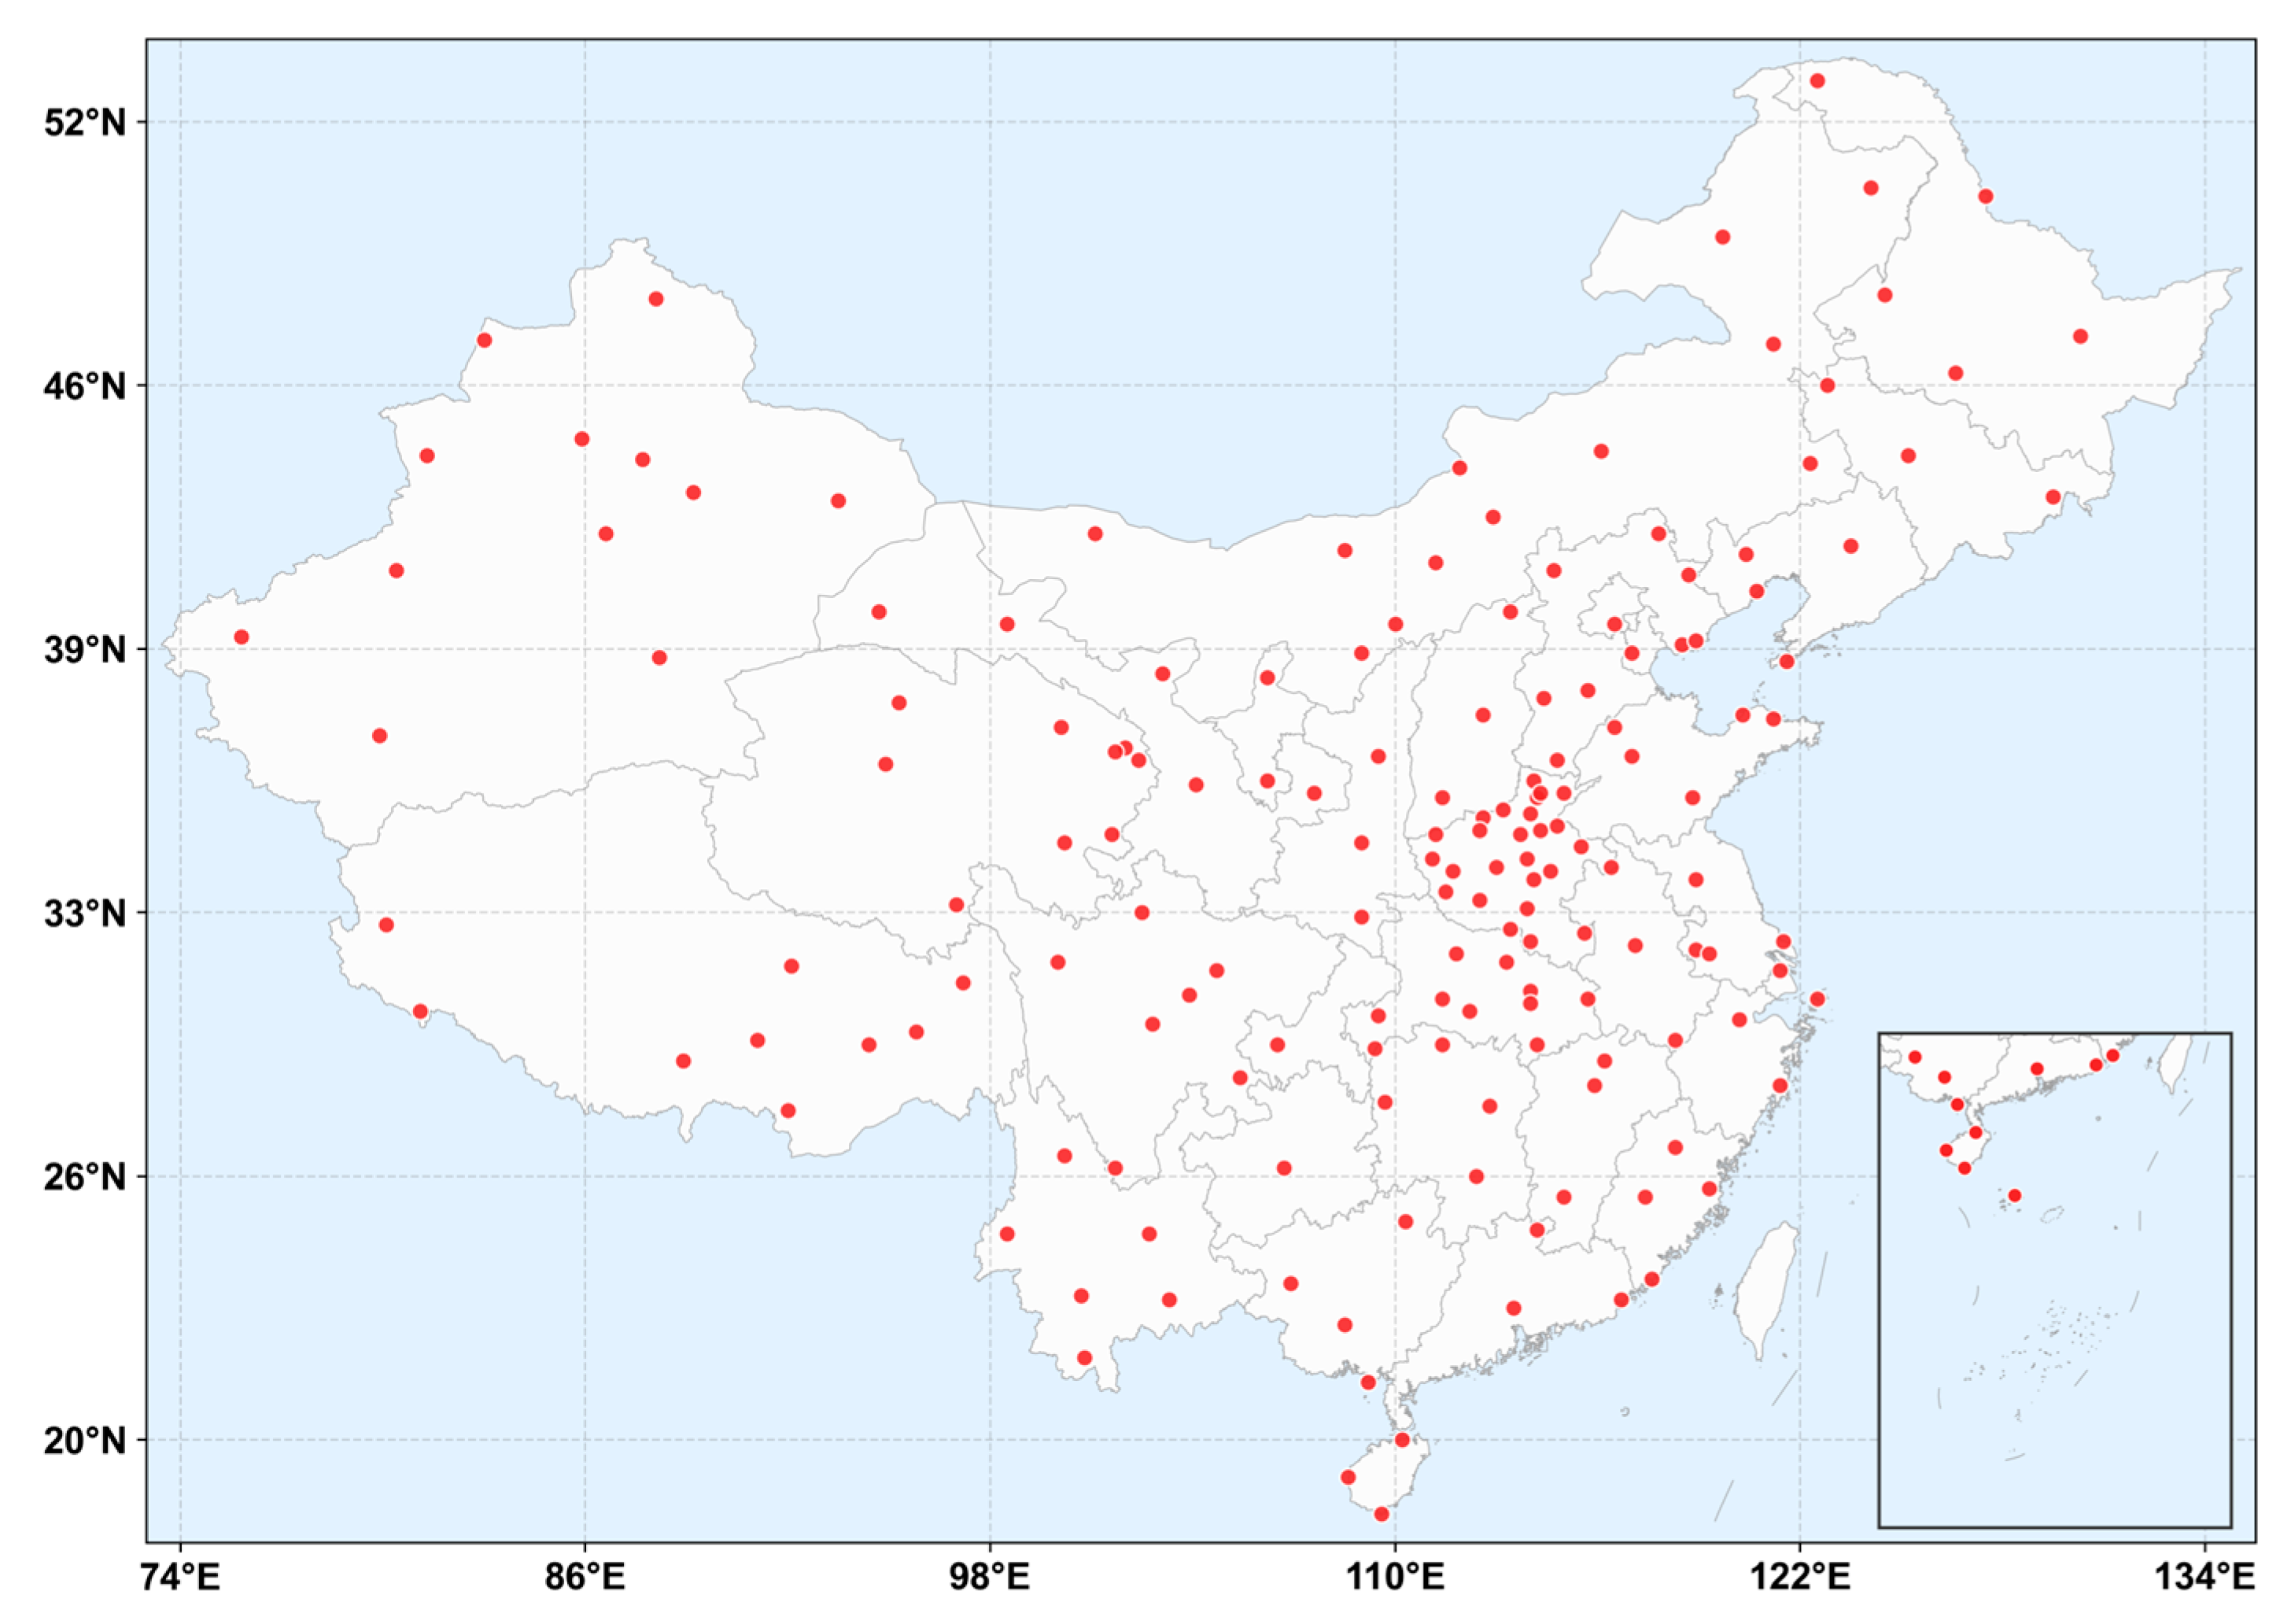
Figure 2.
Flowchart of spatiotemporal matching and quality control processes.
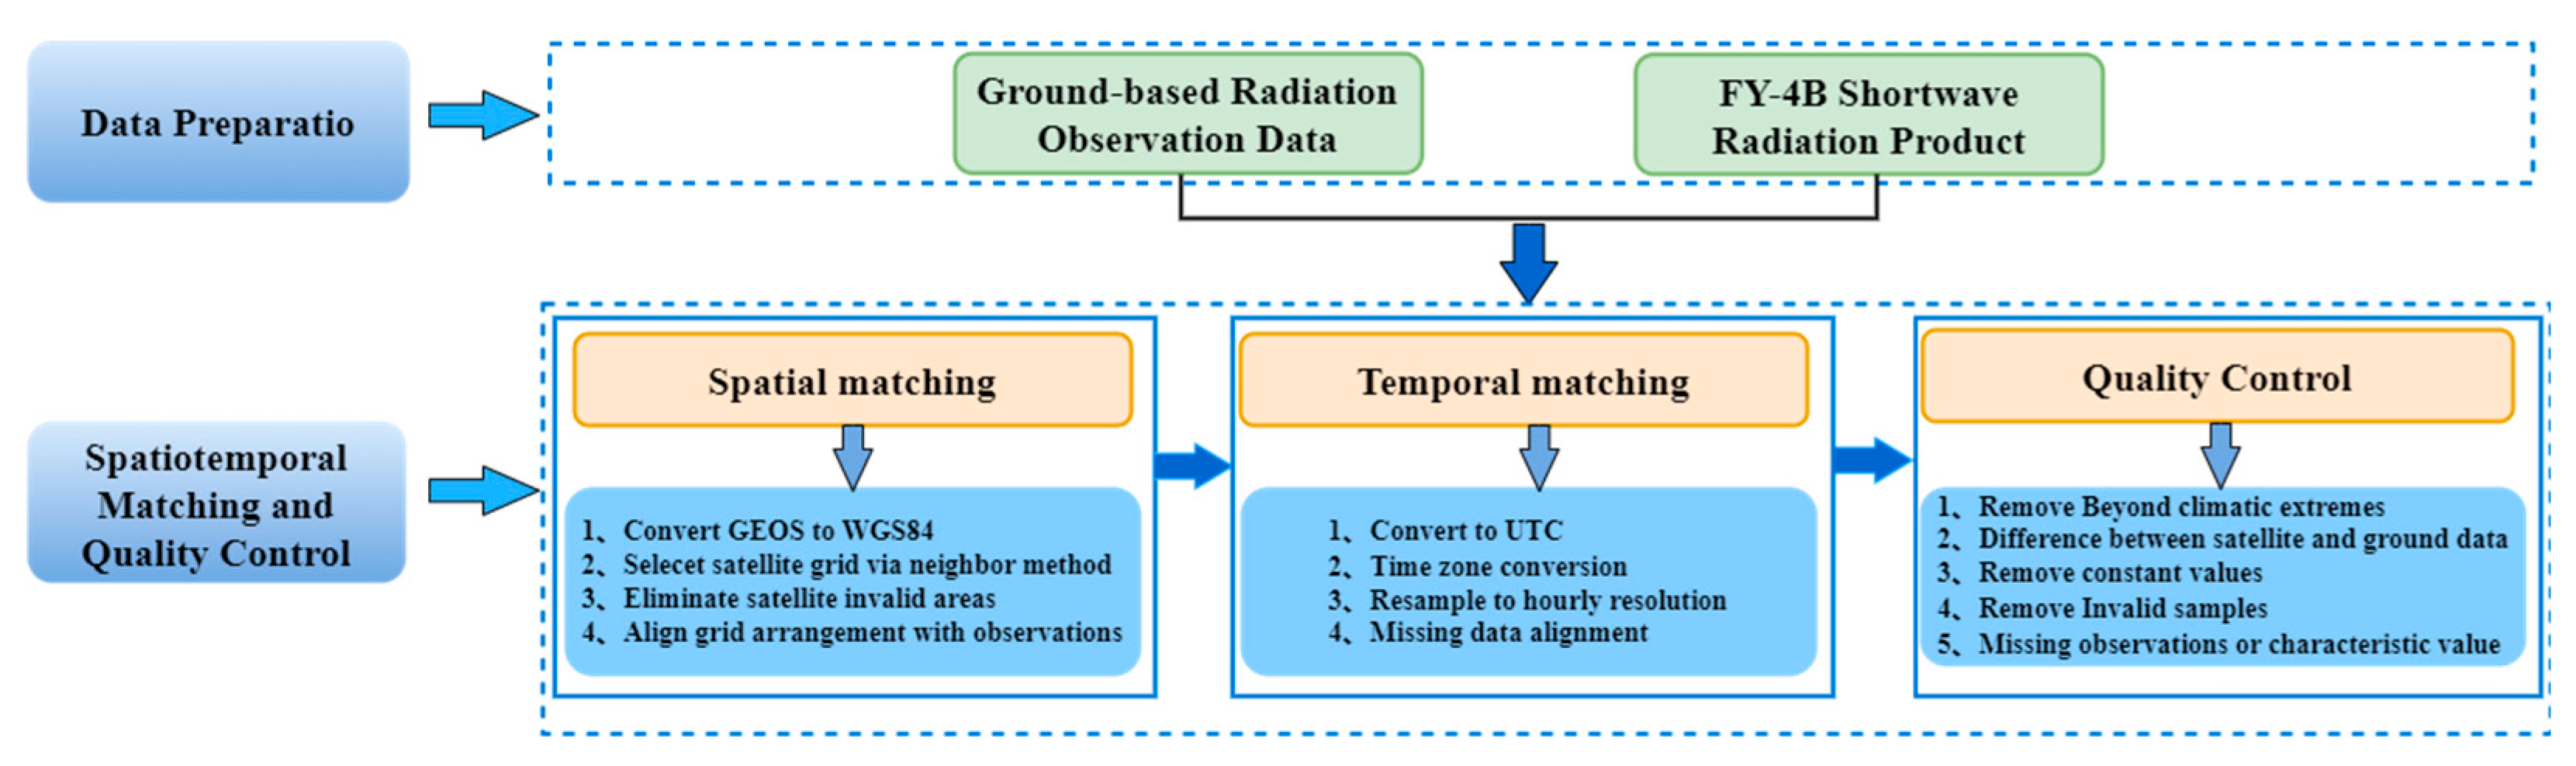
Figure 3.
Scatterplots of ground−based v.s. FY−4B satellite irradiance pre-drift (left) and post-drift (right).
Figure 3.
Scatterplots of ground−based v.s. FY−4B satellite irradiance pre-drift (left) and post-drift (right).
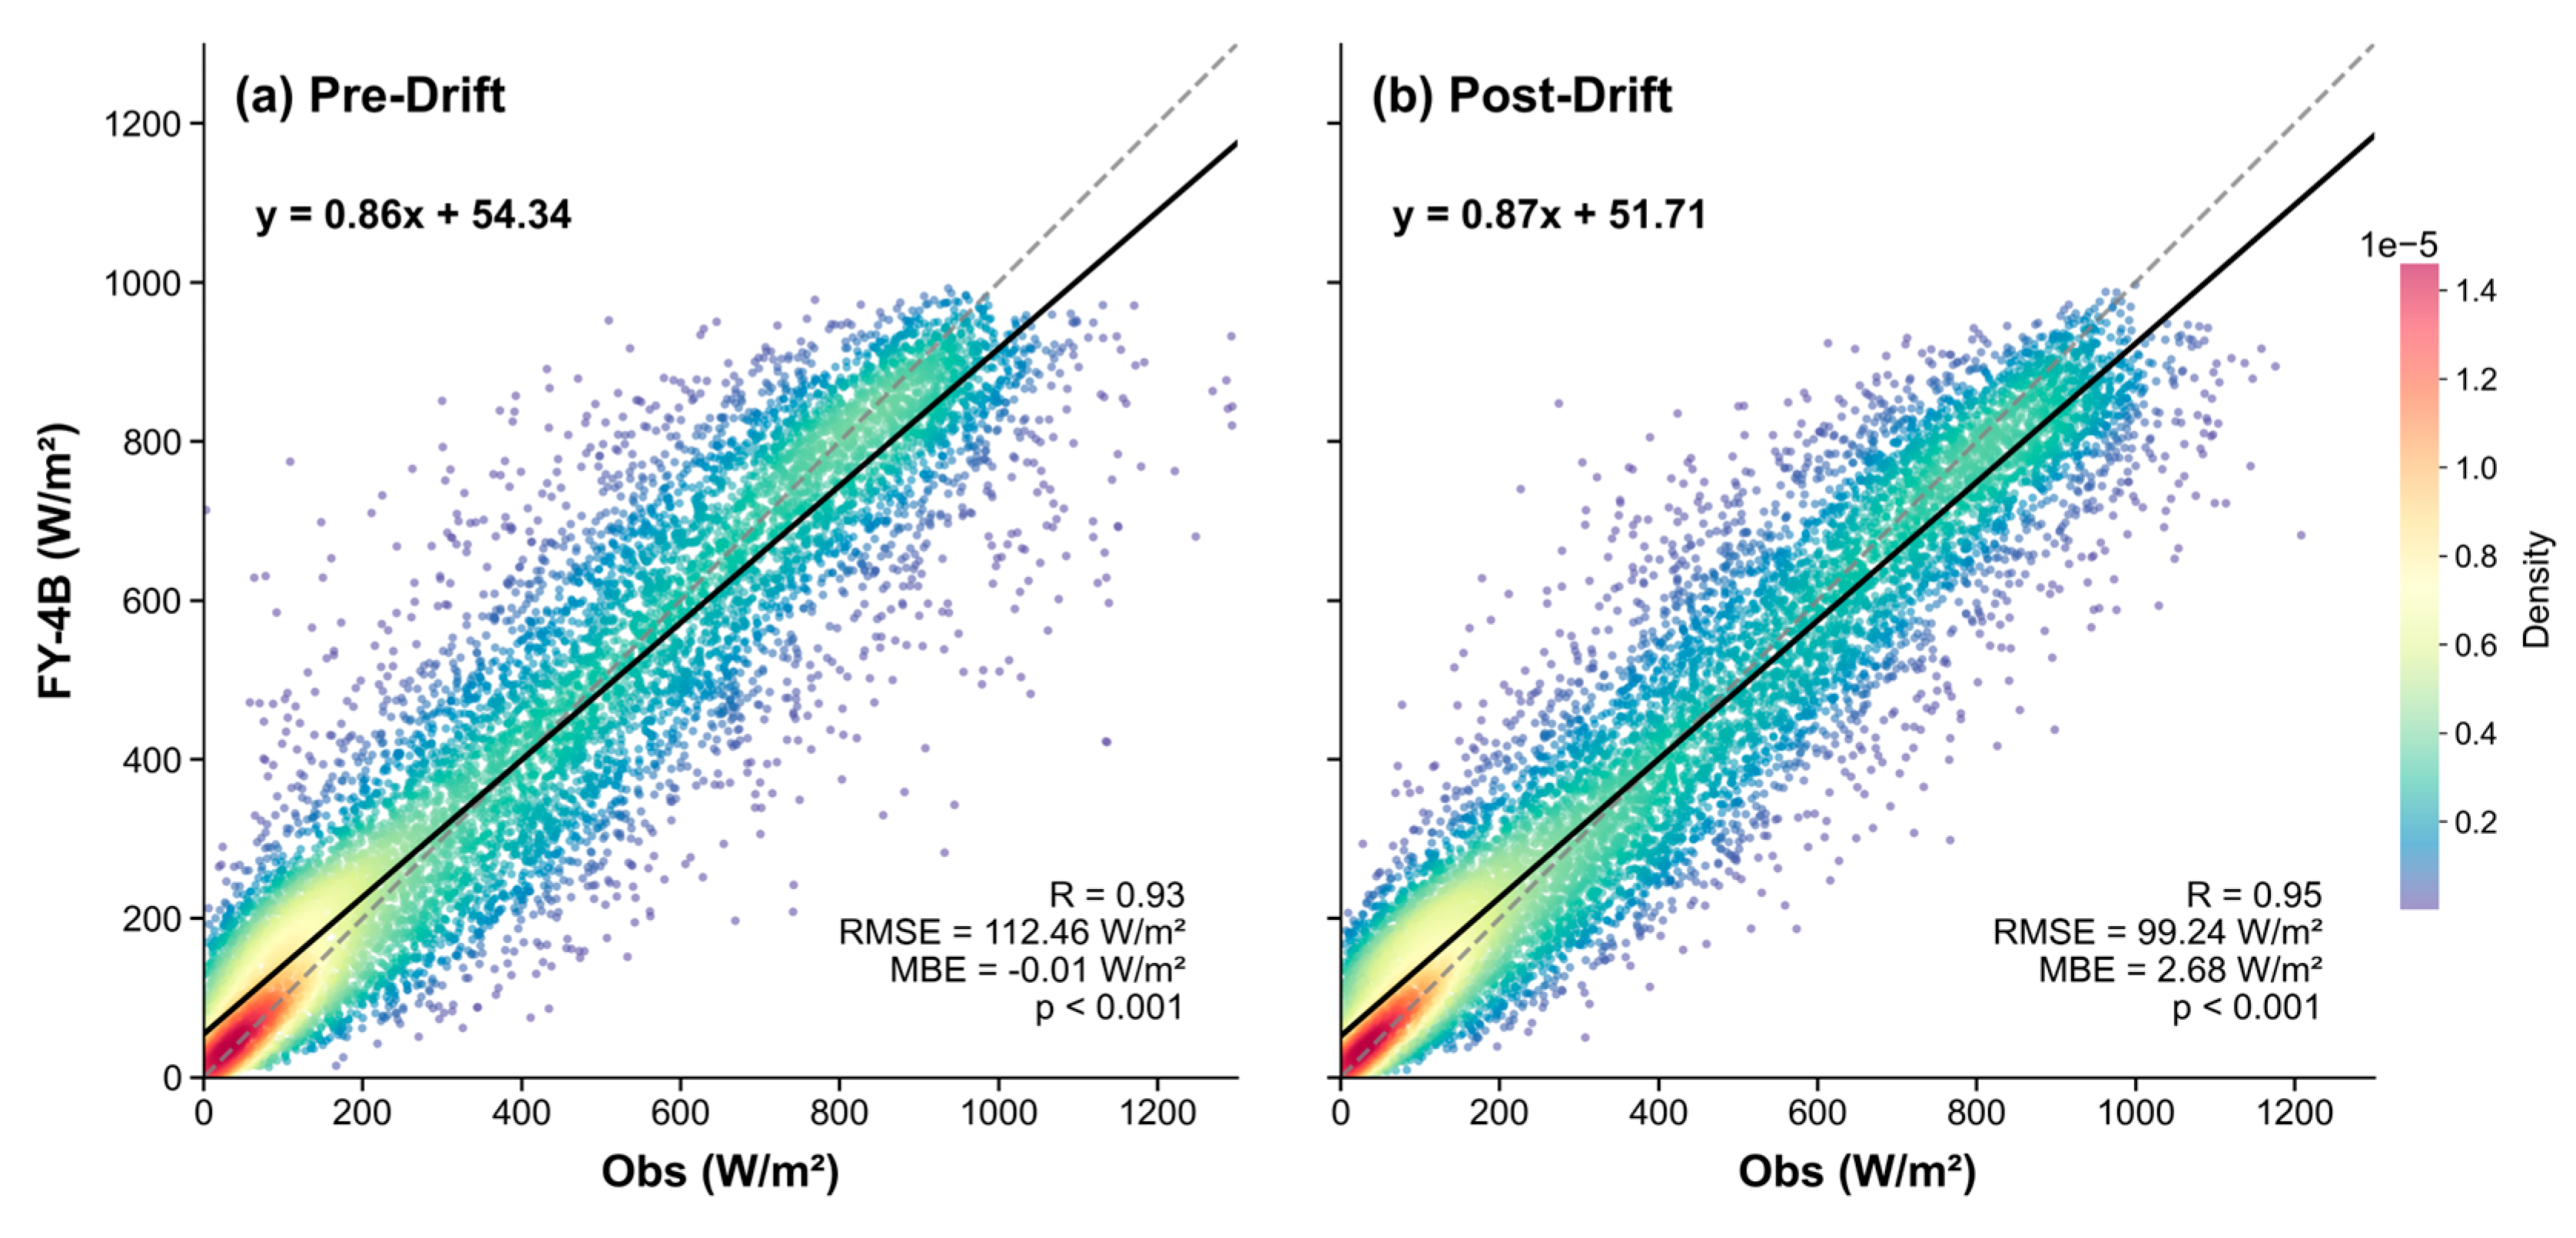
Figure 4.
Monthly comparisons of FY−4Bsatellite irradiance against ground−based observations Pre-drift(left) and Post-drift(right) for June—August.
Figure 4.
Monthly comparisons of FY−4Bsatellite irradiance against ground−based observations Pre-drift(left) and Post-drift(right) for June—August.
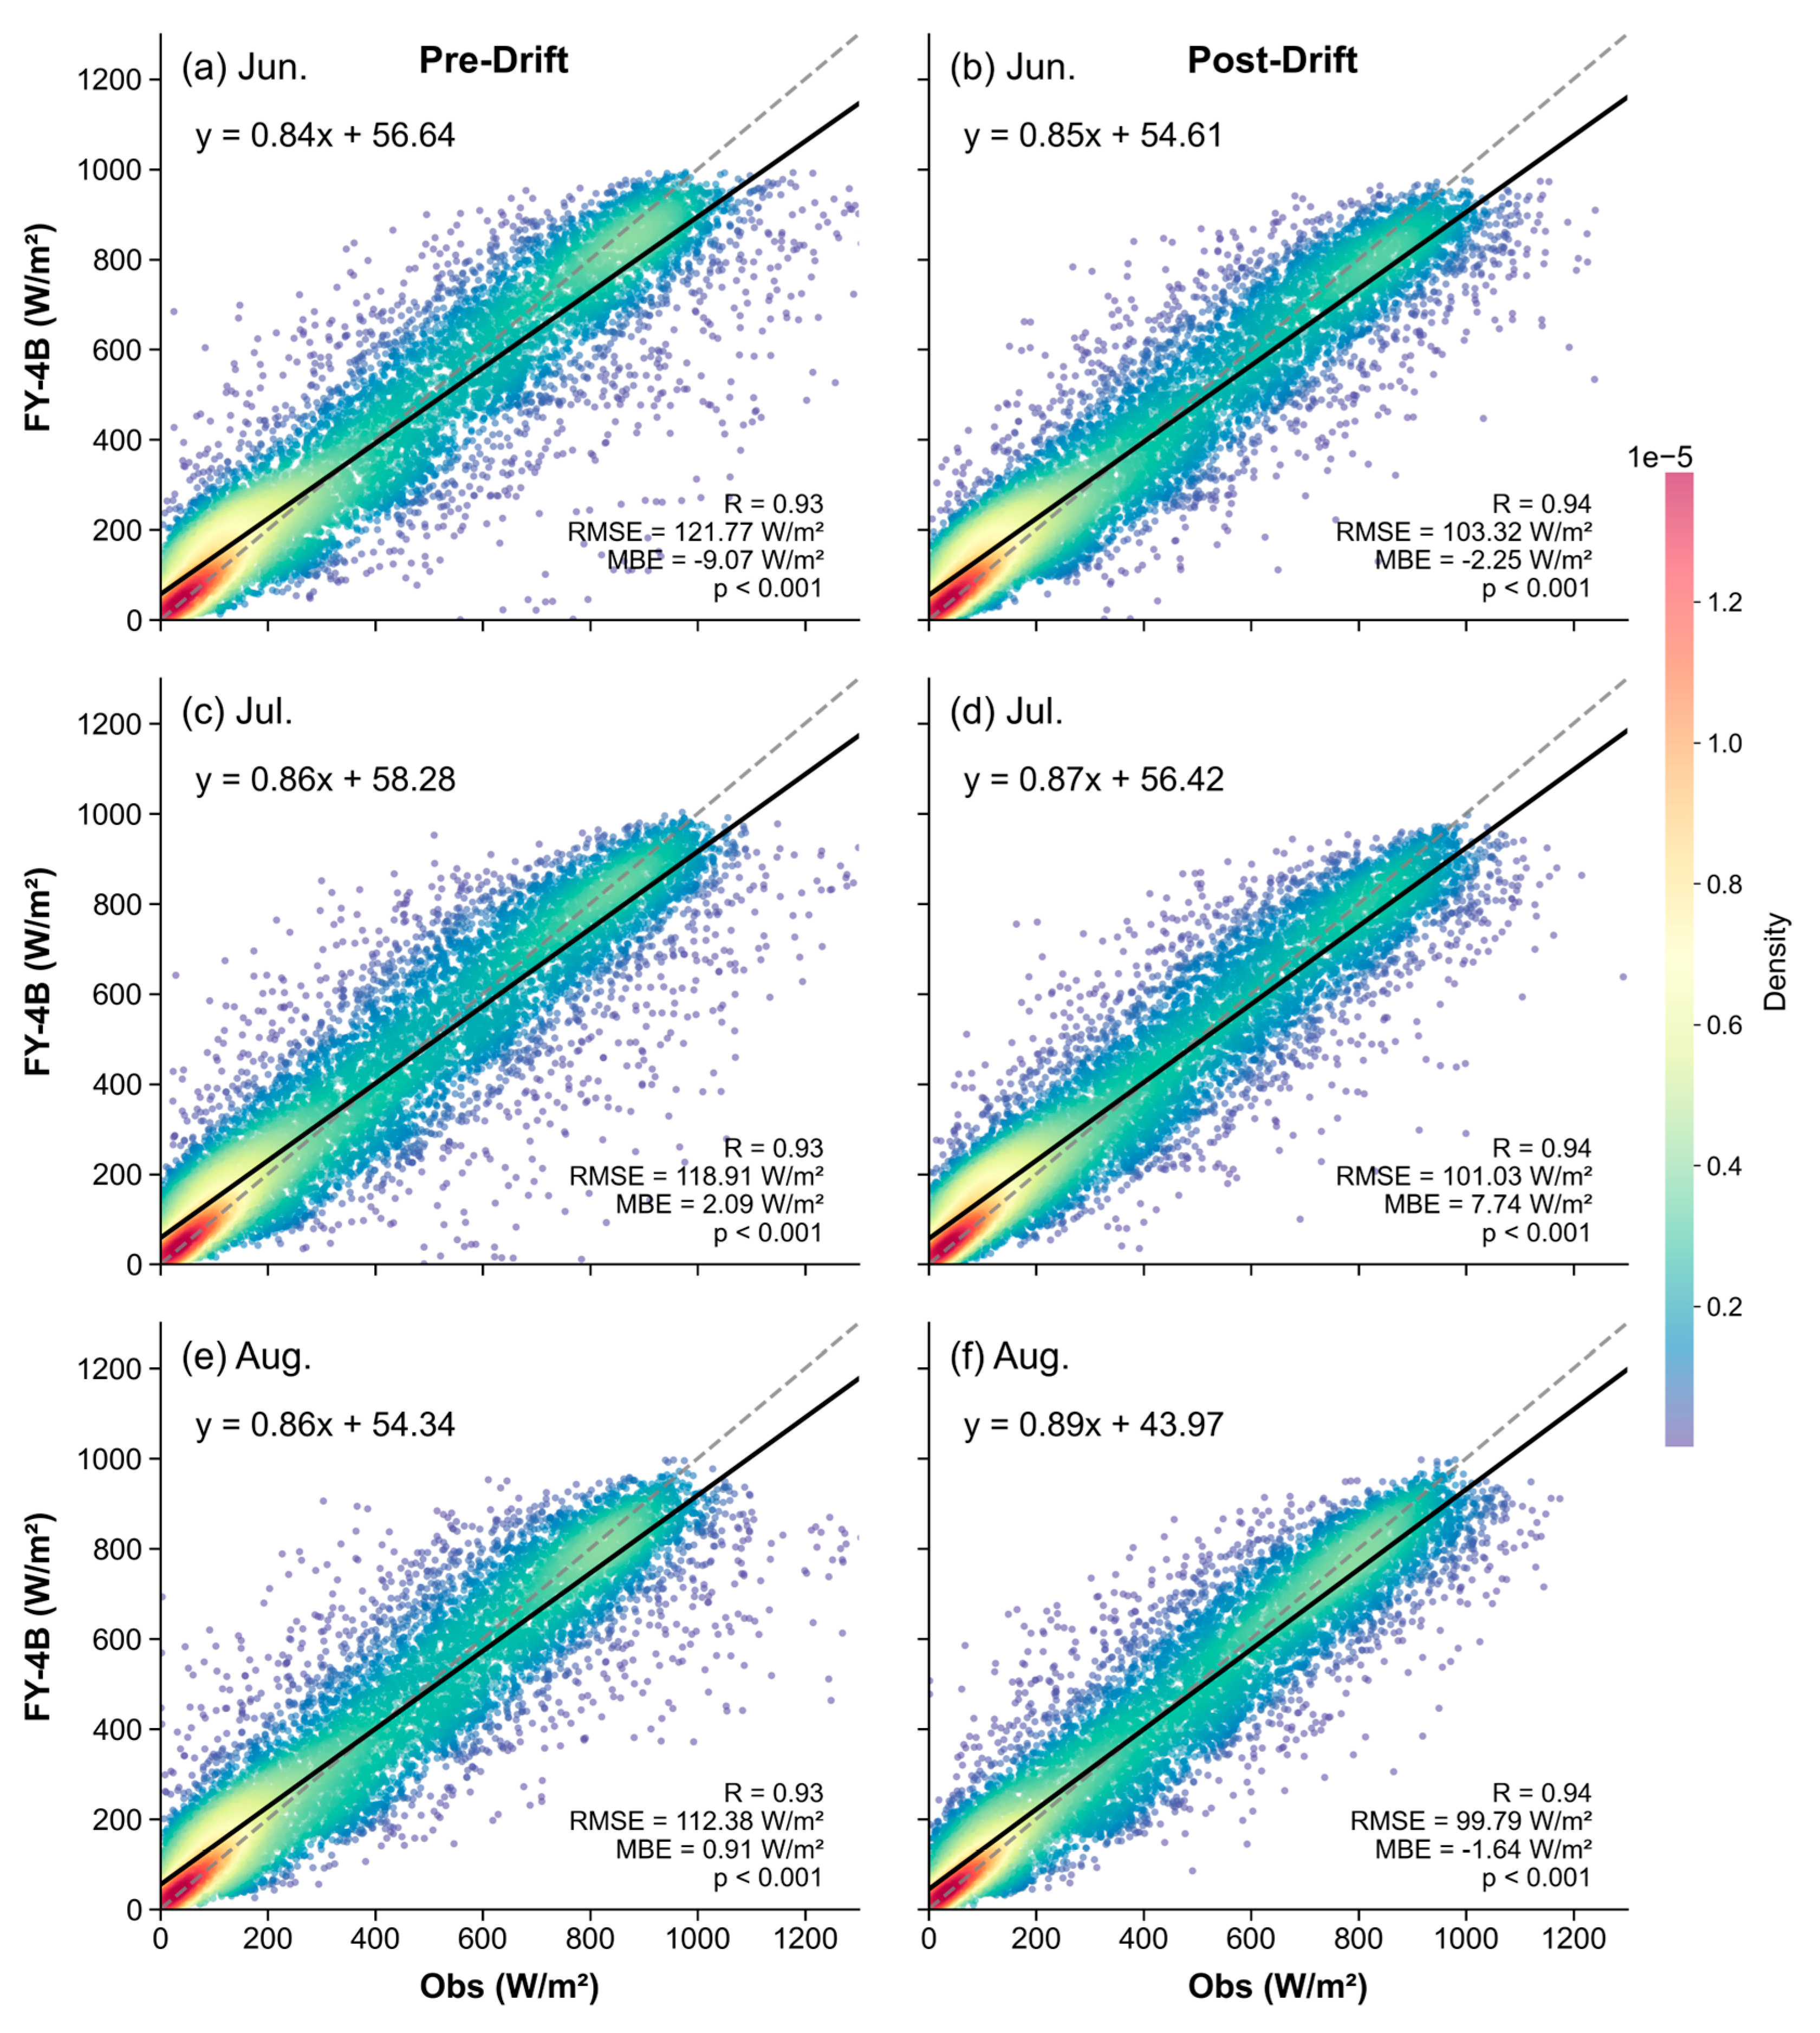
Figure 5.
Spatial distribution of evaluation metrics between FY−4B surface shortwave radiation and ground−based observations Pre- and Post-drift.
Figure 5.
Spatial distribution of evaluation metrics between FY−4B surface shortwave radiation and ground−based observations Pre- and Post-drift.
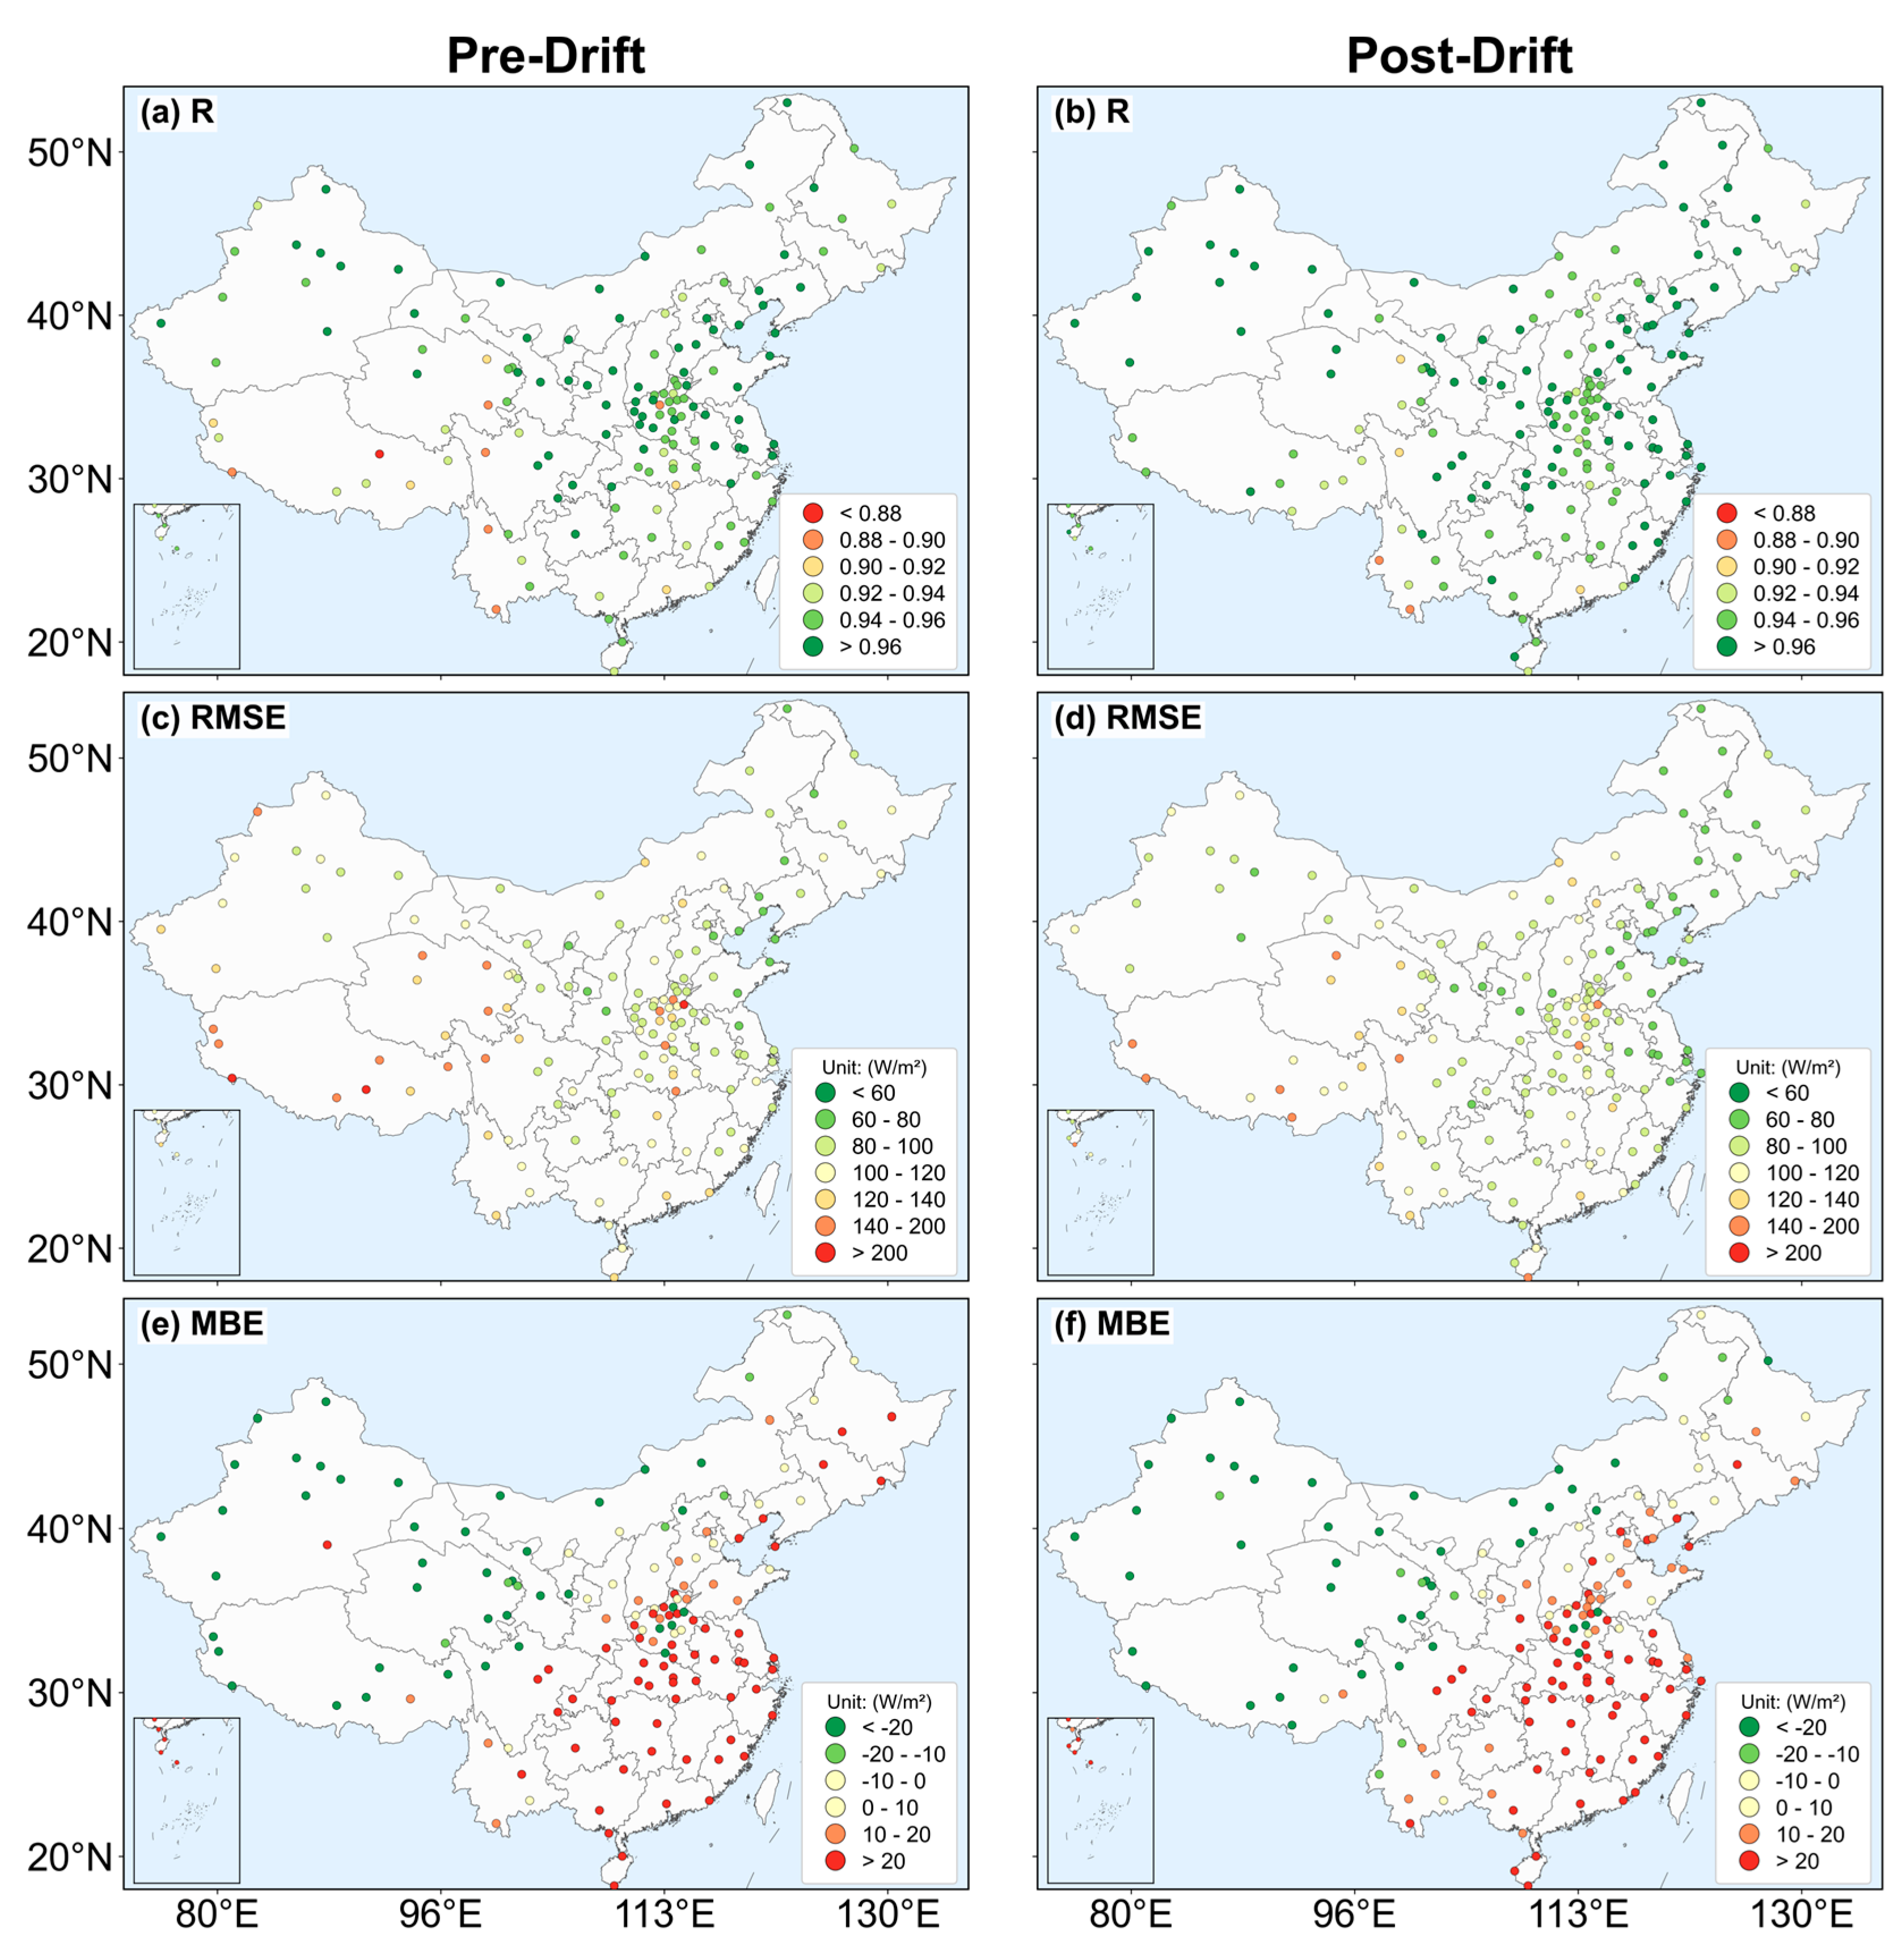
Figure 6.
Evaluation metrics of FY-4B versus ground stations Pre- and Post-drift (left column ordered by longitude; right column ordered by latitude).
Figure 6.
Evaluation metrics of FY-4B versus ground stations Pre- and Post-drift (left column ordered by longitude; right column ordered by latitude).
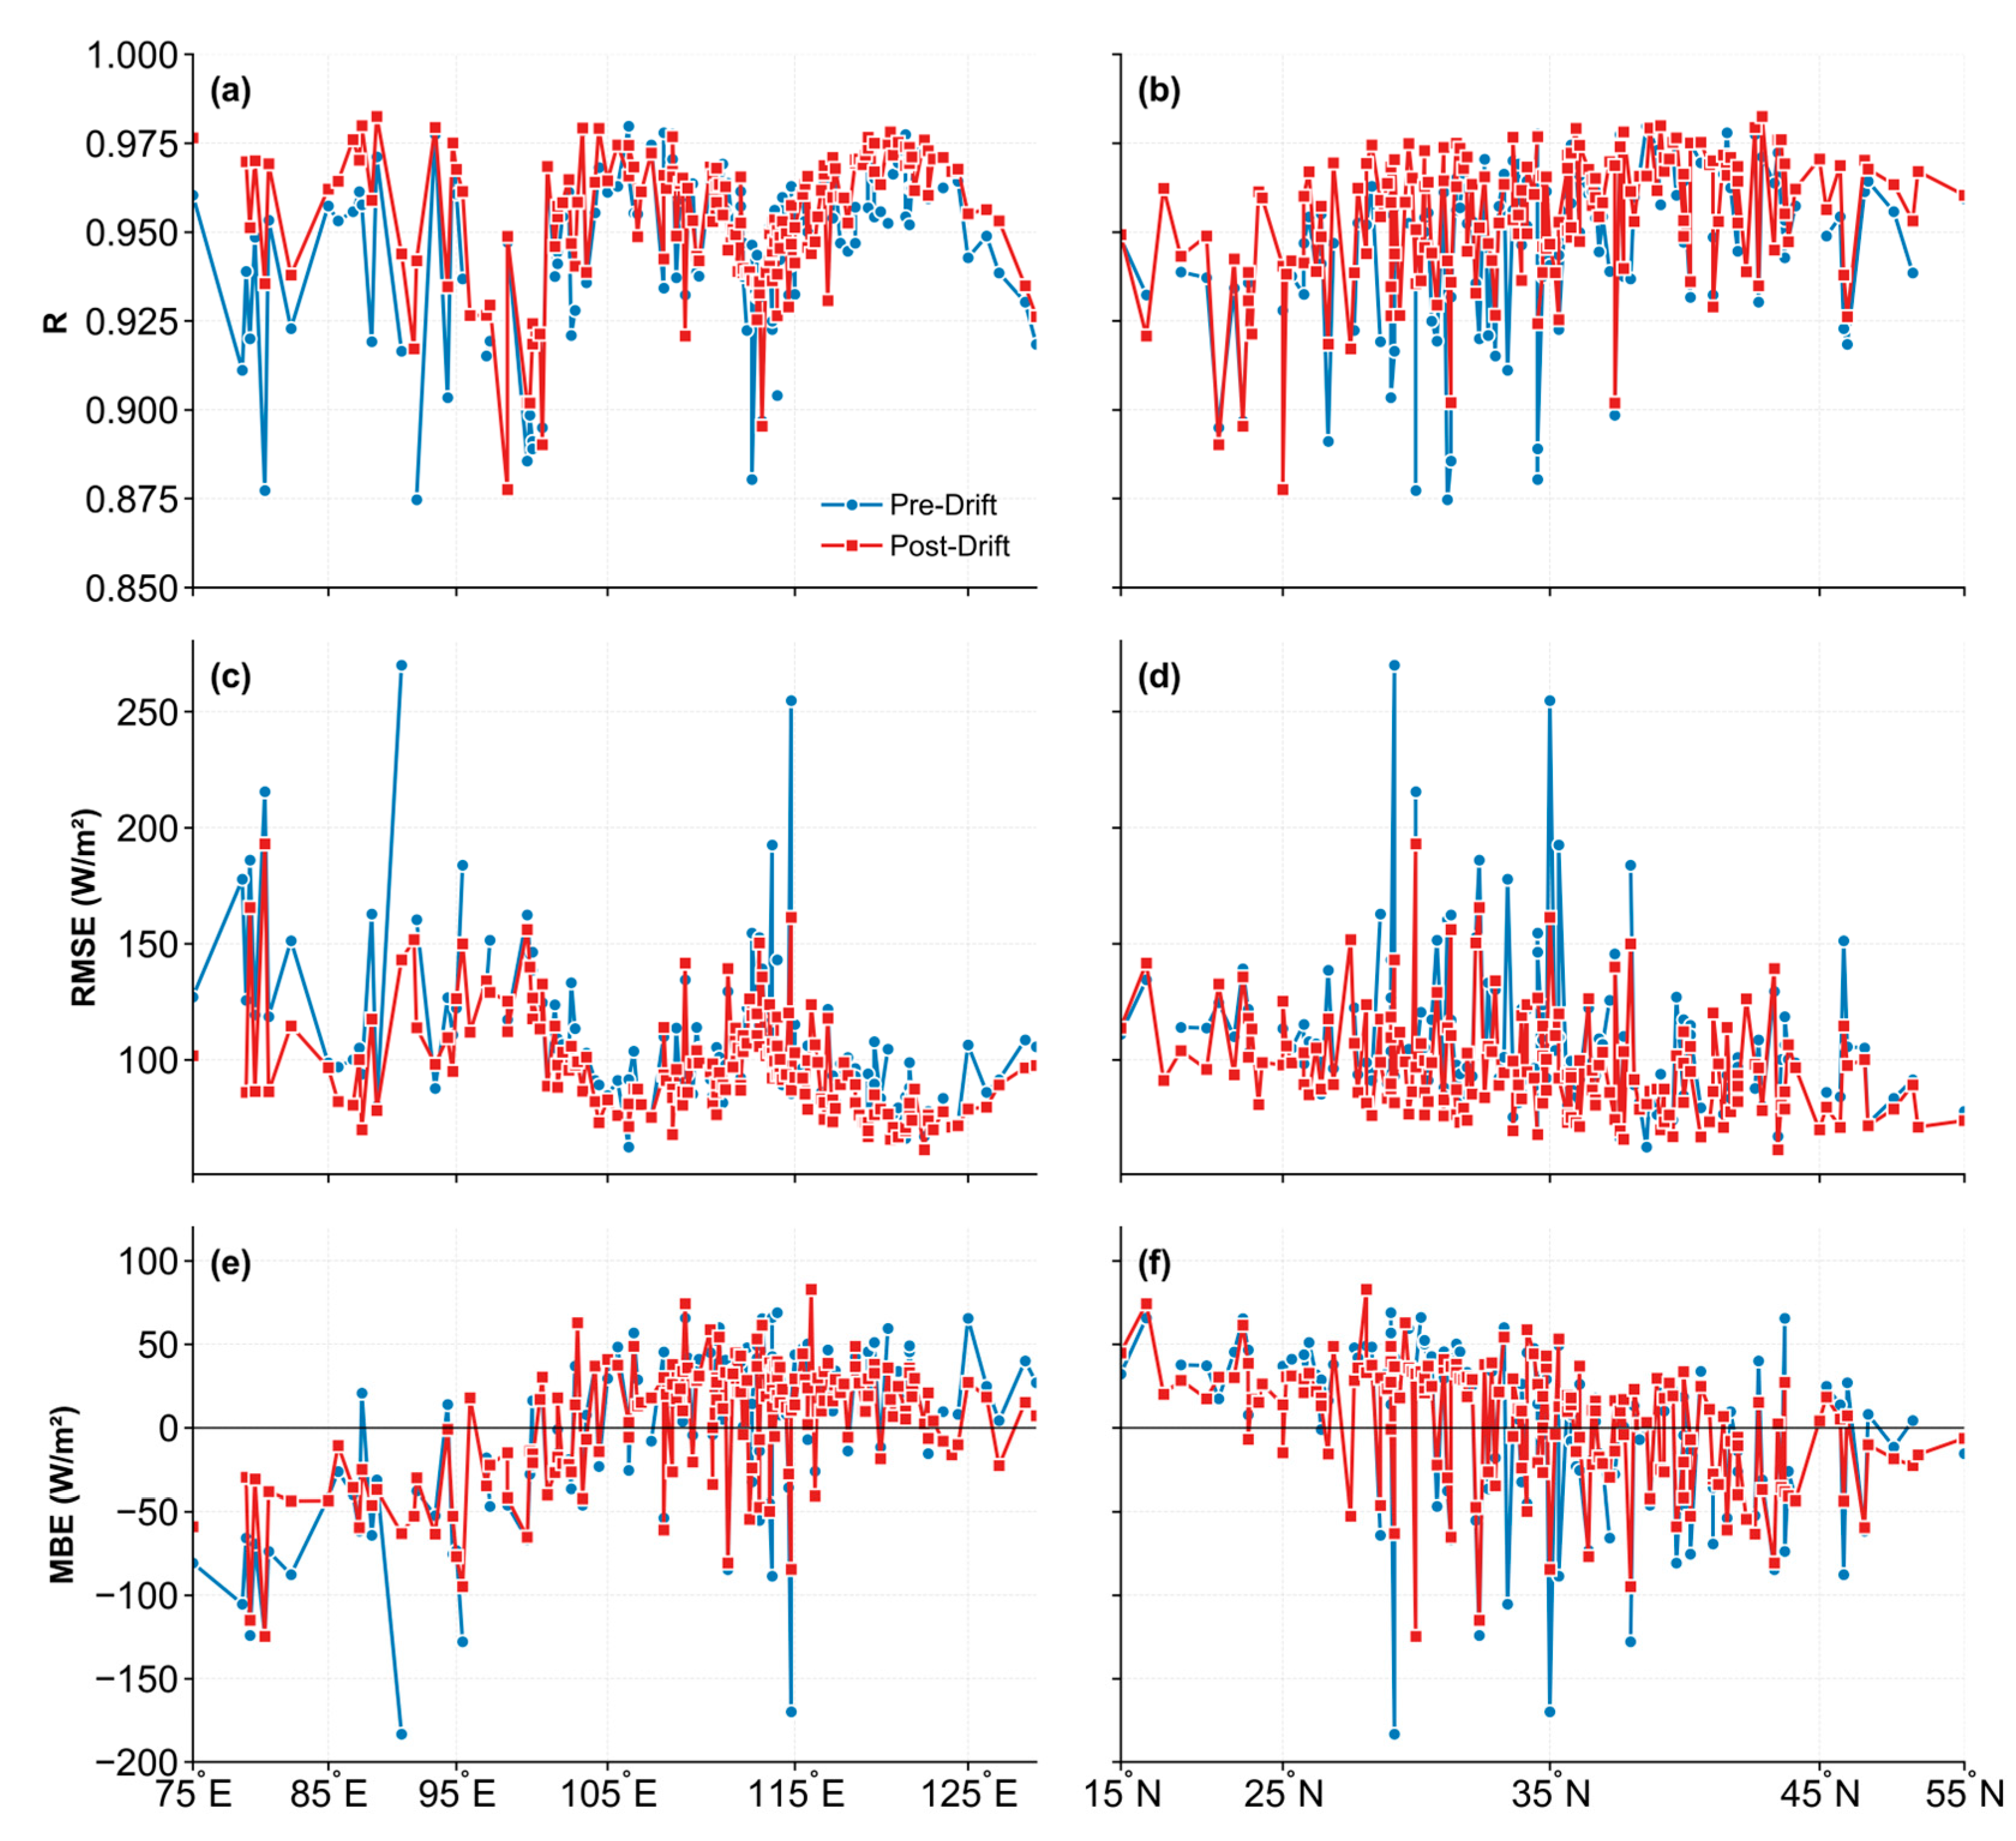
Figure 7.
Evaluation metrics of FY−4B shortwave radiation against ground−based observations under different land surface types.
Figure 7.
Evaluation metrics of FY−4B shortwave radiation against ground−based observations under different land surface types.
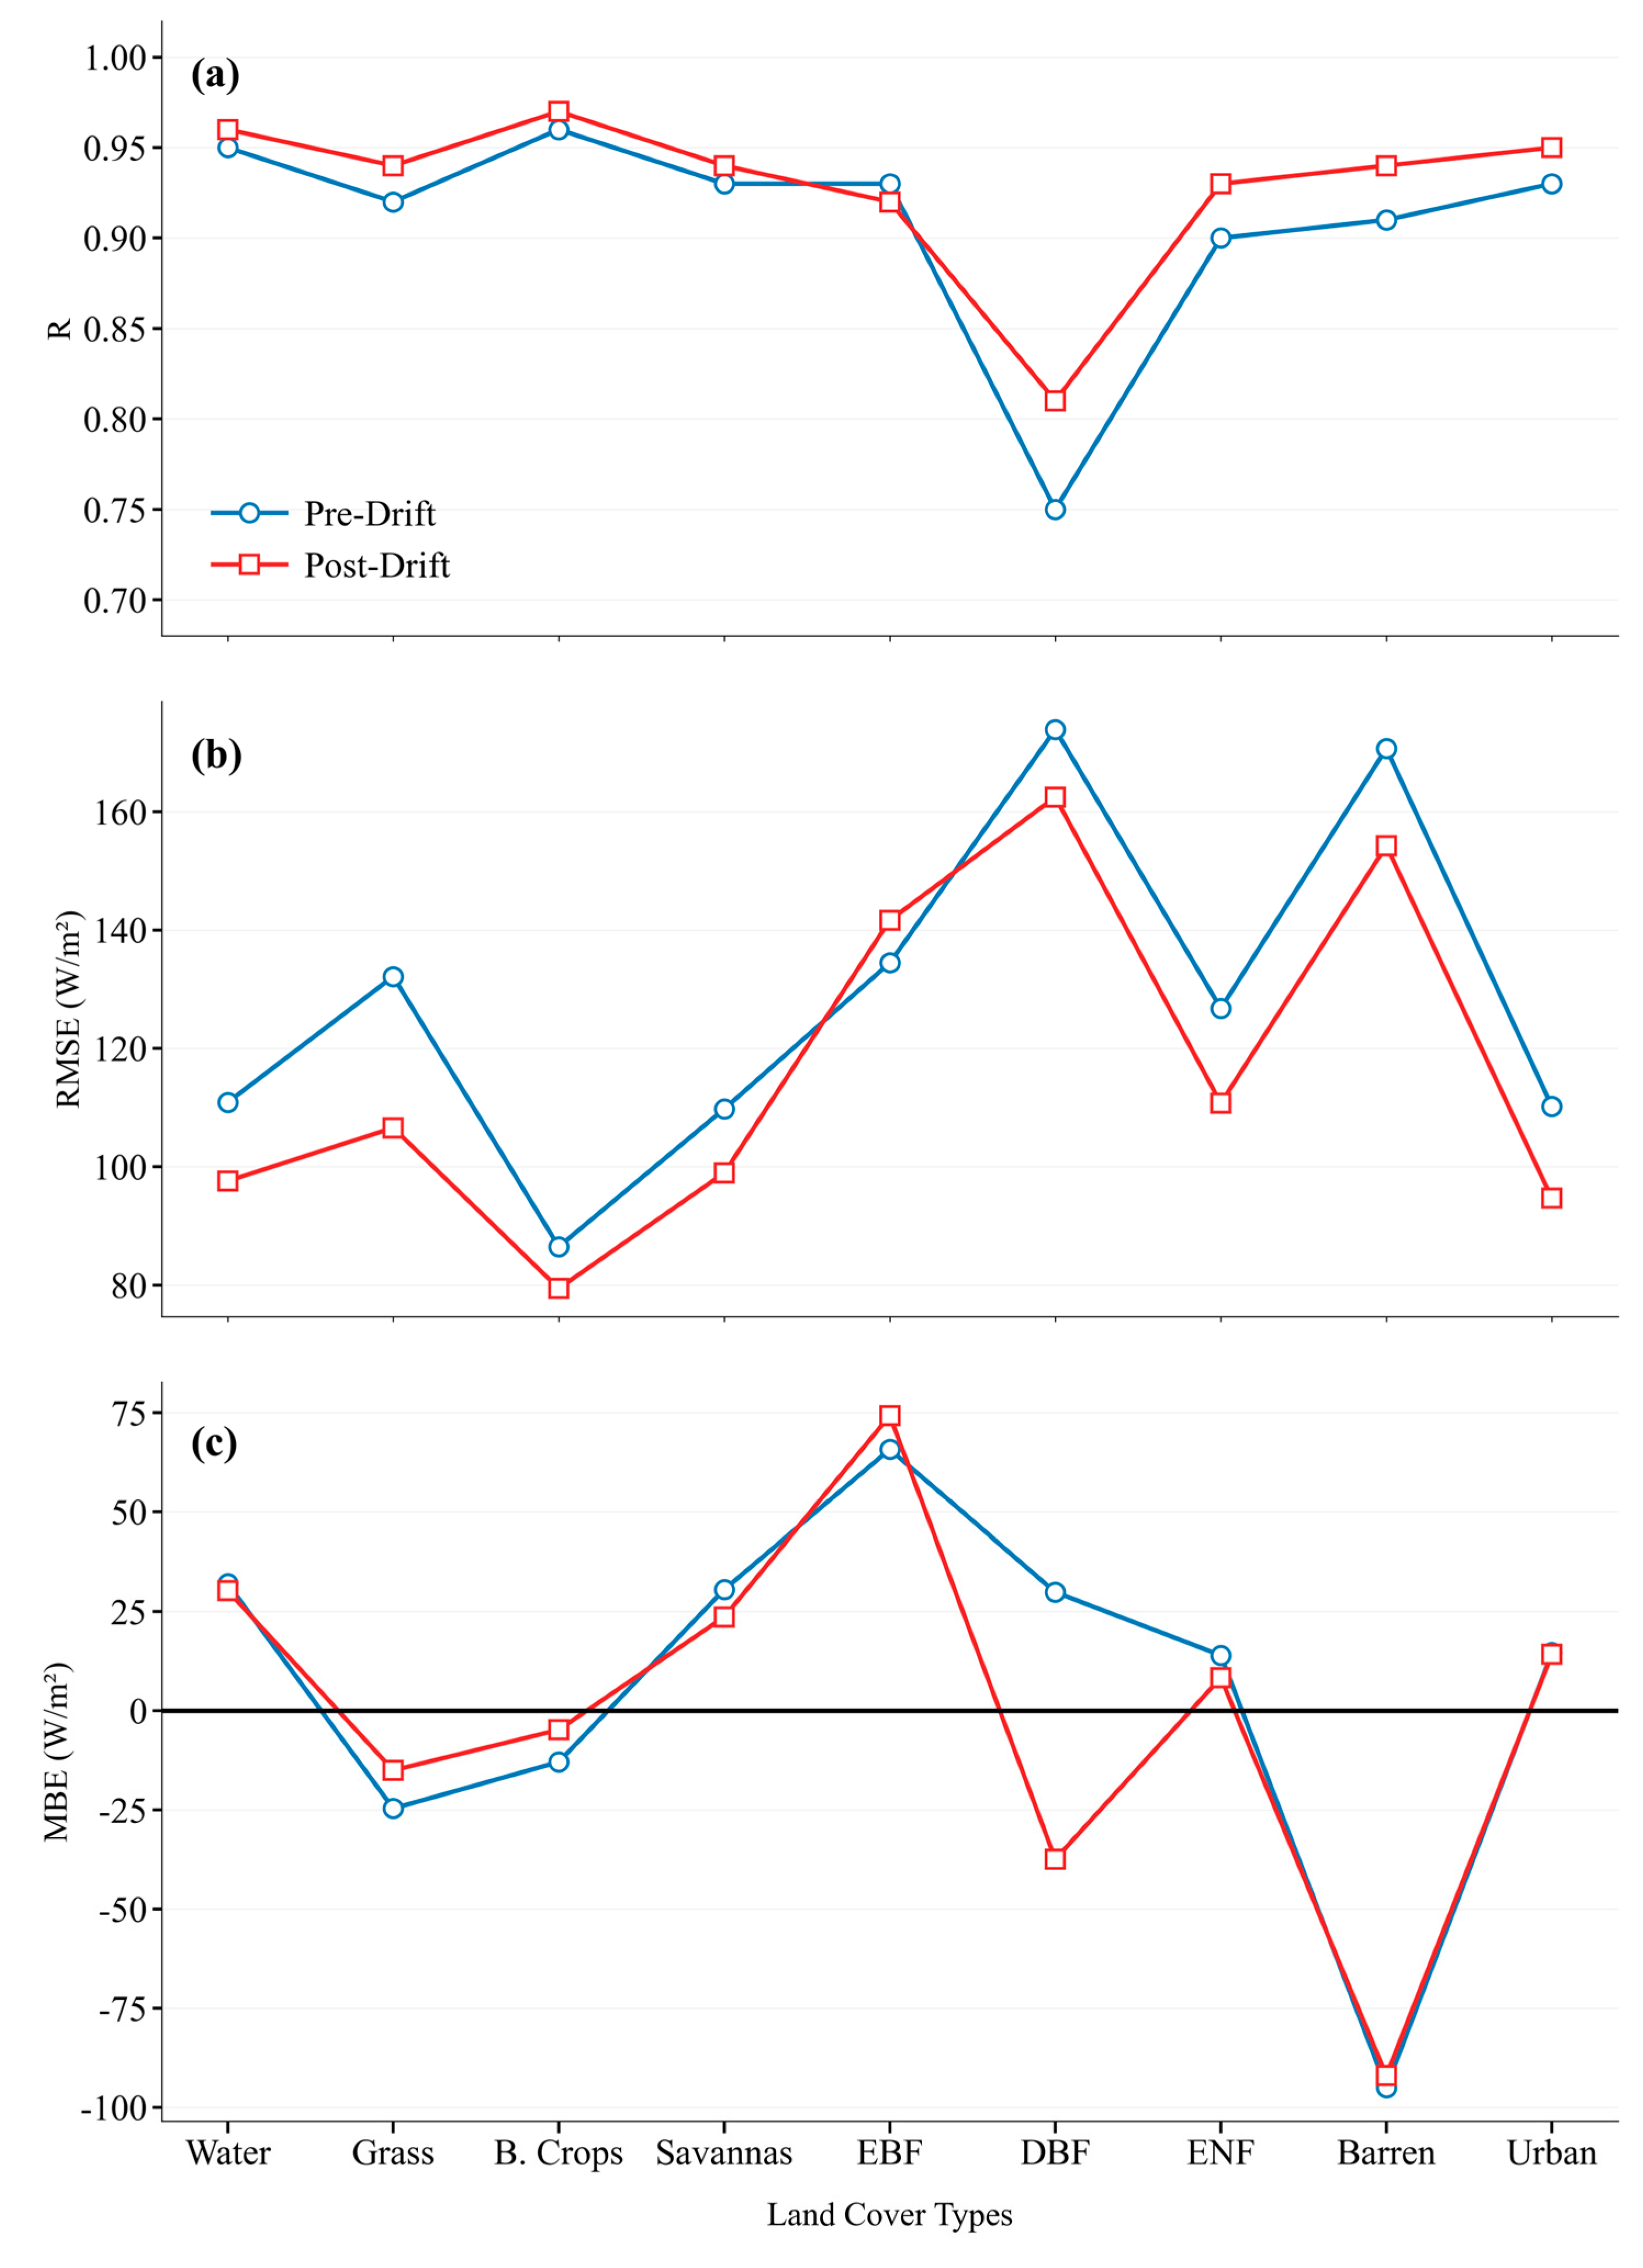
Figure 8.
Evaluation metrics of FY−4B surface shortwave radiation against ground−based observations at different Altitude ranges.
Figure 8.
Evaluation metrics of FY−4B surface shortwave radiation against ground−based observations at different Altitude ranges.
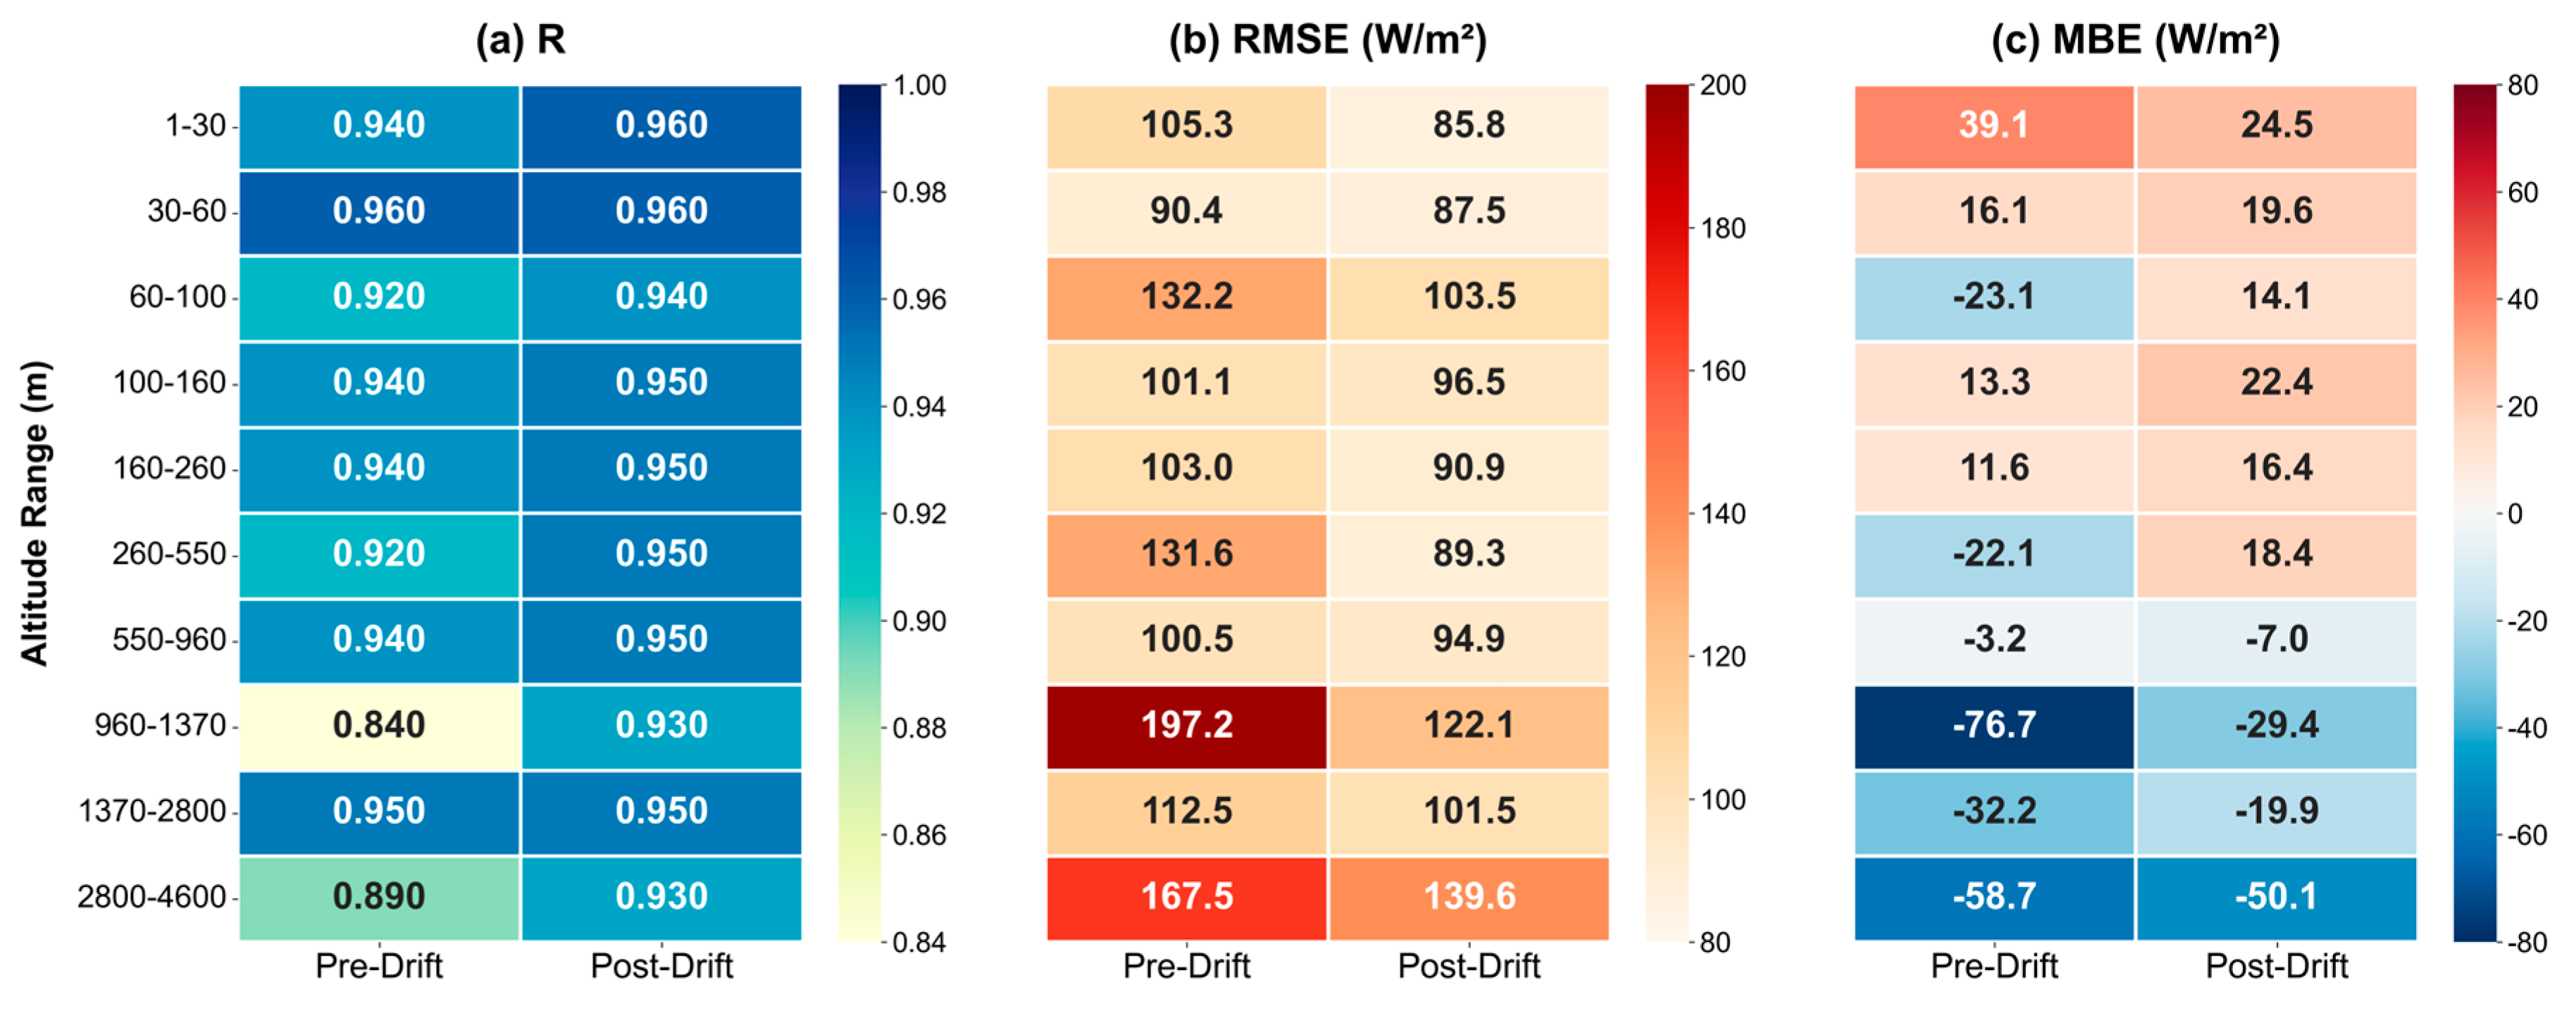
Figure 9.
Evaluation metrics of FY−4B surface shortwave radiation against ground−based observations under varying cloud conditions.
Figure 9.
Evaluation metrics of FY−4B surface shortwave radiation against ground−based observations under varying cloud conditions.
Disclaimer/Publisher’s Note: The statements, opinions and data contained in all publications are solely those of the individual author(s) and contributor(s) and not of MDPI and/or the editor(s). MDPI and/or the editor(s) disclaim responsibility for any injury to people or property resulting from any ideas, methods, instructions or products referred to in the content. |
© 2026 by the authors. Licensee MDPI, Basel, Switzerland. This article is an open access article distributed under the terms and conditions of the Creative Commons Attribution (CC BY) license (http://creativecommons.org/licenses/by/4.0/).
Copyright: This open access article is published under a Creative Commons CC BY 4.0 license, which permit the free download, distribution, and reuse, provided that the author and preprint are cited in any reuse.


