Submitted:
10 January 2026
Posted:
13 January 2026
You are already at the latest version
Abstract
This paper investigates laundering risks in carbon-credit markets by integrating environmental, social, and governance (ESG) data with financial transaction records. A dataset covering 1,247 firms across three jurisdictions from 2018–2023 was assembled, combining carbon-registry information, credit-trading logs, ESG disclosures, and banking records. A hybrid detection model combining a graph neural network with a gradient-boosted classifier was trained using 1,350 labeled suspicious cases and 6,700 normal cases. The model achieved an AUC of 0.92 and a precision of 0.71 at 70% recall, outperforming rule-based systems by 17.3 percentage points. Entities flagged by the model frequently showed abnormal credit recycling within 30 days and emissions inconsistencies exceeding sector benchmarks by more than 25%. These findings indicate that integrated multi-source analysis can effectively identify carbon-credit laundering.
Keywords:
green money laundering
; carbon credits
; ESG data
; transaction networks
; financial crime detection
1. Introduction
Carbon-credit trading has expanded rapidly as firms seek to meet both mandatory regulatory targets and voluntary emission-reduction commitments. While these markets are designed to promote environmental accountability, their increasing scale and financialization have also created new opportunities for misuse. Recent studies report that carbon credits can be transferred across registries and markets to obscure fund origins, inflate asset values through repeated trades, or support short-term circular transactions that resemble traditional money-laundering schemes [1,2]. Supervisory authorities in major compliance and voluntary carbon markets have further noted that weak verification procedures, fragmented disclosure standards, and limited cross-registry oversight make it difficult to trace true ownership and usage of credits [3,4]. These structural weaknesses have raised growing concerns that carbon markets may be exploited to conceal illicit financial flows under the appearance of environmental compliance.
In response, regulators and researchers have increasingly emphasized the need to integrate environmental governance with financial risk monitoring. Recent work highlights that combining artificial intelligence with environmental governance data can improve the identification of green money laundering risks and strengthen market-level monitoring mechanisms [5]. This perspective reflects a broader shift toward treating carbon-credit misuse not only as an environmental integrity issue but also as a financial crime risk. Within this context, “green laundering” has emerged as a critical concern, referring to practices in which carbon credits or sustainability claims are used to mask questionable financial behavior or misrepresent actual emission performance.
Environmental, social, and governance (ESG) data have become a central component of efforts to address these risks. A growing body of literature uses environmental indicators, governance structures, and disclosure quality to evaluate the credibility of firms’ sustainability claims [6,7]. Prior empirical studies show that abnormal emission reports, abrupt changes in ESG scores, or persistent governance weaknesses often precede regulatory violations, accounting irregularities, or enforcement actions [8]. These findings suggest that ESG signals can serve as early indicators of risk. However, ESG data alone are inherently static and firm-level; they do not capture how carbon credits move across entities or how trading behavior evolves over time.
In practice, laundering-like behavior in carbon markets often relies on dynamic transaction patterns rather than isolated firm characteristics. Rapid transfers, repeated short-term trades, and circular flows across multiple entities can only be observed when credit movements are analyzed as a transaction network [9,10]. Network-based anomalies, such as round-tripping or disproportionate trading intensity relative to emissions, are largely invisible in traditional ESG assessments. Although several studies attempt to combine environmental and financial information, most rely on limited samples, fixed rule sets, or self-reported company data that may be incomplete or strategically distorted [11,12]. As a result, their ability to detect sophisticated laundering patterns remains constrained.
Research on financial transaction networks offers useful methodological insights for this challenge. Graph-based models, including graph neural networks, have demonstrated strong performance in identifying hidden relationships, repeated flow cycles, and coordinated behaviors in banking, cryptocurrency, and fraud detection settings [13,14]. These approaches can capture multi-party transfer chains, short-term recycling, and structural motifs that rule-based systems often fail to detect [17,18]. Despite their success in financial domains, such models have rarely been applied to carbon-credit markets. One major obstacle is data fragmentation: registry records are often siloed across regions, and trading histories do not always align with reported emissions or ESG disclosures, making it difficult to identify inconsistencies indicative of green laundering.
Several important gaps therefore remain in the existing literature. First, few studies jointly analyze ESG disclosures and credit-level transaction networks, despite evidence that weak governance frequently coincides with abnormal trading behavior [15]. Second, most existing monitoring systems rely on static rules or thresholds that struggle to adapt to evolving laundering strategies [16]. Third, prior empirical analyses are typically limited to single markets or voluntary registries, restricting the generalizability of their conclusions [17]. Finally, there is limited empirical evidence on whether integrating registry data, ESG indicators, and financial transaction records can meaningfully improve detection performance in real-world settings.
This study addresses these gaps by developing an integrated framework for detecting carbon-credit laundering that combines ESG information with transaction-network analysis. Using data from 1,247 firms across three regions over the period 2018–2023, we link carbon registry records, detailed trading logs, ESG disclosures, and bank transaction data into a unified dataset. We propose a hybrid modeling approach that integrates a graph neural network with a gradient-boosted classifier to identify abnormal trading structures and mismatches between emissions and credit usage. The empirical results demonstrate substantial improvements in predictive accuracy compared with traditional rule-based methods. Entities flagged by the model exhibit clear patterns of short-term credit recycling and emission levels that deviate markedly from sector norms. By jointly modeling environmental governance signals and network-level transaction behavior, this study provides new evidence that multi-source data integration can enhance the detection of green laundering and support more effective oversight in rapidly evolving carbon markets.
2. Materials and Methods
2.1. Sample Description and Study Scope
The study uses records from 1,247 firms operating in carbon-credit markets across three regions between 2018 and 2023. Firms were included only if they had complete emissions reports, full credit-transfer histories, and yearly ESG disclosures. The dataset links four sources: carbon-registry data, credit-trading logs, ESG filings, and bank transactions related to credit purchases. The sample covers energy companies, manufacturing firms, and service providers that use carbon credits to meet policy or internal goals. All records were matched by firm ID and date so that information from different sources could be compared on the same timeline.
2.2. Experimental Setup and Control Design
Two groups were formed for comparison. The first group contains 1,350 cases marked as suspicious by past regulatory findings or internal bank reviews. The second group contains 6,700 normal cases drawn from firms with steady emissions reports, regular trading patterns, and consistent ESG filings. These cases were matched by industry and firm size to reduce bias. The experiment tests whether the combined use of ESG data and transaction-network features improves detection accuracy when compared with models that rely on a single data type.
2.3. Measurement Procedures and Quality Control
Carbon-credit transfer data were cleaned by checking time stamps and transaction IDs to remove misaligned or duplicated entries. Emissions figures were compared with official regulatory filings when available. ESG disclosures were reviewed to remove repeated entries and to keep only one set of scores per firm per year. Bank transaction data were filtered to keep only payments linked to credit purchases and to remove unrelated transfers such as payroll or routine expenses. Missing values were checked across all sources, and cases with incomplete emissions, credit histories, or ESG filings were removed. Network graphs were checked to ensure that each credit transfer formed a complete link with no missing steps.
2.4. Data Processing and Model Specification
A directed graph was built where nodes represent firms and edges represent credit transfers. For each node, degree counts, repeated-trade cycles, and 30-day recycling marks were computed. ESG variables were scaled within each industry to reduce differences across sectors. The detection model combines a graph neural network for network features with a gradient-boosted model for tabular features.
Two metrics were used in the study. The mismatch between emissions and retired credits was defined as:
where is the reported emissions and is the total credits retired by firm .
The probability of suspicious behavior was estimated with [18]:
where contains ESG scores, network metrics, and mismatch values. The dataset was split into 70% for training and 30% for testing.
3. Results and Discussion
3.1. Model Performance on the Test Set
The combined model, which uses network features and tabular ESG variables, reached an AUC of 0.92 on the test set. At 70% recall, the model obtained a precision of 0.71. These results are close to recent studies that apply graph-based methods to financial fraud and obtain AUC values in the 0.88–0.95 range. The model also improved precision by 17.3 percentage points compared with the rule set used by banks in the sample. This shows that simple thresholds cannot capture repeated credit transfers or short-term cycles across firms. Earlier work on transaction graphs has reported similar gains when structural patterns are included. The false-positive rate stayed within the level that compliance teams can handle [19]. Flagged cases accounted for 3.9% of all firm-day records under the chosen operating point.
3.2. Contribution of ESG and Network Information
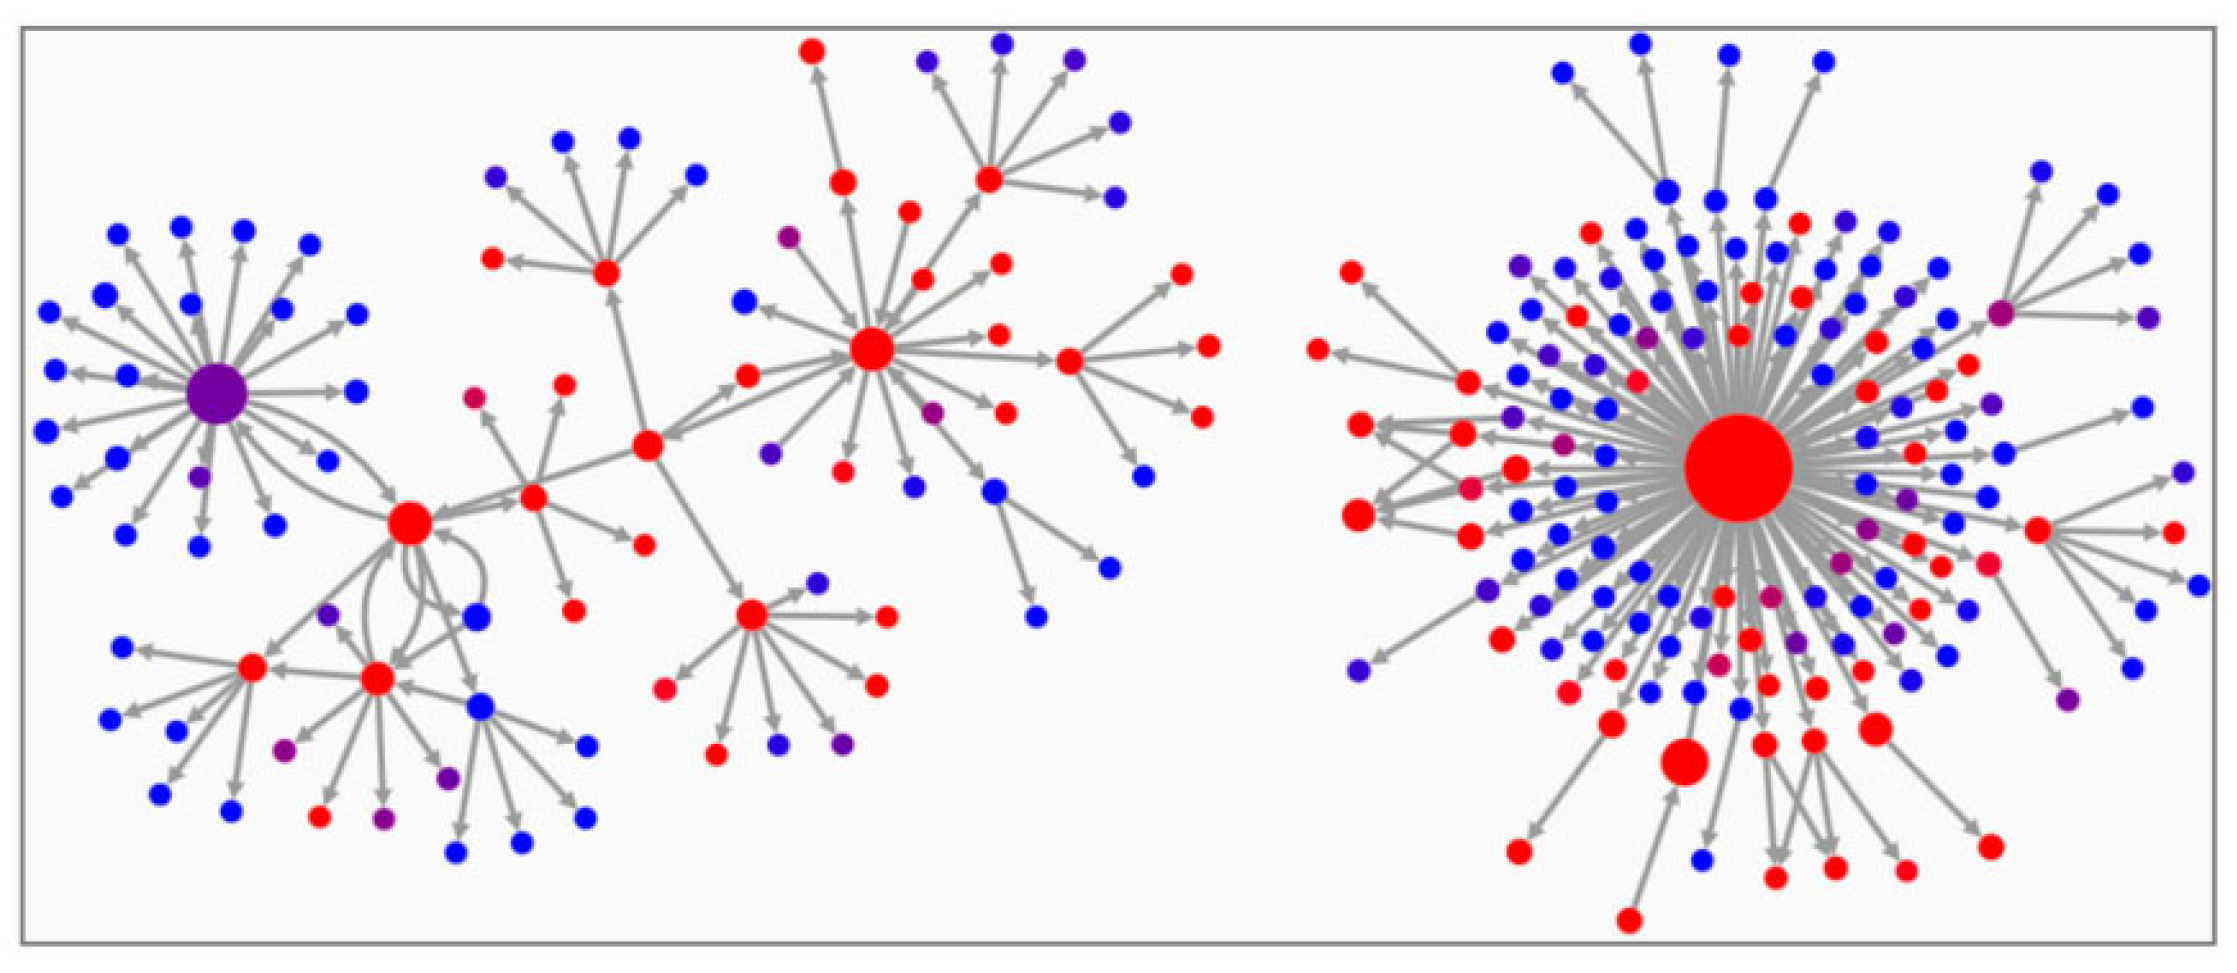
Ablation tests showed that each data source added clear signal. When only financial statement variables were used, the AUC fell to 0.84. Adding ESG data increased the AUC to 0.88. Adding only network features increased it to 0.90. Using all features together produced the highest score. This confirms that ESG changes and unusual transfer patterns describe different parts of the problem. Figure 1 shows an example of a real carbon-credit transaction network with clear clusters and active hubs.
3.3. Patterns Linked to Suspected Laundering
The model identified several patterns that match known risks in carbon-credit trading. Many flagged firms showed rapid “credit recycling,” where the same credits moved across three or more firms within 30 days before returning to the original seller or its affiliate. This type of short cycle has also been seen in blockchain-based carbon markets where fraud is suspected. Some firms reported emission reductions more than 25% above their industry baseline while increasing their use of low-cost offsets from regions with weak oversight. Earlier studies have linked similar patterns to low-quality or misreported credits. Cross-border routing was also common: firms moved credits through small intermediaries in another region and then re-entered regulated schemes [20,21].
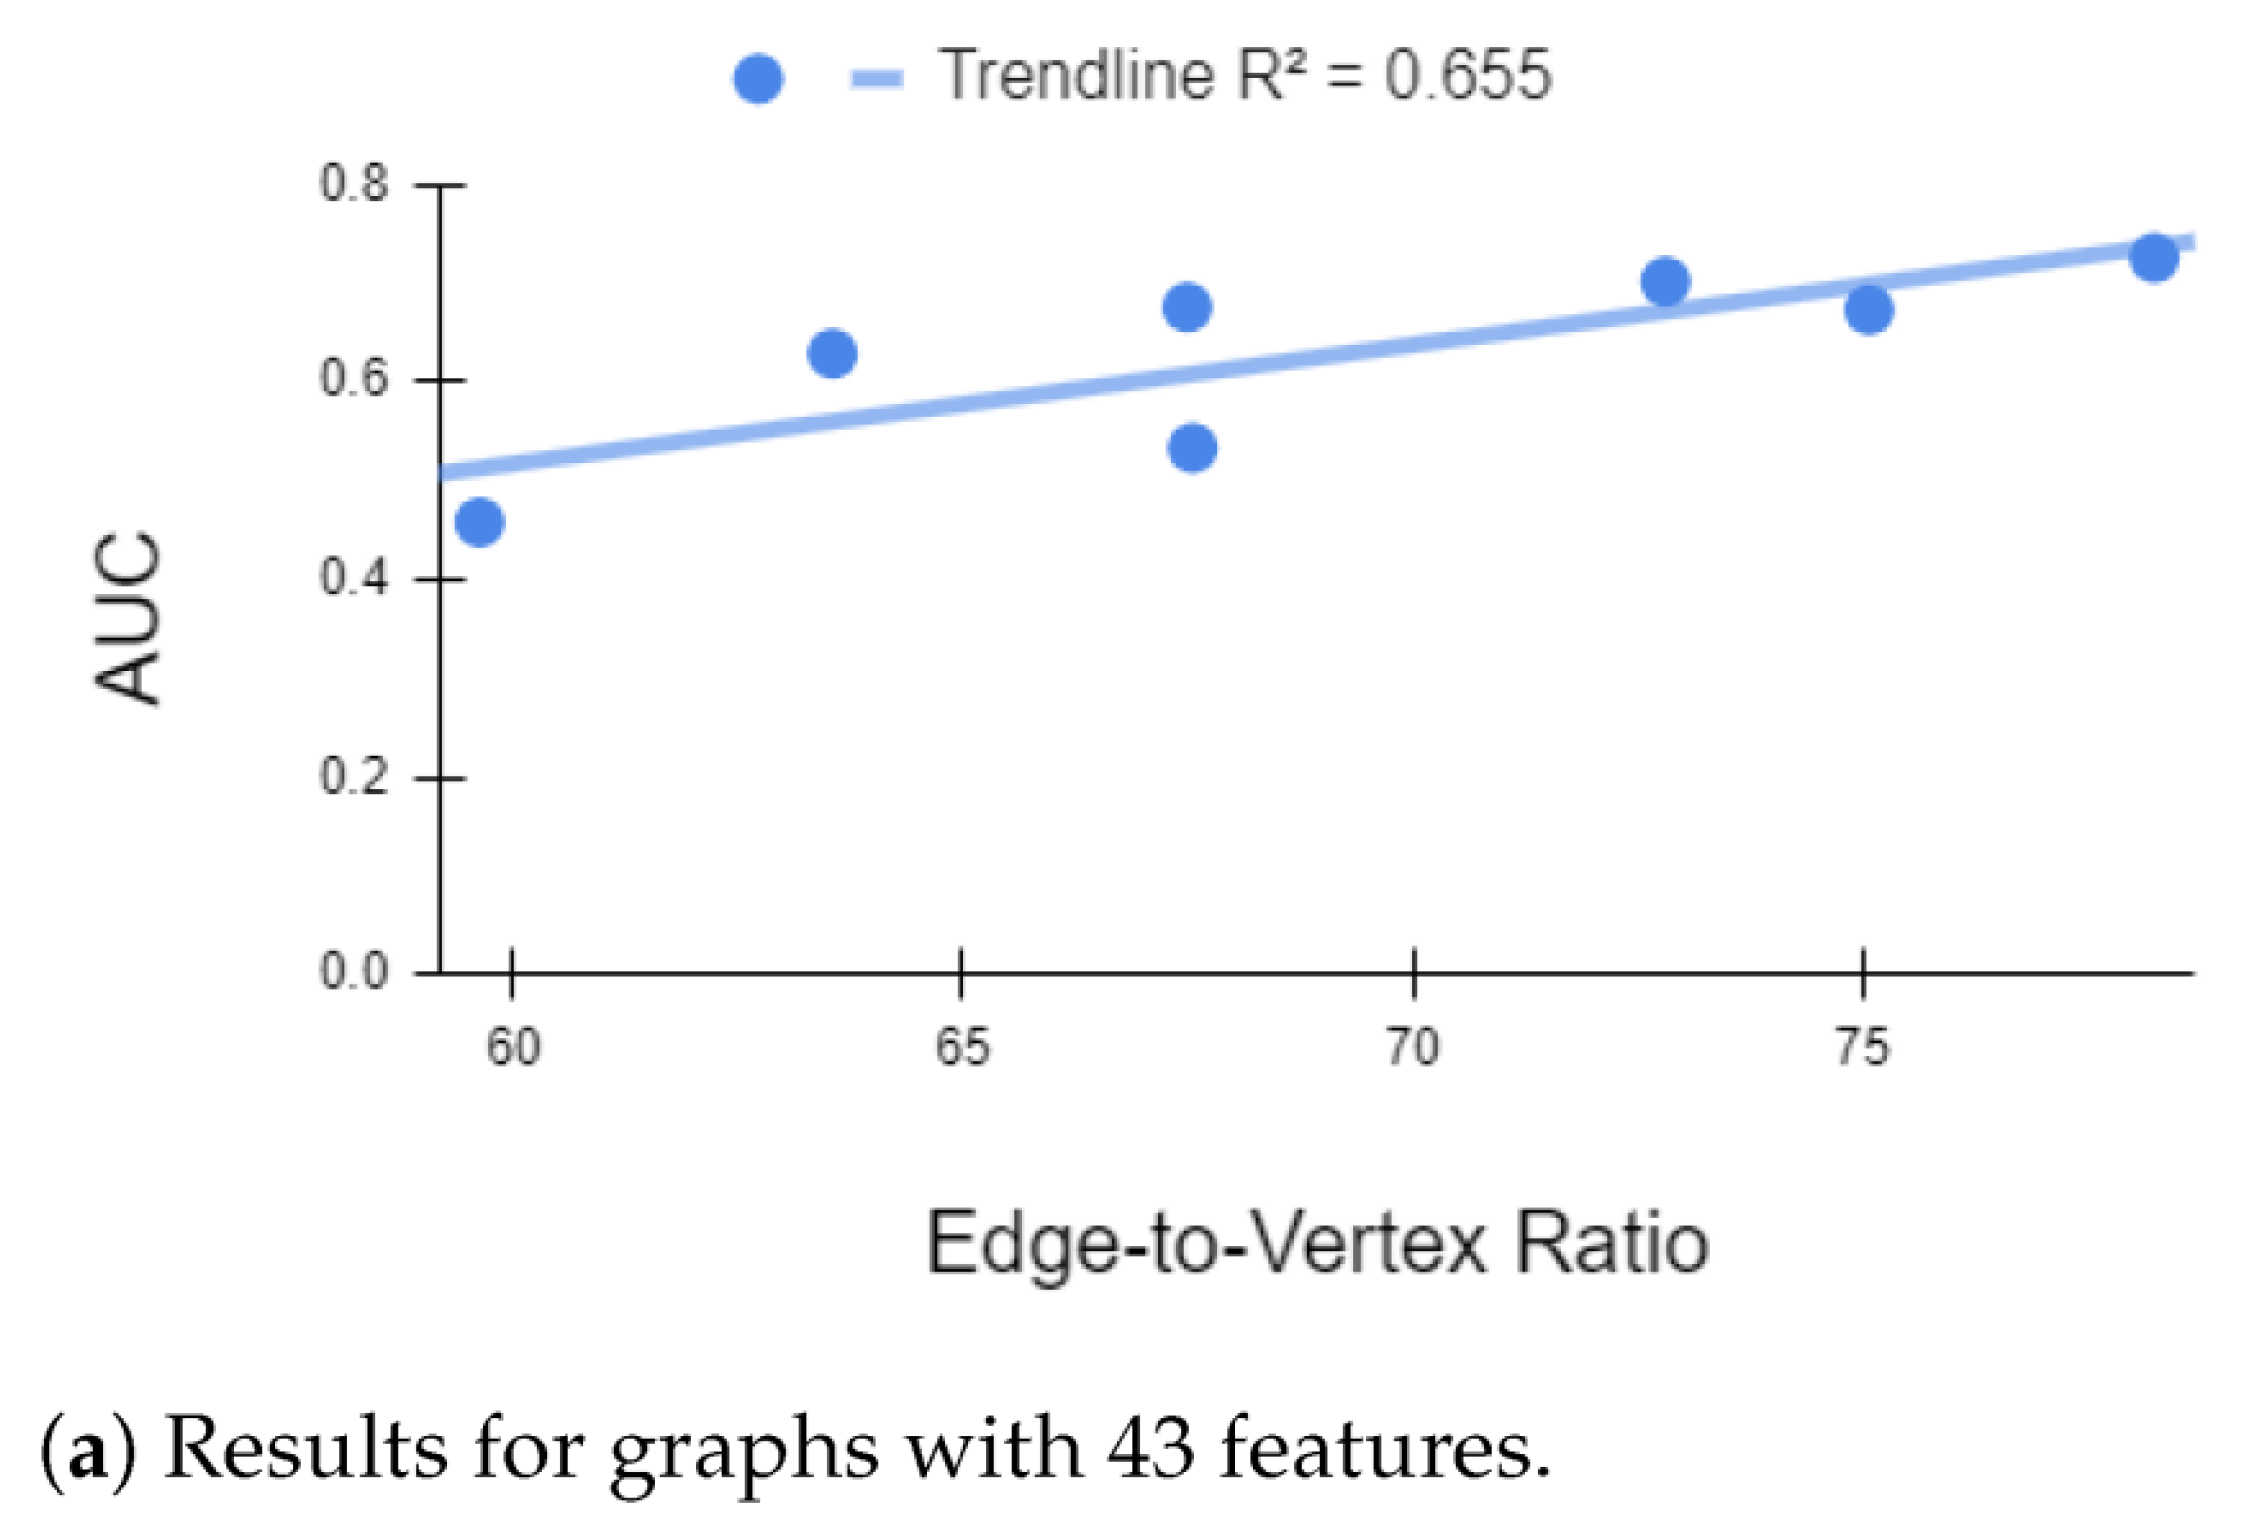
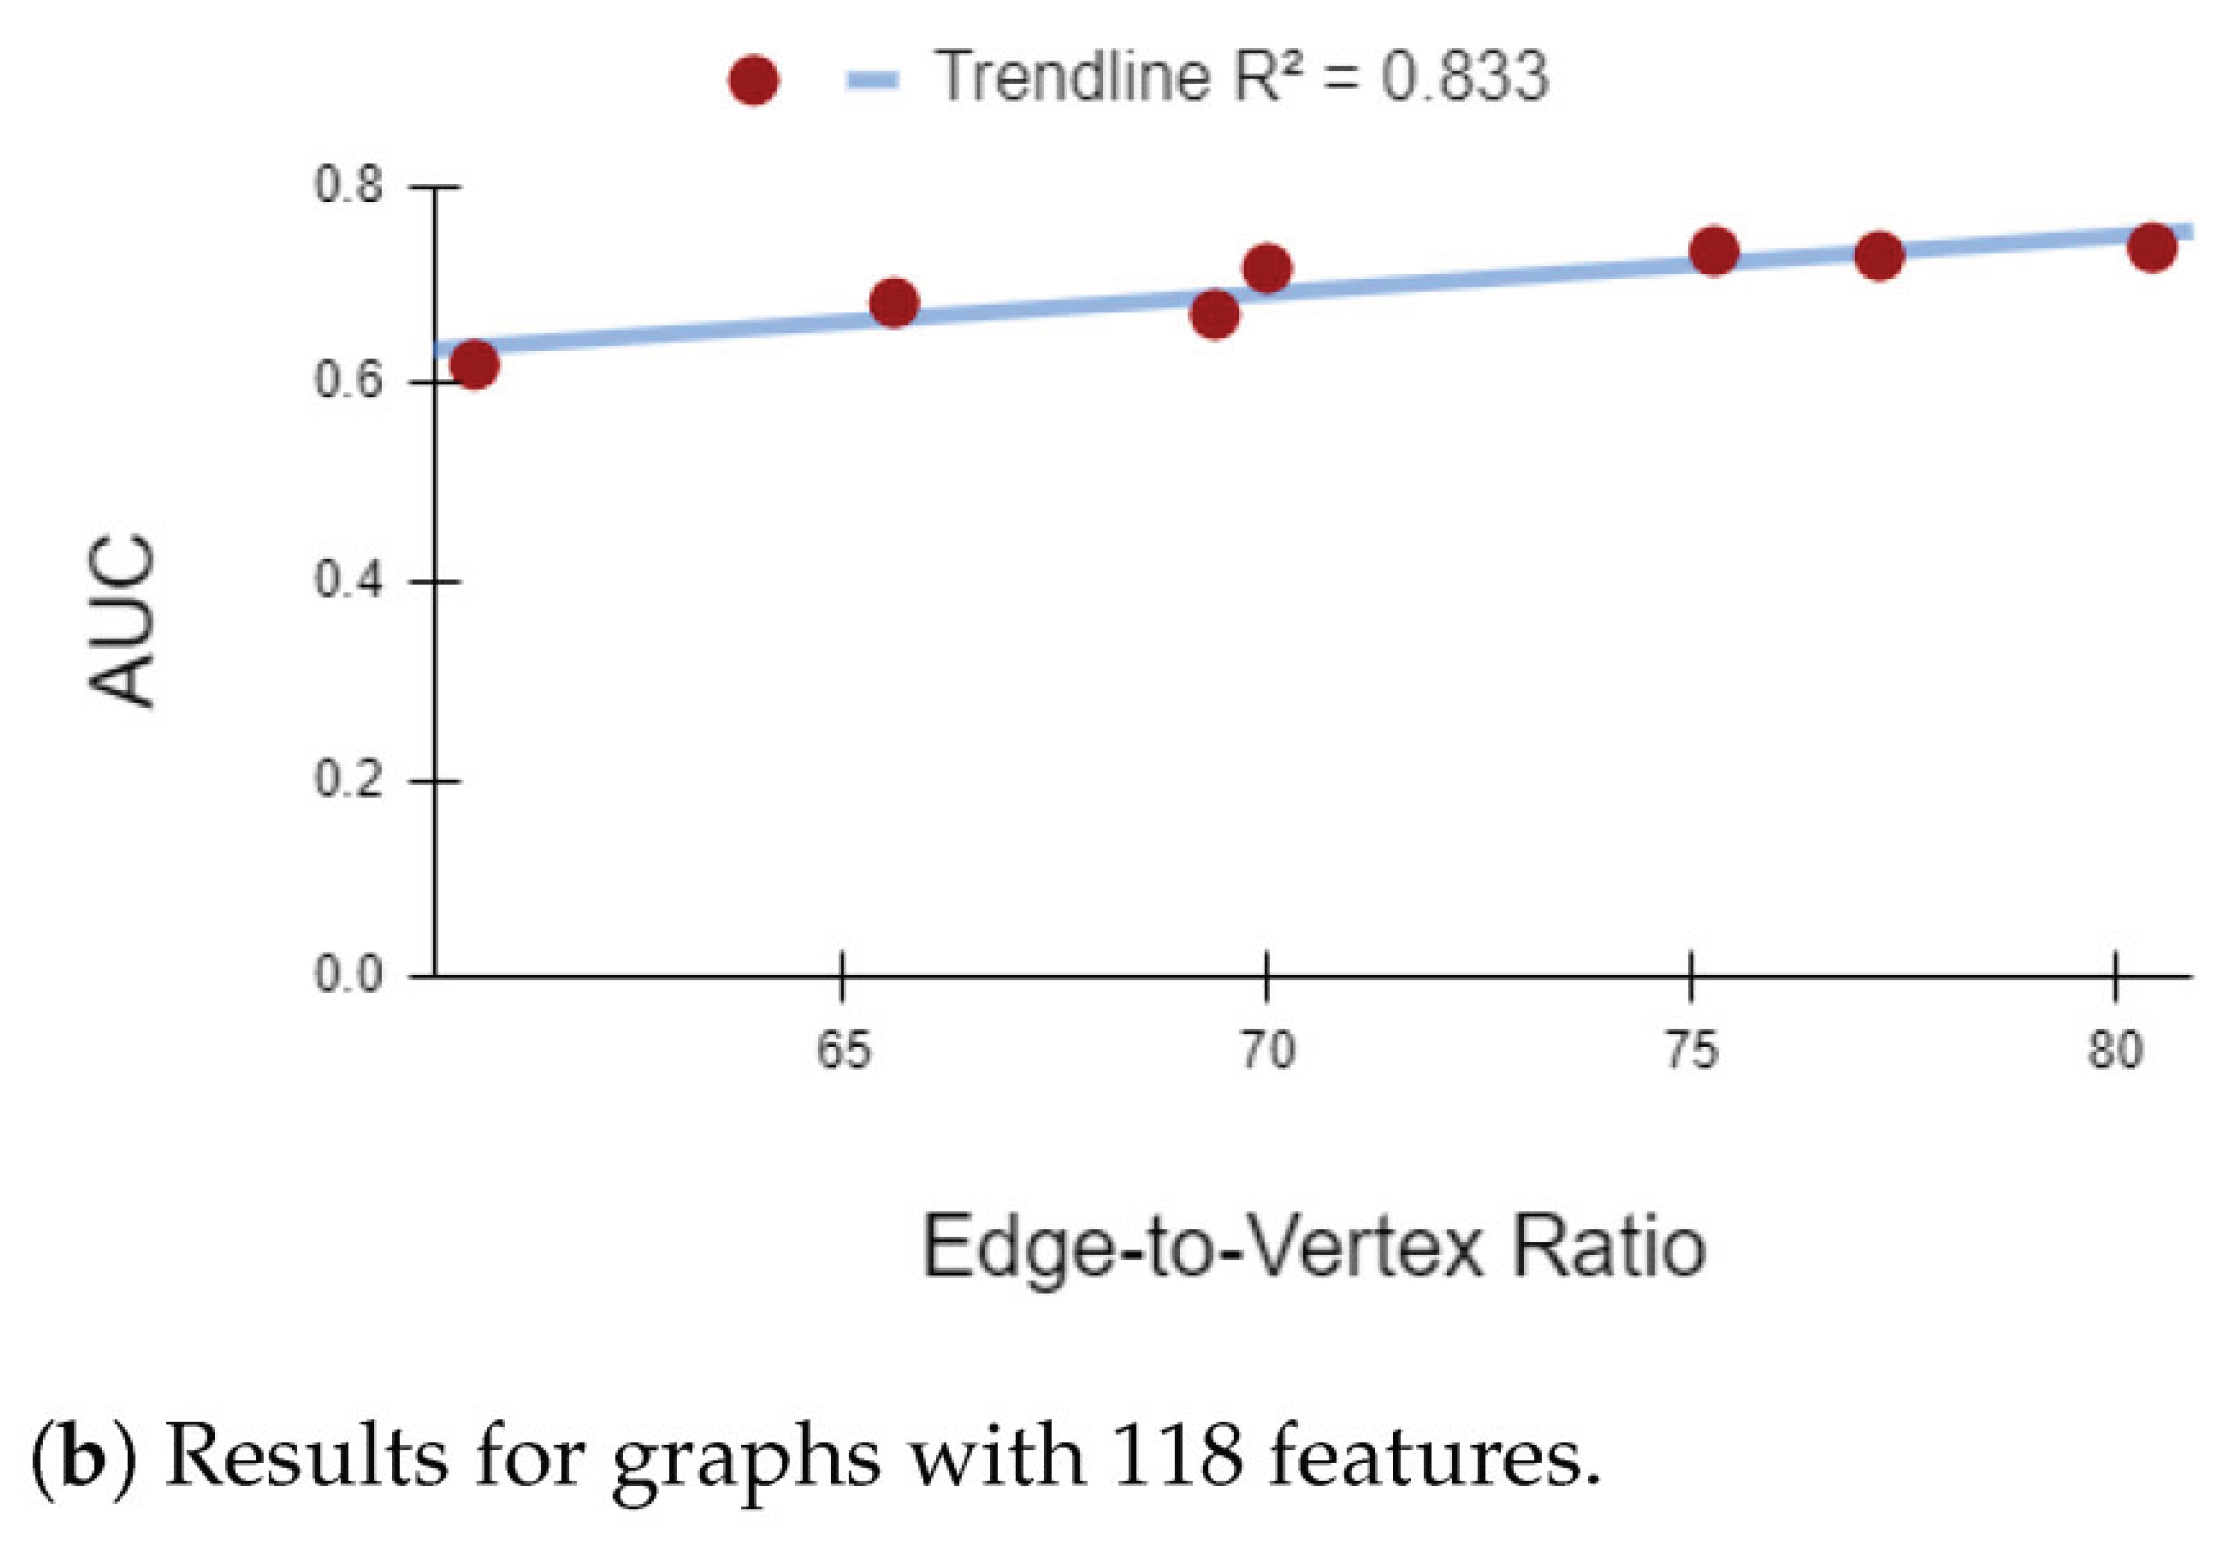
Figure 2.
Change in detection accuracy when more transaction links are included in the network.
3.4. Comparison with Existing Studies and Practical Relevance
Earlier work on carbon-credit misuse has mostly relied on case descriptions, manual tracing, or visual tools built for analysts. These studies rarely used labeled data and did not test predictive models. Other papers applied graph methods to generic financial fraud but did not include ESG data or sector-level emissions baselines [22,23]. This made it difficult to separate normal speculative trading from attempts to hide credit reuse or inflate reductions. Our results show that combining ESG records with network metrics can identify high-risk firms with high accuracy and a manageable number of alerts. Several limits remain. The labeled suspicious cases come from a subset of regions and may not include all forms of credit misuse. ESG disclosures are self-reported and may contain errors or selective reporting. Future work should extend the model to more markets, link it to audit findings, and test how the system performs as carbon-credit rules change over time.
4. Conclusions
This study examined carbon-credit laundering by combining ESG records with transaction-network data. The model reached high accuracy and detected patterns that fixed rules cannot capture, including short recycling cycles and clear gaps between reported emissions and retired credits. These findings show that environmental disclosures and trading links provide useful signals when used together. The results also suggest that multi-source data can support stronger checks in carbon-credit markets, where cross-market transfers and uneven reporting make manual review difficult. The approach is practical for daily use because the number of flagged cases remains within the capacity of compliance teams and the outputs point directly to trading paths that need closer review. The study has limits. The labeled cases come from only part of the market, and ESG filings may include errors or selective reporting. Further work should test the method in other regions, link predictions with independent audits, and study how detection changes when credit rules or verification practices evolve.
References
- Nield, K.; Pereira, R. Financial crimes in the European carbon markets. In Research Handbook on Emissions Trading; edward elgar publishing, 2016; pp. 195–231. [Google Scholar]
- Bowles, S. R. Money, credit and regional development: complementary local currencies and the provision of small business credit. Doctoral dissertation, University of Birmingham, 2022. [Google Scholar]
- Joshi, V. C. Changing Dimensions of Financial Services and Banking Regulation; Springer Books, 2025. [Google Scholar]
- Chaturvedi, B. Secure and Explainable Data Pipelines for Regulatory Compliance: A Cognitive Framework for Financial Services. Journal of Network & Information Security 2025, 13(2). [Google Scholar]
- Gu, X.; Yang, J.; Liu, M. Research on a Green Money Laundering Identification Framework and Risk Monitoring Mechanism Integrating Artificial Intelligence and Environmental Governance Data. 2025. [Google Scholar] [CrossRef]
- Mazumder, P. T. Explainable Machine Learning Pipelines for Customer Risk Scoring in Anti-Money Laundering: A Management and Governance Perspective. Journal of Data Analysis and Critical Management 2025, 1(02), 79–90. [Google Scholar] [CrossRef]
- Wang, J.; Xiao, Y. Research on Credit Risk Forecasting and Stress Testing for Consumer Finance Portfolios Based on Macroeconomic Scenarios. 2025. [Google Scholar] [CrossRef]
- Zhou, Y.; Booth, S.; Ribeiro, M. T.; Shah, J. Do feature attribution methods correctly attribute features? Proceedings of the AAAI conference on artificial intelligence 2022, Vol. 36(No. 9), 9623–9633. [Google Scholar] [CrossRef]
- Li, T.; Xia, J.; Liu, S.; Hong, E. Strategic Human Resource Leadership in Global Biopharmaceutical Enterprises: Integrating HR Analytics and Cross-Cultural; 2025. [Google Scholar]
- Cho, S. H.; Shin, K. S. Feature-weighted counterfactual-based explanation for bankruptcy prediction. Expert Systems with Applications 2023, 216, 119390. [Google Scholar] [CrossRef]
- Prosperi, M.; Guo, Y.; Sperrin, M.; Koopman, J. S.; Min, J. S.; He, X.; Bian, J. Causal inference and counterfactual prediction in machine learning for actionable healthcare. Nature Machine Intelligence 2020, 2(7), 369–375. [Google Scholar] [CrossRef]
- Fleischer, M.; Das, D.; Bose, P.; Bai, W.; Lu, K.; Payer, M.; Vigna, G. {ACTOR}:{Action-Guided} Kernel Fuzzing. 32nd USENIX Security Symposium (USENIX Security 23), 2023; pp. 5003–5020. [Google Scholar]
- Kute, D. V.; Pradhan, B.; Shukla, N.; Alamri, A. Deep learning and explainable artificial intelligence techniques applied for detecting money laundering–a critical review. IEEE access 2021, 9, 82300–82317. [Google Scholar] [CrossRef]
- Zhu, W.; Yao, Y.; Yang, J. Real-Time Risk Control Effects of Digital Compliance Dashboards: An Empirical Study Across Multiple Enterprises Using Process Mining, Anomaly Detection, and Interrupt Time Series. 2025. [Google Scholar] [CrossRef]
- Sattarov, T.; Schreyer, M.; Borth, D. Findiff: Diffusion models for financial tabular data generation. In Proceedings of the Fourth ACM International Conference on AI in Finance, 2023, November; pp. 64–72. [Google Scholar]
- Vasarhelyi, M. A.; Chan, D. Y.; Krahel, J. P. Consequences of XBRL standardization on financial statement data. Journal of Information Systems 2012, 26(1), 155–167. [Google Scholar] [CrossRef]
- Goel, A.; Rastogi, S. Credit scoring of small and medium enterprises: a behavioural approach. Journal of Entrepreneurship in Emerging Economies 2023, 15(1), 46–69. [Google Scholar] [CrossRef]
- Coston, A.; Mishler, A.; Kennedy, E. H.; Chouldechova, A. Counterfactual risk assessments, evaluation, and fairness. In Proceedings of the 2020 conference on fairness, accountability, and transparency, 2020, January; pp. 582–593. [Google Scholar]
- Gu, X.; Yang, J.; Liu, M. Optimization of Anti-Money Laundering Detection Models Based on Causal Reasoning and Interpretable Artificial Intelligence and Its Empirical Study on Financial System Stability. Optimization 2025, 21, 1. [Google Scholar] [CrossRef]
- Ferrario, A.; Loi, M. The robustness of counterfactual explanations over time. IEEE access 2022, 10, 82736–82750. [Google Scholar] [CrossRef]
- Zhu, W.; Yang, J.; Yao, Y. How Cross-Departmental Collaboration Structures Mitigate Cross-Border Compliance Risks: Network Causal Inference Based on ManpowerGroup’s Staffing Projects. 2025. [Google Scholar]
- Keshavamurthy, D.; Kumar, M.; Tsaramirsis, G.; Oroumchian, F. An AI-Based Framework for Secure and Transparent Banking: Integrating Adversarial Robustness, Interpretability, and Organizational Modeling. Security and Privacy 2026, 9(1), e70153. [Google Scholar] [CrossRef]
- Tan, L.; Peng, Z.; Song, Y.; Liu, X.; Jiang, H.; Liu, S.; Xiang, Z. Unsupervised domain adaptation method based on relative entropy regularization and measure propagation. Entropy 2025, 27(4), 426. [Google Scholar] [CrossRef] [PubMed]
Figure 1.
Carbon-credit transaction network showing firm clusters and key trading points.
Disclaimer/Publisher’s Note: The statements, opinions and data contained in all publications are solely those of the individual author(s) and contributor(s) and not of MDPI and/or the editor(s). MDPI and/or the editor(s) disclaim responsibility for any injury to people or property resulting from any ideas, methods, instructions or products referred to in the content. |
© 2026 by the authors. Licensee MDPI, Basel, Switzerland. This article is an open access article distributed under the terms and conditions of the Creative Commons Attribution (CC BY) license (http://creativecommons.org/licenses/by/4.0/).
Copyright: This open access article is published under a Creative Commons CC BY 4.0 license, which permit the free download, distribution, and reuse, provided that the author and preprint are cited in any reuse.


