
Submitted:
08 January 2026
Posted:
13 January 2026
You are already at the latest version
Abstract
LiDAR-based 3D object detection plays an essential role for autonomous driving vehicles under poor lighting condition environments. With LiDAR data, the significance of point cloud technologies is increasing important since Li-DAR sensors are largely cost down. However, the sparsity of point cloud poses a challenge for 3D object detection such that the advancements of sparse convolutional networks could be further investigated. Considering multiscale feature fusion mechanism can improve the object detection performances by using the rich inform among various scale features, we properly add the refinement fusion network with cross-attention modules to the existed 3D voxel-based object detection networks. Additionally, we a realistic strategy to refine the existing point-cloud data augmentation techniques to enable the trained detection networks to achieve substantially improved results. The experimental results demonstrate the effectiveness of our proposed detection system across three categories on the KITTI dataset. These enhancements address the limitations of current approaches and highlight the superior performance of the proposed system.
Keywords:
3D object detection
; region-based convolutional neural networks
; voxel-based sparse convolution
; LiDAR point cloud
1. Introduction
The rises of autonomous driving cars and the needs of vehicle with advanced driving assistance systems has sparked increasing interest in three-dimensional (3D) object detection in academia and in-dustry. Without using RGB images under poor lighting conditions, the LiDAR solution with deep learning plays a pivotal role in this applications. Compared to image methods, the LiDAR approach offers enhanced accuracy in 3D space and provides robust results against various weather and lighting conditions. There are some researches fully utilized Lidar-image fusion for effective 3D object detection [17,20]. In severe weather condition or seasonal changes, the climate changed immensely, the detection networks could not adopt to those cases. If the image sensors fail to work properly, the Lidar-image collaborations will not also function correctly. Hopefully, without image data, the 3D object detection networks can still provide precise acquisition of object geometric outlines with more detailed 3D information. Thus, based on Lidar data only, there still exit many deep learning techniques actively proposed [1,2,3,4,5,6,7,8,9,10,11,12,13].
Figure 1 shows a sample pair of image and LiDAR point cloud data. Generally, the 3D object detection networks in uses of LiDAR point clouds can be categorized into point-wise and voxel-wise detection approaches. The point-wise 3D detection utilizes multilayer perceptron (MLP) and grouping techniques to extract local features at the point level while preserving certain aspects of the original point cloud information. However, the point-wise approach demands heavy computation inferentially with limited accuracy improvements. The voxel-wise 3D detection leverages the rasterization of point cloud scenes and 3D sparse convolution to extract 3D point cloud information. Thus, voxel-wise 3D detection is steadily gaining prominence as the prevailing approach for point cloud object detection due to the efficiency of convolution operations. Furthermore, with the implementation of suitable refinement frameworks, voxel-wise 3D detection achieves comparable or even higher accuracy than point-wise 3D detection approaches. To accurately predict 3D objects in sparse point cloud scenarios, the use of a precise and efficient 3D object detection network is imperative. Voxelization and voxel feature extraction (VFE) prove to be a highly effective operation for representing sparse point clouds. By discretizing the point cloud scene into a four-dimensional tensor, we can employ a convolutional network on this tensor to extract three-dimensional spatial information. Compared to point-wise operations, the voxel-based approach not only conserves computational resources and inference time but also aligns better with the requirements of self-driving applications.
With the above facts, in this paper, we adopt voxel R-CNN [1] as our primary architecture since voxel R-CNN effectively enhances feature maps of various scales to achieve better performances. However, the voxel R-CNN lacks a robust mechanism to effectively fuse the distinct scale feature maps. Consequently, we design a two-stage detection network to achieve exceptional accuracy and efficient infer-ence time. We introduce a novel prediction header to the original voxel-wise 3D detection architecture by enhancing the network to learn from multi-scale objects by complementing feature maps of varying depths and reinforcing the correlation between the region of interest (RoI). Finally, to improve the training process, we also combined with the existing data augmentation by introduce new data augmentation techniques to further advance the network in achieving improved accuracy.
2. Related Work
The self-driving systems, the 3D object detection based on point cloud data is the most important real-world applications. For example, the self-driving cars have demonstrated their prospects and commercial values. Specially for military and surveillance applications, such as self-drive flying drones and unmanned ship, the object detection without light sources should be an important capability, when they are operated during the night. On severe lighting conditions, the Lidar-only 3D object detection be-comes important. Over past few years, there has been a growing trend of 3D object detection research. There are not only many 3D detectors with distinct architectures, but also notable differences in the processing of point cloud data and extraction of point cloud geometric information [1,2,3,4,5,6]. In the following subsections, we will review some exited noticeable networks related to point-cloud object detection and classification.
2.1. PointNet and PointNet++
The PointNet [2] points out three key characteristics of point cloud data: 1) unordered, 2) interaction among points and 3) invariance under transformations. Among these, the unordered property holds the utmost importance. PointNet achieves unordered through symmetric operations and mitigates the potential loss of 3D spatial information by employing multilayer perceptron (MLP) layers. On the other hand, PointNet++ [3] addresses the limitation of PointNet in extracting local features from 3D spatial information by introducing set abstraction (SA) layers. These SA layers employ a farthest point sampling (FPS) and grouping mechanism inspired by the PointNet architecture.
2.2. Point-Based 3D Object Detection
Due to the high performance of PointNet and PointNet++ in point-wise feature extraction, many networks have adopted these approaches for conducting 3D object detection research on pure point clouds. Building upon the original SA layer architecture, the 3DSSD [4] introduces a novel approach called F-FPS, which performs FPS operations on the feature coordinate system. Unlike the original SA layer that utilizes Cartesian coordinates for FPS (D-FPS), the 3DSSD puts up with the sampling key points based on feature distance for the selection of foreground points. Furthermore, the 3DSSD intro-duces a candidate generation (CG) layer designed to predict the offset between each foreground point and the centroid of the object of interest. By applying the calculated offset to each foreground point, the CG layer generates predicted candidate points. These candidate points are then fed into the detection head to produce the final regression and classification results.
2.3. Voxel-Based 3D Object Detection
Although the point-based 3D detection networks are effective in handling the sparsity of point cloud data, the feature extraction based on individual points requires significant computational re-sources and time. For real-time applications, the point-based 3D detection networks face some severe challenges. Recognizing the efficiency of 2D convolution in image detectors, the incorporation of 3D convolution in point clouds has gained momentum. The SECOND [5] sequentially feeds point clouds into the 3D and 2D backbones and leverages sparse convolution and sub-manifold sparse convolution [6] techniques to achieve substantial improvements in both accuracy and speed. To convert point clouds into a pixel-like representation, we can treat it as the first step voxelization. To reduce the computation, voxelization based on a predefined voxel size and point cloud ranges segments the entire point cloud scene several small cubes. Following the voxelization, voxel feature extraction (VFE) should be per-formed, where the multiple point clouds within each voxel are transformed into a one-dimensional vec-tor that serves as a feature representation of the voxel. This process generates a four-dimensional tensor data that can be used for subsequent 3D convolution operations.
Since the number of non-empty voxels is typically very small compared to the entire scene (usually less than 0.1%), the voxel data is stored in a sparse format, recording only the values and indices of the non-empty voxels. The SECOND utilizes sparse convolution and sub-manifold sparse convolution op-erations exclusively on non-empty voxels, significantly improving the efficiency of feature extraction. After the features are extracted in 3D space, the feature map is projected onto a bird’s eye view (BEV). Subsequently, the feature map is processed through a 2D backbone network and a region proposal net-work (RPN) to further extract relevant information and predict the object’s class and 3D bounding box.
2.4. Two-Stage 3D Object Detection
Recognizing the promising performance achieved by single-stage voxel-based detectors in point cloud object detection. One approach to extend the concept of 2-stage networks from 2D convolutional neural networks (CNNs) to 3D CNNs was introduced. For instance, the voxel R-CNN incorporates a supplementary refinement network alongside the primary architecture of SECOND. This refinement network comprises two modules: voxel region of interest (RoI) pooling and a novel prediction head.
The first stage of the network is essentially similar to that of SECOND. However, in the second stage, the network focuses on the RoI features by combining the 3D backbone feature maps with the voxel RoI pooling operation. The process starts by uniformly creating grid points within the RoI. Voxel query is then conducted using these grid points as the centers. The goal is to aggregate non-empty voxels based on their indices. Unlike the ball query used in PointNet++, voxel query utilizes the Manhattan distance to identify targets within the specified range, rather than using a spherical radius. Once the voxel query is completed, the PointNet network generates a dimensional vector that serves as the feature representation for the grid points. This summarizes the overall process of the voxel RoI pooling module. Once the features of the grid points are obtained, the detection head predicts the refined results.
3. Proposed Methods
When the system comes to 3D detection tasks, accurately identifying multiple types of objects within sparse point clouds becomes crucial. However, due to the inherent limitations of point cloud data in open scenes, the density of point clouds collected by LiDAR for objects with different sizes can vary significantly. This variability poses a challenge while attempting to incorporate mechanisms that effectively fuse feature maps at different scales.
3.1. The Proposed Network Structure
The flow chart illustrating our proposed 3D object detection network is shown in Figure 2. The net-work takes the point cloud as the input, where each point in the point cloud is represented by its Cartesian coordinates (x, y, z) and reflection intensity r. Prior to entering the first stage of the network, the point cloud undergoes voxelization, which divides the N-point cloud data into m non-empty voxels. Each voxel can contain up to n points, where m and n represent the maximum number of voxels and the maximum number of points per voxel, respectively. If the number of points exceeds n, they should be down-sampled to n; if it falls short, the voxel is padded with zeros.
Following voxelization, the 3D/2D data retrieval subsystem generates regions of interest (RoIs), as illustrated in Figure 3. These RoIs contain information such as box centroids, sizes, orientations, and classifications. They are then combined with the 3D backbone feature map and fed into the second subsystem of the network, where the further refinement of the RoIs takes place to result in more accurate predictions. The data retrieval subsystem encompasses the voxel feature extractor, 3D backbone, and 2D backbone networks. On the other hand, the subsystem pyramid decision subsystem includes the voxel RoI pooling, pyramid fusion and cross-attention modules.
3.2. Data Retrieval Subsystem
The entire network of the data retrieval stage follows the same architecture as voxel R-CNN [1]. After voxelization, in order to perform 3D convolution, it is necessary to convert the voxel features into one-dimensional vectors. This is achieved by extracting the internal point cloud information using the voxel feature extractor (VFE) module, as illustrated in Figure 4. In our approach, we employ average pool-ing for the points within each voxel, instead of using PointNet operations [7]. It is not necessary to ex-port an excessive number of channels in the VFE module. Thus the average pooling of the points suffices.
As illustrated in Figure 5, the 3D backbone of our proposed network employs a combination of sparse convolution and sub-manifold sparse convolutions. This approach allows us to handle the sparsity of the data by storing it in a sparse tensor format, where only the feature values and indices of non-empty voxels are recorded. Sparse convolution operations are then performed exclusively on these non-empty voxels. Essentially, this sparse tensor representation serves as a dense feature map with dimensions (H, W, D), resembling to a 3D image. Regarding the KITTI 3D dataset, we set the point cloud ranges [xmin, xmax], [ymin, ymax] and [zmin, zmax] as [−40, 40], [0, 70.4] and [−3, 1] meters, respectively and define the voxel size (vx, vy, vz) to (0.05. 0.05, 0.1) meters. As the dense feature map’s size is determined by dividing the point cloud range by the voxel size, the resulting dimensions of (W, H, D) feature map in Figure 5 are set to (1600, 1408, 40).
The 2D backbone and region proposal network (RPN), as depicted in Figure 6, employ the same 2D backbone module utilized in voxel R-CNN [1], although it can be substituted with any other 2D object detection network as desired. The data initially undergoes a conversion from sparse to dense format and is then transformed into a bird’s eye view by reshaping the z-axis and channel dimensions to match that of a 2D image. Subsequently, the data is processed by the 2D backbone network to generate RoI proposals, which are used in the subsequent refinement network. It should be emphasized that, at this stage, the generated RoIs do not differentiate between foreground and background objects; instead, they preserve the complete anchor-based feature map. The detailed descriptions of fusion modules (FMs), up-conversion (Upconv) block, and Deep ASSP module will be explained in the following subsections.
3.3. Pyramid Decision Subsystem
Inspiring from the previous works [8,9], we apply the self-attention module and leveraged multi-scale CNN feature maps to enhance the detection performance of two-stage 3D detectors. Followed the same procedure suggested in voxel R-CNN [1], the RoIs combine Fconv2, Fcon3, and Fcon4 features from the 3D backbone, and the voxel RoI pooling operation is performed to generate the RoI features, Froi2, Froi3 and Froi4. The proposed pyramid fusion RoI head with a refinement network is used to improve the detection results as illustrated in Figure 7.
The RoI features are then used to obtain the prediction as showed in Figure 7. However, there is a distinction in our approach. Unlike voxel R-CNN, which directly concatenates the RoIs features from the three scales and processes them through the FFN network to obtain the final result. We learnt that this method lacks the ability to effectively identify objects across scales and may exhibit instability in detecting multiple classes. To solve this shortage, we separate the RoIs features by scale sand enhance the correlation between them by using the proposed fusion and cross-attention modules as shown in Figure 7. This architectural design shares a conceptual similarity with cascade structures, such as CasA network [10], which employs multiple subnetworks to refine region proposals. However, the computational burden of such an operation is not sufficiently low for practical application in self-driving systems.
After obtaining the RoIs features with a dimension of (R, Gx32), we pass them through an FFN network to extract the features and adjust the number of channels to (R, 256), where R represents the number of RoIs. The value of R is derived from the output of the data retrieval network and filtered using non-maximum suppression (NMS). In the training process, we set R to 512. In testing phase, it is set to 100. Additionally, G denotes the number of grid points, which is configured as 6x6x6, equivalent to 216 grid points uniformly sampled along the length, width, and height of each box within an RoI.
Following that, the relationship between the previous RoI feature and Fconv3 and Fconv2 levels is reinforced using the fusion module, as depicted in Figure 8. Drawing inspiration from the recursive feature pyramid (RFP) module introduced in DetectoRS [11], we observe that the combination of 1x1 convolution and sigmoid operations enables the network to learn the weight σ, determining the significance of each feature. However, in the original design, the fusion of the two features in a complementary manner leads to one feature dominating over the other, resulting in imbalanced feature representations. To address this limitation, our proposed fusion module allows two RoI features with different scales to learn their respective weight σ. Since σ is an output value between [0,1], we aim to encompass both weaker and stronger scenarios by adjusting the output range to [0.5, 1.5] through adding a 0.5 offset. Finally, the fusion module concatenates the two features as its output, achieved by multiplying the RoI features by their respective weights and incorporating residuals.
Subsequently, to enhance the correlation between different levels, we introduce the cross-attention module at the end of each level [14,15]. This module takes the features of the current level as Q inputs and incorporates all the features from the upper levels, including the current level, as K and V inputs. This architectural design of multi-head self-attention process is illustrated in Figure 9, to strengthen the interdependencies among the levels. To enrich the Q, K, and V inputs, we incorporate additional information through position embedding and employ a multi-head architecture, with i setting to 4 in Figure 9. Before entering the cross-attention module, all inputs are transformed into three-dimensional features. Specifically, the Q input is unsqueezed from dimension (R, 256) to (1, R, 256), while the K and V inputs are unsqueezed to (L, R, 256) based on their respective Lth level. Notably, at the first level, the inputs Q, K, and V are the same, making the cross-attention module equivalent to the self-attention module. Subsequently, the output feature of each cross-attention module, with dimensions matching that of Q, will be concatenated into a single prediction head to generate the final outcome.
3.4. Polar-Based Data Augmentation
In point cloud scenes, there is often a significant imbalance in types and quantities of objects pre-sent, as depicted in Figure 10a. Such imbalanced data, for example, where only one pedestrian is marked in the entire scene, hampers the training of the network. To overcome this imbalanced data problem, to train the typical 3D object detection networks often employs a data augmentation technique called “gt_sampling”. This approach aims to increase the number of rare objects in a scene and balance the distribution of different classes, as illustrated in Figure 10b.
The gt_sampling operation involves randomly sampling ground truth objects from other scenes and subsequently checking for collisions between these sampled objects. If a collision occurs, the corresponding ground truth is discarded. To further enhance the diversity of the augmented data, we suggest an improved way to the original gt_sampling method. As depicted in Figure 11, the newly-added sampled object collision to the sampled ground truths is detected, we randomly shift the objects to different locations. Given the nature concept of LiDAR data, the detect light is always from the side of an object facing the origin of the LiDAR source. To avoid the collision, we randomly shift the object by transforming it to a new polar coordinates. We rotate the object based on its radial distance r and azimuth angle θ to ensure that the point cloud data aligns with the direction in which the object faces the origin.
Furthermore, it is important that the number of object point clouds captured by the LiDAR tends to decrease as the distance between the LiDAR and the object increases. To account for this characteristic, we have devised a sampling mechanism that enables the object density to decrease with distance. Here, object density refers to the ratio of the number of point clouds belonging to an object to the volume size it occupies. The distance metric employed for this purpose is based on the radial distance r from the sensor, as depicted in Figure 12. We firmly believe that this decaying sampling design will facilitate the network in gaining more insights into objects with sparse density, ultimately enhancing the network’s performance.
3.5. Loss Functions for Training
To train our networks, we employ the same loss functions as that used in the voxel R-CNN. We define the total loss as
where LDR means the loss for data retrieval stage and LPD denotes the loss for pyramid decision stage. We utilize the output of the RPN head as a predictor for data retrieval stage.
The loss of data retrieval stage is defined as
where denotes the number of foreground anchors produced by RPN head, , , and represents the predictions and ground truths of classification and regression, respectively. In (2), means that only the ith proposal with intersection over union (IoU) is greater than the threshold θ will produce the regression loss, the classification loss and regression loss are binary cross entropy and smooth-L1 loss respectively. In bounding box regression, the 3D bounding box differs from the 2D bounding box in that it comprises seven-dimensional box parameters. Specifically, these parameters include the center point , box size, and rotation direction θ along the z-axis.
Similar to LDR, the loss of pyramid decision stage is defined as
where NII denotes the number of foreground anchors produced by pyramid fusion RoI head, and B(IoUi> σ) means that the ith RoI with IoU greater than the threshold σ will contribute . The IoU threshold θ and σ are usually are different.
4. Experimental Results
The proposed 3D object detector is implemented in Python 3.8.16 and PyTorch 1.9.1. For the hardware devices, we utilize a standard desktop with Intel Core i9-10920X CPU with 3.5GHz and Nvidia Quadro RTX6000 24G GPU with the support of CUDA 11.1. We utilize the KITTI 3D dataset [16] for both training and evaluation tasks. The dataset consists of 7,481 points cloud data samples, which we split into two sets: 3,769 samples for the KITTI training set and 3,712 samples for the KITTI evaluation set. Furthermore, each point cloud data is accompanied by its corresponding image, providing a visual reference for understanding the scene pattern, as depicted in Figure 13. However, it is noted that the proposed 3D detectors solely rely on the point cloud input and do not incorporate color image information during either the training or evaluation tasks.
For training tasks, we use Adam optimizer [17] with β1 = 0.9, β2 = 0.99. We conducted training for 120 epochs using a batch size of 10 and selected the weight that exhibited the best overall performance across all epochs. The optimal weights were selected from this set of epochs. Additionally, during train-ing, we configured the maximum points per voxel to 5 and the maximum number of voxels to 16,000. During testing, the maximum number of voxels was increased to 40,000. For the data augmentation, in addition to our proposed angle-tuned data augmentation, we applied random rotations, scaling, and y-axis flipping operations to the training data.
The KITTI dataset employs average precision (AP) as its evaluation metric, which involves calculating the average of precision values obtained from the precision-recall curve. In our study, we specifically choose to use instead of based on the recommendation provided by Mapillary team [18]. The inclusion of zeros in can sometimes lead to misleading performance improvements. By using, we aim to eliminate this potential bias, ensuring a fairer comparison and a better estimation of the area under the precision-recall curve.
4.1. Verification of Proposed Method
Our research primarily utilized the OpenPCDet toolbox (Team 2020) [19] for implementation, which facilitated the acquisition of pretrained weights for the voxel R-CNN model [1]. Since the voxel R-CNN method has shown better results than most exited point-wise and voxel-wise methods [1], the proposed method only compares to voxel R-CNN approach without loss of generosity.
Table 1 presents performance comparisons in capabilities of the proposed and voxel R-CNN [1], particularly when the “use_road_plane” technigue used in data augmentation is omitted. In the “use_road_plane” technique, the road planes are suggested for gt_sampling data augmentation, involving the addition of extra ground truths onto the “road plane” within the current scene. The decision to ex-clude this data augmentation approach stems from its adverse effects on the performance of our pro-posed network. In this regard, we focus on comparing the capabilities of both networks using identical training batch sizes and epochs.
With the retraining voxel R-CNN, Table 1 shows that the proposed 3D object detection method is better than the voxel R-CNN method for all car, pedestrian and cyclist classes. In Table 2, with use_road_plane technique in data augmentation, we present comparisons of our proposed 3D detection system and the voxel R-CNN architecture using the AP|R40 metric. Due to the lack of experimental data available for AP|R40 in the original paper [1], we leveraged the pretrained weights of voxel R-CNN released in the OpenPCDet toolbox and computed the results for AP|R40 on our device using those weights such that the results are marked with “ ”in Table 2. However, it is noted that the pretrained weights are only available for a single class, namely “Car”. We marked the results with “-“ for the reminding pedestrian and cyclist classes. Consequently, we conducted additional re-training of the voxel R-CNN model to accommodate all three classes of data for comprehensive comparisons. The retraining data is denoted by the symbol “ ” in Table 2. During the retraining process, we adhered strictly to the configuration and dataset specifications provided in the OpenPCDet toolbox, and maintained a batch size of 16, as indicated in the original paper [1]. Comparing Table 1 and Table 2, the de-tection precision of the proposed method and the retrained voxel R-CNN with use_road_plane tech-nique will become worse.
4.2. Ablation Study
In our ablation study, we test all possible combinations of the proposed modules and submodules to verify the correctness of the designed improved modules. Thus, we made modifications to different models and retrained them using the configuration provided in the OpenPCDet toolbox. Notably, the “use_road_plane” method of data augmentation was excluded from the training process of all networks in this subsection. The use_road_plane method, which involves pasting additional ground truth onto the road plane of the current scene, was not utilized for gt_sampling data augmentation. The mean average precision (mAP) is calculated by summing up the values for the three difficulty levels (Easy, Moderate, and Hard) and then averaging the results. The Avg. refers to averaging the performance metrics mAP across the three object categories (Car, Pedestrian, and Cyclist).
In Table 3 and Table 4, we compare the effects and improvements brought by using different proposed modules, and each method is described as follows: In Table 3, Method (a) involves retraining the original voxel R-CNN architecture on our device. Method (b) replaces the original detection head with our proposed pyramid fusion RoI head. Method (c) incorporates our proposed angle-tuned data augmentation method suggested in Section 3.4 during the training of method (b). Table 3 shows that the proposed pyramid fusion RoI head and angle-tuned augmentation can successfully improve the performances of the voxel R-CNN in detection of Car, Pedestrian, and Cyclist objects. Of course, Method (a) and Method (c) denotes the voxel R-CNN and the proposed method, respectively.
Based on method (c), we keep the angle-tuned augmentation mechanism in the networks. We could test the detailed designs of the pyramid fusion RoI head. In Table 4, Method (d) removes the fusion module from the pyramid fusion RoI head, Method (e) removes the cross-attention module from the pyramid fusion RoI head, Method (f) removes both cross-attention module and fusion module from the pyramid fusion RoI head. Table 4 shows that our proposed fusion module significantly enhances the network’s ability to detect pedestrians. However, we also notice that when the network focuses excessively on smaller objects like pedestrians, it might compromise the detection capability for larger objects. On the other hand, the cross-attention module, the referred multiple levels tend to average out the performance across various categories. Considering these insights, we decided to use both architectures since the combined architecture demonstrates the best overall performance, aligning with our design concept of the pyramid fusion RoI head. Our objective was to enhance the network’s performance across different scales by learning the correlation between feature maps of various scales.
Table 5 presents a comparison of the top-down RoI characteristics of the pyramid fusion RoI head module, focusing on the transition from “shallow to deep” and “deep to shallow” features. In this comparison, we consider three RoI features: Froi2, Froi3, and Froi4, representing the primary RoI features. In this paper, Froi4 denotes the deep feature and Froi2 refers to the shallow one. Actually, Figure 7 shows the “deep to shallow” architecture of the pyramid fusion RoI head since it starts from Froi4 and ends at Froi2. Table 7 shows that the proposed fusion order suggested in Figure 7 can get much better performance improvement than the structure starting from Froi2.

Table 5.
Performance comparison of pyramid fusion RoI head with different sorting for from the top down on the KITTI val set.
Table 5.
Performance comparison of pyramid fusion RoI head with different sorting for from the top down on the KITTI val set.
| Methods | Car | Pedestrian | Cyclist | Total |
|---|---|---|---|---|
| mAP | mAP | mAP | Avg. | |
| From shallow to deep | 83.73 | 58.02 | 78.09 | 73.28 |
| From deep to shallow | 85.48 | 58.81 | 79.24 | 74.51 |
Table 6.
Performance comparison of refinement network with different number of levels on the KITTI val set for car class.
Table 6.
Performance comparison of refinement network with different number of levels on the KITTI val set for car class.
| Number of levels | Baseline | Ours |
|---|---|---|
| mAP | mAP. | |
| 2 | 85.33 | 85.81 |
| 3 | 84.99 | 85.48 |
| 4 | 84.64 | 85.62 |
To further verify the offset design of fusion module exhibited in Figure 8, Table 7 presents a compari-son of the designed fusion module in the pyramid fusion RoI head, specifically evaluating whether the sigmoid output includes an additional offset of 0.5. Table 7 shows that Car class does not get the benefit, however, the overall performance show better results if we include the additional offset 0.5.
Table 7.
Performance comparison of 0.5 offset for sigmoid module in fusion module on the KITTI val set.
Table 7.
Performance comparison of 0.5 offset for sigmoid module in fusion module on the KITTI val set.
| Method | Car | Pedestrian | Cyclist | Total |
|---|---|---|---|---|
| mAP | mAP | mAP | Avg. | |
| w/o 0.5 offset | 85.92 | 57.27 | 76.01 | 73.07 |
| w/ 0.5 offset | 85.47 | 58.80 | 79.24 | 74.51 |
5. Conclusions
In this paper, we introduce a novel 3D object detection network based on point clouds. We enhanced the voxel R-CNN method by proposing pyramid fusion RoI head, which utilizes a multiscale feature fusion module to combine RoI features from different levels with cross-attention modules to enhance the correlation among these levels. By incorporating these modules, we aim to improve the re-finement performance of the network by enhancing feature maps at various scales. During the training phase, we also employ the proposed data augmentation techniques to introduce greater variability in the placement of ground truth objects. Specifically, we apply displacement, rotation, and data augmentation strategies that gradually reduce the density of points with increasing distance. This approach enables us to achieve superior network performance by enriching the training data and better mimicking re-al-world scenarios. Compared to the voxel R-CNN method, we substantiate the effectiveness of the proposed methods through comprehensive experimental data and rigorous ablation experiments.
Author Contributions
Conceptualization, W.Y. and S.Y.; methodology, W.Y.; software, S.Y.; validation, W.Y., S.Y. and J.Y.; formal analysis, W.Y.; investigation, W.Y., S.Y.; resources, S.Y.; data curation, W. Y.; writing—original draft preparation, W.Y. S.Y.; writing—review and editing, J.Y; visualization, S.Y.; supervision, W.Y.; project administration, W.Y.; funding acquisition, J.Y. All authors have read and agreed to the published version of the manuscript.
Funding
This research was funded by the National Science and Technology Council, Taiwan under Grants: NSTC 114-2221-E-006-105 and NSTC 114-2221-E-017-009.
Institutional Review Board Statement
Not applicable.
Informed Consent Statement
Not applicable.
Conflicts of Interest
The authors declare no conflicts of interest.:
References
- Deng, J.; Shi, S.; Li, P.; Zhou, W.; Zhang, Y.; Li, H. Voxel r-cnn: Towards high performance voxel-based 3D object detection. In Proc. of AAAI Conference on Artificial Intelligence. 2021; 35(2), 1201–1209. [CrossRef]
- Qi, C.R.; Su, H.; Mo, K.; Guibas, L. J. Pointnet: Deep learning on point sets for 3D classification and segmentation. In Proc. of IEEE Conference on Computer Vision and Pattern Recognition. 2016; 652–660. arXiv preprint arXiv:1612.00593.
- Qi, C. R.; Yi, L.; Su, H.; Guibas, L. J. Pointnet++: Deep hierarchical feature learning on point sets in a metric space. In Proc. of Advances in Neural Information Processing Systems, Long Beach, CA, 2017, 30.
- Yang, Z; Sun, Y.; Liu, S.; Jia, J. 3dssd: Point-based 3d single stage object detector. IEEE/CVF Conference on Computer Vision and Pattern Recognition. 2020; 11040–11048. arXiv:2002.10187.
- Yan, Y.; Mao, Y.; Li, B. Second: Sparsely embedded convolutional detection. Sensors 2018, 18(10), 3337. [Google Scholar] [CrossRef] [PubMed]
- Graham, B.; Van der Maaten, L. Submanifold sparse convolutional networks. arXiv 2017, arXiv:1706.01307. [Google Scholar]
- Lang, A. H.; Vora, S.; Caesar, H.; Zhou, L.; Yang, J.; Beijbom, O. Pointpillars: Fast encoders for object detection from point clouds. In Proc. of IEEE/CVF Conference on Computer Vision and Pattern Recognition, 2019, 12697–12705.
- Hu, J. S.; Kuai, T.; Waslander, S. L. Point density-aware voxels for lidar 3d object detection. In Proc. of IEEE/CVF Conference on Computer Vision and Pattern Recognition, 2022, 8469–8478.
- Yu, G; Chang, Q.; Lv, W.; Xu, C.; Cui, C.; Ji, W.; et al. Pp-picodet: A better real-time object detector on mobile devices. arXiv 2021, arXiv:2111.00902. [Google Scholar]
- Wu, H.; Deng, J.; Wen, C.; Li, X.; Wang, C.; Li, J. Casa: A cascade attention network for 3-d object detection from lidar point clouds. IEEE Transactions on Geoscience and Remote Sensing 2022, 60, 1–11. [Google Scholar] [CrossRef]
- Qiao, S.; Chen, L. C.; Yuille, A. Detectors: Detecting objects with recursive feature pyramid and switchable atrous convolution. In Proc. of IEEE/CVF Conference on Computer Vision and Pattern Recognition, 2021; pp. 10213–10224. [Google Scholar]
- Muhammad, S.; Kim, G. Dynamic multi-LiDAR based multiple object detection and tracking. Sensors 2019, 19. [Google Scholar] [CrossRef]
- Gómez, J.; Aycard, O.; Baber, J. Efficient detection and tracking of human using 3D LiDAR sensor. Sensors 2023, 23(no. 10), 4720. [Google Scholar] [CrossRef] [PubMed]
- Dosovitskiy, A.; Beyer, L.; Kolesnikov, A.; Weissenborn, D.; Zhai, X.; Unterthiner, T.; Dehghani, M.; Minderer, M.; Heigold, G.; Gelly, S.; Uszkoreit, J.; Houlsby, N. An image is worth 16x16 words: Transformers for image recognition at scale. arXiv 2020, arXiv:2010.11929. [Google Scholar]
- Vaswani, A.; Shazeer, N.; Parmar, N.; Uszkoreit, J.; Jones, L.; Gomez, A. N.; Kaiser, L.; Polosukhin, I. Attention is all you need. In Advances in Neural Information Processing Systems, 2017; 30. [Google Scholar]
- The KITTI Vision Benchmark Suite, https://www.cvlibs.net/datasets/kitti/eval_3dobject.php.
- Kingma, D. P.; Ba, J. Adam: A method for stochastic optimization. arXiv 2014, arXiv:1412.6980. [Google Scholar]
- Simonelli, A.; Bulo, S. R.; Porzi, L.; Lopez-Antequera, M.; Kontschieder, P. Disentangling monocular 3d object detection. In Proc. of IEEE/CVF International Conference on Computer Vision. 2019;1991–1999.
- GitHub. OpenPCDet. 2023; https://github.com/open-mmlab/OpenPCDet (accessed Jun. 26, 2023).
- Cai, X.; Lai, Q.; Pei, G.; Shu, X.; Yao, Y.; Wang, W. Cycle-consistent learning for joint layout-to-image generation and object detection, in Proc. of the IEEE/CVF International Conference on Computer Vision (ICCV). 2025; 6797-6807.
- Yin, J.; Shen, J.; Chen, R.; Li, W.; Yang, R.; Frossard, P.; Wang, W. IS-Fusion: Instance-scene collaborative fusion for multimodal 3D object detection. In Proc. of the IEEE/CVF Conference on Computer Vision and Pattern Recognition (CVPR). 2024; 14905-14915.
- Bai, X.; Hu, Z.; Zhu, X.; Huang, Q.; Chen, Y.; Fu, H.; Tai, C.L. Transfusion: Robust lidar-camera fusion for 3d object detection with transformers. In Proc. of the IEEE/CVF Conference on Computer Vision and Pattern Recognition (CVPR), 2022; 1090=1099.
Figure 1.
The sampled 3D dataset: (a) RGB image; (b) point clouds with 3D ground truth labelled.
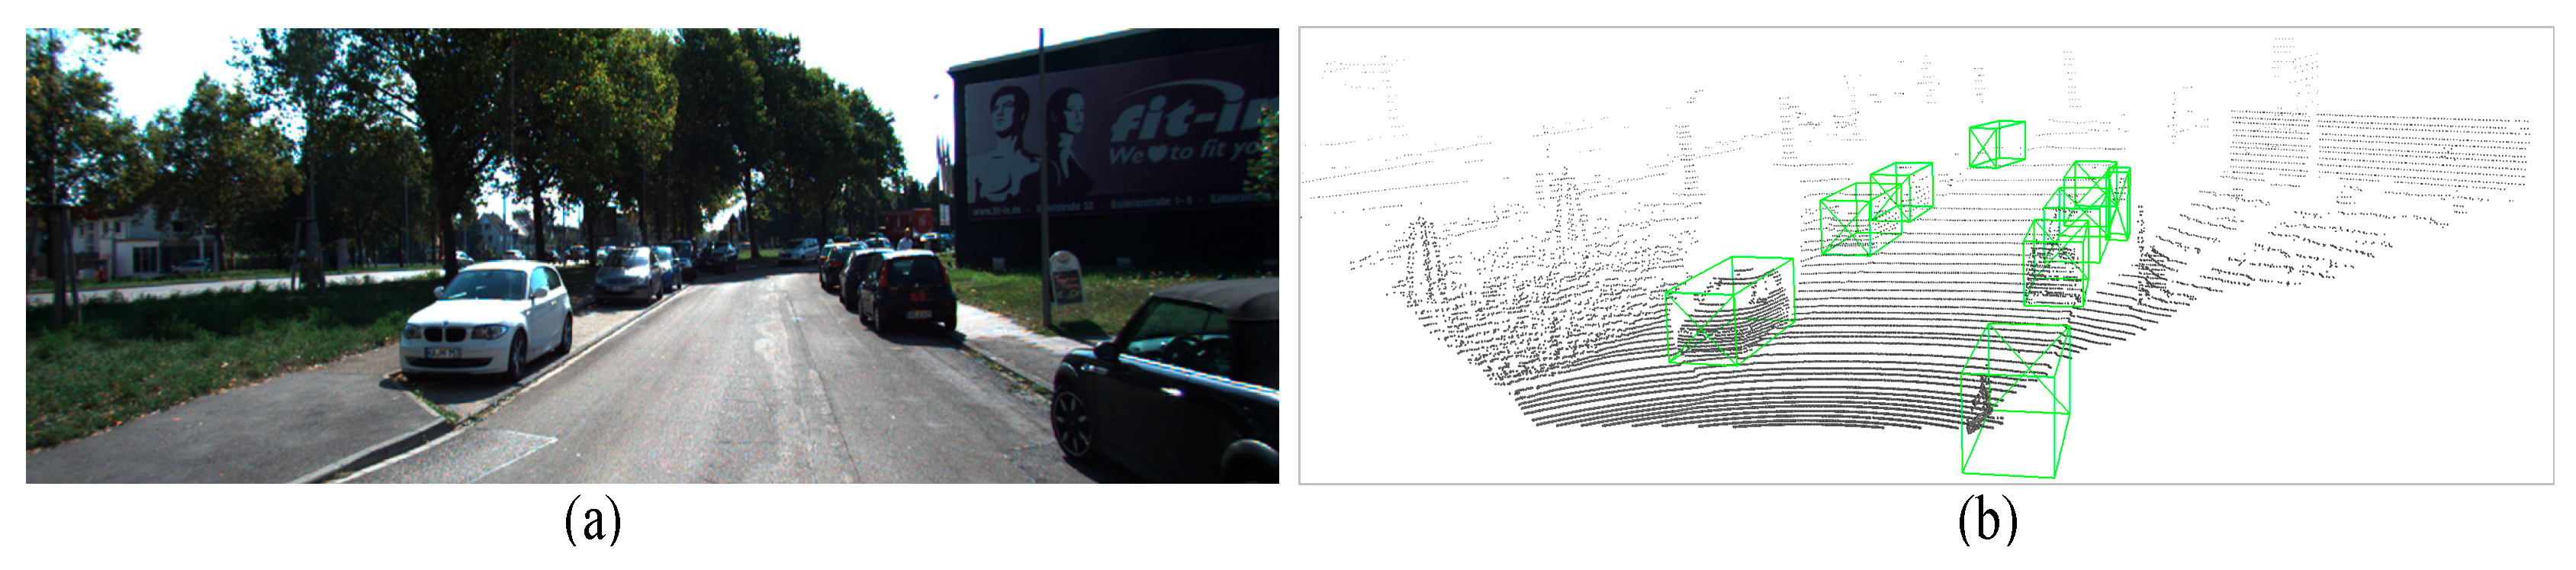
Figure 2.
Flow chart of the proposed 3D object detector.
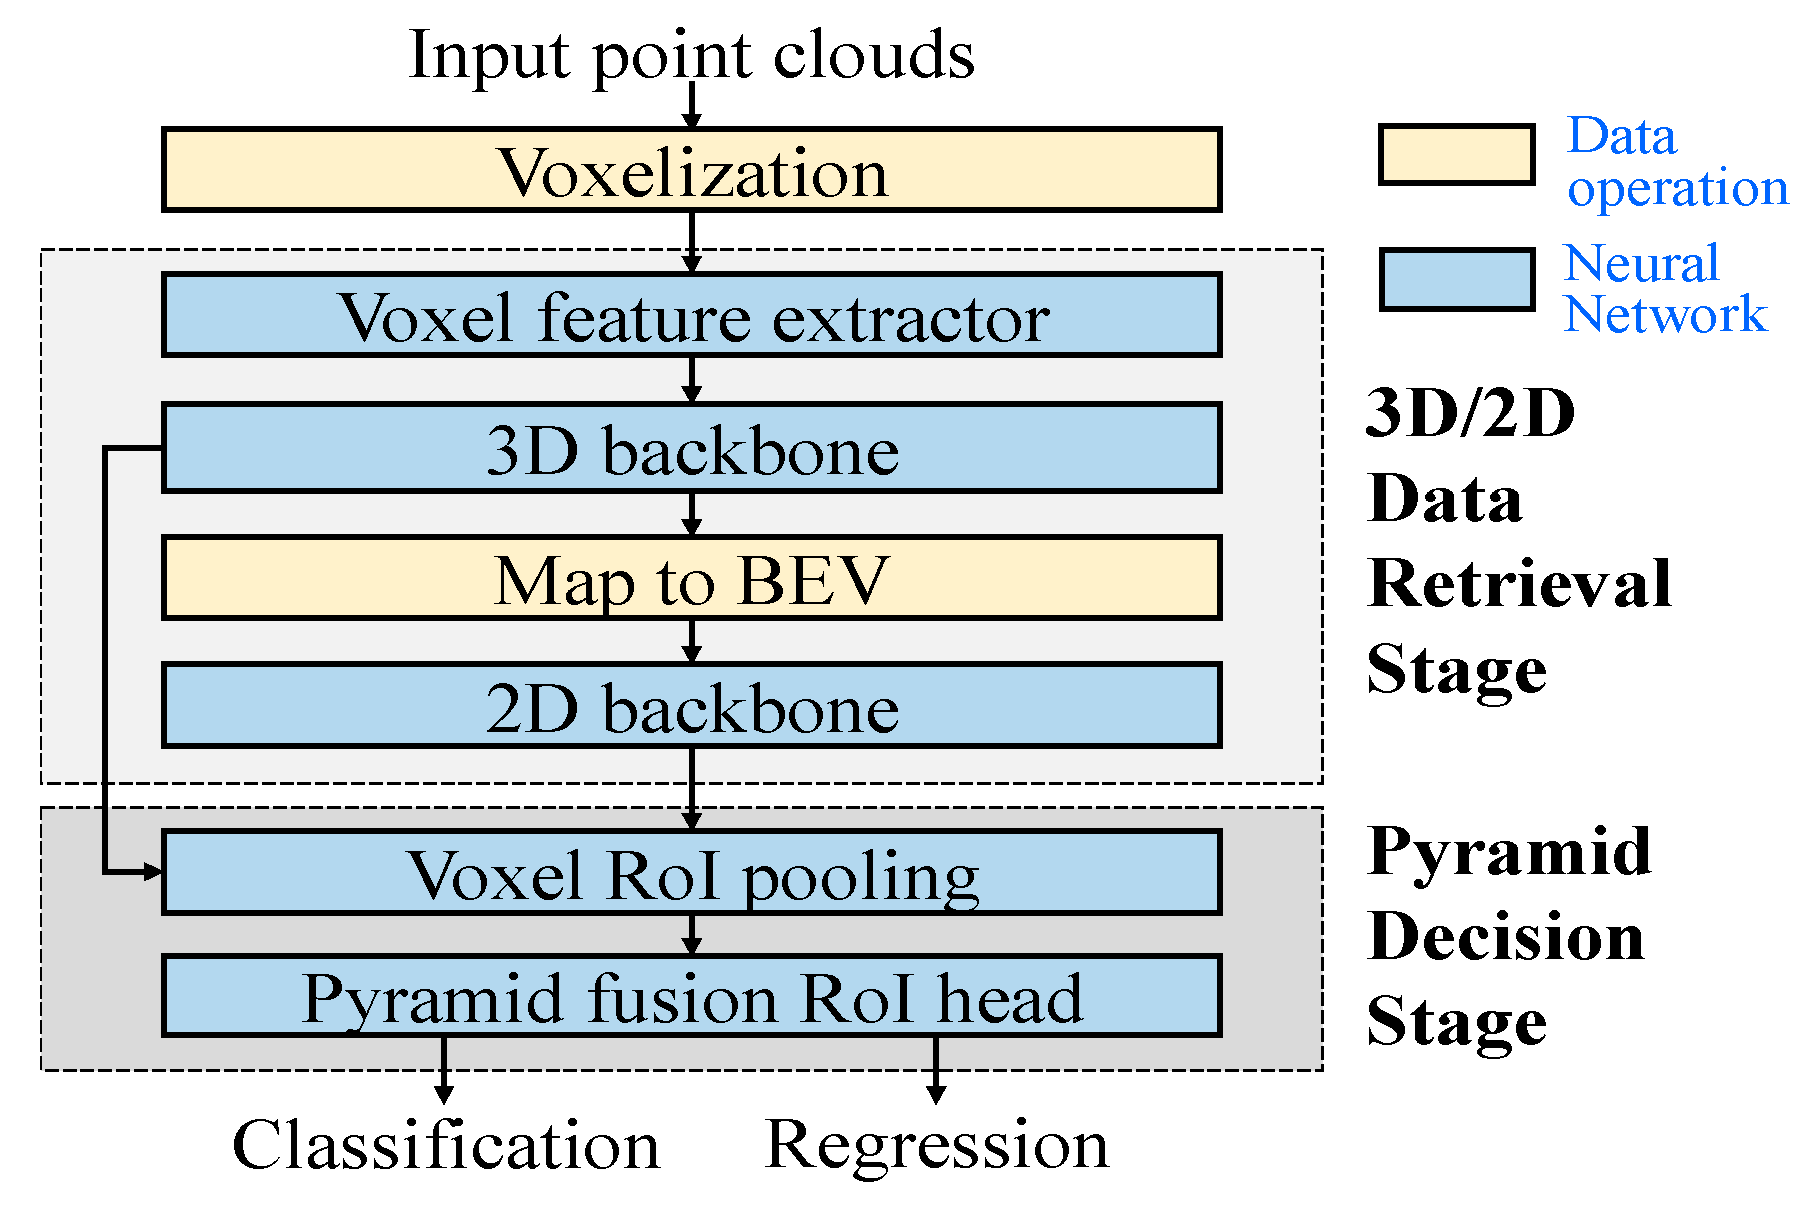
Figure 3.
Structure of the proposed 3D object detection network.
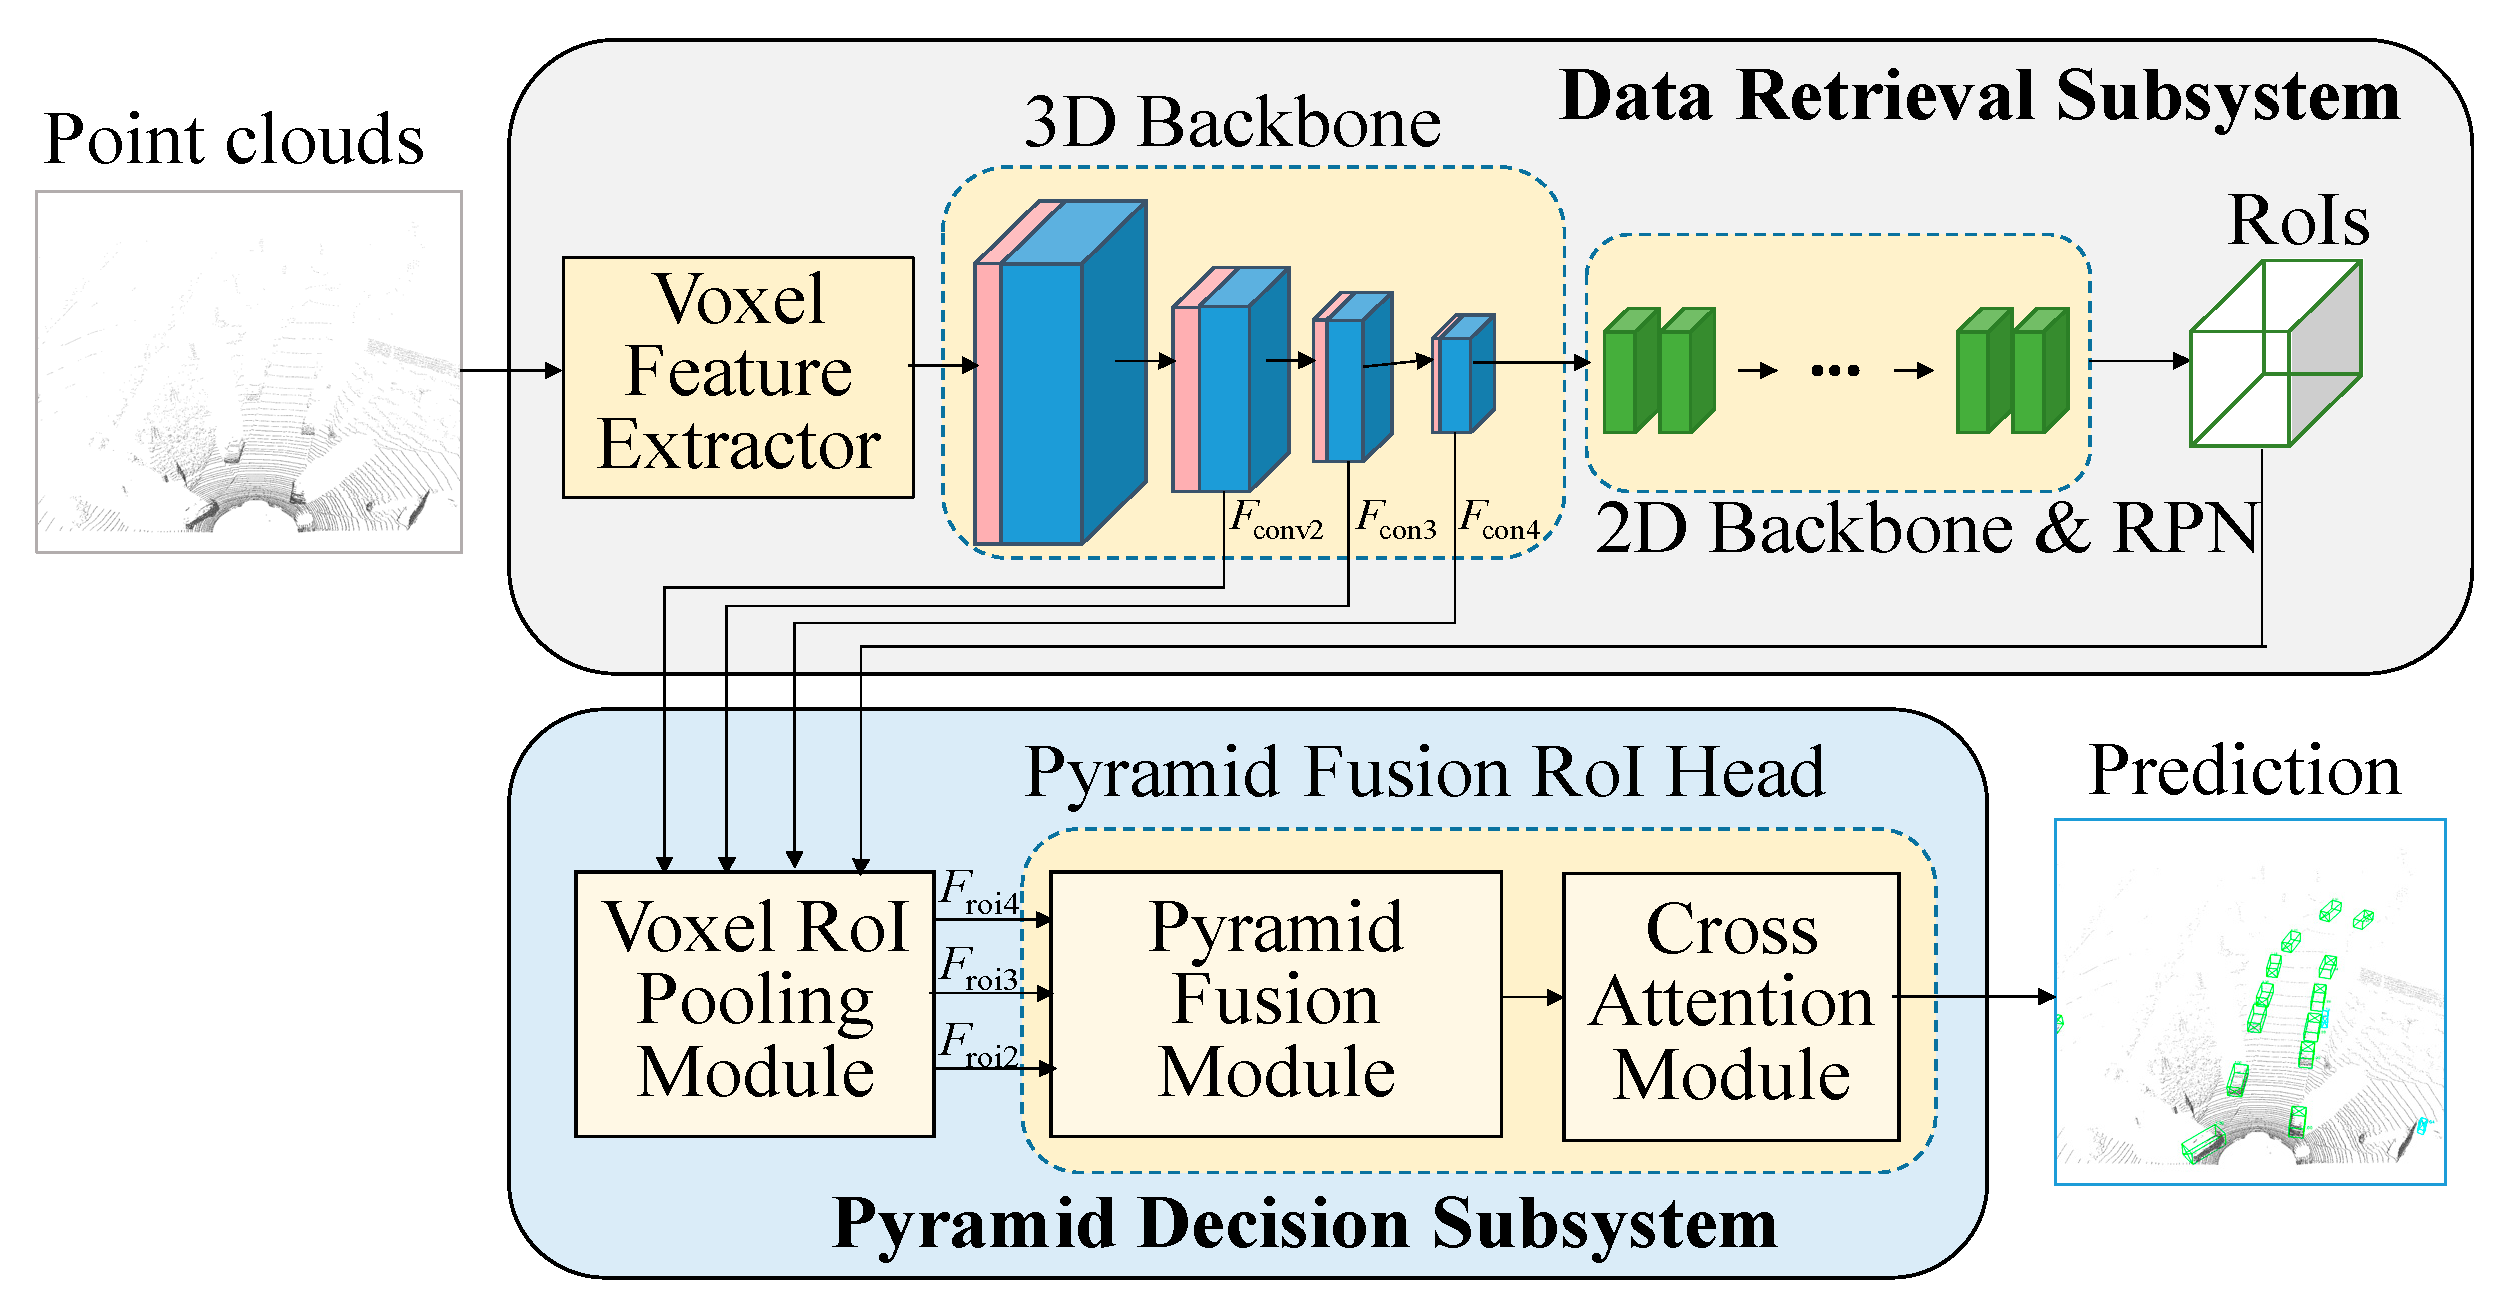
Figure 4.
Detailed architecture of the voxel feature extractor (VFE) module.
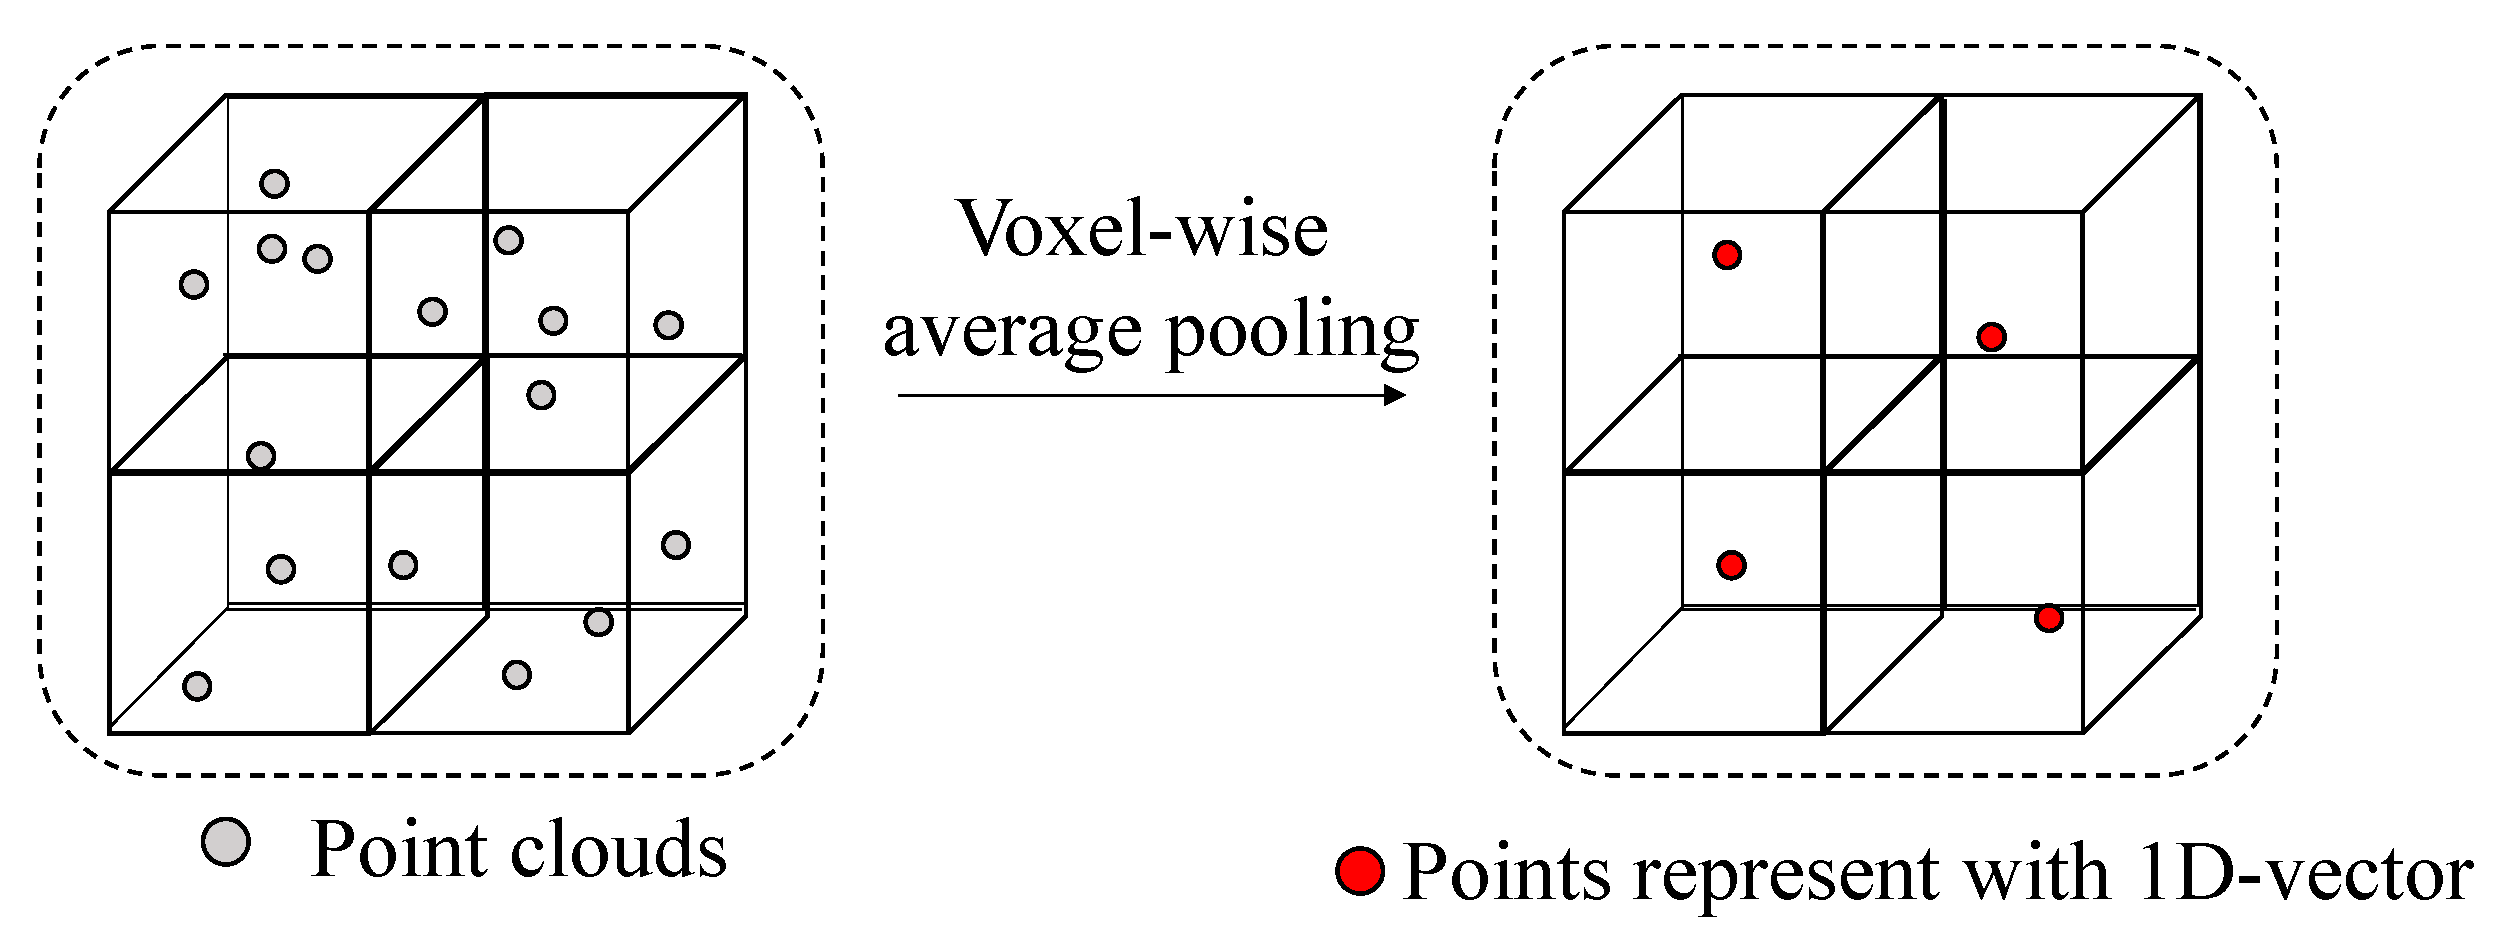
Figure 5.
Detailed architecture of the 3D backbone network.
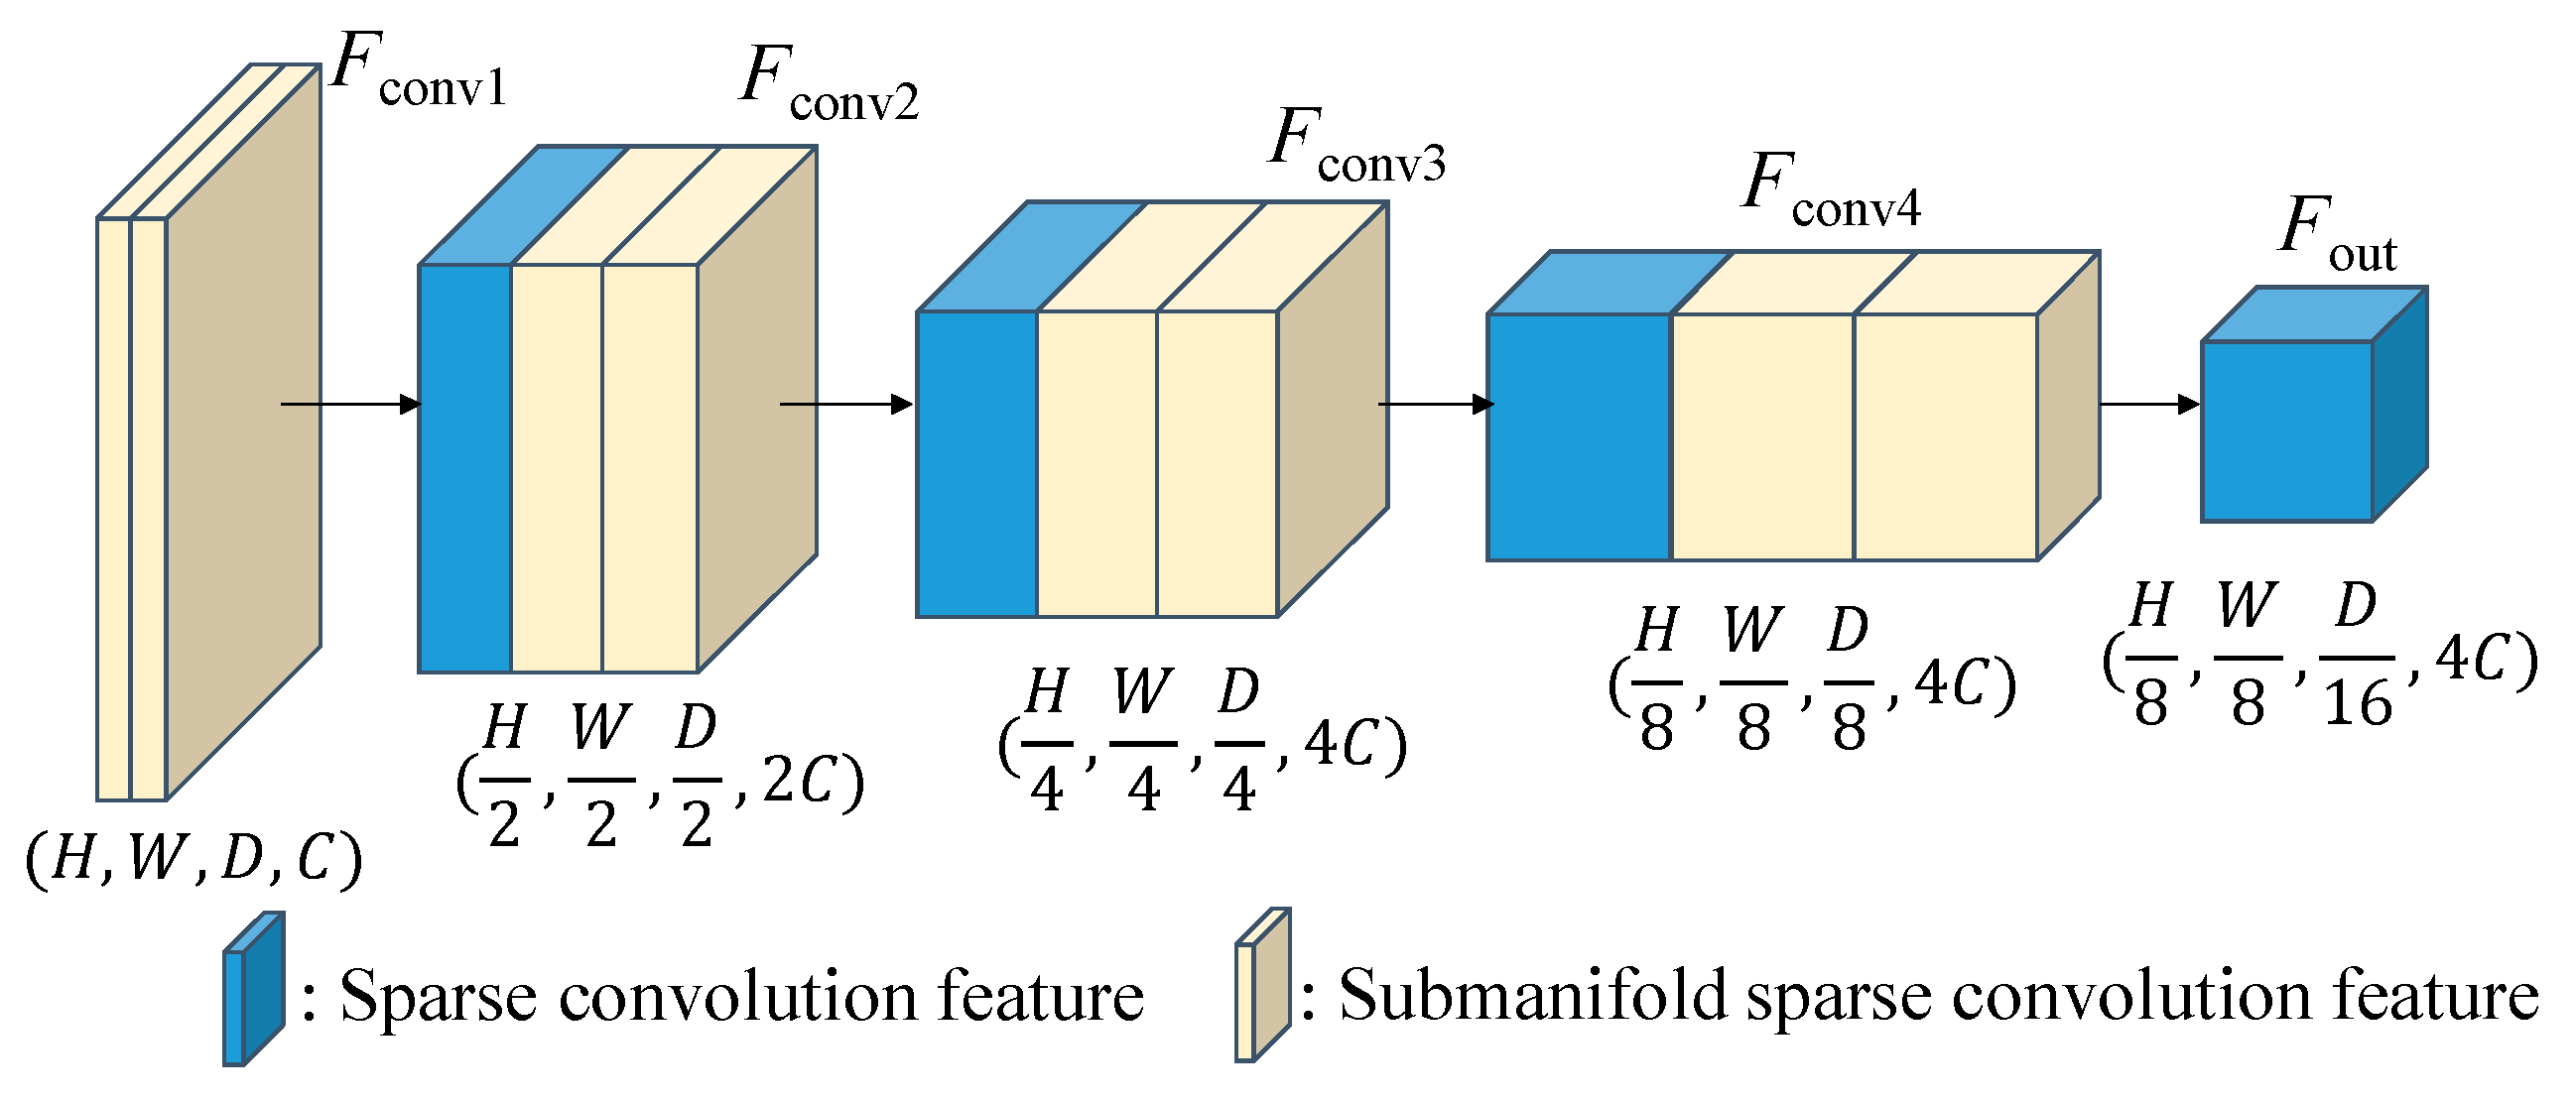
Figure 6.
Detailed architecture of the 2D backbone and RPN network.
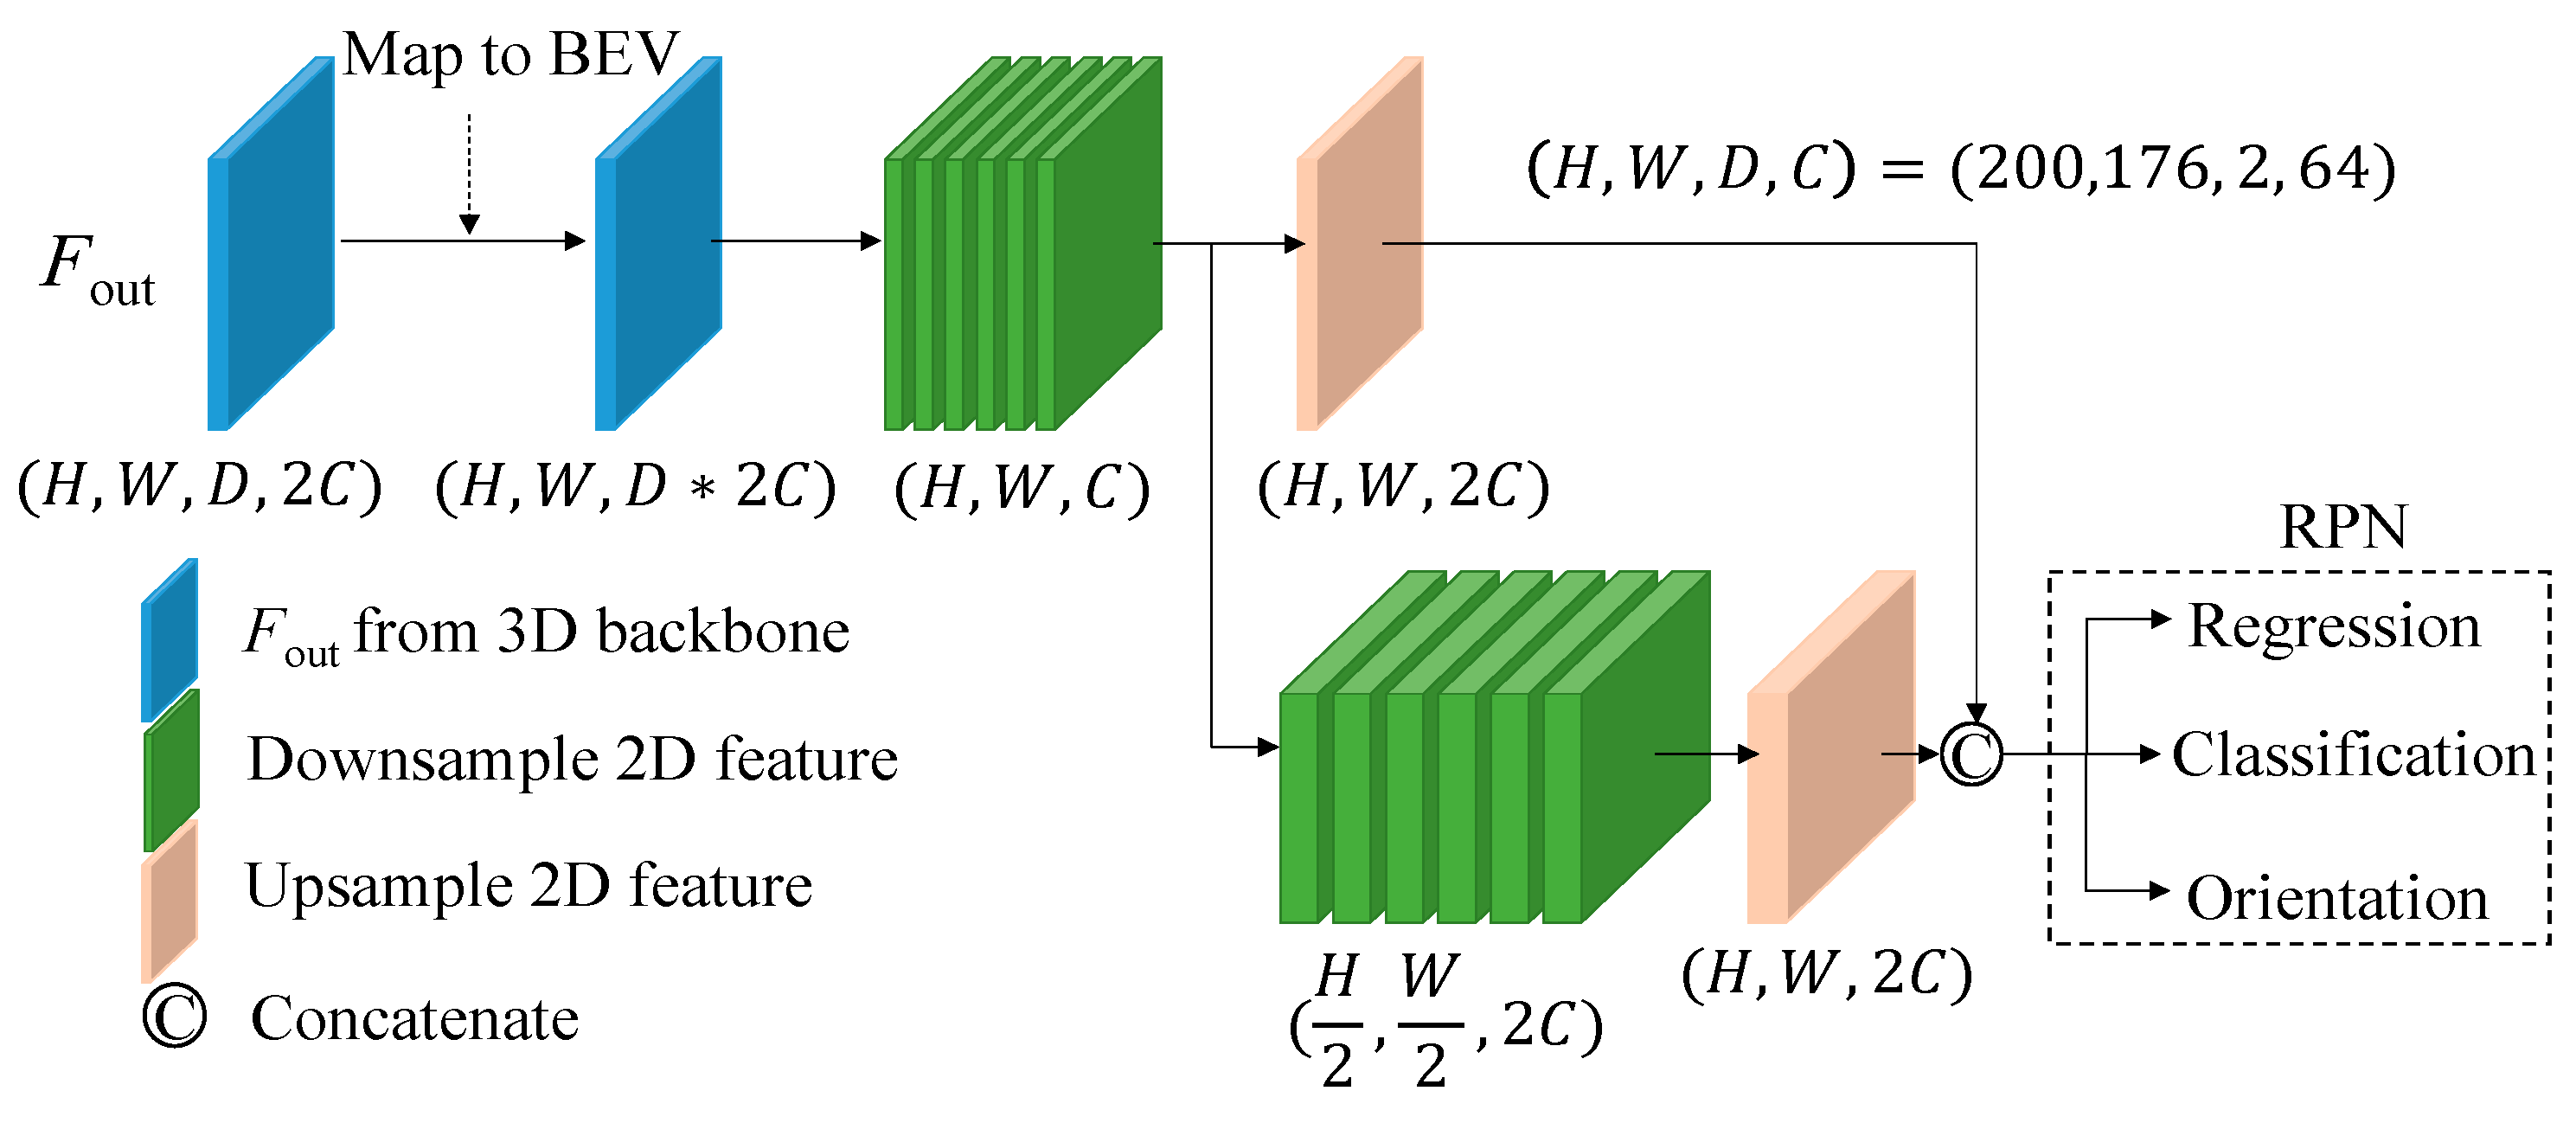
Figure 7.
Detailed architecture of the pyramid fusion RoI head.
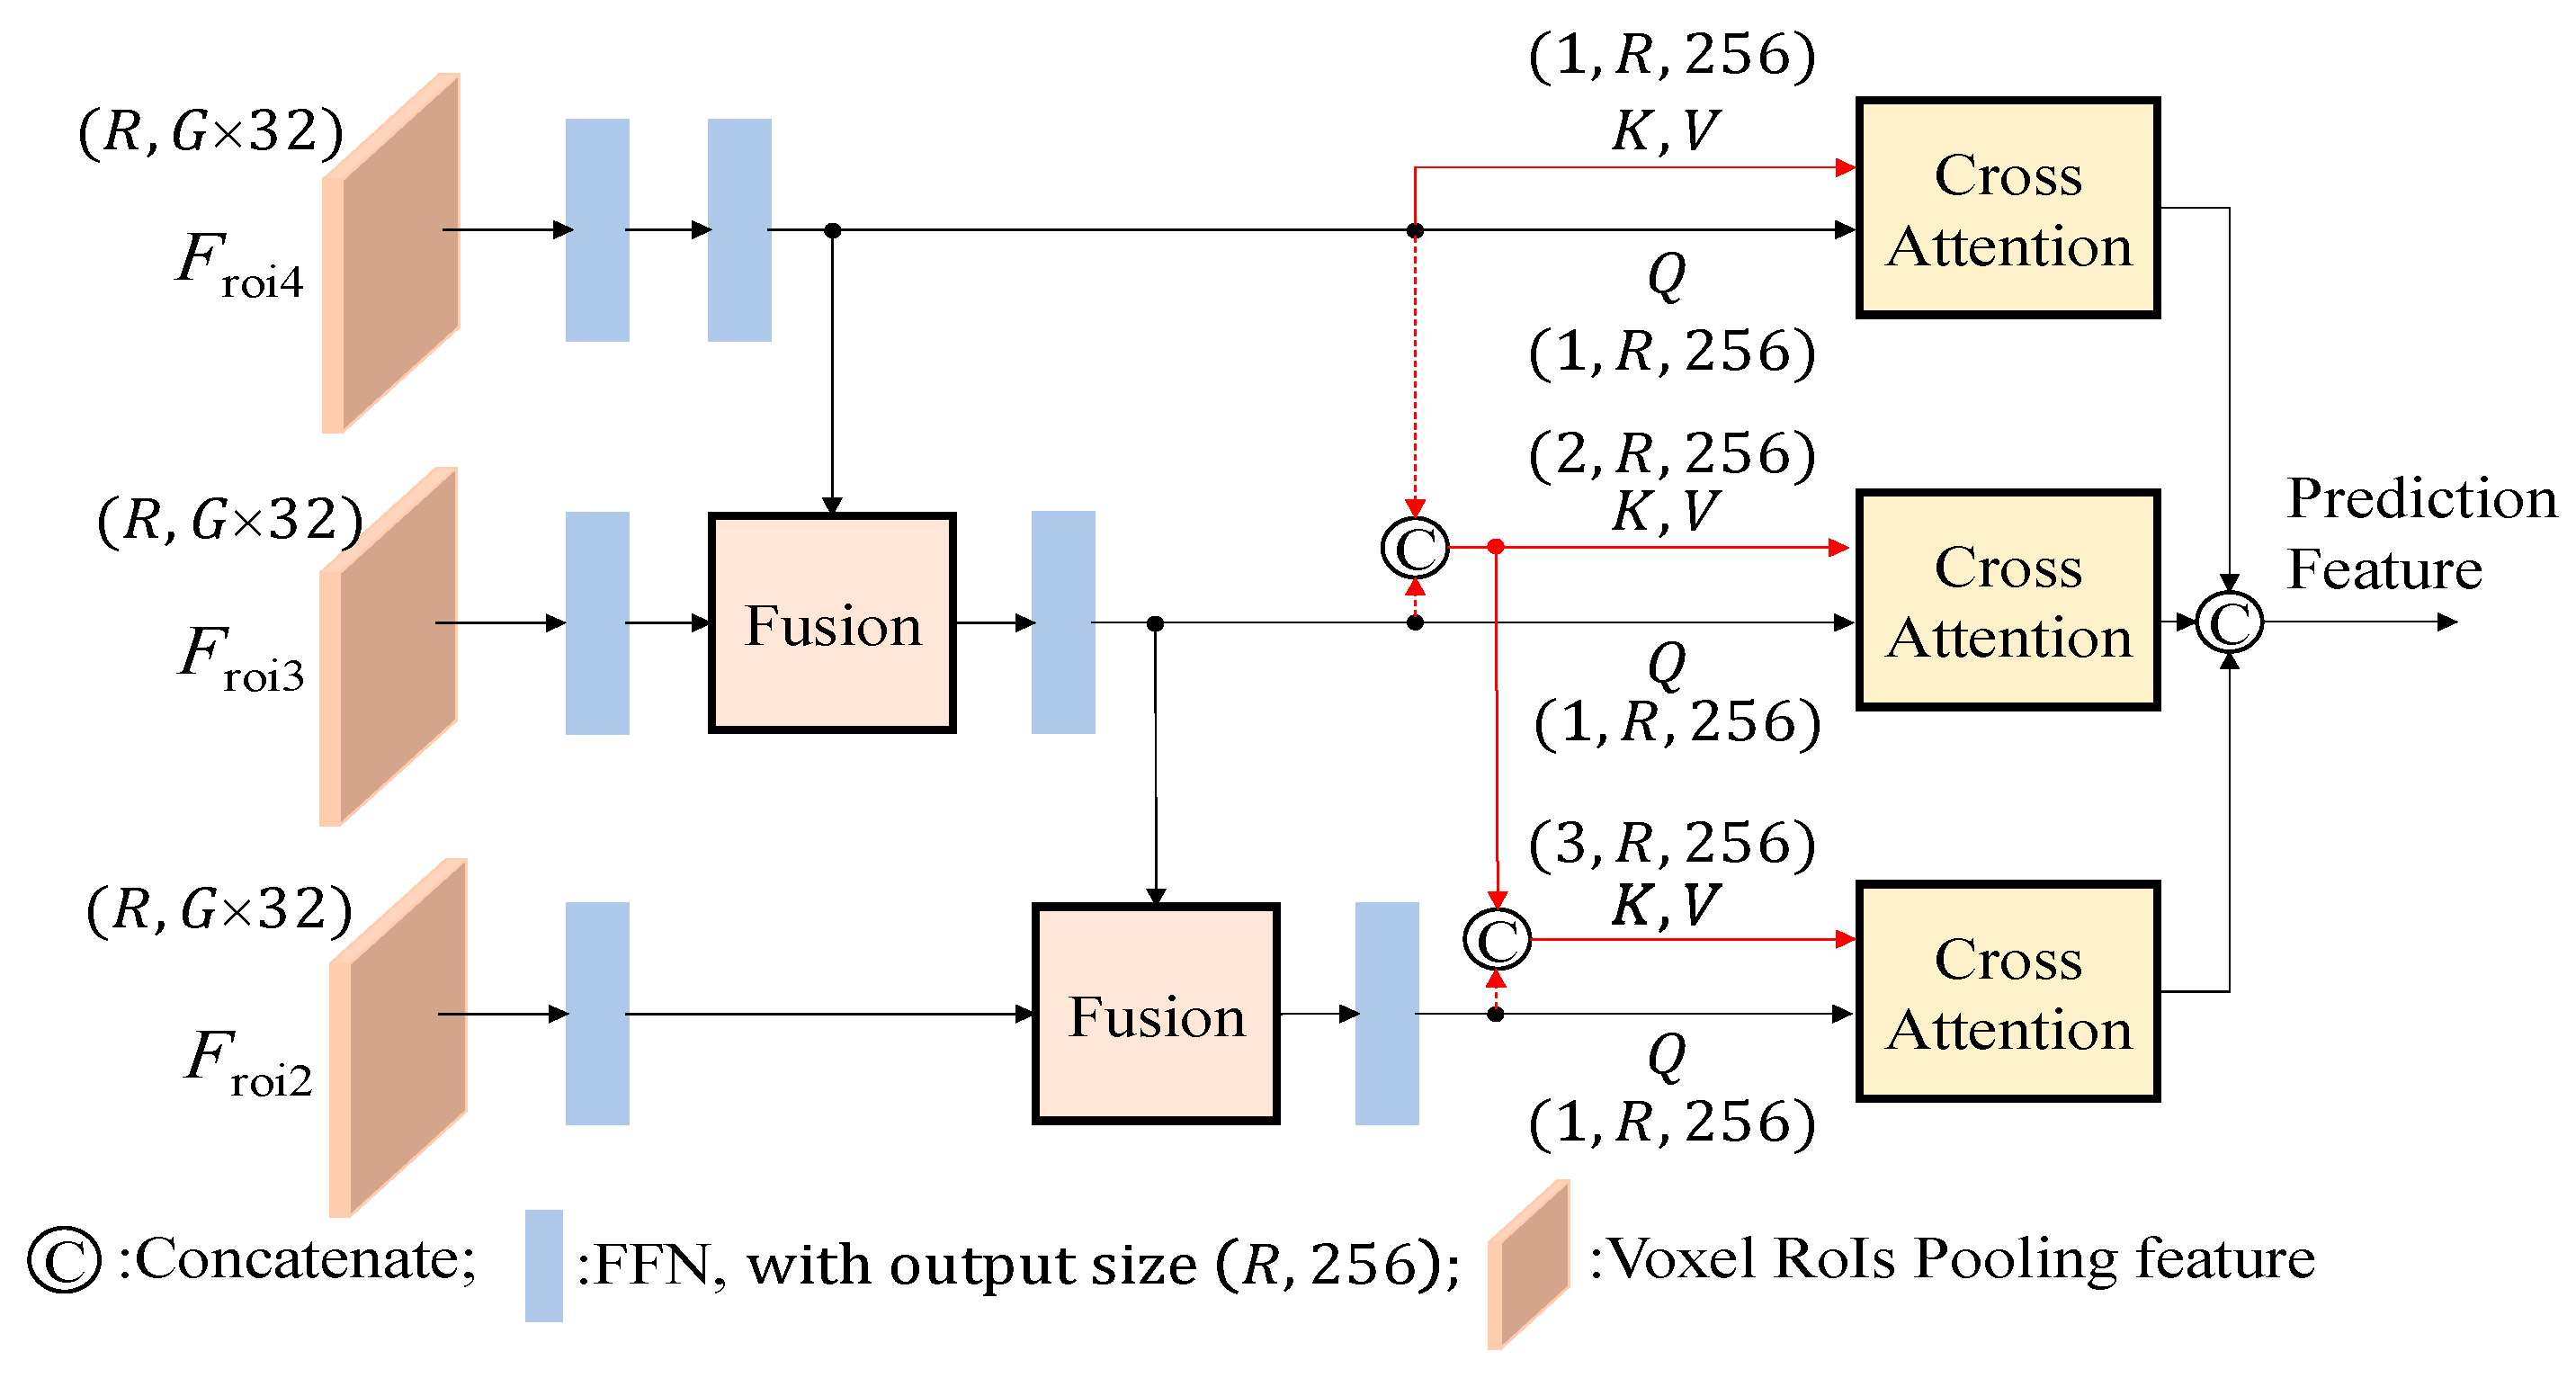
Figure 8.
Detailed architecture of the fusion module.
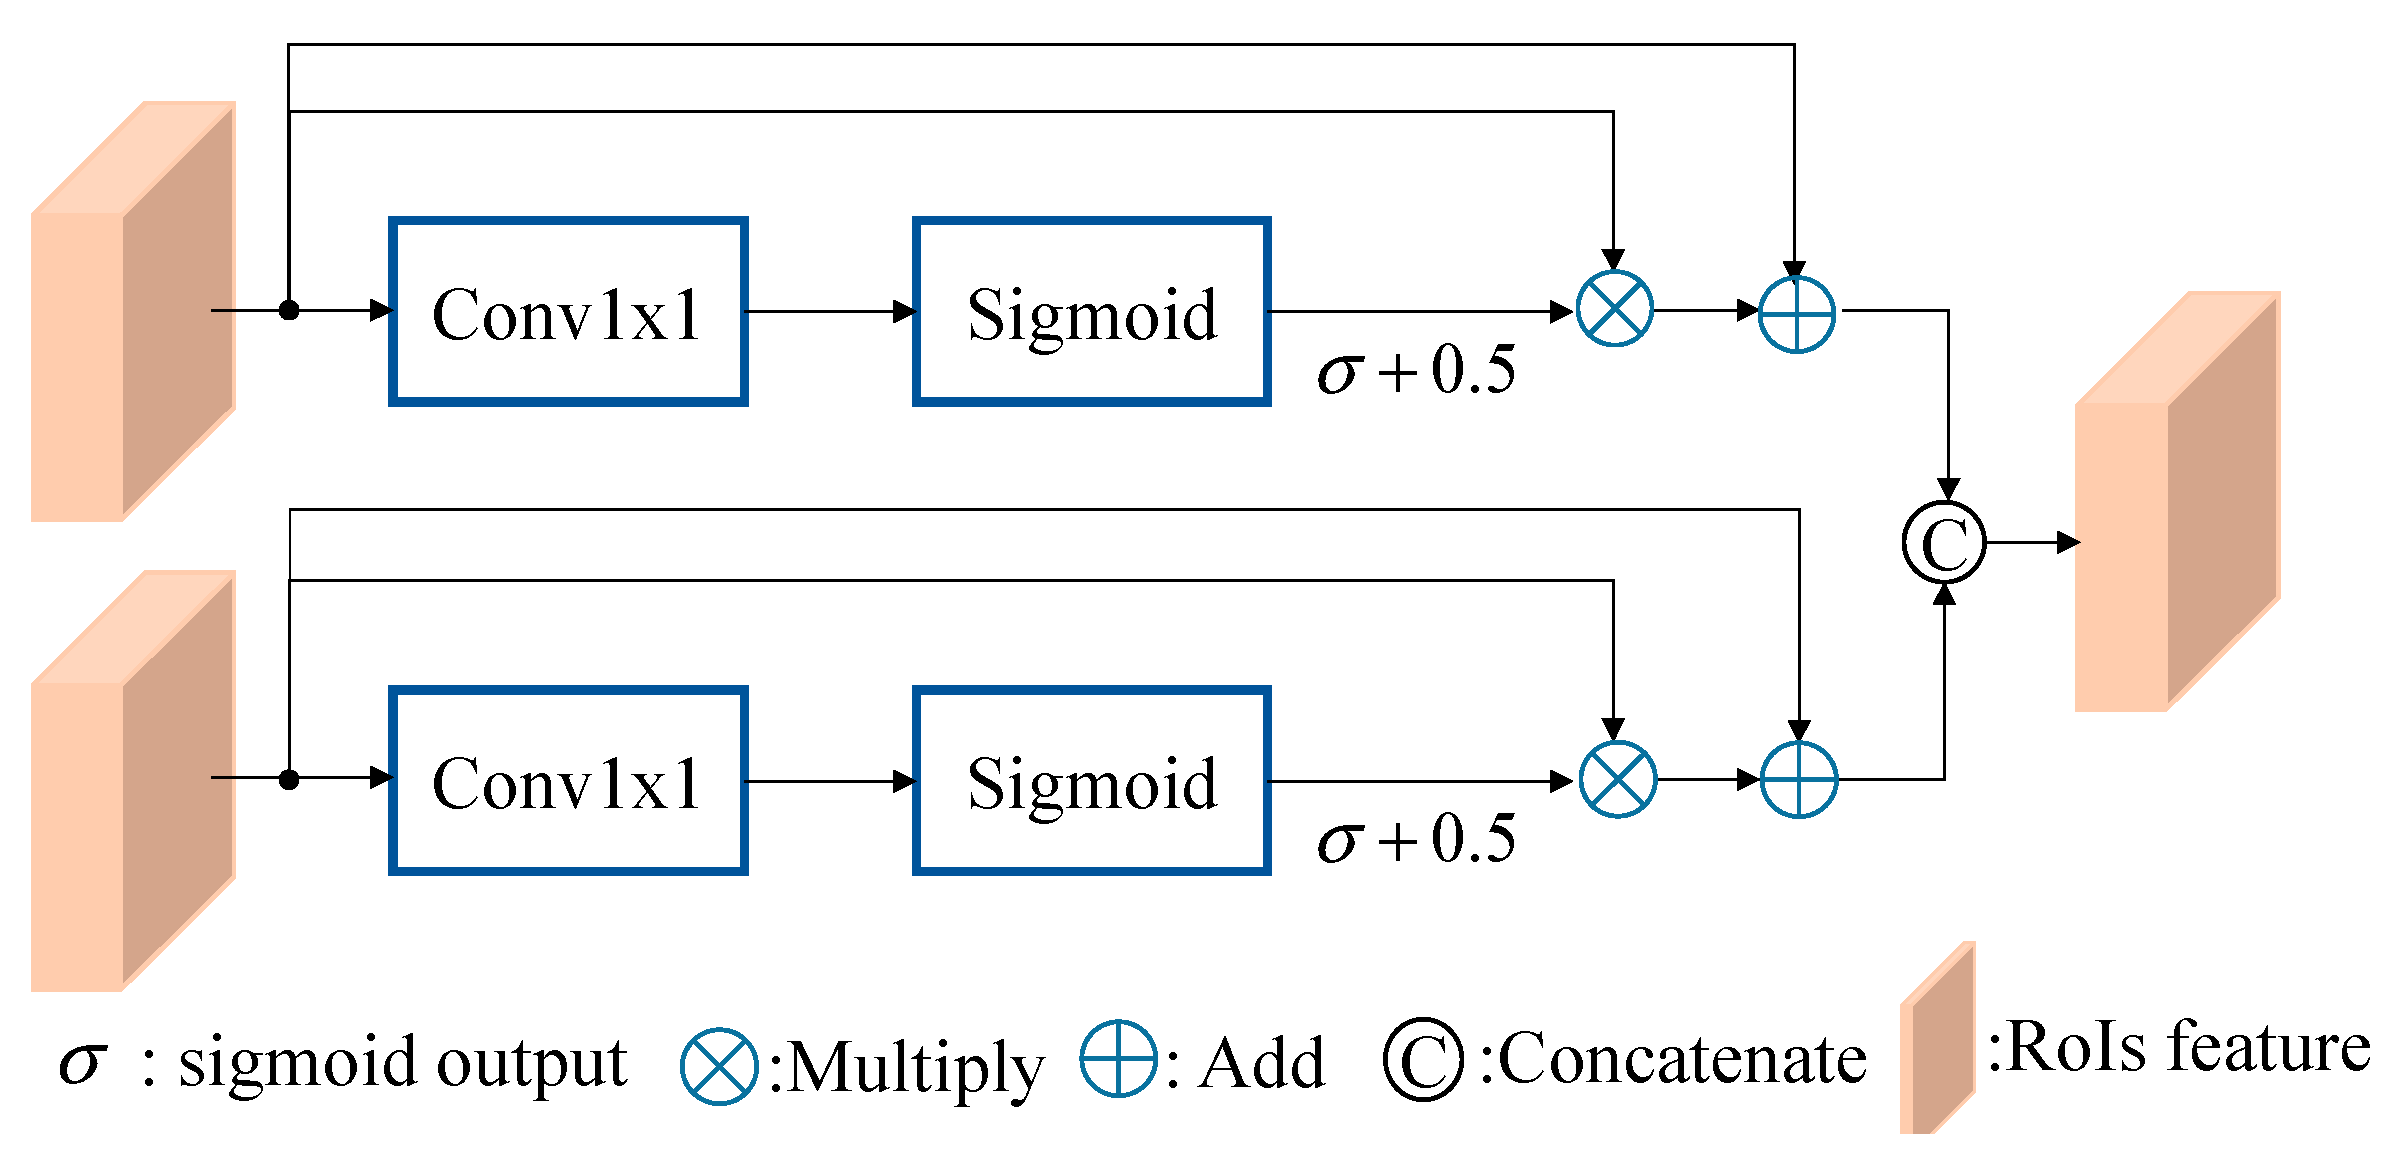
Figure 9.
Illustration of cross-attention module with i multi-head attention.
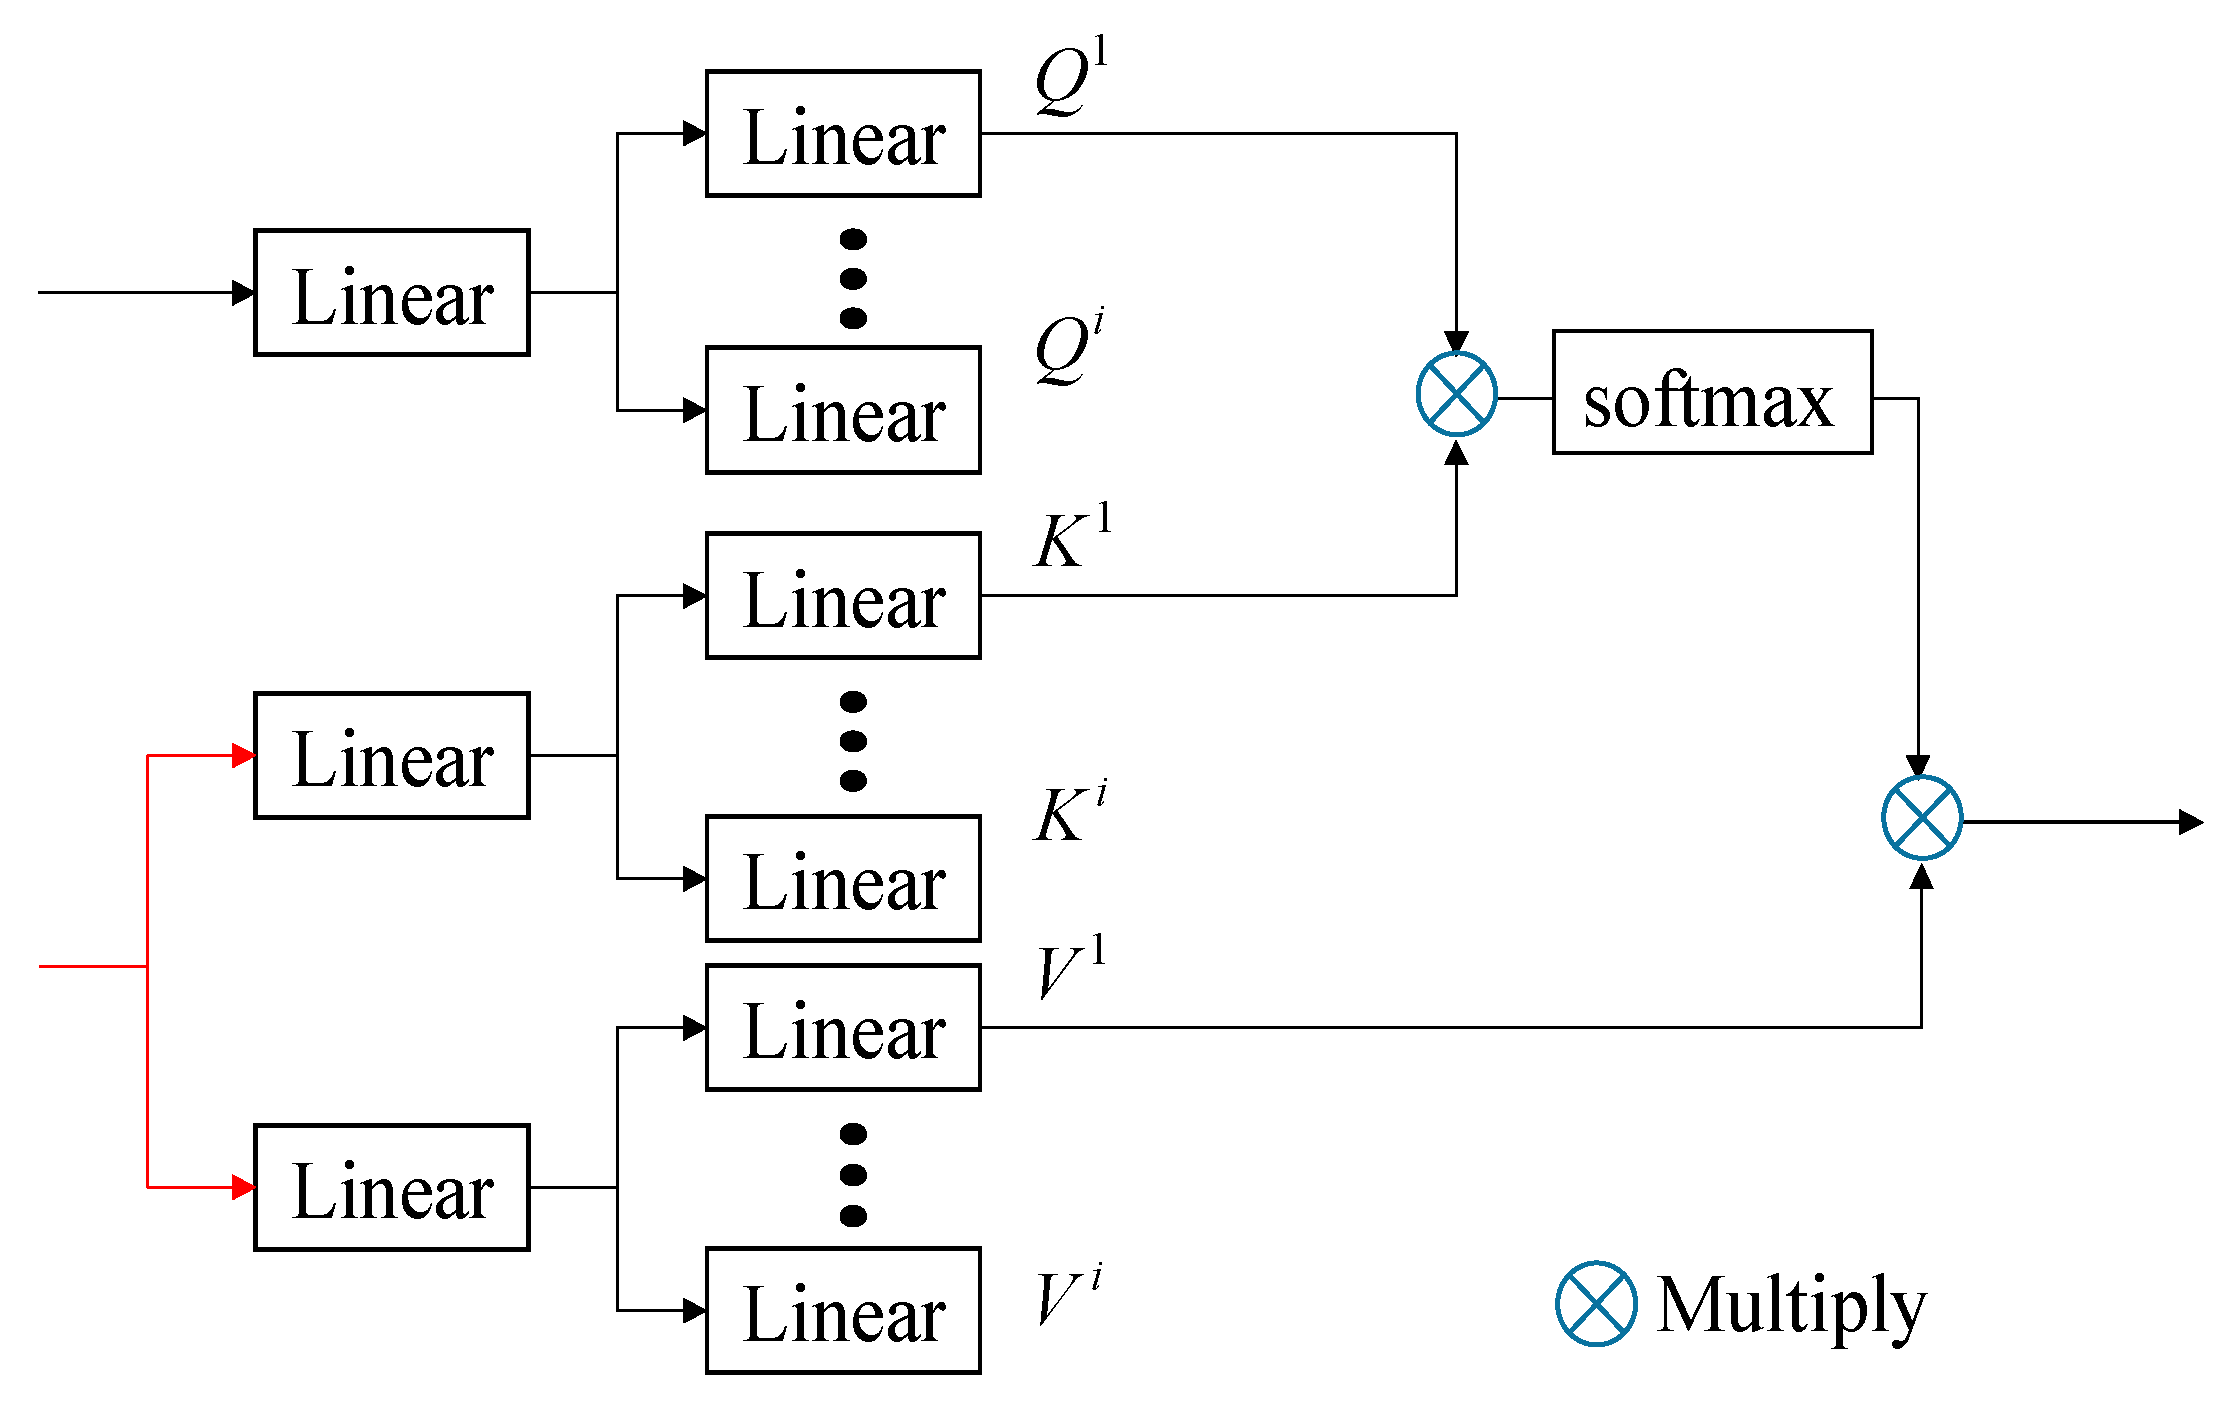
Figure 10.
Illustration of original point cloud scene: (a) with ground truth labelled. (b) after the gt_sampling data augmentation.
Figure 10.
Illustration of original point cloud scene: (a) with ground truth labelled. (b) after the gt_sampling data augmentation.
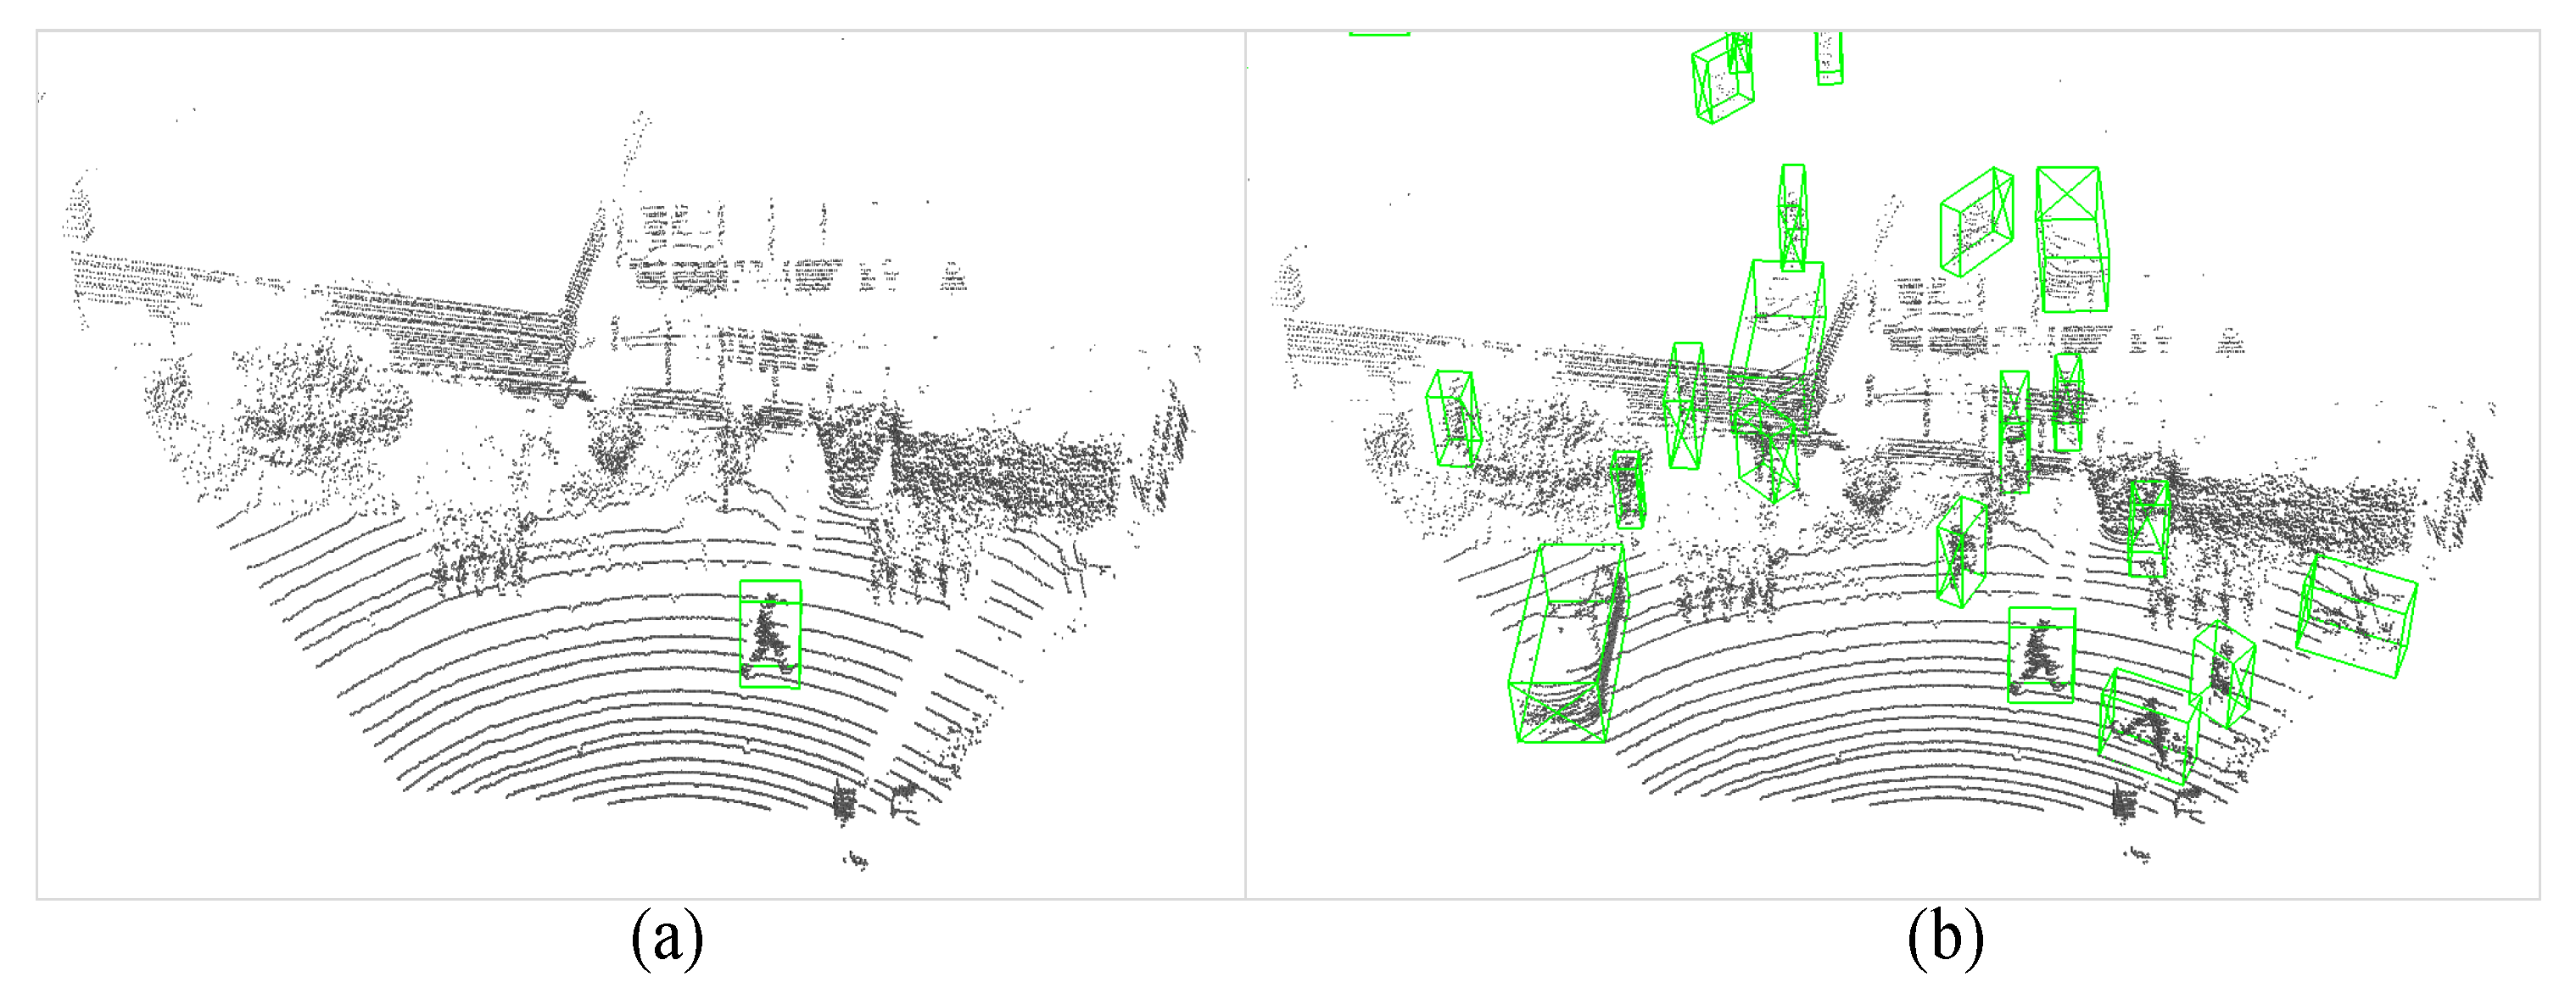
Figure 11.
Illustration of improvement for gt_sampling: (a) sampled ground truth from other scenes but colliding with building. (b) rotation and displacement of the sample ground truth for correct data augmentation.
Figure 11.
Illustration of improvement for gt_sampling: (a) sampled ground truth from other scenes but colliding with building. (b) rotation and displacement of the sample ground truth for correct data augmentation.
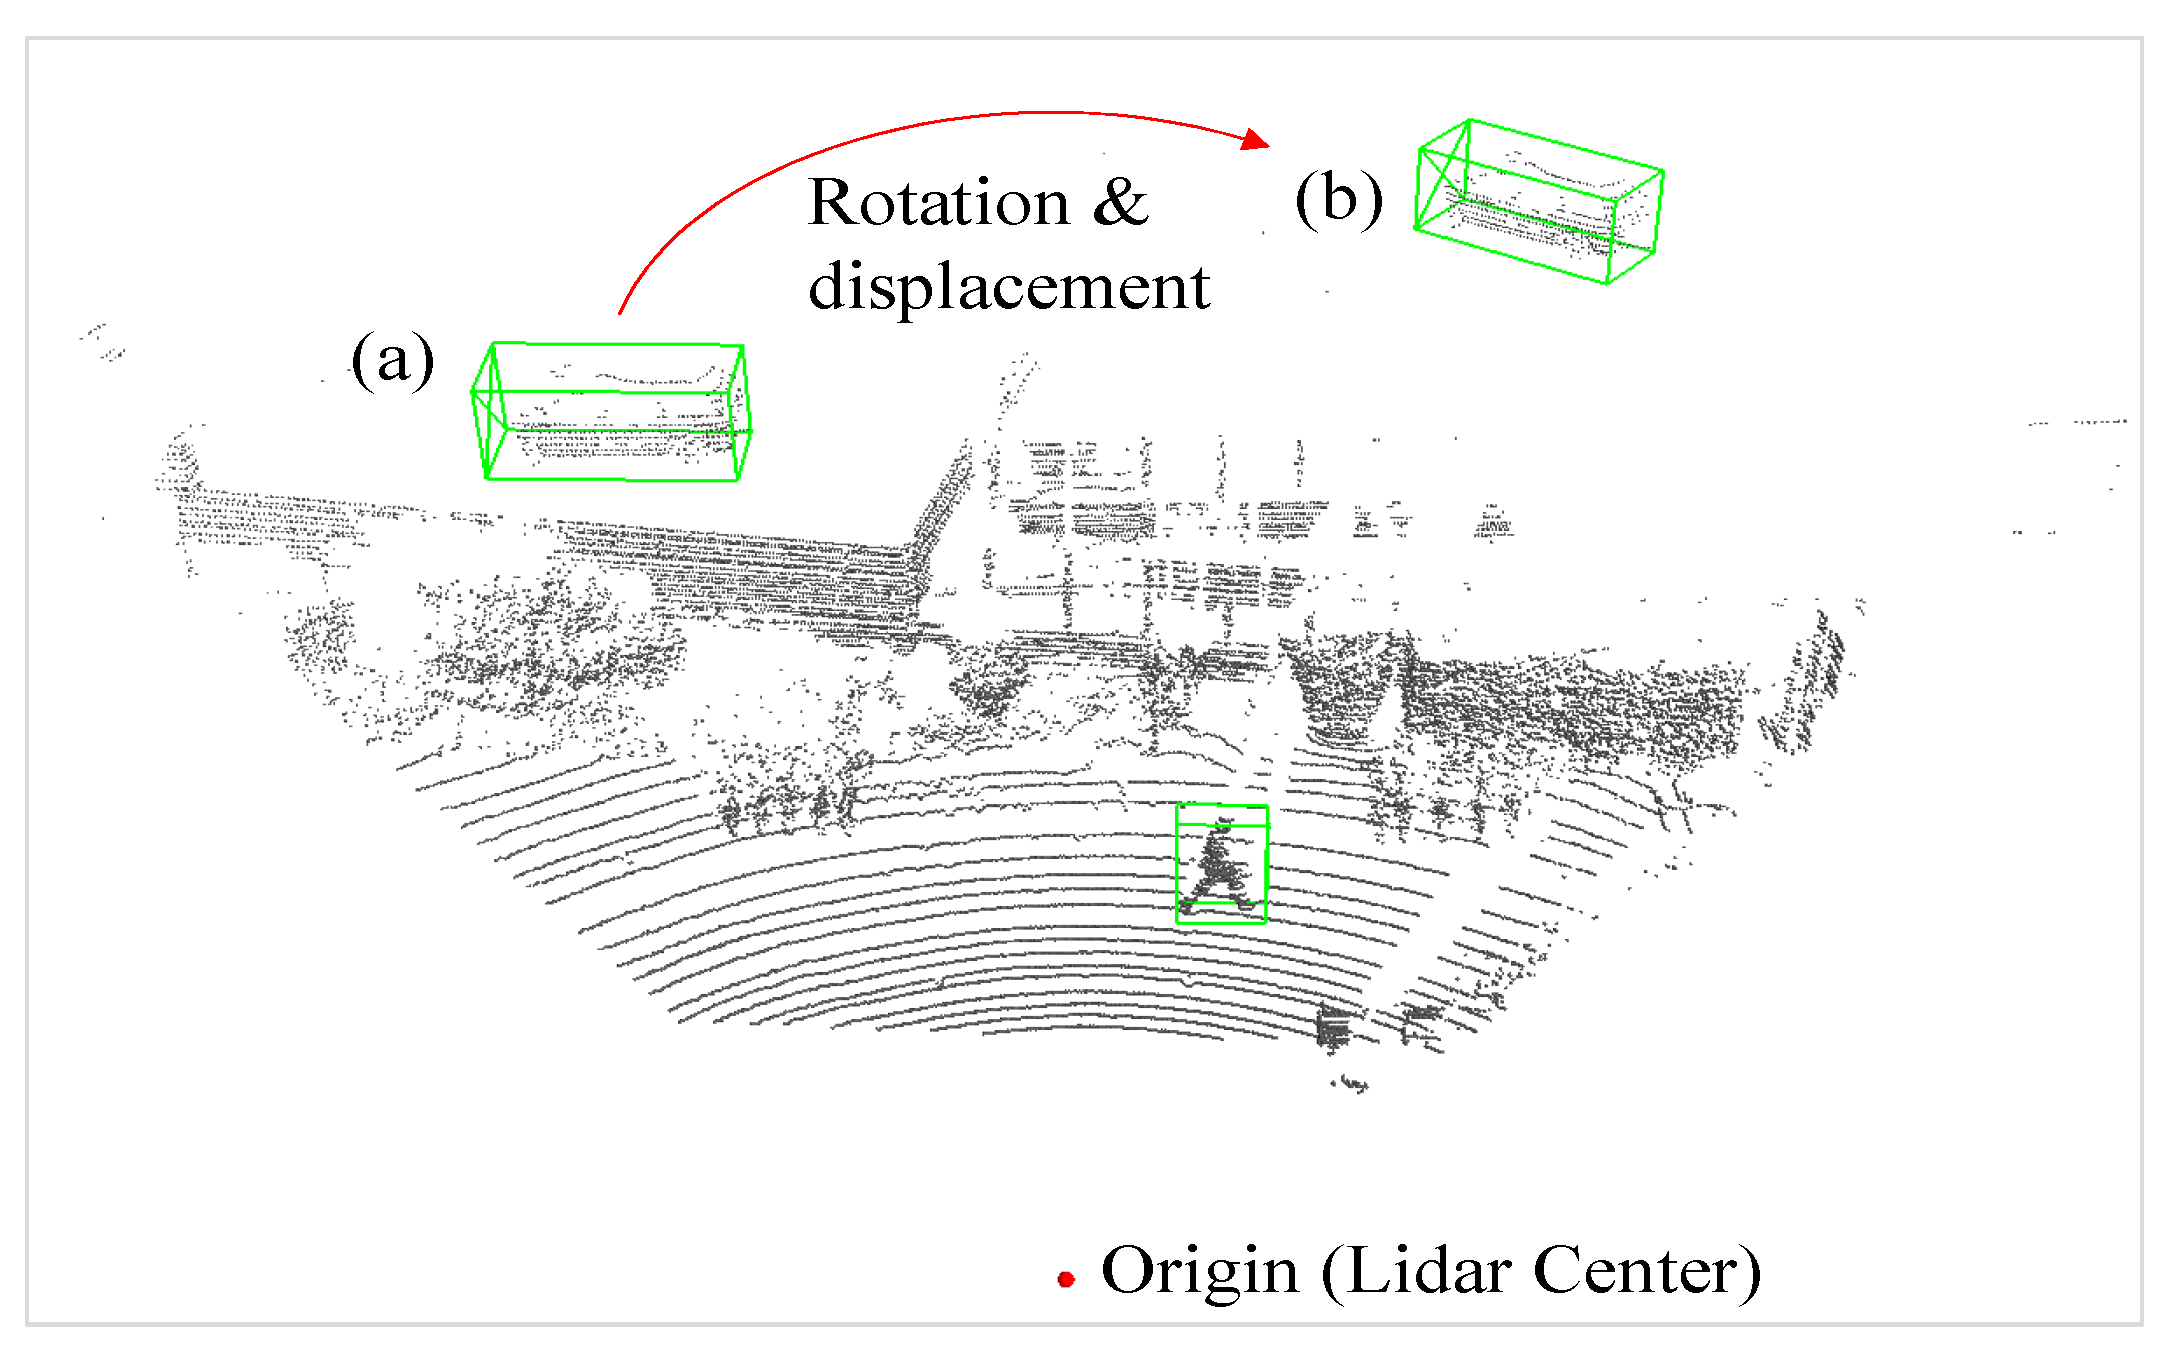
Figure 12.
Illustration of distance decay mechanism in our angle-tuned augmentation: (a) original object density; (b) augmented object after point dropout based on radial distance.
Figure 12.
Illustration of distance decay mechanism in our angle-tuned augmentation: (a) original object density; (b) augmented object after point dropout based on radial distance.
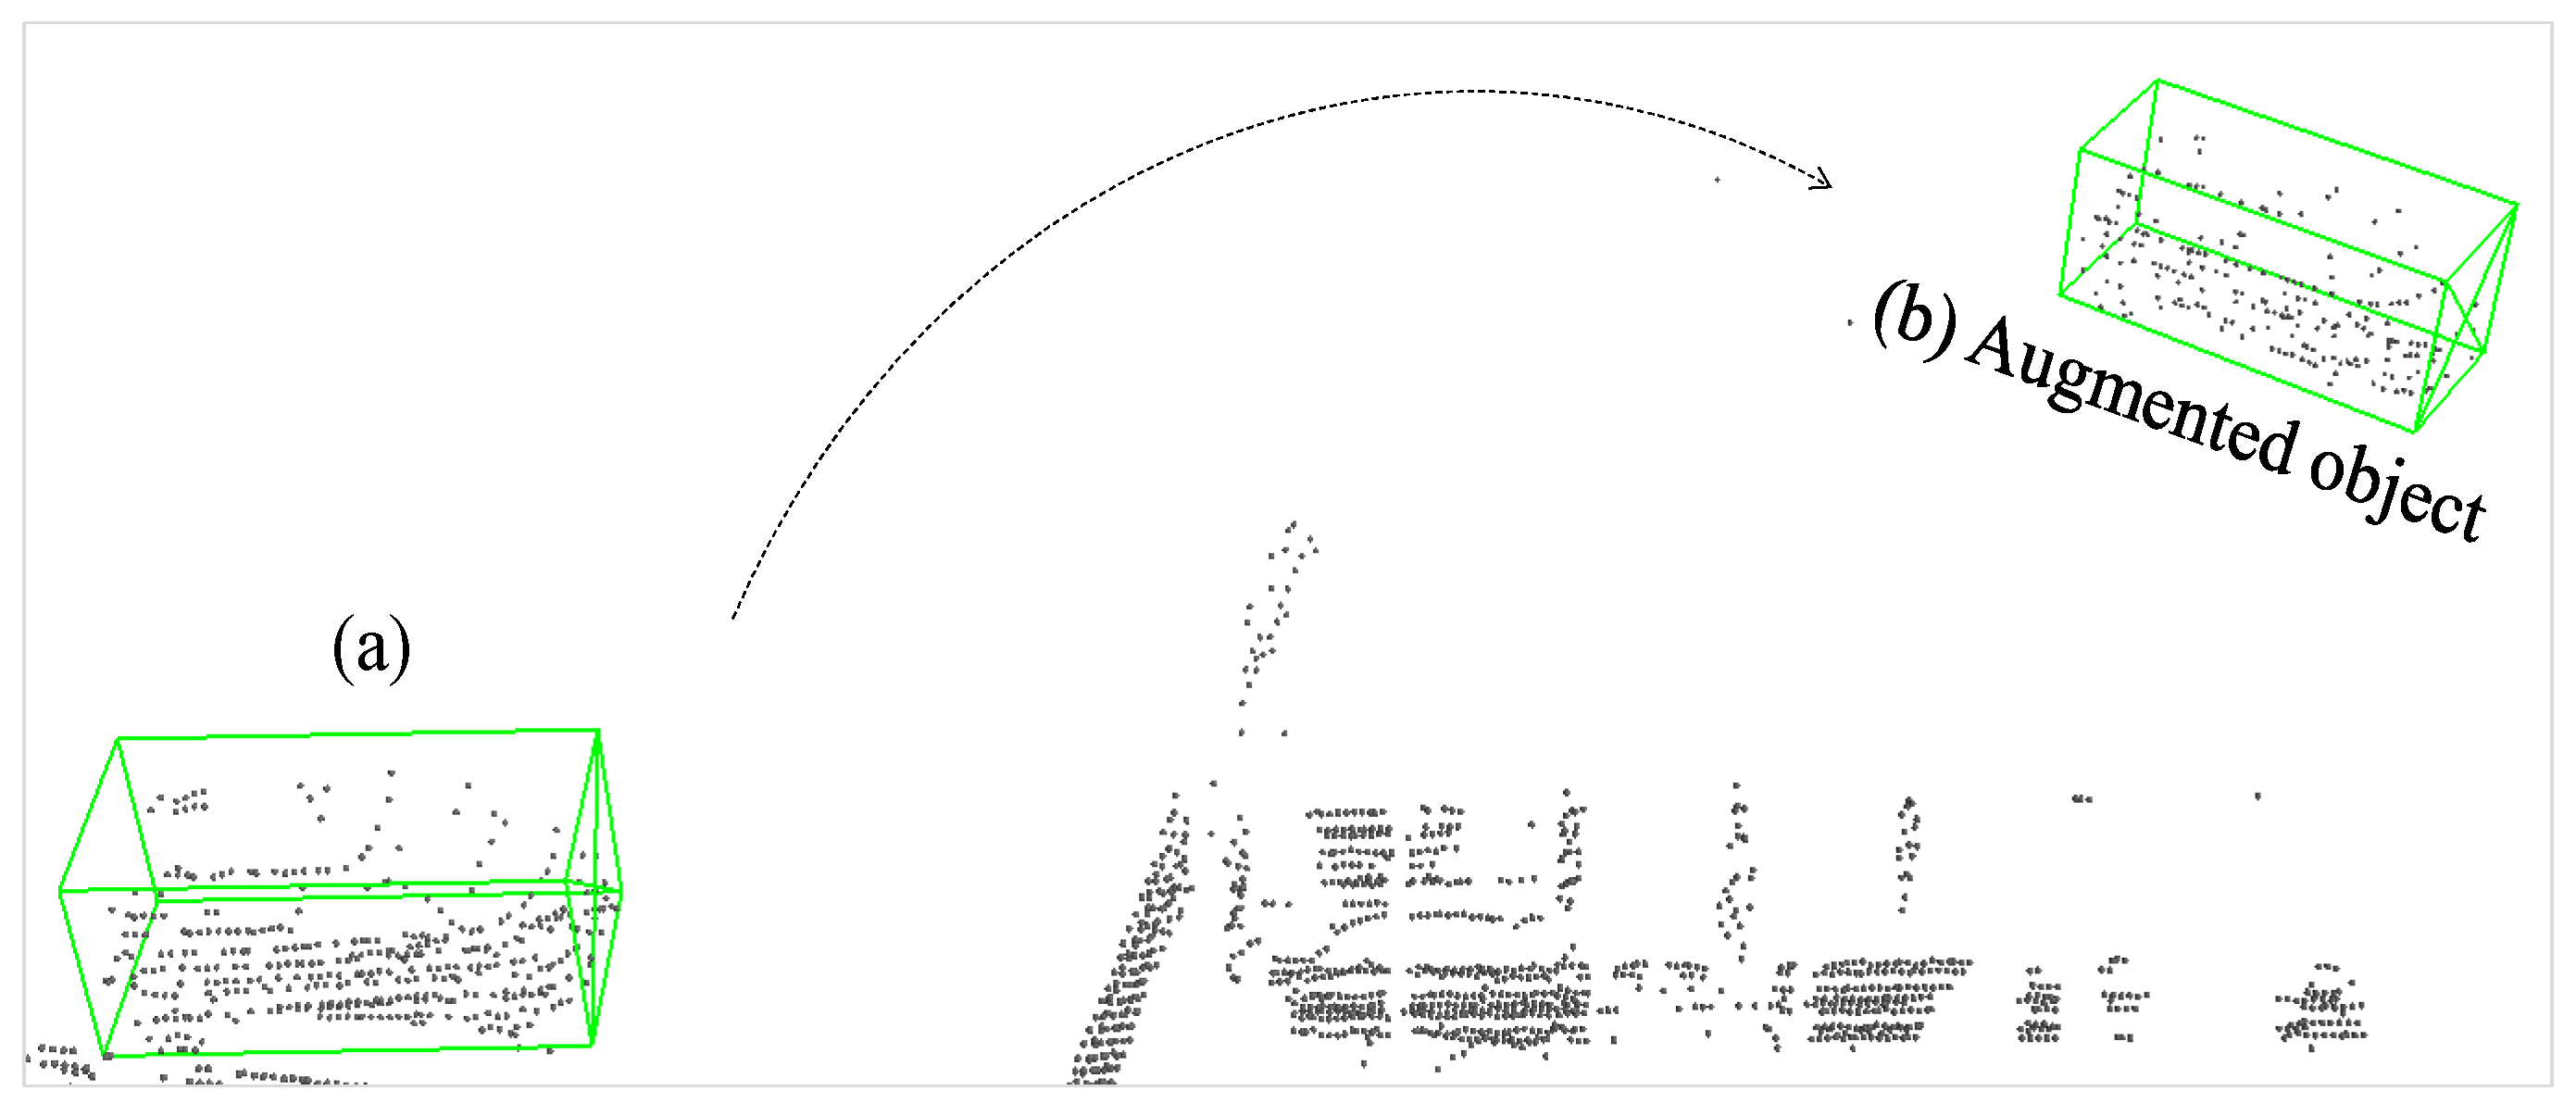
Figure 13.
Two examples of KITTI 3D dataset: (a) point clouds; (b) RGB images.
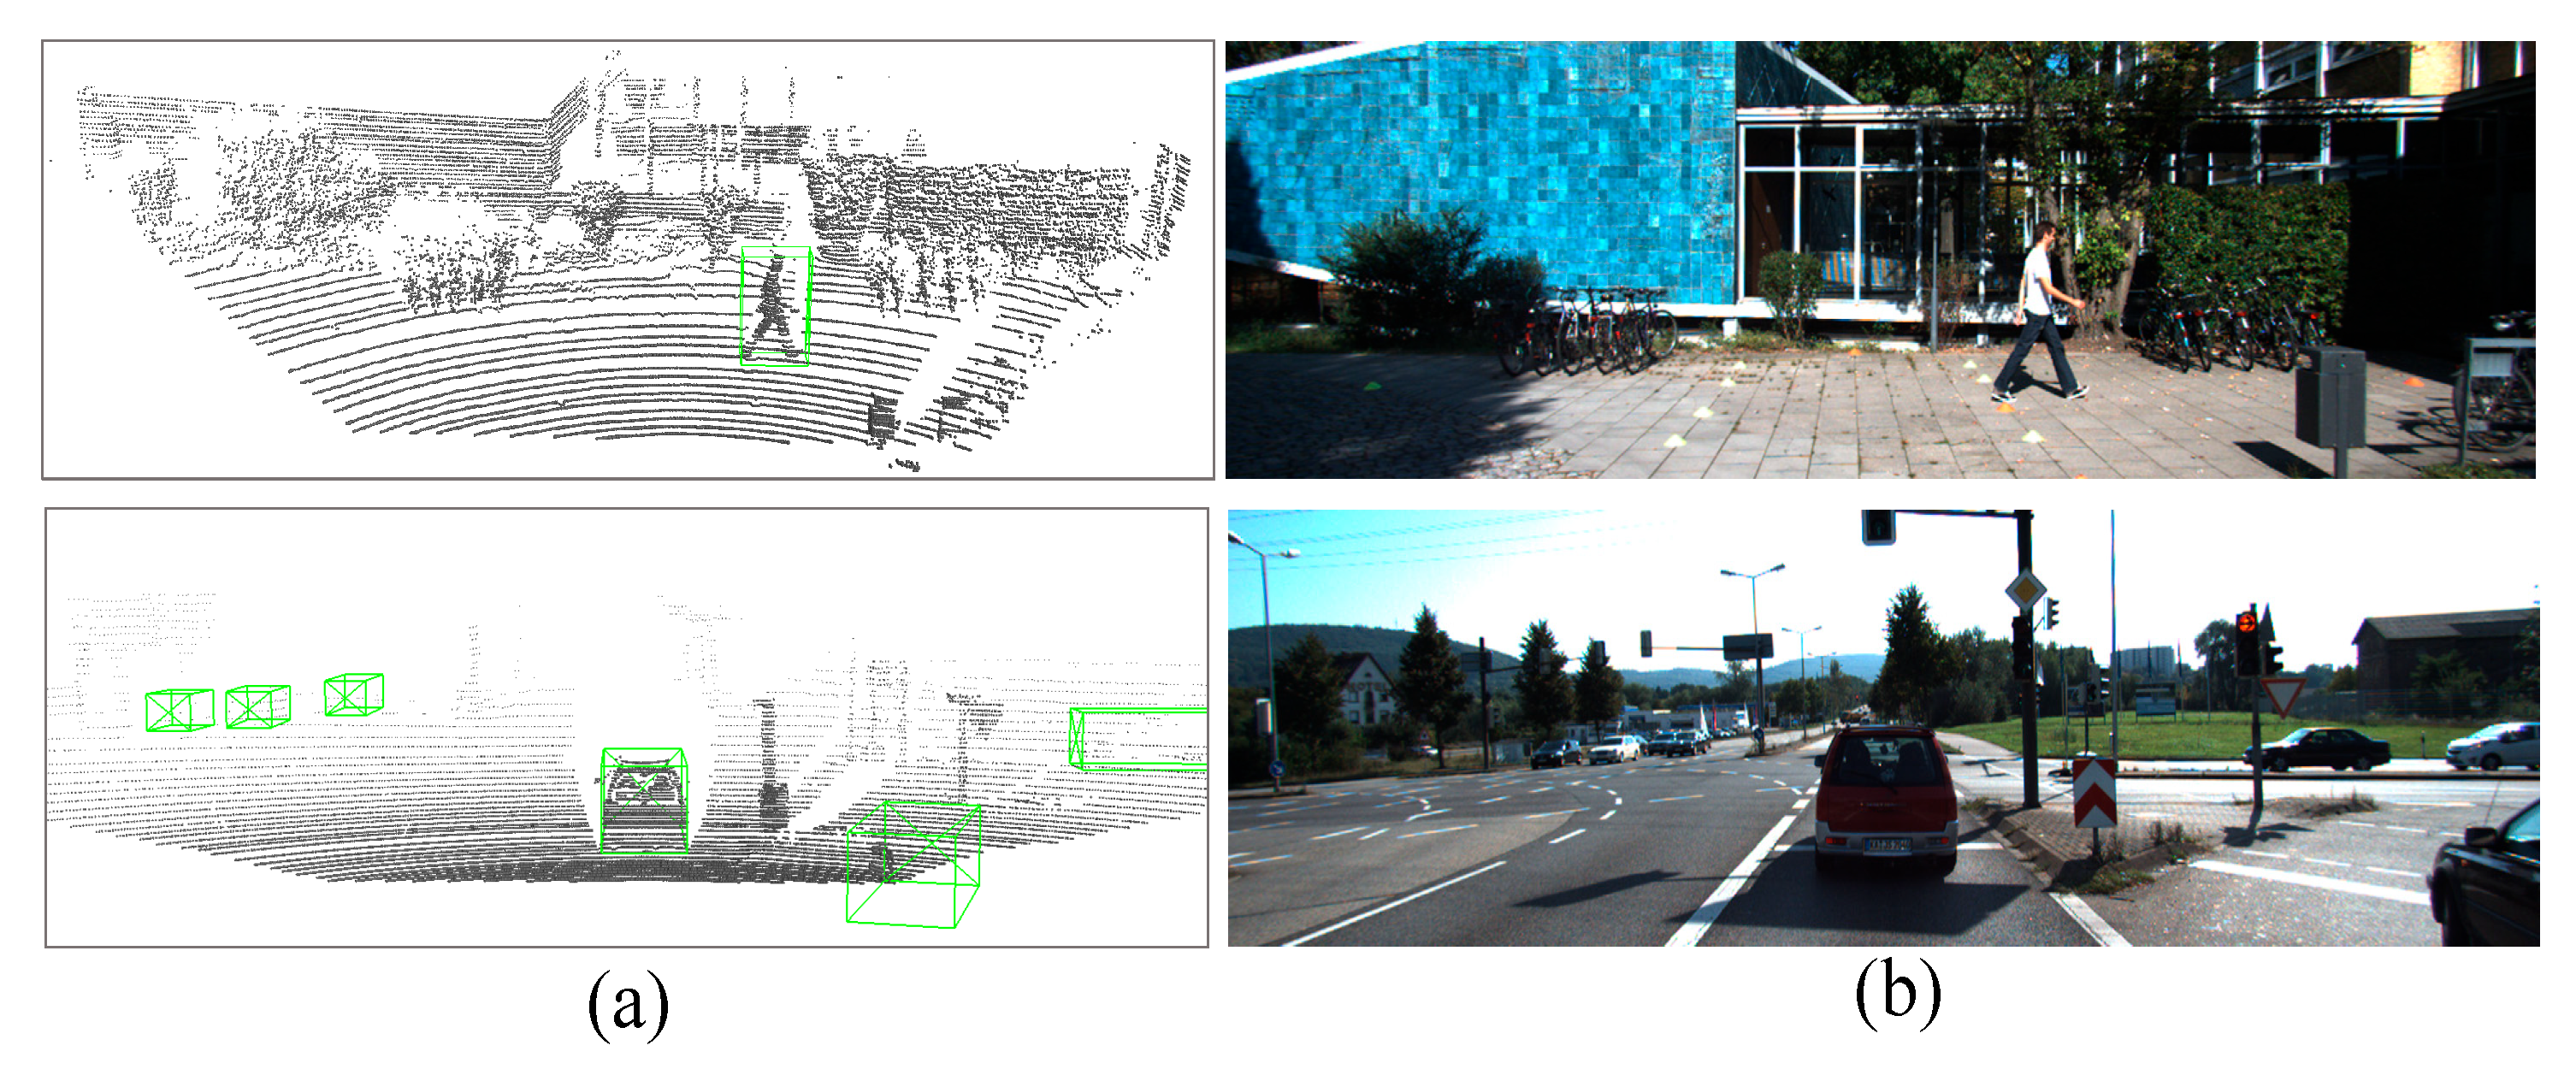
Table 1.
Performance comparisons on the KITTI val set with AP calculated by 40 recall positions for car, pedestrian and cyclist classes without use_road_plane technique in data augmentation.
Table 1.
Performance comparisons on the KITTI val set with AP calculated by 40 recall positions for car, pedestrian and cyclist classes without use_road_plane technique in data augmentation.
| Methods | Car 3D APR40 (%) | Pedestrian 3D APR40 (%) | Cyclist 3D APR40 (%) | ||||||
|---|---|---|---|---|---|---|---|---|---|
| Easy | Mod. | Hard | Easy | Mod. | Hard | Easy | Mod. | Hard | |
| Voxel R-CNN∇ | 92.33 | 82.63 | 80.00 | 62.53 | 54.86 | 48.96 | 89.93 | 73.97 | 68.56 |
| Ours | 92.67 | 83.26 | 80.50 | 66.35 | 58.02 | 52.05 | 91.40 | 75.48 | 70.86 |
∇ With retrained weights.
Table 2.
Performance comparisons on the KITTI val set with AP calculated by 40 recall positions for car, pedestrian and cyclist classes with use_road_plane technique in data augmentation.
Table 2.
Performance comparisons on the KITTI val set with AP calculated by 40 recall positions for car, pedestrian and cyclist classes with use_road_plane technique in data augmentation.
| Methods | Car 3D APR40 (%) | Pedestrian 3D APR40 (%) | Cyclist 3D APR40 (%) | ||||||
|---|---|---|---|---|---|---|---|---|---|
| Easy | Mod. | Hard | Easy | Mod. | Hard | Easy | Mod. | Hard | |
| Voxel R-CNN∗ | 92.15 | 85.01 | 82.48 | - | - | - | - | - | - |
| Voxel R-CNN∇ | 91.52 | 83.81 | 81.78 | 67.95 | 60.68 | 55.33 | 90.52 | 73.28 | 68.82 |
| Ours | 92.12 | 85.02 | 82.74 | 67.77 | 60.09 | 54.91 | 93.42 | 75.18 | 70.43 |
* With pretrained weights provided in OpenPCDet toolbox [15]; ∇ With retrained weights.
Table 3.
Performance comparison of proposed 3D detection with different designed components on the KITTI val set.
Table 3.
Performance comparison of proposed 3D detection with different designed components on the KITTI val set.
| Methods | Pyramid Fusion RoI Head | Angle-tuned Augmentation | Car | Pedestrian | Cyclist |
|---|---|---|---|---|---|
| mAP | mAP | mAP | |||
| (a) | 84.98 | 55.45 | 77.48 | ||
| (b) | ✓ | 85.09 | 57.69 | 76.70 | |
| (c) | ✓ | ✓ | 85.47 | 58.80 | 79.24 |
Table 4.
Performance comparison of pyramid fusion RoI head w/o fusion and cross attention modules on the KITTI val set.
Table 4.
Performance comparison of pyramid fusion RoI head w/o fusion and cross attention modules on the KITTI val set.
| Methods | Fusion module | Cross-attention | Car | Pedestrian | Cyclist | Total |
|---|---|---|---|---|---|---|
| mAP | mAP | mAP | Avg. | |||
| (c) | ✓ | ✓ | 85.47 | 58.80 | 79.24 | 74.51 |
| (d) | ✓ | 85.22 | 56.51 | 79.76 | 73.83 | |
| (e) | ✓ | 84.83 | 59.23 | 76.28 | 73.45 | |
| (f) | 85.71 | 55.47 | 77.99 | 73.06 |
Disclaimer/Publisher’s Note: The statements, opinions and data contained in all publications are solely those of the individual author(s) and contributor(s) and not of MDPI and/or the editor(s). MDPI and/or the editor(s) disclaim responsibility for any injury to people or property resulting from any ideas, methods, instructions or products referred to in the content. |
© 2026 by the authors. Licensee MDPI, Basel, Switzerland. This article is an open access article distributed under the terms and conditions of the Creative Commons Attribution (CC BY) license (http://creativecommons.org/licenses/by/4.0/).
Copyright: This open access article is published under a Creative Commons CC BY 4.0 license, which permit the free download, distribution, and reuse, provided that the author and preprint are cited in any reuse.


