Submitted:
07 January 2026
Posted:
08 January 2026
You are already at the latest version
Abstract
Papua New Guinea is one of the least studied regions in the Southwest Pacific, and large areas of the country, such as the Fly Plat-form, remain poorly understood due to limited exposure and access constraints. This study presents the first documentation of basaltic volcanism on the Fly Platform, based on new field discoveries at Mea-hill and Yemsigi, two areas located approximately 25 km apart. Inte-grated field observations, petrography, mineral chemistry, and whole-rock geochemistry show that both basalt suites were derived from a similar magma source but record contrasting emplacement histories. Meahill basalts, which include welded tuffs and highly ve-sicular basalt units, reflect rapid magma ascent, vigorous degassing, and locally explosive activity. In contrast, the massive, less vesicular porphyritic basalts at Yemsigi preserve a quieter emplacement history, but with more extensive post-magmatic alteration. Geochemical sig-natures from least altered rocks of both suites support an intraplate origin with similarities to Pliocene-Pleistocene lava fields of Northeast Queensland. The origin of the intra-plate basaltic magmatism is enig-matic, but both young volcanic provinces correlate spatially with a lower mantle anomaly that may represent residual slab material and a seated-seated magma source. These findings provide further insight into the tectono-magmatic evolution of the Fly Platform region and highlight the need for continued geological investigation in this underexplored district.
Keywords:
basalt
; Fly Platform
; intraplate volcanism
; magmatism
; South Fly District
; Papua New Guinea
1. Introduction
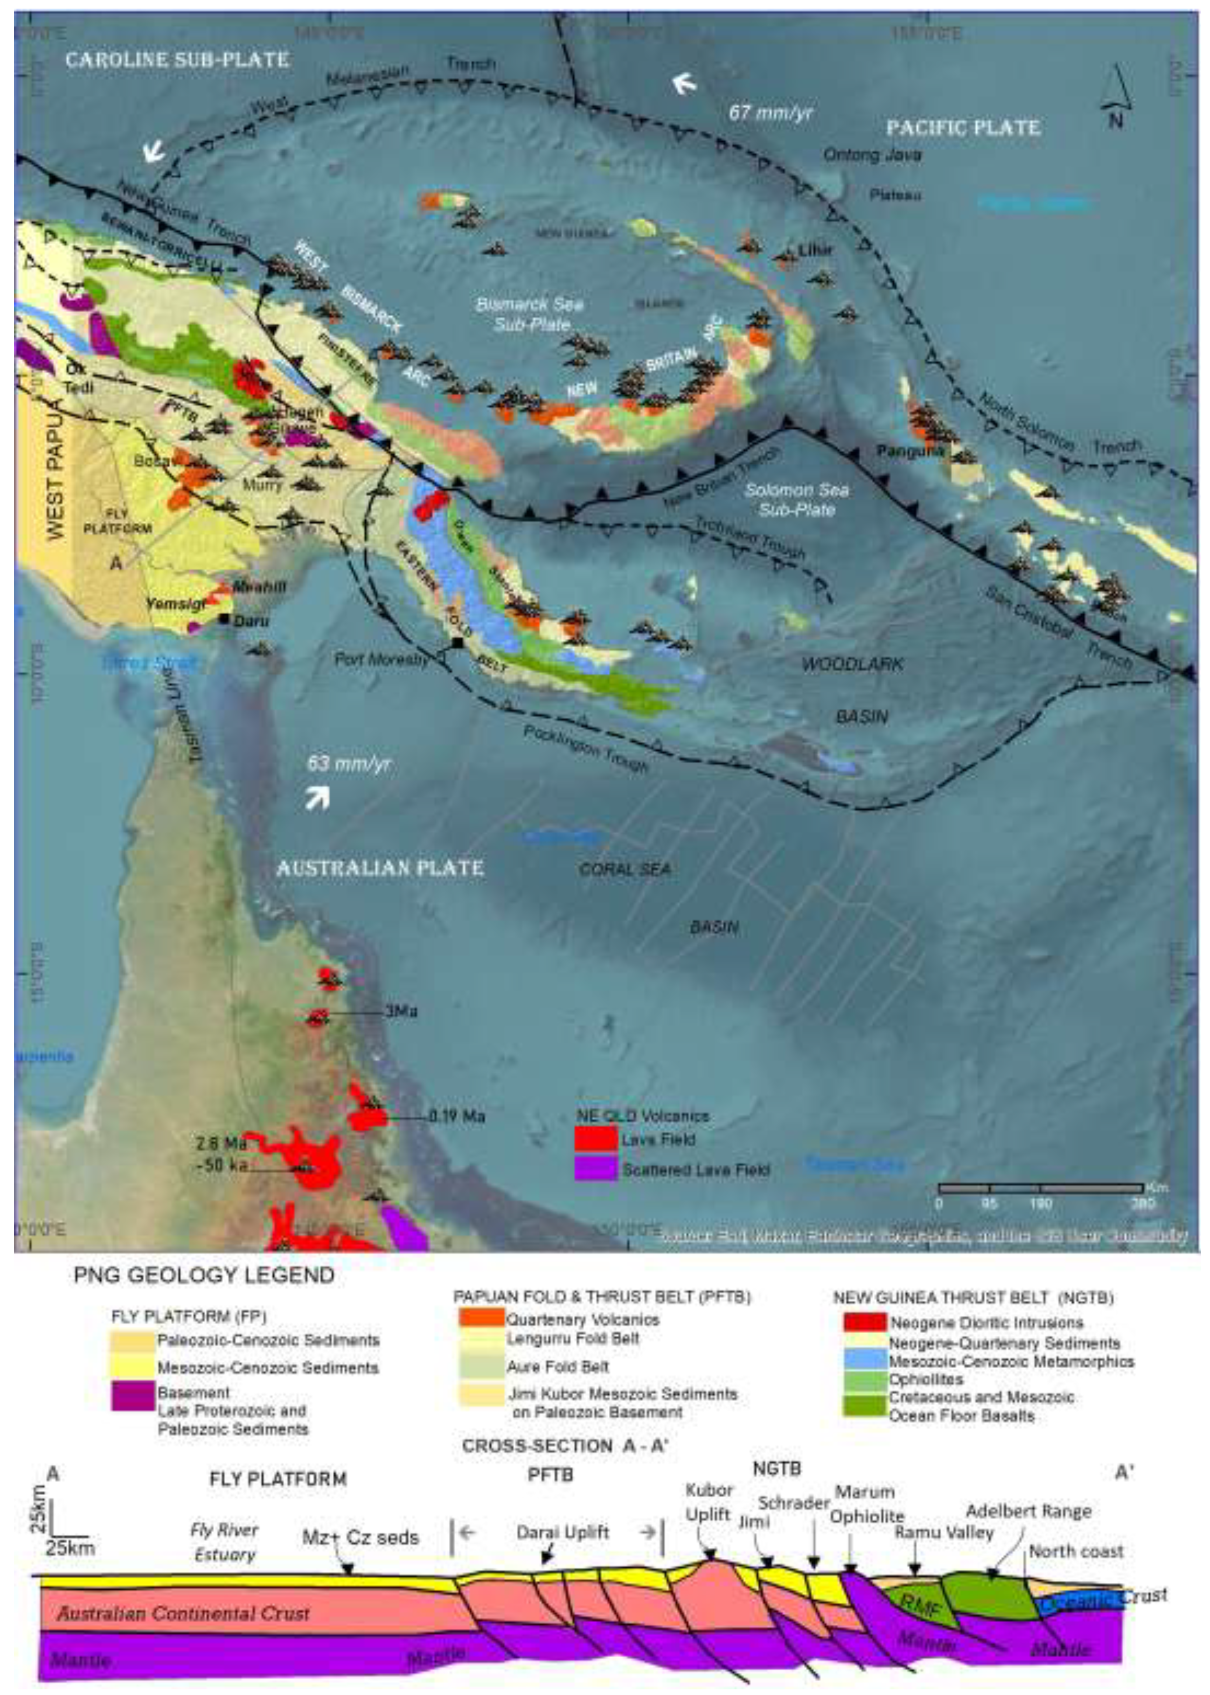
The geology of Papua New Guinea (PNG) is controlled by its position at the triple junction between the Australian Continental Plate, the Pacific Oceanic Plate, and the Caroline Sub-Plate, along the seismically and volcanically active Pacific Ring of Fire (Figure 1). Relative plate motions indicate that convergence between the Australian plate, moving at ~ 63 mm/yr, and the Pacific plate, moving at ~ 67 mm/yr, resolves to high convergence rates of approximately 10-11 cm/yr (Holm et al., 2016) [1].
This geodynamic setting has long attracted the attention of many researchers seeking to understand plate tectonics, crustal and basin evolution across the Southeast Asia and the Pacific (e.g., Weissel & Watts, 1979; Abbott, et al, 1994; Hill & Hall, 2002; Hall, 2002; Baldwin et al, 2004, Baldwin et al., 2012; Bortford et al., 2012; Webb, et al., 2014; Holm et al., 2015; Holm et al, 2016; Bulois et al., 2018; Holm et al, 2019; Holm et al., 2020; Brandl et al., 2024) e.g., [1,2,3,4,5,6,7,8,9,10,11,12,13,14] Although, a vast amount of literature addresses the geology of PNG, much of the field-based geological data was acquired during the 1960s and early 1970s, prior to PNG’s Independence in 1975. These data were largely generated through a collaborative geological mapping program with the Bureau of Mineral Resources (now Geoscience Australia) and are documented in the official 1:250,000 geological map series and synthesized for easier understanding (e.g., Dow, 1977; Williamson & Hancock 2005; Sheppard & Cranfield, 2012; Davies, 2012) e.g., [15,16,17,18].
Since then, geological knowledge has continued to accumulate, mainly from regions where subsurface and surface data are more readily available through hydrocarbon and mineral exploration (e.g., Corbett and Leach, 1997; Williamson & Hancock 2005; Callot, et al., 2017) e.g., [16,19,20]. For decades, accessibility challenges and inadequate infrastructure have hindered detailed geological mapping across much of the country, complicating efforts to reconstruct the tectonic evolution (e.g., Holm et al., 2016; Holm et al., 2019; Holm et al., 2020) [1,12,13]. These challenges arise largely from the rugged topography, dense forest cover, and extensive swamplands, compounded by limited logistical support. Consequently, large parts of the country, particularly the Fly Platform, which forms the southwestern part of the Eastern Papuan Basin of New Guinea (Davies, 2012)[18] remain poorly mapped and underexplored. In this region, bedrock exposures are scarce, as rocks are buried beneath extensive swampy lowlands and thick sedimentary cover, severely limiting opportunities for direct geological observation and sampling. As a result, much of the geological understanding of the Fly Platform has remained speculative.
More recently, the Geological Survey of PNG, functioning as a division under Mineral Resources Authority (MRA), renewed its efforts to update the national geological map series. This ongoing initiative aims to strengthen the country’s geoscientific database, with initial work focusing on the unmapped areas of the Fly Platform. In this region local knowledge has proven invaluable, providing essential guidance in locating and accessing outcrops within the otherwise inaccessible swampy terrain.
In September 2024, a field reconnaissance survey was conducted, resulting in the discovery of basalt outcrops that had not been previously documented. Samples collected during the field campaign were subsequently prepared and analyzed at Akita University, Japan, to investigate their petrogenesis. In addition, K-Ar radiometric dating was performed to constrain the timing of this magmatic activity.
2. Geology of the Fly Platform
The Fly Platform forms the southwestern portion of the Late Mesozoic-Cenozoic Papuan Basin, one of the most extensive and geologically significant sedimentary basins in New Guinea, occupying the northern margin of the Australian continental plate (Davies, 2012) [18]. The Papuan Fold and Thrust Belt defines the northern boundary of the basin. The tectonic architecture and crustal configuration of these units are illustrated in cross-section A-A′, which transects the southern margin of PNG from the Fly River estuary to the northern coast (Figure 2).
The evolution of the Papuan Basin is closely linked to the breakup of Gondwanaland and the subsequent northward drift of the Australian Plate (Hill & Hall, 2002; Hall, 2002; Crowhurst, et al., 2005; Holm, 2016) [1,4,5,21]. Australia began rifting away from Gondwanaland during the Late Jurassic to Early Cretaceous (ca. 160-130 Ma), initiating the development of passive continental margins along northern Australia, including the Papuan Basin and the region that is now the Fly Platform. By the Eocene (~45 Ma), Australia had completely separated from Antarctica, and its northern continental margin experienced significant subsidence, forming a broad sedimentary basin. Within this basin, Jurassic to Miocene sandstones, siltstones, shales, and carbonates accumulated under predominantly marine conditions.
Continued northward drift led to collision between the Australian and Pacific plates during the Miocene, generating compressional forces that produced the Papuan Fold and Thrust Belt to the north. Numerous studies identify two magmatic arc events, the Miocene Maramuni Arc and the Pliocene-Quaternary arc that contributed to the formation of ore deposits along the New Guinea Orogenic Belt, also referred to as the New Guinea Mobile Belt (Davies, 2012; Holm et al., 2015; Holm et al, 2016) [1,10,18]. Relics of these magmatic events are preserved along the Fly-Highland’s region, which hosts a chain of dormant Pleistocene volcanoes including Mount Bosavi, Mount Murray, and Mount Hagen (Johnson et al, 1978; MacKenzie & Johnson, 1984; Hamilton et al., 1983) [22,23,24].
In contrast, the Fly Platform has long been regarded as relatively stable (Davies, 2012; Sheppard & Cranfield, 2012) [17,18]. Most rock units remain concealed beneath thick sedimentary and alluvial cover and are primarily known from subsurface data acquired through petroleum exploration drilling (Davies, 2012) [18]. The region has commonly been interpreted as preserving a largely undisturbed foreland stratigraphic sequence that continues into the Fold and Thrust Belt. However, field investigations conducted in this study have identified basaltic units that indicate localized and relatively recent magmatic activity on the Fly Platform, suggesting that the region may not have been entirely tectonically and magmatically inactive.
Figure 2.
Geotectonic map showing the major geological provinces of Papua New Guinea (after Davies, 2012) [18] and principal tectonic structures, with bold lines denoting active volcanic arcs and dashed lines denoting ancient arcs (after Holm, 2016) [1]. The lower panel shows a schematic cross-section (A-A’) extending from the Fly Platform (FP) across the Papuan Fold and Thrust Belt (PFTB) to the New Guinea Thrust Belt (NGTB). Active and dormant Quaternary volcanoes are indicated. Quaternary volcanic rocks of northeast Queensland (NE QLD) are also shown for regional comparison (Meeuws et al., 2016) [25]. The study areas are shown in red.
3. Sampling and Analytical Methods
A one-week field reconnaissance survey was conducted in September 2024 where samples were collected for this study. Two sites, Meahill and Yemsigi (Figure 3), where accessed on foot and by motorboat from Daru Island, the provincial headquarters of Western Province. Meahill lies about 67 km northeast of Daru and 2 km inland from Tabio, a gardening camp of the Saremabu people along the Fly River Delta. Yemsigi is located 30 km north of Daru and 10 km east of Mur village, the last settlement along the Oriomu River. For this study, the least altered basaltic rocks were collected for analysis to understand the magma composition and source characteristics. Details of the sample preparation methods and analytical equipment used are provided in the following section.
3.1. Petrography
Two representative fresh basalts, each from Tabio-Meahil (TM9 and TM13) and Mur-Yemsigi (MY6 and MY4), were prepared for petrographic and mineralogical study. The preparation process involved cutting the rock samples, and mounting them onto glass slides, which were subsequently ground and polished to a standard thickness of 30 µm. The petrographic analysis was carried out using a Nikon Eclipse LV100 POL microscope under plane-polarized light (PPL) and cross-polarized light (XPL).
Minerals were further verified using a JEOL JSM-IT300LV scanning electron microscope (SEM) operated at 15 kV and 2.2 nA. For this method, the polished-sections were carbon-coated to ensure electrical conductivity and enhance imaging quality. Backscattered Electron (BSE) images were acquired.
3.2. Mineral Chemistry
The major element compositions of mineral crystals (e.g., olivine, pyroxene, feldspar and titatanomagnetite) were analyzed by a JEOL JXA-8230 Electron Probe Micro-Analyzer (EPMA) using with a 10 μm defocused beam at 15 kV and 20 nA, with peak counting times of 10-20 seconds. Analytical accuracy and precision for EPMA measurements were monitored using internal standards [e.g., albite (Na), wollastonite (Ca), rutile (Ti), hematite (Fe), nickel oxide (Ni), and forsterite (Mg)]. Elements analyzed included SiO2, TiO2, Al2O3, Cr2O3, FeO, MnO, MgO, NiO, CaO, Na2O, and K2O. The olivine, pyroxene, plagioclase, and titano-magnetite compositions were calculated using MagMin_PT: an excel-based mineral classification and geothermobarometry program for magmatic rocks (Gündüz & Kürşad, 2023) [26].
3.3. Whole-Rock Geochemistry
A selection of 12 least altered rock samples from Meahill (n=6) and Yemsigi (n=6) were pulverized with a tungsten carbide mill, and a 3 g aliquot was used to determine Loss on Ignition (LOI) by sequential heating to 900 °C. The whole-rock major elements were measured using a ZSX Primus II XRF spectrometer (Rigaku Co.).
The trace element and Rare Earth Element (REE) concentrations were determined by Inductively Coupled Plasma-Mass Spectrometry (ICP-MS). A 0.3 g portion of each sample was digested in a three-acid mixture (HClO4, HNO₃, HF) and heated at 135 °C for 1-2 days. The solutions were then diluted, acidified, filtered, and stored. Quality control includes blanks, duplicates, and certified reference materials (JG-2). Analytical accuracy and precision were monitored through repeated analysis of internal standards with uncertainty generally better than ±1 to ±2%.
3.4. Potassium-Argon (K-Ar) Age Dating
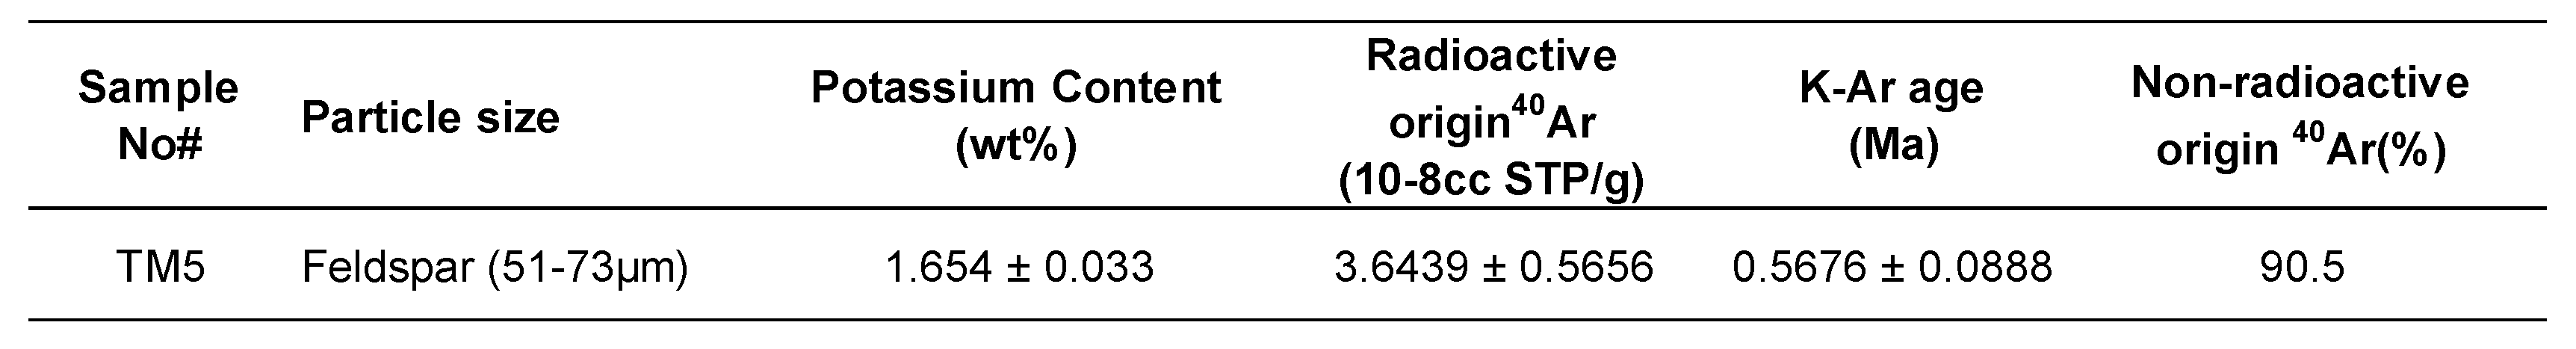
The K-Ar geochronology was performed at the Hiruzen Geochronology Research Institute Co., Ltd, in Okayama, Japan. A relatively fresh basalt sample (TM5) weighing 0.95 grams was sent to the laboratory where feldspar grain sizes ranging between 51 and 73 µm were extracted and analyzed using the K-Ar geochronology method. The feldspars contained a potassium content of 1.654 wt% ± 0.033, providing a suitable basis for radiometric dating. The potassium content was measured using flame photometry or an atomic absorption spectrophotometer. A standard reference material was analyzed alongside the sample to ensure accuracy. The results were then corrected for any potential interferences or systematic errors. The sample was heated in a vacuum system to release argon gas. The extracted gas was then purified to remove contaminants such as atmospheric argon or other interfering gases. The amount of radiogenic Ar was determined using a mass spectrometer (Nagao, Nishito, et.al, 1984; Itaya, et al., 1991; Yagi, Okada, et.al, 2015) [27,28,29].
4. Results
4.1. Field Observations
The Meahill and Yemsigi basalt exposures are located approximately 25 km apart and occur along a northeast-southwest trend on the South Fly mainland (see Figure 3). Owing to their contrasting field characteristics and textures, each locality is discussed separately.
4.1.1. Meahill Basalts
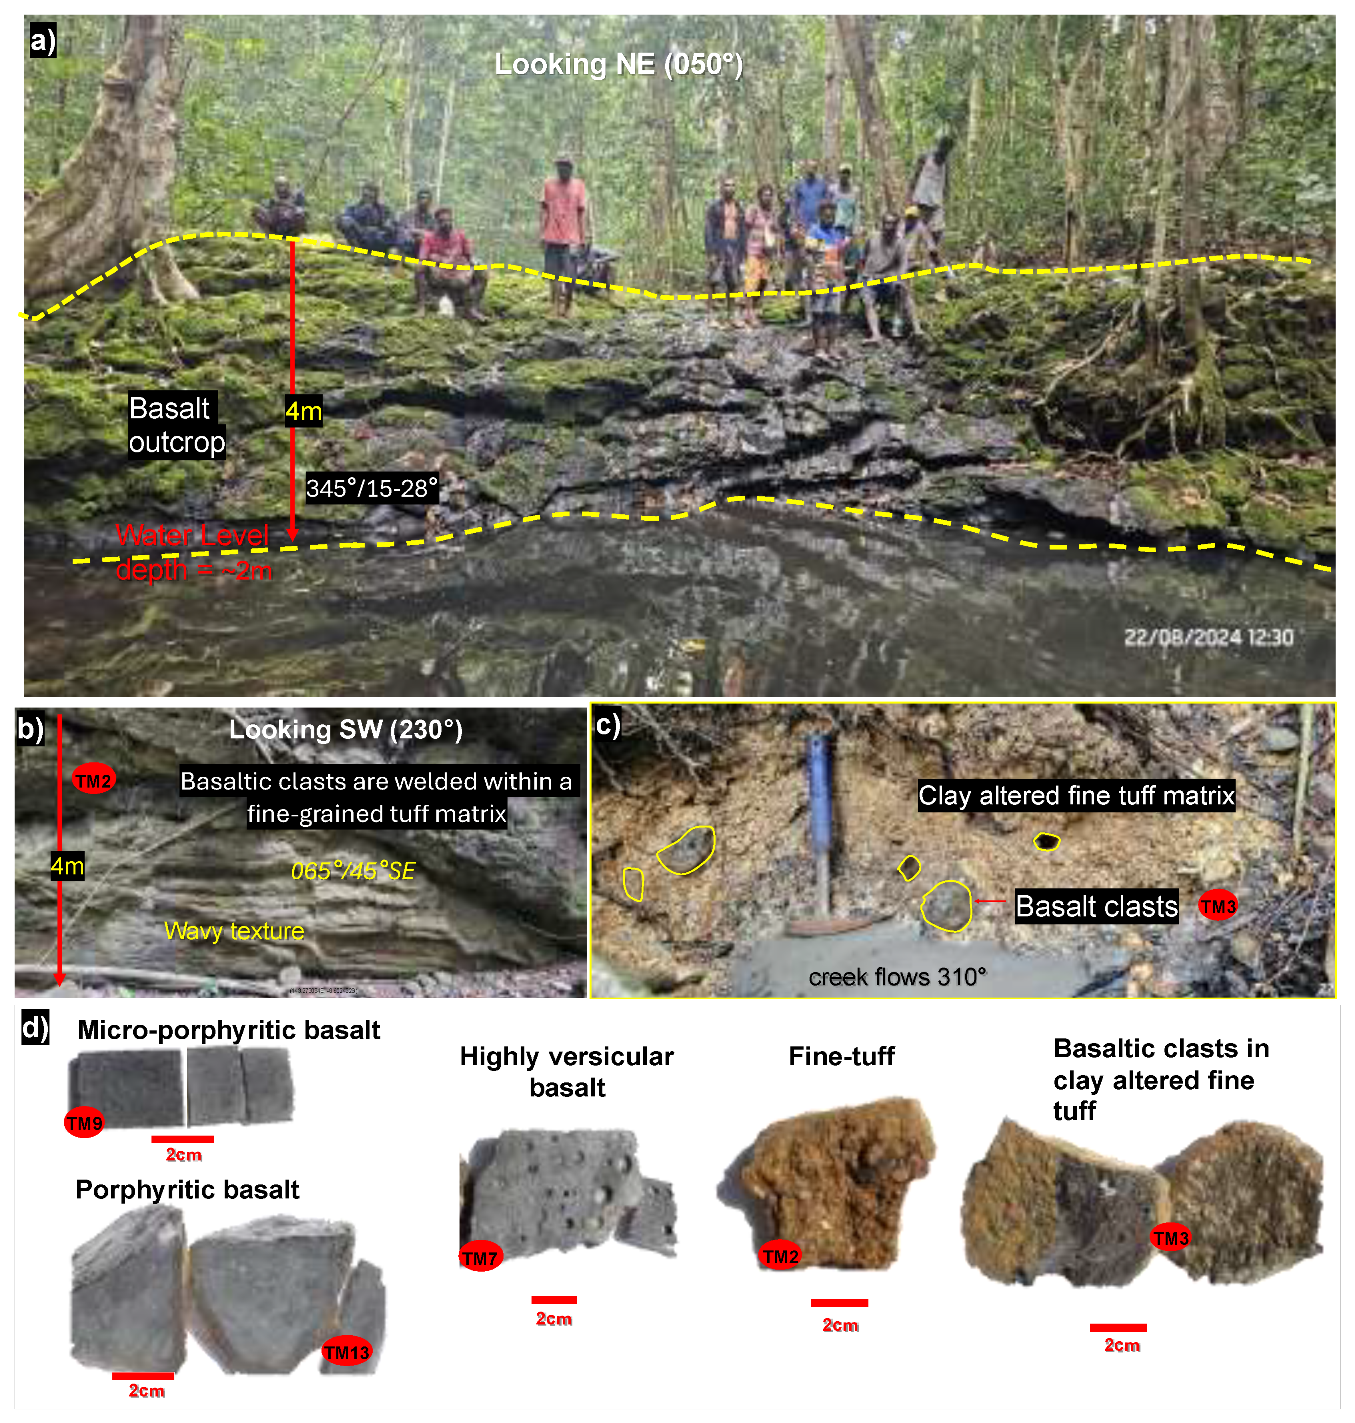
Meahill was first accessed through Tabio, a low-lying coastal area dominated by sedimentary formations composed mainly of dark, fine-grained mudstone and siltstone units occurring within a mangrove-type vegetation zone. The terrain gradually rises in the west towards Meahill, which lies at an elevation of approximately 40 m above sea level. At Meahill, outcrops preserve evidence of a late-stage explosive eruption, characterized by basaltic clasts embedded within altered and welded fine tuffs, together with a massive basaltic outcrop (~4-6 m thick) exposed at Aleale Creek (143.273402° E, -8.652976° N; see Figure 4a). The outcrops comprise:
- 1.
- Fine tuffs with basaltic clasts; One outcrop (TM2; 143.355556°E, -8.633557°N; see Figure 4b) exposes a ~4 m high section of light brown, welded fine-grained tuff containing pebble- to cobble-sized dark basaltic clasts. The unit displays low-angle cross-stratification dipping 45° to the southeast with an approximate strike of 065°. A second outcrop at TM3 (143.355556°E, -8.633557°N; see Figure 4c) is exposed along a creek channel flowing towards ~310°. In this locality, the tuff matrix is strongly altered to fine clay, while the basaltic clasts remain relatively well preserved. The alteration is intense, producing friable material with light yellowish-brown staining throughout the exposures.
- 2.
- Micro-porphyritic to porphyritic basalts; The basaltic rocks collected along Aleale Creek are typically dark grey to black on fresh surfaces and display textures ranging from micro-porphyritic to porphyritic, with several units exhibiting high vesicularity (see Figure 4d). The phenocrysts are dominated by mostly olivine and clinopyroxene, occurring as pale green to black euhedral to subhedral crystals. The groundmass is microcrystalline, forming a dense interstitial matrix composed of plagioclase, clinopyroxene, and opaque minerals. Vesicles are abundant, variable in size, and frequently filled with amygdales.
Figure 4.
Outcrop and samples from Meahill. a) Basalt outcrop at Aleale Creek, b) Welded Fine tuff with basaltic clasts (TM2), c) Basalt clasts in clay altered fine tuff (TM3), d) Hand specimen showing basaltic units ranging from micro-porphyritic to porphyritic and highly versicular basalts also shown are fine tuff with basaltic clasts from the clay altered tuff.
4.1.2. Yemsigi Outcrops
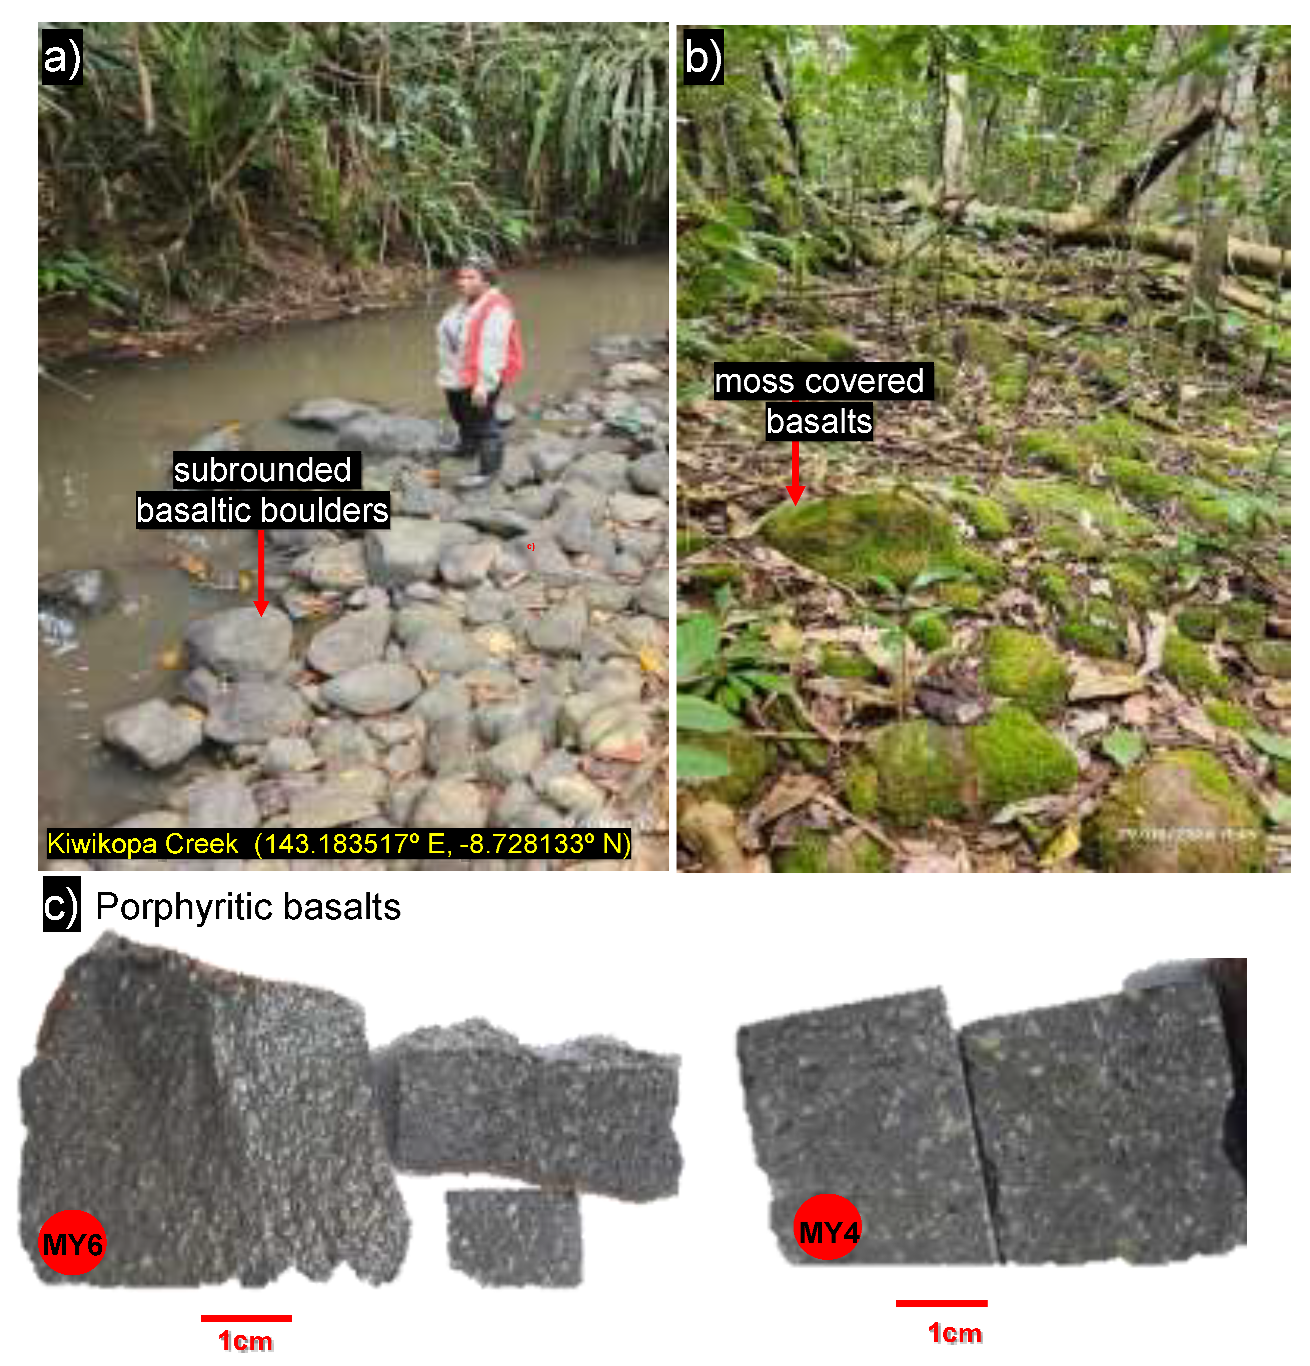
The Yemsigi area was accessed via Mur village along a track marked by a continuous stretch of orange-red, hematite-rich soils, with few scattered, moss-covered and highly weathered basaltic clasts visible along the way. The only prominent exposure is along Kiwikopa Creek (143.183517° E, -8.728133° N), refer to Figure 5 a-b.
Unlike at Meahill, the basalts at this location are preserved as large, heavy, dark subrounded boulders and display a porphyritic texture (see Figure 5c). They contain visible euhedral to subhedral, lenticular-shaped olivine phenocrysts set within a fine- to medium-grained groundmass composed of mostly clinopyroxene, plagioclase, and opaque minerals. Vesicularity is generally lower in comparison to Meahill basalts.
Figure 5.
Outcrops and samples from Yemsigi, a) Kiwikopa Creek showing sub-rounded massive basalt boulders; b) moss-covered basalts adjacent to the river channel; and c) representative hand specimen displaying the porphyritic basalt textures.
Figure 5.
Outcrops and samples from Yemsigi, a) Kiwikopa Creek showing sub-rounded massive basalt boulders; b) moss-covered basalts adjacent to the river channel; and c) representative hand specimen displaying the porphyritic basalt textures.
4.2. Petrography
Petrographic analysis was conducted on selected fresh basalt samples from both Meahill (TM9 and TM13) and Yemsigi (MY4 and MY6). The fine-tuff samples from Meahill were excluded at this stage due to their altered and friable nature; however, they may be examined in future follow-up work.
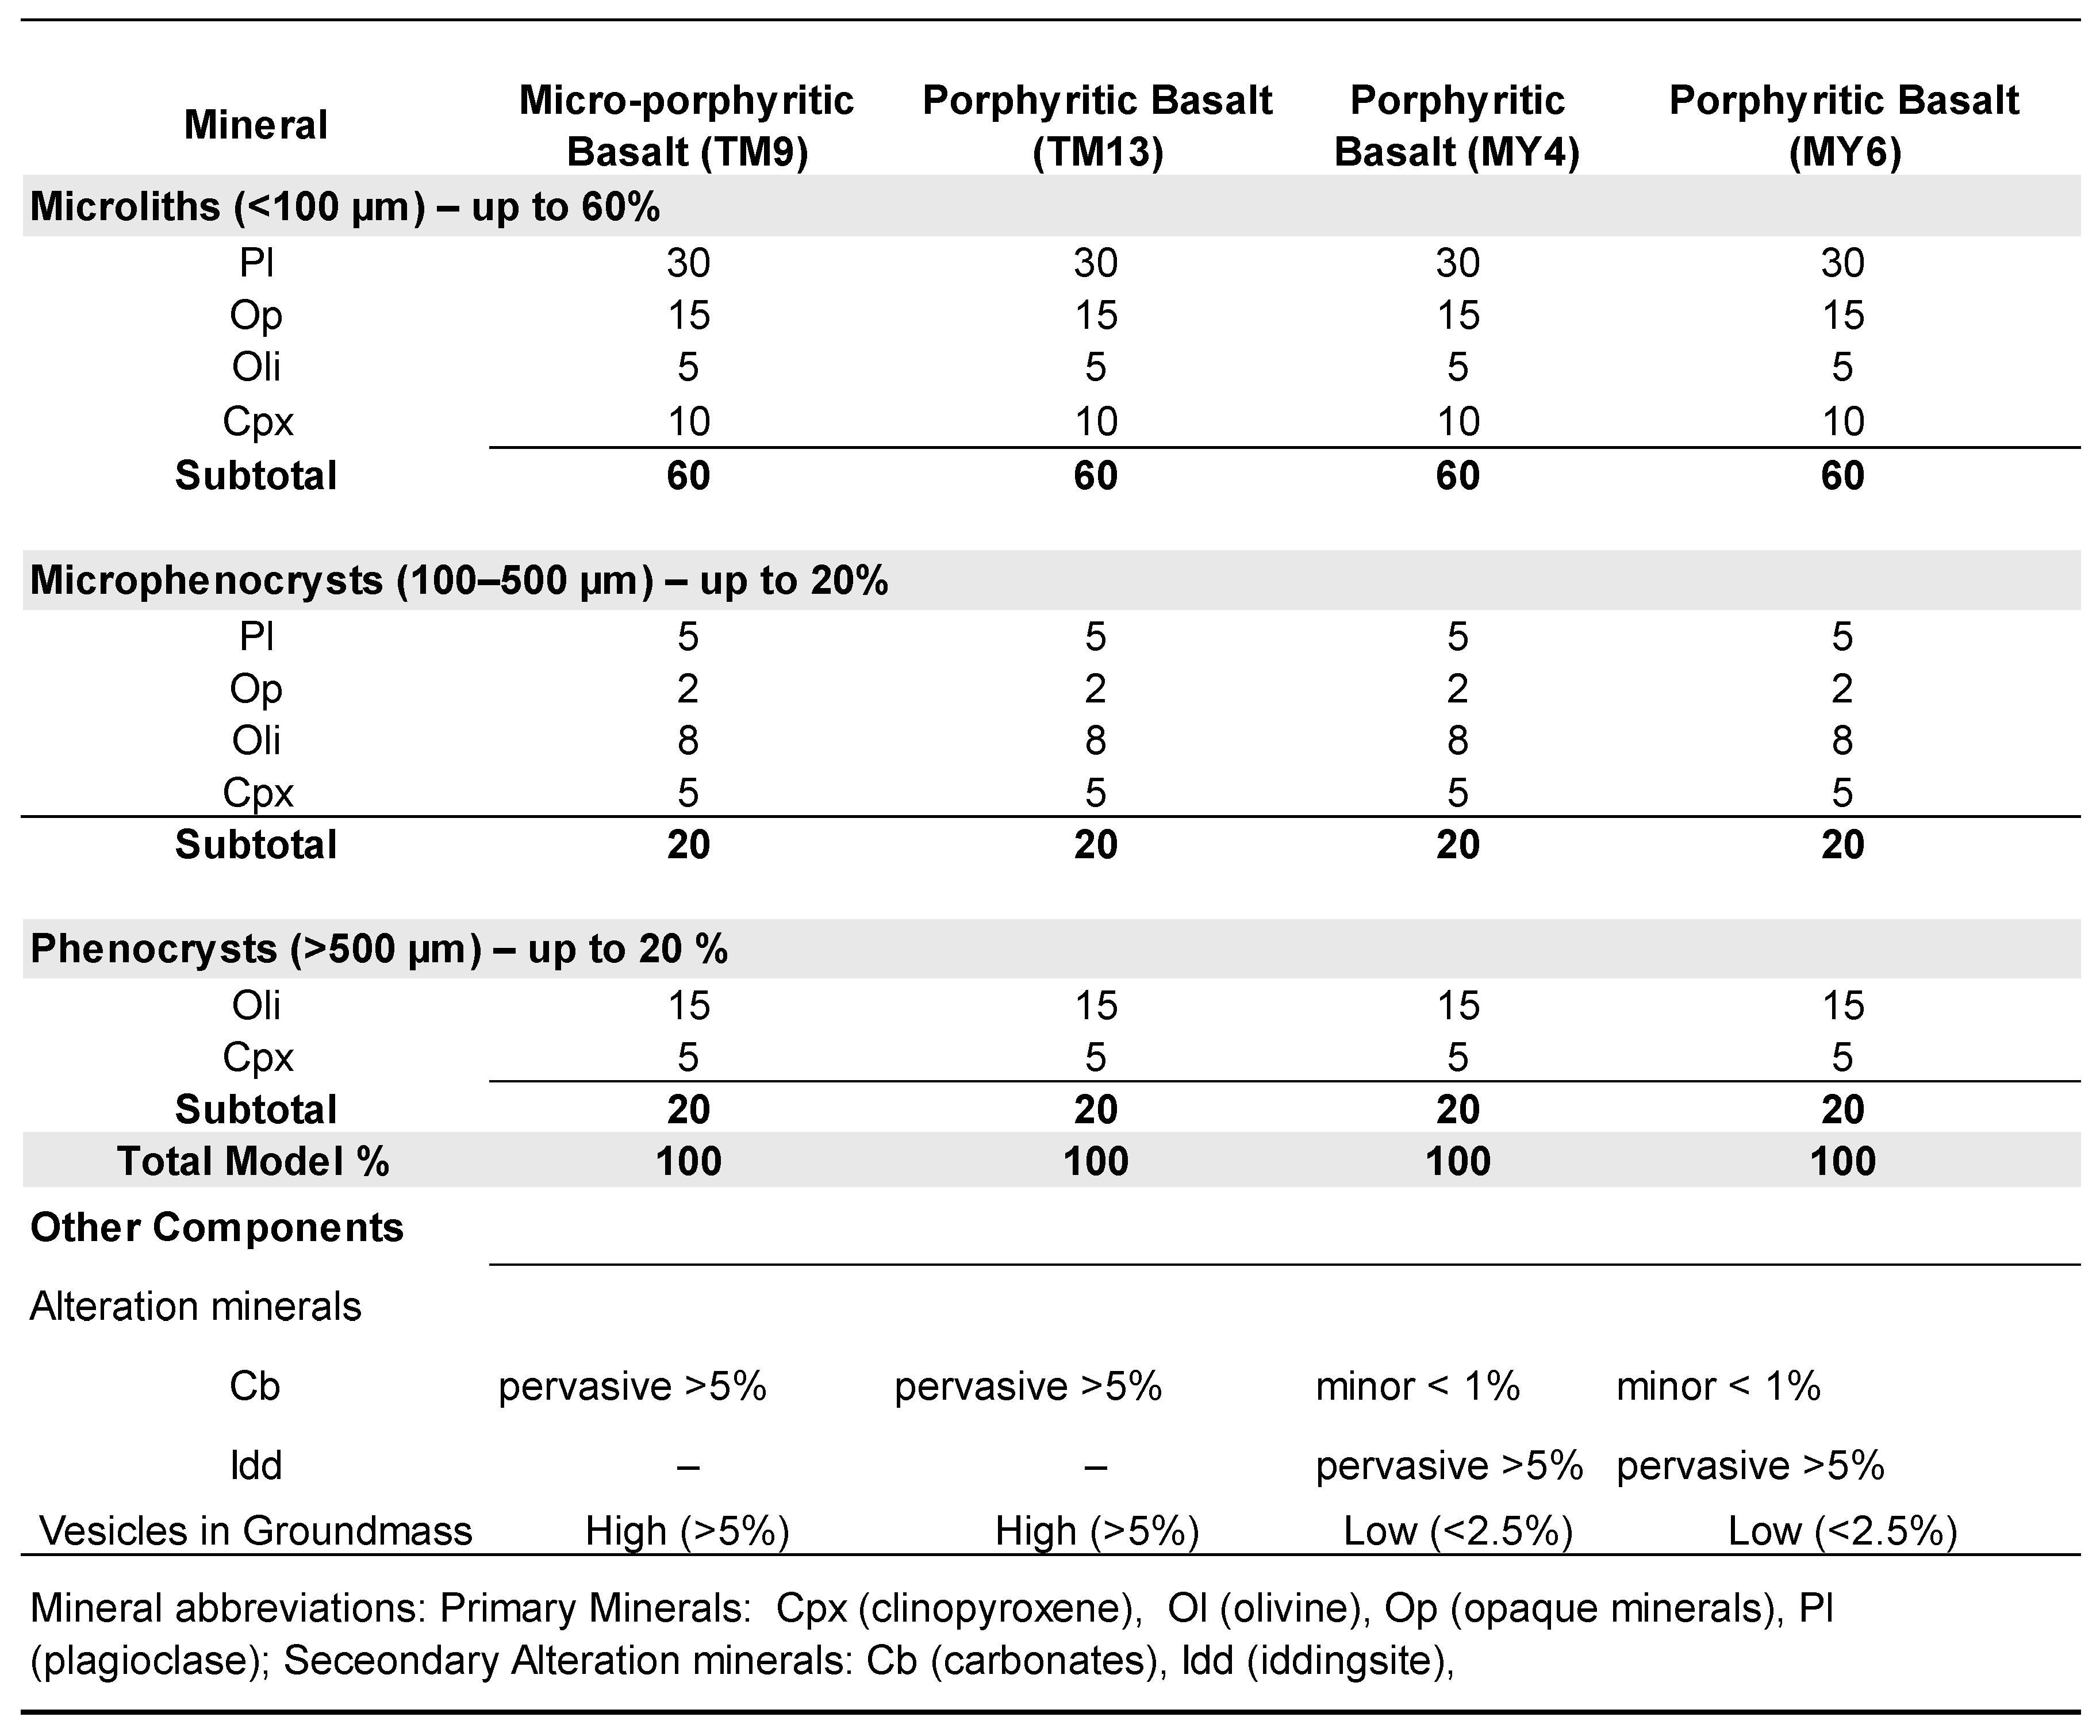
Table 1 presents a summary of the petrographic observations, and the individual basalt types are discussed separately in the following sections.

Table 1.
Model % of minerals in thin section (microliths, microphenocrysts, phenocrysts).
4.2.1. Meahill Basalts
In thin section, the micro-porphyritic basalt (TM9) is dominated by abundant olivine and clinopyroxene microphenocrysts set within a dense groundmass of plagioclase microliths and opaque minerals. Olivine occurs as subhedral to anhedral grains ranging from 120-700 μm, displaying bright interference colours and internal fracturing. Clinopyroxene forms short prismatic microphenocrysts (150-300 μm) and granular groundmass crystals. Plagioclase occurs as both microphenocrysts (150-250 μm) and as abundant microlithic laths (<80 μm) that are tightly interlocked with opaque minerals and clinopyroxenes. Opaque minerals occur as irregular grains (100-250 μm) and as fine disseminated particles in the groundmass. Local carbonate replacement appears mostly along with olivine and closer to vesicles which are present up to 400-600 μm in diameter.
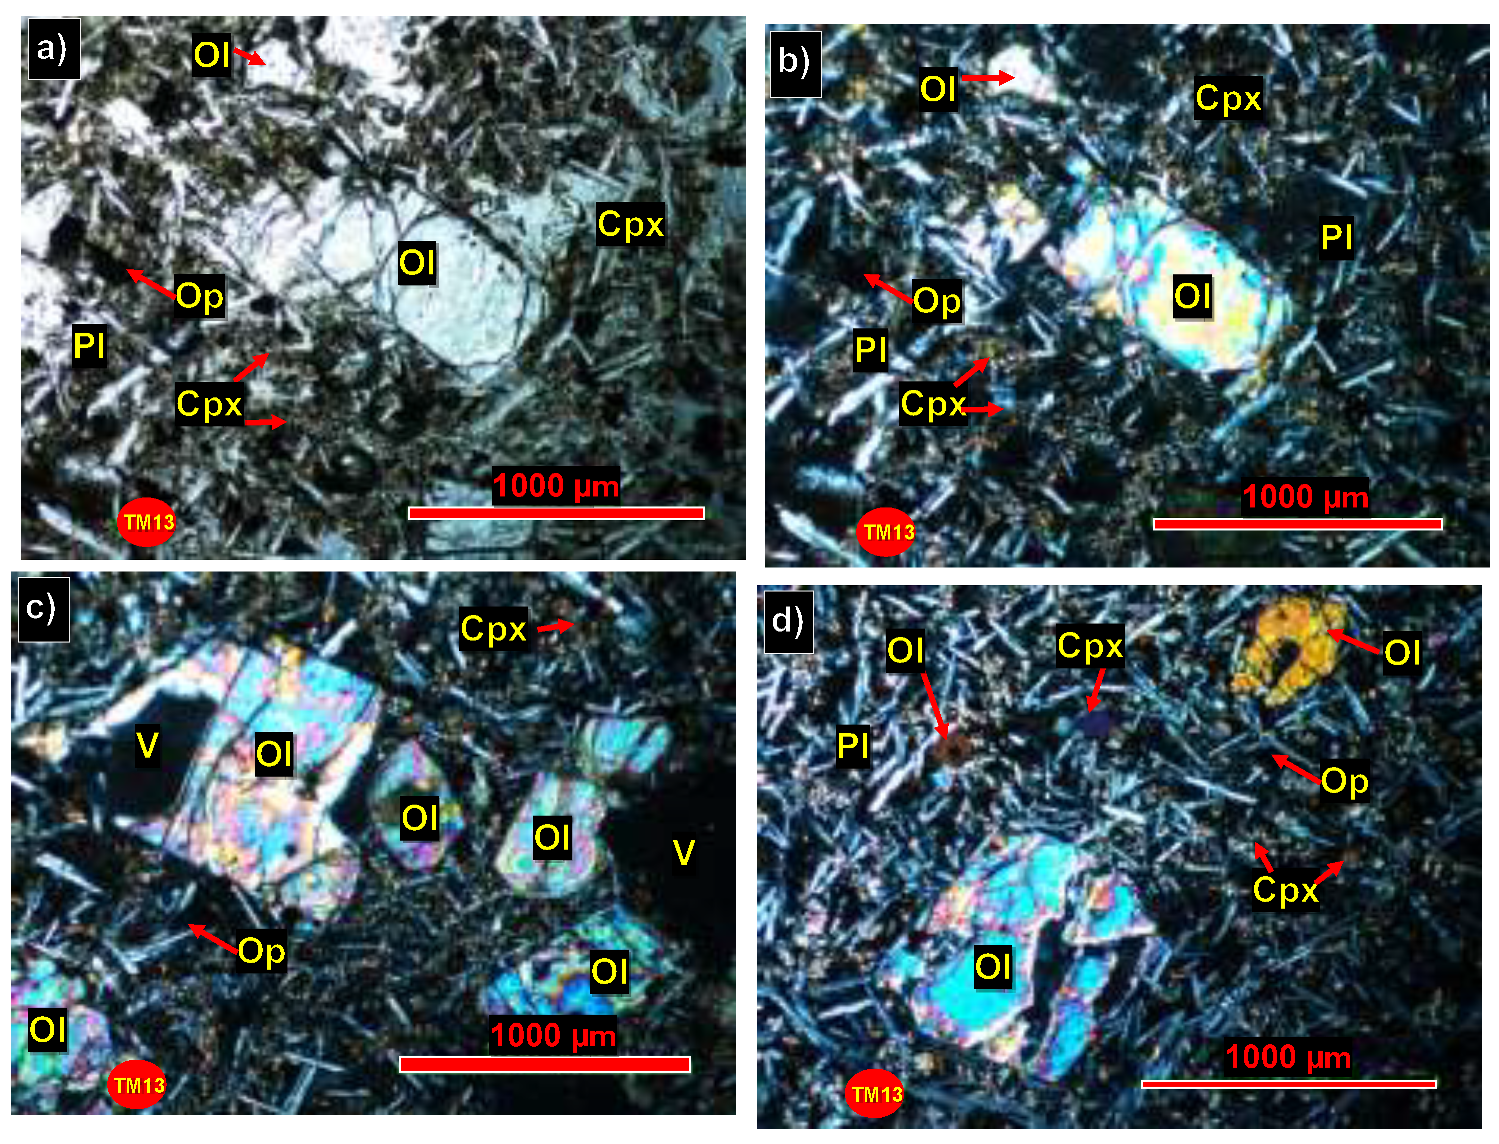
The porphyritic basalt (TM13) is characterized by abundant olivine phenocrysts set within a fine-grained intergranular to interstitial groundmass. Olivine occurs as large euhedral to subhedral phenocrysts, typically 800-1200 μm in size, locally exhibiting internal fractures and weakly resorbed margins. Clinopyroxene also forms sparse subhedral phenocrysts up to 900 μm. Microphenocrysts of plagioclase (120-300 μm) and clinopyroxene (150-350 μm) are common, occurring as lenticular to prismatic crystals dispersed throughout the matrix. The groundmass consists predominantly of plagioclase microliths (<50-80 μm), forming a dense network of needle-like laths around larger phenocrysts, accompanied by fine granular clinopyroxene (<50 μm) and disseminated opaque minerals (<30 μm). Vesicles, where present, are rounded to elongate (400-700 μm).
Figure 5.
Photomicrographs of the micro-porphyritic basalt (TM9) from Meahill showing mineral assemblages and textural features in PPL (a) and XPL (b-d) views. (a) Olivine microphenocrysts and rare phenocrysts surrounded by plagioclase laths, clinopyroxene grains, and opaque oxides set within a fine microlithic groundmass. (b) Olivine grains displaying bright interference colours together with plagioclase laths, granular clinopyroxene, and scattered opaque oxides. (c) Assemblage of olivine, clinopyroxene, plagioclase, and opaque minerals with minor carbonate occurring as irregular patches in the microlithic matrix. (d) Fine-grained groundmass dominated by plagioclase microliths intergrown with clinopyroxene, with vesicles and localized concentrations of opaque oxides and altered olivine. Abbreviations: Ol = Olivine; Pl = Plagioclase; Cpx = Clinopyroxene; Op = Opaque oxides; Cb = Carbonate; V = Vesicle.
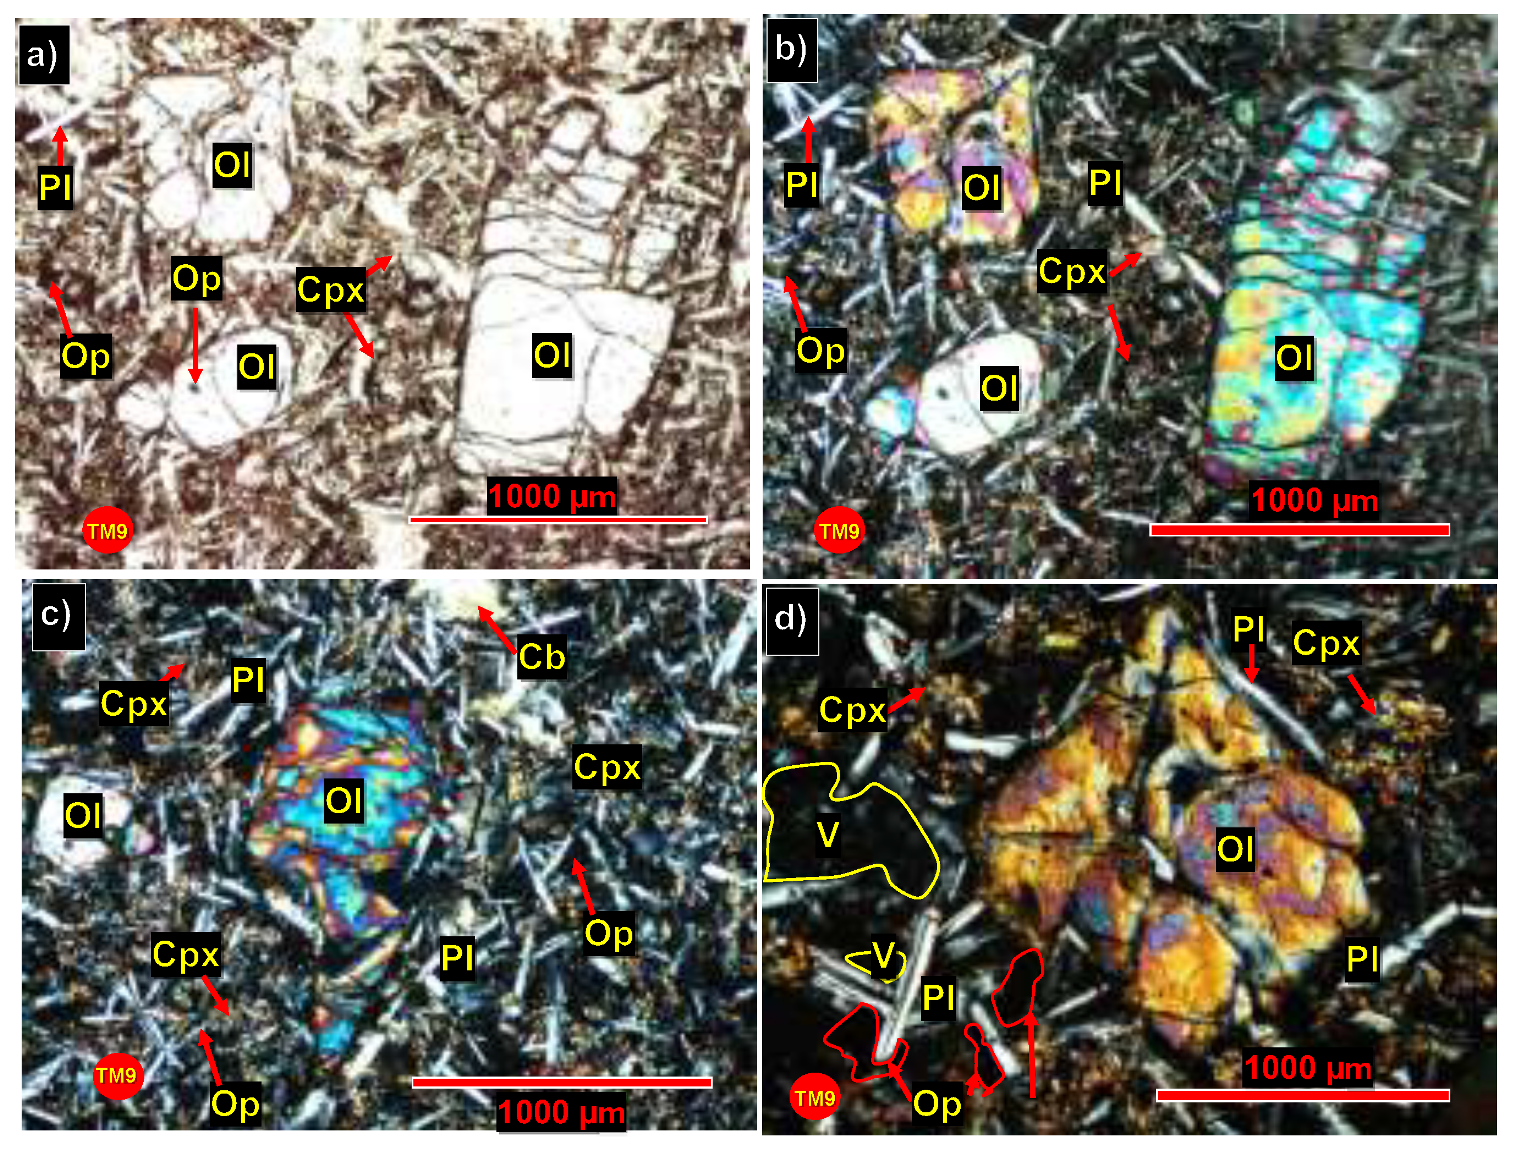
Figure 6.
Photomicrographs of the porphyritic basalt (TM13) from Meahill showing mineral assemblages and textural features in PPL (a) and XPL (b-d) views. (a) Large subhedral to anhedral olivine phenocrysts surrounded by plagioclase laths, clinopyroxene grains, and opaque oxides within a fine microlithic groundmass. (b) Olivine phenocrysts displaying bright interference colours, accompanied by plagioclase and clinopyroxene microphenocrysts and scattered opaque oxides. (c) Porphyritic texture with multiple olivine phenocrysts and vesicles enclosed by dense plagioclase and clinopyroxene microliths. (d) Mixed assemblage of olivine, clinopyroxene, plagioclase, and opaque oxides within a tightly packed microlithic groundmass.
4.2.2. Yemsigi Basalts
The porphyritic basalts MY4 and MY6 from Yemsigi are described separately here but display similar textures and mineral compositions. Both samples are dominated by olivine phenocrysts accompanied by abundant microphenocrysts of olivine, clinopyroxene, and plagioclase. The groundmass in MY4 and MY6 is microlitic and densely packed, consisting mainly of plagioclase laths intergrown with interstitial clinopyroxene and fine opaque minerals. Iddingsite alteration is present in both samples but is more extensive in MY6.
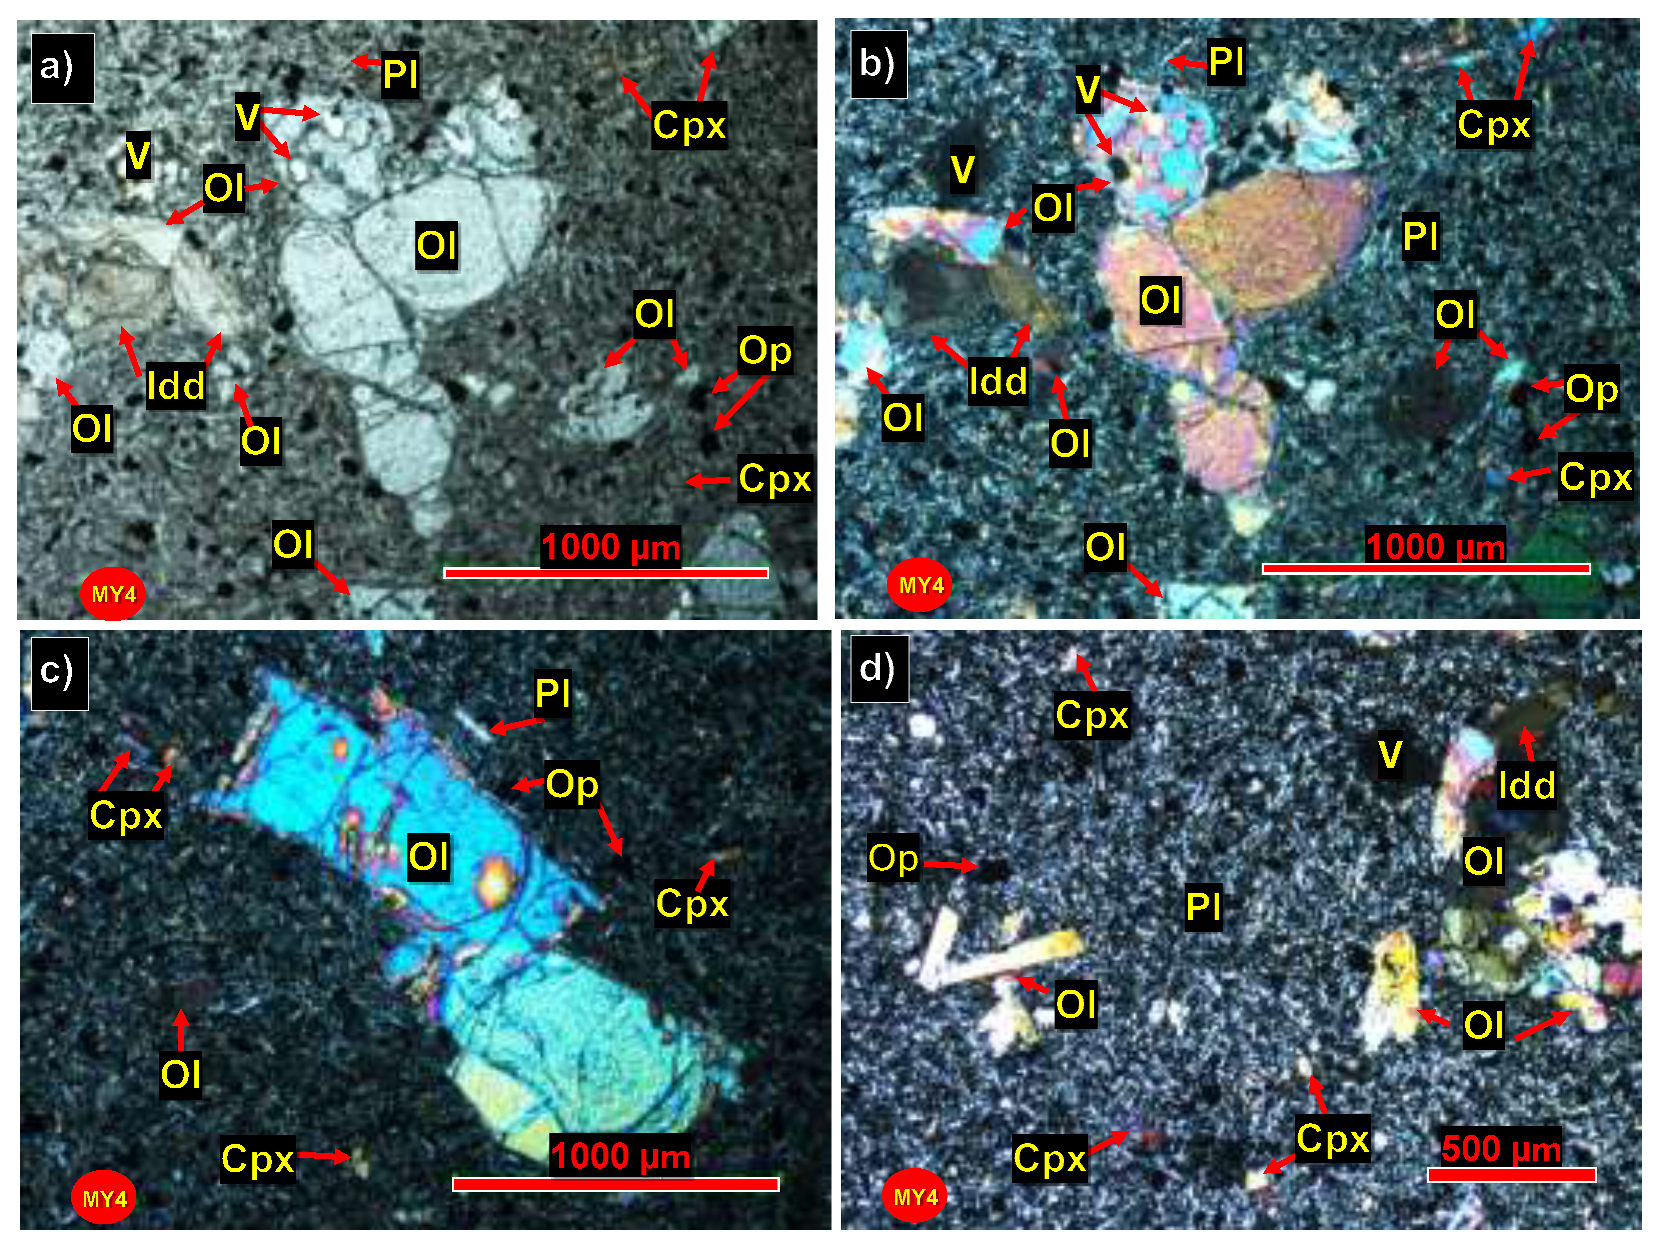
The MY4 basalt contains large olivine phenocrysts ranging from approximately 600-1500 μm, occurring as subhedral to anhedral crystals with internal fracturing and irregular margins. Many of these phenocrysts show partial replacement by iddingsite, visible as reddish-brown alteration zones in plane-polarized light. Clinopyroxene phenocrysts occur less commonly and form subhedral grains up to 800-1000 μm in size. Microphenocrysts of olivine (150-400 μm), clinopyroxene (150-350 μm), plagioclase (120-300 μm), and opaque oxides (100-200 μm) are abundant and distributed throughout the petrographic section. The groundmass is dense and fine-grained, composed predominantly of plagioclase microliths 40-80 μm long, together with interstitial clinopyroxene microliths (<30-60 μm) and fine opaque oxides (<30 μm). Vesicles with diameters of 200-600 μm occur in several areas and are bordered by microlith-rich rims or thin linings of opaque minerals.
Figure 7.
Photomicrographs of the porphyritic basalt (MY4) from the Yemsigi basalts showing mineral assemblages and textural features in PPL (a) and XPL (b-d) views. (a) Large olivine phenocrysts with iddingsite alteration surrounded by plagioclase laths, clinopyroxene grains, opaque oxides, and vesicles within a fine microlithic groundmass. (b) Olivine phenocrysts displaying bright interference colours accompanied by plagioclase, clinopyroxene, opaque oxides, and vesicles dispersed throughout the matrix. (c) Assemblage of olivine, clinopyroxene, plagioclase, and opaque oxides with minor carbonate occurring as irregular patches in the microlithic groundmass. (d) Fine-grained matrix dominated by plagioclase and clinopyroxene microliths with vesicles and extensive iddingsite alteration around olivine grains. Abbreviations: Ol = Olivine; Pl = Plagioclase; Cpx = Clinopyroxene; Op = Opaque oxides; Idd = Iddingsite; Cb = Carbonate; V = Vesicle.
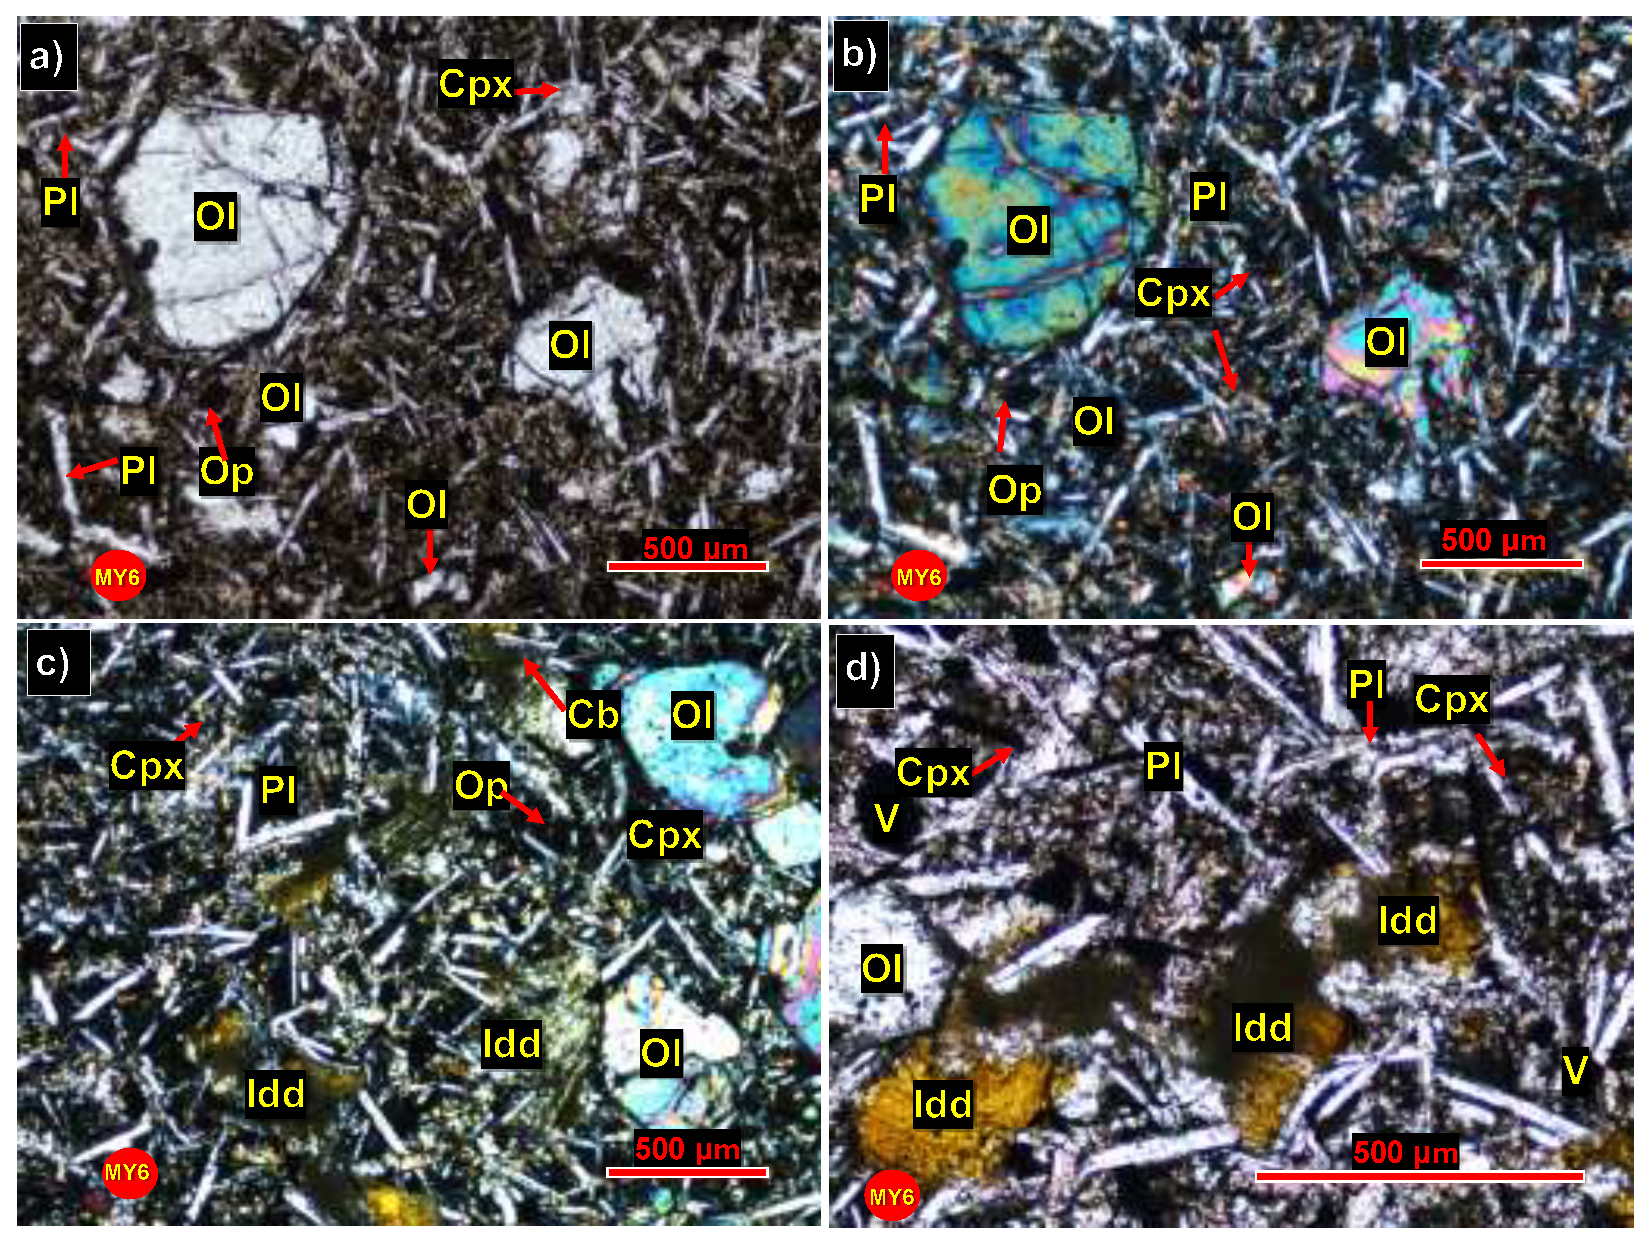
The MY6 basalt displays a porphyritic texture like MY4, although the phenocrysts are generally smaller. Olivine phenocrysts range from approximately 300-700 μm and occur as subhedral to anhedral crystals with internal fracturing. Clinopyroxene phenocrysts are present and occur as subhedral crystals measuring approximately 300-600 μm. Microphenocrysts are abundant and include olivine (120-300 μm), clinopyroxene (150-300 μm), plagioclase (100-250 μm), and opaque minerals (80-150 μm). The groundmass consists of tightly packed plagioclase microliths 30-70 μm long, interstitial clinopyroxene microliths (<30-50 μm), and fine opaque minerals (<25 μm) dispersed throughout the matrix. Iddingsite is common in MY6 and forms yellow-brown replacement patches around altered olivine grains. Vesicles 150-400 μm in diameter occur sparingly and are locally filled or bordered by fine microliths.
Figure 8.
Photomicrographs of the porphyritic basalt (MY6) from the Yemsigi basalts showing mineral assemblages and textural features in PPL (a) and XPL (b-d) views. (a) Subhedral to anhedral olivine phenocrysts set within a fine microlithic groundmass of plagioclase laths, clinopyroxene grains, and scattered opaque oxides. (b) Olivine and clinopyroxene grains displaying bright interference colours together with plagioclase laths and opaque oxides dispersed throughout the matrix. (c) Fine-grained groundmass composed of plagioclase and clinopyroxene microliths with opaques, minor carbonate patches, and localized olivine alteration to iddingsite. (d) Dense microlithic texture dominated by plagioclase and clinopyroxene, with vesicles and abundant iddingsite replacement surrounding altered olivine grains.
4.2.3. Opaque Minerals and Vesicle Characteristics
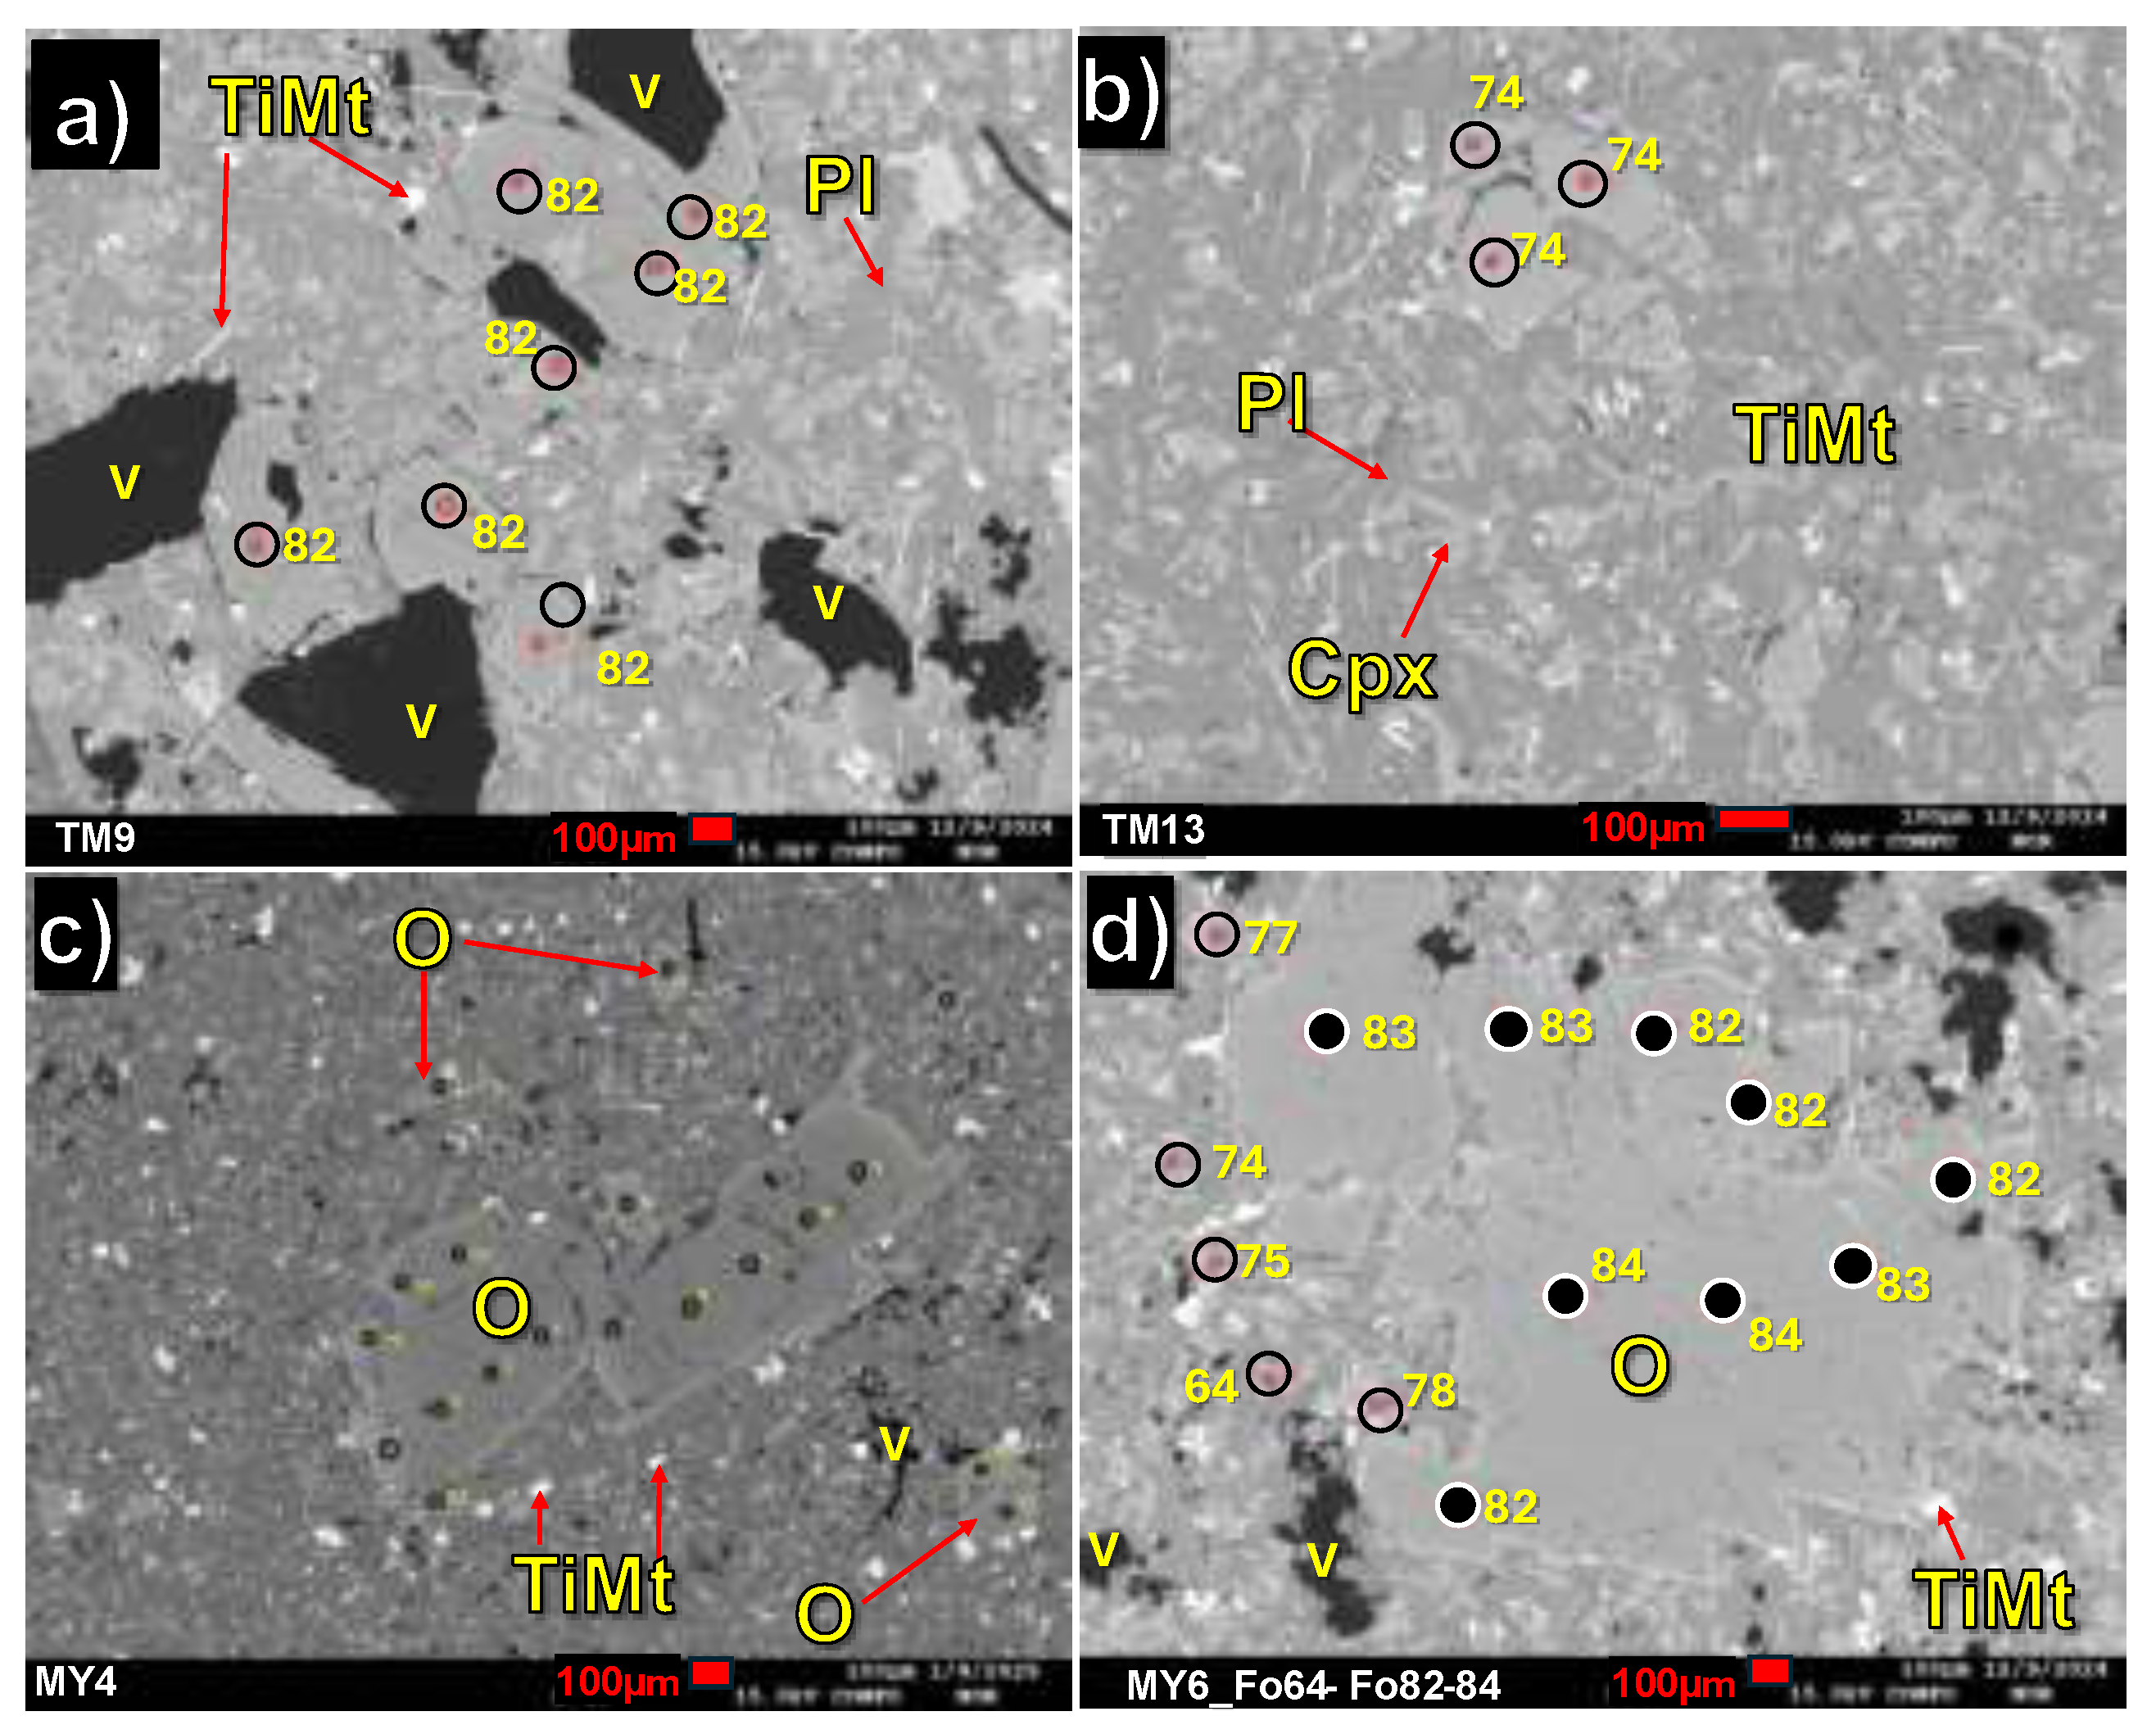
Using SEM-EDS, the opaque mineral phase in all analyzed samples is identified predominantly as titanomagnetite. Titanomagnetite occurs as bright, opaque grains in BSE images, displaying a range of crystal textures including euhedral blocky crystals, subhedral to anhedral equant grains, elongate laths, and irregular interstitial patches. Many grains appear as discrete crystals within the groundmass, while others occur along grain boundaries or as small clusters intergrown with plagioclase and clinopyroxene. Refer to the BSE images in Appendix A.
In the Meahill basalts (TM9 and TM13), vesicles are abundant and occur throughout the groundmass. They range from numerous small, isolated pores to larger and more irregular cavities. The Yemsigi basalts (MY4 and MY6) contain fewer vesicles than the Meahill samples. Vesicles in the Yemsigi basalts are generally smaller, occurring mostly as rounded to subrounded voids distributed sparsely within the matrix. MY6 contains slightly more vesicles than MY4, but overall vesicle density remains significantly lower than in Meahill basalts.
Figure 9.
BSE images of basalts from Meahill (a-b) and Yemsigi (c-d) showing textural variations. Titanomagnetite has a brighter appearance with various crystal textures.
Figure 9.
BSE images of basalts from Meahill (a-b) and Yemsigi (c-d) showing textural variations. Titanomagnetite has a brighter appearance with various crystal textures.
4.3. Mineral Chemistry
4.3.1. Olivine Composition
The olivine phenocrysts from both the Meahill basalts and Yemsigi basalts were measured by EPMA and the calculated forsterite values [Fo = 100*Mg/(Mg + Fe)] calculated. The full EPMA dataset is presented in Appendix A, Table A1.
To examine how elemental concentrations vary during olivine crystallization, oxide concentrations (NiO and CaO) were plotted against forsterite content. Figures 10 shows the compositional variations for olivine crystals from the Meahill basalt (n = 61) and the Yemsigi basalt (n = 79), respectively.
Olivine crystals from the Meahill basalt display forsterite values ranging from Fo63 to Fo84 with NiO concentrations increasing with increasing Fo content, whereas Ca shows decreasing concentrations with increasing Fo content (Figure 10 a, c).
Olivine crystals from the Yemsigi basalts exhibit forsterite values ranging from Fo67 to Fo86. Similarly, NiO concentrations increase with increasing Fo content, and CaO decrease with increasing Fo content (Figure 10 b, d).
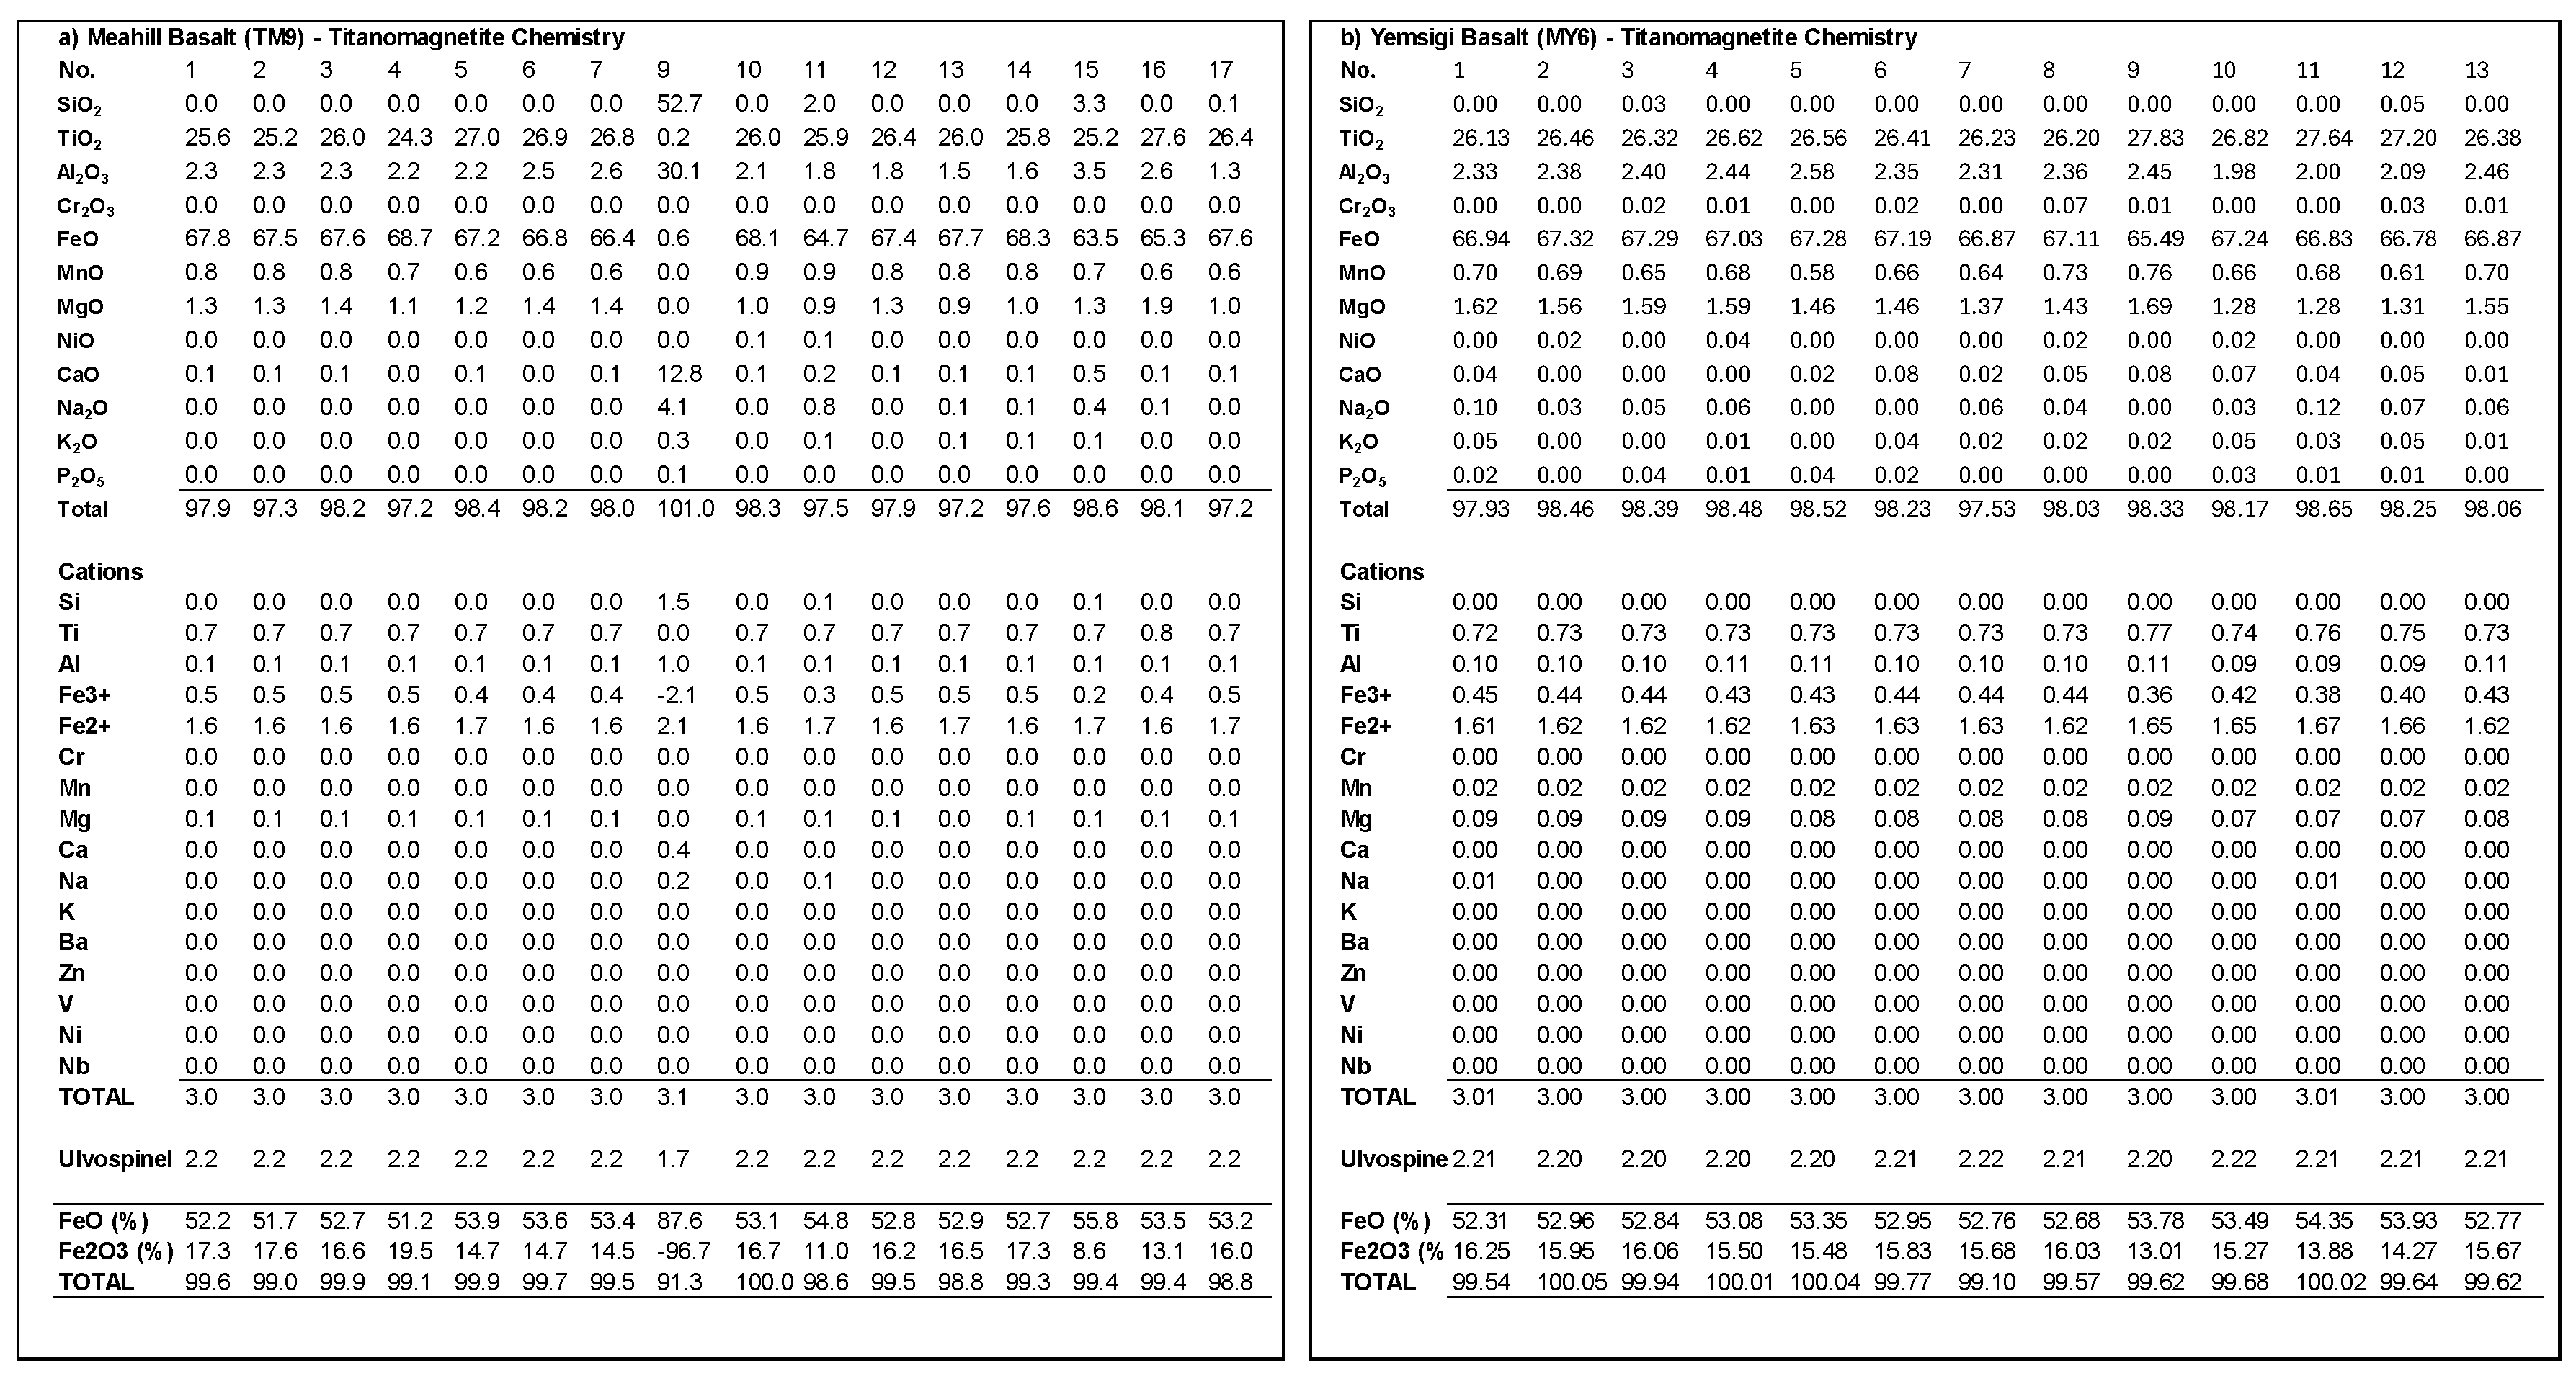
4.3.2. Clinopyroxene, Plagioclase and Titanomagnetite Classification
The chemical compositions of the clinopyroxene, plagioclase, and titanomagnetite are presented in Appendix A, Table A2, Table A3 and Table A4, respectively. The ternary classification diagrams in Figure 11 illustrate the mineral classifications for clinopyroxene, plagioclase, and titanomagnetite.
The clinopyroxenes from the Meahill and Yemsigi basalts plot predominantly within the diopside field, with wollastonite components ranging from Wo47 to Wo49 (Figure 11a). Plagioclase compositions range from An39 to An63, falling within the Andesine to Labradorite fields (Figure 11b). The titanomagnetite data display variations in TiO2 and FeO that are consistent with the magnetite-ulvöspinel solid-solution series (Figure 11c).
4.4. Whole-Rock Geochemistry
Whole-rock major, trace, and rare earth element data, together with loss on ignition (LOI) values, are presented in Appendix B. The Yemsigi basalts show low LOI values (0.2-1.31 wt%), whereas the Meahill basalts display higher LOI values of up to ~6 wt%, indicating a greater influence of secondary volatile components. To minimize the effects of residual volatiles and alteration, all major oxide data were recalculated to an anhydrous (volatile-free) basis.
Figure 12 presents Harker variation diagrams comparing Meahill and Yemsigi basalt suites. Both datasets define a narrow SiO₂ range of approximately 46-50 wt%. Loss on ignition values are higher and more variable in the Yemsigi basalts, whereas Meahill basalts generally display lower LOI values with a more restricted range (Figure 12a). MgO contents overlap between the two groups, with Meahill basalts clustering between ~8-9 wt% and Yemsigi basalts extending to slightly higher values of up to ~10 wt% (Figure 12b). CaO values show substantial overlap, with Yemsigi basalts plotting at marginally higher CaO contents at comparable SiO₂ (Figure 12c). Fe₂O₃ contents also overlap between the two basalt groups, although Yemsigi basalts display a slightly broader range compared to the more tightly clustered Meahill basalts (Figure 12d). TiO₂ values are similar for both groups, with Meahill basalts exhibiting a slightly wider spread, including one higher TiO₂ value relative to the main cluster (Figure 12e). Al₂O₃ contents for both datasets fall within a narrow range of approximately 13-15 wt%, showing strong overlap and limited variability (Figure 12f).
Figure 13 presents whole-rock classifications using the Total Alkali-Silica (TAS) and SiO₂-K₂O diagrams. On the TAS diagram (Figure 13a), Meahill and Yemsigi basalts plot within a restricted compositional range of ~47-55 wt% SiO₂ and ~3-6 wt% (Na₂O + K₂O). Meahill basalts cluster predominantly within the basalt field, with minor extension into the basaltic andesite field. Yemsigi basalts overlap the Meahill field but display a broader dispersion, extending further into the basaltic andesite field and exhibiting slightly higher total alkali contents at comparable SiO₂.
On the SiO₂-K₂O diagram (Figure 13b), both basalt suites plot mainly within the medium-K calc-alkaline field, with limited overlap into the high-K calc-alkaline field. Meahill basalts form a relatively tight cluster, whereas Yemsigi basalts show a wider spread in K₂O at similar SiO₂ contents. Generally, the two basalt suites display substantial compositional overlaps.
In order to examine variation trends more clearly, Figure 14 presents major- and trace-element variation diagrams plotted against MgO (wt%) for the Meahill and Yemsigi basalts. Meahill basalts generally plot at slightly higher MgO contents and show tighter clustering for most major elements, particularly Al₂O₃ (Figure 14b), Fe₂O₃ (Figure 14d), Na₂O (Figure 14h), and MnO (Figure 14i). Yemsigi basalts overlap the Meahill dataset across all panels but display a broader dispersion in several oxides, including CaO (Figure 14c), K₂O (Figure 14f), Na₂O (Figure 14h), and MnO (Figure 14i). Trace elements Cr and Ni show overlapping ranges for both basalt groups, with Yemsigi basalts extending to slightly higher values at comparable MgO contents (Figure 14j, k).
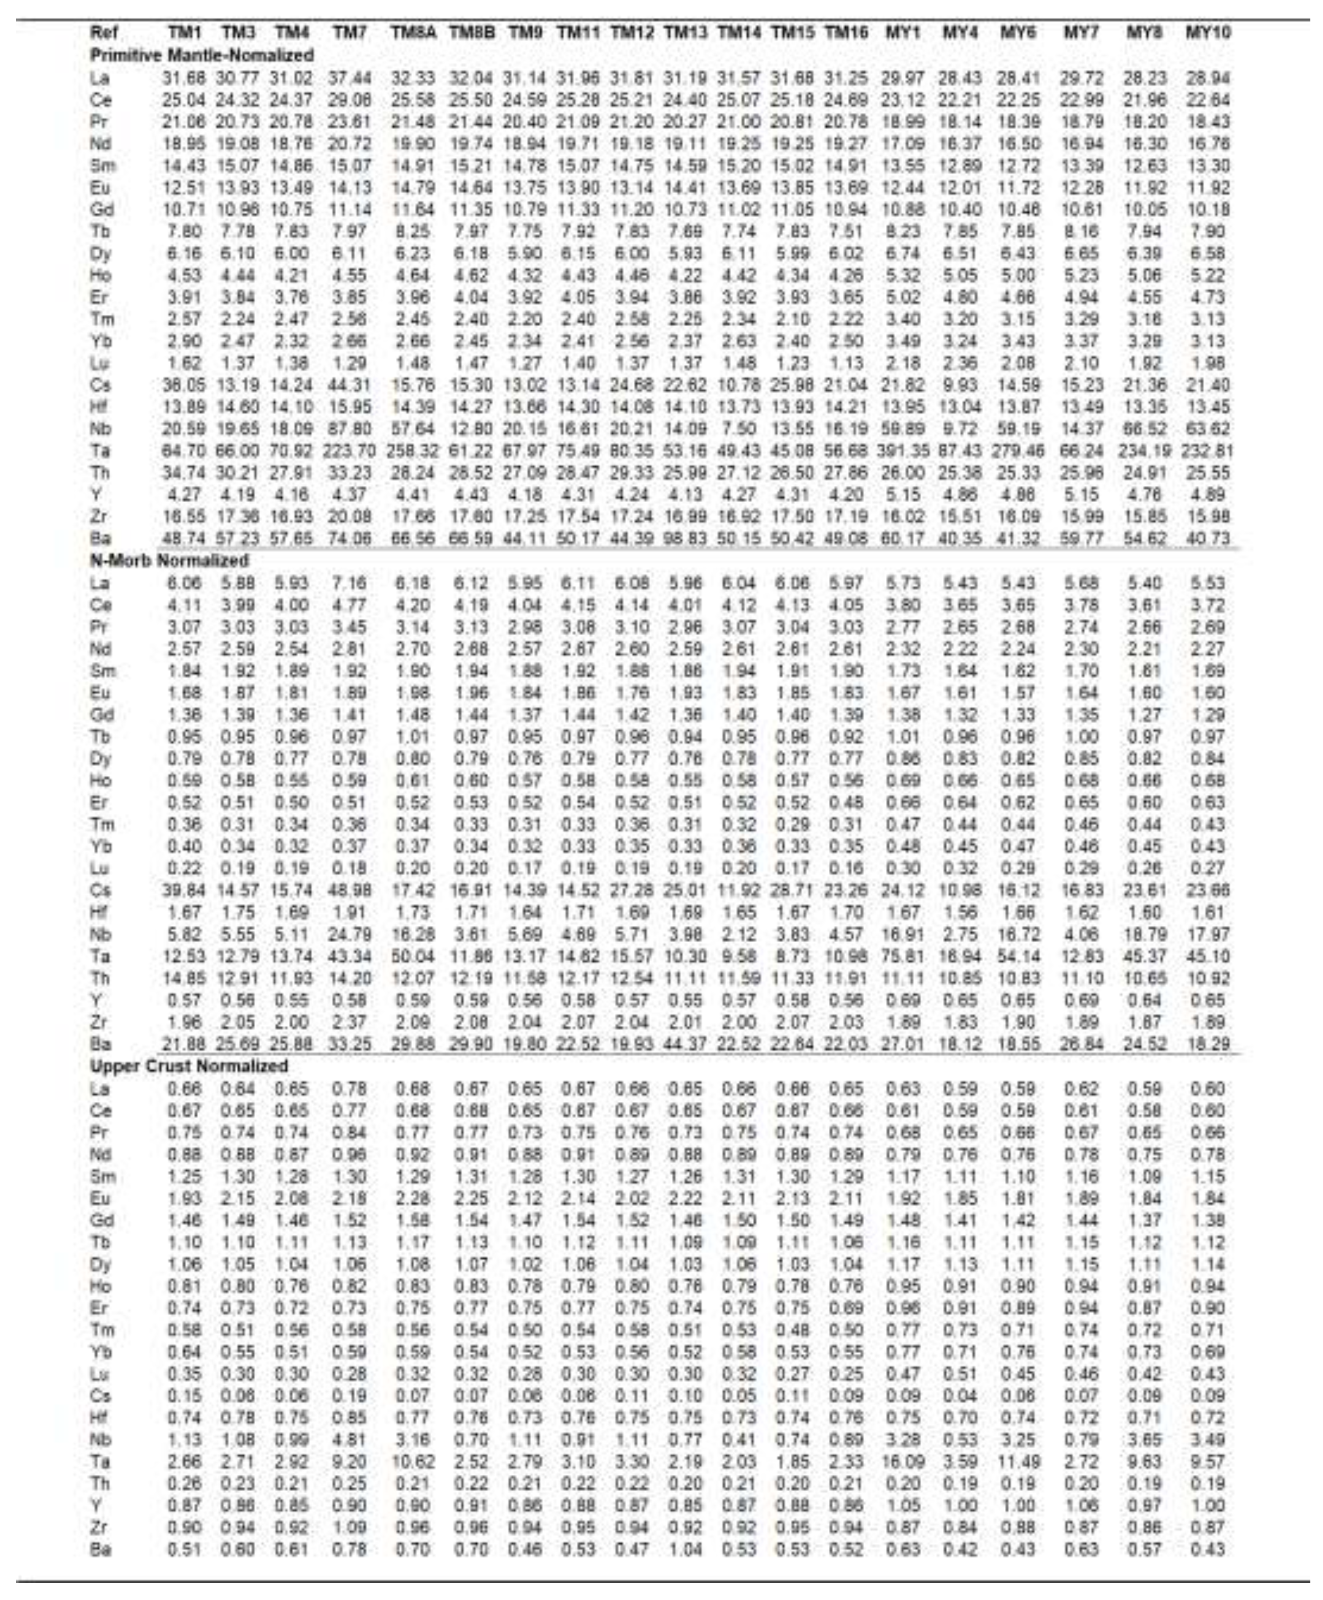
The REE and trace element concentrations were normalized to Normal Mid-Ocean Ridge Basalt (N-MORB) and Upper Crust values and are shown in the spider diagrams in Figure 15. Both normalized patterns display a consistent positive Eu anomaly (Figure 15a).
High-field-strength elements (HFSE; e.g., Y, Zr, Nb, Hf, Th) and large-ion lithophile elements (LILE; e.g., Ba, Cs) show generally coherent patterns, with positive Ta and Nb anomalies that deviate from the general trace-element trends (Figure 15b).
For comparison, volcanic rocks from the Fly Highlands (Mt. Bosavi and Mt. Murray; Mackenzie & Johnson, 1984 [23]) are included on the REE diagram (Figure 15a); however, incomplete datasets preclude their inclusion in Figure 15b.
Using the immobile trace element discrimination diagrams in Figure 16, after Saccani (2015) [33] and Peace and Gale (1977) [34] in Rollinson and Pease (2021) [35], the tectonic setting of the magmas can be inferred. The Meahill and Yemsigi basalts fall within the Within-Plate Basalt field (Figure 16a) and plot adjacent to the Convergent Plate Margin field and generally plot within the Divergent Plate Setting field corresponding to non-subduction oceanic and rifted-margin environments (Figure 16b).
Also plotted are samples from the PNG Central Highlands in the Fold and Thrust Belt (Mt Murry, Mt Hagen, Mt Bosavi), along with those from the active volcanic arc (Rabaul), and samples from Northeast Queensland (NEQld) taken from the Georoc database [36] for comparison. Due to incomplete data sets, some samples were not shown on Figure 16b.
4.3. K-Ar Age
The measured radiogenic 40Ar content was 3.64 × 10⁻⁸ cc STP/g ± 0.57, and the calculated K-Ar age is 0.57 ± 0.09 million years (Ma) shown on Table 1.
Table 1.
K-Ar Results.
5. Discussion
The discovery and characterization of basaltic outcrops from Meahill and Yemsigi on the Fly Platform provide an opportunity to enhance our understanding of the tectono-magmatic evolution of the southwestern margin of PNG. The K-Ar age of 0.57 Ma constrains the timing of the Meahill and Yemsigi volcanism to the Late Pleistocene.
5.1. Volcanism and Post-Magmatic Modification
Field observations and petrographic studies show that the Meahill and Yemsigi basalts experienced different conditions during and after eruption. At Meahill, the rocks show strong evidence for an explosive eruption. Fine welded tuffs with basaltic clasts and basalts that are highly vesicular indicate rapid magma ascent, strong degassing, and fragmentation during eruption. Olivine crystals show cracking, dissolved rims, and partial alteration to iddingsite, indicating that the crystals were affected by rapid pressure drop, fast cooling, and exposure to oxidizing fluids. The large and abundant vesicles further confirm that the magma contained an exsolving gas phase and erupted in a violent manner.
At Yemsigi, the eruption was comparatively less violent, but experienced stronger alteration. Olivine crystals are heavily altered and often completely replaced by iddingsite, showing that the rocks interacted with water-rich and oxidizing fluids over a prolonged period of time. Vesicles are fewer and smaller, indicating the magma exsolved comparatively less gas during the eruption. The porphyritic textures and more altered minerals suggest slow cooling and more intense post-magmatic alteration.
In general, the Meahill basalts record an explosive eruption, while the Yemsigi basalts record a more effusive eruption followed by much stronger hydration and oxidation subsequent to emplacement.
5.2. Magmatic Evolution
The magmatic history of rocks is recorded in their mineral textures and compositions (Gill, 2010; Burchardt, 2018) [37,38]. In typical basaltic systems, fractional crystallization of olivine, pyroxene, plagioclase, and titanomagnetite follows predictable magmatic differentiation trends, although these trends may vary depending on the physicochemical conditions of the magmatic environment.
The composition of olivine reflects both the nature of parental melt and the extent of fractional crystallization, making it a robust indicator of magma evolution. In both the Meahill and Yemsigi basalt suites, olivine phenocryst compositions range from Fo₈₆ to Fo₆₄ (Section 4.3.1), with higher Fo contents recording crystallization from a minimally evolved melt (Roeder & Emslie, 1970; Kushiro, 1998; Rasmussen et al., 2020)[39,40,41], whereas lower Fo values signify progressive fractionation and melt differentiation (Namur et al., 2010; Filiberto & Dasgupta, 2011; Latypov et al., 2020)[42,43,44]. As magmatic evolution continued, the subsequent crystallization of pyroxene, plagioclase, and titanomagnetite further modified the composition of the residual melt.
Magma chemistry, particularly the trace and REEs, are useful for interpretation of magma source characteristics as these elements remain immobile during alteration and preserve primary magmatic signatures (Rollinson & Pease, 2021) [35]. There is a pronounced positive Eu anomaly on the REE spider diagram (see Figure 15a), consistent with shallow-level plagioclase crystallization and accumulation in the melt. Furthermore, the distinct positive Nb-Ta anomalies (see Figure 15b), are characteristic of OIB-like mantle sources and are typically associated with intra-plate magmatic settings (e.g., Zhou et al., 2023; Singtuen & Phajan, 2021; Dada et al., 2024; Jankovics et al., 2012, 2019) [45,46,47,48,49].
5.3. Tectono-Magmatic Setting for Meahill and Yemsigi Basalts
The Meahill and Yemsigi basalts display REE patterns broadly similar to that of the Fly Highlands volcanics (e.g., Mt Bosavi and Mt Murry; Mackenzie & Johnson, 1984 [23]; Figure 15a), although they lack the pronounced subduction-related HFSE enrichments and Nd-Ta depletion characteristic of arc magmas (Figure 15b). This distinction becomes clearer when examining the bivariate tectonic discrimination diagrams on Figure 16. Both the Meahill and Yemsigi basalts plot within the intra-plate fields.
There are several tectono-magmatic settings that can give rise to intra-plate basaltic magmatism; the most common settings being shallow mantle melting associated with mantle decompression in a rift-related setting, or deep mantle melting associated with a deep-seated plume activity (e.g., Zhou et al., 2023; Singtuen & Phajan, 2021; Dada, et al., 2024)[45,46,47] The Fly Platform intra-plate basaltic magmatism can be compared with similar rock types in the region to assist in the interpretation of permissible settings.
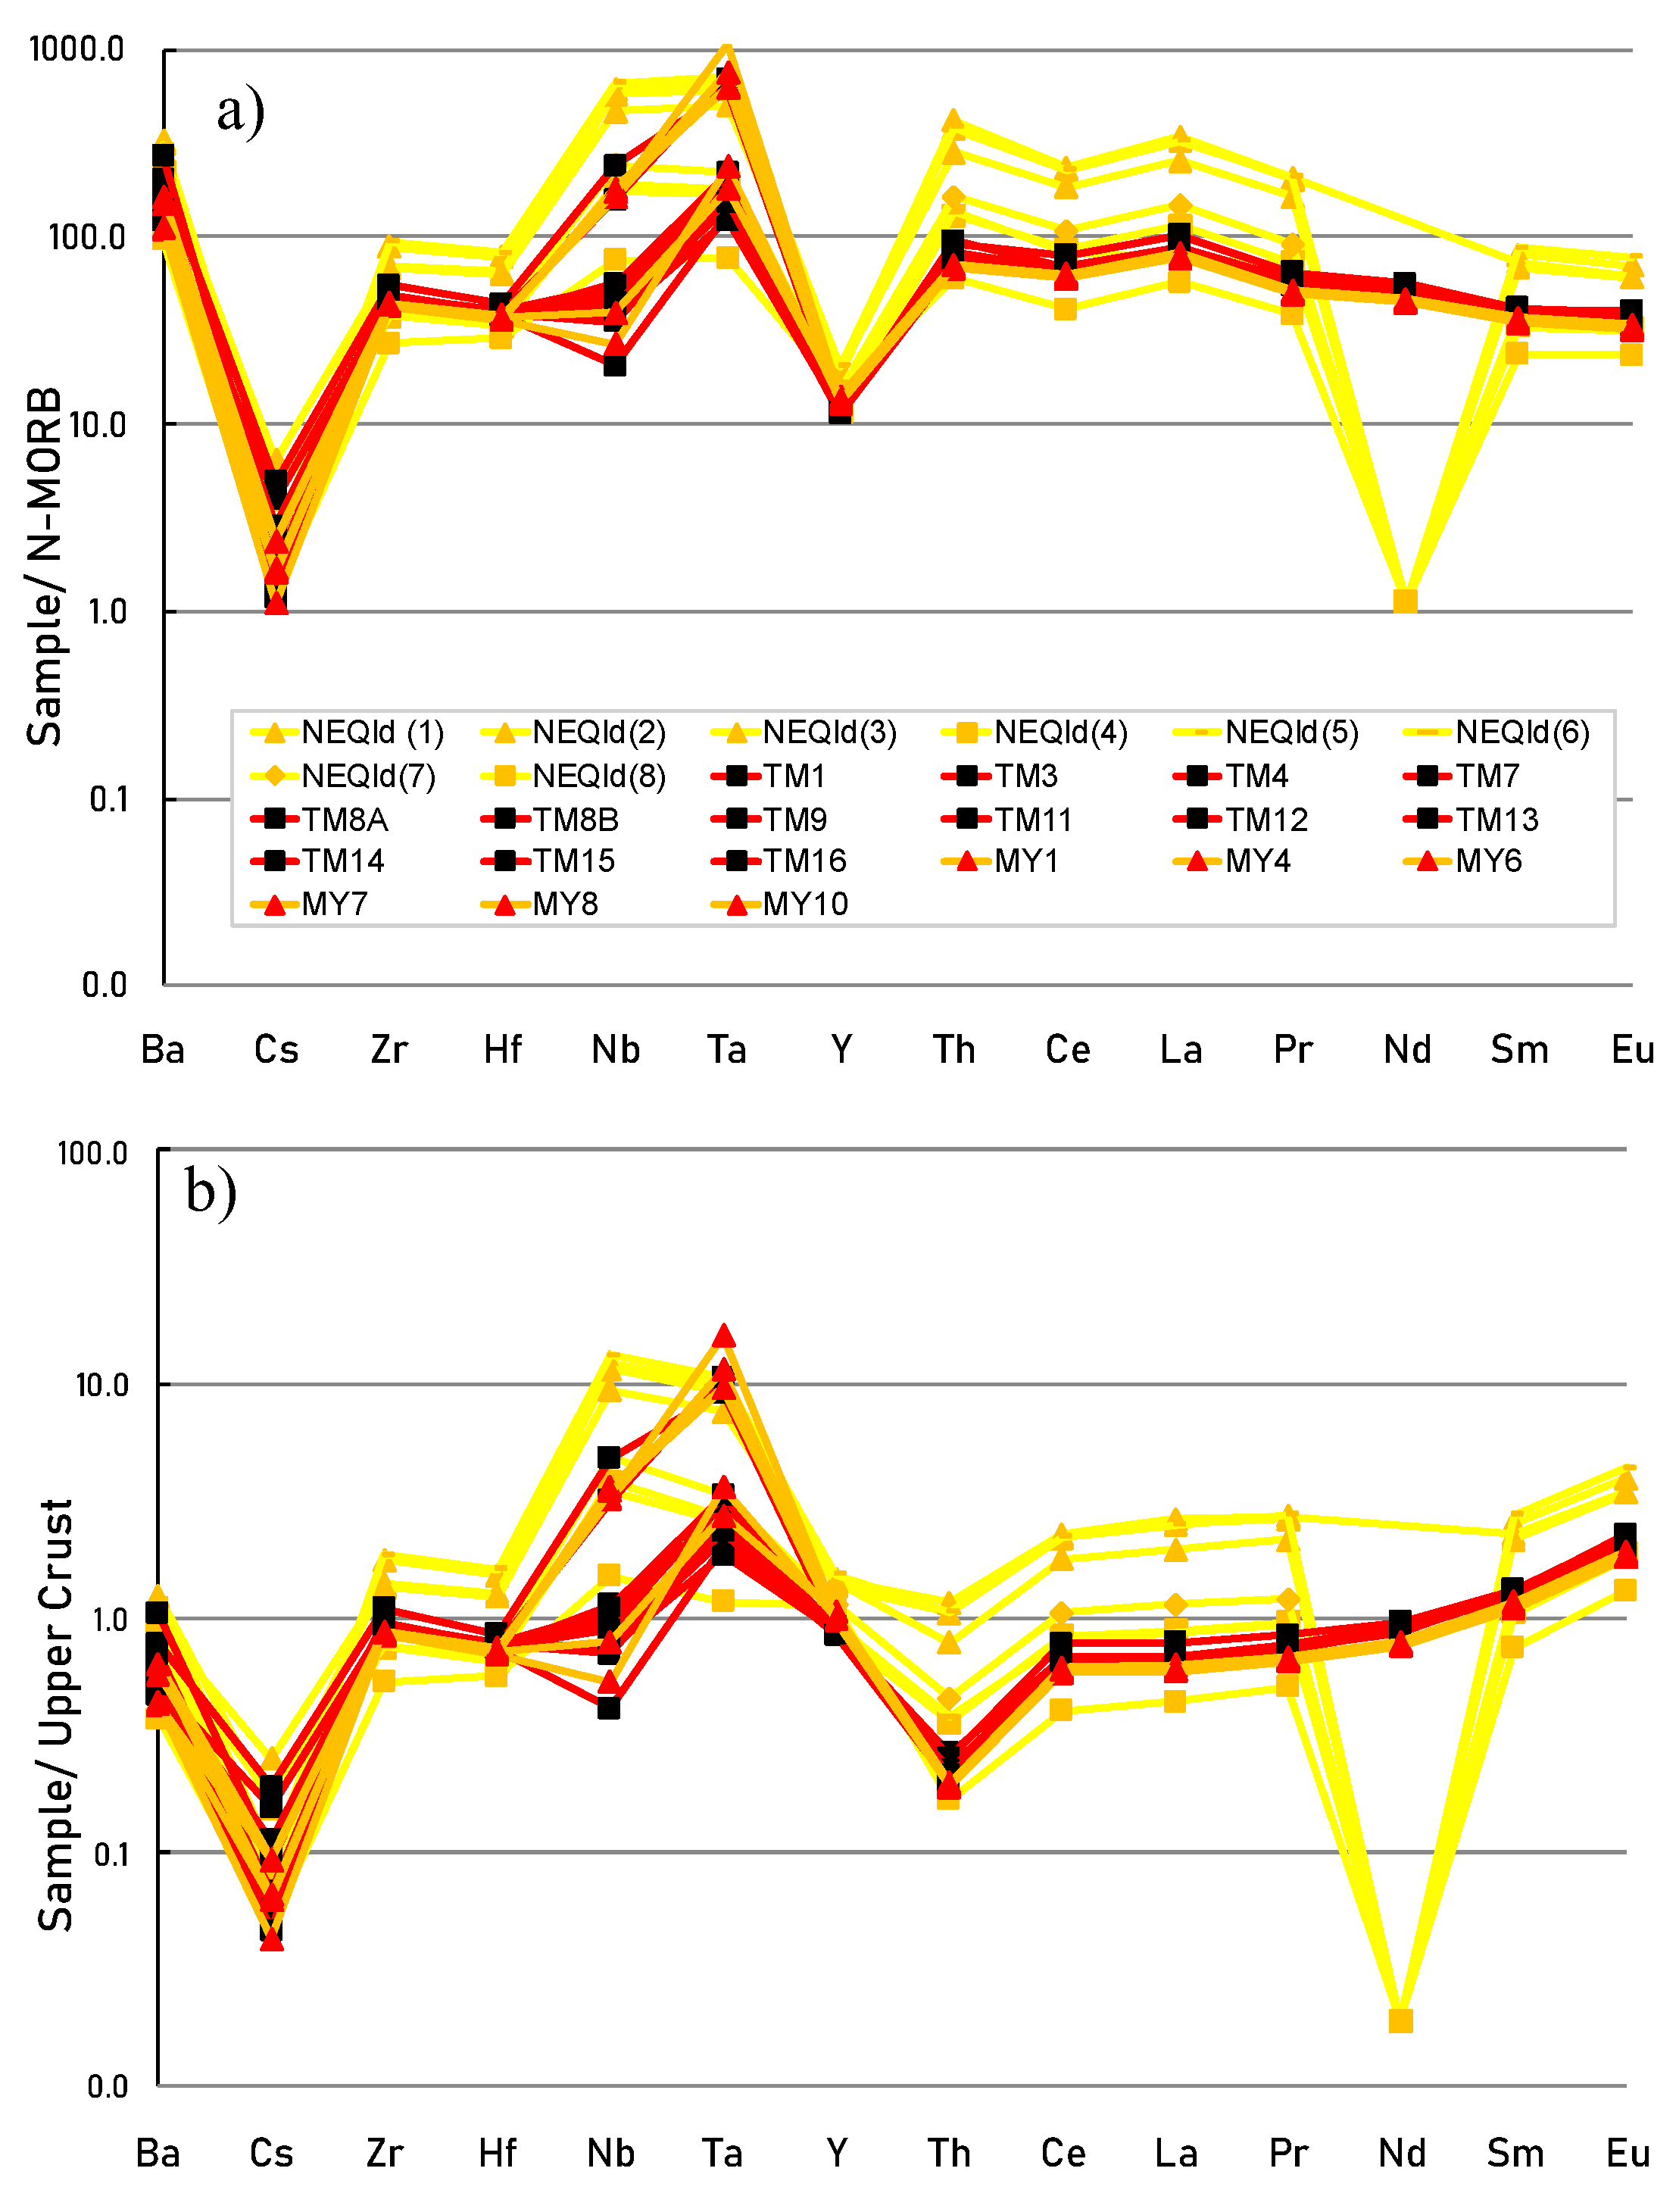
The Pleistocene age for Fly Platform intra-plate volcanism coincides with a period of widespread volcanic activity in NE Australia (Bulois, et al., 2017)[11]. A series of Late Cenozoic intraplate volcanic provinces occur across northeastern Australia (Meeuws et al., 2016; Cohen et al., 2017)[25,50], including the late Pliocene-Pleistocene Atherton, Nulla, Bundaberg-Boyne, and Sturgeon fields in northeastern Queensland (see Figure 17). Moreover, the geochemical signature of the Fly Platform intra-plate volcanism closely overlaps with the NE Queensland basaltic lava fields (Figure 18; e.g., (Meeuws, , 2016)[25]. The geochemical affinity between the Meahill, Yemsigi and NE Queensland basalts suggests comparable magmatic settings, with both sample sets exhibiting broadly similar REE trends, with enriched light REE (LREE), and relatively flat middle to heavy REE (MREE-HREE) segments.
Northeast Queensland basalts exhibit more pronounced negative Nd anomalies. This may be explained due to derivation from an older, more depleted, and heterogeneous mantle source that had undergone earlier melt extraction, experienced stronger metasomatic modification, or interacted with older crustal components. The Meahill and Yemsigi basalts may tap a less depleted or more mixed mantle source associated with early Cenozoic rift-related magmatism along the Coral Sea margin (e.g. Gaina et al., 1999) [51], potentially resulting in weaker Nd depletion (Mullen et al., 2014; Sani et al., 2023) [52,53].
The mantle structure beneath this region can provide additional context for understanding the potential origin of the intra-plate basalts. Hall and Spakman (2002) [54] identified several mantle anomalies in their regional tomographic study, and both the Fly Platform and NE Queensland magmatism spatially coincide with a similar lower mantle anomaly (defined as A8 in Hall and Spakman, 2002 [54]). This anomaly was interpreted by Hall and Spakman (2002) [54] as an older subducted slab fragment sinking into the mantle. Its presence may have modified regional mantle flow patterns, promoting localized zones of upwelling, capable of sustaining intra-plate basaltic volcanism.
Another important distinguishing feature is the positive Nb-Ta anomalies in the regional intra-plate basalt provinces that is characteristic of intra-plate basalts (Pearce, 1983; Hofmann, 1997; Condie, 2005) [55,56,57]. Decoupling of the Nb-Ta signature with Ta enrichment compared with Nb has previously been interpreted to be consistent with melting in the presence of residual rutile in the source, where rutile preferentially retains Nb while allowing Ta to enter the melt (e.g., Foley et al., 2000; Kamber et al., 2003; Schmidt et al., 2004; Klemme et al., 2005) [58,59,60,61]. Such signatures typically reflect the involvement of recycled crustal components and residual slabs in the mantle source. The lower mantle anomaly spatially correlates with residual slab derived geochemical signatures in both the Fly Platform and NE Queensland intra-plate basalt provinces. These integrated lines of evidence provides plausible mechanism linking the volcanism to a deep-seated source, however, more work is required to establish a conclusive link.
There is an absence of evidence in support of a rift-related model for the origin of the intra-plate basaltic volcanism in southern PNG and NE Queensland. The youngest active rifting ceased with the termination of Coral Sea rifting at ~52 Ma (e.g. Gaina et al., 1999[51]), and no geologic features can be interpreted as related to active extensional tectonism at the present day (e.g. normal faulting, basin formation, seafloor spreading).
Therefore, the ~0.57 Ma Meahill and Yemsigi basalts are interpreted as a potential northern continuation of the NE Queensland intra-plate volcanic province and inferred to be derived from melting of residual slab material represented by a lower mantle anomaly.
6. Conclusion
This study utilized integrated field observations, petrographic analysis, mineral chemistry, whole-rock geochemistry, and K-Ar geochronology, to provide the first documentation of Pleistocene basaltic volcanism on the Fly Platform. Although the Meahill and Yemsigi basalts were derived from a broadly similar magma source, they record contrasting volcanic and emplacement histories. Field relationships and textural characteristics indicate that Meahill basalts experienced a more explosive eruption, whereas Yemsigi basalts record a comparatively more effusive eruptive phase followed by more extensive post-magmatic alteration. The K-Ar age of 0.57 ± 0.09 Ma for intra-plate volcanism post-dates the main phase of Fly-Highlands arc volcanism. The REE and HFSE (e.g., Nb, Ta, and Eu) geochemical signatures are similar to NE Queensland intra-plate basaltic lava fields. A common origin for the two volcanic provinces is inferred, and the magmas are interpreted to be derived from older subducted slab material indicated by a lower mantle anomaly.
Funding
This research study is supported by the Government and people of Japan through the Japan International Cooperation Agency (JICA) under the Kizuna Scholarship Program offered to developing countries including Papua New Guinea to which the co-author is a recipient of.
Conflicts of Interest
The authors declare that there is no conflict of interest related to this study. No financial, personal, or professional relationships have influenced the design, execution, interpretation, or presentation of the research findings. The data and conclusions pre-sented in this manuscript are solely the result of independent academic research, without any external influence from funding agencies, commercial entities, or other organizations.
Acknowledgments
The authors thank the reviewers for their help, which greatly improved the manuscript. We acknowledge the support from Akita University, Earth Resources Science , the JICA Scholarship Program of Japan, and the Mineral Resources Authority (MRA) of Papua New Guinea. Special thanks to the staff of the Geological Survey Division of MRA for the field assistance and geological discussions.
Appendix A
Table A1.
Olivine Chemistry Results from EPMA analyses.
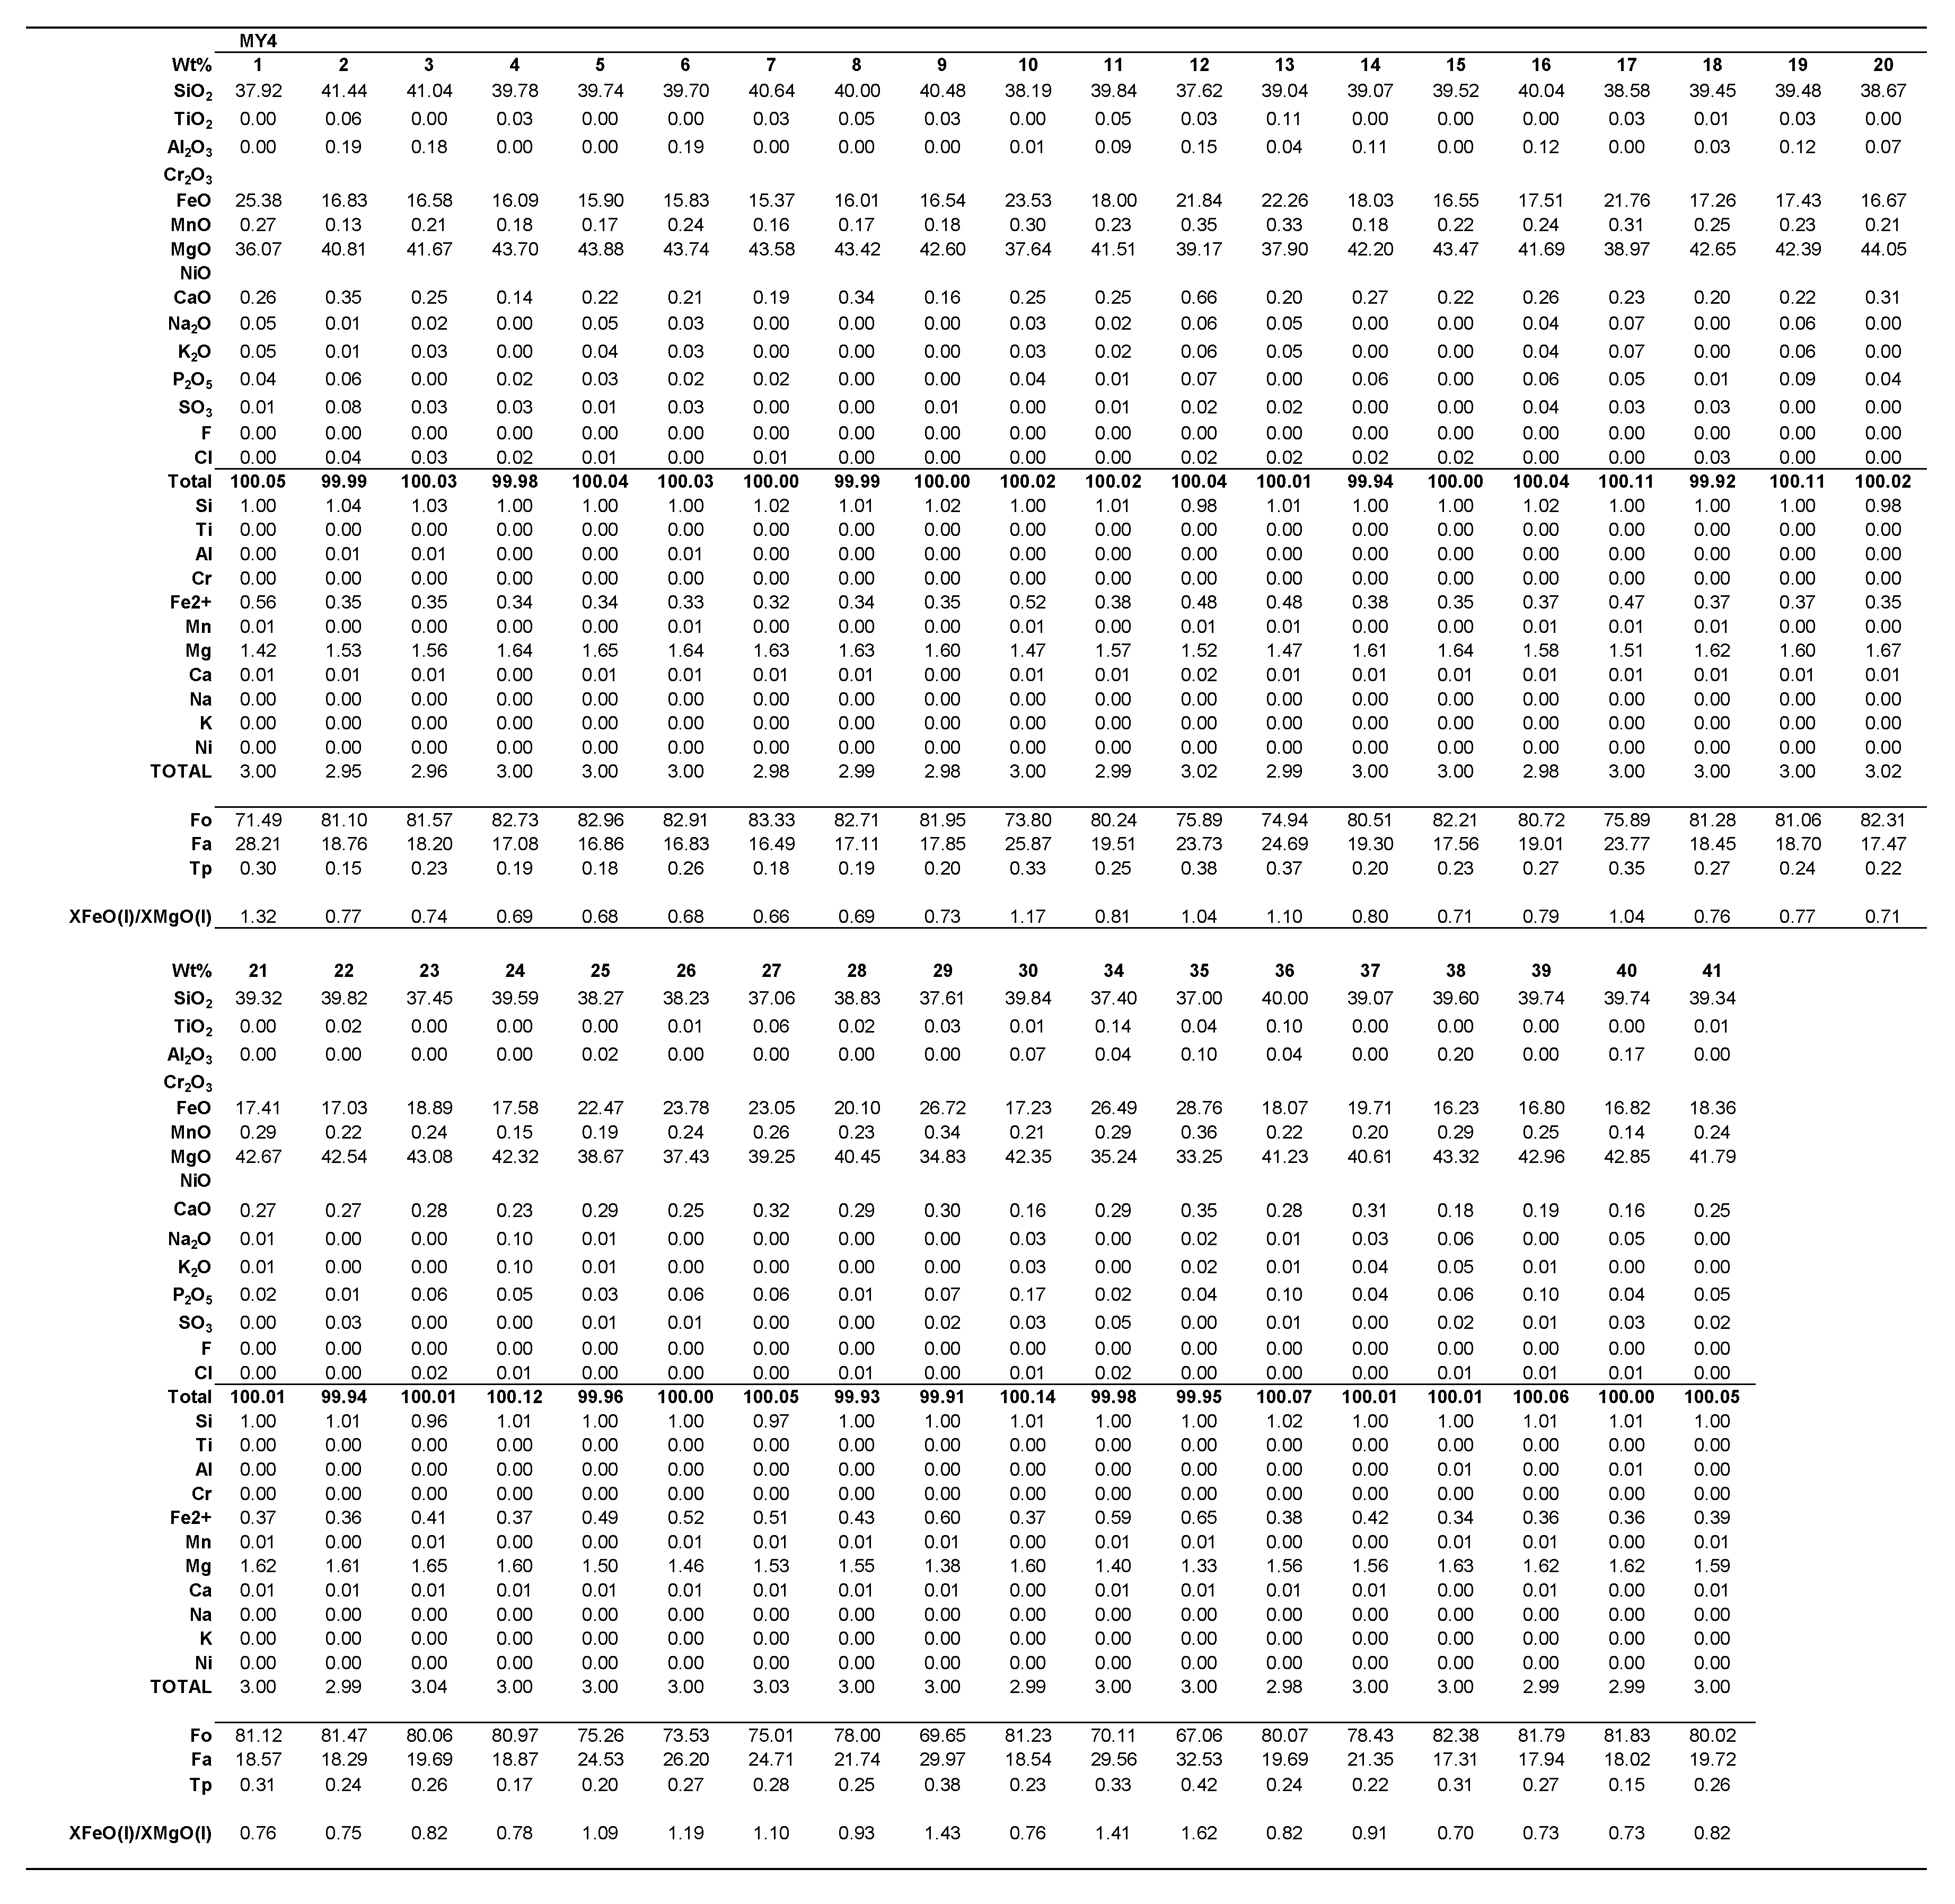
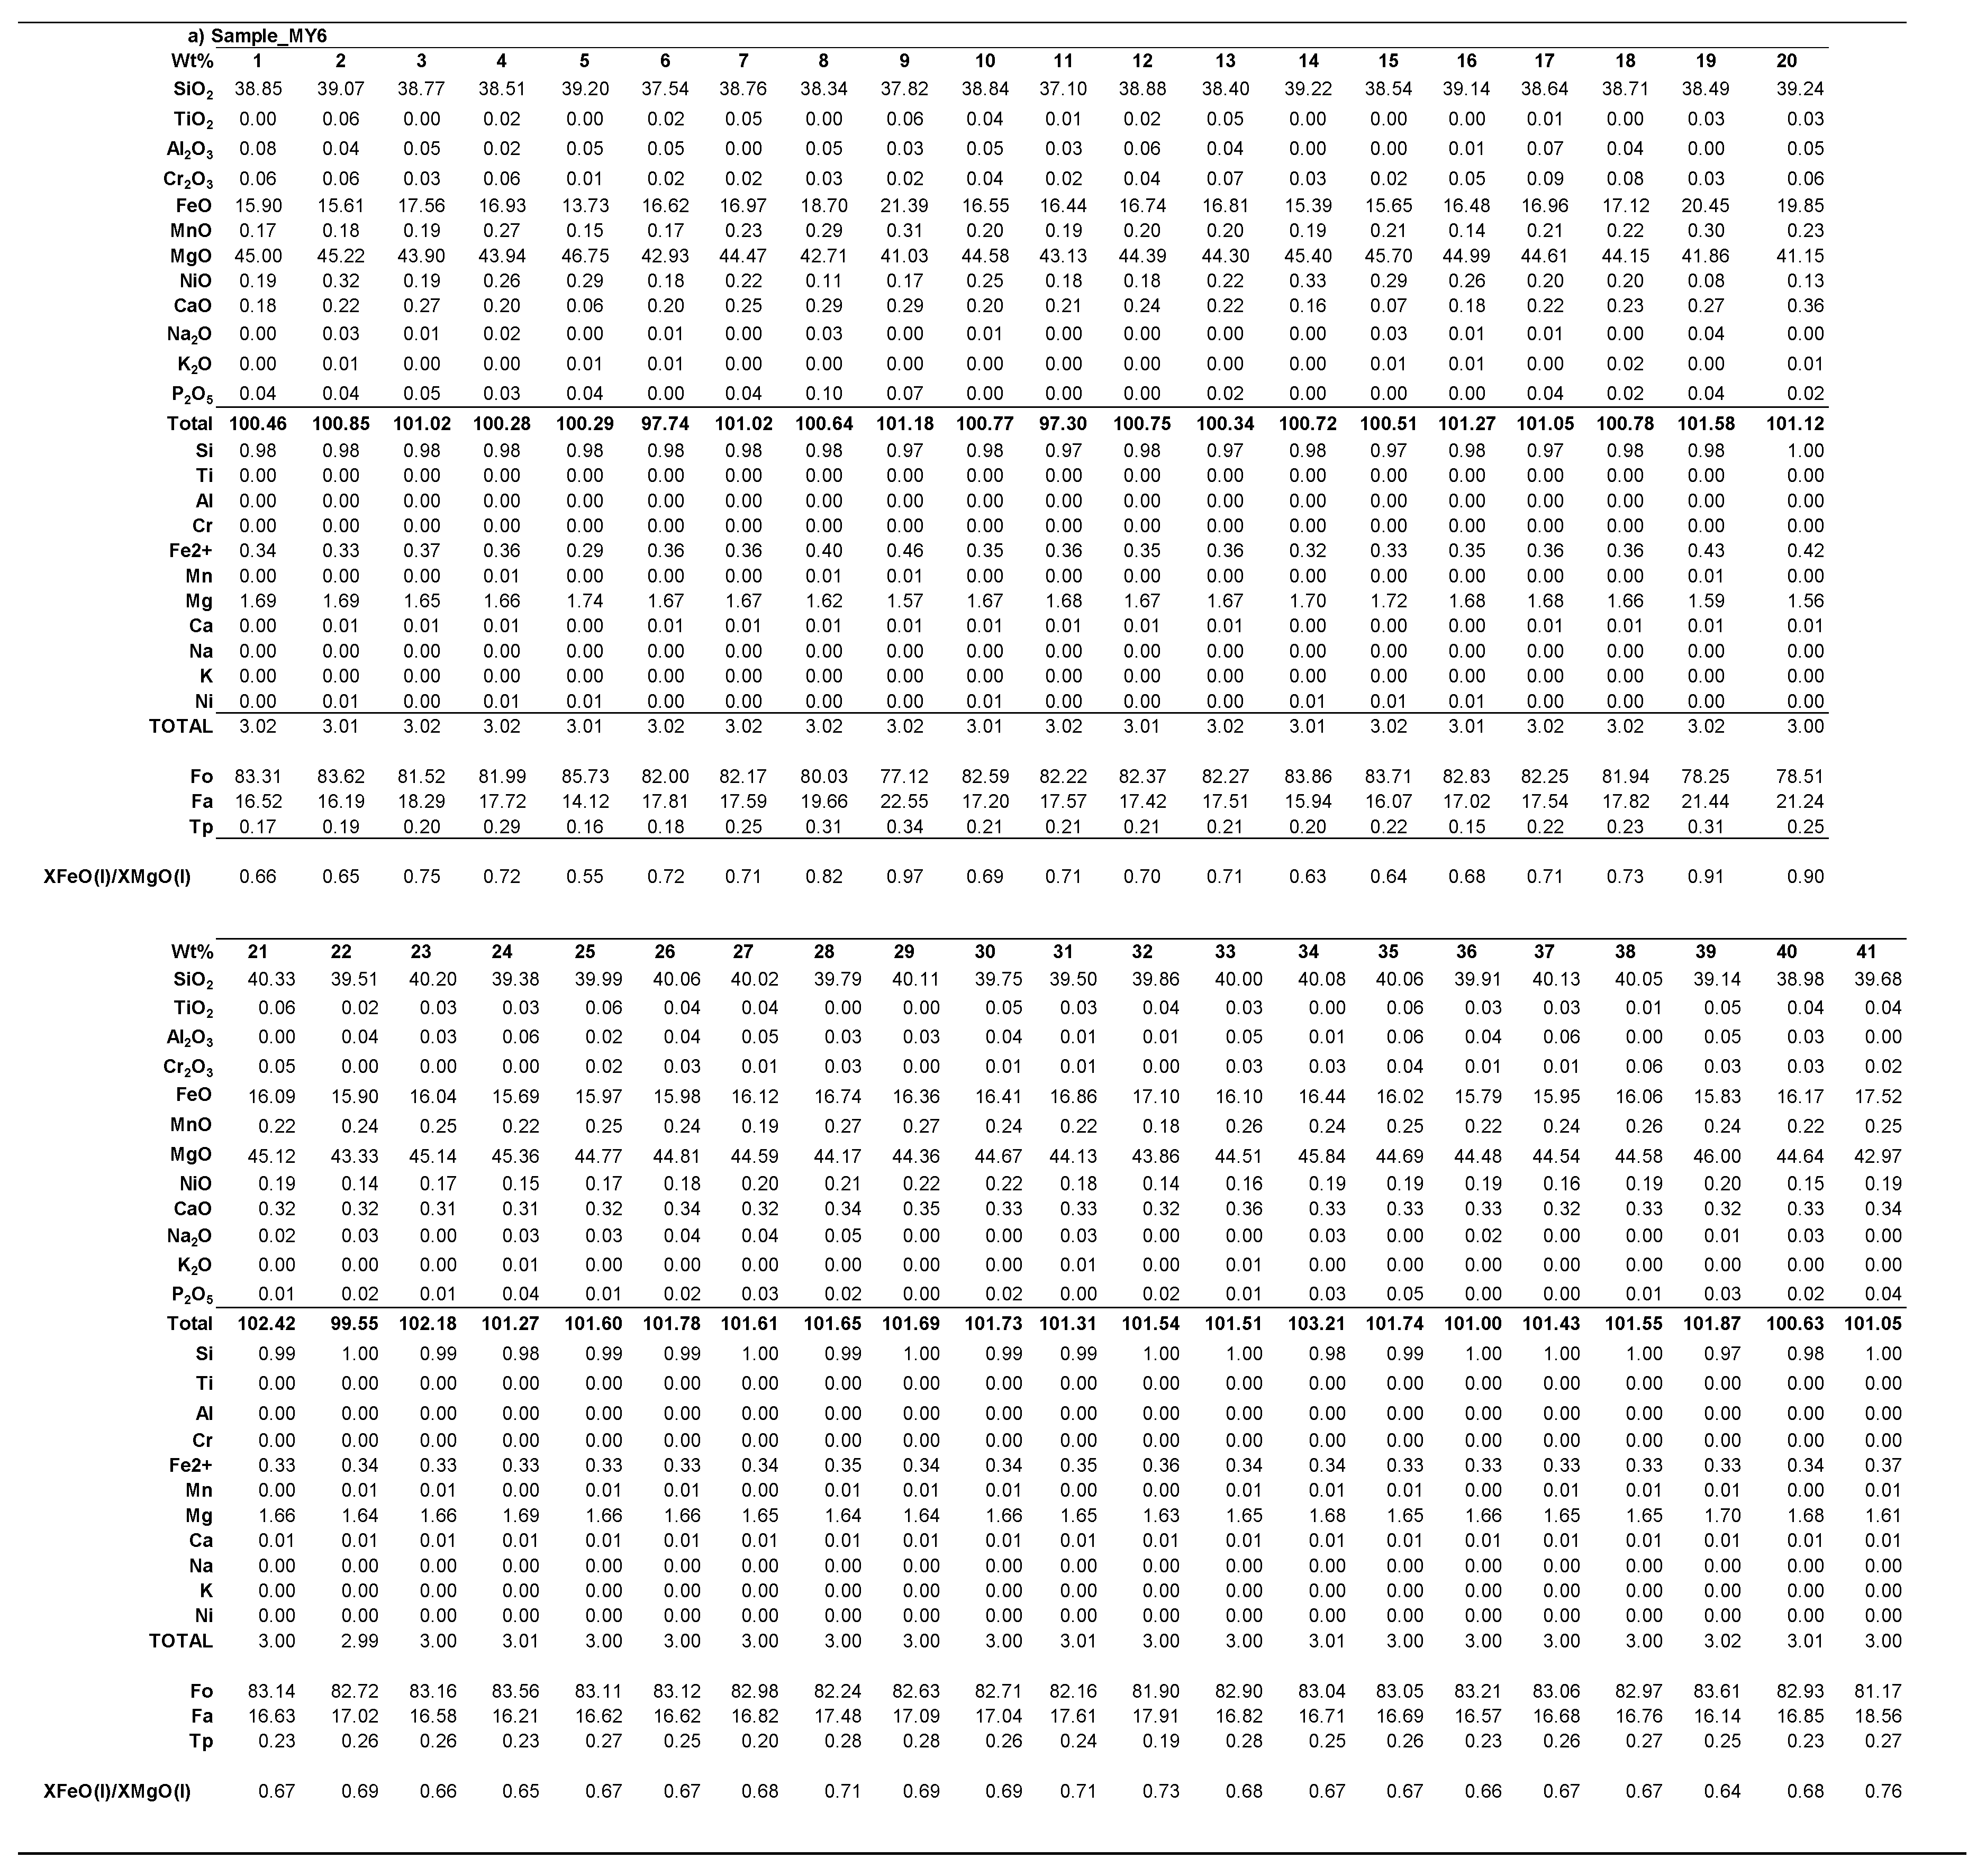
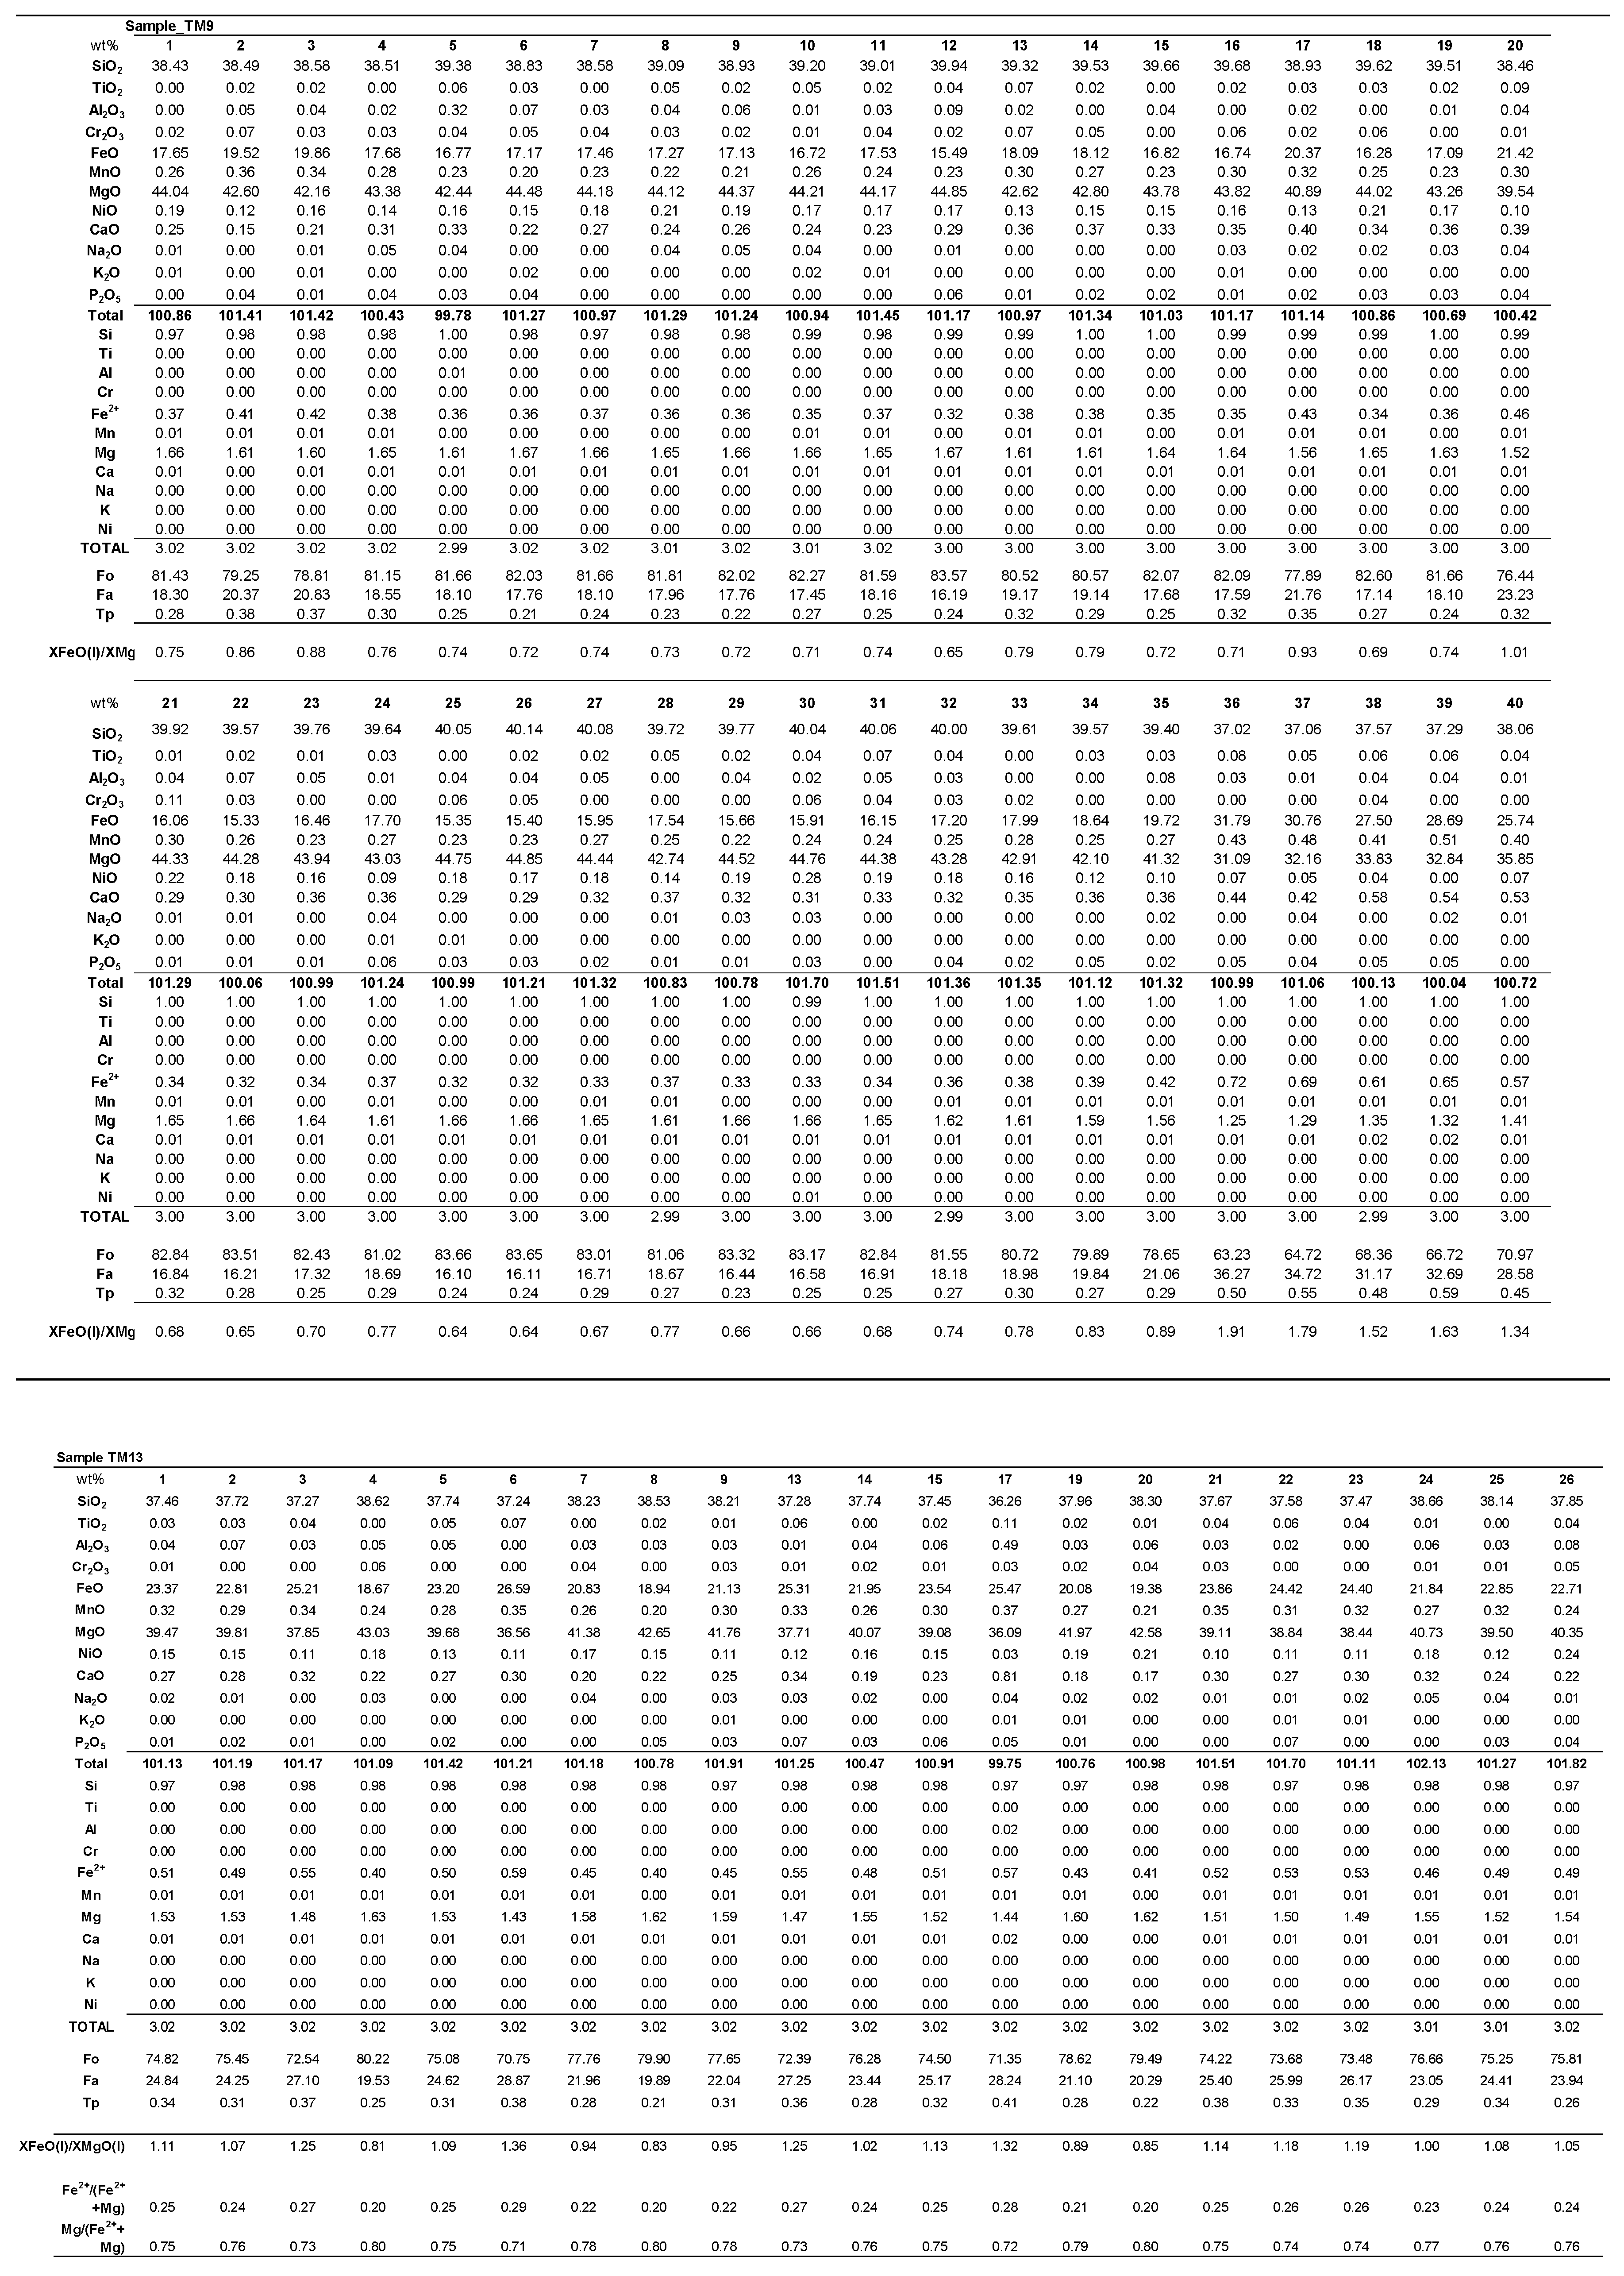
Table A2.
Pyroxene Chemistry Results from EPMA analysis.
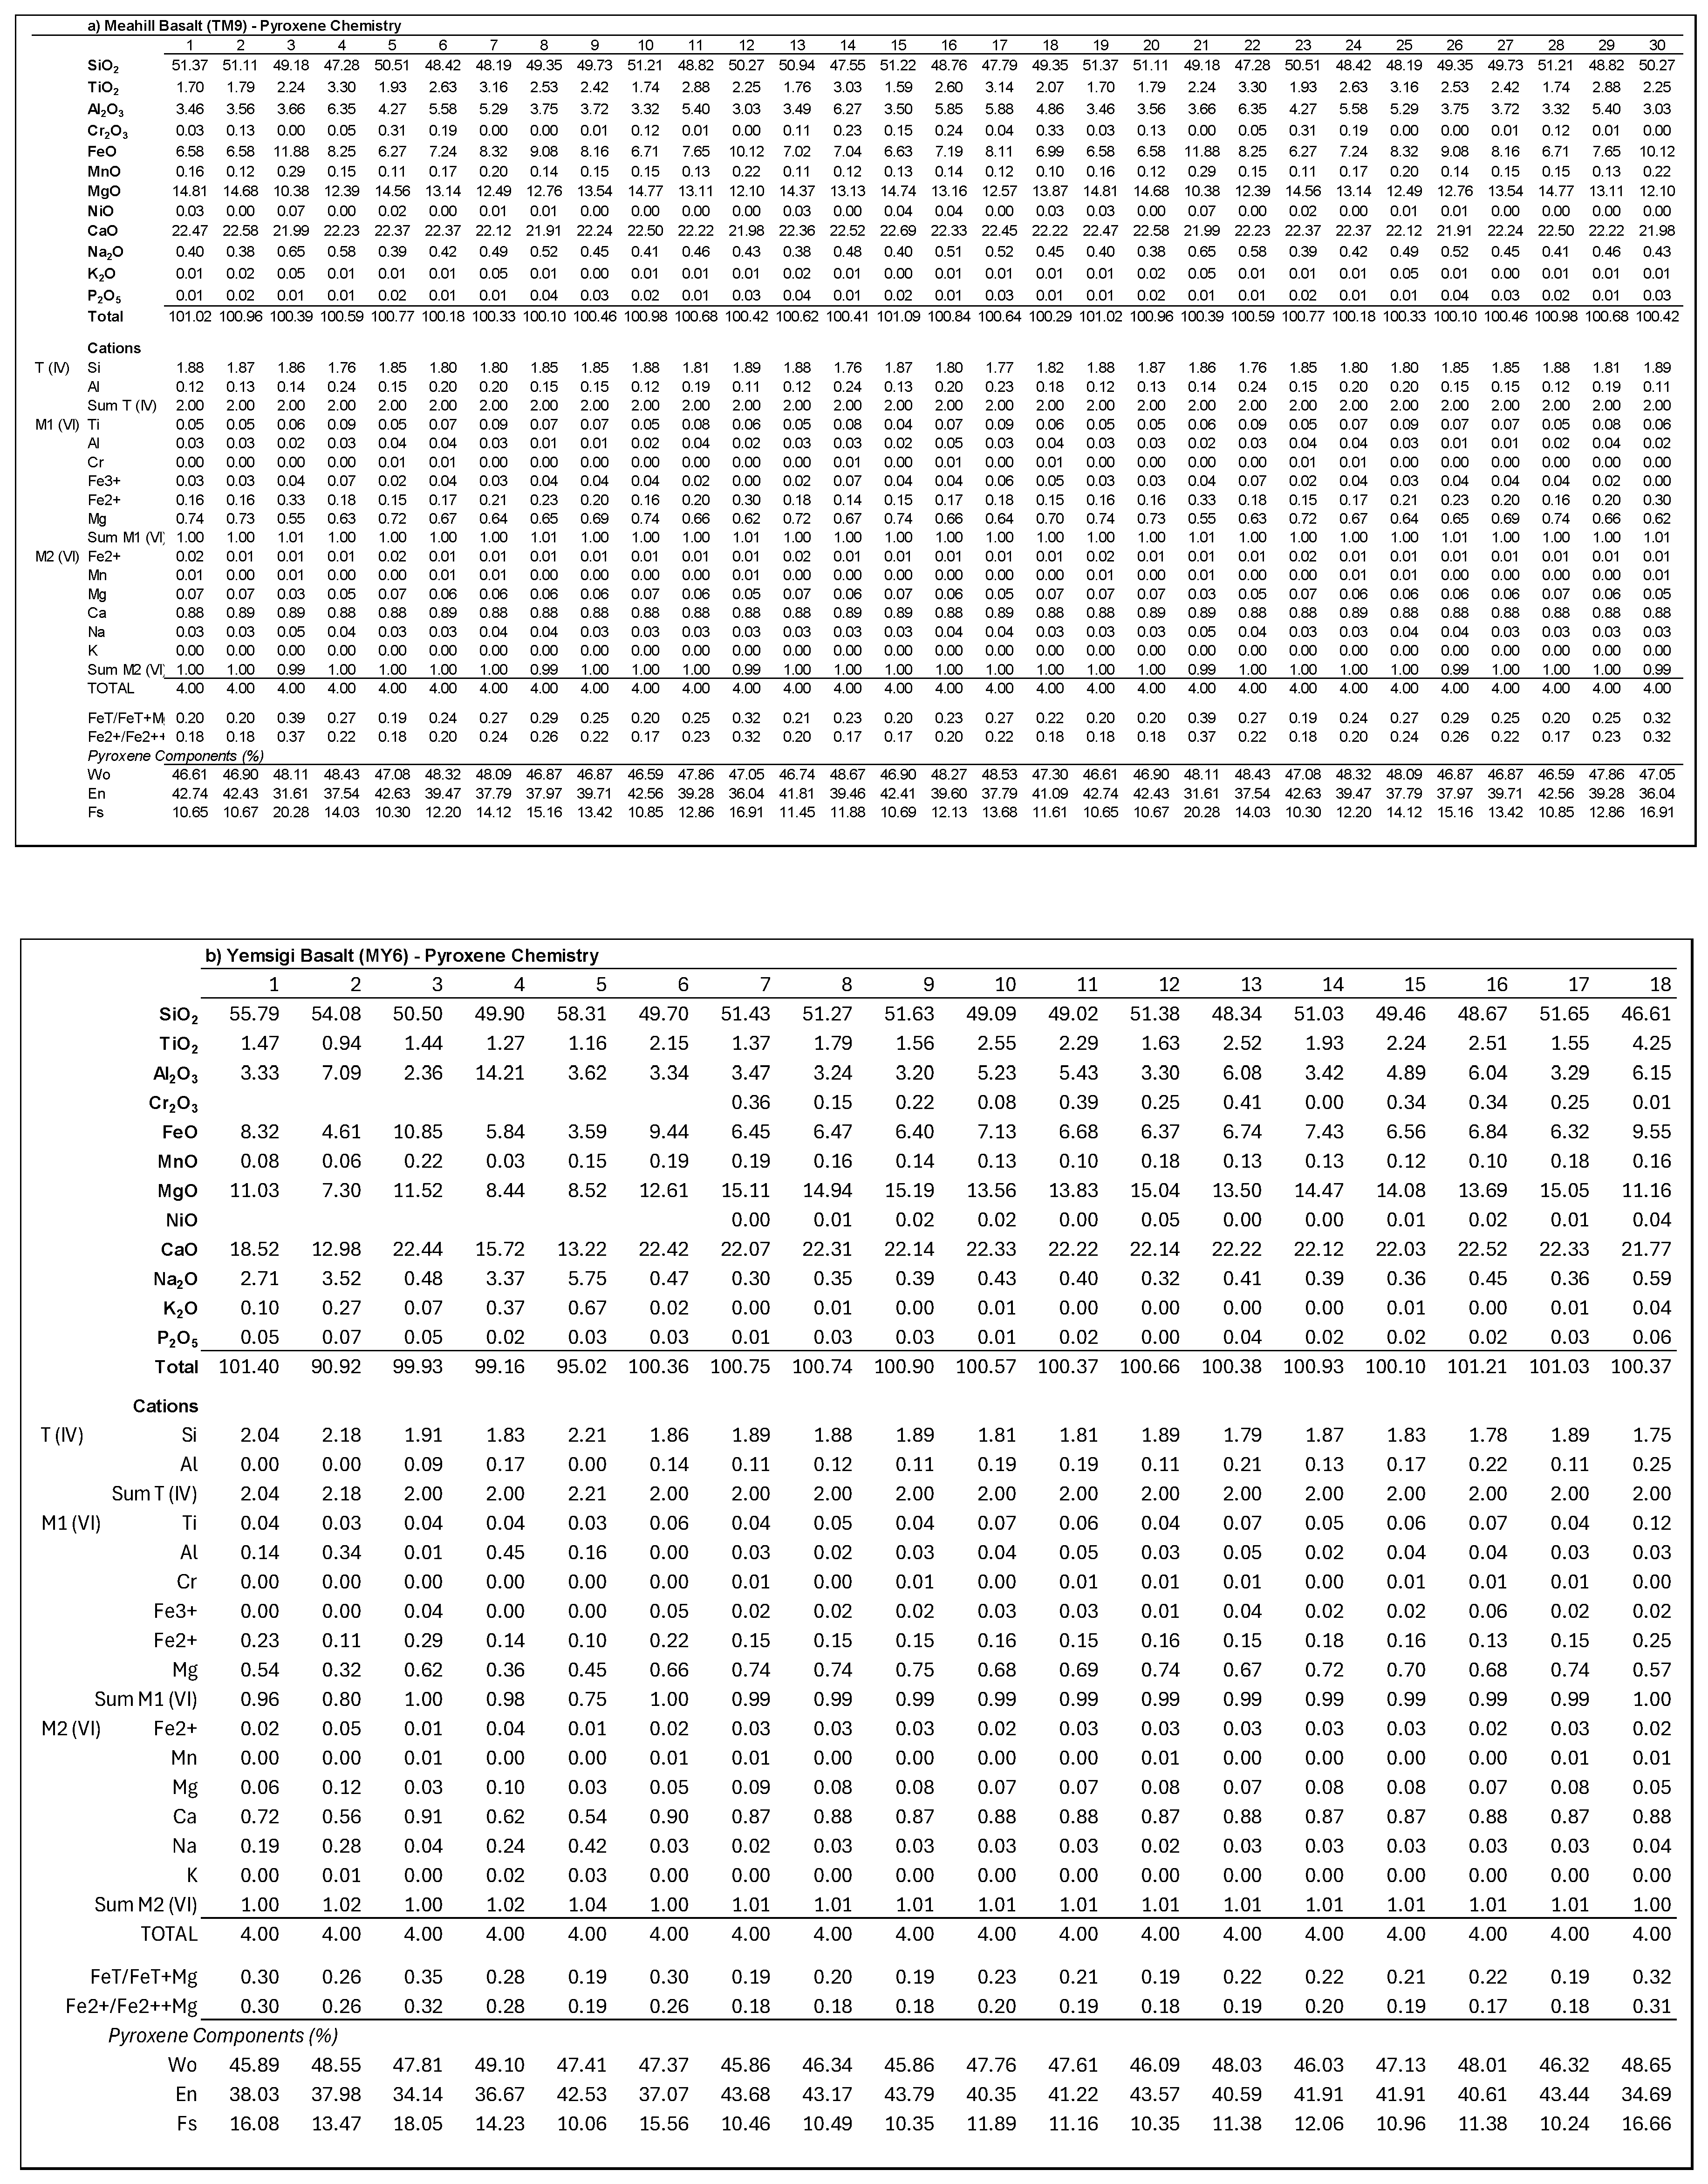
Table A3.
Feldspar Chemistry Results from EPMA analysis.
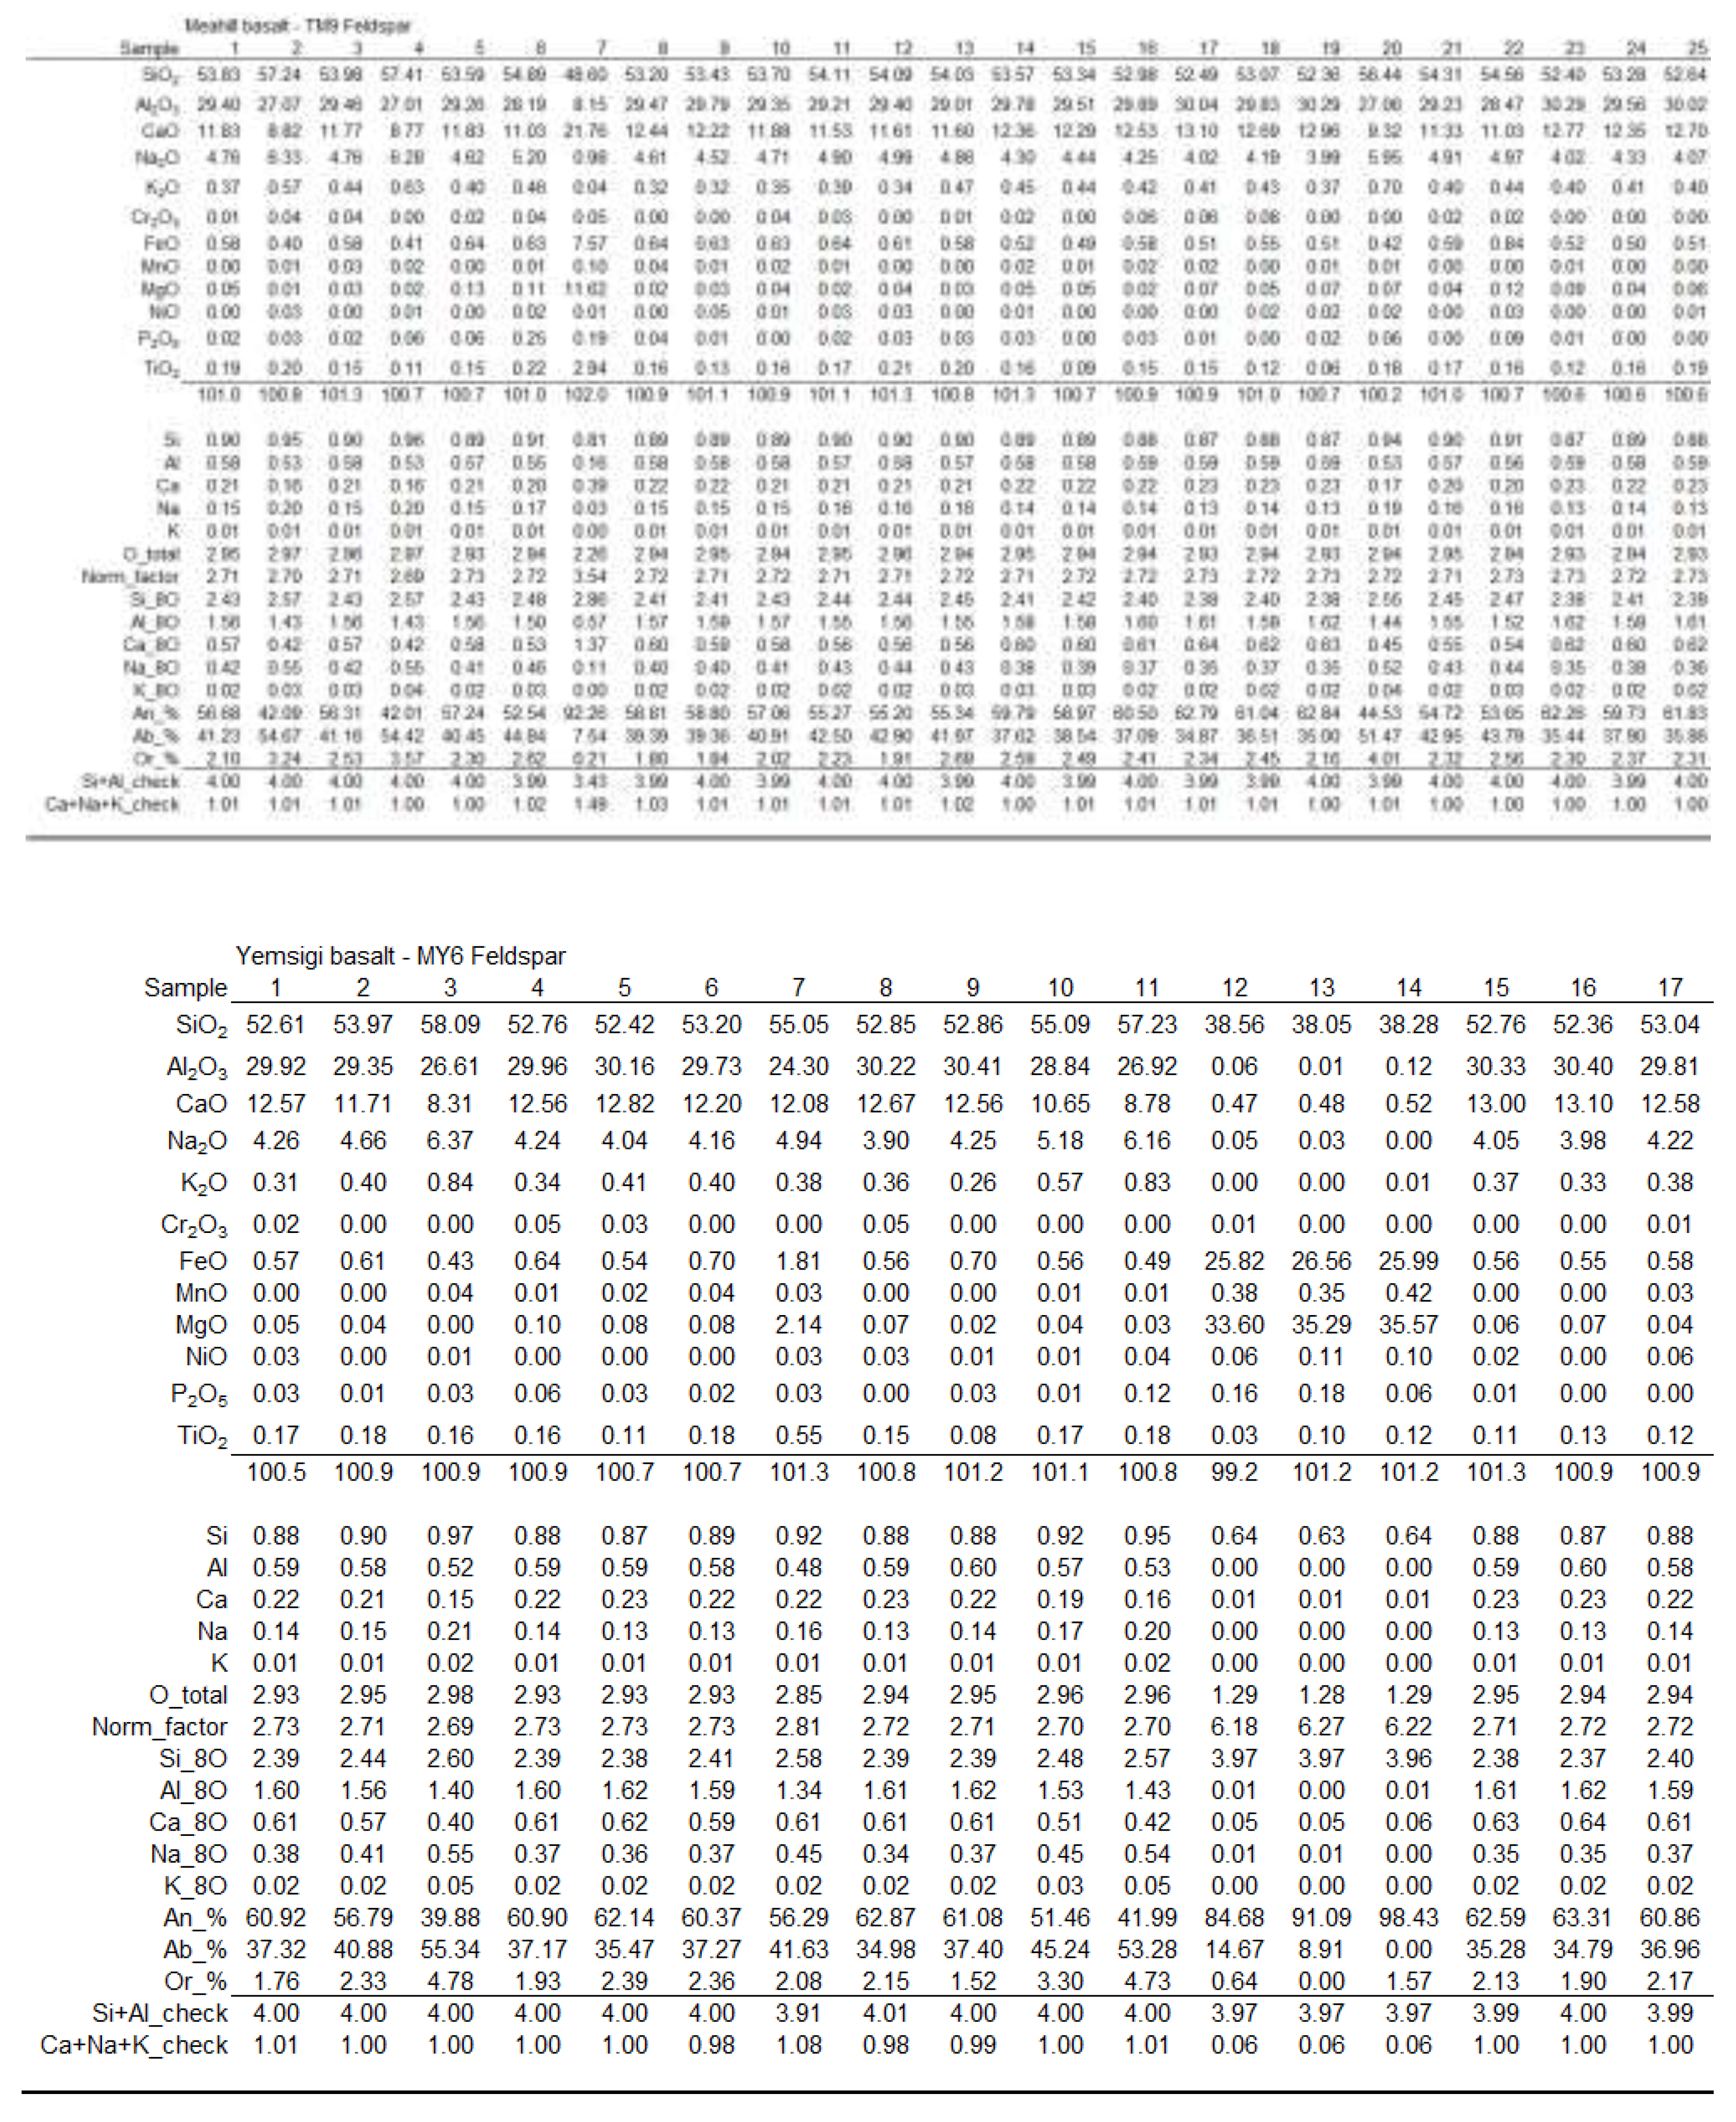
Table A4.
Titanomagnetite Chemistry from EPMA analysis.
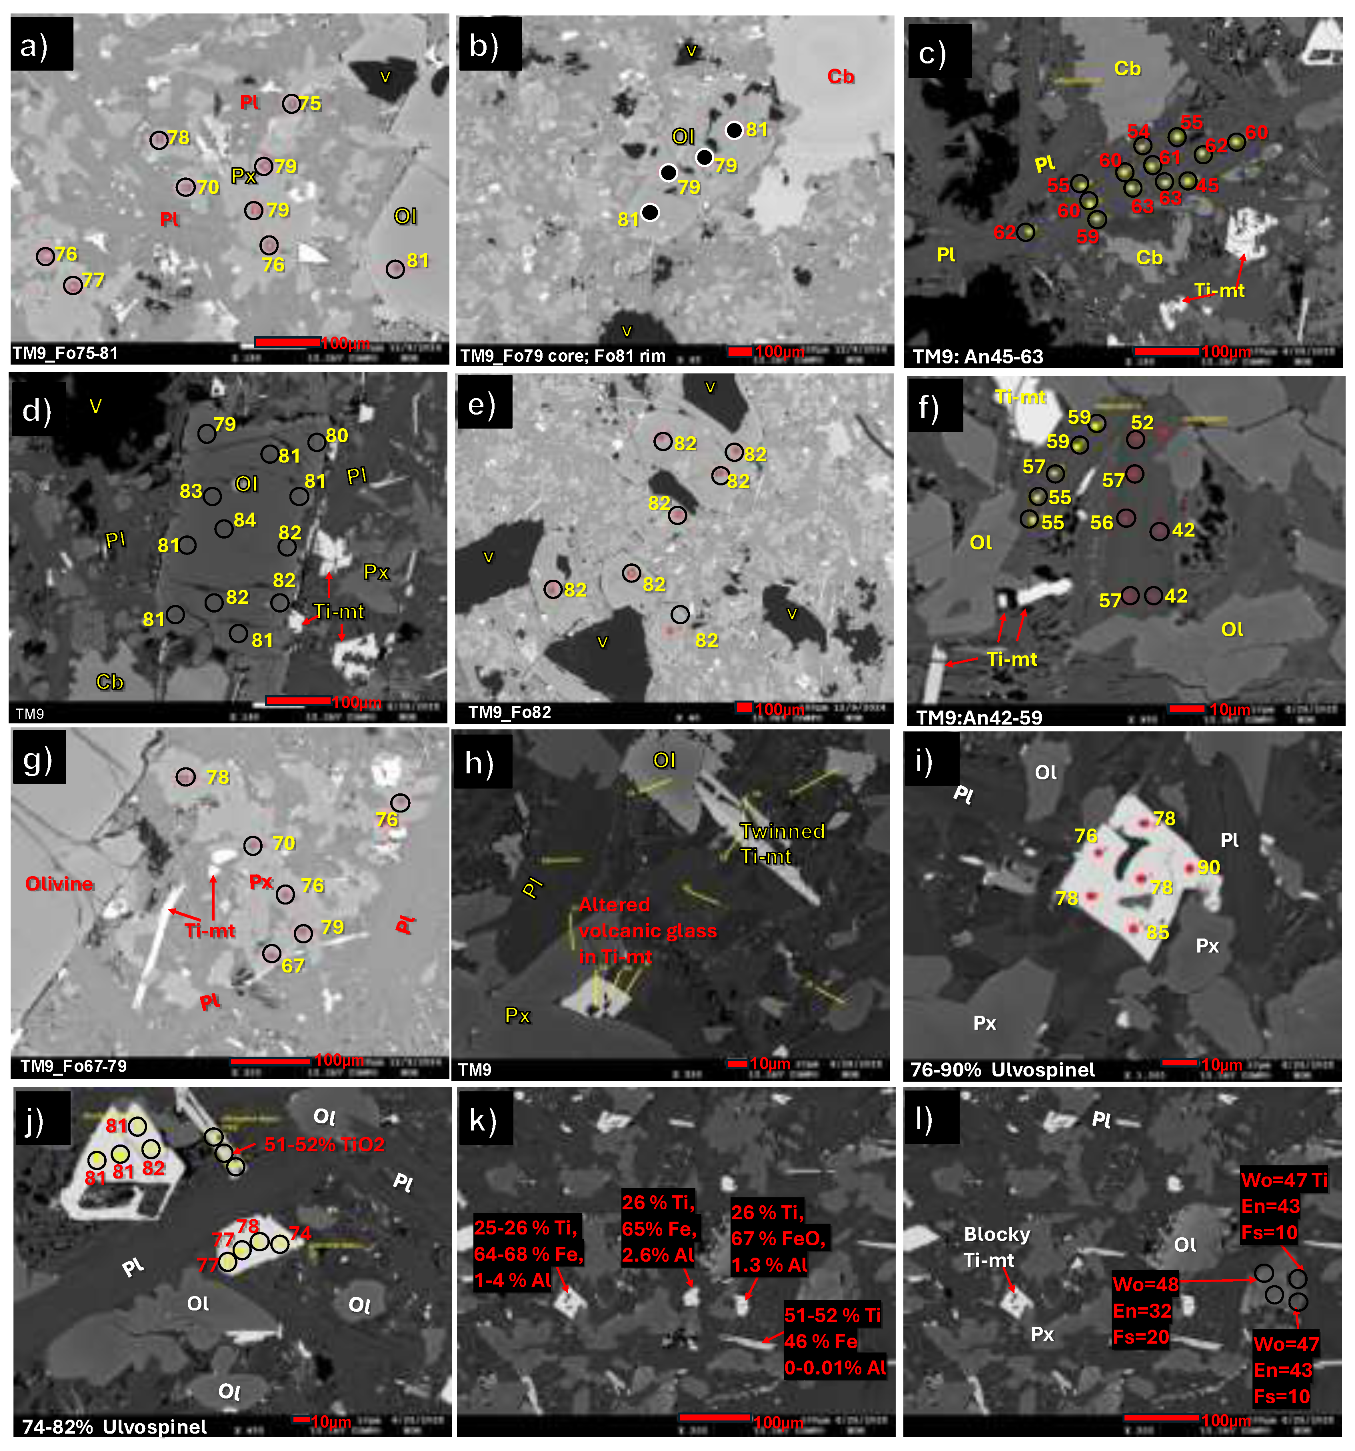
BSE images of Meahill basalt (TM9 and TM13) showing mineral phases, textures, and locations of EPMA analytical points.(a) Plagioclase, olivine, clinopyroxene, vesicles, and titanomagnetite.(b) Olivine phenocryst displaying core-to-rim zoning associated with vesicles and carbonate.(c) Plagioclase crystals together with carbonate patches and interstitial titanomagnetite.(d) Assemblage of olivine, plagioclase, clinopyroxene, and titanomagnetite with associated carbonate.(e) Vesicle-rich groundmass containing olivine and fine-grained interstitial phases.(f) Titanomagnetite grains associated with olivine and plagioclase.(g) BSE image showing olivine, clinopyroxene, plagioclase, and titanomagnetite in a microlitic groundmass.(h) Olivine associated with twinned plagioclase and altered volcanic glass intergrown with titanomagnetite.(i) Plagioclase crystals with associated olivine, clinopyroxene, and blocky titanomagnetite.(j) Titanomagnetite grains showing ulvöspinel components. (k) Titanomagnetite grains illustrating representative mineral textures.(l) Clinopyroxene grains plotted on the wollastonite-enstatite-ferrosilite scale, showing diopsidic compositions. Abbreviations: olivine (Ol); plagioclase (Pl); clinopyroxene (Px); titanomagnetite (Ti-mt); vesicle (V); carbonate (Cb); forsterite content of olivine (Fo); anorthite content of plagioclase (An); ulvöspinel component (Usp).
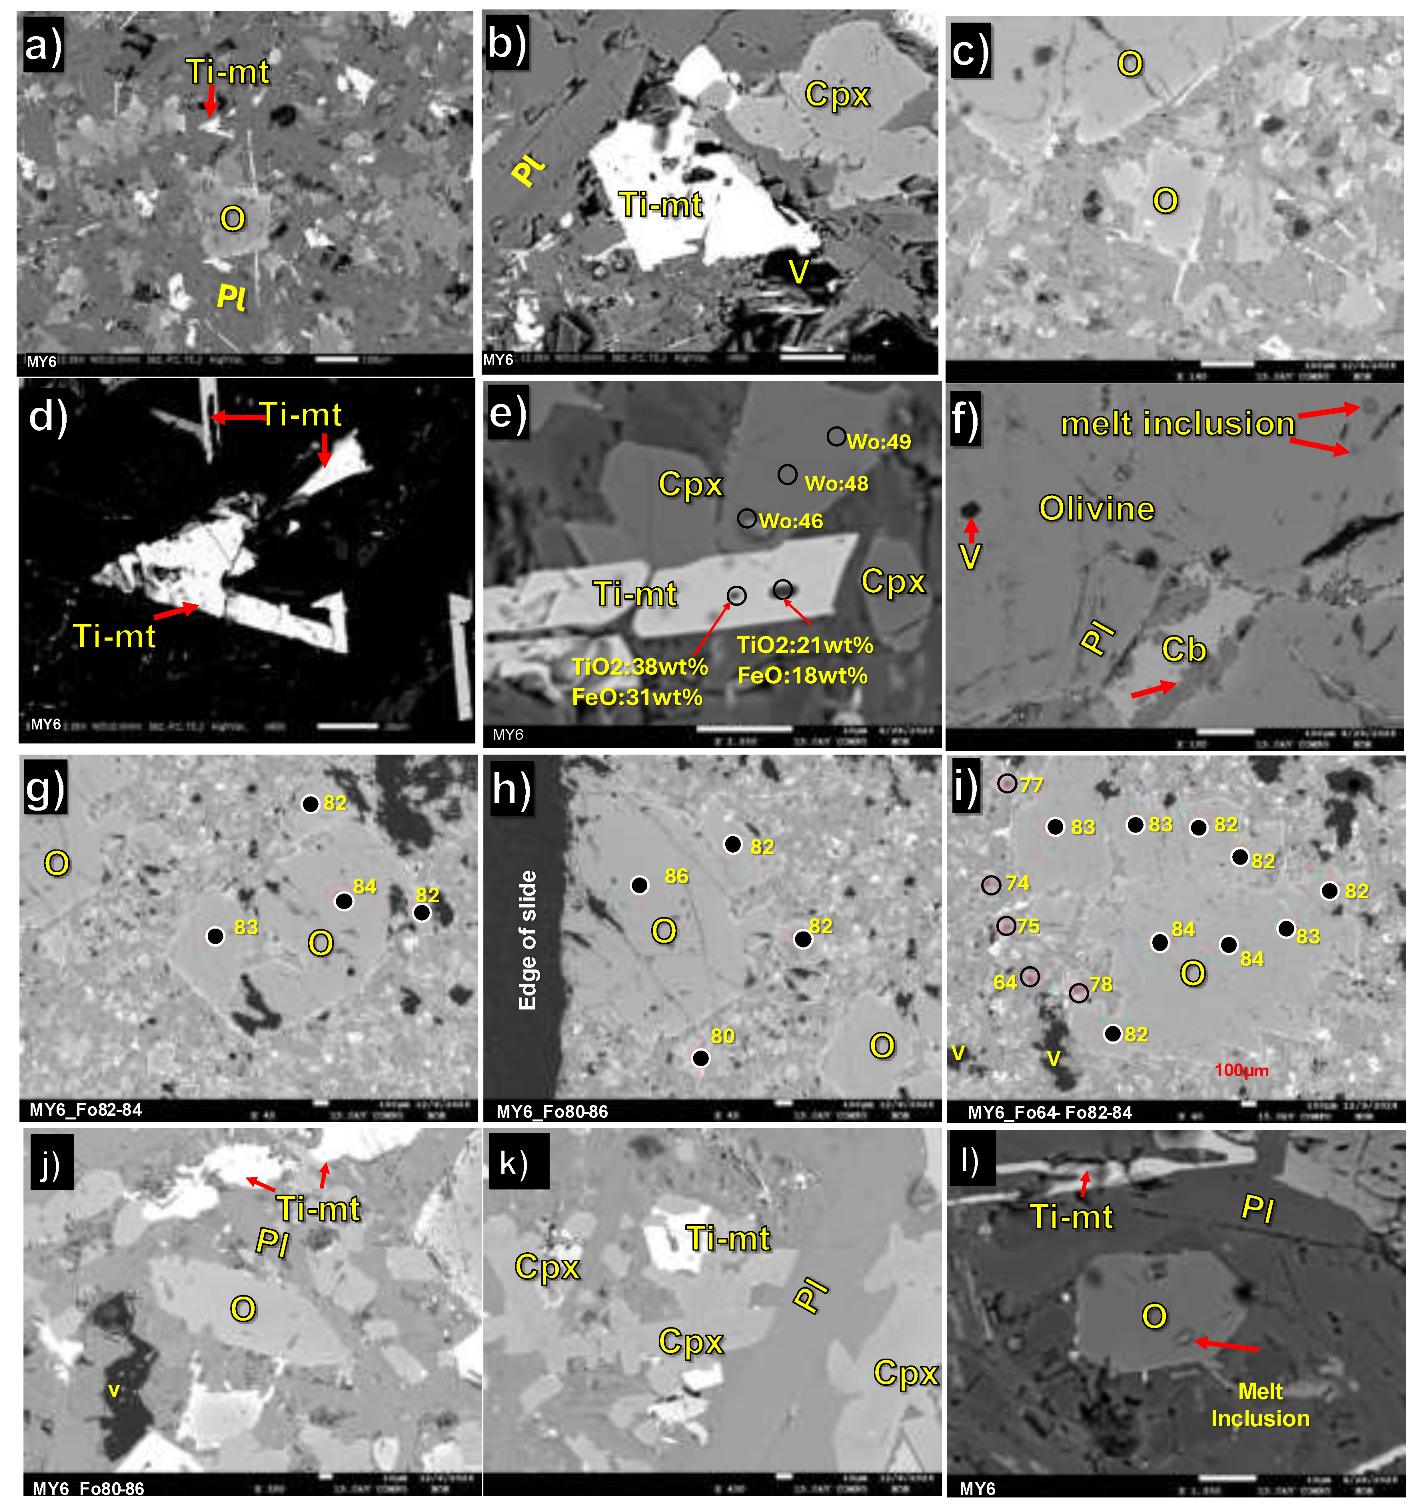
BSE images of the Yemsigi basalts (MY6 and MY8) showing mineral phases, textures, melt inclusions, and EPMA analytical points. (a) Fine-grained groundmass of plagioclase, olivine, and disseminated titanomagnetite. (b) Clinopyroxene, plagioclase, titanomagnetite, and vesicles within a microlitic groundmass. (c) Olivine crystals surrounded by plagioclase and fine-grained matrix phases. (d) Subhedral titanomagnetite crystals exhibiting irregular grain boundaries and intergrowth textures. (e) Clinopyroxene grains associated with titanomagnetite and fine-grained groundmass minerals. (f) Olivine containing melt inclusions, carbonate phases, and adjacent plagioclase in a fractured grain. (g) Olivine crystals with EPMA analytical points within a fine-grained matrix. (h) Olivine grains located near the edge of the polished section, showing internal fractures and inclusions. (i) Mixed assemblage of olivine, plagioclase, clinopyroxene, vesicles, and titanomagnetite. (j) Titanomagnetite-plagioclase intergrowths adjacent to olivine in the surrounding matrix. (k) Blocky titanomagnetite with plagioclase and multiple clinopyroxene grains. (l) Olivine crystals displaying melt inclusions and surrounded by plagioclase and titanomagnetite in a fine-grained groundmass. Abbreviations: olivine (Ol); plagioclase (Pl); clinopyroxene (Cpx); titanomagnetite (Ti-mt); vesicle (V); carbonate (Cb); forsterite content of olivine (Fo); anorthite content of plagioclase (An); ulvöspinel component (Usp).
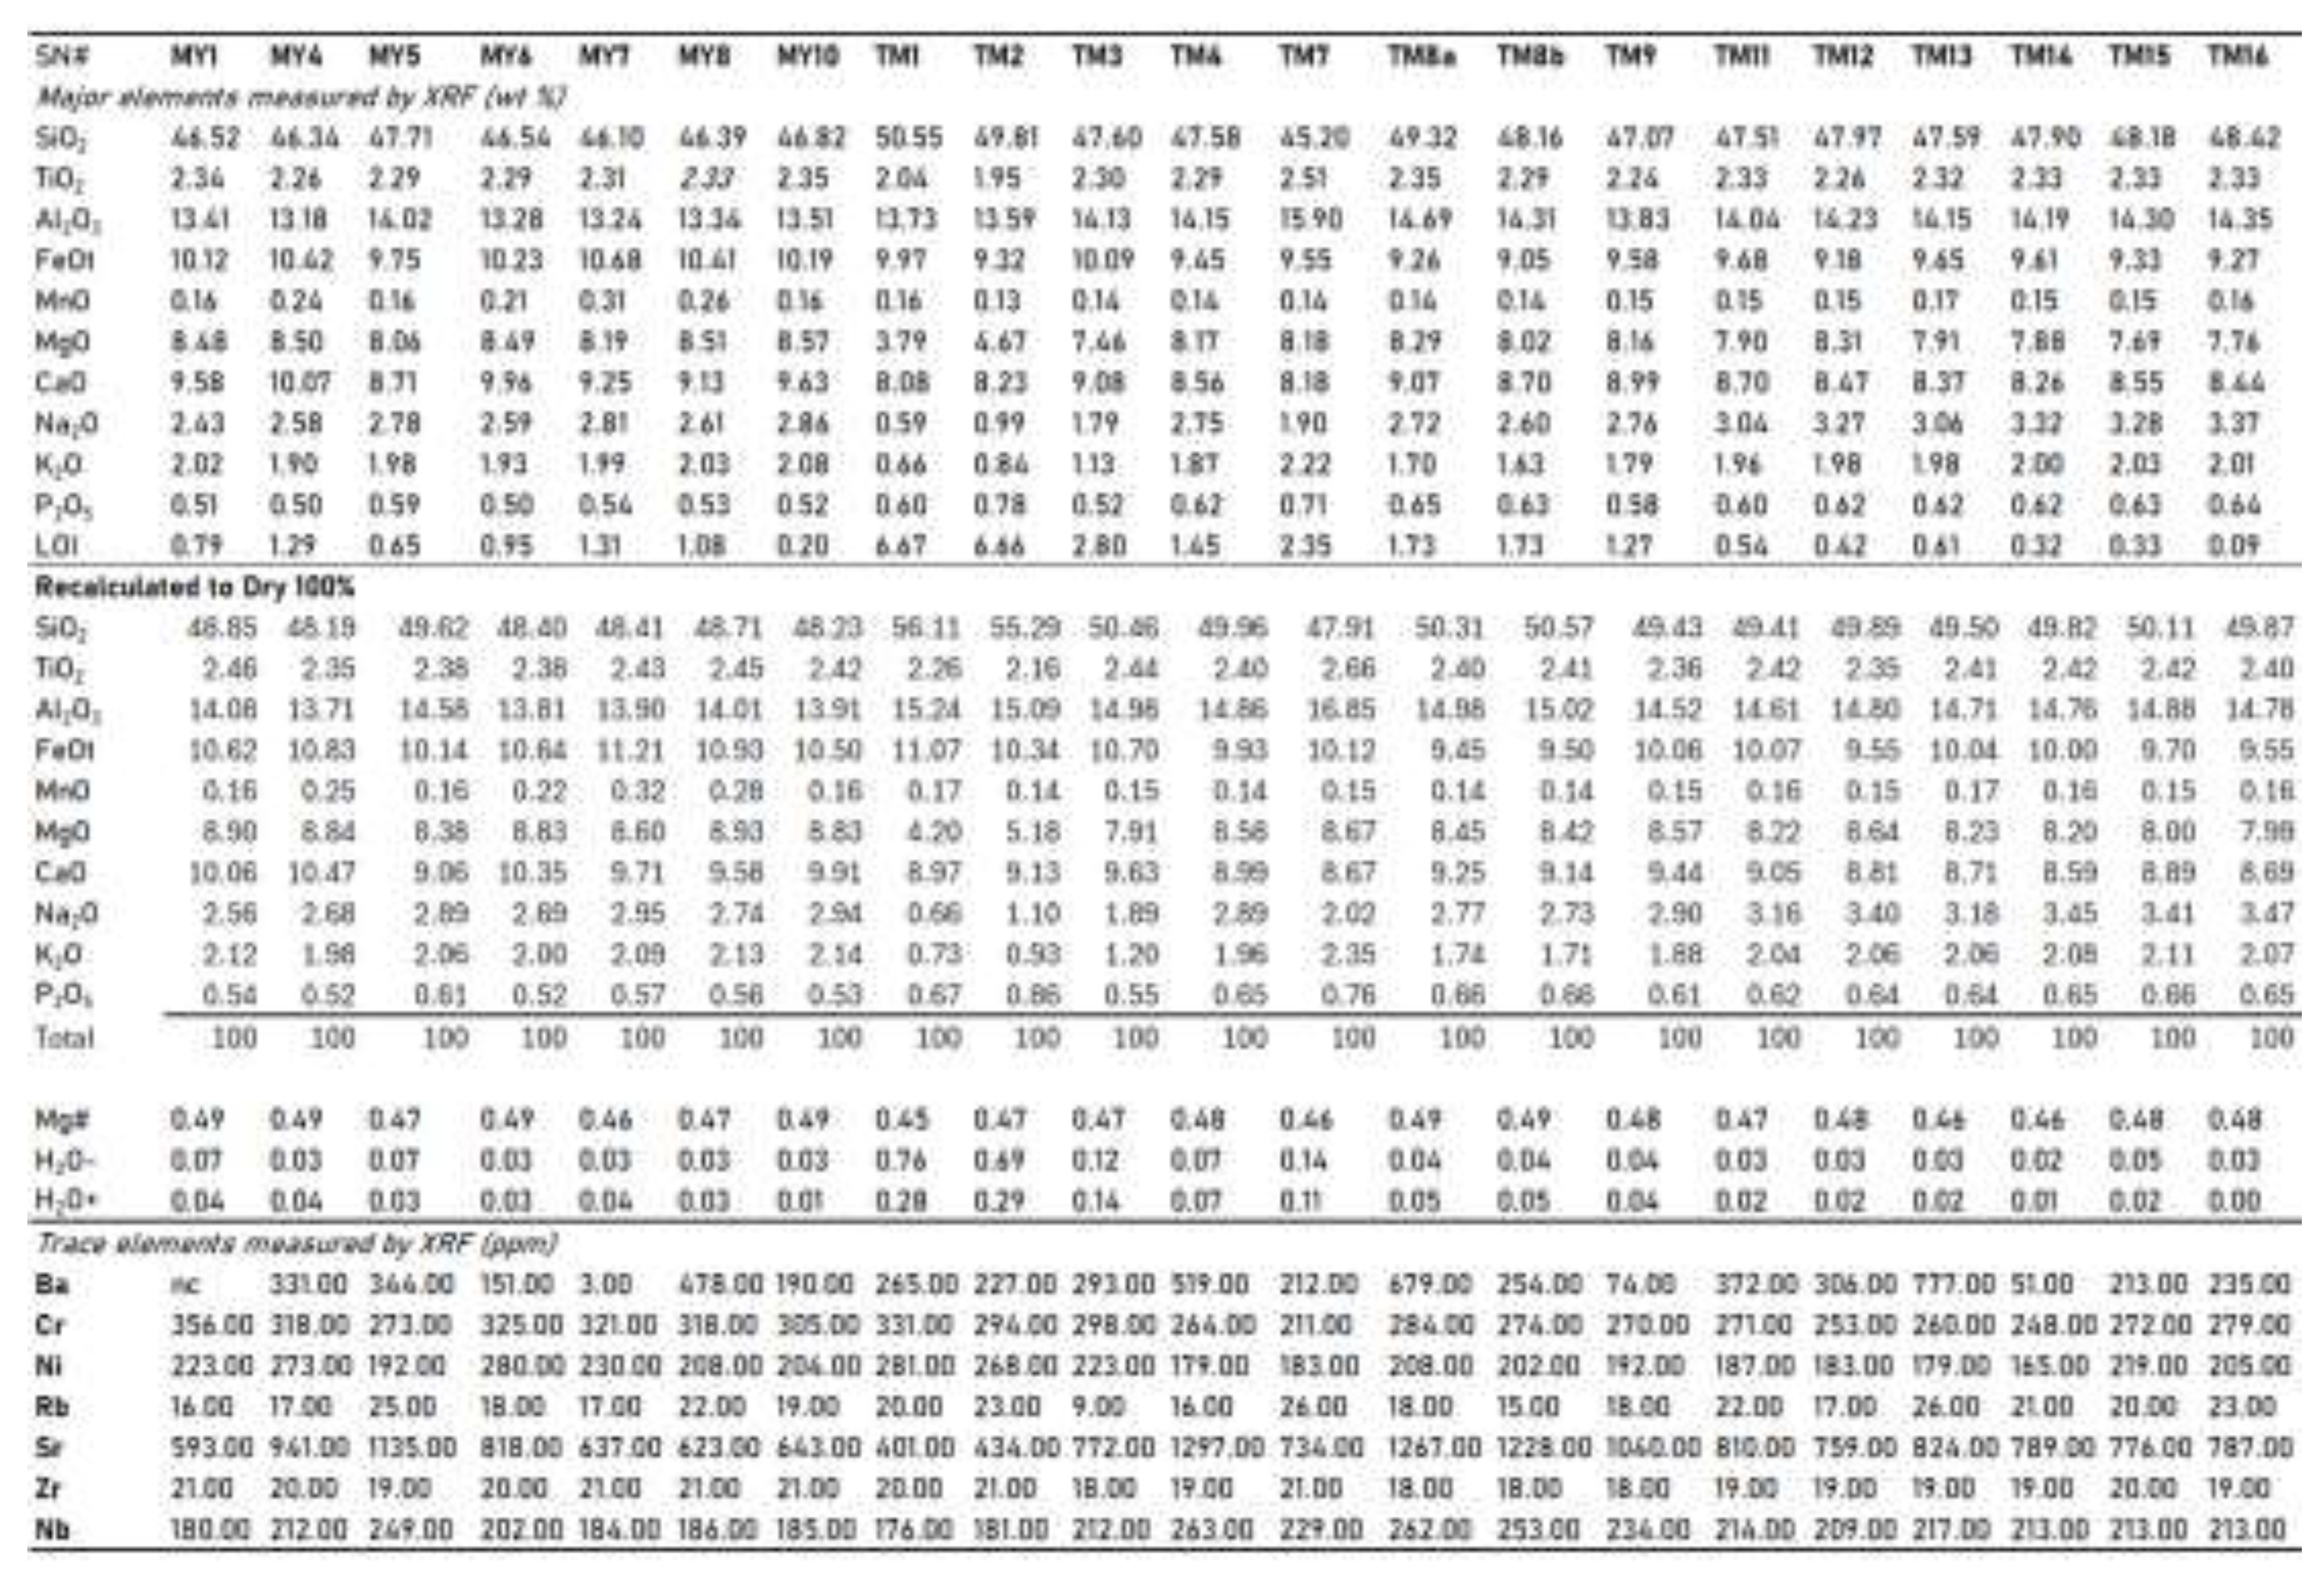
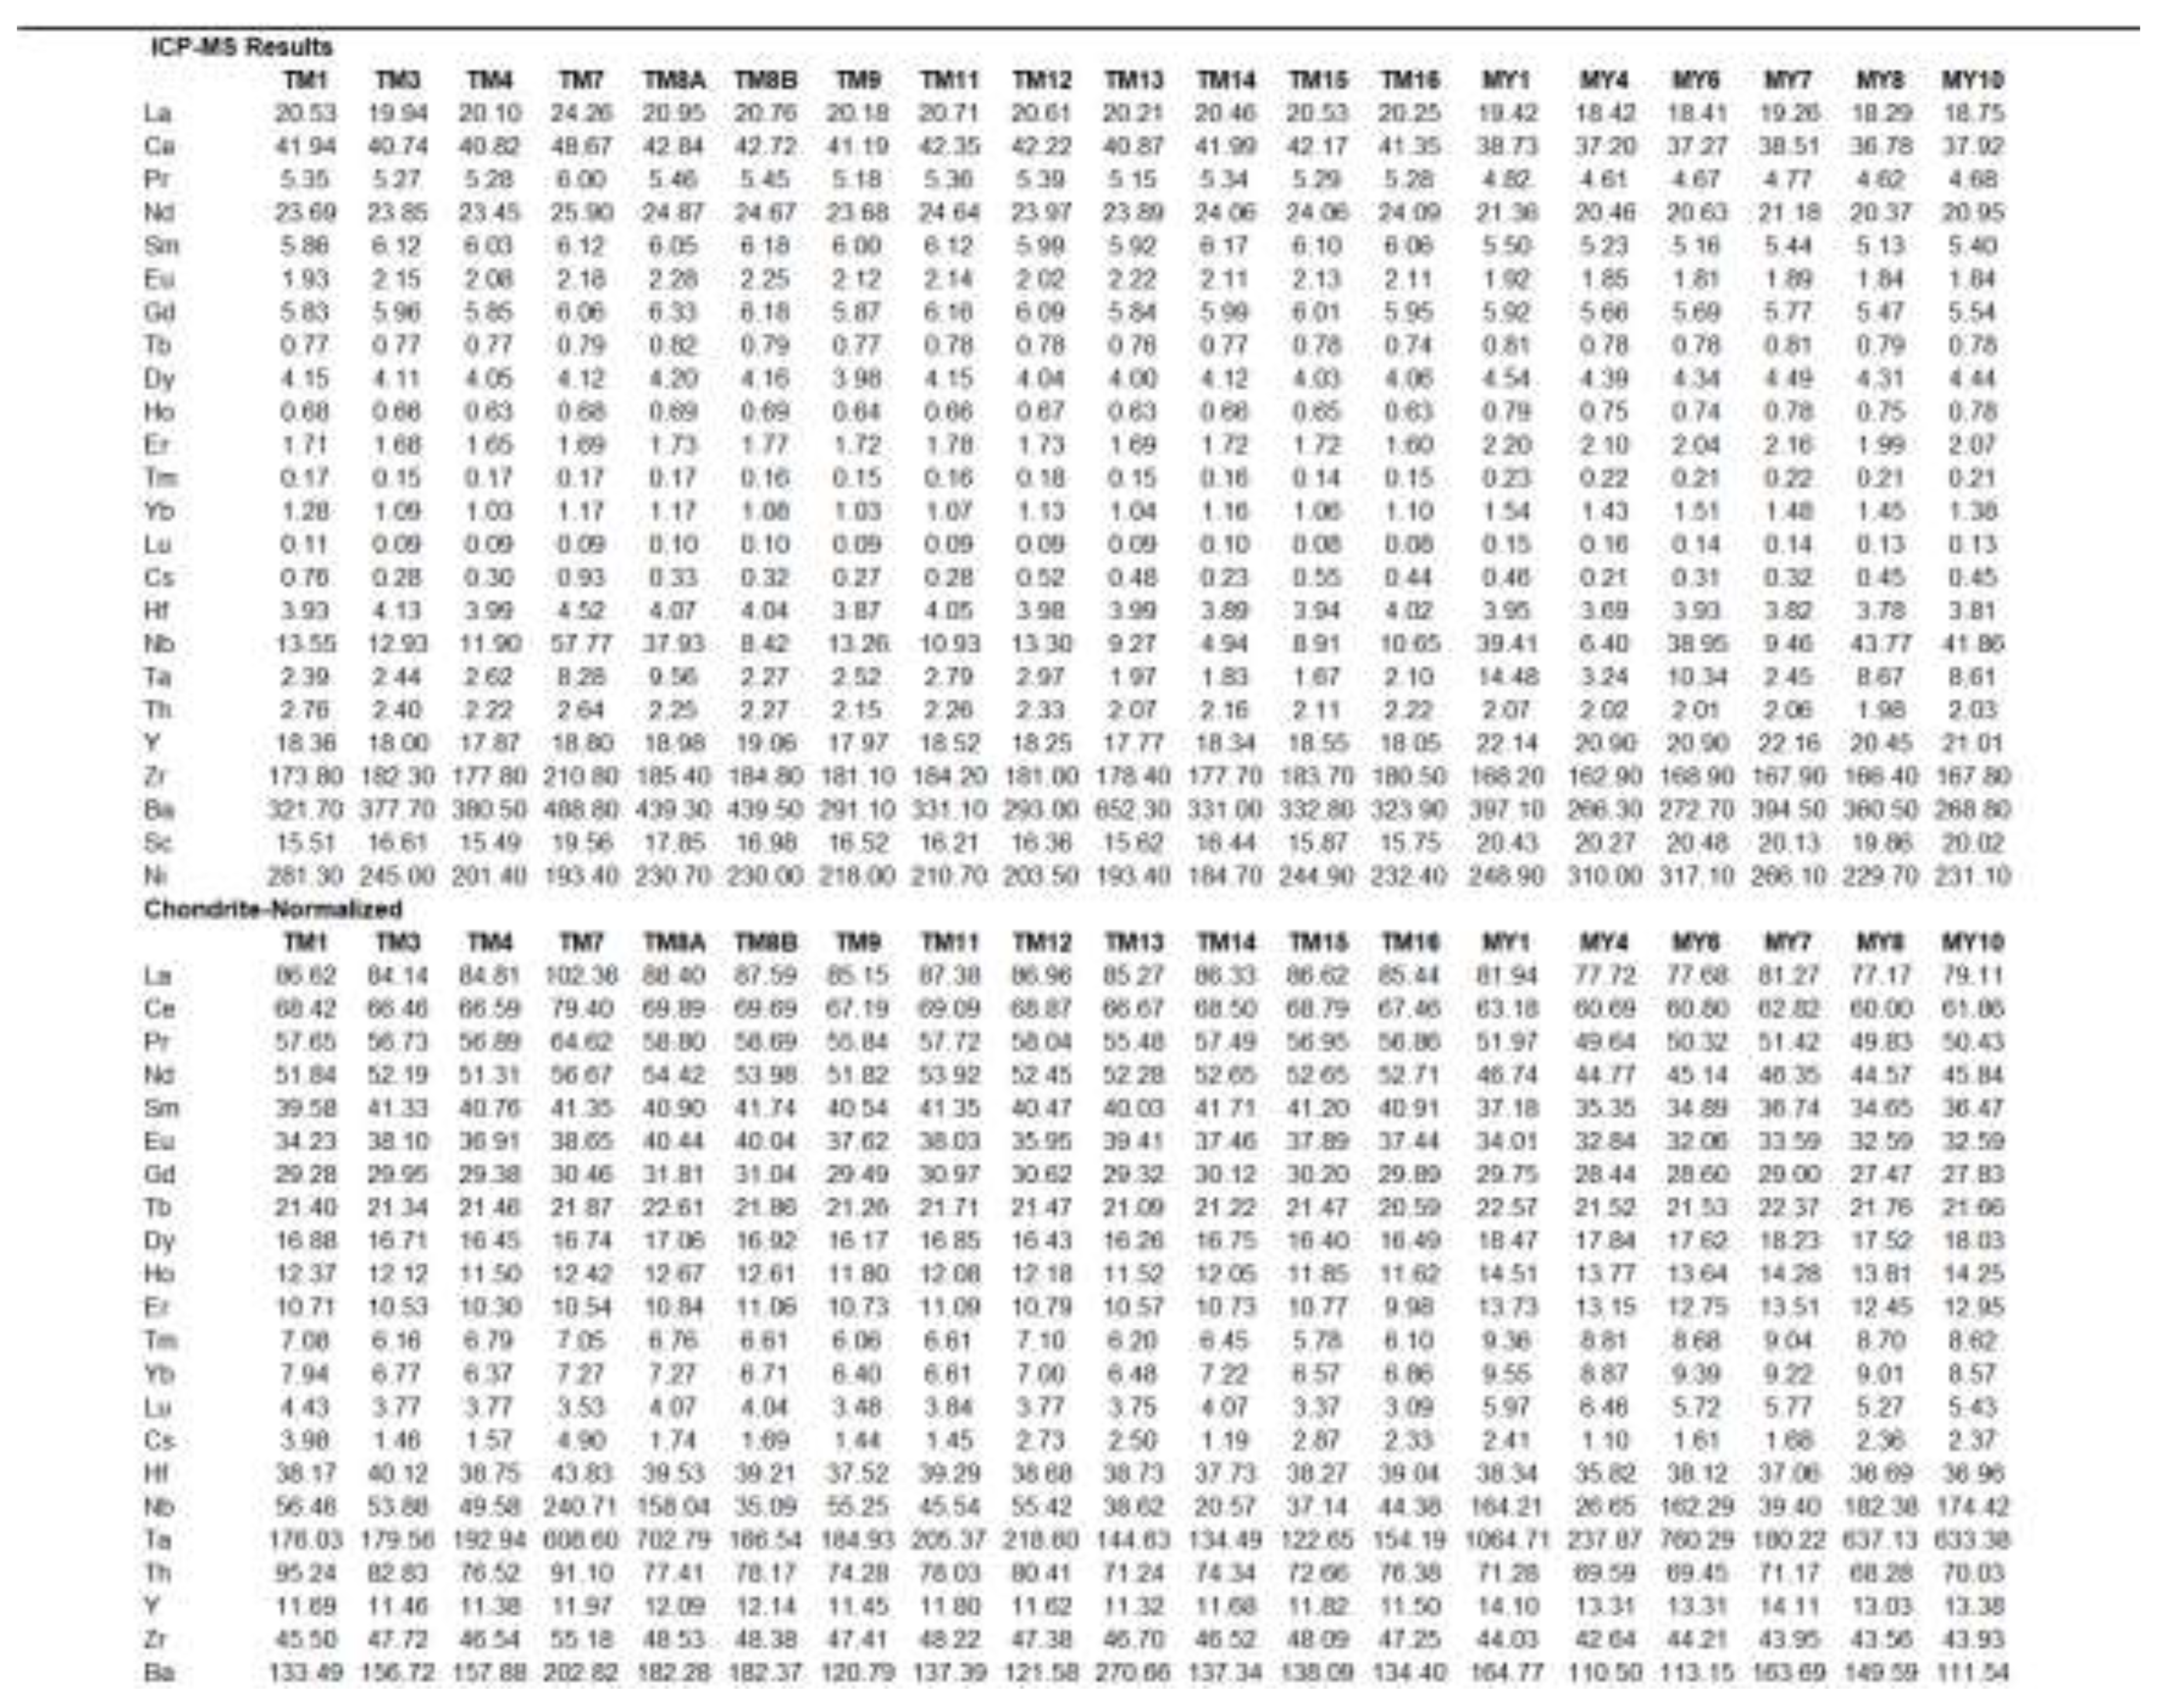
Appendix B. XRF and IC-PMS Results for the Meahill and Yemsigi Basalts
References
- Holm, 2016. Post 8 Ma reconstruction of Papua New Guinea and Solomon Islands: Microplate tectonics in a convergent plate boundary setting: Earth-Science Reviews, p. 66-81.
- Weissel, J. K.; Watts, A. B. Tectonic evolution of the Coral Sea Basin. Journal of Geophysical Research 1979, v. 84(no. B9), 4572–4582. [Google Scholar] [CrossRef]
- Abbott, L. D.; Silver, E. A.; Galewsky, J. Structural evolution of a modern arc-continent collision in Papua New Guinea. Tectonics 1994, v. 13, 1007–10034. [Google Scholar] [CrossRef]
- Hill, K. C., and Hall, R., 2002, Mesozoic-Cenozoic evolution of Australia's New Guinea Margin in a West Pacific context: Geological Society of America Special Paper, p. 259-283.
- Hall, R., 2002, Cenozoic geological and plate tectonic evolution of SE Asia and the SW Pacific: computer-based reconstructions, model and animations: Journal of Asian Earth Sciences, p. 353-431.
- Webb, L. E.; Baldwin, S. L.; Fitzgerald, P. G. The early-middle Miocene subduction complex of the Louisiade Archipelago, southern margin of the Woodlark Rift. Geochemistry, Geophysics, Geosystems 2004, 15, 4024–4046. [Google Scholar] [CrossRef]
- Baldwin, S. L., Fitzgerald, P. G., and Webb, L. E., 2012, Tectonics of the New Guinea Region: Annual Review of Earth and Planetary Sciences, p. 495-520.
- Botsford, A., Endebrock, L., and Harrington, A., 2012, Structural and stratigraphic evolution of the Gulf of Papua, Papua New Guinea: New insights from a modern 3D seismic survey: AAPG International Conference and Exhibition (Search and Discovery Article), Singapore, p. 12.
- Webb, L. E.; Baldwin, S. L.; Fitzgerald, P. G. The early-middle Miocene subduction complex of the Louisiade Archipelago, southern margin of the Woodlark Rift. Geochemistry, Geophysics, Geosystems 2014, v. 15, 4024–4046. [Google Scholar] [CrossRef]
- Holm, R. J., Spandler, C., and Richards, S. W., 2015, Continental collision, orogenesis and arc magmatism of the Miocene Maramuni arc, Papua New Guinea: Gondwana Research, p. 1117-1136.
- Bulois, C.; Pubellier, M.; Chamot-Rooke, N.; Delescluse, M. Successive rifting events in marginal basins: The example of the Coral Sea region (Papua New Guinea). Tectonics 2018, v. 37, 3–29. [Google Scholar] [CrossRef]
- Holm, R. J.; Simon, T.; Jelsmae, H. A.; Rosenbaum, G.; Mark, D. F. Tectonic evolution and copper-gold metallogenesis of the Papua New Guinea and Solomon Islands region. Ore Geology Reviews 2019, 208–226. [Google Scholar] [CrossRef]
- Holm, R., Gold, D., White, L., Webb, M., Mahoney, L., McLaren, S., and others, 2020, Provenance and tectonics of the allochthonous New Guinea terranes: Implications for the formation and evolution of regional basins: AAPG/EAGE PNG Geoscience Conference & Exhibition, Port Moresby, p. 1-10.
- Brandl, P. A., Hannington, M. D., Krätschell, A., Petersen, S., Baxter, A. T., Stewart, M. S., and others. A new geological map of the marginal basins of eastern Papua New Guinea: Implications for crustal accretion and mineral endowment at arc-continent collisions. Lithosphere 2024, v. 4(145), 40 p. [CrossRef]
- Dow, D. B., 1977, Geological synthesis of Papua New Guinea: Canberra, Australian Government Publishing Service.
- Williamson, A., and Hancock, G., 2005, The geology and mineral potential of Papua New Guinea: Port Moresby, Papua New Guinea Department of Mining.
- Sheppard, S., and Cranfield, L. C., 2012, Geological framework and mineralisation of Papua New Guinea: an update: Port Moresby, Mineral Resources Authority.
- Davies, H. L. The geology of New Guinea-the cordilleran margin of the Australian continent. Episodes 2012, v. 35(no. 1), 87–102. [Google Scholar] [CrossRef]
- Corbett, G. J., and Leach, T. M., 1998, Southwest Pacific rim gold-copper systems: Structure, alteration and mineralisation: Society of Economic Geologists, Special Publication 6, 238 p.
- Callot, J.-P., Sassi, W., Roure, F., Hill, K., Wilson, N., and Divies, R., 2017, Pressure and basin modeling in foothill belts: A study of the Kutubu area, Papua New Guinea Fold and Thrust Belt, in AbuAli, M. A., Moretti, I., and Bolås, H. M., eds., Petroleum Systems Analysis—Case Studies: AAPG Memoir, p. 165-190. 165–190.
- Crowhurst, P. V.; Maas, R.; Hill, K. C.; Foster, D. A.; Fanning, C. M. Isotopic constraints on crustal architecture and Permo-Triassic tectonics in New Guinea: Possible links with eastern Australia. Australian Journal of Earth Sciences 2004, 51(1), 107–122. [Google Scholar] [CrossRef]
- Johnson, R. W.; Mackenzie, D. E.; Smith, I. E. Delayed partial melting of subduction-modified mantle in Papua New Guinea. Tectonophysics 1978, v. 46, 197–216. [Google Scholar] [CrossRef]
- Mackenzie, D. E.; Johnson, R. Pleistocene volcanoes of the western Papua New Guinea Highlands: Morphology, geology, petrography, and modal and chemical analyses: Australia; Bureau of Mineral Resources, Geology and Geophysics, 1984. [Google Scholar]
- Hamilton, J. P.; Johnson, R. W.; Mackenzie, D. E.; O’Nions, R. K. Pleistocene volcanic rocks from the Fly-Highlands Province of western Papua New Guinea: A note on new Sr and Nd isotopic data and their petrogenetic implications. Journal of Volcanology and Geothermal Research 1983, v. 18, 449–459. [Google Scholar] [CrossRef]
- Meeuws, F.J.E.; Holford, S.P.; Foden, J.D.; Schofield, N. Distribution, chronology and causes of Cretaceous–Cenozoic magmatism along the magma-poor rifted southern Australian margin: Links between mantle melting and basin formation: Marine and Petroleum Geology. 2016, v. 73, 271–298. [Google Scholar] [CrossRef]
- Gündüz, M., and Kürşad, A., MagMin_PT: An Excel-based mineral classification and geothermobarometry program for magmatic rocks: Mineralogical Magazine (Retrieved July 24, 2023), ResearchGate URL provided.
- Nagao, K., Nishito, Y., Itaya, T., and Ogata, T., 1984, Age determination by the K-Ar method: Tokyo, Japan, Okayama University of Science, Hiruzen Laboratory.
- Itaya, T.; Nagao, K.; Inoue, K.; Honjou, Y.; Okada, T.; Ogata, A. Argon isotope analysis by a newly developed mass spectrometric system for K-Ar dating. Mineralogist 1991, 203–221. [Google Scholar] [CrossRef]
- Yagi, K.; Okada, T.; Honjou, Y.; Itaya, T. Argon analyses by isotopic dilution method using argon 38 spike with HIRU-Reproducibility and reliability in 25 years K-Ar dating. Bulletin of the Research Institute of Technology 2015, 33, 45–52. [Google Scholar]
- Le Bas, M.; Le Maitre, R. W.; Streckeisen, A.; Zanettin, B. Chemical classification of volcanic rocks based on the total alkali-silica diagram. Journal of Petrology 1986, v. 27, 745–750. [Google Scholar] [CrossRef]
- White, W. M., and Klein, E. M., 2014, Composition of the oceanic crust, in Holland, H., and Turekian, K. K., eds., Treatise on Geochemistry, 2nd ed.: Elsevier, Oxford, v. 4, p. 457-496.
- Rudnick, R. L., and Gao, S., 2014, Composition of the continental crust, in Holland, H., and Turekian, K. K., eds., Treatise on Geochemistry, 2nd ed.: Elsevier, Oxford, v. 4, p. 1-51.
- Saccani, E. A new method of discriminating different types of post-Archean ophiolitic basalts and their tectonic significance using Th-Nb and Ce-Dy-Yb systematics. Geoscience Frontiers 2015, v. 6(no. 4), 481–501. [Google Scholar] [CrossRef]
- Pearce, J. A., and Gale, G. H., 1977, Identification of ore-deposition environment from trace element geochemistry of associated igneous host rocks, in Volcanic Processes in Ore Genesis: Geological Society Special Publication 7, Geological Society, London, p. 14-24.
- Rollinson, H., and Pease, V., 2021, Using geochemical data to understand geological processes, 2nd ed.: Cambridge, United Kingdom, Cambridge University Press.
- GEOROC_Database., (2024). Geochemistry of Rocks of the Oceans and Continents. Retrieved from Georock: https://georoc.eu/georoc/new-start.asp.
- Gill, R., 2010, Igneous rocks and processes: Oxford, UK, University of London.
- Burchardt, S., ed., 2018, Volcanic and igneous plumbing systems—Understanding magma transport, storage and evolution in the Earth’s crust: United Kingdom/Sweden, Candice Janco.
- Roeder, P. L.; Emslie, R. F. Olivine-liquid equilibrium: Contributions to Mineralogy and Petrology 1970, v. 29(no. 4), 275–289. [CrossRef]
- Kushiro, I.; Walter, M. J. Mg-Fe partitioning between olivine and mafic-ultramafic melts. Geophysical Research Letters 1998, v. 25(no. 13), 2337–2340. [Google Scholar] [CrossRef]
- Rasmussen, M. B.; Halldórsson, S. A.; Gibson, S. A.; Guðfinnsson, G. H. Olivine chemistry reveals compositional source heterogeneities within a tilted mantle plume beneath Iceland. Earth and Planetary Science Letters 2020, v. 531, 116008. [Google Scholar] [CrossRef]
- Namur, O.; Charlier, B.; Toplis, M. J.; Higgins, M. D.; Liégeois, J.-P.; Vander Auwera, J. Crystallization sequence and magma chamber processes in the ferrobasaltic Sept-Îles layered intrusion. Journal of Petrology 2010, v. 51(no. 6), 1203–1236. [Google Scholar] [CrossRef]
- Filiberto, J.; Dasgupta, R. Fe2+-Mg partitioning between olivine and basaltic melts: Applications to the genesis of olivine-phyric shergottites and conditions of melting in the Martian interior. Earth and Planetary Science Letters 2011, v. 304(no. 3-4), 527–537. [Google Scholar] [CrossRef]
- Latypov, R. M.; Chistyakova, S. Y.; Namur, O.; Barnes, S. J. Dynamics of evolving magma chambers: Textural and chemical evolution of cumulates at the arrival of new liquidus phases. Earth-Science Reviews 2020, v. 210, 103388. [Google Scholar] [CrossRef]
- Zhou, L., Su, Y.-P., Zheng, J.-P., Dai, H.-K., Ma, Q., Wang, J., Zhang, S., Zhang, X.-H., and Xiong, K., 2023, Generation of continental intraplate alkaline basalts by edge-driven convection: Insights from the Cenozoic basalts beyond the Big Mantle Wedge: Chemical Geology, p. 1-19.
- Singtuen, V., and Phajan, S., 2021, Petrographic and geochemical data of high alkaline basalts, Sisaket Terrain, NE Thailand: Data in Brief, p. 1-9.
- Dada, A. C.; Maro, G.; Caffe, P. J.; Ulberich, J. P.; Fracchia, D. Early Paleogene alkaline magmatism in the Subandean Ranges of Jujuy Province. Journal of South American Earth Sciences 2024, 1–14. [Google Scholar]
- Jankovics, M. É.; Harangi, S.; Kiss, B.; Ntaflos, T. Open-system evolution of the Füzes-tó alkaline basaltic magma, western Pannonian Basin: Constraints from mineral textures and compositions. Lithos 2012, 25–37. [Google Scholar] [CrossRef]
- Jankovics, M. É.; Sági, T.; Astbury, R. L.; Petrelli, M.; Kiss, B.; Ubide, T.; Németh, K.; Ntaflos, T.; Harangi, S. Olivine major and trace element compositions coupled with spinel chemistry to unravel the magmatic systems feeding monogenetic basaltic volcanoes. Journal of Volcanology and Geothermal Research 2019, v. 369, 203–223. [Google Scholar] [CrossRef]
- Cohen, B. E.; Mark, D. F.; Fallon, S. J.; Stephenson, P. J. Holocene-Neogene volcanism in northeastern Australia: Chronology and eruption history. Quaternary Geochronology 2017, 39, 79–91. [Google Scholar] [CrossRef]
- Gaina, C.; Müller, R. D.; Royer, J.-Y.; Symonds, P. Evolution of the Louisiade triple junction. Journal of Geophysical Research 1999, v. 104(no. B6), 12927–12939. [Google Scholar] [CrossRef]
- Mullen, E. K.; McCallum, I. S. Origin of basalts in a hot subduction setting: Petrological and geochemical insights from Mt. Baker, northern Cascade arc. Journal of Petrology 2014, v. 55(no. 2), 241–281. [Google Scholar] [CrossRef]
- Sani, C.; Sanfilippo, A.; Peyve, A. A.; Genske, F.; Stracke, A. Earth mantle’s isotopic record of progressive chemical depletion. AGU Advances 2023, v. 4, e2022AV000792. [Google Scholar] [CrossRef]
- Hall, R.; Spakman, W. Subducted slabs beneath the eastern Indonesia-Tonga region: Insights from tomography. Earth and Planetary Science Letters 2002, v. 201(no. 2), 321–336. [Google Scholar] [CrossRef]
- Pearce, J. A., 1983, Role of the sub-continental lithosphere in magma genesis at active continental margins, in Hawkesworth, C. J., and Norry, M. J., eds., Continental Basalts and Mantle Xenoliths: Nantwich, Cheshire, Shiva Publications, p. 230-249.
- Hofmann, A. W. Mantle geochemistry: The message from oceanic volcanism. Nature 1997, v. 385, 219–229. [Google Scholar] [CrossRef]
- Condie, K. C. High field strength element ratios in Archean basalts: A window to evolving sources of mantle plumes. Lithos 2005, v. 79(no. 3-4), 491–504. [Google Scholar] [CrossRef]
- Foley, S. F.; Barth, M. G.; Jenner, G. A. Rutile/melt partition coefficients for trace elements and an assessment of the influence of rutile on the trace element characteristics of subduction zone magmas. Geochimica et Cosmochimica Acta 2000, v. 64(no. 5), 933–938. [Google Scholar] [CrossRef]
- Kamber, B. S.; Greig, A.; Schoenberg, R.; Collerson, K. D. A refined solution to Earth’s hidden niobium: Implications for evolution of continental crust and mode of core formation. Precambrian Research 2003, v. 126(no. 3-4), 289–308. [Google Scholar] [CrossRef]
- Schmidt, M. W.; Dardon, A.; Chazot, G.; Vannucci, R. The dependence of Nb and Ta rutile-melt partitioning on melt composition and Nb/Ta fractionation during subduction processes. Earth and Planetary Science Letters 2004, v. 226(no. 3-4), 415–432. [Google Scholar] [CrossRef]
- Klemme, S.; Prowatke, S.; Hametner, K.; Günther, D. Partitioning of trace elements between rutile and silicate melts: Implications for subduction zones. Geochimica et Cosmochimica Acta 2005, v. 69(no. 9), 2361–2371. [Google Scholar] [CrossRef]
Figure 1.
Tectonic map of PNG within the southwestern Pacific region. Red symbols indicate active and extinct volcanoes (up to Pleistocene age). Fly Platform is located on southwestern mainland of PNG.
Figure 1.
Tectonic map of PNG within the southwestern Pacific region. Red symbols indicate active and extinct volcanoes (up to Pleistocene age). Fly Platform is located on southwestern mainland of PNG.
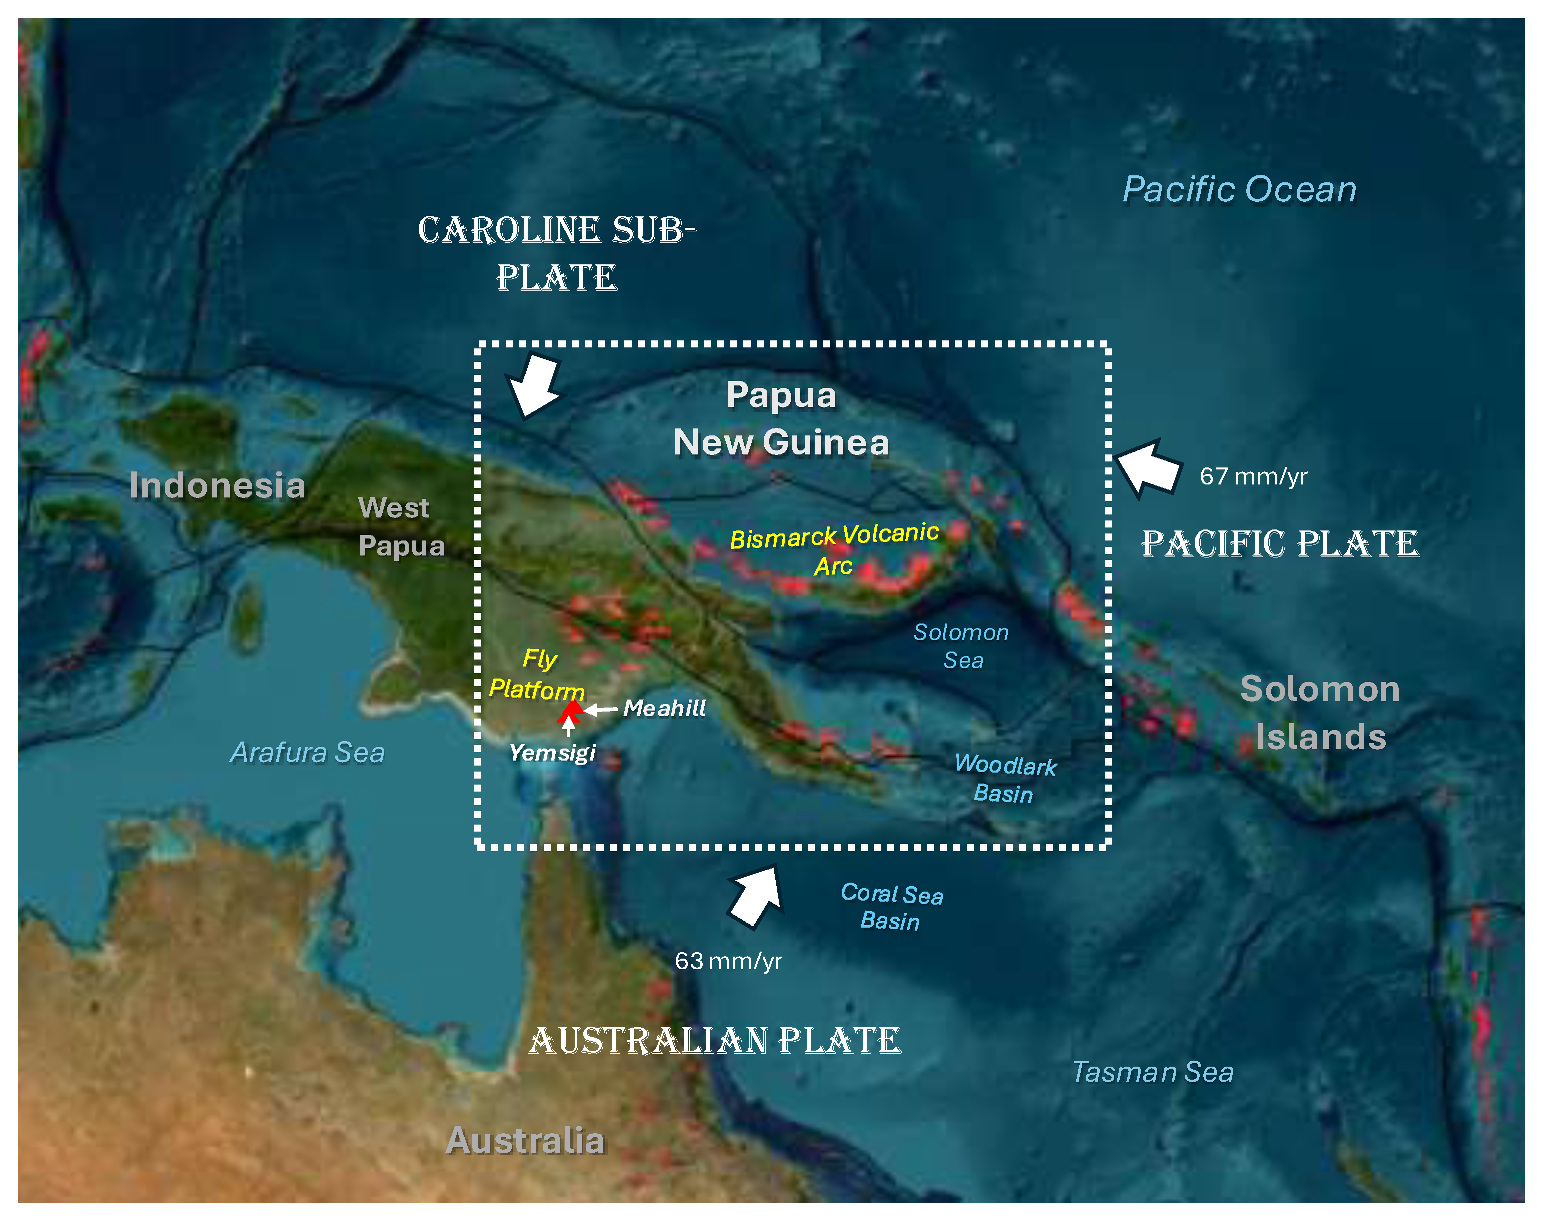
Figure 3.
Location map of the study areas on the Fly Platform, southern Papua New Guinea. Red squares indicate localities, blue circles show Meahill basalt occurrences and pink diamonds show Yemsigi basalt occurrences. Major rivers and 50 m contour lines are shown for reference.
Figure 3.
Location map of the study areas on the Fly Platform, southern Papua New Guinea. Red squares indicate localities, blue circles show Meahill basalt occurrences and pink diamonds show Yemsigi basalt occurrences. Major rivers and 50 m contour lines are shown for reference.
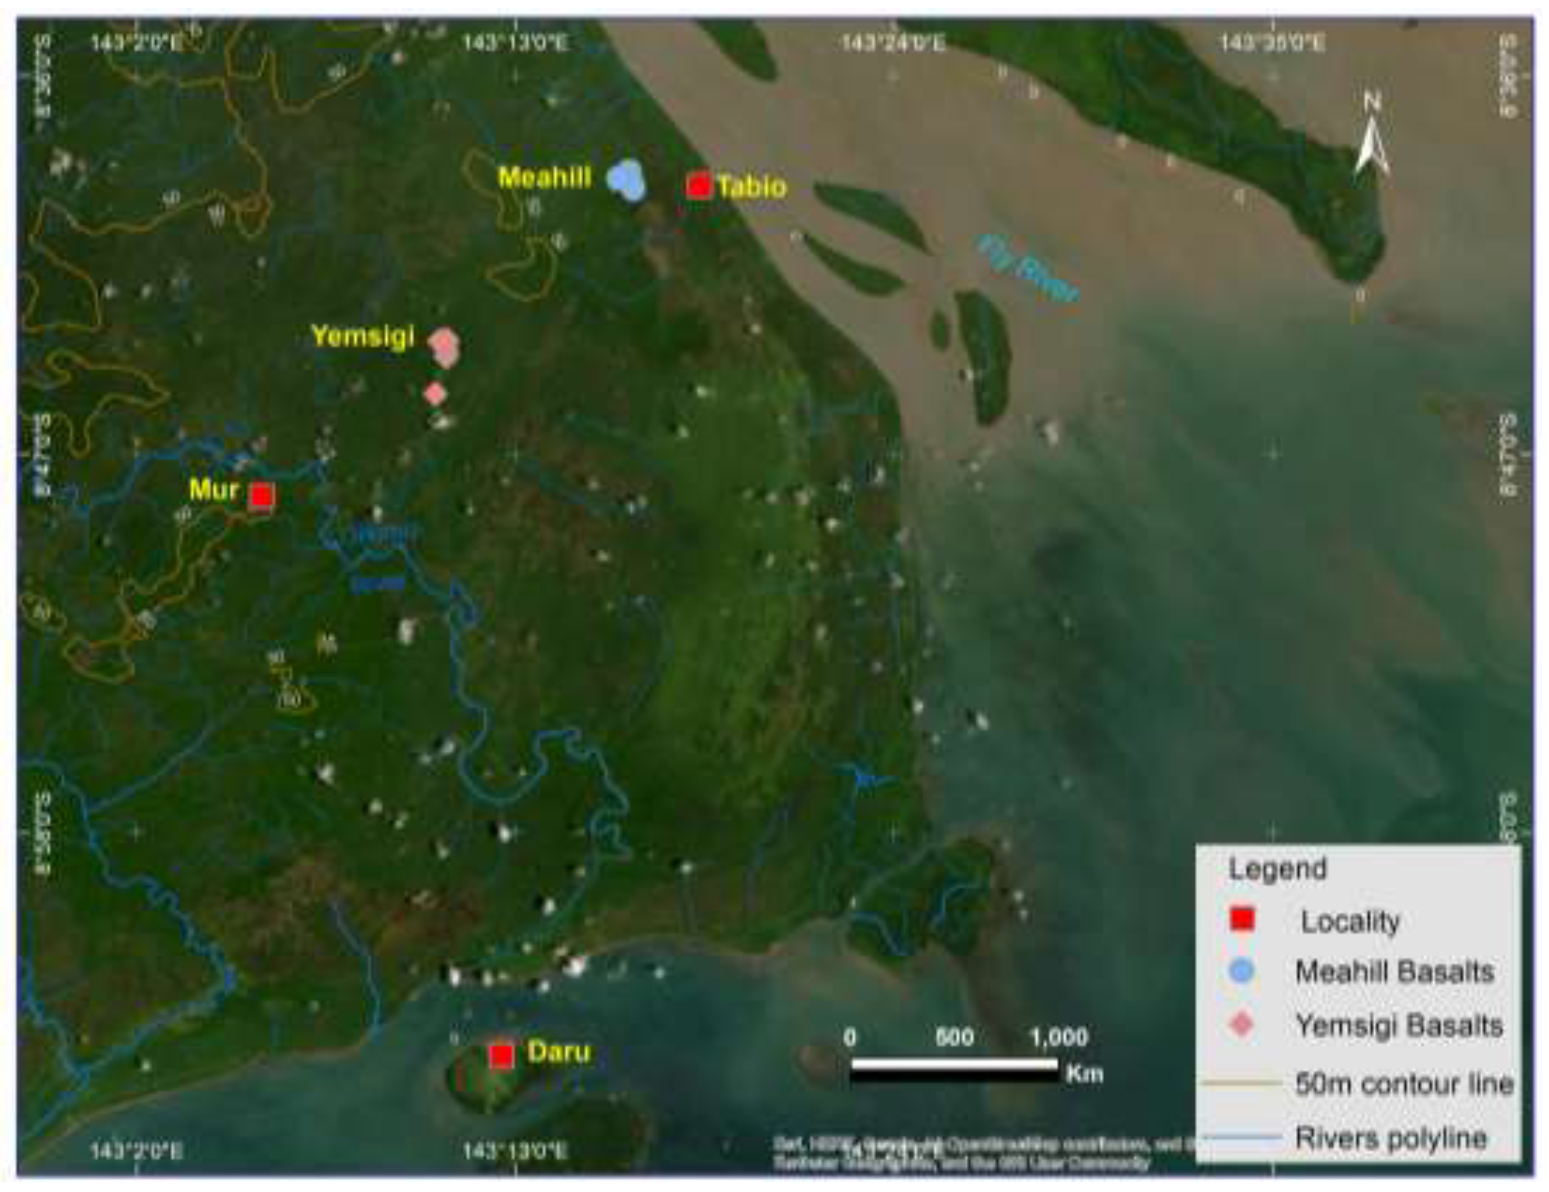
Figure 10.
Plots of forsterite (Fo) content versus NiO and CaO concentrations in olivine crystals from the Yemsigi basalt (n = 79) and Meahill basalt (n = 61). Panels (a) and (b) show NiO variations, while panels (c) and (d) illustrate CaO trends. In both localities, NiO concentrations increase with increasing Fo content, defining a positive correlation. In contrast, CaO concentrations decrease as Fo increases. Red dotted lines indicate the general direction of the observed trends.
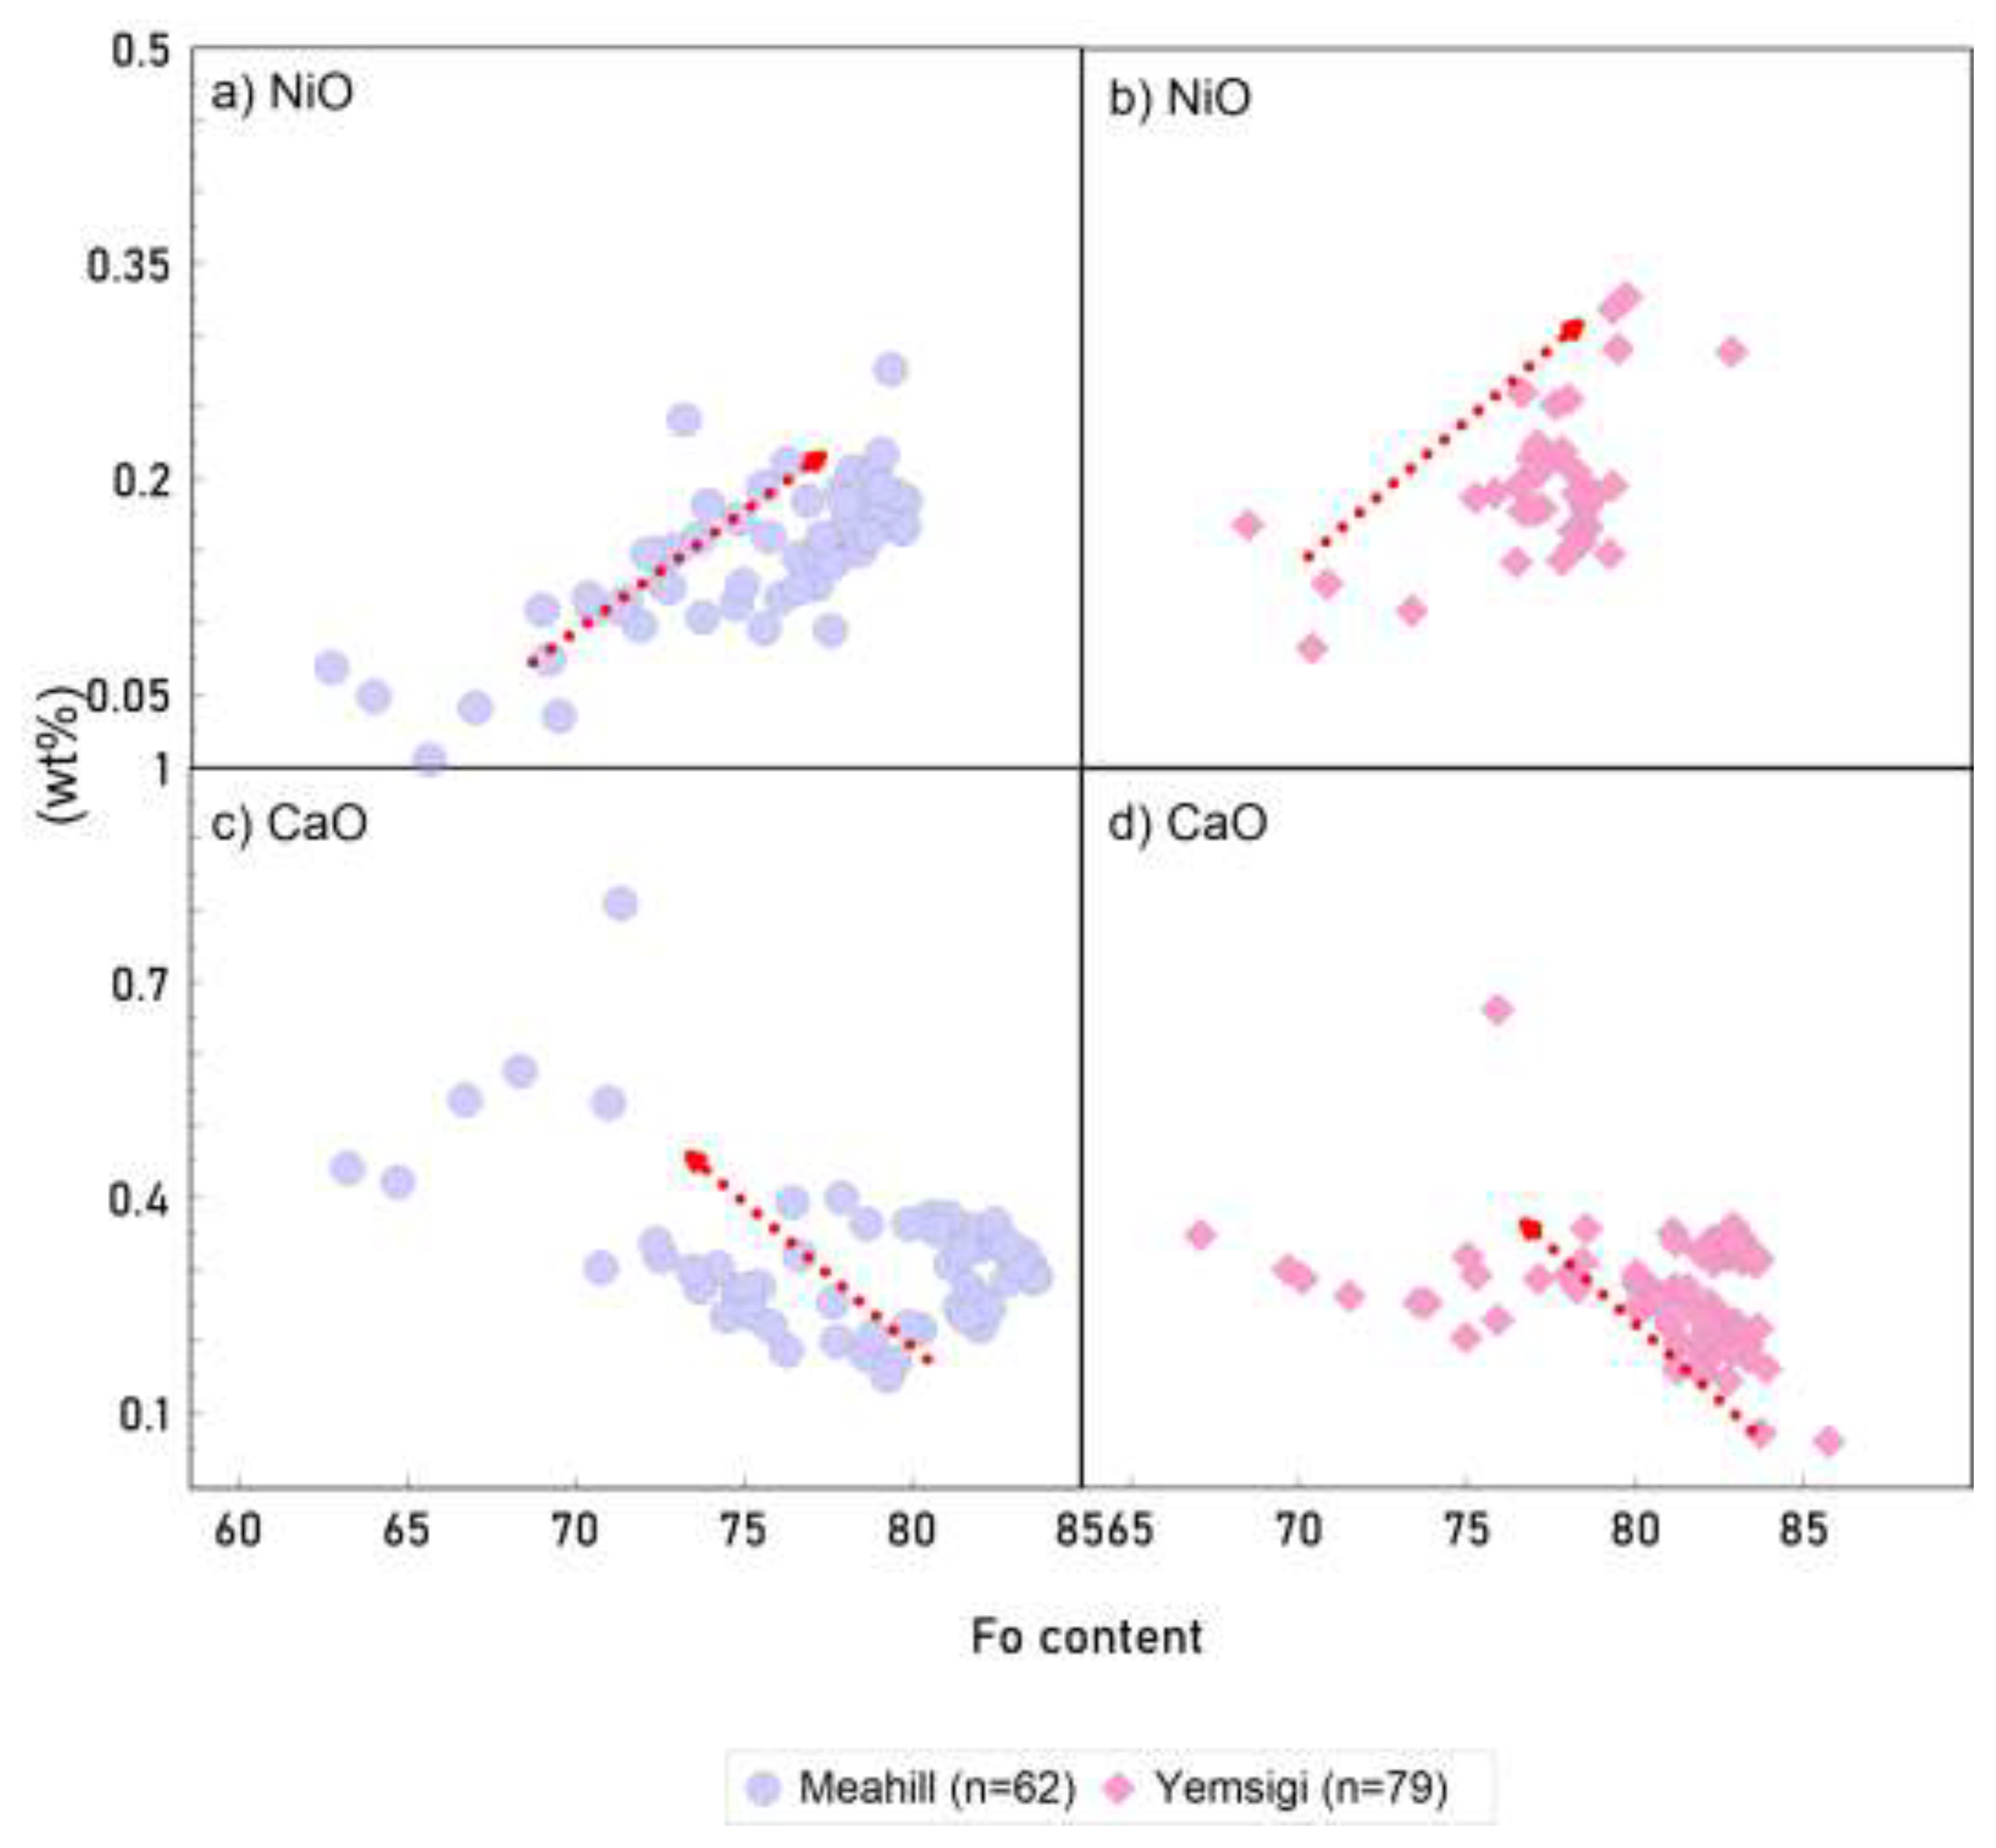
Figure 11.
a) Pyroxene classification diagram, b) Anorthite-Albite-Orthoclase feldspar classification diagram, and (c) FeO-Fe2O3-TiO₂ ternary diagram showing the classification of titanomagnetite.
Figure 11.
a) Pyroxene classification diagram, b) Anorthite-Albite-Orthoclase feldspar classification diagram, and (c) FeO-Fe2O3-TiO₂ ternary diagram showing the classification of titanomagnetite.
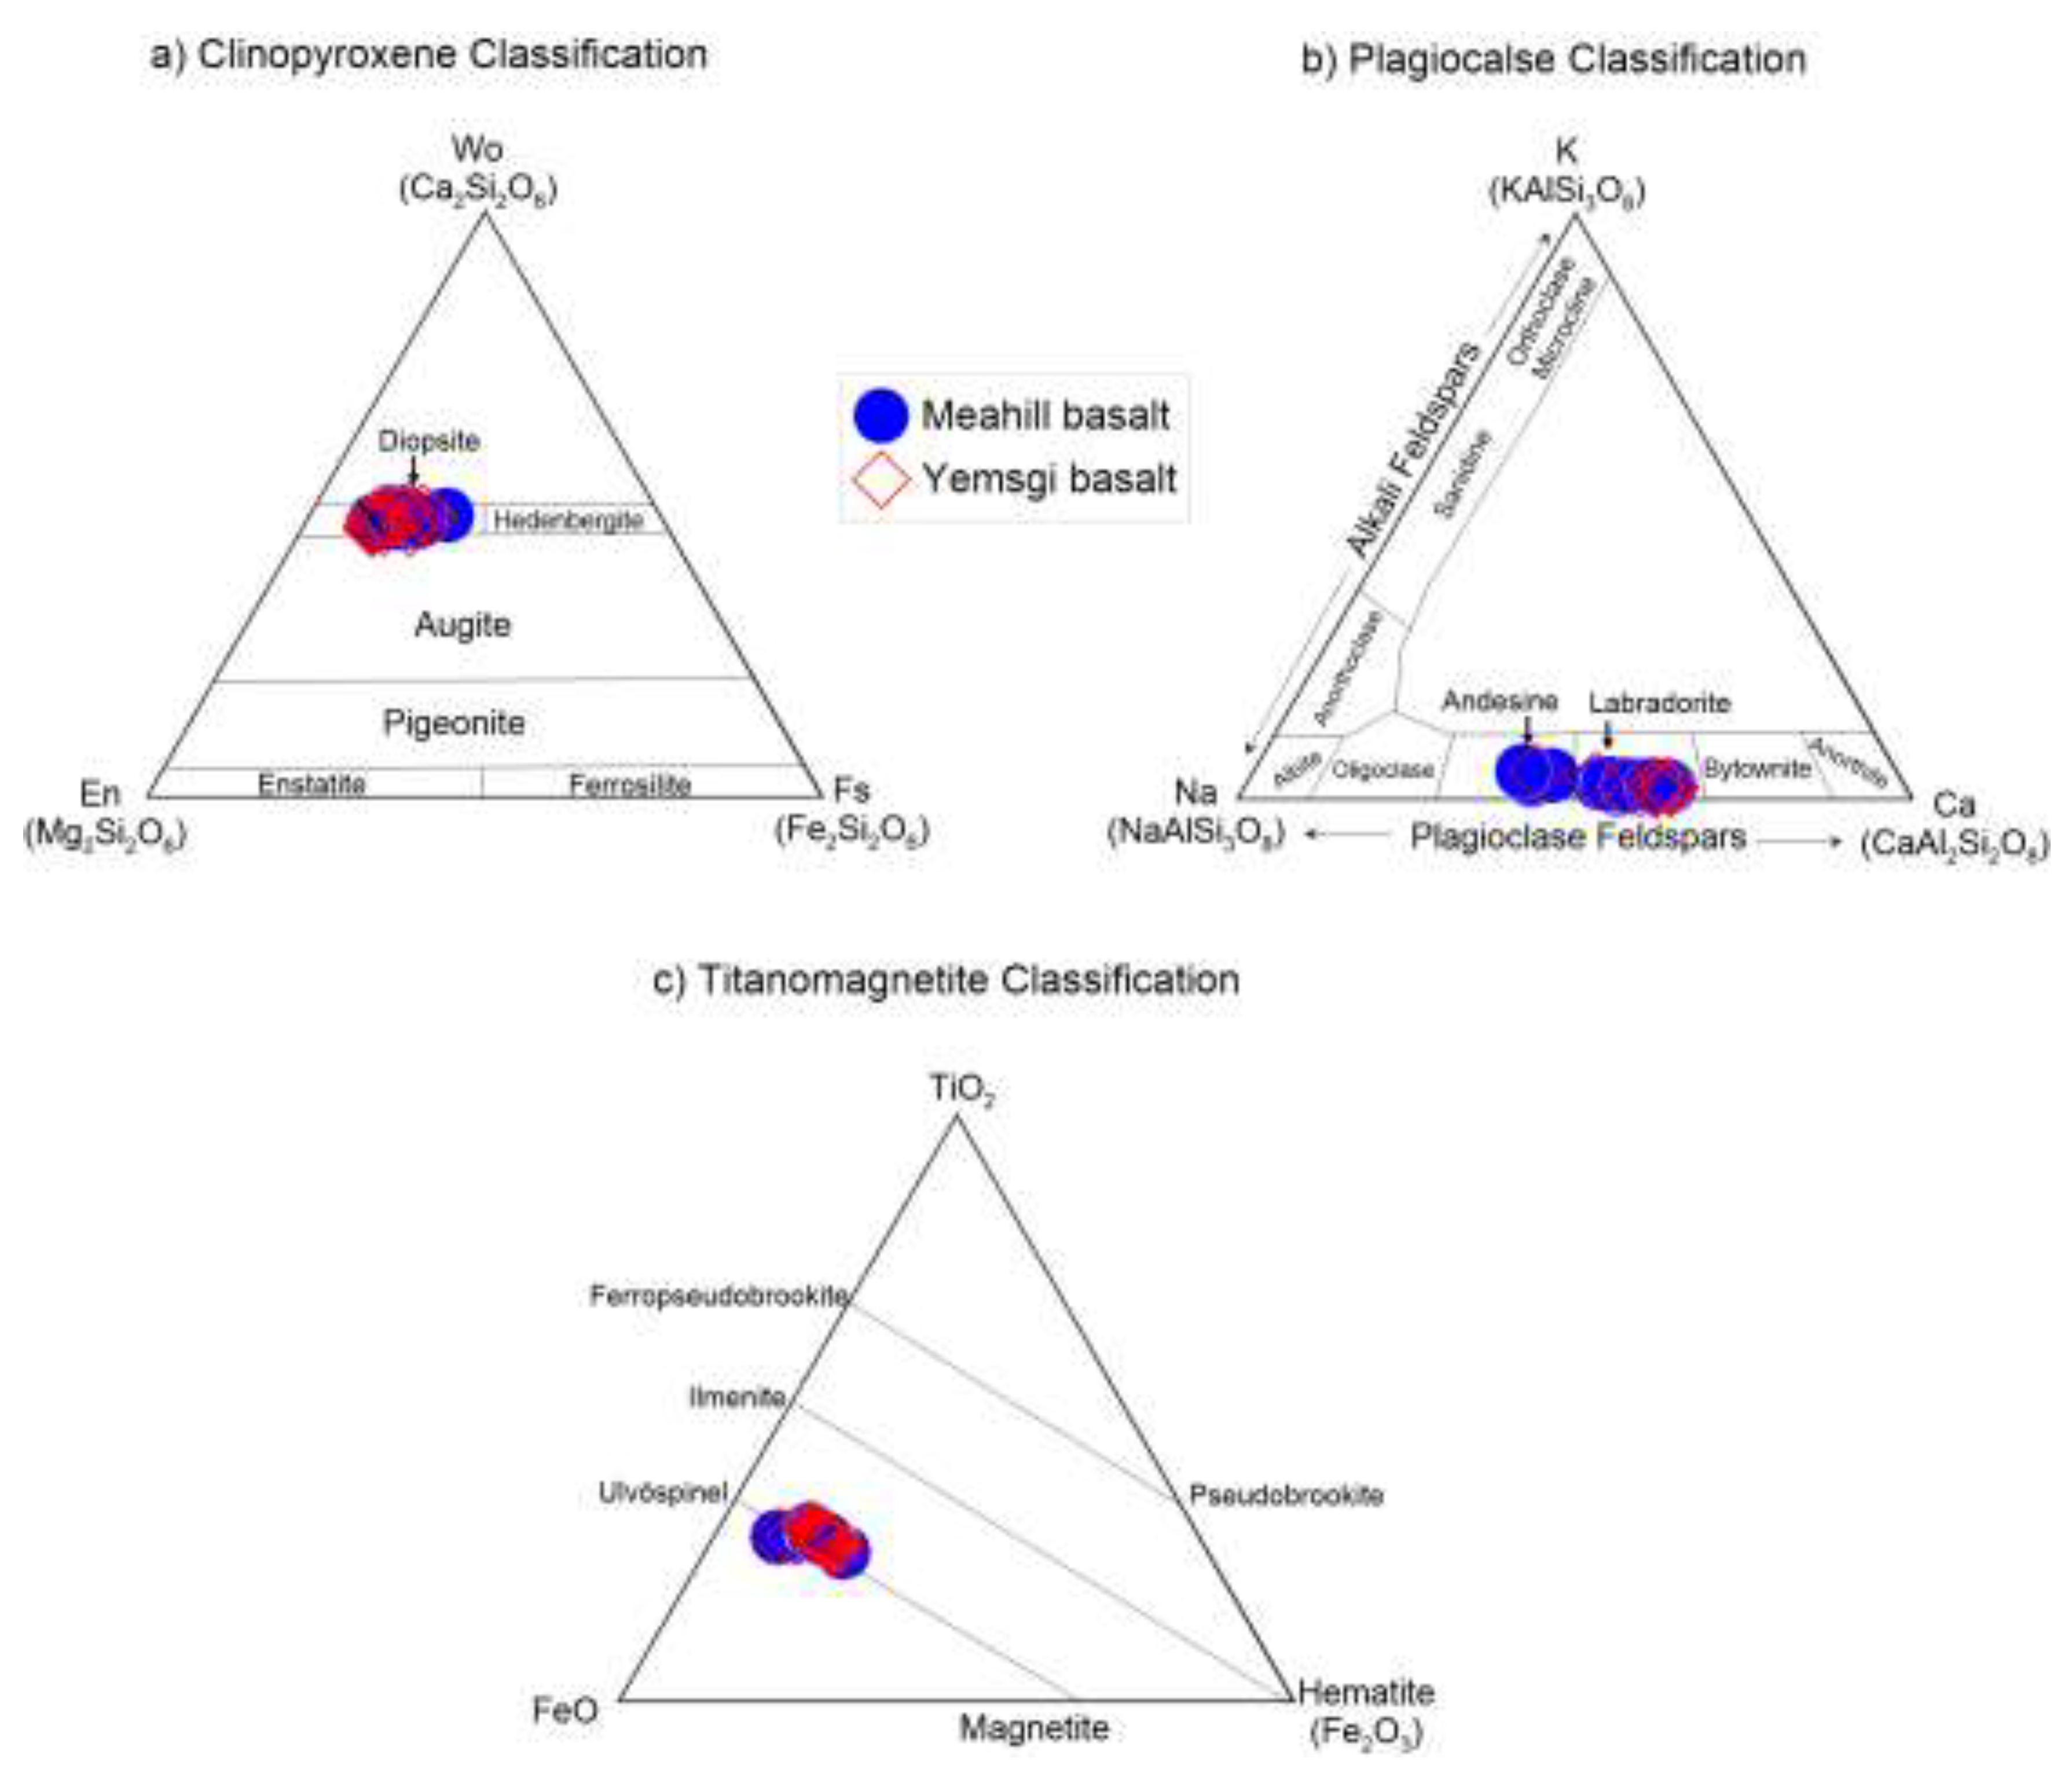
Figure 12.
Harker variation diagrams showing whole-rock major-element relationships for Meahill and Yemsigi basalts. Plots show SiO₂ (wt%) versus (a) loss on ignition (LOI), (b) CaO, (c) MgO, (d) Fe₂O₃, (e) TiO2, and (f) Al2O3.
Figure 12.
Harker variation diagrams showing whole-rock major-element relationships for Meahill and Yemsigi basalts. Plots show SiO₂ (wt%) versus (a) loss on ignition (LOI), (b) CaO, (c) MgO, (d) Fe₂O₃, (e) TiO2, and (f) Al2O3.
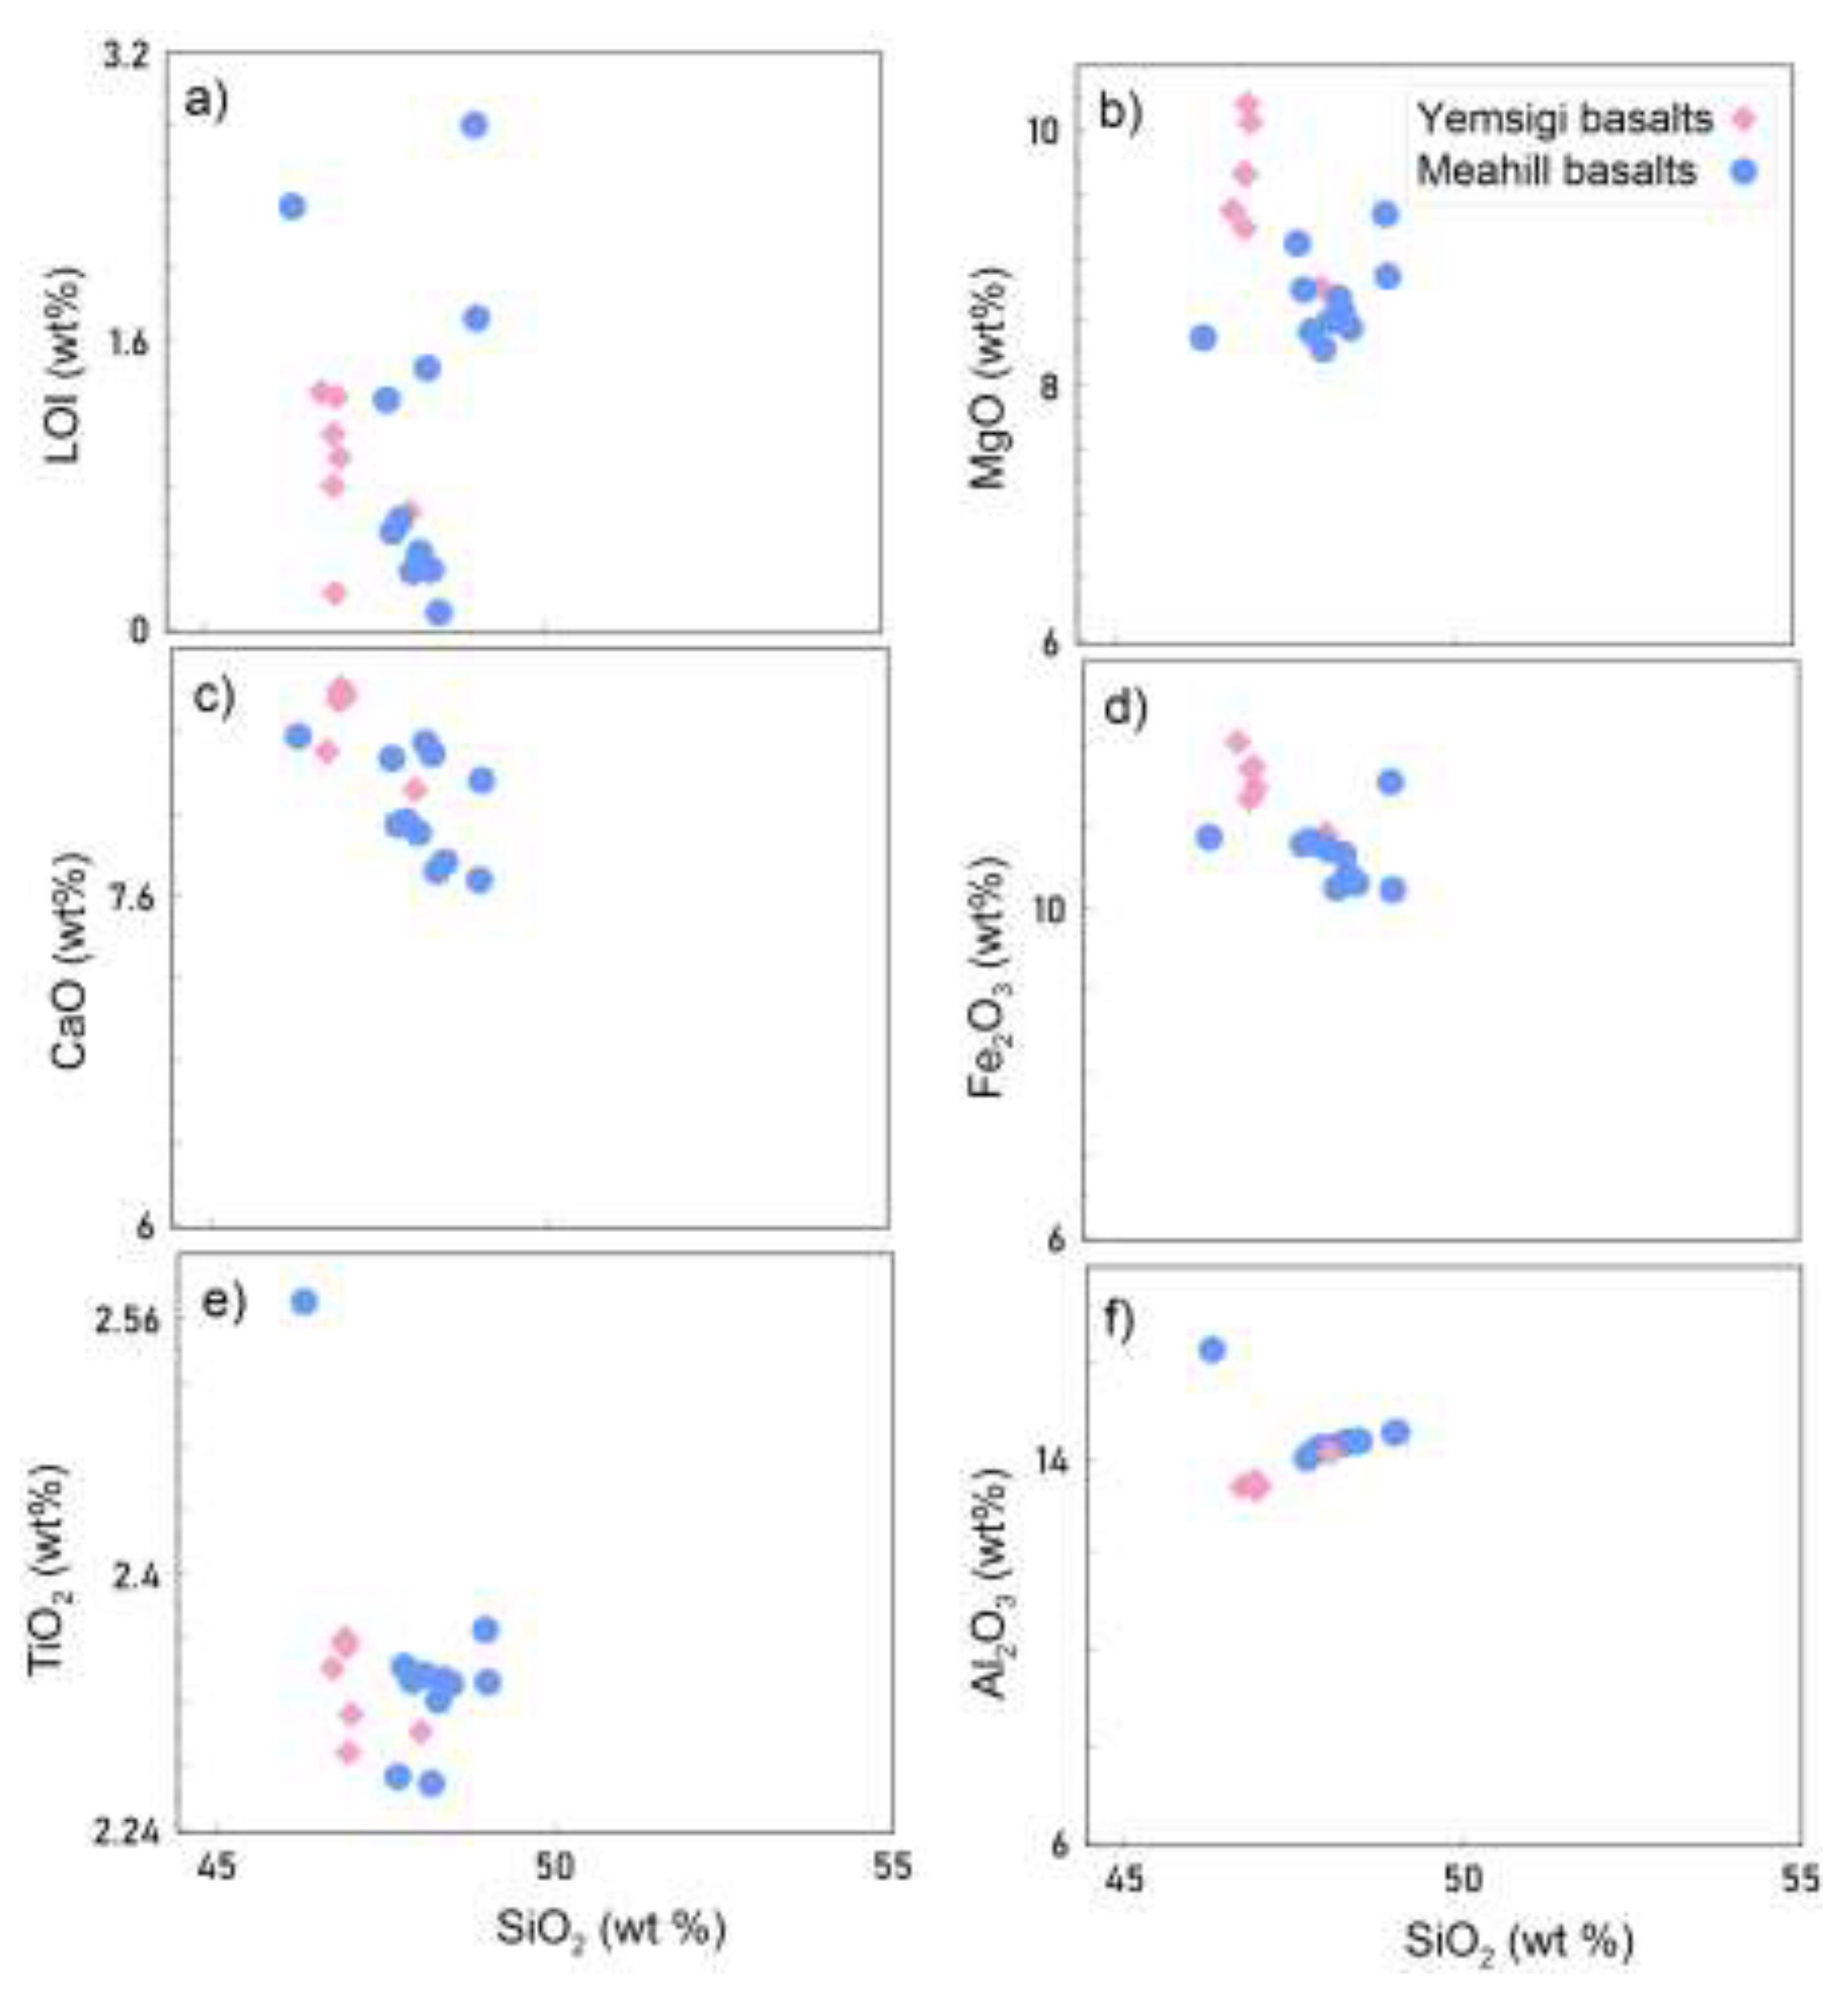
Figure 13.
Total alkali-silica (TAS) classification diagram after Le Bas et al. (1986) [30] and SiO₂ versus K₂O diagram. Samples from Northeast Queensland and Central Highlands are also plotted for comparison.
Figure 13.
Total alkali-silica (TAS) classification diagram after Le Bas et al. (1986) [30] and SiO₂ versus K₂O diagram. Samples from Northeast Queensland and Central Highlands are also plotted for comparison.
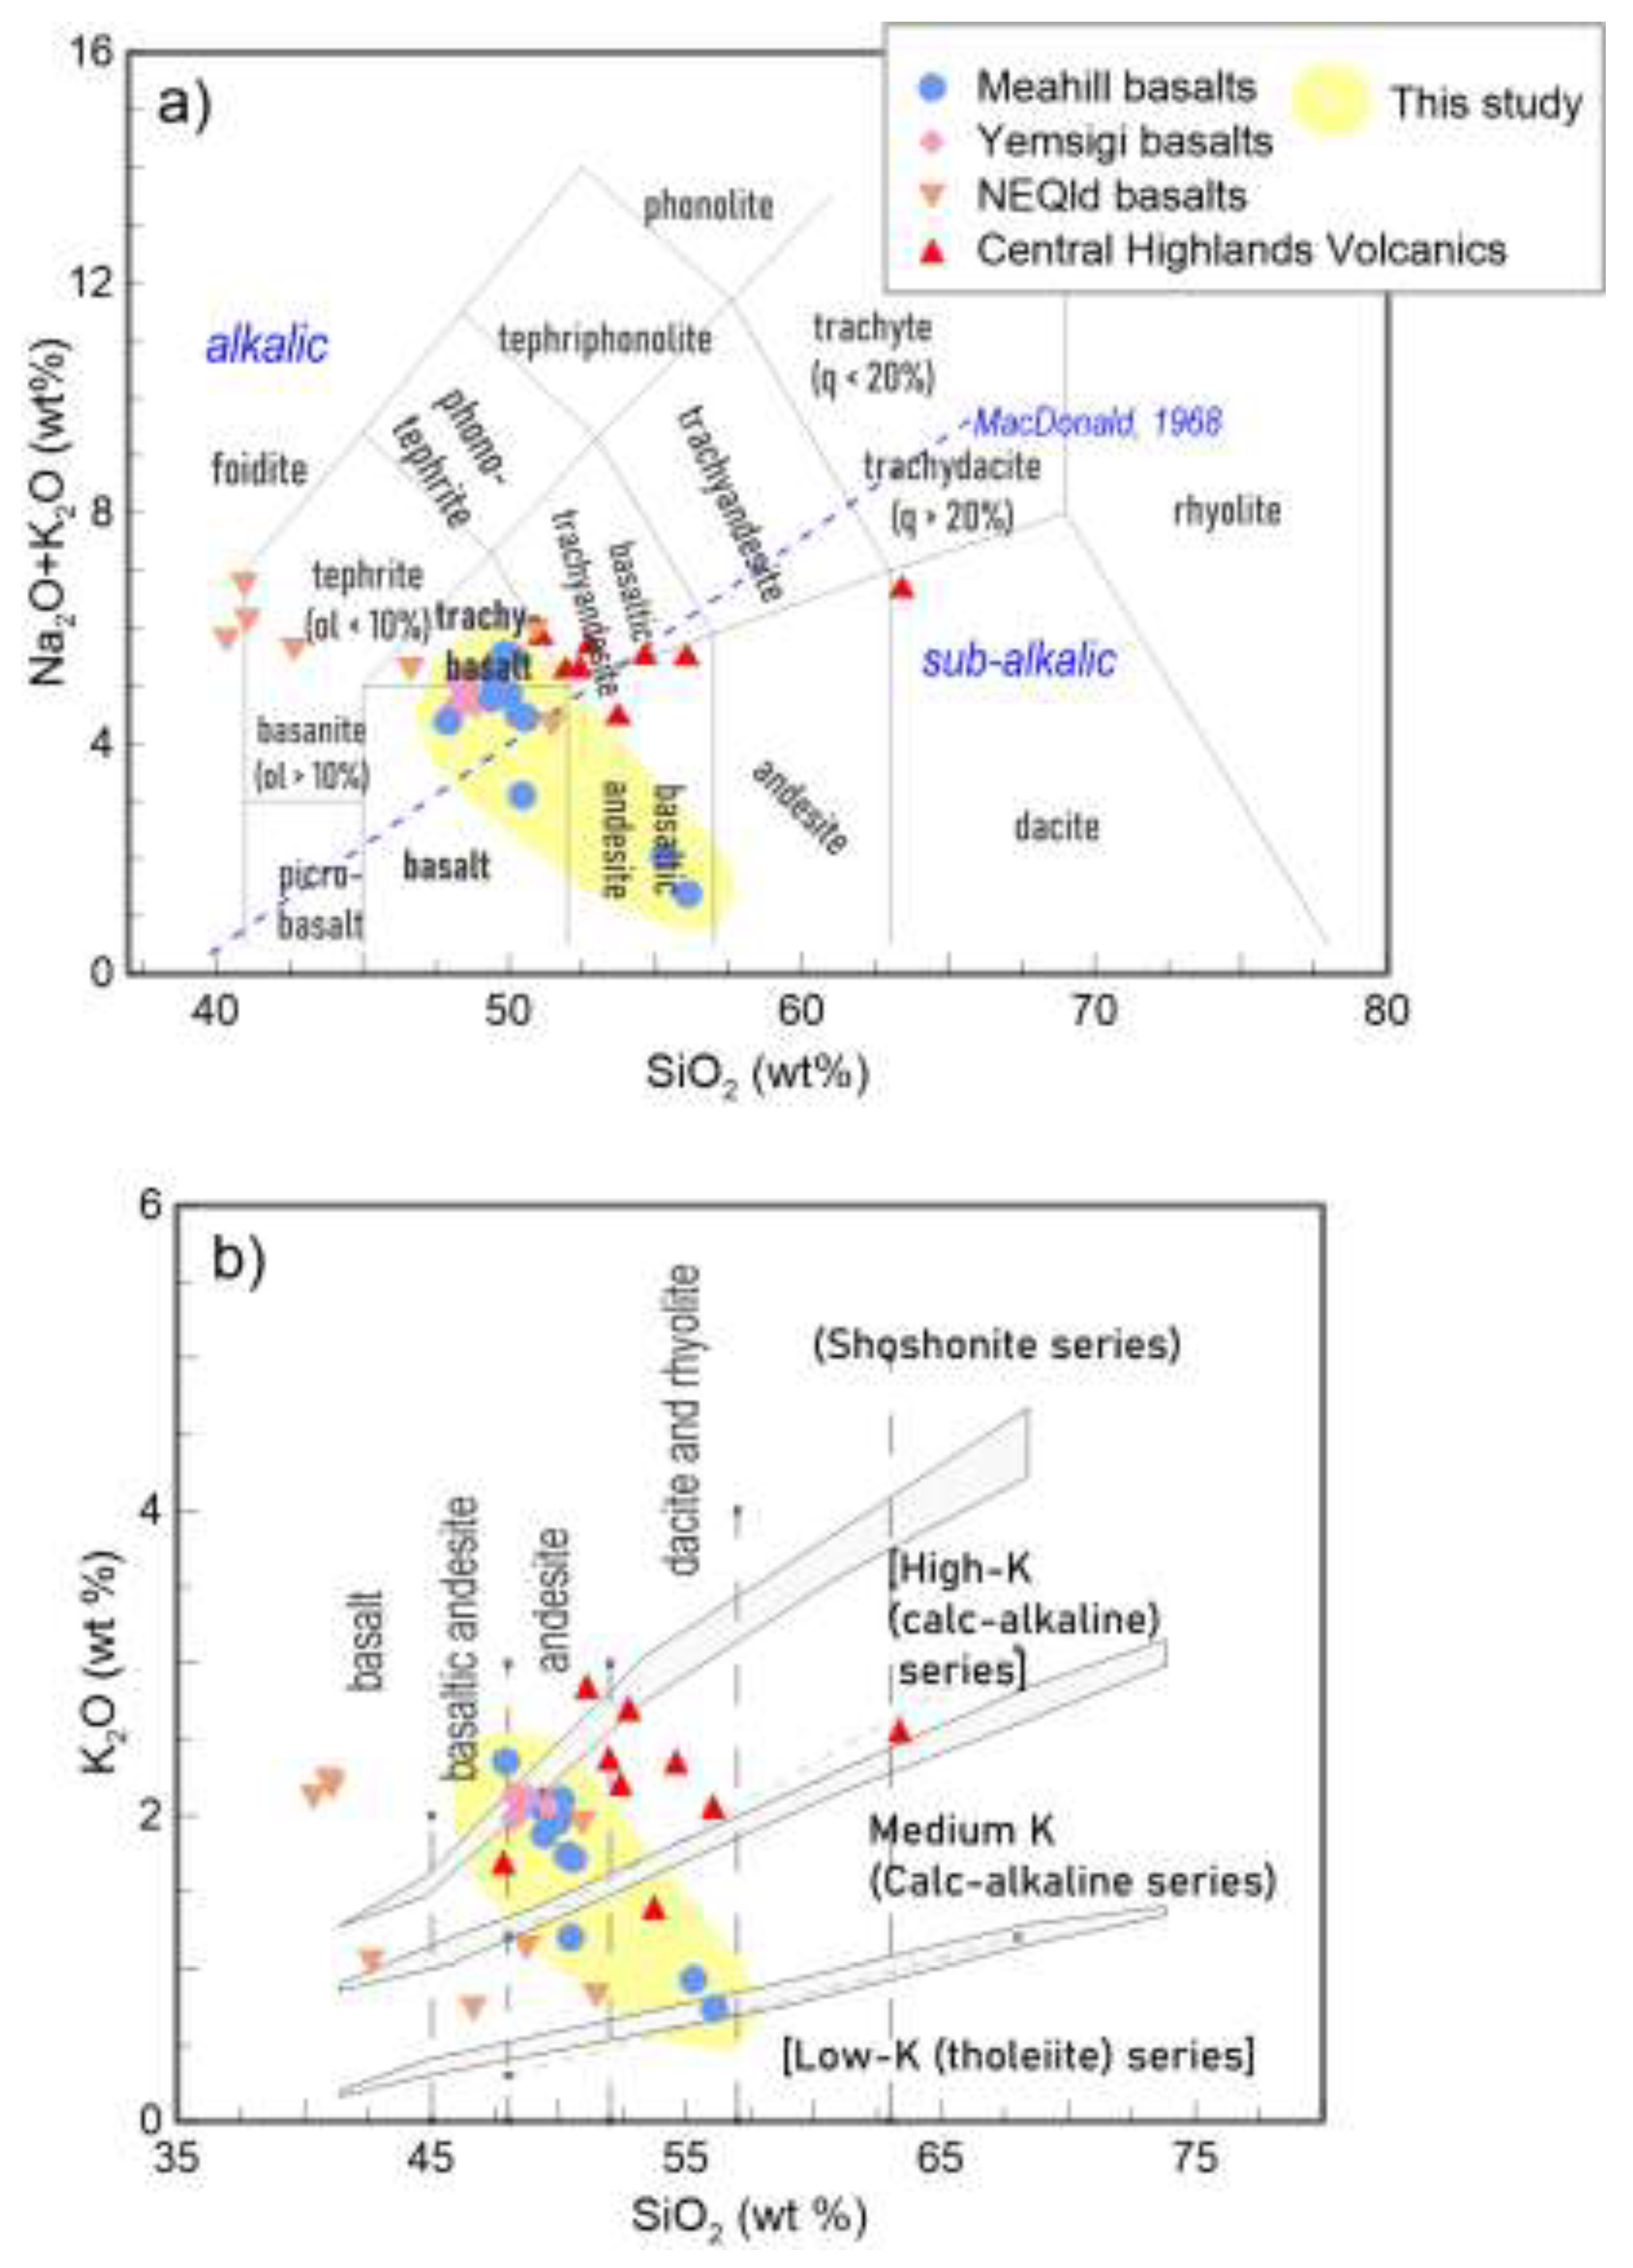
Figure 14.
Major- and trace-element variation diagrams plotted against MgO (wt%) comparing Meahill and Yemsigi basalts. (a) SiO₂ (wt%), (b) Al₂O₃ (wt%), (c) CaO (wt%), (d) Fe₂O₃ (wt%), (e) P₂O₅ (wt%), (f) K₂O (wt%), (g) TiO₂ (wt%), (h) Na₂O (wt%), (i) MnO (wt%), (j) Cr (ppm), and (k) Ni (ppm).
Figure 14.
Major- and trace-element variation diagrams plotted against MgO (wt%) comparing Meahill and Yemsigi basalts. (a) SiO₂ (wt%), (b) Al₂O₃ (wt%), (c) CaO (wt%), (d) Fe₂O₃ (wt%), (e) P₂O₅ (wt%), (f) K₂O (wt%), (g) TiO₂ (wt%), (h) Na₂O (wt%), (i) MnO (wt%), (j) Cr (ppm), and (k) Ni (ppm).
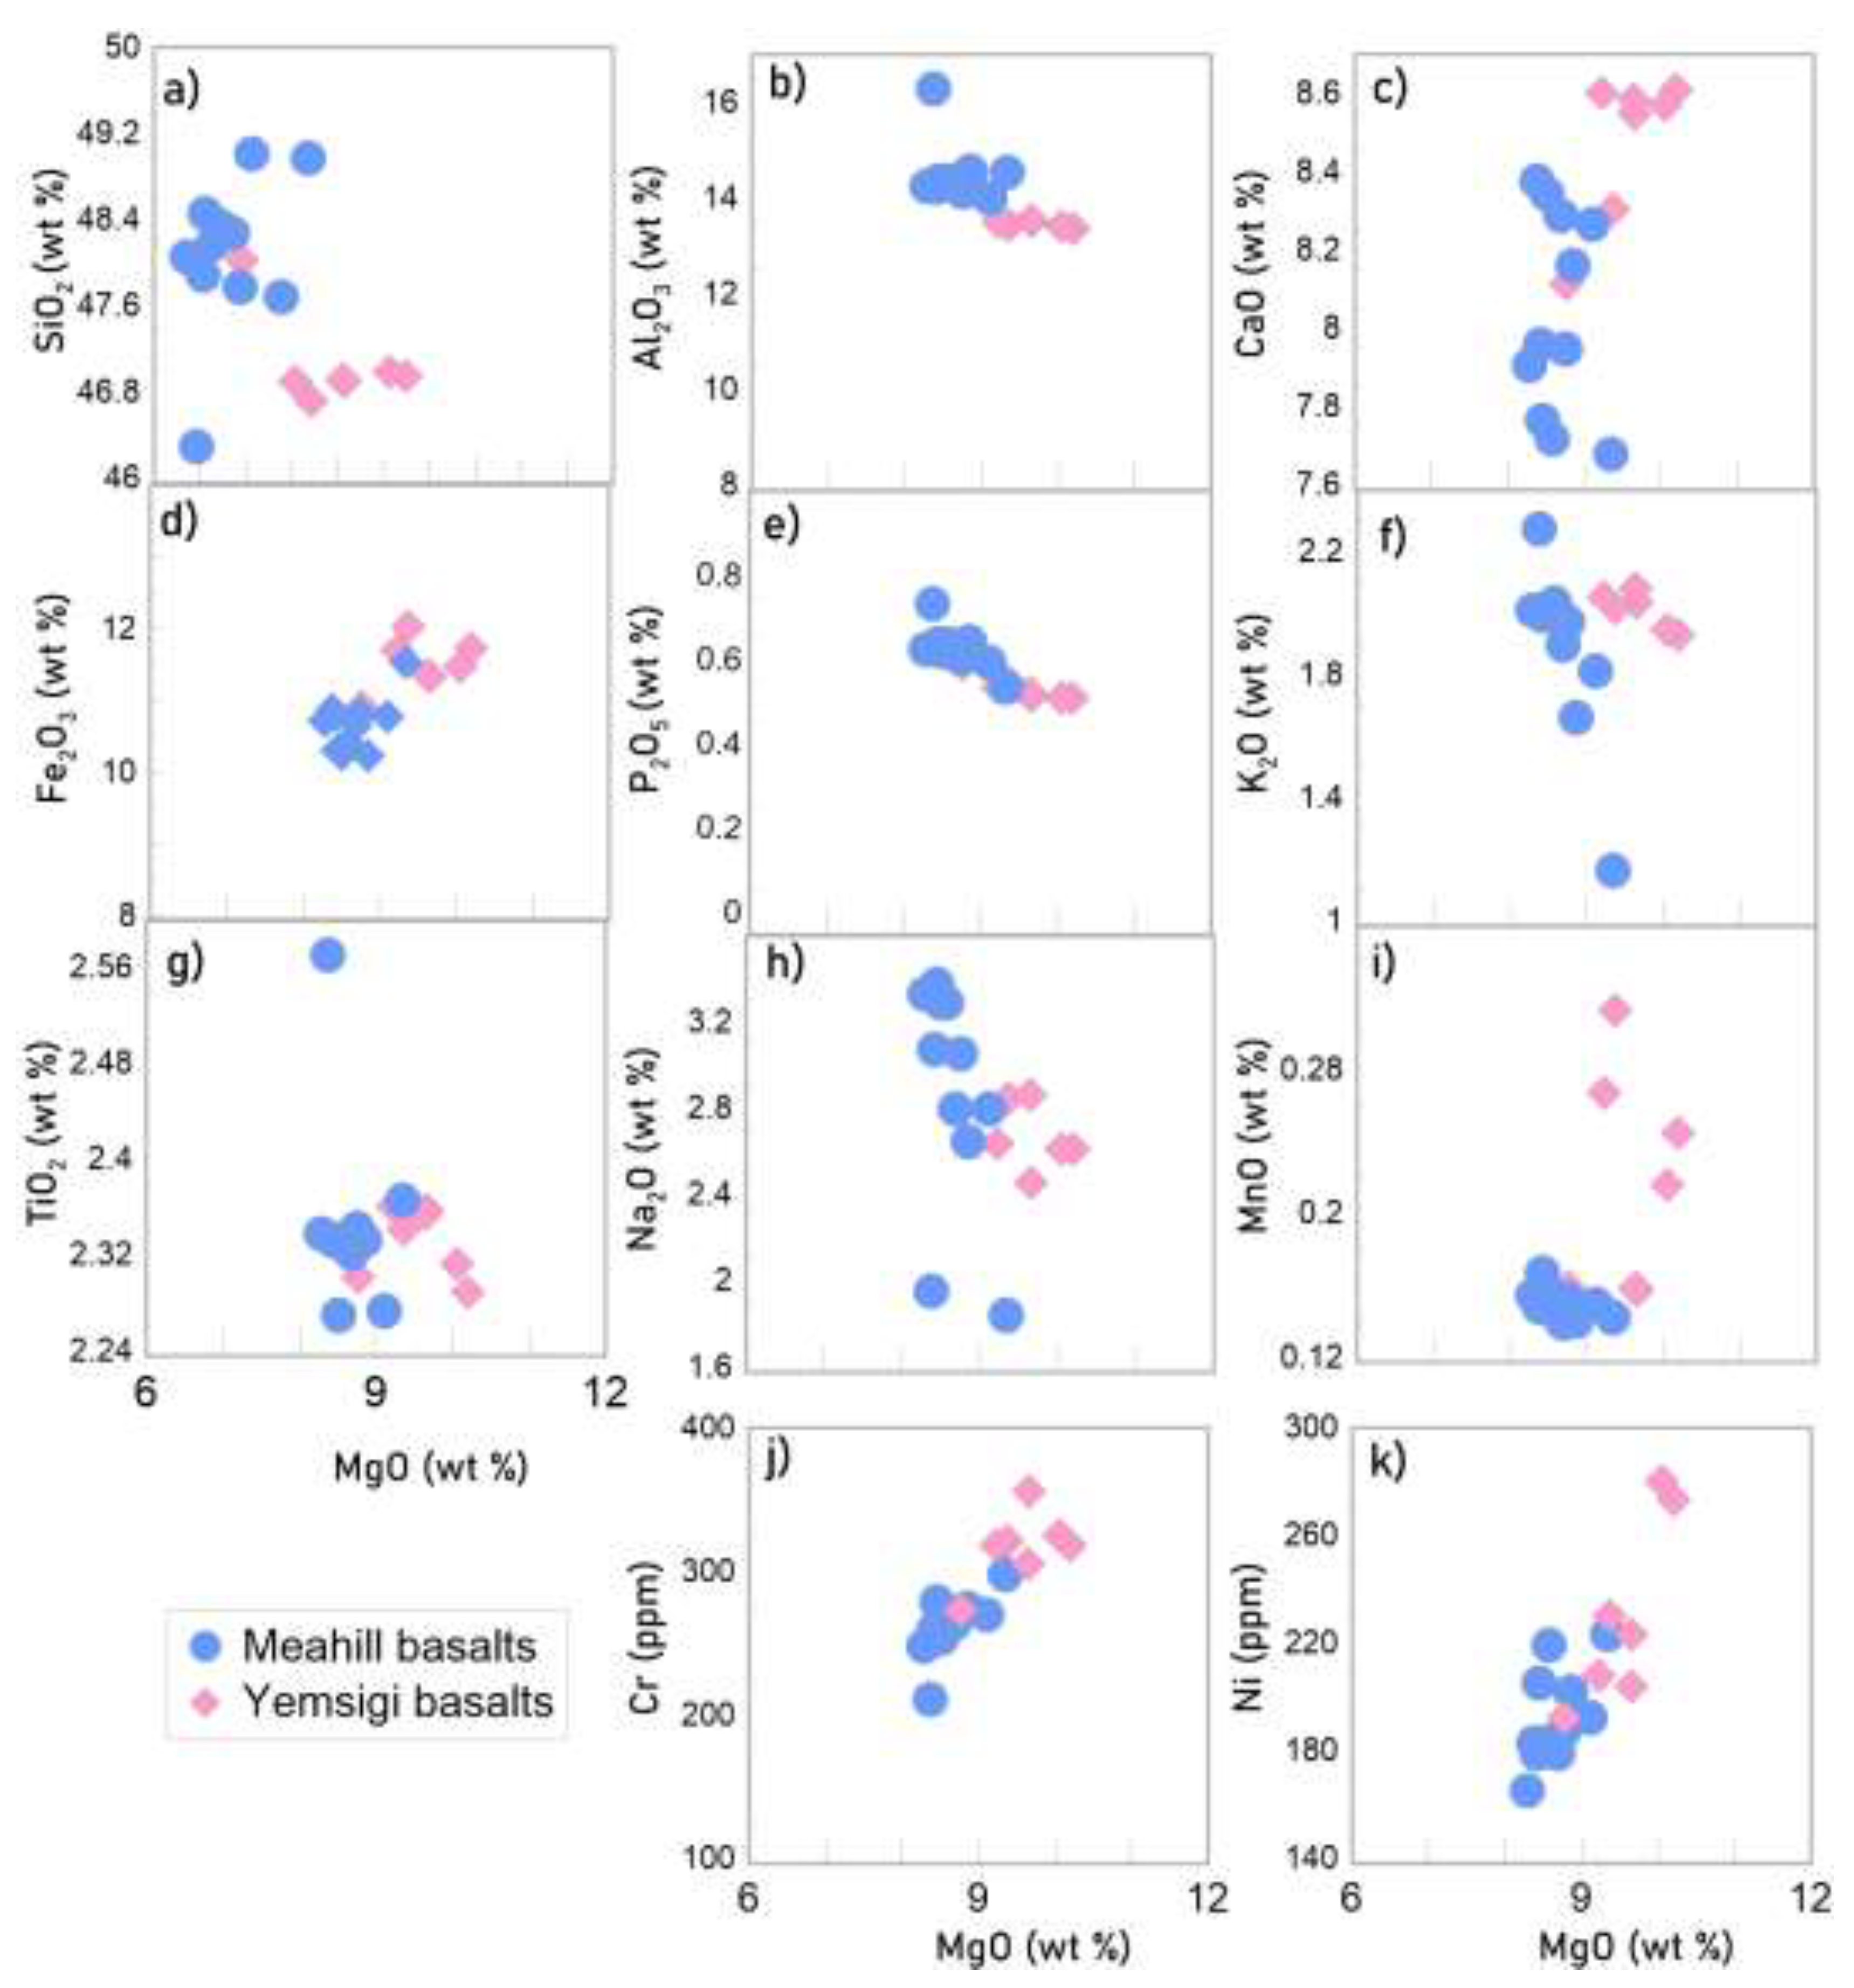
Figure 15.
Spider diagrams showing a) N-MORB-normalized, and Upper Crust-normalized REE patterns for the Meahill and Yemsigi basalts, b) N-MORB-normalized and Upper Crust-normalized HFSE, and LILE patterns for the Meahill and Yemsigi basalts only. The N-MORB normalization values are from White and Klein (2014) [31], and Upper Continental Crust values are from Rudnick and Gao (2014)[32].
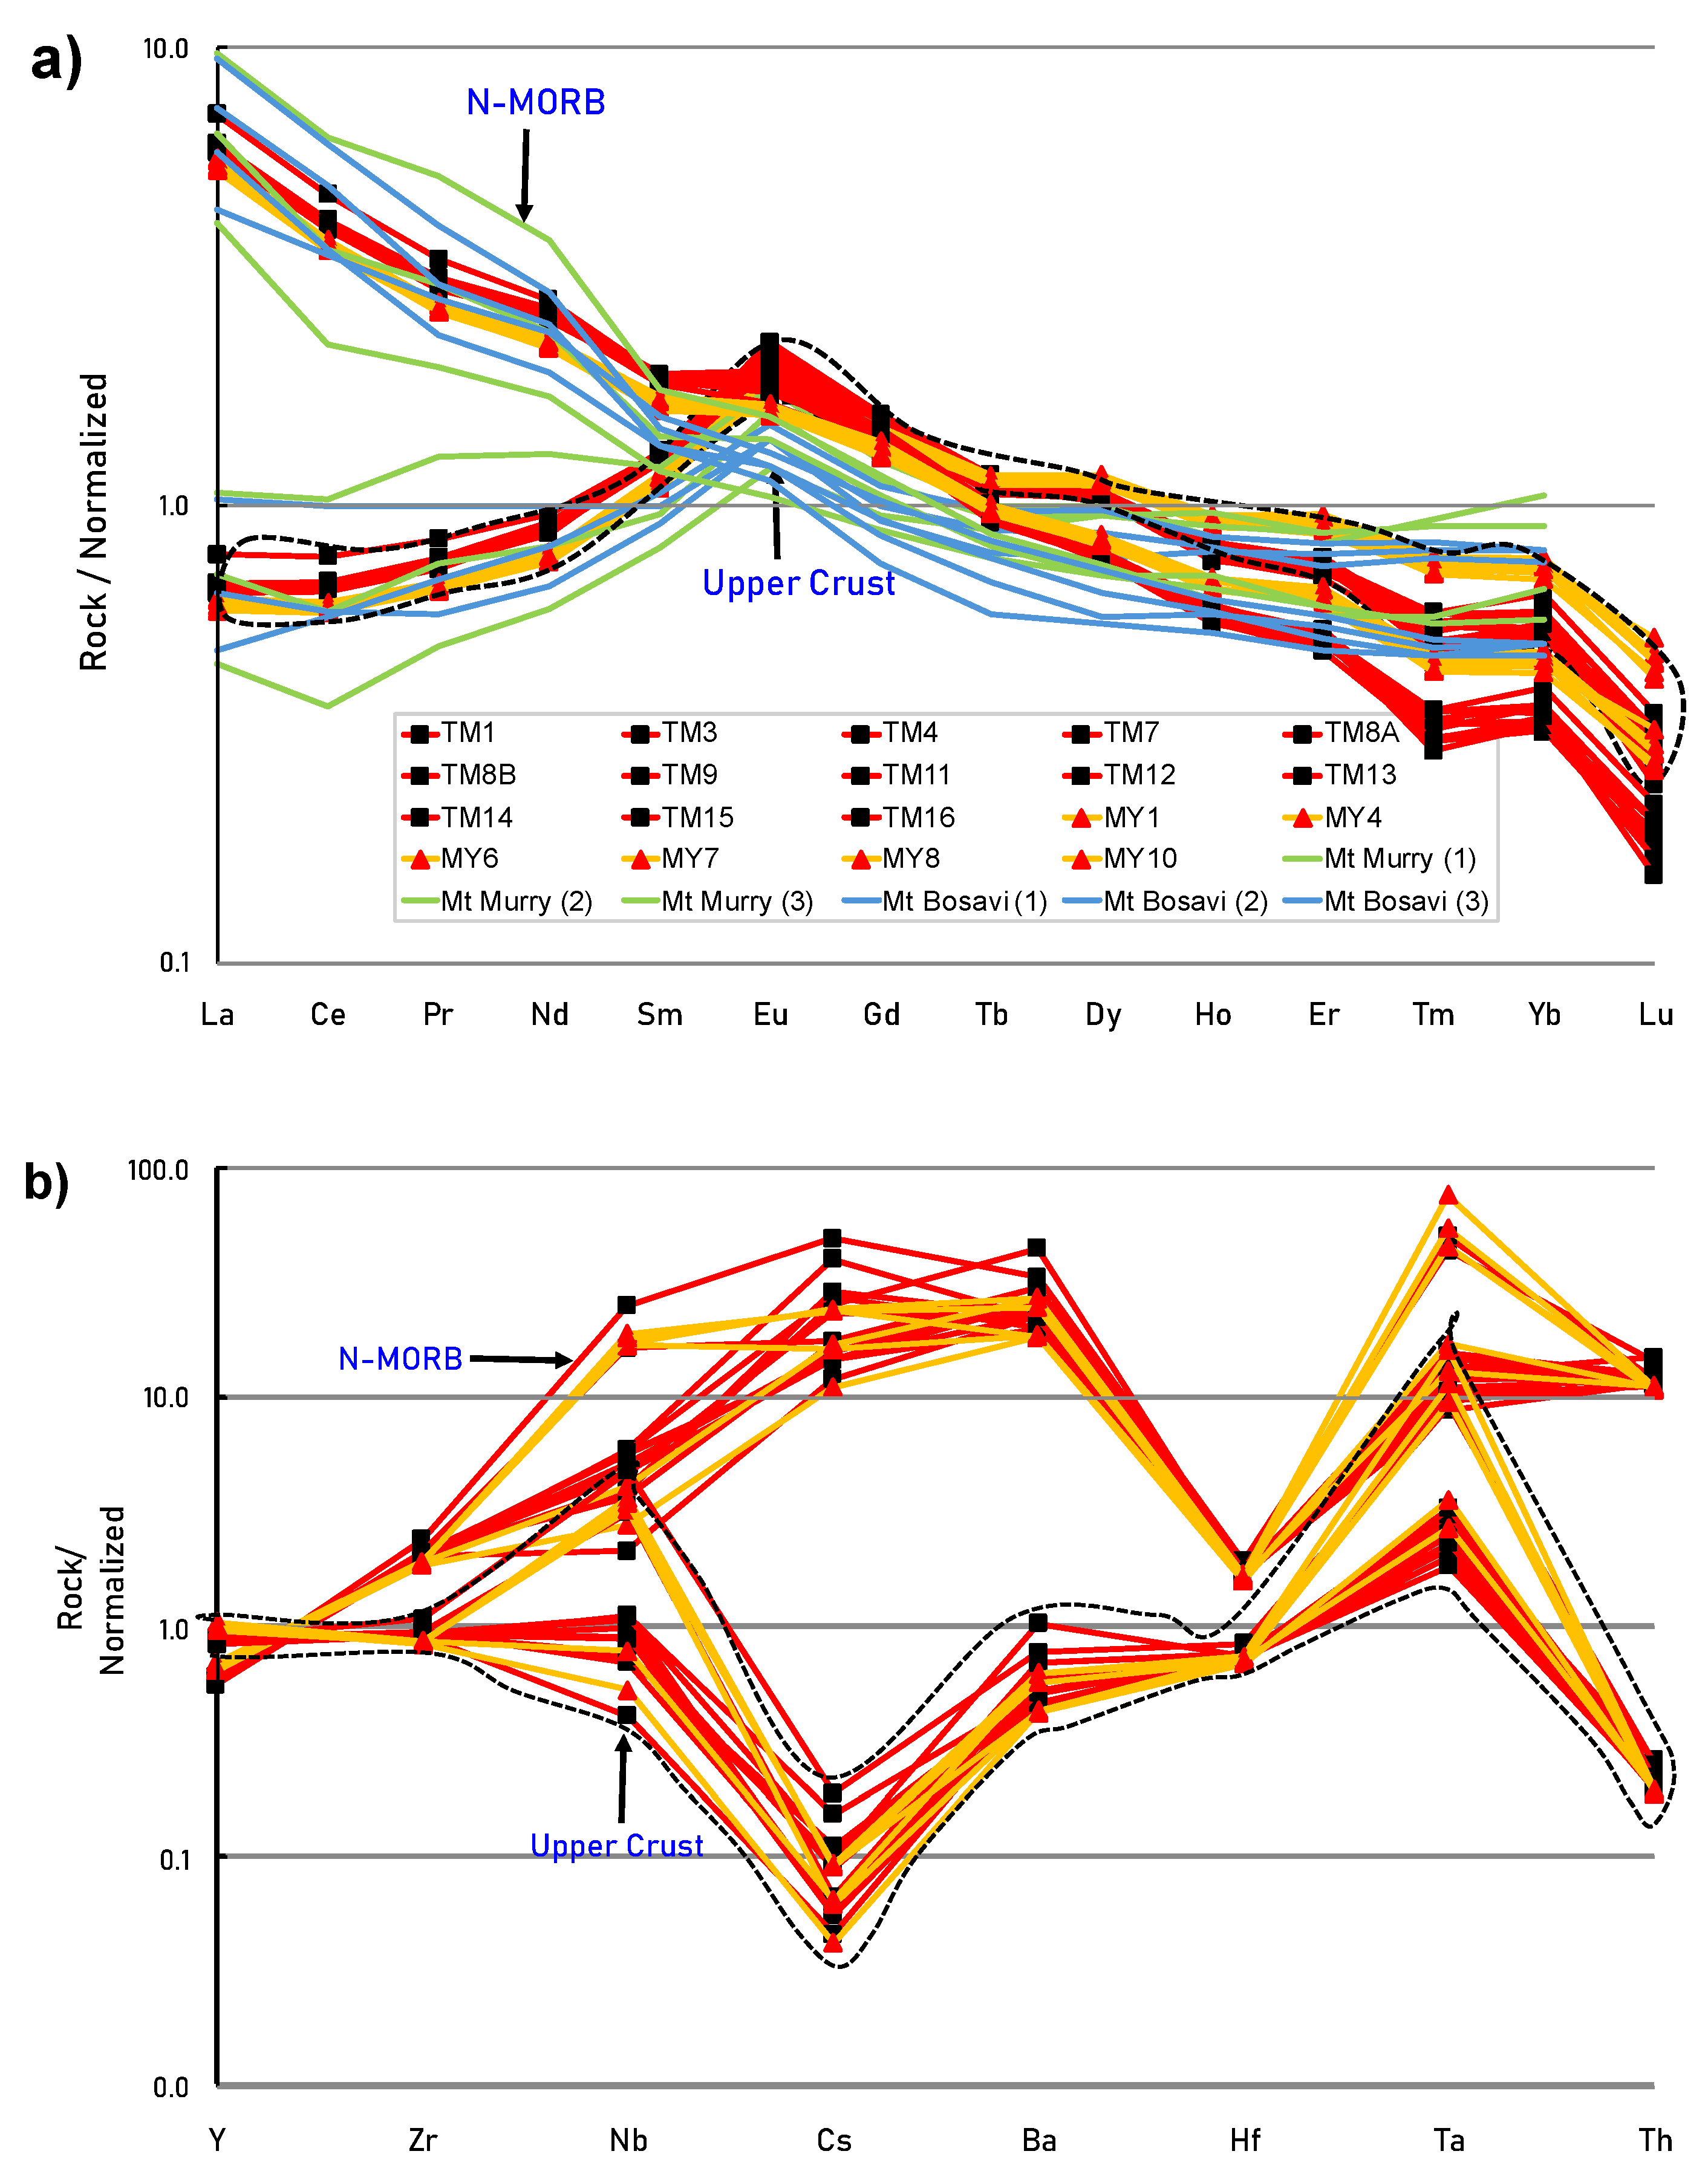
Figure 16.
Bivariate tectonic discrimination diagrams: a) Ti/Y vs. Zr/Y, and b) Nb vs. Th, (normalized to N-MORB values from White and Klein (2014). The bivariate diagrams are referenced from Rollingson and Peace (2021) after Saccani (2015) and Peace and Gale (1977) respectively. Volcanics from Central Highlands (Mt Hagen, Mt Murry and Mt Bosavi; Mackenzie & Johnson, 1984) and Rabaul and Northeast Queensland (Georock Database) are plotted for comparison.
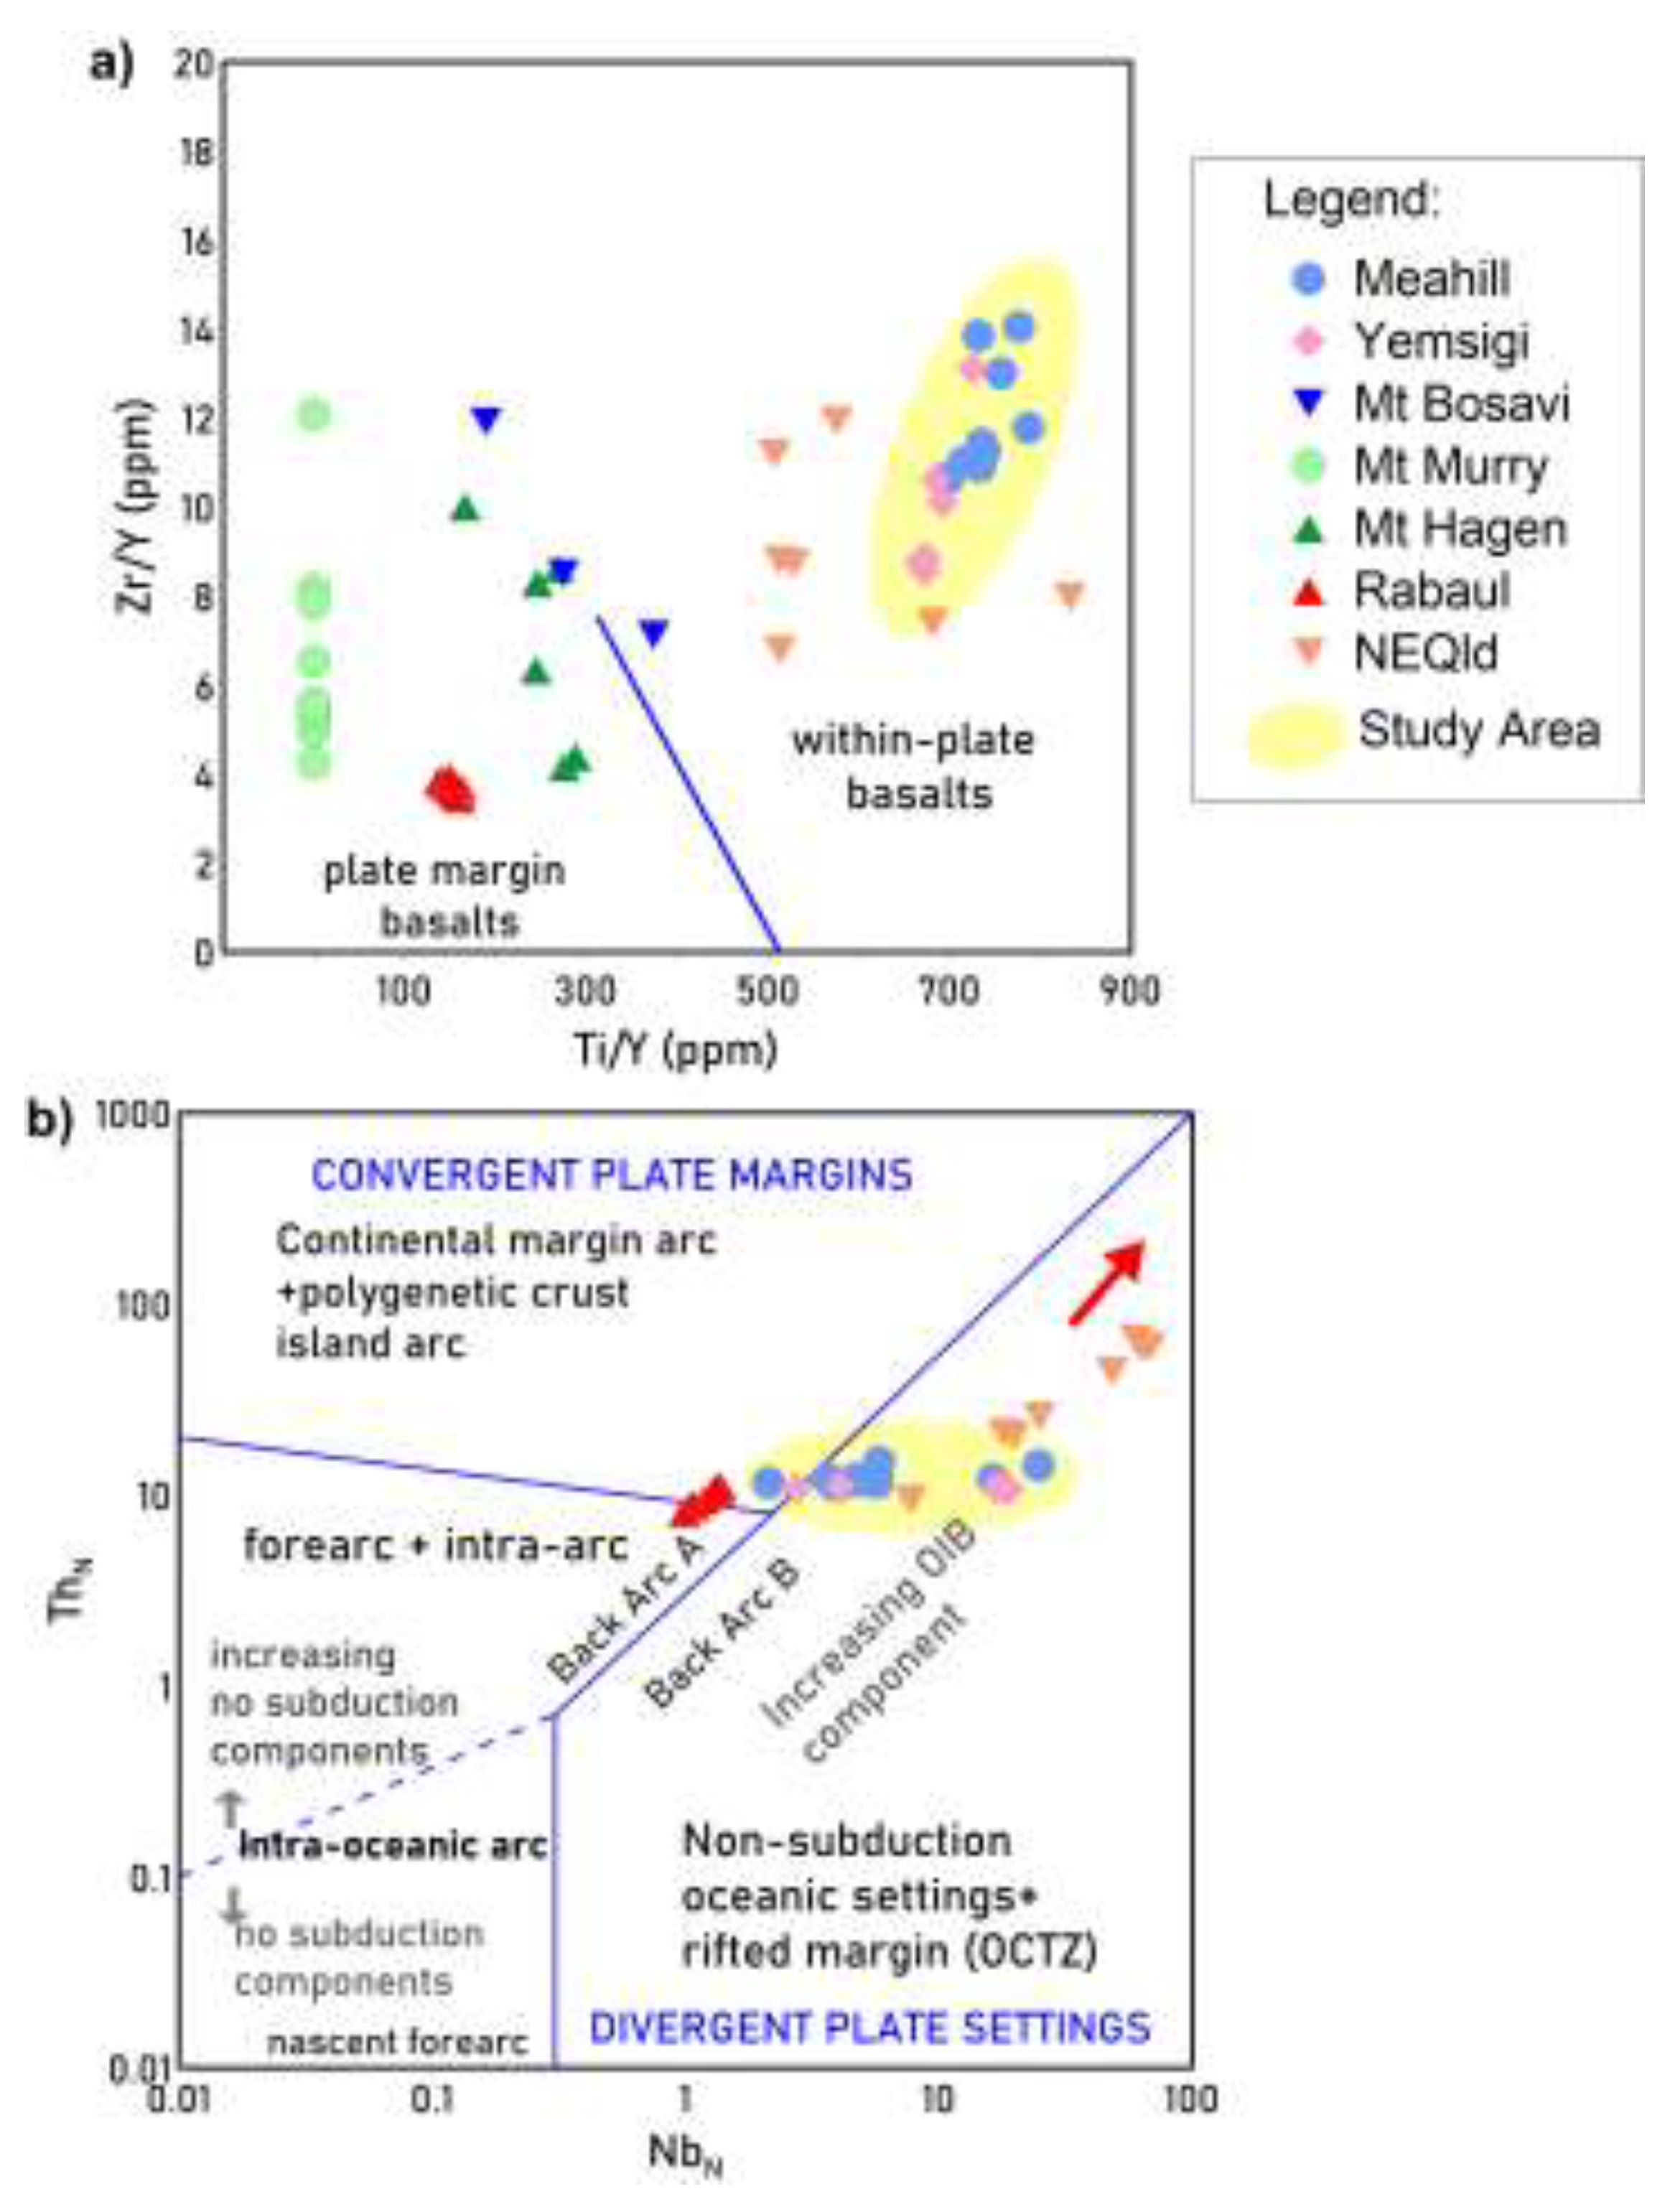
Figure 17.
Cenozoic magmatism in PNG and Australia (from Meeuws et al., 2016)[25]. Locations of mineral deposit ages, oil and gas projects (black star) including PPL wells (black circle) are also shown on the map.
Figure 17.
Cenozoic magmatism in PNG and Australia (from Meeuws et al., 2016)[25]. Locations of mineral deposit ages, oil and gas projects (black star) including PPL wells (black circle) are also shown on the map.
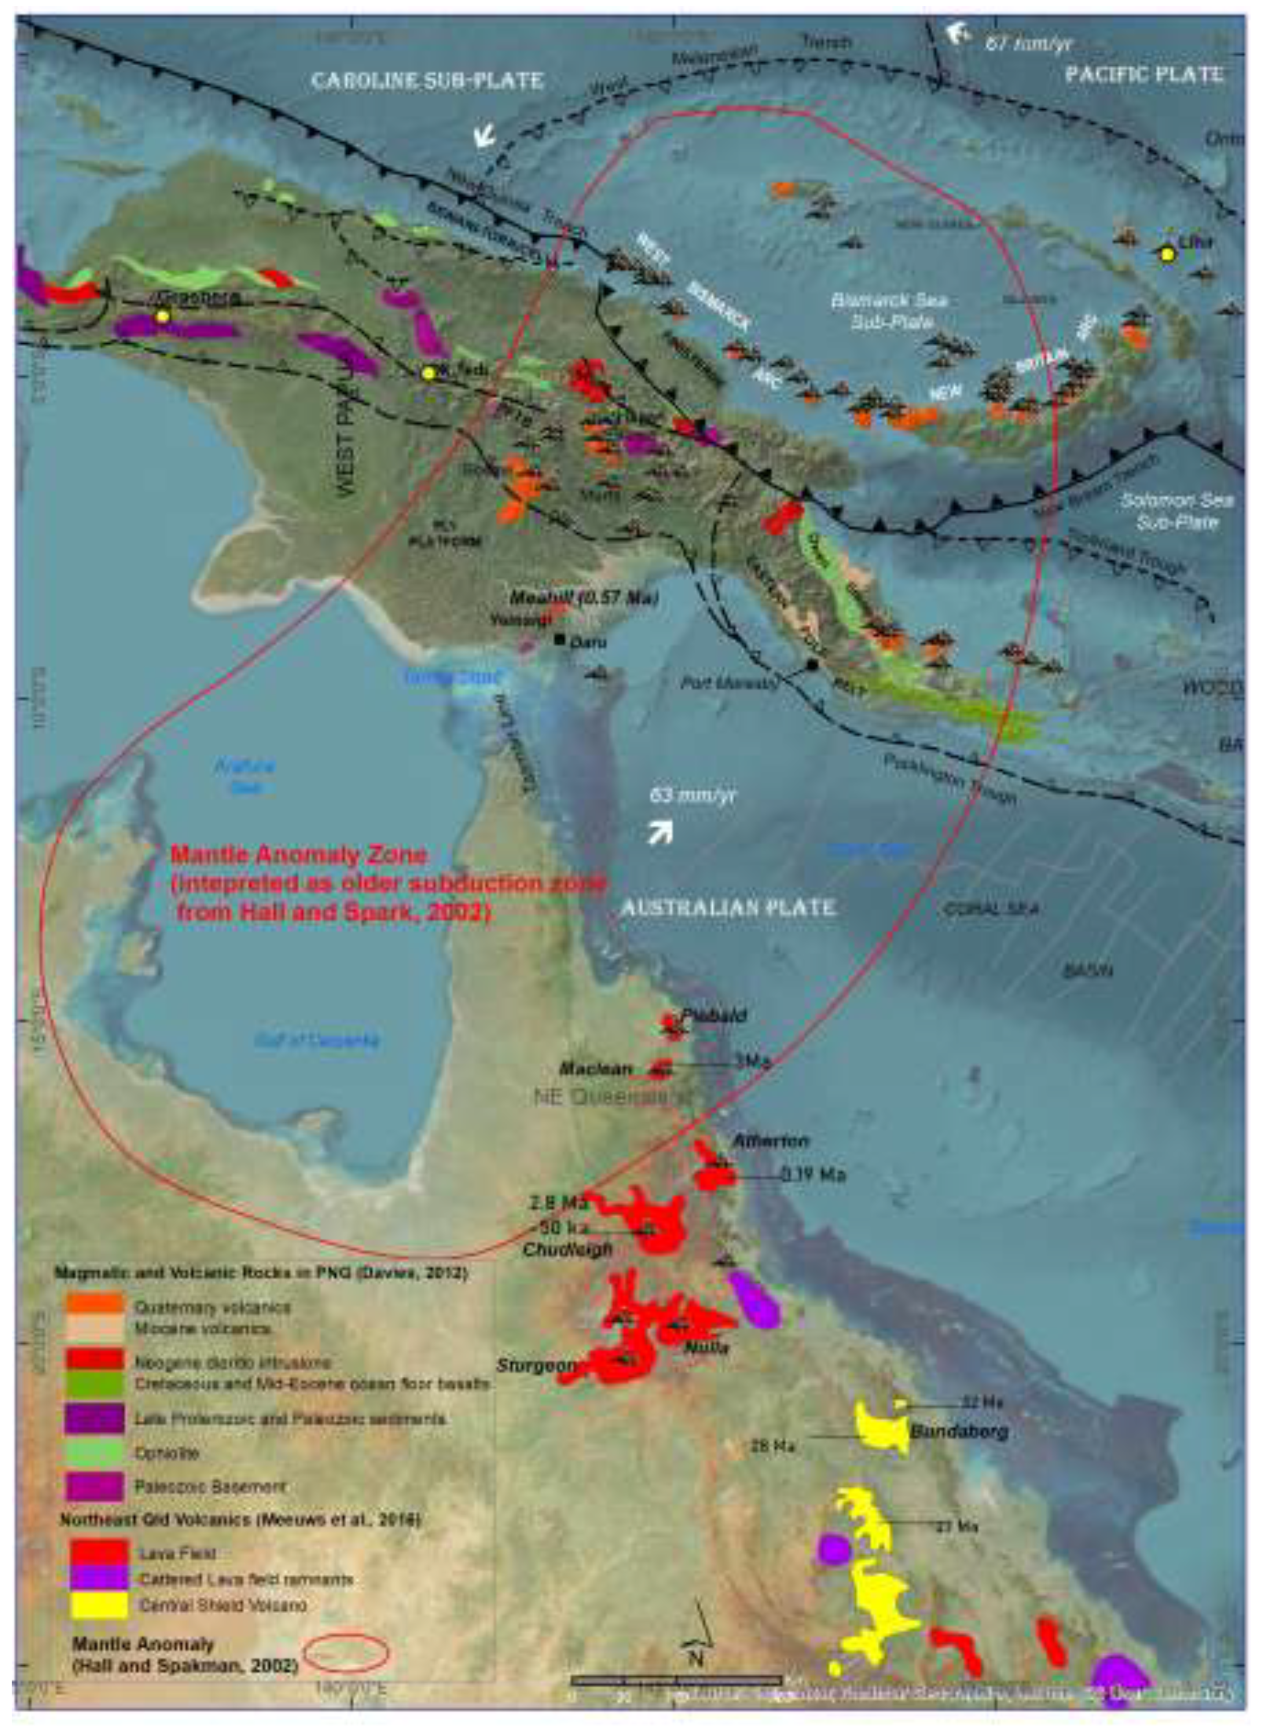
Figure 18.
HFSE and REE spider diagram for the Meahill (TM-series) and Yemsigi (MY-series) basalts compared with NE Queensland basalts: (a) N-MORB normalized patterns and (b) Upper Crust normalized patterns. The N-MORB normalization values are from White and Klein (2014)[31], and Upper Continental Crust values are from Rudnick and Gao (2014)[32].
Disclaimer/Publisher’s Note: The statements, opinions and data contained in all publications are solely those of the individual author(s) and contributor(s) and not of MDPI and/or the editor(s). MDPI and/or the editor(s) disclaim responsibility for any injury to people or property resulting from any ideas, methods, instructions or products referred to in the content. |
© 2026 by the authors. Licensee MDPI, Basel, Switzerland. This article is an open access article distributed under the terms and conditions of the Creative Commons Attribution (CC BY) license (http://creativecommons.org/licenses/by/4.0/).
Copyright: This open access article is published under a Creative Commons CC BY 4.0 license, which permit the free download, distribution, and reuse, provided that the author and preprint are cited in any reuse.


