
Submitted:
06 January 2026
Posted:
07 January 2026
You are already at the latest version
Abstract
Camera-based wildlife monitoring is often overwhelmed by non-target triggers and slowed by manual review or cloud-dependent inference, which can prevent timely intervention for high stakes human-wildlife conflicts. Our key contribution is a deployable, fully offline edge vision sensor that achieves near-real-time, highly accurate wildlife event classification by combining detector-based empty-frame suppression with a lightweight classifier trained with a staged transfer-learning curriculum. Our design is robust to low-quality nighttime monochrome imagery (motion blur, low contrast, illumination artifacts, and partial-body captures) and operates using commercially available components in connectivity-limited settings. In field deployments running since May 2025, end-to-end latency from camera trigger to action command is approximately 4 seconds. Ablation studies using a dataset of labeled wildlife images (pumas, not pumas) show that the two-stage approach substantially reduces false alarms in identifying pumas relative to a full-frame classifier while maintaining high recall. The system can be easily adapted for other species, as demonstrated by rapid retraining of the second stage to classify ringtails. Downstream responses (e.g., notifications and optional audio/light outputs) provide flexible actuation capabilities that can be configured to support intervention.
Keywords:
edge computing
; real-time environmental monitoring
; computer vision
; artifical intelligence
; object detection
; image classification
; curriculum learning
1. Introduction
Camera traps and other camera-based sensing systems are now widely used for environmental monitoring, biodiversity assessment, and wildlife management [2,38]. Tools such as Megadetector [2] and Wildlife Insights [2] are designed to help scientists analyze trail camera images for research and can perform complex classification tasks that can differentiate between multiple species. These efforts are typically done weekly or monthly in batch mode and do not require rapid inference. While such latency is acceptable in many ecological studies, there are a growing set of operational contexts where the decision window can be minutes rather than days.
Human activities are reshaping natural ecosystems, resulting in habitat loss and imposing significant pressures on large carnivores [2]. In addition, large scale ecological disturbances such as droughts and wildfires driven by climate change are transforming landscapes and altering wildlife distributions, further exacerbating human–wildlife interactions [2,2]. In the case of large mammals entering human-used spaces (e.g., polar bears in towns), wildlife approaching transportation corridors or other infrastructure (e.g., elephants near railway lines), and rare or high-stakes events in insufficiently protected areas (e.g. pumas attacking livestock), near-real-time detection, of the order of a few seconds, is of the utmost importance in order to enact intervening measures [2].
Field deployment requiring real-time or near real-time response faces several challenges, the most important consideration being a fast yet accurate classification algorithm. Additionally, deployments often operate in remote locations with intermittent connectivity, constrained budgets, minimal power and limited compute. This requires edge computing approaches that run inference locally rather than relying on cloud processing. Furthermore, the data itself presents difficulties: large fractions of motion-triggered captures may be empty, and animal-containing frames can be low resolution and hard to interpret automatically, especially in low light situations [9]. Nighttime trail camera imagery is often monochrome/infrared and frequently affected by motion blur, illumination artifacts, and partial-body captures; in contrast, daytime color images typically contain richer information and sharper frames. Practical systems must therefore work across both night and day conditions while suppressing empty triggers to avoid excessive false alarms.
There is no single state of the art vision sensing AI model that performs efficiently and reliably under all of the above-mentioned constraints. While frontier multimodal models are highly capable, they are typically accessed as externally hosted, proprietary services, which introduces ongoing cost, connectivity requirements, and variable end-to-end latency, complicating guarantees of seconds-scale response in remote deployments [10,11,12,13]. Even when running locally, a model often has to do two different jobs at once: (i) ignore the many empty and nuisance triggers from wind, rain, etc., and (ii) make a high-confidence, target-species decision when an animal is present. Edge-friendly tools such as YOLO [14,15] are excellent at quickly finding animal-like image regions, but have poor reliability in confirming a specific target species. This is exacerbated when the animal may be distant, partially visible, and frequently captured in infrared at night. These gaps are especially important in near-real-time workflows where repeated false alarms quickly undermine trust and usability.
To address these gaps, we present a detect–classify cascade, a two-stage AI-enabled vision sensor that forms the core of our near-real-time environmental monitoring system. The system itself consists of an event-driven camera paired with an edge-computing unit that performs on-device inference and triggers user-defined responses. Related smart camera-trap systems demonstrate on-device inference and integrated field prototypes [16,17]; here we focus on seconds-scale, species-specific identification for high-stakes events. We demonstrate our approach for a sample dataset containing camera trap images, distinguishing pumas from other wildlife. We report end-to-end trigger-to-action latency and false-trigger behavior across both daytime color and nighttime infrared imagery. Finally, we include Grad-CAM visualizations [18] for explainability of classifier decisions that build trust in the system and guide model refinement for terrain and species specific applications. Our contributions can be summarized as follows:
- a novel two-stage edge-deployable pipeline that is reproducible for reliable event-level decisions on resource-constrained hardware, and
- an openly released, re-trainable implementation (code, weights, labeled datasets, and a hardware bill of materials) designed for field use.
The system is designed with flexibility in mind, to be extended to other species with modest additional labeled data. While our quantitative evaluation emphasizes pumas as a high-stakes management case study, we also include an illustrative ringtail deployment obtained by retraining only Stage 2 with a few hundred labeled images, demonstrating that the same pipeline can be adapted to new target species with modest additional data.
2. Materials and Methods
2.1. System Overview
We introduce an AI-enabled vision sensor for near-real-time wildlife monitoring that couples event-driven image acquisition with two-stage edge inference and configurable downstream actions. The system operates in an event-triggered manner: a motion trigger activates image capture, and the resulting frame(s) are transmitted over a local network to an edge-computing device for seconds-scale inference and decision-making. Figure 1 summarizes the end-to-end pipeline, spanning (i) event triggering and image acquisition, (ii) data transfer, (iii) two-stage edge inference, and (iv) action generation. The system is designed to operate without internet connectivity (offline inference), and run on low-cost, low-power hardware suitable for field deployment without access to mains power. The design goal is for the system to achieve seconds-scale end-to-end latency to support real-time intervention [2].
2.2. Two-Stage Classification
Our central methodological contribution is a two-stage detector–classifier cascade designed for reliable, species-specific decisions under resource constraints. This staged design follows the principle that sequential pipelines that filter and refine candidates relative to single-shot approaches [19] can improve robustness. While our approach uses standard model families (one-stage detection and compact classification), our contribution is the staged integration and domain-tuned training procedure that yields reliable species-level decisions from noisy trail camera imagery. Our modular pipeline is tailored to common field constraints: (i) motion-triggered cameras produce high volumes of empty or non-target frames, and (ii) nighttime infrared imagery and partial-body captures can degrade the reliability of direct full-frame classification. Our two-stage design separates fast candidate localization from species classification. The first stage emphasizes low latency localization and is designed to be fast enough to handle frequent motion triggers, while the second stage emphasizes efficient species classification on cropped regions of interest (ROIs).
- Stage 1: YOLO for real-time localization and trigger suppression
We use a one-stage detector (YOLO) [14] in Stage 1 to localize candidate animals under strict latency and compute constraints. Specifically, we use YOLOv8, a stable and well-supported real-time object detection model, to deliver fast, accurate inference with an easy-to-use training and deployment workflow [20]. One-stage detectors are commonly selected for real-time operation because they unify localization and classification in a single forward pass, enabling high throughput [14,19]. However, relying on detector class labels as a proxy for the target species can be brittle under trail camera conditions (night IR, motion blur, partial-body captures), motivating a dedicated confirmation stage. In our setting, Stage 1 is intentionally treated as a broad localizer and empty-frame suppressor rather than a final species decision rule. By executing Stage 1, the detector suppresses empty or nuisance trigger frames and localizes candidate animals; detections are used to generate cropped ROIs.
- Stage 2: EfficientNet with curriculum learning for ROI classification
Stage 2 performs target-species confirmation on the cropped ROIs. A binary species classifier assigns a target probability to each ROI and gates downstream actions. We implement this step with an EfficientNet classifier [21] trained through a two-step curriculum. We use EfficientNetV2-S for binary classification because of its efficient scaling and strong feature extraction to achieve accurate results with reduced training and inference cost. In Step 1, we initialize an EfficientNetV2-S backbone with ImageNet-pretrained weights [22], remove its classification head (where this outputs 1000 distinct classes, of which puma is not a class), and freeze the base network to preserve its generic image feature extraction capabilities. We then add a custom classification head to adapt to model for our binary classification task (puma vs. no-puma). During this stage we limit the training to the new classification head, allowing for rapid transfer of the original ImageNet representations to the puma classification problem. This approach is important since it enables effective training on a relatively small, domain-specific dataset while maintaining generalizable performance under challenging infrared trail camera conditions. In Step 2, we fine-tune all layers using a balanced, species-specific dataset that includes diverse lighting, seasonal, and camera-angle variations. This staged optimization improves convergence stability and mitigates overfitting, yielding superior accuracy compared with single-phase training.
A detailed ablation study reported in Section 4 demonstrates the need for our two-stage cascade.
2.3. Hardware Platform
Camera and triggering: Images are acquired using an FTP-enabled WiFi security camera with a Passive Infrared Sensor (PIR) for motion triggering. In our implementation we used a MICROSEVEN M7B1080P-WSAA, but the approach is designed to be compatible with many commercially available FTP-capable security cameras (e.g., several Reolink models) that can upload triggered images to a local FTP server. These cameras typically provide configurable motion/PIR detection zones, which helps reduce nuisance triggers from irrelevant motion (e.g., wind-driven vegetation or traffic outside the area of interest) and improves the practicality of event-driven monitoring in the field.
Edge-computing device and networking: A Raspberry Pi 5 serves as the edge-computing device and runs the on-device inference pipeline and action policy. The system supports two networking configurations: (i) a standalone mode where the Raspberry Pi 5 hosts a local WiFi hotspot that the camera(s) join, and (ii) a site-network mode where the Raspberry Pi 5 and camera(s) join an existing WiFi network (common at the urban–wildland interface). In both modes, cameras upload triggered images to the Raspberry Pi 5 via FTP, and the inference workflow is identical. The system does not require external internet access once models are trained.
User interface: Users interact with the system by connecting a laptop or phone to the same WiFi network that the camera(s) are on. The connection is established through a platform-independent graphical user interface implemented using the Flutter framework [23]. The user interface supports monitoring from devices in either of the two supported network modes. Users connect directly to the Raspberry Pi 5 to view images, download them for offline use, delete images that are not needed, and adjust system settings such as detection parameters and optional audio-file selection. Users can adjust a small number of settings in the interface, including detector sensitivity, and whether audio is enabled.
Outputs (optional): Downstream outputs are configurable and can include (i) notifications for rapid stakeholder awareness and (ii) optional on-site cues such as lights and/or audio to support immediate event verification. These output modalities are widely discussed in deterrence literature [24,25], but here they are treated as actuation capabilities rather than validated interventions.
Power considerations: In a single-camera configuration with a USB speaker, average total power draw is approximately 8 W (Table 1). In many intended use cases (e.g., homes, barns, ranches), power is readily available. For deployments in remote/wild areas, the system can be powered using a battery generator and/or solar panel system sized for the expected duty cycle and local conditions. The camera contributes substantially to the overall power budget because it captures continuous video and, at night, powers infrared illumination. This feature is currently retained as it is beneficial for our current research and monitoring needs. However, reducing camera power draw is a practical direction for future optimization; for example, camera models or configurations that allow enabling video only during certain times (while retaining event-driven image capture/upload) could reduce overall system power consumption.
Multi-camera deployments: Our approach supports multiple FTP-enabled WiFi cameras connecting to the same Raspberry Pi 5 hotspot, allowing coverage to be expanded by adding cameras. We tested the system with up to three cameras connected concurrently. If multiple cameras upload images simultaneously, incoming images are placed into a queue and processed sequentially by the inference pipeline. Because on-device inference is fast (sub-second per image for each stage) and target events are typically sparse in time for many monitoring scenarios, queuing is expected to have limited impact on overall system responsiveness in typical deployments; however, sustained high trigger rates could increase latency due to backlog. Power demand scales approximately with the number of cameras (and any speaker usage), and can be estimated as
Enclosure and cost: The prototype uses commercially available components to minimize build complexity and cost. In our current configuration, the Raspberry Pi 5 costs approximately $60, the FTP-enabled WiFi PIR camera costs approximately $40, and the USB speaker costs approximately $15. The camera and speaker are weather-resistant/waterproof for outdoor deployment, while the Raspberry Pi 5 is housed in a waterproof enclosure (approximately $15). Thus, the total hardware cost for a single-camera configuration with optional audio output is approximately $130 (excluding power supply/battery/solar components).
2.4. Software Pipeline
Data flow and orchestration: As described in Figure 1, the system operates in an event-triggered manner. Motion-triggered images are uploaded via FTP and written to a directory on the Raspberry Pi 5 which is monitored by a lightweight file-watcher utility. New arrivals are detected and queued for processing in a sequential manner when multiple cameras upload concurrently. This ensures that peak resource use remains bounded. For each processed image (and each downstream crop), the system records structured metadata — including timestamp, camera identifier, detector outputs, classifier scores, final decision, and any action taken — supporting later analysis and auditing. To improve robustness in field deployments, corrupted or partially uploaded files are detected and skipped (logged and ignored) rather than propagating errors that could halt the pipeline.
Two-stage inference cascade: As introduced in Section 2.2, the novel two-stage design provides fast empty-frame suppression and coarse animal localization, followed by target-species classification. This structure also supports reuse: Stage 1 functions as a general animal-localization module, while Stage 2 can be retrained for a new target species with modest labeled data.
- Stage 1: object detection (empty-frame suppression and cropping)
Stage 1 applies an object detector to each triggered image to identify candidate animals and suppress empty frames. We use an Ultralytics YOLOv8s detector with pretrained weights (yolov8s.pt) running on the Raspberry Pi 5. Inference uses image size = 640 with a YOLO confidence threshold of 0.25 and YOLO NMS IoU threshold of 0.45. If no detections exceed the confidence threshold, the frame is treated as an empty/non-target trigger and is not forwarded to Stage 2. For each retained detection, we generate a crop by expanding the bounding box by 15% padding (CROP_EXPAND = 0.15) prior to cropping. All detected boxes are forwarded to Stage 2 without detector-class filtering; this choice reduces the risk of suppressing true events when detector labels are unstable under challenging infrared or partial-body conditions.
- Stage 2: curriculum learning for binary classification
Each Stage 1 crop is classified using an EfficientNetV2-S binary classifier initialized with ImageNet weights. Inputs are resized to and processed using the model’s built-in EfficientNetV2 preprocessing (include_preprocessing = true); no additional infrared-specific preprocessing is applied beyond this shared pipeline. We first train the classification head with a frozen backbone, then fine-tune upper backbone layers while keeping BatchNorm layers frozen. Models are selected using performance on a held-out validation set with early stopping to reduce overfitting. At the time of deployment, the classifier outputs a confidence score, which is thresholded to produce a true event vs. not-true event decision. Implementation details and full training/configuration hyperparameters are provided in the accompanying repository (see the Data Availability statement).
The system decides what to do after each camera trigger using a simple set of rules. Stage 1 may produce zero or more crops from a triggered image. Each crop is scored by Stage 2, which outputs a true event probability. We classify an event as true event if any crop has a probability ; otherwise the event is not-true event. All results in this work are based on a threshold of .
3. Case Study
3.1. Study Context and Dataset
The species chosen for this demonstration was the puma. Pumas are wide-ranging large carnivores with important ecological roles [26,27] and are also implicated in management challenges near the wildland–urban interface and around domestic animals. Management actions such as lethal removal can have complex outcomes, motivating scalable nonlethal approaches and improved monitoring tools [28,29]. Selective sensing can enable targeted downstream actions, including activation of well-established deterrent modalities, once reliable low-false-alarm triggering is available [24,25]. The scope of this study is limited to the sensing-and-classification capability only.
Study region: The original training and validation dataset was assembled by the Large Mammal Monitoring Project [2,30]. The project investigates the effect of climate change, drought, and wildfire on large mammal numbers and behavior by collecting trail camera imagery in the Pajarito Plateau area of New Mexico. Dozens of trail cameras have been deployed, capturing thousands of images of pumas and other wildlife. The region includes rugged canyons and mesas and supports diverse wildlife, including deer, elk, bears, bobcats, coyotes, and pumas. The resulting imagery contains animals approaching from multiple angles and distances under varying lighting conditions. Additionally, data were collected using multiple trail camera brands with different imaging sensors and brightness profiles, improving robustness to cross-camera domain shifts. We further augmented this dataset with images collected from our own field deployments in New Mexico and California to better handle edge cases.
Imaging conditions: Our dataset spans both nighttime infrared (IR) imagery and daytime color imagery. Nighttime IR images are often lower quality and more prone to motion blur and illumination artifacts, whereas daytime color images typically contain richer information and sharper frames. Including both modalities supports around-the-clock monitoring and improves practical deployability. Training, validation and test datasets each contain images across the entire spectrum of operating conditions.
Dataset and Labels: For training and validation, we draw from a dataset that consists of 1103 puma images and 1693 no-puma images using an split. For test data we use an independent set of 479 puma and 955 no-puma images. We manually verified that the range of imaging conditions is captured in the sets. We formulated a binary classification task: puma vs. no-puma. The no-puma class includes other wildlife species (e.g., foxes, coyotes, bobcats, bears, deer, elk, skunk) as well as empty or nuisance-trigger frames (e.g., wind-driven vegetation, precipitation, insects, and other non-animal motion). Labels were assigned at the image level based on visual review: an image was labeled puma if any part of a puma was visibly present (including partial-body views), and labeled no-puma otherwise. This binary labeling scheme is also straightforward to adapt to other target species, because it only requires image-level labels for a single target class versus a pooled no-target class, rather than exhaustive multi-species annotation.
3.2. Prototype Evaluation
We evaluate the system for near-real-time monitoring in terms of its speed and reliability. We first conduct an offline ablation study of the two-stage sensing-and-classification methodology developed here. This is performed by systematically testing individual parts of the cascade to compare the performance by dividing the dataset into the same training and test categories for each step. We also validate the entire pipeline in field deployment mode to ensure that not only does the two-stage classification work accurately within seconds, but that the entire end-to-end pipeline functions as intended.
Baselines and ablations: We use an independent test dataset previously unseen by the classifier, with 479 puma images and 955 no-puma images to perform our ablation study:
- Stage 1 only (YOLO label proxy): detector-only baseline that predicts puma if the pretrained YOLO detector reports a cat detection; otherwise no-puma.
- Stage 2 only (full frame): single-stage baseline that applies the curriculum-learned binary EfficientNet classifier directly to the uncropped original image.
- Two-stage (animal-only filter): ablation in which Stage 1 detections are filtered to a restricted “animal” label set before cropping; Stage 2 classifies the resulting crops.
- Two-stage (proposed; permissive Stage 1): the proposed detector → classifier cascade, where Stage 1 is used permissively for localization/cropping and empty-trigger suppression, and Stage 2 performs puma confirmation on the crops and gates downstream actions.
3.3. Metrics
The following questions guide our evaluation of the system:
- How accurately does the pipeline distinguish target vs. non-target across nighttime IR and daytime color conditions?
- How effectively does the two-stage cascade suppress false triggers (empty frames and non-target wildlife) compared to simpler baselines?
- What is the end-to-end latency from trigger to action command, and how does it decompose by stage?
We record True Positive (TP), True Negative (TN), False Positive (FP) and False Negative (FP) classifications. In addition to these numbers, offline performance is quantified using precision (P), recall (R), and F1 score (F1), where
for the positive class (puma) in Table 2, Table 3, Table 4 and Table 5. Operational performance is characterized by (i) end-to-end latency and its stage breakdown (Section 4.3) and (ii) qualitative field demonstrations of the integrated workflow (trigger → transfer → inference → action; Figure 2).
End-to-end latency is measured as the elapsed time from camera trigger (image timestamp at upload) to issuance of an action command by the edge device (e.g., notification event and/or initiation of audio playback). Latency values were computed over 100 triggered events collected during field operation across both networking configurations.
4. Results
4.1. Offline Performance Evaluation (Ablation and Baselines)
We begin with an offline ablation study to isolate the role of each stage in the two-stage pipeline. The goal is straightforward, to show what breaks if we skip parts of the system. These comparisons motivate the full two-stage cascade and explain why seemingly sensible shortcuts can lead to more missed events or more false alarms, both of which lead to different undesirable consequences and lowered trust.
- Stage 1 only (YOLO label proxy)
We evaluate a detector-only baseline using YOLO, a common choice for fast edge deployment. Because puma is not a dedicated detector class in our YOLO model, we use a proxy rule by flagging puma whenever YOLO reports cat (Table 2). Under this setting, the model correctly identifies 160/479 puma events and correctly rejects 948/955 no-puma events. This corresponds to a precision of 0.958, recall of 0.334, and F1 of 0.495 (puma treated as the positive class). Furthermore, even when the detector localizes the animal, its predicted class label is unreliable under field conditions: motion-triggered wildlife imagery (often infrared, blurred, and partially occluded) is frequently assigned to visually adjacent or even unrelated categories.
- Stage 2 only (full-frame curriculum-learned classifier)
We also evaluate a classifier-only baseline (EfficientNet on the full frame) and show that, without detector-based localization and empty-frame filtering, it produces more false alarms in cluttered, motion-triggered imagery. Table 3 shows that applying the classifier directly to full frames yields relatively high sensitivity to pumas (FN = 33), but at the cost of many false positives (FP = 171). Table 3 makes this tradeoff explicit: the model correctly identifies 446/479 puma events (recall = 0.931), but incorrectly flags 171/955 no-puma events as puma (precision = 0.723).
- Two-stage with an animal-only filter
A natural idea is to reduce clutter by filtering Stage 1 detections to “animal” labels before passing crops to Stage 2. Table 4 shows that this strategy produces substantially more missed pumas than full-frame classification (FN = 89 vs. 33). Only 390/479 puma events are correctly identified (recall = 0.814), while 89 puma events are filtered or rejected as no-puma before Stage 2 can identify them. The reason is that the detector’s semantic labels are less reliable than its ability to localize an object: many true pumas are localized when all classes are enabled but are assigned non-animal (or otherwise incorrect) labels and therefore get removed by the label filter. Once those frames are excluded, Stage 2 never has the opportunity to correct the detector’s label error.
- Proposed Two-stage workflow
Table 5 shows the proposed design, keeping Stage 1 permissive for localization and empty-trigger suppression, then using Stage 2 for the puma decision on cropped regions of interest. This configuration achieves both low false alarms (FP = 8) and low missed events (FN = 12), improving substantially over the individual stages. The confusion matrix in Table 5 summarizes this balance: 467/479 puma events are correctly detected (recall = 0.975) while only 8/955 no-puma events are incorrectly flagged (precision = 0.983). The reduction in false alarms is driven by Stage 1 suppressing empty or nuisance triggers and restricting Stage 2 to animal-containing crops, which removes much of the background clutter that confuses a full-frame classifier. Importantly, the decrease in missed pumas is also consistent with ROI-based confirmation: by centering the classifier on the localized animal, Stage 2 can focus on puma-relevant morphology in the crop (rather than weak, spatially diluted cues in the full frame). The few remaining misses are dominated by cases where Stage 1 fails to localize the animal (e.g., low contrast with foliage in nighttime infrared imagery), highlighting that localization quality is the primary limiting factor once the two-stage cascade is used.
4.2. Field Deployment and Operational Workflow Validation
We have continuously deployed the system since May 2025 in the field to validate end-to-end robustness under realistic triggering conditions (wind, precipitation, insects, and non-target wildlife) and to confirm that the sensing-to-action loop runs without external internet access. Deployments were conducted at two sites using both supported networking configurations, using an existing WiFi network, and in standalone mode, with a hotspot. In both modes, cameras upload motion-triggered images via FTP to the Raspberry Pi and downstream inference and action logic is identical. In the field, the trigger stream is dominated by empty or weather-disturbed frames, with non-target animals (e.g., skunks, ringtails, raccoons, and foxes) far more common than puma visits. On nights with calm weather, the system ingests on the order of ∼100 motion-triggered events, whereas windy, rainy, or snowy conditions can generate ∼1000 events due to nuisance motion. These conditions provide a realistic stress test of false-trigger suppression and alert gating under heavy background activity. Across ongoing deployments comprising tens of thousands of motion-triggered events, we quantified to be from 98 false puma detections out of 12,436 triggers, where a false positive is defined as a non-puma event that nonetheless produces a puma alert/action. False puma detections were a combination of animals such as foxes posed in ways that resemble a puma. Other false detections result from crops of inanimate objects that resembled a puma.
Because puma events are rare at our sites, these deployments are primarily informative for operational robustness and false-trigger behavior. Field operation discovered systematic edge cases (e.g. animals that resemble pumas at certain angles) that are underrepresented in curated offline splits. We used these field observations to refine labeling guidelines for ambiguous triggers and to prioritize targeted data collection (hard negatives and rare positive contexts), strengthening the training/validation coverage and the representativeness of held-out evaluation data used for the offline results reported in Section 4.1. Across continuous operation, we observed a small number of site-network infrastructure interruptions (two power outages and four temporary WiFi outages), all of which resolved without manual intervention as the Raspberry Pi rebooted and services resumed automatically, providing practical evidence of robustness to common field failures.
4.2.1. End-to-End Workflow Demonstrations
We validated the integrated workflow (trigger → transfer → inference → action) using qualitative field demonstrations in which an audio output was triggered following target detection. Figure 2 shows an example puma encounter from the site-network deployment (19 May 2025) where a caterwauling call was played to get a response from the puma without making it a nuisance or scaring it away. This encounter demonstrates Stage 1 localization (bounding boxes), Stage 2 classification, and triggering of an audio output. We present Figure 2 as an operational demonstration of closed-loop performance. All field demonstrations were conducted on private property using standard non-invasive monitoring practices; no animals were handled, baited, or physically contacted.
4.2.2. Illustrative Multi-Species Operation (Ringtail Case Study)
To demonstrate that the same sensing-to-action pipeline can be adapted beyond pumas, we retrained the Stage 2 classifier to identify ringtails using 653 ringtail images. We deployed the system for monitoring ringtails at a residential water feature. Over approximately one month, the system recorded more than 30 ringtail visits and produced 311 usable images. The ringtail-trained Stage 2 binary classifier correctly identified 258 images (approximately 83% image-level accuracy) in this deployment. As expected, accuracy was lower than for pumas since ringtails are fast, small, and the Stage 1 object detector often fails to detect them. When ringtail detections occurred, an audio output was optionally triggered as a demonstration of actuation capability and rapid verification. In some instances the animal left the scene shortly after audio playback; these observations are anecdotal and are included to illustrate closed-loop operation in a different species context. The corresponding video is provided at https://vimeo.com/1120196742.
4.3. End-to-End Latency
We measured end-to-end latency as the elapsed time from camera trigger (image timestamp at upload) to issuance of an action command by the edge device (e.g., notification event and/or initiation of audio playback). This metric captures the practical responsiveness of the system for near-real-time monitoring workflows.
In the current implementation, end-to-end latency is approximately 4 s in typical operation. This value was averaged over 100 triggered events collected during field operation across both networking configurations. This total is dominated by image transfer plus Stage 1 detection/cropping (approximately 3 s) followed by Stage 2 classification (approximately 1 s); other overheads are negligible. In an earlier field demonstration recorded on 19 May 2025 (Figure 2), the end-to-end latency was approximately 8 s; subsequent software optimization (model caching and runtime initialization changes) reduced latency to the current value.
5. Discussion
5.1. Interpreting Results of the Ablation Study
Key results of the ablation study described in Section 3.2 are summarized in Table 6 for a step-by-step analysis of each stage of the proposed two-stage algorithm.
The Stage 1-only baseline highlights a key limitation of using off-the-shelf detectors for species-specific decisions. Relying on the cat proxy yields very few false alarms (FP = 7) but misses many true pumas (FN = 319), indicating that the detector is not reliable as a final decision rule for puma. This is consistent with field conditions in motion-triggered wildlife imagery, where predicted class labels can become unstable even when localization is successful. Importantly, this instability is not solely a consequence of using a proxy label. In qualitative review, true pumas are often assigned to visually adjacent or unrelated categories (e.g., dog, sheep, horse). We observe similar behavior even for species that do exist as detector classes (e.g., bears), where YOLO produces a correct bounding box but assigns the wrong species label. This is a consequence of 1000 coarsely defined classes in YOLO trained primarily upon clear daytime images. These results motivate using Stage 1 primarily as a broad trigger/localizer, deferring the species decision to a downstream classifier.
The Stage 2-only baseline (full-frame classifier) exhibits the opposite failure mode: it substantially increases false alarms (FP = 171) because motion-triggered field imagery often contains complex backgrounds (vegetation, shadows, precipitation, insects) and, at night, monochrome infrared artifacts and motion blur. In these conditions, the classifier can confuse background texture or illumination patterns for puma-like features. In addition, without localization the target may occupy only a small fraction of the frame or appear as a partial-body capture, which contributes to missed positive events (FN = 33). Together, these effects make full-frame classification less reliable for unattended, high-volume triggering in the field.
The “animal-only filter” variant demonstrates why using detector semantic labels as a pre-filter is risky. Although filtering to “animal” labels reduces nuisance crops, it also discards many true pumas before Stage 2 is ever applied, increasing missed events (FN = 89) while keeping false alarms low (FP = 7). Empirically, YOLO’s localization is often correct when run permissively, but its class labels can be unstable under infrared and partial-body conditions. Once a true puma is filtered out due to a label error, the classifier never has the opportunity to correct it.
Finally, the proposed permissive two-stage workflow yields the best overall balance (FP = 8, FN = 12). In this design, Stage 1 is used broadly for localization and empty-trigger suppression (i.e., to decide when and where to crop), while Stage 2 performs target-species confirmation on the resulting animal-centric ROIs. Specifically, Stage 2 applies a curriculum-learned binary classifier that assigns a target probability to each ROI and gates downstream actions (puma vs. no-puma). The two-step curriculum first freezes the pretrained backbone and trains only a small binary head, so the model leverages stable, general ImageNet features without immediately overfitting to a small, noisy trail camera dataset. It then fine-tunes all layers to adapt those features to domain-specific cues (IR contrast, blur, occlusion) using balanced, diverse data, improving generalization across conditions and camera types. In practice, this reduces catastrophic forgetting and camera/background-specific memorization, yielding more reliable field performance.
This division of labor reduces false alarms by removing empty or background-dominated frames from the classifier’s input distribution, and it reduces missed pumas by concentrating the classifier on localized animal evidence rather than weak, spatially diluted cues in the full frame. The remaining misses are dominated by cases where Stage 1 fails to localize the animal (e.g., low contrast with foliage in nighttime infrared imagery), indicating that localization quality is the primary limiting factor once ROI-based confirmation is employed.
5.2. Visual Analysis of Illustrative Examples
To complement the quantitative ablation results in Table 6, Figure 3 provides representative examples illustrating the strengths and failure modes of the three configurations (Stage 1 only, Stage 2 only, and the proposed two-stage cascade).
In the first row of Figure 3, the target is partially obscured and blends into a nighttime monochrome background. Stage 1 localizes the animal but assigns an incorrect detector label (e.g., “elephant”), potentially because a curved tail segment is interpreted as trunk-like in low-SNR infrared imagery. This highlights label instability under field conditions (IR illumination, blur, and occlusion) that induces confusion across detector classes. We observed similar mislabeling even for species that are native YOLO classes—for example, frames containing bears were often correctly localized but labeled as other animals (and occasionally non-animal categories)—indicating that the dominant limitation is label confusion rather than the absence of a puma class. In our qualitative review, true pumas are variously labeled as other animals (e.g., dog, sheep, horse) or even non-animal categories. Consequently, simply adding puma as an additional detector class is unlikely to be sufficient; Stage 1 is best treated as a broad localizer/trigger rather than a final species decision rule. Stage 2 applied to the full frame predicts no-puma, likely because the animal occupies a small fraction of the image and background dominates, whereas applying Stage 2 to the Stage 1 crop correctly yields puma with high confidence, illustrating how localization mitigates full-frame background confounds.
In the second row, a daytime color image captures a puma in open view with a relatively simple background. Stage 2 (full-frame classifier) correctly identifies the target in this easier setting. Stage 1 again localizes the animal but assigns a non-target detector label (e.g., “dog”), reinforcing that Stage 1 should be treated primarily as a localization and candidate-generation stage rather than a species decision rule. The two-stage pipeline correctly classifies the cropped region with high confidence, matching the full-frame classifier on this straightforward example while retaining the robustness benefits observed in Table 6.
The third row illustrates a challenging non-target false positive: a fox captured at an angle and posture that produces puma-like contours (notably head/shoulder silhouette and tail/torso proportions). All three approaches are misled in this example: Stage 1 assigns a proxy label (e.g., “cat”), Stage 2 applied to the full frame predicts puma, and the two-stage pipeline assigns a high puma probability despite operating on the localized crop. This case demonstrates that false positives are not limited to empty frames or nuisance motion; visually similar non-target species and rare poses can also drive errors. The impact of this misidentification is likely small, since often the goal is to eliminate a high percentage of false positives and these types of false positives appear to be rare. In Section 5.3, Grad-CAM visualizations help interpret why the classifier attends to plausible morphological cues in such examples, even when the final decision is incorrect.
5.3. Explainability and Error Analysis
We analyzed both model-level and system-level behavior to understand where errors occur in practical deployments. Explainability of the classifier’s decisions serves two purposes. It builds trust in the system in addition to identifying actionable strategies to improve performance. To better understand which image regions drive the Stage 2 binary classifier decisions (puma vs. no-puma), we generated Gradient-weighted Class Activation Mapping (Grad-CAM) visualizations [18]. Grad-CAM uses gradients of the target class score with respect to the final convolutional feature maps to produce a coarse heatmap that highlights regions most influential to the prediction. Figure 4 shows representative heatmaps for multiple species and provides a useful sanity check on what the classifier is using after cropping.
Across many correctly classified puma images (two shown for illustration), the classifier consistently places high importance on anatomically informative cues such as the long tail, head/ear region, torso or shoulder contour, and paws. The heatmaps also help interpret common failure cases. False positives can be explained by overlapping silhouettes and poses (e.g., foxes or coyotes in side-profile with long tails and puma-like silhouettes, and occasional bobcat examples when tail cues are absent or the viewing angle emphasizes head/torso features). These qualitative patterns align with the quantitative ablation results (Table 6) and Figure 3 and Figure 4, in which incorrect target classification after cropping is relatively rare compared to missed events caused by Stage 1 localization failures in low-contrast nighttime infrared conditions (e.g., low contrast, partial occlusion, motion blur, and cases where the animal blends into foliage or logs). In these cases, the classifier is not evaluated because no reliable crop is produced. This suggests that improving Stage 1 recall is likely to deliver the largest practical gains.
5.4. Operational Robustness
The device user interface exposes the detector confidence threshold (Stage 1 sensitivity), allowing users to trade off missed detections versus additional candidate crops. Increasing sensitivity can reduce missed pumas by accepting weaker detections in low-contrast nighttime imagery; in our experience this does not substantially increase false alarms because Stage 2 provides strong binary puma confirmation on the cropped regions. This supports a practical deployment strategy: keep Stage 1 permissive to preserve recall, and rely on Stage 2 to maintain specificity.
The deployment software was designed for unattended operation. Corrupted or partially uploaded image files are detected and skipped (logged and ignored) rather than causing pipeline failure. In field operation, the system resumed automatically after brief power or connectivity interruptions once service was restored. We also tested multi-camera operation with up to three cameras connected concurrently; images are processed sequentially via a queue, which keeps peak resource use bounded and is expected to introduce limited backlog in typical wildlife monitoring scenarios where target events are sparse in time.
5.5. Limitations and Future Work
Three limitations are most relevant. First, while the pipeline is primarily evaluated on pumas (with an additional illustrative ringtail deployment), performance may shift with different target species, camera hardware, backgrounds, or infrared characteristics. Second, recall is constrained by Stage 1 localization under the hardest nighttime cases where the target blends into foliage or low-contrast backgrounds. Third, field demonstrations are meant to validate end-to-end operation and actuation capability, but not deterrence efficacy.
The following next steps are being pursued: (i) improve nighttime localization and missed-crop behavior (e.g., by fine-tuning on the hardest infrared examples and leveraging burst-level voting); (ii) expand multi-camera throughput characterization under sustained trigger rates; (iii) reduce deployment power demand through camera and configuration choices, since camera power draw dominates due to continuous capture and nighttime illumination; and (iv) conduct controlled studies of targeted deterrence with appropriate protocols. We have shipped units to two separate research groups to enable controlled, protocol-driven studies at designated research sites in support of these next steps.
6. Conclusions
We presented a deployable, offline vision sensor node for near-real-time environmental monitoring that runs on low-cost edge hardware and is designed for challenging field imagery. The core contribution is a practical two-stage pipeline that separates broad localization and empty-frame suppression (Stage 1) from target confirmation on cropped regions (Stage 2), improving reliability in motion-triggered deployments where most frames are empty or non-target.
On a labeled puma vs. no-puma dataset (479 puma, 955 no-puma; ), the proposed two-stage configuration achieved high event-level performance and outperformed single-stage alternatives by reducing false positives caused by complex backgrounds and nuisance triggers. Grad-CAM visualizations further support that, once properly localized, the classifier attends to anatomically meaningful cues for the target decision.
In field deployments operating since May 2025 across two networking modes (site WiFi and standalone hotspot), the system achieves approximately 4 s end-to-end latency from trigger to action command, enabling time-sensitive monitoring use cases in which stakeholders can be notified and events verified while the animal is still present. Field examples demonstrate integrated closed-loop operation with optional actuation outputs.
The system is intended to be reusable across species and sites via retraining of the Stage 2 binary classifier and configurable deployment settings. This was demonstrated by successfully training on a limited number of ringtail images. Ongoing and future work will focus on improving nighttime localization in low-contrast conditions, reducing power demand through camera configurations that avoid continuous capture while retaining event-driven upload, and conducting controlled, protocol-driven evaluations of targeted intervention policies (e.g., audio/light) to quantify behavioral outcomes. More broadly, these observations motivate data-efficient improvement strategies, including model-in-the-loop inspection and edge-enabled feedback loops in which uncertain events are flagged for human review and incorporated into periodic retraining as the system encounters new environments and species.
Author Contributions
Conceptualization, A.S.V., J.E.S., and M.A.P.; methodology, A.S.V., A.B., Z.B., J.E.S., D.M.T and M.A.P.; software, A.S.V. and A.B.; validation, A.S.V., A.B., and Z.B.; formal analysis, A.S.V.; investigation, A.S.V., A.B., and Z.B.; resources, M.A.P., D.M.T. and J.E.S.; data curation, A.S.V., A.B., and Z.B.; writing—original draft preparation, A.S.V.; writing—review and editing, A.S.V., A.B., Z.B., J.E.S., D.M.T. and M.A.P.; visualization, A.S.V.; supervision, D.M.T (computer science), J.E.S. (computer science) and M.A.P. (wildlife biology); project administration, A.S.V., D.M.T, J.E.S. All authors have read and agreed to the published version of the manuscript.
Institutional Review Board Statement
Not applicable. Field demonstrations were conducted on private property using non-invasive monitoring practices; no animals were handled, captured, baited, or physically contacted, and the study involved no human subjects.
Data Availability Statement
The code, training notebooks, and pretrained model weights used in this study are publicly available in the project repository [31]. The labeled image dataset and associated annotations used for the offline experiments are provided through the same repository. Field demonstration media are provided via the links cited in the manuscript. A preconfigured Raspberry Pi microSD image and site-specific configuration files are available upon request.
Acknowledgments
The authors thank the Pajarito Environmental Education Center for working with the Los Alamos community to secure field sites for testing, including the Los Alamos Community Stables and a local residential deployment. We also thank Nature Group members Tate Plohr, Suchir Jha, Celia Pesiri, Sebastian Koglin, and Pheobe Reid for their help with the project. We thank Lisa Reader and Catherine Miller for allowing us to use the Los Alamos Community Stables as a test site for this work.
Conflicts of Interest
The authors declare that they have no known competing financial interests or personal relationships that could have appeared to influence the work reported in this paper.
Abbreviations
The following abbreviations are used in this manuscript:
- AI: Artificial Intelligence
- CNN: Convolutional Neural Network
- CPU: Central Processing Unit
- FTP: File Transfer Protocol
- Grad-CAM: Gradient-weighted Class Activation Mapping
- IoU: Intersection over Union
- IR: Infrared
- ML: Machine Learning
- NMS: Non-Maximum Suppression
- PIR: Passive Infrared (motion sensor)
- ROI: Region of Interest
- TPU: Tensor Processing Unit
- UI: User Interface
References
- Schneider, S.; Greenberg, S.; Taylor, G.W.; Kremer, S.C. Three critical factors affecting automated image species recognition performance for camera traps. Ecology and evolution 2020, 10, 3503–3517. [Google Scholar] [CrossRef]
- Murphy, S.M.; Wilckens, D.T.; Augustine, B.C.; Peyton, M.A.; Harper, G.C. Improving estimation of puma (Puma concolor) population density: clustered camera-trapping, telemetry data, and generalized spatial mark-resight models. Scientific reports 2019, 9, 4590. [Google Scholar] [CrossRef]
- Beery, S. The MegaDetector: Large-Scale Deployment of Computer Vision for Conservation and Biodiversity Monitoring; California Institute of Technology: Pasadena, CA, USA, 2023. [Google Scholar]
- Ahumada, J.A.; Fegraus, E.; Birch, T.; Flores, N.; Kays, R.; O’Brien, T.G.; Palmer, J.; Schuttler, S.; Zhao, J.Y.; Jetz, W.; et al. Wildlife insights: A platform to maximize the potential of camera trap and other passive sensor wildlife data for the planet. Environmental Conservation 2020, 47, 1–6. [Google Scholar] [CrossRef]
- Woodroffe, R. Predators and people: using human densities to interpret declines of large carnivores. Animal Conservation 2000, 3, 165–173. [Google Scholar] [CrossRef]
- Abrahms, B. Human-wildlife conflict under climate change. Science 2021, 373, 484–485. [Google Scholar] [CrossRef] [PubMed]
- Abrahms, B.; Carter, N.H.; Clark-Wolf, T.; Gaynor, K.M.; Johansson, E.; McInturff, A.; Nisi, A.C.; Rafiq, K.; West, L. Climate change as a global amplifier of human–wildlife conflict. Nature Climate Change 2023, 13, 224–234. [Google Scholar] [CrossRef]
- Davison, J.; et al. Automated near real-time monitoring in ecology: Status quo and ways forward. Ecological Informatics 2025, 85, 102587. [Google Scholar] [CrossRef]
- Yang, Z.; et al. A systematic study on transfer learning: Automatically identifying empty camera trap images using deep CNNs. Ecological Informatics 2024, 80, 102421. [Google Scholar] [CrossRef]
- Dietrich, J.; Hollstein, A. Performance and Reproducibility of Large Language Models in Named Entity Recognition: Considerations for the Use in Controlled Environments. Drug Safety 2025, 48, 287–303. [Google Scholar] [CrossRef]
- Huang, J.; Yang, D.M.; Rong, R.; Nezafati, K.; Treager, C.; Chi, Z.; Wang, S.; Cheng, X.; Guo, Y.; Klesse, L.J.; et al. A Critical Assessment of Using ChatGPT for Extracting Structured Data from Clinical Notes. npj Digital Medicine 2024, 7, 106. [Google Scholar] [CrossRef]
- Thomas, L.D.W.; Romasanta, A.K.G.; Pujol Priego, L. Jagged Competencies: Measuring the Reliability of Generative AI in Academic Research. Journal of Business Research 2026, 203, 115804. [Google Scholar] [CrossRef]
- Venugopal, S.; Gazzetti, M.; Gkoufas, Y.; Katrinis, K. Shadow Puppets: Cloud-level Accurate AI Inference at the Speed and Economy of Edge. In Proceedings of the USENIX Workshop on Hot Topics in Edge Computing (HotEdge), 2018; USENIX Association. [Google Scholar]
- Redmon, J.; Divvala, S.; Girshick, R.; Farhadi, A. You Only Look Once: Unified, Real-Time Object Detection. In Proceedings of the Proceedings of the IEEE Conference on Computer Vision and Pattern Recognition (CVPR), 2016; pp. 779–788. [Google Scholar] [CrossRef]
- Bochkovskiy, A.; Wang, C.Y.; Liao, H.Y.M. YOLOv4: Optimal Speed and Accuracy of Object Detection. arXiv 2020, arXiv:2004.10934. [Google Scholar] [CrossRef]
- Nazir, M.; Kaleem, S.; et al. Object classification and visualization with edge artificial intelligence for a customized camera trap platform. Ecological Informatics 2024, 79, 102398. [Google Scholar] [CrossRef]
- Velasco-Montero, D.; et al. Reliable and efficient integration of AI into camera traps for smart wildlife monitoring based on continual learning. Ecological Informatics 2024, 83, 102465. [Google Scholar] [CrossRef]
- Selvaraju, R.R.; Cogswell, M.; Das, A.; Vedantam, R.; Parikh, D.; Batra, D. Grad-CAM: Visual Explanations from Deep Networks via Gradient-based Localization. In Proceedings of the Proceedings of the IEEE International Conference on Computer Vision (ICCV), 2017; pp. 618–626. [Google Scholar] [CrossRef]
- Mohammed, S.Y. Architecture review: Two-stage and one-stage object detection. Franklin Open 2025, 12, 100322. [Google Scholar] [CrossRef]
- Jocher, G.; Chaurasia, A.; Qiu, J. Ultralytics YOLOv8. GitHub repository, 2023. Version 8.0.0. Available online: https://github.com/ultralytics/ultralytics (accessed on 24 December 2025).
- Tan, M.; Le, Q.V. EfficientNet: Rethinking Model Scaling for Convolutional Neural Networks. In Proceedings of the Proceedings of the 36th International Conference on Machine Learning (ICML), 2019; pp. 6105–6114. [Google Scholar]
- Deng, J.; Dong, W.; Socher, R.; Li, L.J.; Li, K.; Fei-Fei, L. ImageNet: A Large-Scale Hierarchical Image Database. In Proceedings of the Proceedings of the IEEE Conference on Computer Vision and Pattern Recognition (CVPR), 2009; pp. 248–255. [Google Scholar] [CrossRef]
- Flutter is an open source framework for building beautiful, natively compiled, multi-platform applications from a single codebase. Available online: https://flutter.dev/.
- Smith, M.E.; Linnell, J.D.; Odden, J.; Swenson, J.E. Review of methods to reduce livestock depredation II. Aversive conditioning, deterrents and repellents. Acta Agriculturae Scandinavica, Section A-Animal Science 2000, 50, 304–315. [Google Scholar] [CrossRef]
- Zarco-González, M.; Monroy-Vilchis, O. Effectiveness of low-cost deterrents in decreasing livestock predation by felids: a case in C entral M exico. Animal Conservation 2014, 17, 371–378. [Google Scholar] [CrossRef]
- Ripple, W.J.; Estes, J.A.; Beschta, R.L.; Wilmers, C.C.; Ritchie, E.G.; Hebblewhite, M.; Berger, J.; Elmhagen, B.; Letnic, M.; Nelson, M.P.; et al. Status and ecological effects of the world’s largest carnivores. Science 2014, 343, 1241484. [Google Scholar] [CrossRef]
- Barry, J.M.; Elbroch, L.M.; Aiello-Lammens, M.E.; Sarno, R.J.; Seelye, L.; Kusler, A.; Quigley, H.B.; Grigione, M.M. Pumas as ecosystem engineers: ungulate carcasses support beetle assemblages in the Greater Yellowstone Ecosystem. Oecologia 2019, 189, 577–586. [Google Scholar] [CrossRef]
- Elbroch, M. The cougar conundrum: sharing the world with a successful predator; Island Press, 2020. [Google Scholar]
- Elbroch, L.M.; Treves, A. Perspective: Why might removing carnivores maintain or increase risks for domestic animals? Biological Conservation 2023, 283, 110106. [Google Scholar] [CrossRef]
- Cain, J.W.; Kay, J.H.; Liley, S.G.; Gedir, J.V. Mule deer (Odocoileus hemionus) resource selection: Trade-offs between forage and predation risk. Frontiers in Ecology and Evolution 2024, 12, 1121439. [Google Scholar] [CrossRef]
- Pumaguard v21. Available online: https://github.com/PEEC-Nature-Youth-Group/pumaguard/releases/tag/v21. [CrossRef]
Figure 1.
AI-enabled vision sensor node workflow for near-real-time environmental monitoring: (i) event triggering and image acquisition, (ii) local-network transfer to an edge device, (iii) on-device inference, and (iv) downstream action when target criteria are met. Row 1 shows the hardware devices and Row 2 depicts the actions.
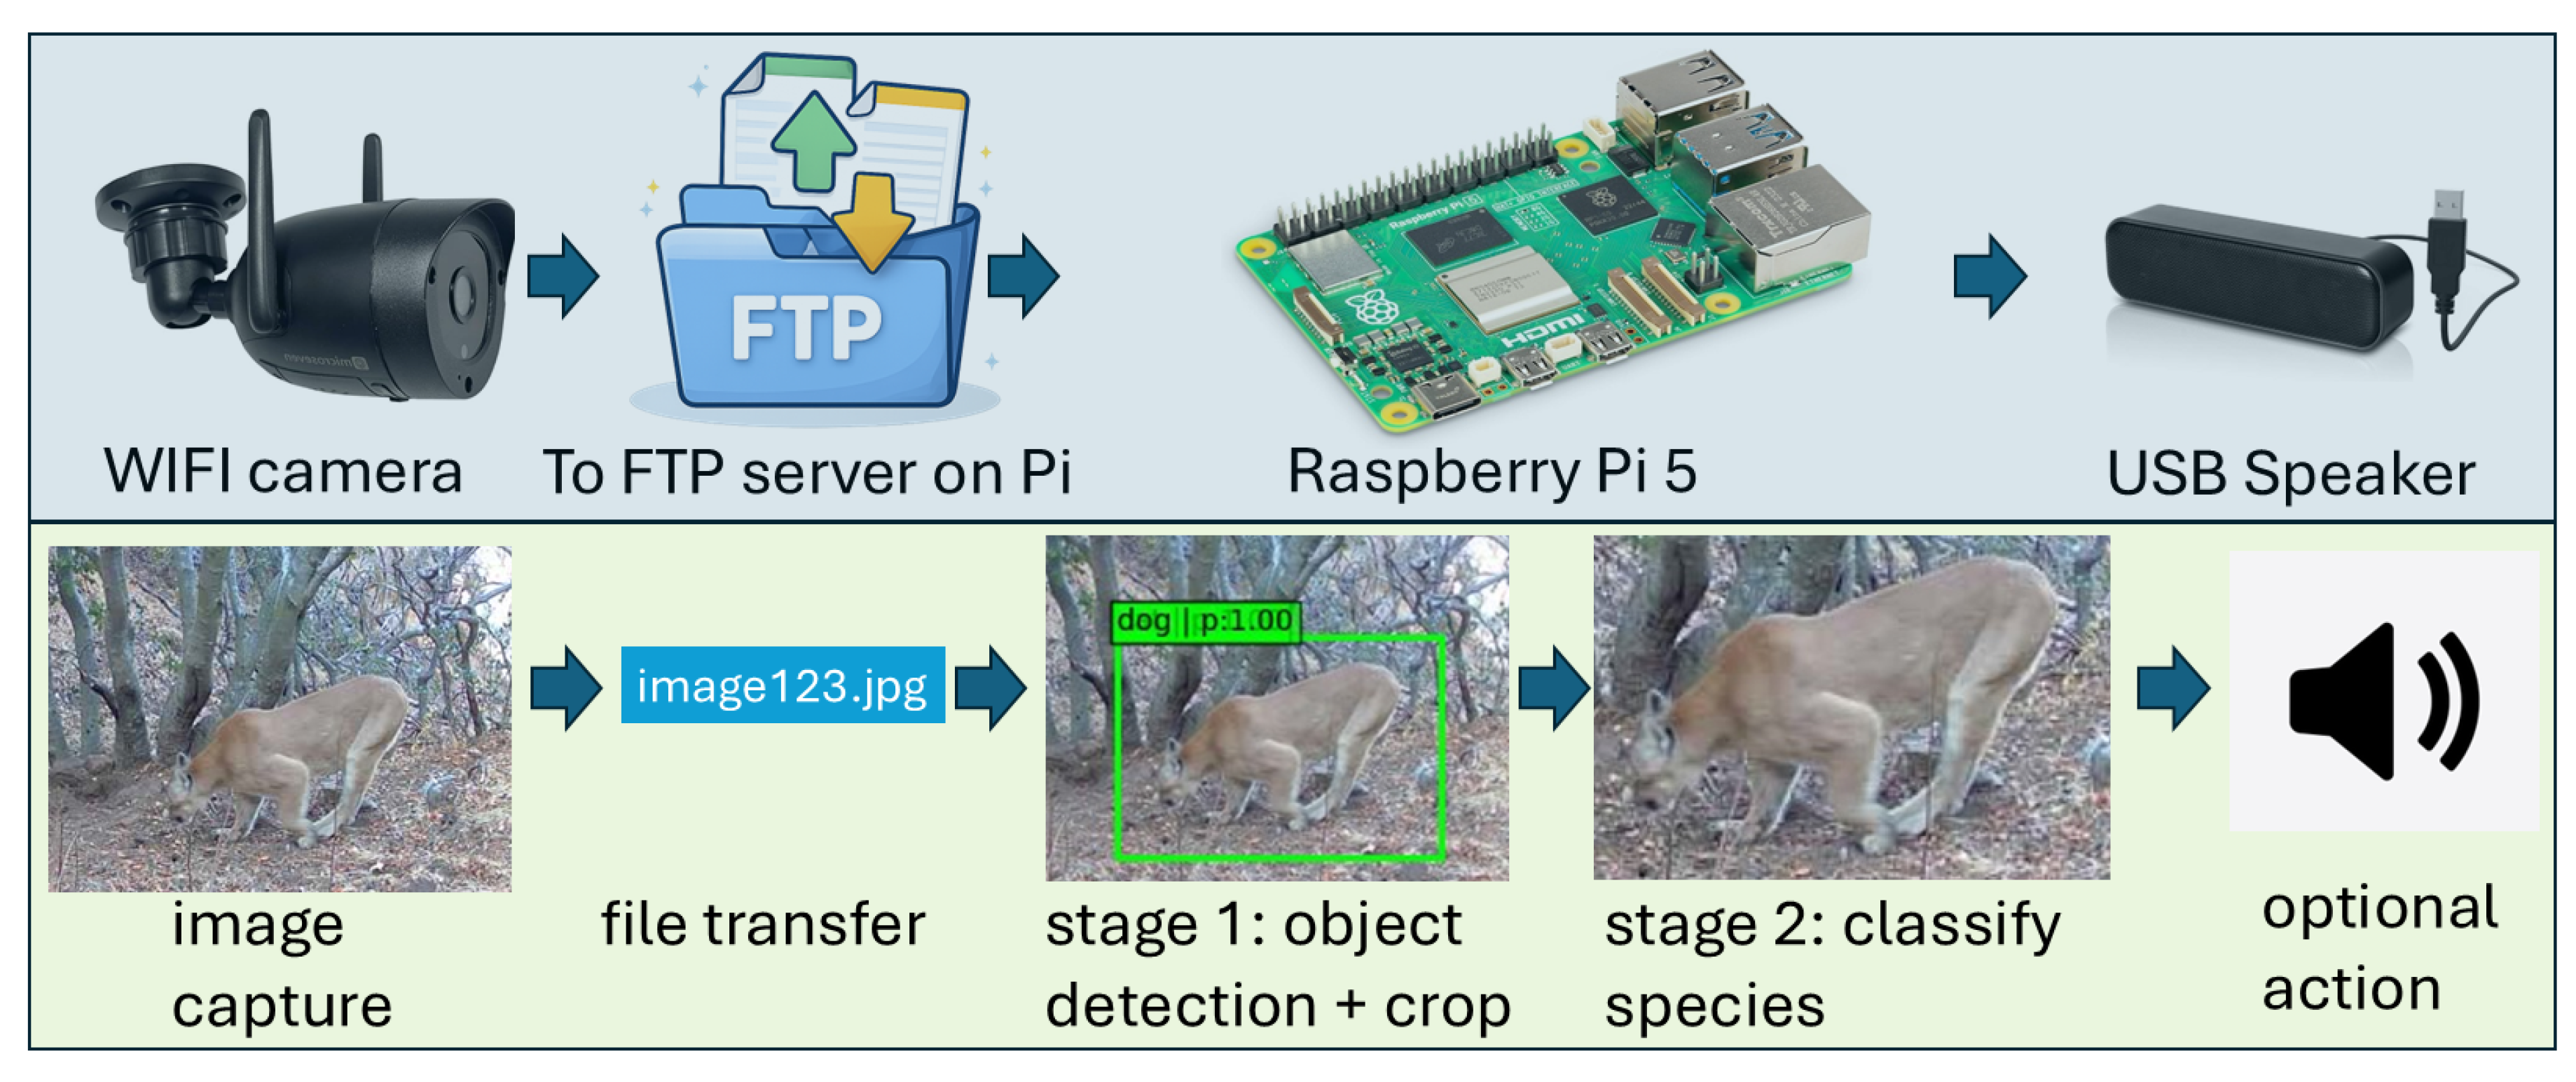
Figure 2.
Field deployment example illustrating the end-to-end sensing-to-action workflow. A puma approaches a residential pond (19 May 2025): (a) motion-triggered images are acquired and the animal is localized (green bounding boxes) and classified as puma in near real time (20/21 images classified correctly in this encounter); (b) an audio output is triggered after classification to demonstrate actuation capability; (c) the puma orients toward the sound source; (d) DSLR photo of the puma during the event. This figure is intended as a qualitative demonstration of integrated operation (trigger → transfer → inference → action), not as a controlled evaluation of behavioral deterrence. The full video is available at https://vimeo.com/1087210081.
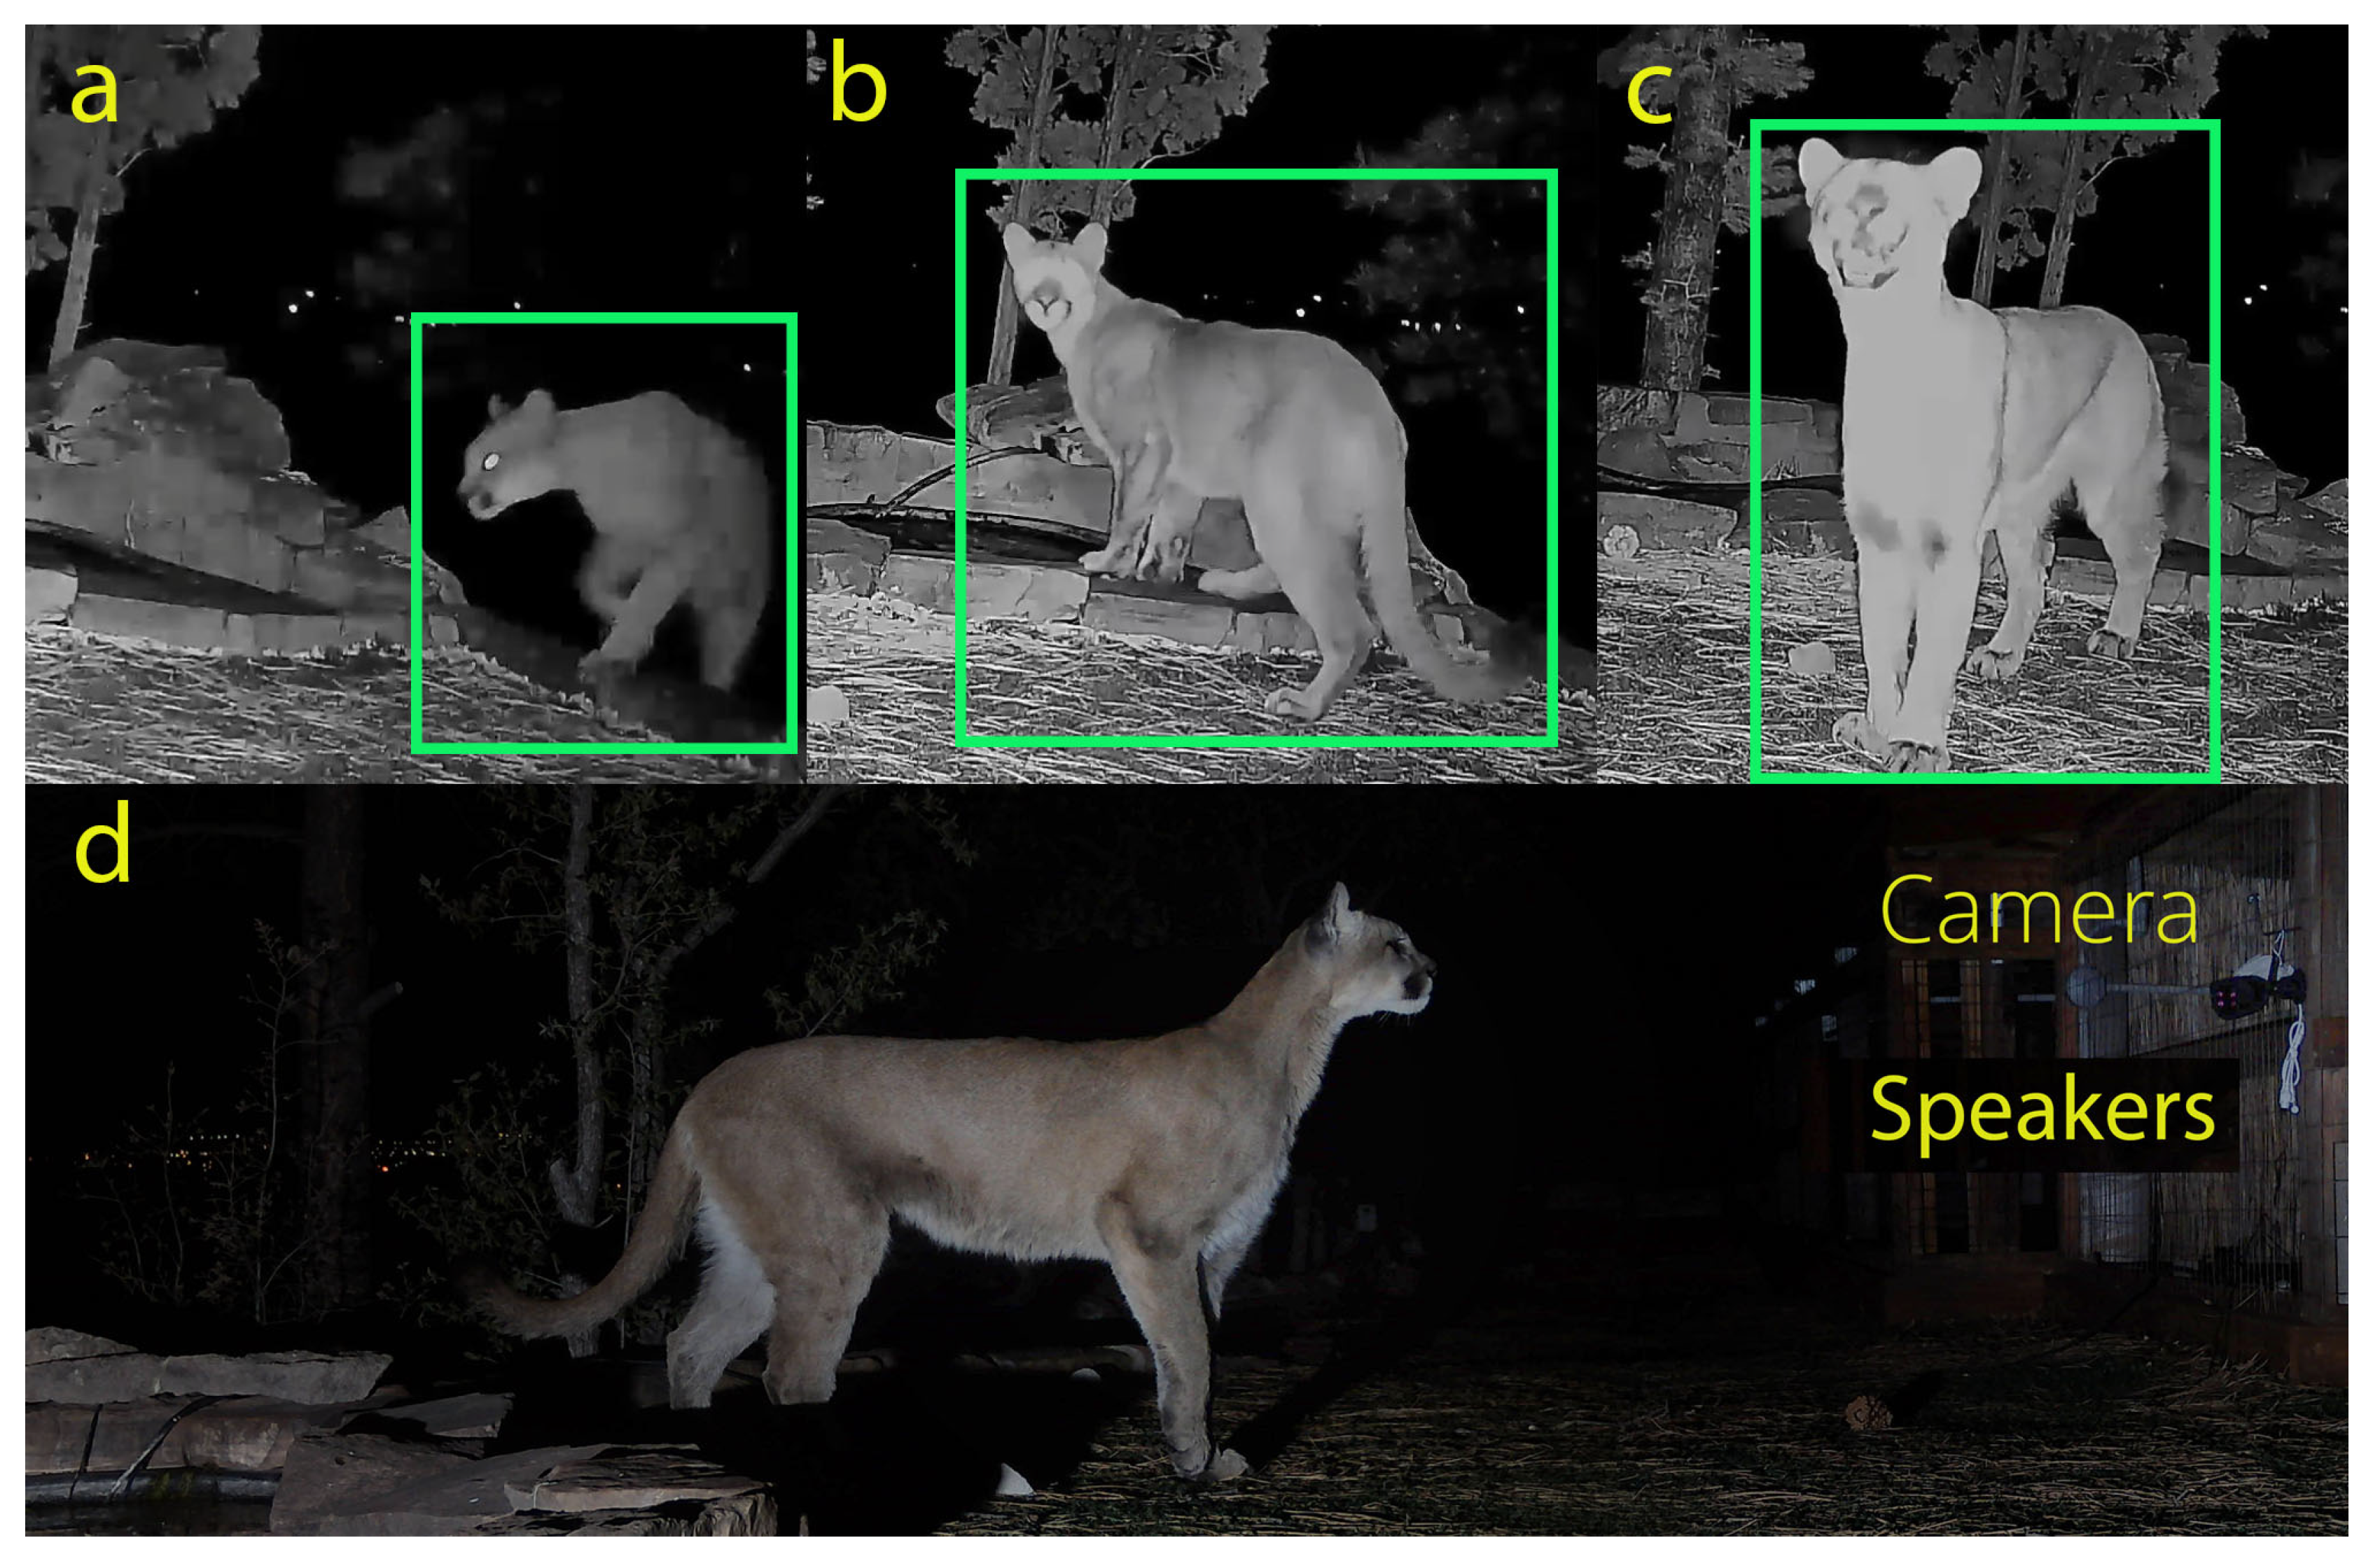
Figure 3.
Illustrative examples comparing Stage 1-only, Stage 2-only, and the proposed two-stage pipeline. Columns report Stage 1 detector outputs, Stage 2 full-frame classifier outputs, and the two-stage decision (Stage 1 crop + Stage 2). Rows include two puma cases (nighttime partially occluded; daytime) and one non-target fox example that produces a puma-like false positive across methods (see Section 5.3).
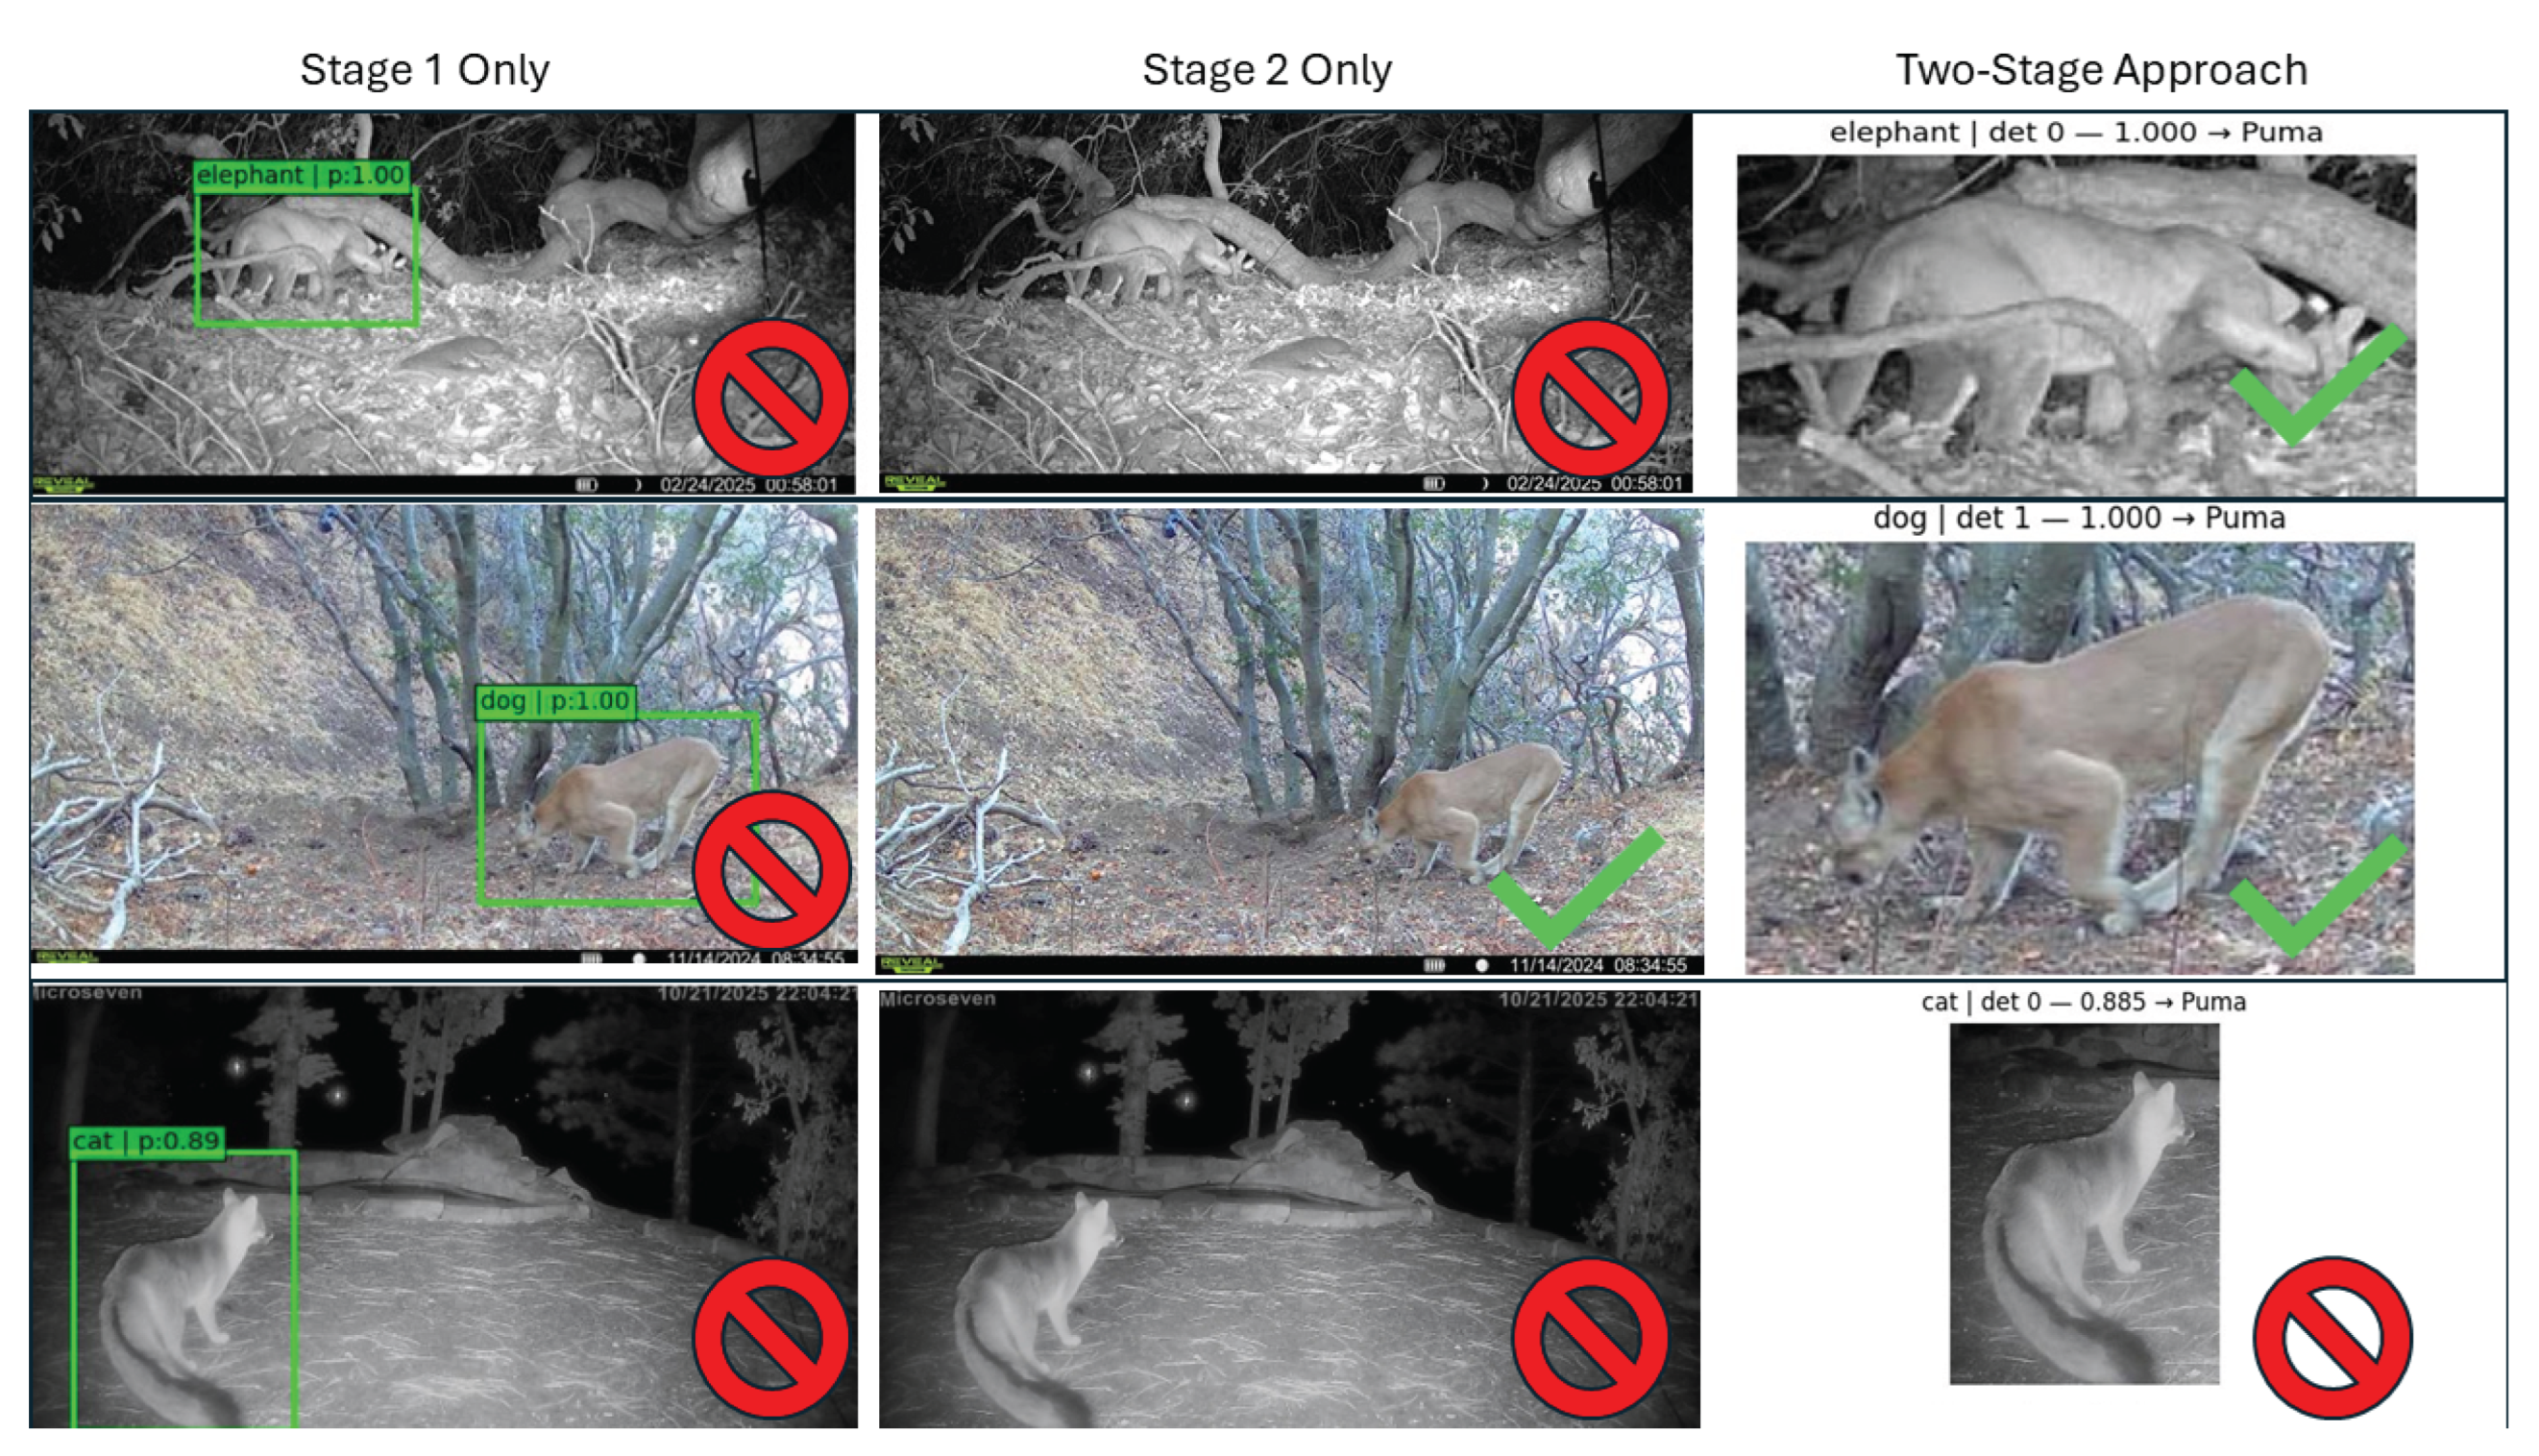
Figure 4.
Grad-CAM visualizations for the Stage 2 binary classifier (puma vs. no-puma) on cropped regions of interest. The panel includes two pumas, one coyote, two bobcats, and one fox. Heatmap intensity indicates feature importance for the classifier decision: red regions contribute most to the predicted class, while low-intensity/no-color regions contribute little. A green check mark indicates a correct prediction; a red barred circle indicates an incorrect prediction. Across puma examples, high-importance regions commonly include the tail, head, torso/shoulder contour, and paws. Misclassifications for visually similar species (e.g., bobcat and fox) often correspond to poses where these cues resemble the puma profile.
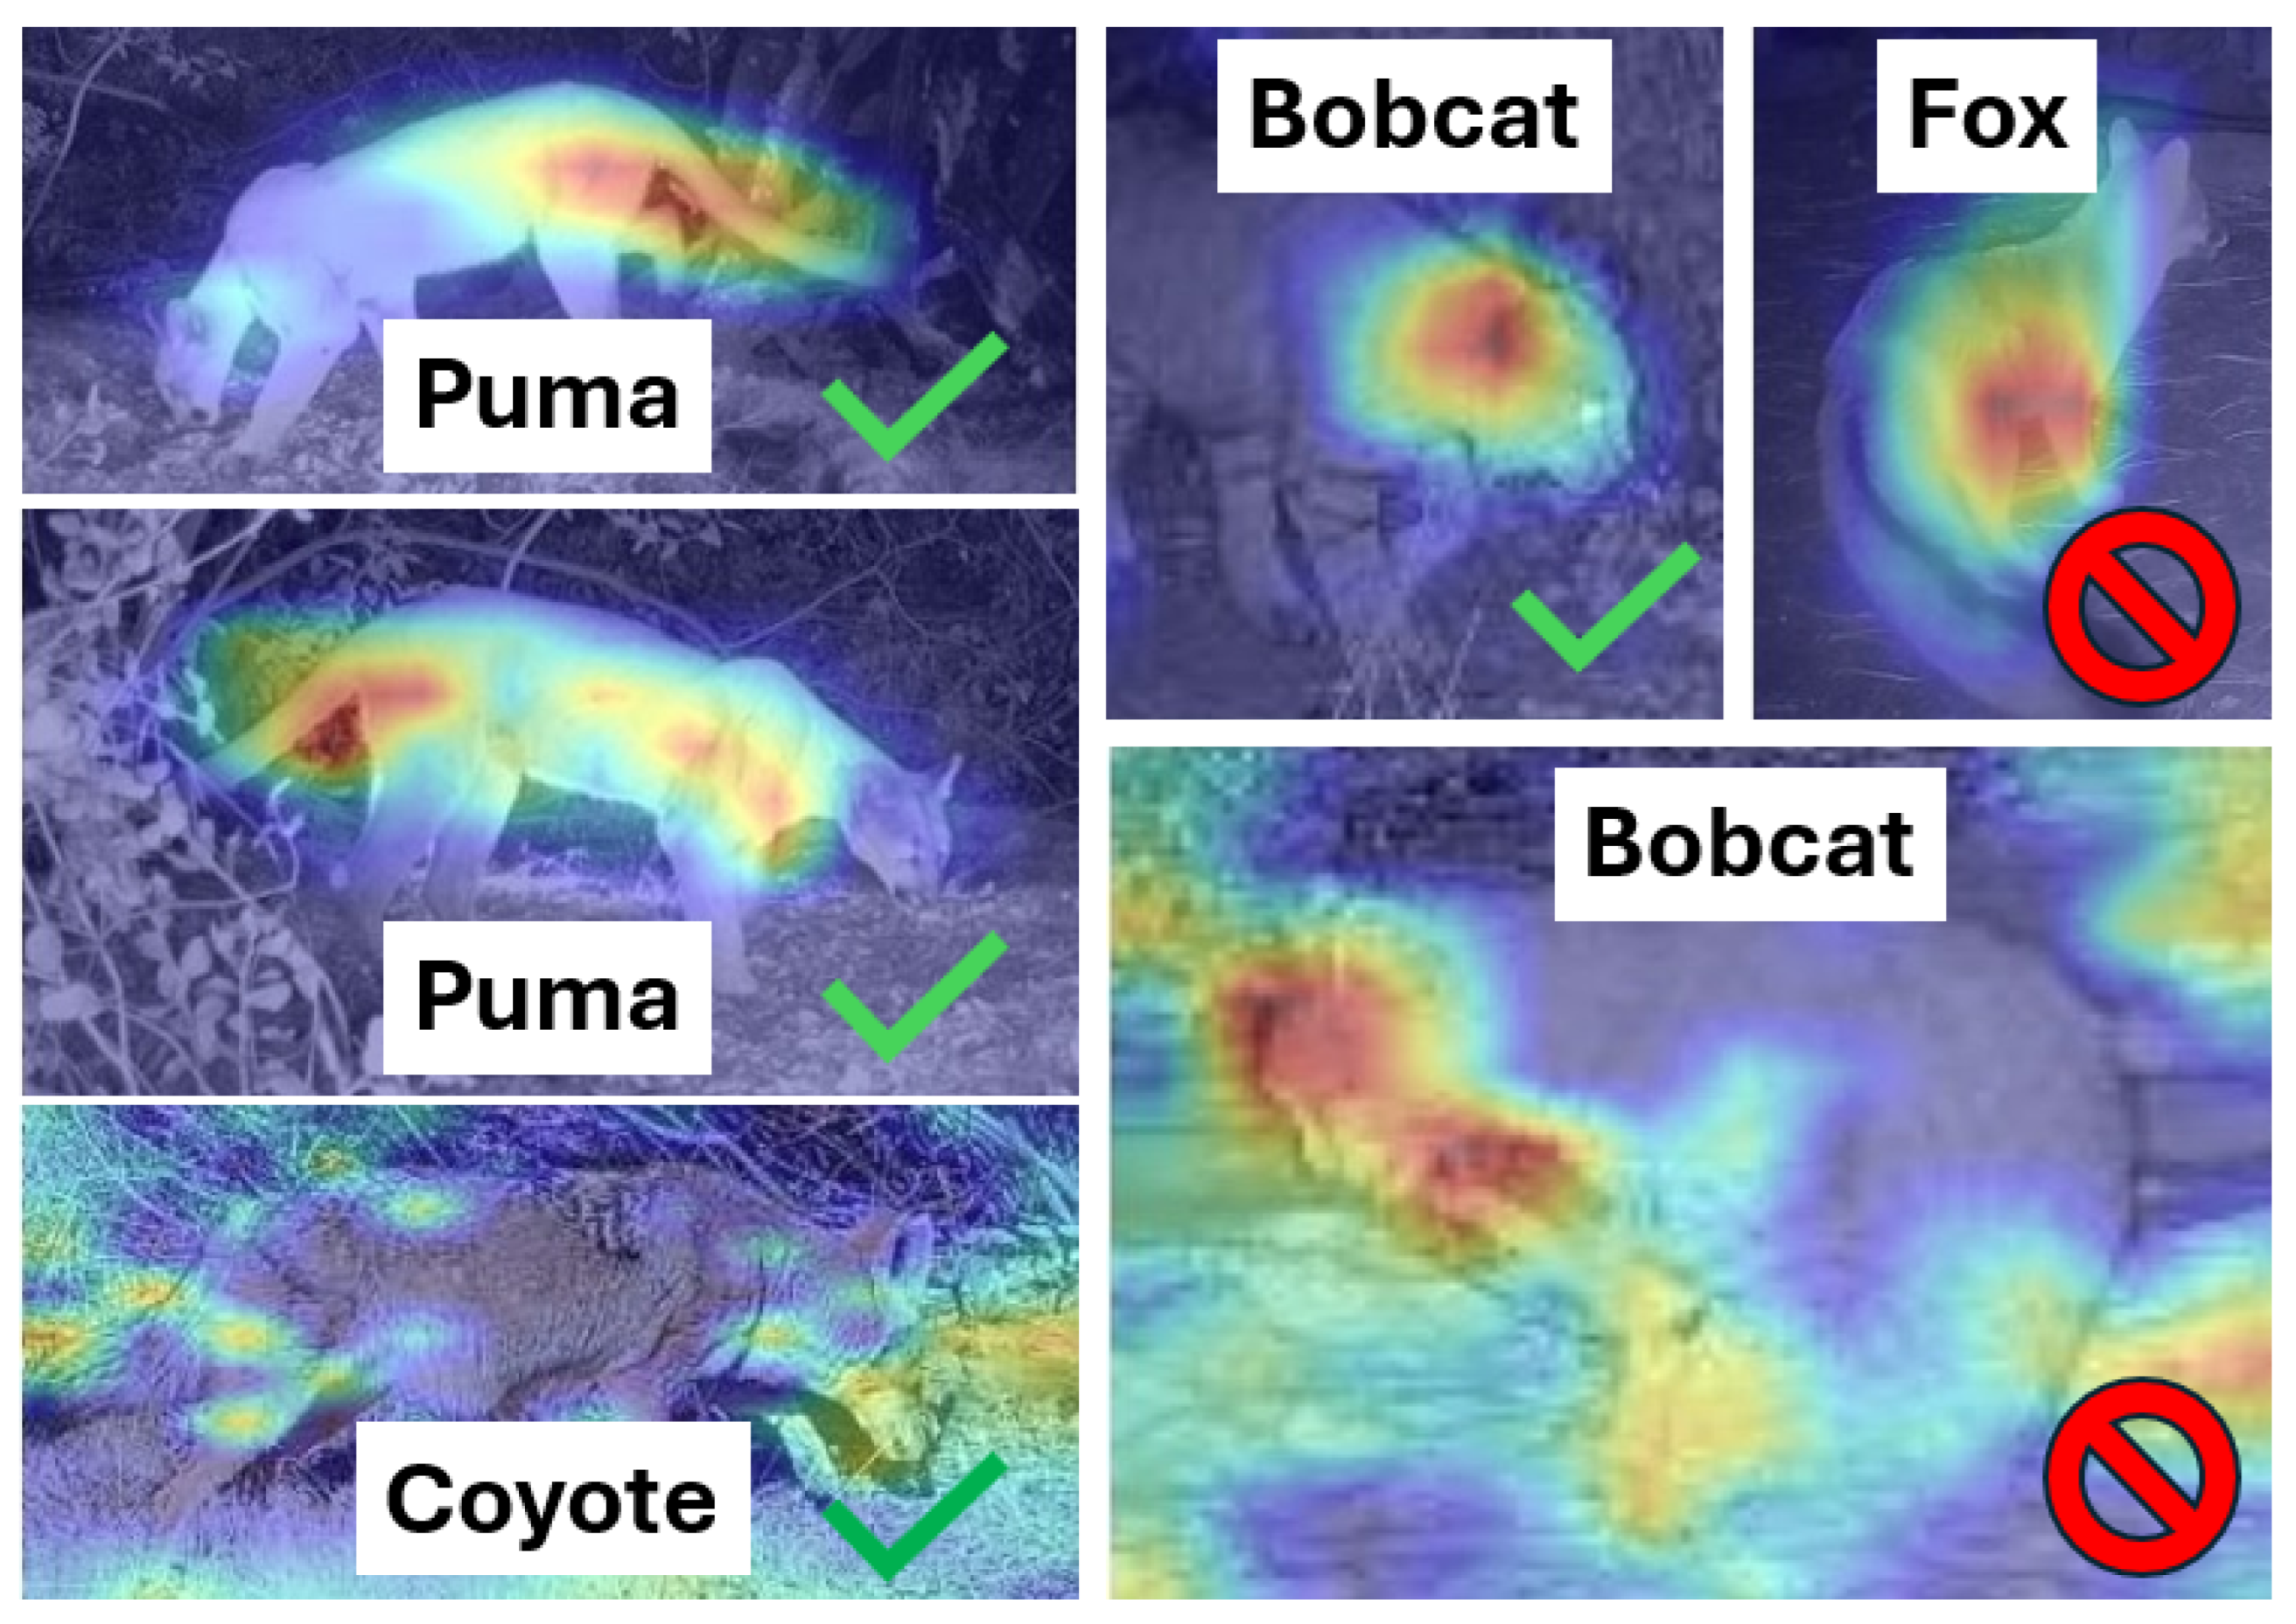

Table 1.
Representative power budget for the vision sensor system. Values are typical/observed in our deployment configuration; actual power draw depends on camera model, WiFi conditions, and speaker duty cycle.
Table 1.
Representative power budget for the vision sensor system. Values are typical/observed in our deployment configuration; actual power draw depends on camera model, WiFi conditions, and speaker duty cycle.
| Component | Qty. | Power (W) | Notes |
|---|---|---|---|
| Raspberry Pi 5 (edge inference + hotspot + FTP + UI) | 1 | Includes local WiFi hotspot and services. | |
| FTP-enabled WiFi PIR security camera | 1 | Higher draw due to continuous video and (at night) IR illumination. | |
| USB speaker (optional) | 1 | Typical draw; depends on volume and playback duty cycle. | |
| Total (single-camera configuration) | Observed in our single-camera setup. |
Table 2.
Confusion matrix for Stage 1 only implementation.
| Predicted | Metrics (Puma as positive) | ||||
|---|---|---|---|---|---|
| Actual | Puma | Not Puma | Precision | Recall | F1 |
| Puma | 160 | 319 | 0.958 0.334 0.495 | ||
| Not Puma | 7 | 948 | |||
Table 3.
Confusion matrix for Stage 2 only implementation.
| Predicted | Metrics (Puma as positive) | ||||
|---|---|---|---|---|---|
| Actual | Puma | Not Puma | Precision | Recall | F1 |
| Puma | 446 | 33 | 0.723 0.931 0.814 | ||
| Not Puma | 171 | 784 | |||
Table 4.
Confusion matrix for Two-stage animal-only implementation.
| Predicted | Metrics (Puma as positive) | ||||
|---|---|---|---|---|---|
| Actual | Puma | Not Puma | Precision | Recall | F1 |
| Puma | 390 | 89 | 0.982 0.814 0.890 | ||
| Not Puma | 7 | 948 | |||
Table 5.
Confusion matrix for proposed two-stage methodology.
| Predicted | Metrics (Puma as positive) | ||||
|---|---|---|---|---|---|
| Actual | Puma | Not Puma | Precision | Recall | F1 |
| Puma | 467 | 12 | 0.983 0.975 0.979 | ||
| Not Puma | 8 | 947 | |||
Table 6.
Ablation study for per-trigger puma vs. no-puma classification on the labeled dataset (479 puma, 955 no-puma; ). FP counts no-puma events incorrectly predicted as puma, and FN counts puma events incorrectly predicted as no-puma.
Table 6.
Ablation study for per-trigger puma vs. no-puma classification on the labeled dataset (479 puma, 955 no-puma; ). FP counts no-puma events incorrectly predicted as puma, and FN counts puma events incorrectly predicted as no-puma.
| Variant | What it does | Results (FP/FN) |
|---|---|---|
| Stage 1 only (YOLO label proxy) | Predict puma if YOLO reports cat. | 7 / 319 |
| Stage 2 only (full frame) | EfficientNet binary classifier on raw uncropped image. | 171 / 33 |
| Two-stage (animal-only filter) | Filter YOLO detections to “animal” labels, crop, then classify with EfficientNet. | 7 / 89 |
| Two-stage (proposed; permissive Stage 1) | Use YOLO for broad localization/cropping, then EfficientNet for classification. | 8 / 12 |
Disclaimer/Publisher’s Note: The statements, opinions and data contained in all publications are solely those of the individual author(s) and contributor(s) and not of MDPI and/or the editor(s). MDPI and/or the editor(s) disclaim responsibility for any injury to people or property resulting from any ideas, methods, instructions or products referred to in the content. |
© 2026 by the authors. Licensee MDPI, Basel, Switzerland. This article is an open access article distributed under the terms and conditions of the Creative Commons Attribution (CC BY) license (http://creativecommons.org/licenses/by/4.0/).
Copyright: This open access article is published under a Creative Commons CC BY 4.0 license, which permit the free download, distribution, and reuse, provided that the author and preprint are cited in any reuse.


