1. Introduction
Hypertension remains highly prevalent and is a leading modifiable risk factor for cardiovascular morbidity and mortality. Despite effective pharmacologic and lifestyle therapies, long-term control is often limited by gaps in patient knowledge, inconsistent self-management behaviors, and barriers to accessing ongoing education and support,challenges that are frequently amplified in rural and underserved communities [
1].
Mobile health (mHealth) applications have emerged as a scalable strategy to extend hypertension education and self-management support beyond clinic visits. Randomized controlled trials report that app-based interventions can improve hypertension knowledge, self-care behaviors, medication adherence, and, in some studies, blood pressure outcomes [
2,
3,
4]. However, systematic reviews note that evidence for hypertension mHealth apps is limited by high risk of bias and heterogeneity in interventions and outcomes, which reduces confidence in reported effects [5}.
Persistent knowledge deficits may further hinder effective hypertension control. Only 9% of patients reported knowing their target blood pressure in one study [
6], and low understanding of low-density lipoprotein (LDL) cholesterol targets has also been documented [
7]. Nurse-led educational interventions have demonstrated mixed but promising effects on knowledge and clinical outcomes [
8].
In a public academic medical setting serving rural and underserved communities, a state public health–funded hypertension initiative identified an implementation challenge: in-person lifestyle education classes had limited reach due to attendance barriers, underscoring the need for an alternative delivery modality. In response, an interdisciplinary team developed a smartphone-based platform (HYPE) to deliver evidence-based lifestyle education and self-management support that could be accessed outside traditional clinic-based programming.
This pilot study was designed to evaluate a publicly available hypertension management app (iOS and Android) with respect to feasibility, perceived usefulness, user satisfaction, and user-entered metrics relevant to HTN and lifestyle management (e.g., BP, weight, activity, medications). Overall, the app demonstrated feasible low-touch uptake and captured user-entered self-management metrics, although sustained tracking was limited to a subset of users. Sustaining the app required ongoing maintenance, security updates, and iterative platform changes that became cost-prohibitive; future efforts may be supported through a sustainability plan that leverages institutional IT support and grant/health-system partnerships, prioritizes a lean “maintenance mode” feature set, and integrates the tool into existing digital health infrastructure to share costs across programs.
2. Materials and Methods
Study Design and Setting
We conducted an internet-based, single-arm pilot evaluation of a publicly available hypertension (HTN) self-management mobile application (iOS and Android) developed in a public academic medical setting serving rural and underserved communities. To extend access to evidence-based lifestyle education and self-management support outside clinic walls, an interdisciplinary team developed the HYPE smartphone app through monthly, nurse-led meetings with app developers, a clinical dietitian, and data analysts. App development began in 2019, and data collection ended in 2024.
Intervention: HYPE Mobile Application
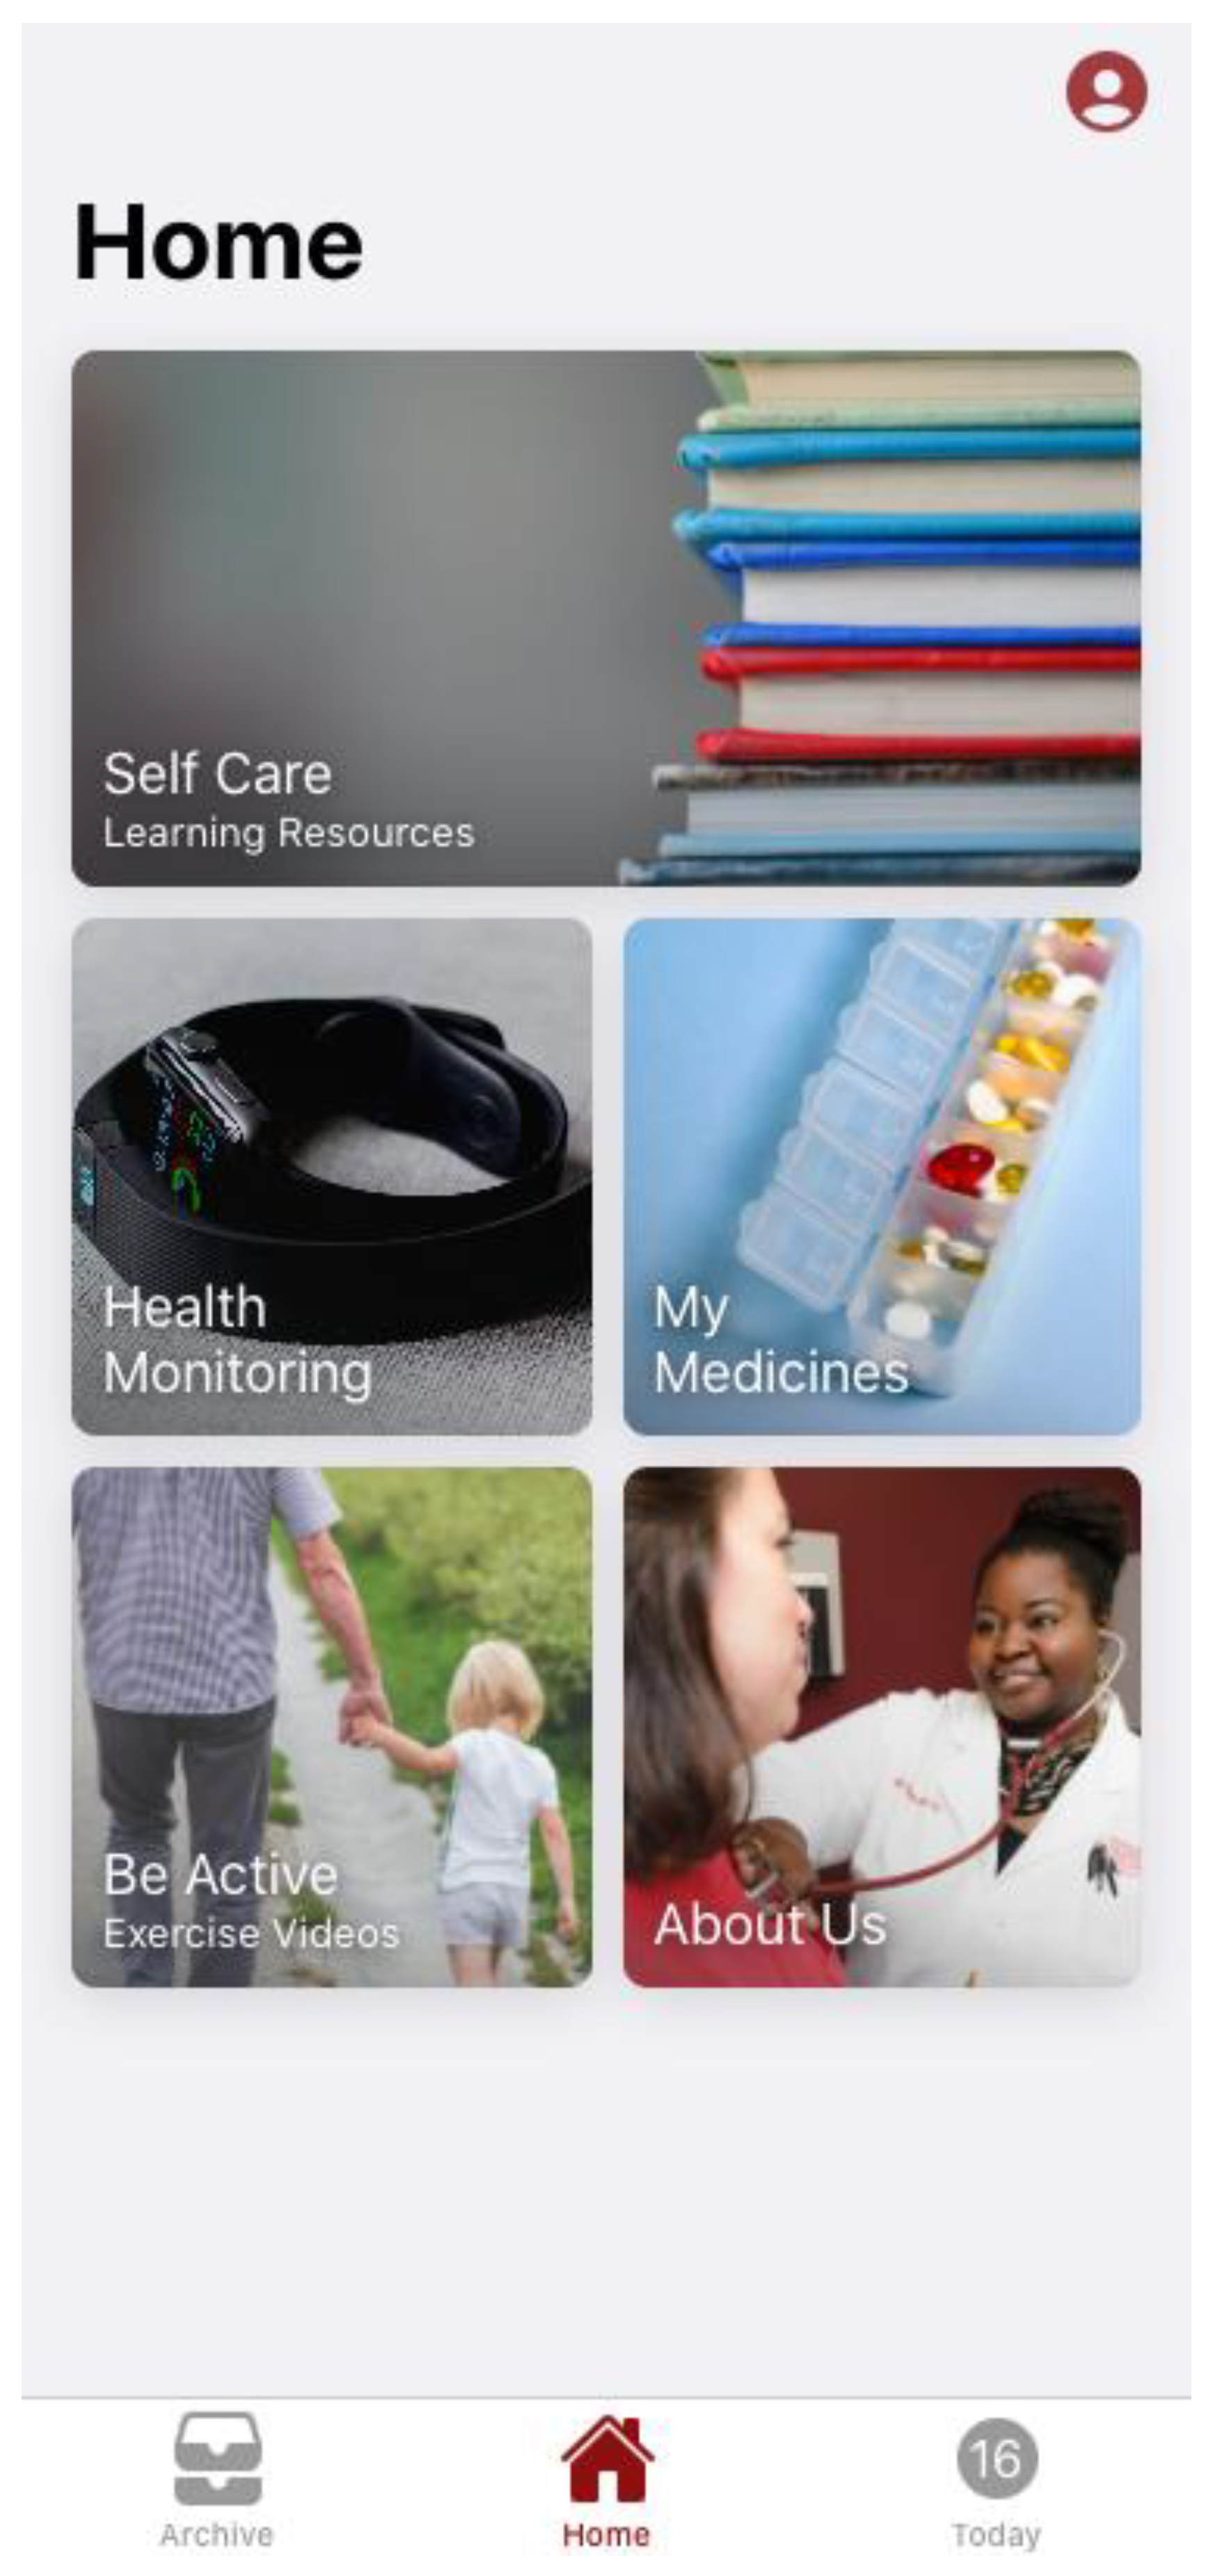
The HYPE mobile application was previously distributed via public app stores; however, it is no longer available for download at the time of manuscript preparation HYPE was a publicly available hypertension self-management mobile application (iOS and Android) designed to combine evidence-informed lifestyle education with practical tools for day-to-day tracking and goal setting. The app opens to a Home screen with large, tile-based navigation that directs users to core features, including Self Care (Learning Resources), Health Monitoring, My Medicines, and Be Active (Exercise Videos), with an additional About Us tile for program information (
Figure 1).
The app opens to a Home screen with large, tile-based navigation that directs users to core features, including Self Care (Learning Resources)
, Health Monitoring
, My Medicines
, and Be Active (Exercise Videos), with an additional About Us tile for program information (
Figure 1).
Medication management is available through the My Medicines feature, which allows patients to document medications (
Figure 2).
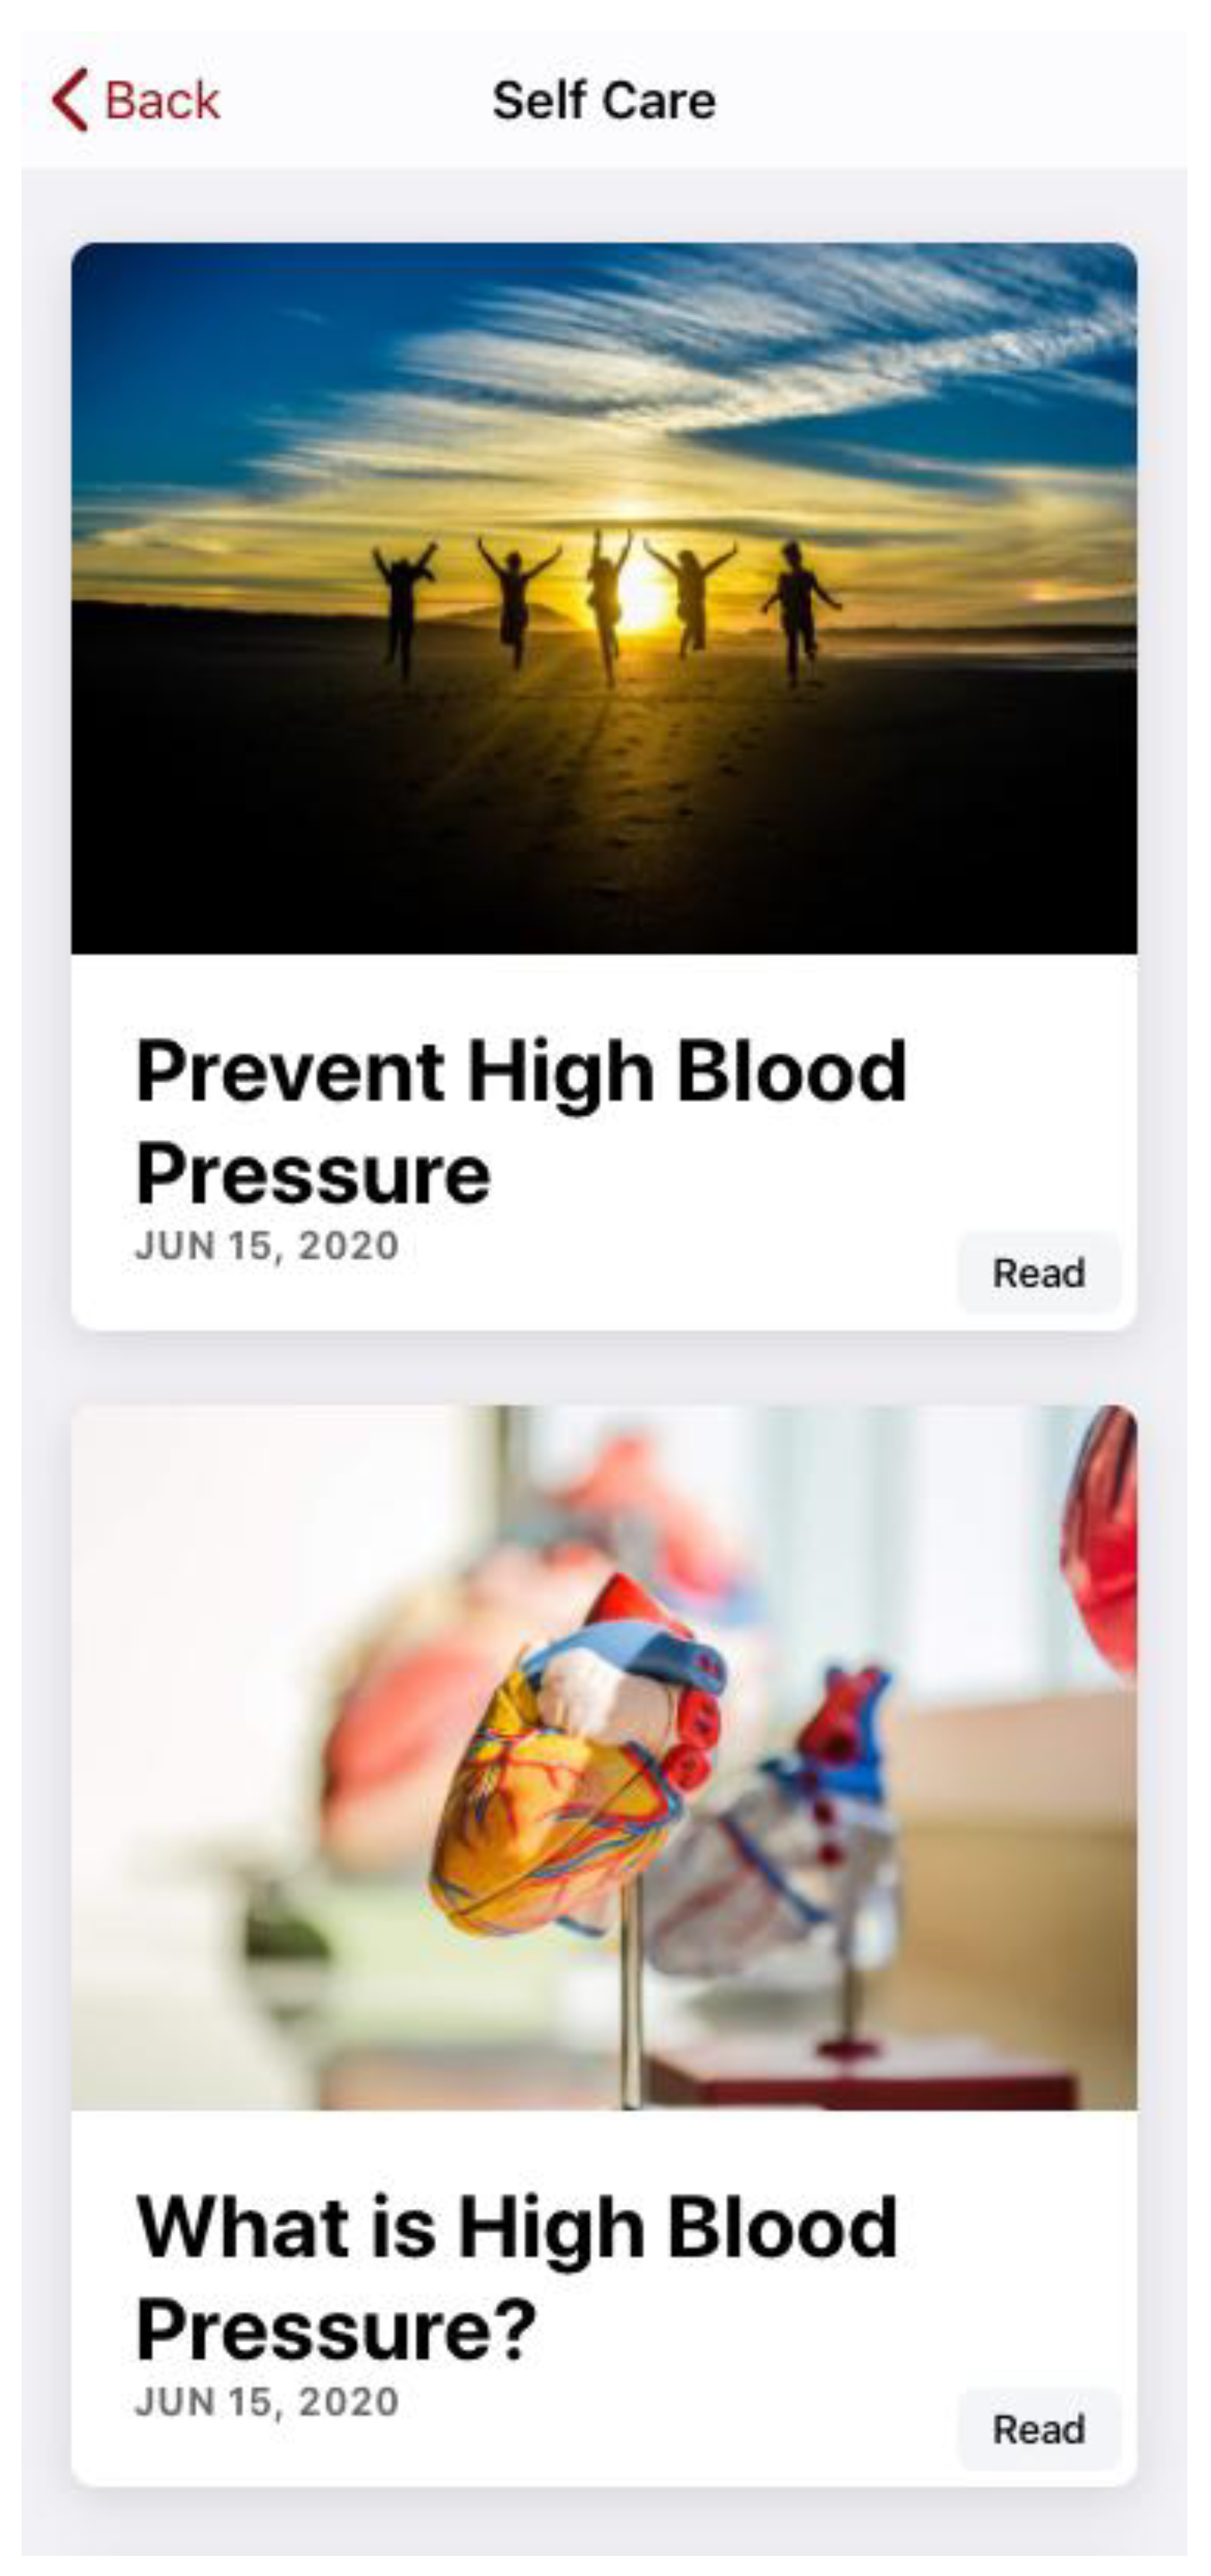
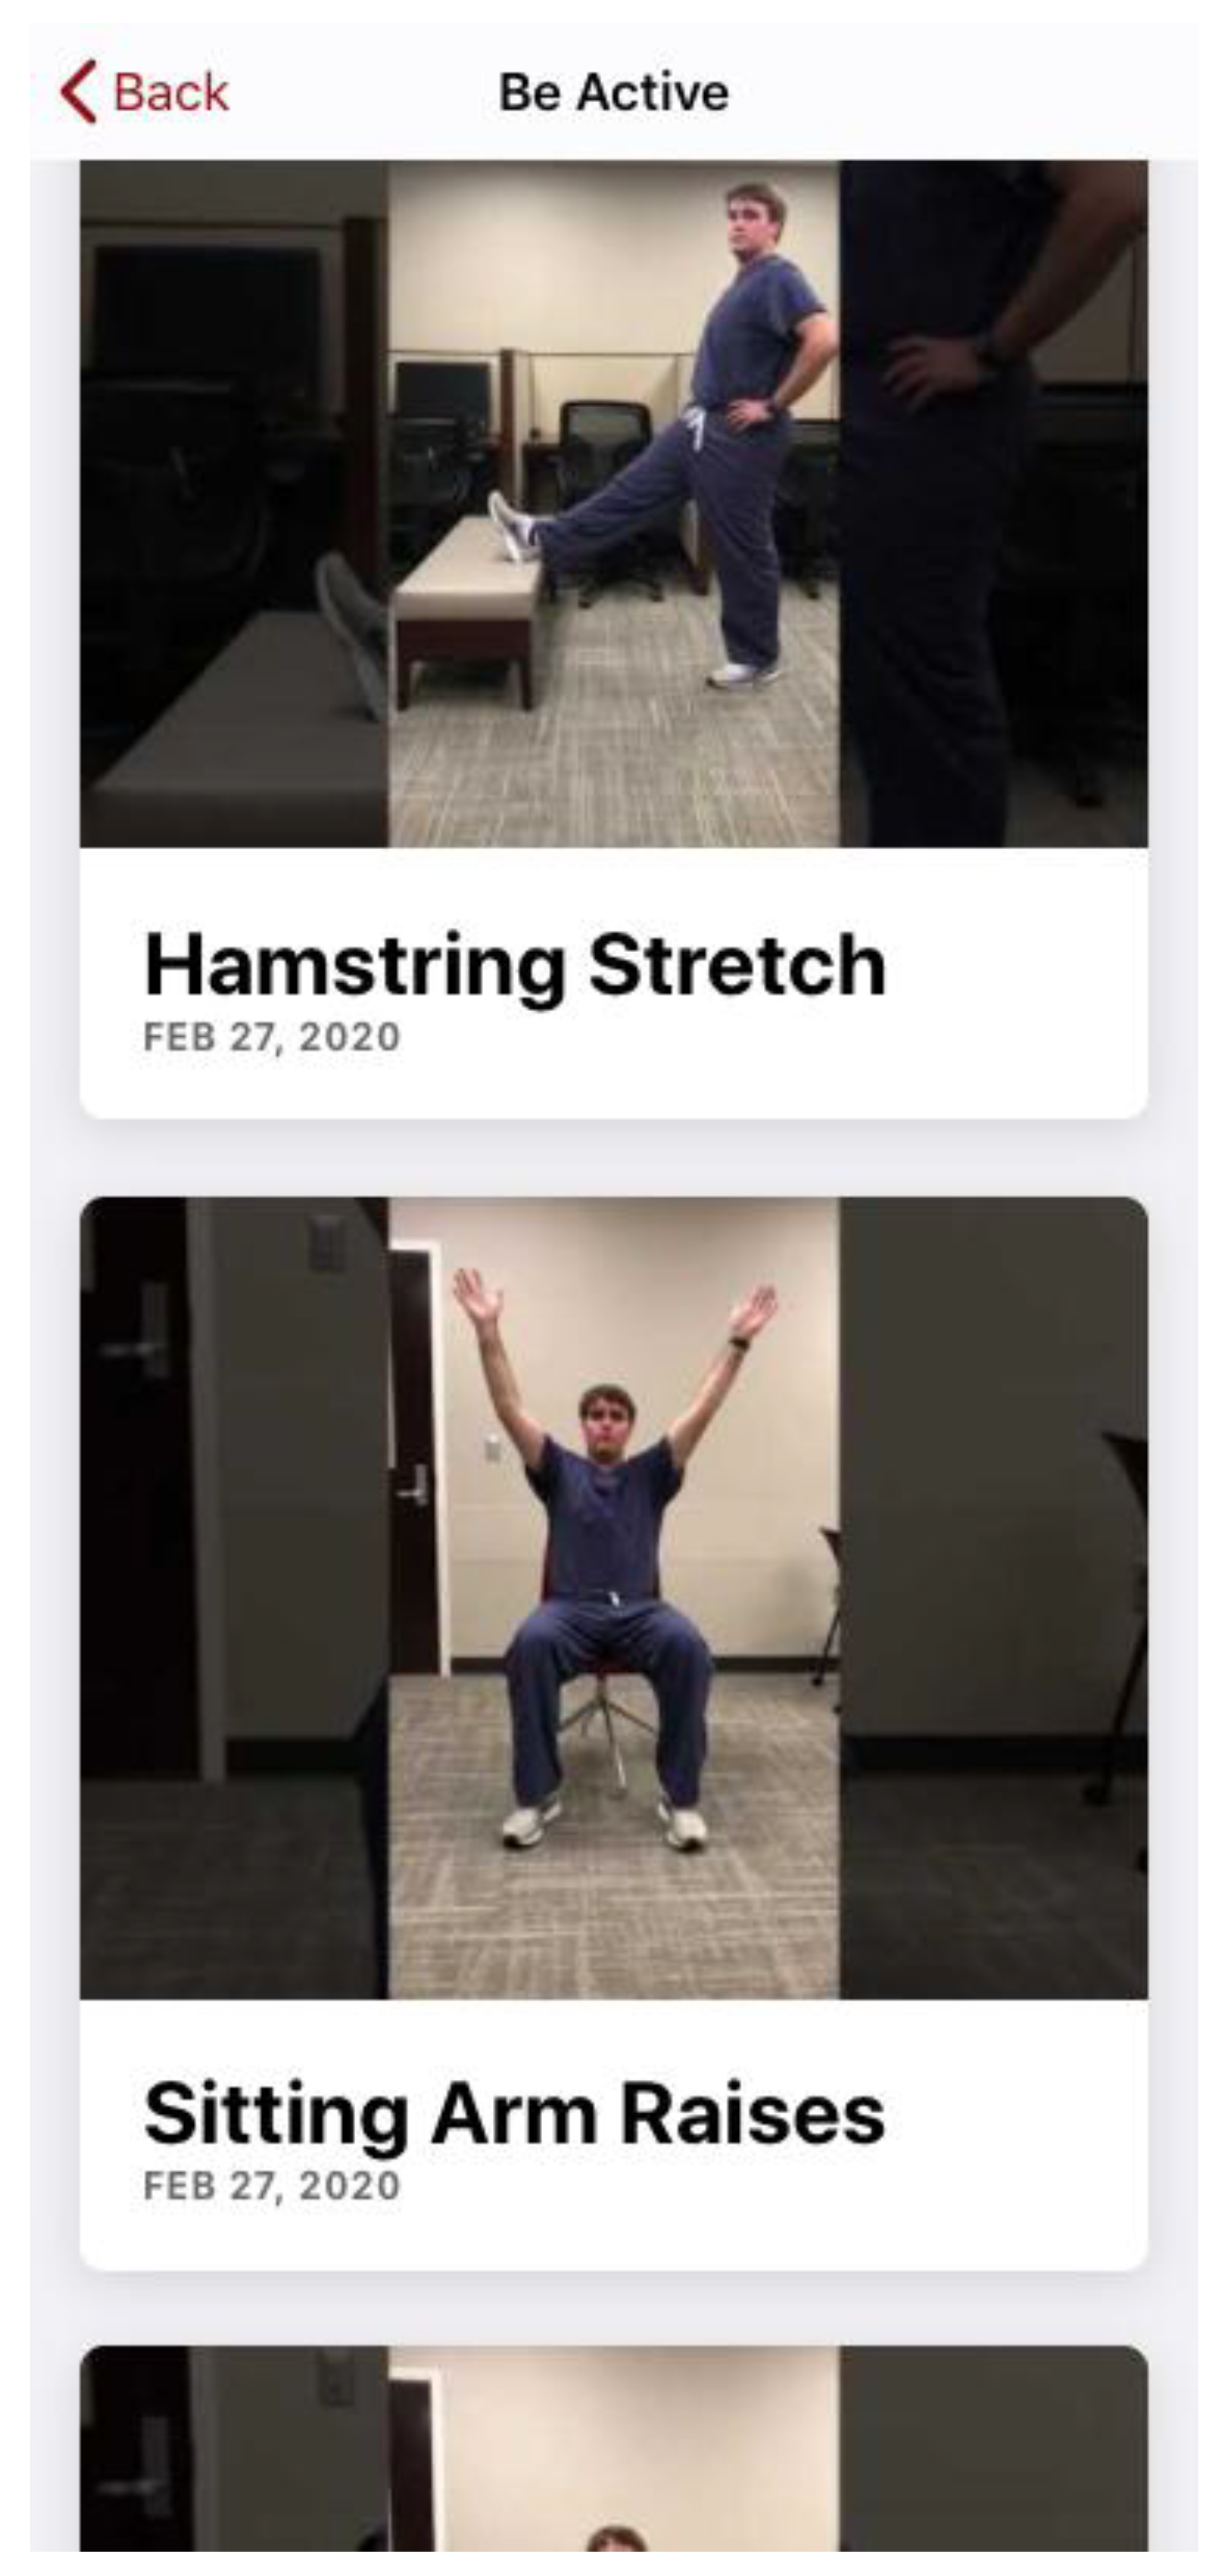
The educational component is delivered through Self Care, where users can access written learning modules (e.g., “Prevent High Blood Pressure” and “What is High Blood Pressure?”;
Figure 3), and through Be Active, which provides exercise videos (e.g., stretching and chair-based activities;
Figure 4) to reinforce lifestyle strategies that support blood pressure control.
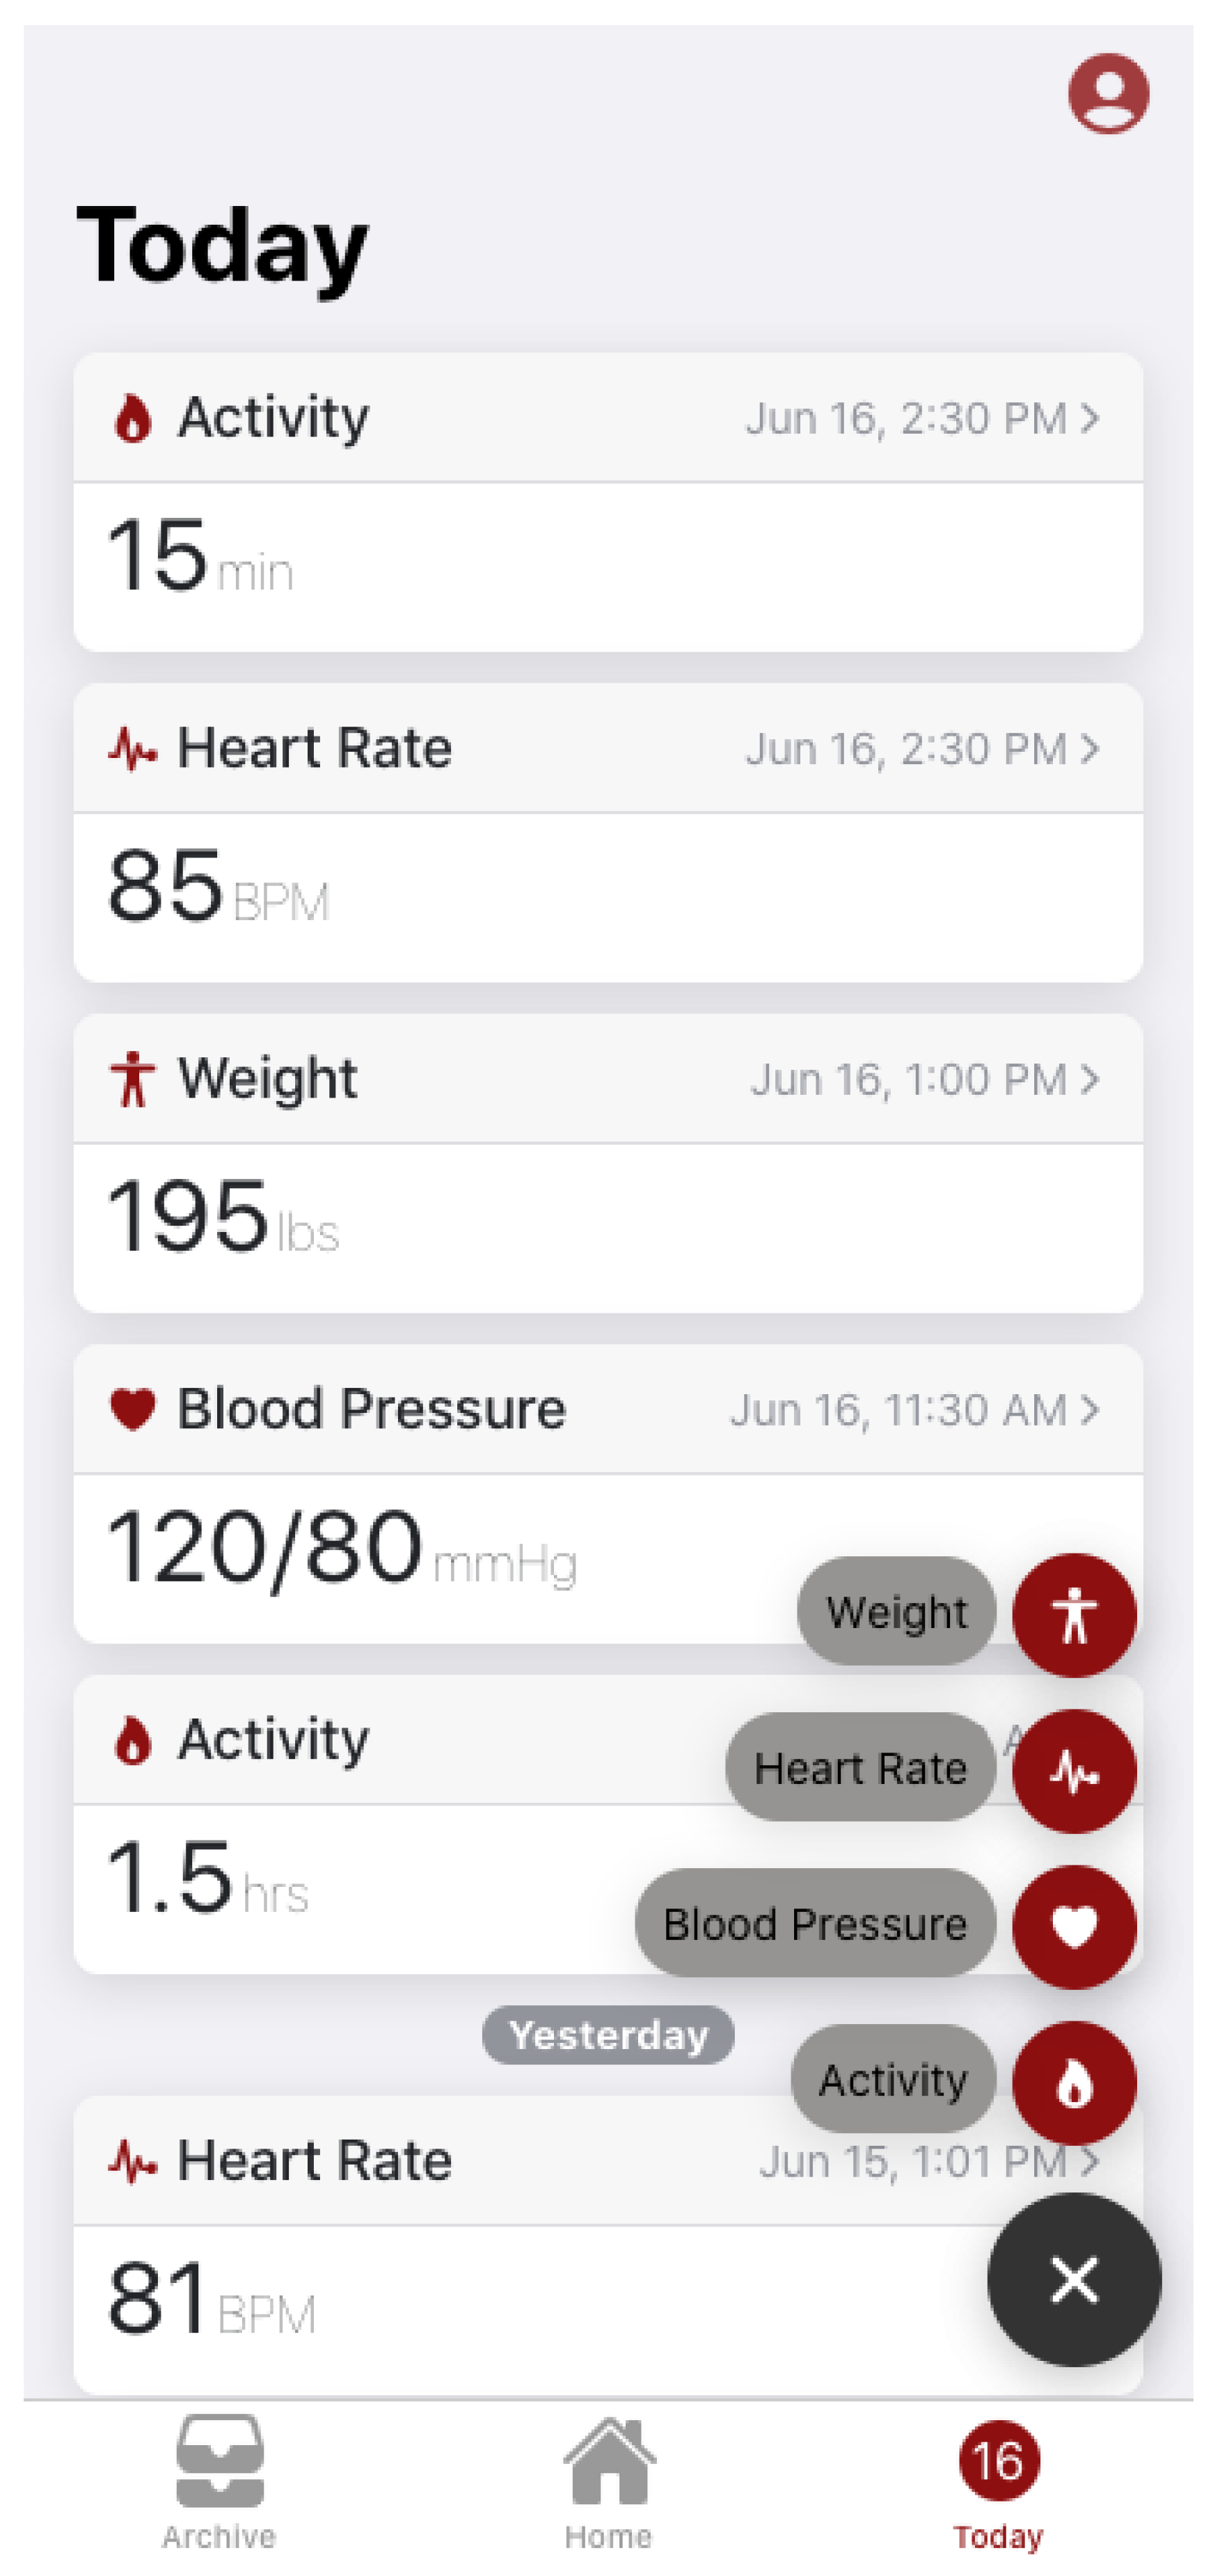
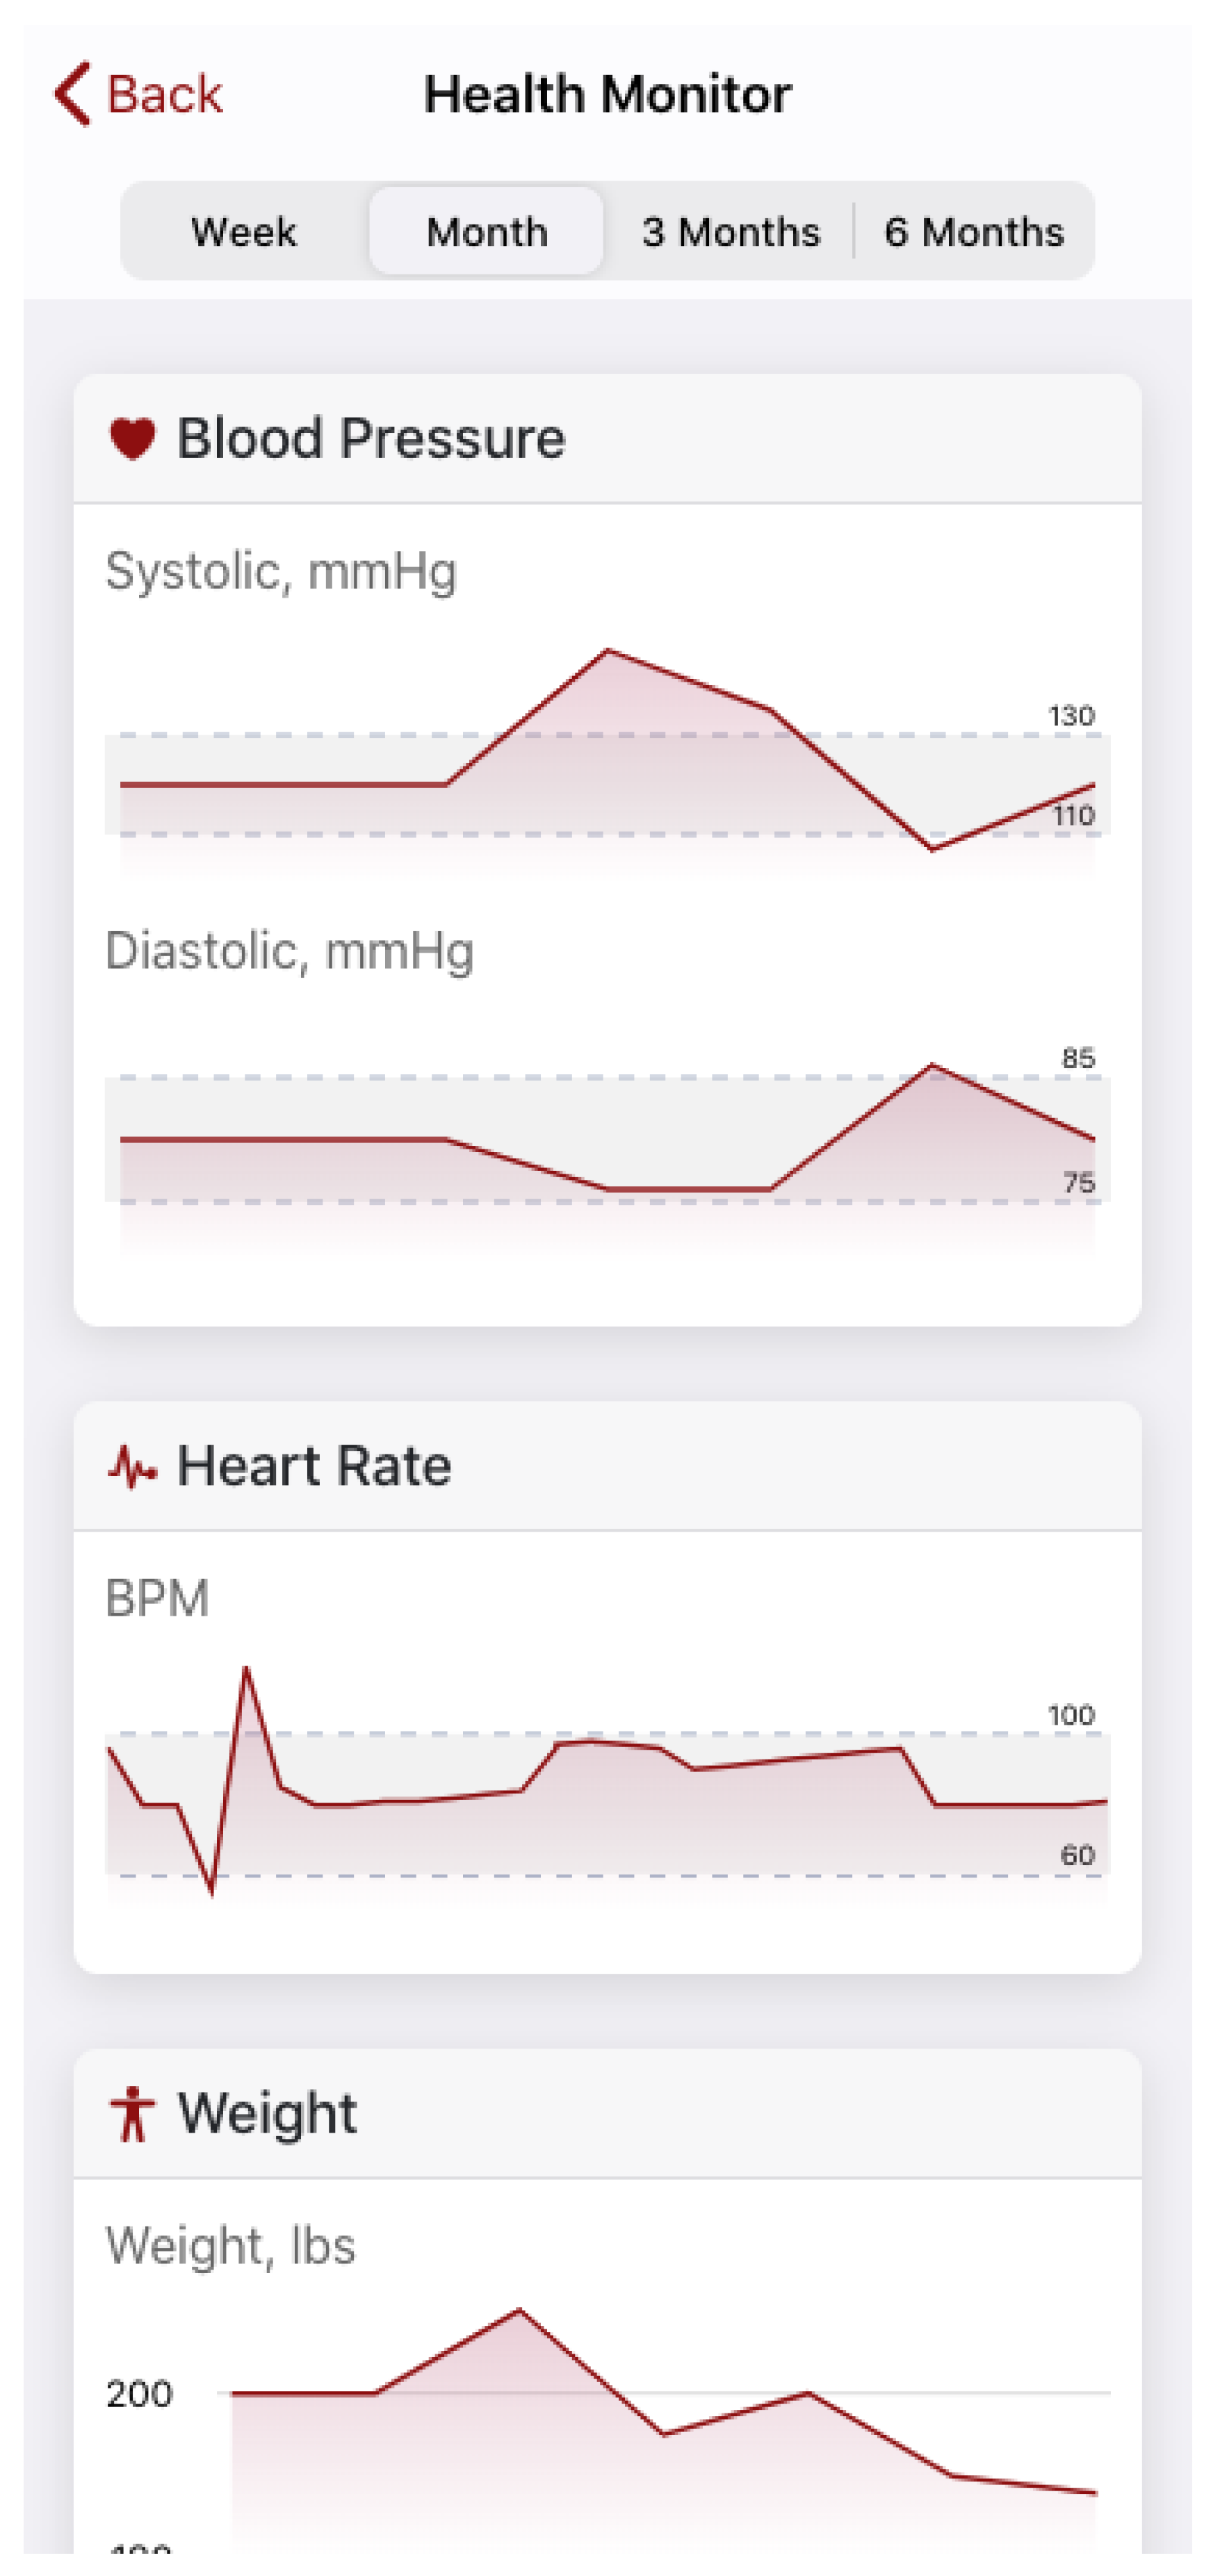
In parallel, the app supports self-monitoring and tracking through a “Today” dashboard and longitudinal displays: the Today view summarizes recent entries for blood pressure, heart rate, weight, and activity (
Figure 5), while the Health Monitor view trends these measures over time (
Figure 6) and can also display values in list format (e.g., heart rate history; Figure 7). Patients can enter new blood pressure readings through the tracking interface (e.g., via the Today/Blood Pressure functions;
Figure 5) and can document medications within the My Medicines section accessed from the Home screen (
Figure 2), supporting ongoing self-management and consistent tracking over time.
Iterative Enhancements
Across the five-year grant period, the app was refined through iterative updates to improve usability, support engagement, and enable evaluation using de-identified user-entered data. During Year 2 of the HYPE app (FY22; July 1, 2021–June 30, 2022), the university center provided ongoing maintenance support, focused on (1) updates to resolve production issues (bug fixes) and (2) keeping the iOS and Android apps current with operating system releases. The agreement covered the Hype Mobile App only; new enhancements beyond these maintenance tasks were out of scope and would require a separate effort, and Tier 1 support was not included.
For Year 3 (Phase 3), planned work for the HYPE mobile app focused on adding data-access and user-engagement enhancements and refining the user interface. Key deliverables included: (1) a data dashboard that allows research team authorized users to download app data; (2) a new “Townhall” tile added to the app home screen to provide in-app access to townhall videos (hosted via a YouTube playlist); (3) an in-app user feedback prompt/notification to ask users, particularly those with low engagement, why they are not using the app more frequently; (4) a UI update to make the “Today” page the default landing page to prioritize entering monitoring data and to adjust page labeling since “Home” would no longer be the default; and (5) an instructional video demonstrating how to use the app after sign-in, available both during onboarding and on-demand from the profile page.
Participants and Enrollment
Adults aged ≥19 years who downloaded the free app from a commercial app store were eligible. Enrollment was entirely remote and app-based: users created a single password-protected account (one account per person), reviewed an electronic consent screen describing the study purpose, procedures, risks/benefits, and data handling, and indicated consent in-app; only consenting users could access the questionnaire. No direct outreach, clinic-based recruitment, study visits, or incentives were used, and participants could discontinue at any time without contact from the study team.
Outcomes and Measures
This pilot study evaluated feasibility, perceived usefulness, user satisfaction, and user-entered metrics relevant to HTN and lifestyle management (e.g., BP, weight, activity, medications). Questionnaire measures were captured via an in-app baseline questionnaire completed at or near initial app use/registration. Items assessed HTN history and management (e.g., time since diagnosis, duration of BP medication use, and whether the user had been told a BP goal by a clinician), perceived BP status (e.g., “How would you describe your blood pressure?” with response options such as low/normal/borderline/high/don’t know), and knowledge of targets (e.g., free-text entries for “What is your BP goal?” and “What should your BP numbers be?”). Self-management behavior and perceptions were assessed with items such as “How often do you [monitor/check] your blood pressure?” (Likert-type options from never to always) and “How concerned are you about your blood pressure?” (from not at all to very concerned). Additional cardiovascular risk items included yes/no questions regarding related conditions and management (e.g., “Have you been diagnosed with high blood cholesterol?” “Do you currently take cholesterol medication?” and frequency of lipid monitoring), with follow-up items when applicable.
App engagement outcomes included counts of registered users, the proportion of registrants who used tracking features, and distributions of user-entered health metrics captured through app data fields (e.g., blood pressure readings, weight, heart rate, activity duration, and medication schedule entries).
Data Management, Security, and Cleaning
Data collected through the app were stored electronically in secure, access-restricted systems. Identifying information was not collected (e.g., names, addresses), and users were assigned a unique study identifier to support de-identification. Data exports for analysis were stored in encrypted, access-controlled institutional systems. Questionnaire submissions flagged as spam were excluded prior to analysis. Because some questionnaire items were optional, item-level denominators are reported for each variable.
Statistical Analysis
Analyses were descriptive and focused on feasibility, user perceptions, and user-entered health data. Questionnaire responses were summarized using counts and percentages; completion time was summarized using the median and interquartile range (IQR) due to skewness. App engagement was summarized as the number of unique registrants and the proportion of registrants who entered at least one health metric or medication schedule, as well as the proportion entering each metric type (e.g., BP, weight, heart rate, activity, medications). User-entered continuous measures (e.g., weight, BMI) were summarized using means and standard deviations (SDs). Blood pressure entries were summarized using the number of readings and contributing users, mean systolic and diastolic BP (SD), and the proportion of readings below common thresholds (<140/90 mm Hg and <130/80 mm Hg). All analyses were conducted using IBM SPSS Statistics (IBM Corp., Armonk, NY, USA).
3. Results
3.1. Intake Survey
A total of 727 user profiles were available for analysis. The mean age (calculated as 2020 minus birth year) was 55.6 years (SD 14.2), with a median of 57 (IQR 47–66; range 9–87). Hypertension diagnosis year was available for 501/727 (68.9%) users (median 2009, IQR 1998–2017) (
Table 1).
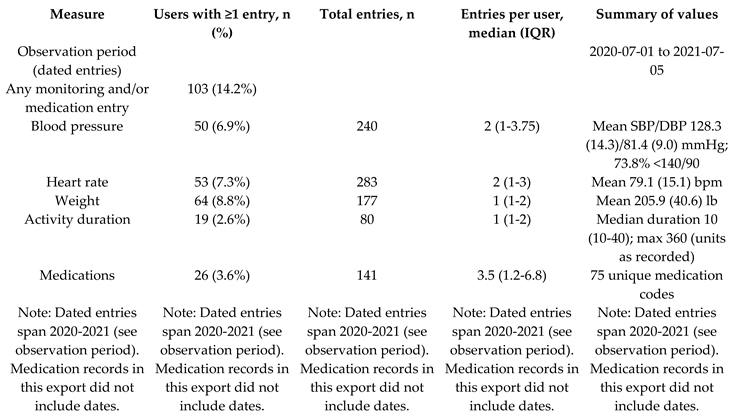
Across the observation window (July 2020–July 2021), 103/727 (14.2%) users entered at least one health-monitoring value and/or medication record. In total, users logged 780 health-monitoring entries (blood pressure, heart rate, weight, and activity) and 141 medication entries. Blood pressure was recorded by 50/727 (6.9%) users (240 readings; median 2 readings/user, IQR 1–3.8) (
Table 2).
3.1.1. Cholesterol and Hypertension Self-Report Items
Key cardiovascular risk-related findings are summarized in
Table 3. Approximately half of respondents reported a diagnosis of high blood cholesterol, and 41.7% reported that they were currently taking cholesterol medication. Most respondents reported diagnosed hypertension, over half reported taking BP medication for more than two years, and 52.3% reported they had not been told a BP goal by a clinician (
Table 3).
3.1.2. Blood Pressure Target Knowledge
Among participants who entered BP targets, the median BP goal and the median “should be” BP were both 120/80 mm Hg, and 120/80 mm Hg was the most frequently reported “should be” value (
Table 4).
3.2. App Engagement and User-Entered Health Metrics
Note. Percentages are calculated using registered users (N=761) as the denominator.
4. Discussion
In this analysis of the HYPE mobile application, we observed that the platform successfully combined hypertension education, lifestyle-focused resources, and self-monitoring tools within a single interface; however, patient-entered tracking activity was relatively limited. Although several hundred users created profiles and provided demographic information, only a smaller subset entered health-monitoring values and/or medication data, and among those who did, the median number of entries per user was low. These findings suggest that, while initial adoption (account creation) can be achieved, sustaining engagement with ongoing self-monitoring remains a central challenge for app-based hypertension self-management.
Our results align with prior mHealth hypertension research showing that digital tools can support self-management behaviors (e.g., home blood pressure monitoring, medication adherence support, and lifestyle education), yet real-world engagement often declines over time and may be highly variable across users. In many studies, improvements in blood pressure outcomes are most consistently observed when apps are paired with additional implementation supports—such as clinician feedback, care management, structured reminders, or integration into routine clinical workflows, rather than relying on self-directed app use alone. The relatively low frequency of patient-entered readings in our dataset is consistent with this broader literature and underscores the likelihood that apps function best as one component of a multi-level intervention, rather than as a stand-alone solution.
Importantly, the self-monitoring values that were entered (blood pressure, heart rate, weight, activity) demonstrate that the app can capture clinically relevant data and present it in user-friendly formats (dashboard summaries and longitudinal trends). However, because the dataset reflects voluntary, patient-entered measurements, the tracked values likely represent a more engaged subgroup and should not be interpreted as population-level clinical outcomes. This distinction is critical when interpreting descriptive metrics (e.g., the proportion of readings below a threshold), as entry patterns may reflect selection effects (users who are already motivated or better controlled are more likely to record data). Knowledge gaps likely contributed to limited engagement with self-monitoring; notably, 52.3% of participants reported they had not been told a blood pressure goal by a clinician. Without a clear target, patients may be less likely to recognize the value of routine home monitoring or to interpret readings in a way that supports behavior change and treatment adherence.”
From a broader implementation perspective, these results highlight several plausible explanations for limited sustained use: competing demands, variable digital literacy, technology access, usability friction, and limited perceived benefit without feedback loops. The Phase 3 design plans (e.g., making “Today” the default landing page, adding prompts for low engagement, and offering an instructional video) are consistent with behavior-change and implementation principles that emphasize reducing user burden, increasing cues to action, and strengthening perceived utility. In other words, the pattern observed in Year 1–2 data supports the hypothesis that workflow-centered design refinements and engagement strategies may be necessary to increase meaningful longitudinal use.
This study has limitations. First, these data are observational and descriptive, with no comparison condition; therefore, we cannot attribute any clinical change to app use. Second, demographic variables are self-reported and may be missing or misclassified. Third, depending on the export structure, some engagement metrics may be constrained by missing identifiers or timestamps, limiting the ability to quantify users’ longitudinal engagement trajectories or to link entries to individuals over time. Finally, patient-entered health measures are not equivalent to clinically validated outcomes captured in the electronic health record.
Future research should evaluate HYPE using designs that can assess both effectiveness and implementation, such as a pragmatic trial or hybrid effectiveness–implementation approach. Priorities include: (1) determining which combinations of supports (automated reminders, coaching, care-manager outreach, clinician messaging, or EHR integration) most effectively increase sustained engagement; (2) assessing usability, barriers, and facilitators through qualitative interviews and structured user feedback; (3) examining equity-related determinants of engagement (connectivity, device access, digital literacy) and tailoring strategies accordingly; and (4) linking app engagement to clinically meaningful outcomes (blood pressure control, medication adherence, and lifestyle behaviors) using objective measures when feasible. Collectively, these directions would clarify whether HYPE’s educational and tracking functions can translate into durable self-management behaviors and improved hypertension outcomes when embedded within a supportive care model.
5. Conclusions
In this descriptive analysis of the HYPE mobile app, we found that the platform offers an integrated set of features—education, lifestyle resources, and tools for entering and viewing health-monitoring and medication information, but that sustained, patient-entered tracking activity was limited to a smaller subset of users. Among those who used the tracking functions, the app successfully captured blood pressure and other monitoring data and displayed trends in a way that could support self-management. Taken together, these findings suggest that app availability alone may be insufficient to drive ongoing engagement, and that pairing HYPE with workflow supports (e.g., reminders, onboarding reinforcement, and care-team feedback) may be necessary to increase consistent use. Future work should evaluate strategies to improve engagement and determine whether higher-intensity implementation approaches translate into improved hypertension self-management behaviors and clinically meaningful outcomes.
Funding
This research was funded by the Alabama Department of Public Health (federal pass-through from the Centers for Disease Control and Prevention (CDC)), Sponsor’s # C20115191 and GC-22-281 (Project # A22-0459; Fund 28978).
Institutional Review Board Statement
The study was conducted in accordance with the Declaration of Helsinki and approved by the Institutional Review Board (or Ethics Committee) of The University of Alabama .Protocol code 19-OR-142-ME-R2; April 1, 2021.
Informed Consent Statement
Informed consent was obtained from all subjects involved in the study.
Data Availability Statement
Acknowledgments
The author gratefully acknowledges the contributions of project team members who supported study activities (e.g., planning, implementation, and technical support). These individuals did not participate in drafting or revising the manuscript and therefore do not meet ICMJE authorship criteria. The author also acknowledges Dr. Matt Gilbert for consenting to appear in photographs featured within the mobile app. In addition, the author recognizes the University of Alabama Center for Advanced Public Safety team for technical and administrative support related to HYPE mobile application development and maintenance, as well as institutional support from the Institute for Rural Health Research.
Conflicts of Interest
The authors declare no conflicts of interest. The funders had no role in the design of the study; in the collection, analyses, or interpretation of data; in the writing of the manuscript; or in the decision to publish the results.
Guidelines and Standards Statement
This manuscript was drafted against the STROBE (Strengthening the Reporting of Observational Studies in Epidemiology) guidelines for reporting observational research.
Use of Artificial Intelligence
During the preparation of this manuscript, the author(s) used ChatGPT (OpenAI) for language editing and grammar and for drafting/revising sections of text based on author-provided results and outlines. The author(s) reviewed and edited all AI-assisted content and take full responsibility for the content of this publication. During the preparation of this manuscript, the author(s) used ChatGPT (OpenAI) for language editing and drafting assistance; the author(s) reviewed and edited the output and take full responsibility for the content of this publication.
References
- Fryar, C.D.; Kit, B.; Carroll, M.D.; Afful, J. Hypertension Prevalence, Awareness, Treatment, and Control Among Adults Age 18 and Older: United States, August 2021-August 2023; 2024. [Google Scholar]
- Dwairej, L.; Ahmad, M. Hypertension and mobile application for self-care, self-efficacy and related knowledge. Heal. Educ. Res. 2022, 37, 199–212. [Google Scholar] [CrossRef] [PubMed]
- Liu, F.; Song, T.; Yu, P.; Deng, N.; Guan, Y.; Yang, Y.; Ma, Y. Efficacy of an mHealth App to Support Patients’ Self-Management of Hypertension: Randomized Controlled Trial. J. Med Internet Res. 2023, 25, e43809. [Google Scholar] [CrossRef] [PubMed]
- Gong, K.; Yan, Y.-L.; Li, Y.; Du, J.; Wang, J.; Han, Y.; Zou, Y.; Zou, X.-Y.; Huang, H.; She, Q. Mobile health applications for the management of primary hypertension. Medicine 2020, 99, e19715. [Google Scholar] [CrossRef] [PubMed]
- Alessa, T.; Hawley, M.S.; Hock, E.S.; de Witte, L. Smartphone Apps to Support Self-Management of Hypertension: Review and Content Analysis. JMIR mHealth uHealth 2019, 7, e13645. [Google Scholar] [CrossRef] [PubMed]
- Dean, S.C.; Kerry, S.M.; Cappuccio, F.P.; Oakeshott, P. Pilot study of potential barriers to blood pressure control in patients with inadequately controlled hypertension. Fam. Pr. 2007, 24, 259–262. [Google Scholar] [CrossRef] [PubMed]
- Lichtman, J.H.; Amatruda, J.; Yaari, S.; Cheng, S.; Smith, G.L.; A Mattera, J.; A Roumanis, S.; Wang, Y.; Radford, M.J.; Krumholz, H.M. Clinical trial of an educational intervention to achieve recommended cholesterol levels in patients with coronary artery disease. Am. Hear. J. 2004, 147, 522–528. [Google Scholar] [CrossRef] [PubMed]
- Ebrahem, S.M.; El Gahsh, N.F.; Abd-Elalem, S.M. The effectiveness of the nursing intervention on cholesterol level and quality of life among hypertensive patients with dyslipidemia. Clin. Nurs. Stud. 2017, 5, 32. [Google Scholar] [CrossRef]
|
Disclaimer/Publisher’s Note: The statements, opinions and data contained in all publications are solely those of the individual author(s) and contributor(s) and not of MDPI and/or the editor(s). MDPI and/or the editor(s) disclaim responsibility for any injury to people or property resulting from any ideas, methods, instructions or products referred to in the content. |