
Submitted:
06 January 2026
Posted:
07 January 2026
You are already at the latest version
Abstract
Cyber Security is an essential element for responding to serious threats posed by digital 2
technology. The Common Vulnerability Scoring System (CVSS) is a key indicator for eval- 3
uating software security risks. However, CVSS results—expressed as numerical scores 4
or vector strings—are difficult for general users and managers to intuitively understand 5
and judge. This complexity hinders effective risk management. This study aimed to im- 6
prove the usability and satisfaction of a cybersecurity assessment simulator by designing a 7
user-friendly UI/UX. The design proposal focused on three core principles for intuitive 8
understanding of detailed CVSS V4.0 indicator values: Firstly, data Visualization: Using a 9
clear color scheme (red/yellow/green) to distinguish risk levels at a glance. Tooltips were 10
implemented to provide detailed information on hover. secondly, clear Information Hier- 11
archy: The CVSS V4.0 groups (Base, Threat, Environment, Supplemental) were arranged 12
logically, with the Basic Group at the top center for visibility. Supplemental information 13
was provided using a drill-down approach. lastly, Interactivity and Accessibility: Features 14
like data filtering/sorting and a responsive UI were included. Accessibility was addressed 15
by providing patterns and text labels alongside colors for color vision deficiency. The 16
proposed dashboard-type UI/UX was implemented as a web service and tested against the 17
existing CVSS V4.0 calculator. Experiments showed a significant improvement in usability, 18
design satisfaction (e.g., visual satisfaction 8.9 points, readability 9.0 points), and overall 19
UI/UX satisfaction (83%) compared to the existing system. No significant difference was 20
found in items evaluating interaction or certain usability metrics. This was attributed to 21
the system being primarily information-providing rather than a two-way interactive tool. 22
The study successfully designed a visualized UI/UX for the CVSS V4.0 simulator, making 23
risk assessment results more accessible. Future work will focus on improving the system 24
structure to enable two-way interaction and enhance overall usability metrics.
Keywords:
cyber security
; CVSS
; user interface
; user experience
; design principle
; data security
1. Introduction
The transition to the Fourth Industrial Revolution and the explosive development of digital technology have fundamentally reshaped society, making software security a paramount concern [1]. While this digital transformation offers limitless opportunities, it simultaneously introduces sophisticated cyber threats, often leveraging AI and automation, which become the root cause of exponentially increasing risks [2]. Consequently, cybersecurity is no longer seen as merely an IT problem; it is recognized as an essential component for safeguarding individual lives, corporate growth, and national sustainability [3]. To proactively counter these continuously evolving threats, establishing a robust security system capable of accurate and efficient vulnerability assessment and rapid response is essential. The Common Vulnerability Scoring System (CVSS), supported by the National Institute of Standards and Technology (NIST), is widely used as the international standard metric for objectively evaluating the risk of these security vulnerabilities.
CVSS quantifies the exploitability and impact of vulnerabilities, serving as a fundamental index for security risk assessment. However, conventional CVSS-based security assessment systems have historically provided results primarily in the form of vector strings or simple numerical scores. This presentation format makes it difficult for general users or non-expert managers to intuitively understand the actual risk level and the contributing factors of the CVSS metrics[4]. As a result, the increased time and effort required to interpret complex numerical data often create a bottleneck, causing security teams to miss the golden time for making quick decisions and responding to vulnerabilities [5]. Therefore, there is a critical need for a user-centric interface design that utilizes the detailed metrics of CVSS V4.0 while enabling users to perceive risk instantly without requiring additional interpretation.
The primary goal of this study is to create a user-friendly UI/UX for a CVSS V4.0-based cybersecurity assessment simulator. We aim to achieve this by designing an interface that allows users to immediately grasp the security risk level, thereby improving overall usability and user satisfaction. To accomplish this, we sought to: propose a design that clearly illustrates the complex CVSS V4.0 metrics through data visualization; design a dashboard layout with a clear information hierarchy so users can quickly understand assessment results and locate necessary details; and implement interactive elements, such as color schemes, tooltips, and filtering functions, to increase system utilization.
This paper details the entire process undertaken to design and validate the user-friendly UI/UX for the CVSS V4.0-based simulator. First, the Backgrounds and Related Works section provides an in-depth analysis of the evolving cybersecurity landscape, the structure of CVSS V4.0, and recent research trends in data visualization and security dashboard design. Following this, the System Design and UI/UX Principles section presents specific design principles, including a risk color scheme (red/yellow/green) for intuitive risk recognition, a drill-down hierarchical structure for improved information access, and accessibility measures considering responsive web design. Finally, the Implementation and Experimentation sections describe the system’s actual implementation, followed by an analysis of the experimental results, where the proposed design’s validity is verified against the existing CVSS V4.0 calculator system.
The key contributions of our research are as follows. We presented an effective UI/UX solution that translates the complex CVSS V4.0 metrics into a visualized dashboard, enabling users to intuitively determine the security risk level. Experimental results confirmed that our system significantly improved design satisfaction, readability, and overall system satisfaction (83%) compared to the existing system. Furthermore, by incorporating design elements for accessibility and utilizing responsive web design, our system successfully enhanced the accessibility of security assessment results and established a foundation for increasing their practical utilization.
he outcomes of this research are expected to bring about positive effects across various fields. Practically, both security experts and non-technical management can understand CVSS results more easily and quickly, which will increase the efficiency and speed of vulnerability response and prioritization processes. Academically, our methodology for designing and validating a user-centric interface for complex cybersecurity risk metrics will serve as a valuable reference for the future development of diverse security assessment tools and risk management dashboards. Ultimately, the user-friendly UI/UX will enhance the market competitiveness of security assessment simulator products and contribute to the wider adoption and popularization of security systems.
This paper is structured into the following five chapters: Chapter 1: Introduction introduces the necessity and objectives of the research, along with its key contents and expected effects. Chapter 2: Backgrounds and Related Works analyzes the CVSS V4.0 metrics and current research trends related to security system UI/UX, establishing the theoretical basis for this study. Chapter 3: UI/UX Design of the Cybersecurity Assessment Simulator presents the proposed system architecture and specific UI/UX design principles focusing on data visualization and information hierarchy. Chapter 4: Experimentation and Verification describes the user-based comparative experiment method and verifies the validity of the proposed design through the analysis of the experimental results. Chapter 5: Conclusion summarizes the research findings, highlights the contributions, and suggests directions for future research and improvements.
2. Backgrounds and Related Works
2.1. Backgrounds
The increasing integration of digital technology across all sectors in the era of the Fourth Industrial Revolution has propelled software security to a critical position, defining both national competitiveness and social stability [6]. However, this digital expansion is met by increasingly sophisticated threats leveraging AI and automation, leading to a geometric rise in the complexity and scale of cyber attacks [7]. This dynamic threat landscape necessitates a shift from passive defense mechanisms to a proactive, user-centric risk assessment framework [8]. The foundational system for managing security vulnerabilities globally is CVE (Common Vulnerabilities and Exposures), operated by MITRE [9]. CVE assigns unique identifiers to known vulnerabilities, facilitating standardized information sharing. Complementing CVE is the CVSS (Common Vulnerability Scoring System), an open framework designed to objectively evaluate the severity and risk associated with these vulnerabilities. CVSS calculates a numerical score based on the potential impact (Confidentiality, Integrity, Availability) and exploitability factors (Access Path, Complexity) [10]. This score is crucial for security personnel when prioritizing vulnerability patching and response efforts [11]. The comprehensive guide for establishing these security systems is often rooted in the Risk Management Framework (RMF) outlined in NIST Special Publication 800-37 R1, which provides structured procedures for assessing and managing information system risks.
Cyber security refers to technologies, processes, and policies that protect networks, systems, data, devices, and information assets from cyber attacks, illegal access, damage, theft, and other threats. It aims to safely manage digital assets of individuals, organizations, and governments, defend against threats, and respond quickly when security incidents occur. CVE (Common Vulnerabilities and Exposures), which provides a standardized system for identifying, sharing, and managing security vulnerabilities, is a system that assigns unique identification numbers to security vulnerabilities, and an open framework called CVSS (Common Vulnerability Scoring System) is used to convey the characteristics, impact, and risk factors of CVE. CVSS is a system that evaluates the risk of cyber security vulnerabilities. It is one of the elements of CVE (Common Vulnerabilities and Exposures), a security vulnerability management system of MITRE supported by the National Institute of Standards and Technology (NIST) in the United States, and is used as an indicator to evaluate software security vulnerabilities by reflecting confidentiality, integrity, availability, access path and complexity of vulnerabilities, and authentication status. CVSS was created in 2005 by the U.S. National Infrastructure Advisory Board (NIAP) for the purpose of establishing a severity standard for software vulnerabilities. CVSS V2 was released in 2007, but limitations such as insufficient detail and vague guidelines were discovered, so CVSS V3.0 was released in 2015 to supplement these, and CVSS V4.0, which was released in 2023, is currently being used to improve the limitations of CVSS V3.1 and increase the accuracy and usability of vulnerability assessment.
CVSS V4.0 features enhanced precision and situational evaluation capabilities due to the addition of new metrics and groups. Its applicability has been expanded through modifications based on various environments and requirements. Furthermore, it assists security teams in setting response priorities and allocating resources. CVSS V4.0 is composed of four metric groups: Base, Threat, Environmental, and Supplemental. The Base Metric Group reflects the severity of a vulnerability based on its inherent characteristics, which are constant over time, and assumes a reasonable worst-case impact across various deployment environments. The Threat Metric Group adjusts the severity of a vulnerability based on factors such as the availability of Proof-of-Concept (POC) code or active exploitation. The Environmental Metric Group refines the severity score by considering factors such as the presence of mitigations specific to a particular computing environment and the importance attributes of the vulnerable system. Lastly, the Supplemental Metric Group explains and measures additional external attributes of the vulnerability.
2.2. CVSS 4.0 Index
Since its inception in 2005, CVSS has undergone several revisions to enhance assessment accuracy. CVSS V4.0 (released in 2023) is the latest version, specifically addressing limitations found in V3.1 and aiming for maximum usability and precision in vulnerability assessment. The V4.0 framework is segmented into four distinct metric groups as shown in Figure 1, allowing for highly granular risk analysis:
- Base Metric Group: This is divided into Exploitability Metrics (e.g., Attack Vector, Attack Complexity, Privileges Required), which assess the conditions necessary for a successful exploit, and Impact Metrics (e.g., Vulnerable System Confidentiality, Subsequent System Availability), which evaluate the consequences on both the immediate and downstream systems.
- Threat Metric Group: This group incorporates factors like Exploit Maturity to reflect the current, real-world level of threat posed by the vulnerability.
- Environmental Metric Group: This allows analysts to customize the assessment based on their organization’s specific security controls and the criticality of the affected IT assets.
- Supplemental Metric Group: This provides ancillary information relevant to incident response planning, such as Automatable or Recovery capabilities.
2.2.1. Base Index
The Exploitability metrics reflect the characteristics of a "vulnerable" system. Each should be evaluated in relation to the vulnerable system and reflect the attributes of the vulnerability that lead to a successful attack. It is assumed that the attacker has advanced knowledge of the target system, including typical configurations and inherent defense mechanisms (e.g., built-in firewalls, rate limiting, traffic policing). For instance, exploiting a repeatable and successful vulnerability is considered a low value for Attack Complexity, regardless of the attacker’s knowledge or capabilities. Target-specific attack mitigations (e.g., custom firewall filters, access lists) are instead reflected in the Environmental Metric Group score.
The Impact metrics assess the effect of a successfully exploited vulnerability , and the analyst limits the assessment to the reasonable, ultimate outcome that the attacker could achieve. When assessing the Impact metrics of a vulnerability, only consider access, privilege escalation, or other negative outcomes that result from a successful exploit.
2.2.2. Threat Index
The Threat metrics measure the likelihood that a vulnerability will be attacked, and they are based on the current state of exploitation technology and the availability of exploit code. The public availability of easy-to-use exploit code or instructions increases the number of potential attackers, including those with less skill. Initially, the actual exploitation might be theoretical. Proof-of-concept exploit code, functional exploit code, or sufficient technical details required to exploit the vulnerability may be publicly disclosed. Furthermore, available exploit code or instructions can range from a proof-of-concept demonstration to exploit code that continuously attacks the vulnerability. In severe cases, it can be provided as a network-based worm or virus, or other automated attack tool.
2.2.3. Environmental Index
The Environmental metrics allow the consumer analyst to assess the importance of the affected IT assets to the user organization, as measured in terms of complementary/alternative security controls, confidentiality, integrity, and availability. In the absence of explicit values, these metrics are set to the default value of "Not Defined (X)"—which is equivalent to the "High (H)" metric value—following the concept of assuming a "reasonable worst case".
Through Modified Base metrics, the consumer analyst can redefine individual Base metric values according to the specific characteristics of the user environment. Characteristics that impact exploitability or impact can be reflected through appropriately modified Environmental metric values. For example, if the provider sets "Privileges Required" in the Base metric to "Low (PR:L)" and the analyst redefines "Modified Privileges Required" to "High (MPR:H)," the resulting score is calculated as if the Base metric’s "Privileges Required" were set to "High (PR:H)".
2.2.4. Supplemental Metrics
The Supplemental Metric Group provides new metrics that describe and measure additional external attributes of a vulnerability. The assessment of Supplemental metrics is provided by the vendor, while the usage and response plan for each metric within the Supplemental Metric Group are determined by the consumer. This allows the metrics to be used differently in each consumer’s environment, and none of the metrics in the Supplemental Metric Group affect the final calculated CVSS score.
2.3. Contribution and Limitation
While CVSS provides objective numerical results and qualitative severity scales, these raw metrics often fail to provide intuitive understanding [9] or facilitate rapid decision-making for non-technical managers. This gap has driven significant research in data visualization for cybe rsecurity products [6].
Recent studies emphasize the importance of presenting complex data in a simple, visual format to reduce cognitive load. Park and Kim [12] demonstrated that visualizing CVSS scores using heatmaps or radial charts significantly enhances the ability to intuitively compare risks between different vulnerabilities [15]. Furthermore, Non-experts could quickly grasp attack progress by using color coding, patterns, and animation to visualize real-time threat data [19]. These findings reinforce that the core elements of a user-friendly UI/UX—consistency, intuitive navigation, simplicity/clarity, and accessibility are crucial for effective security assessment tools.
To meet modern standards, security systems must also adhere to strict accessibility requirements. Jung and Ahn highlighted that providing additional cues like patterns and text labels alongside colors is essential for users with color vision deficiency, improving overall usability. [24] further argued that design consistency dramatically lowers the learning curve and reduces operational errors in complex security applications.
This research addresses the lack of intuitive understanding inherent in traditional CVSS reporting by proposing and implementing a user-friendly, dashboard-type UI/UX specifically tailored for CVSS V4.0. Our design focused on data visualization, establishing a clear information hierarchy, and enabling interactivity to allow users to grasp detailed metric values at a glance [10]. Experimental results confirm that the proposed system significantly improved usability, design satisfaction, and overall system satisfaction (83%) compared to the existing calculator. This contributes practically by translating complex security data into an easily digestible visual format, enhancing risk awareness and response efficiency.
Despite the improvements, the experimental validation revealed two main limitations: no significant difference was observed in items evaluating interaction or specific metrics of usability compared to the existing system. The lack of interaction improvement is attributed to the system’s current structure, which is information-providing rather than a true two-way interactive tool. Furthermore, limited improvement in certain usability scores suggests the initial design focused primarily on intuitively viewing text-based information. Therefore, future work will concentrate on redesigning the system architecture to support bidirectional interaction (e.g., real-time configuration changes impacting the score) and supplementing the UI to better enhance overall usability metrics.
3. UI/UX for Cyber Security Assessment Simulator
3.1. Overall System Organization and Structure
The system proposed in this study was implemented as a web service that receives CVSS V4.0 metric results, evaluates security vulnerabilities, and presents the outcomes via a user-friendly dashboard interface. The system was specifically designed to be accessible from any location and to support diverse device environments.
3.1.1. System Architecture
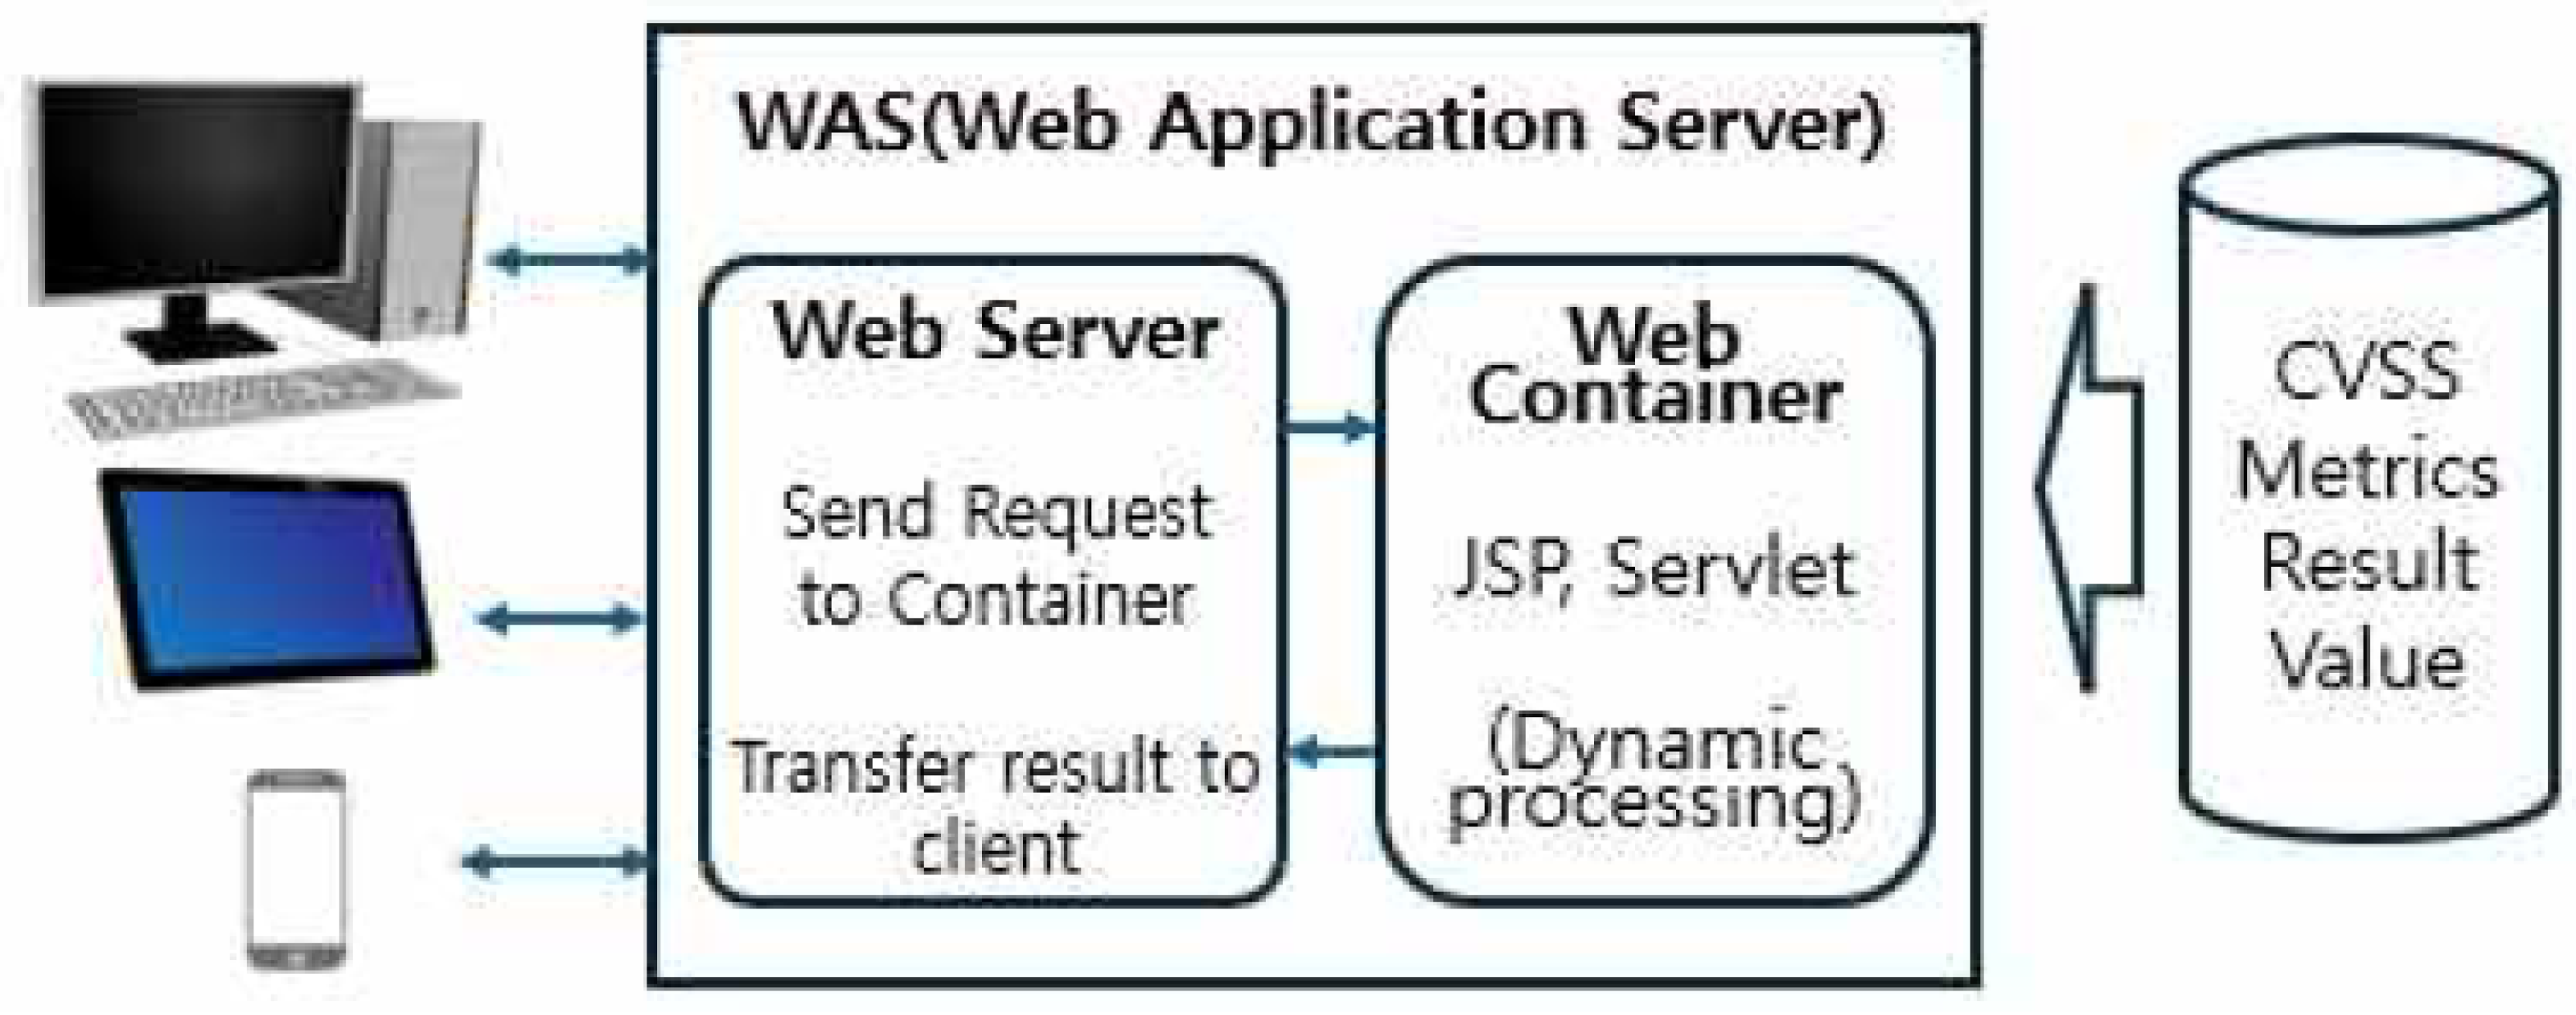
To ensure efficient operation and scalability, the system adopted a standard Web Application Server (WAS) architecture [108]. This architecture is logically structured into three main tiers:
- Client Tier: This is the domain where end-users interact with the system via web browsers on various devices, including PCs, tablets, and mobile phones. This tier implements a Responsive UI to provide a consistent visual experience and easy accessibility, regardless of the connecting device’s screen size or type.
- WAS Tier: This tier is responsible for handling the core logic of the web service and is divided into the Web Server and the Web Container. Web Server component initially receives HTTP requests from the client. It directly processes requests for static content (e.g., HTML, CSS, JavaScript) but forwards requests requiring dynamic processing (e.g., CVSS score calculation requests) to the Web Container. Web Container is the core component that executes dynamic processing logic, such as CVSS score calculation, database queries, and business logic, typically using technologies like JSP and Servlets [114,118]. The processed final data is then sent back to the client via the Web Server [117].
- Data Tier: This tier comprises the database area responsible for persistently storing and managing crucial data, including individual CVSS V4.0 metric values (Metrics Result Value), detailed vulnerability information, and the criteria for final score and severity classification. This tier is closely integrated with the WAS tier to provide the necessary raw data and calculation results for the assessment process.
Figure 2.
Control system configuration diagram.
3.1.2. CVSS V4.0 Calculator and Input Interface
The system includes a dedicated CVSS V4.0 Calculator interface designed to facilitate the calculation of vulnerability risk. This interface serves as the primary pathway through which users input the specific characteristics of the vulnerability into the system.
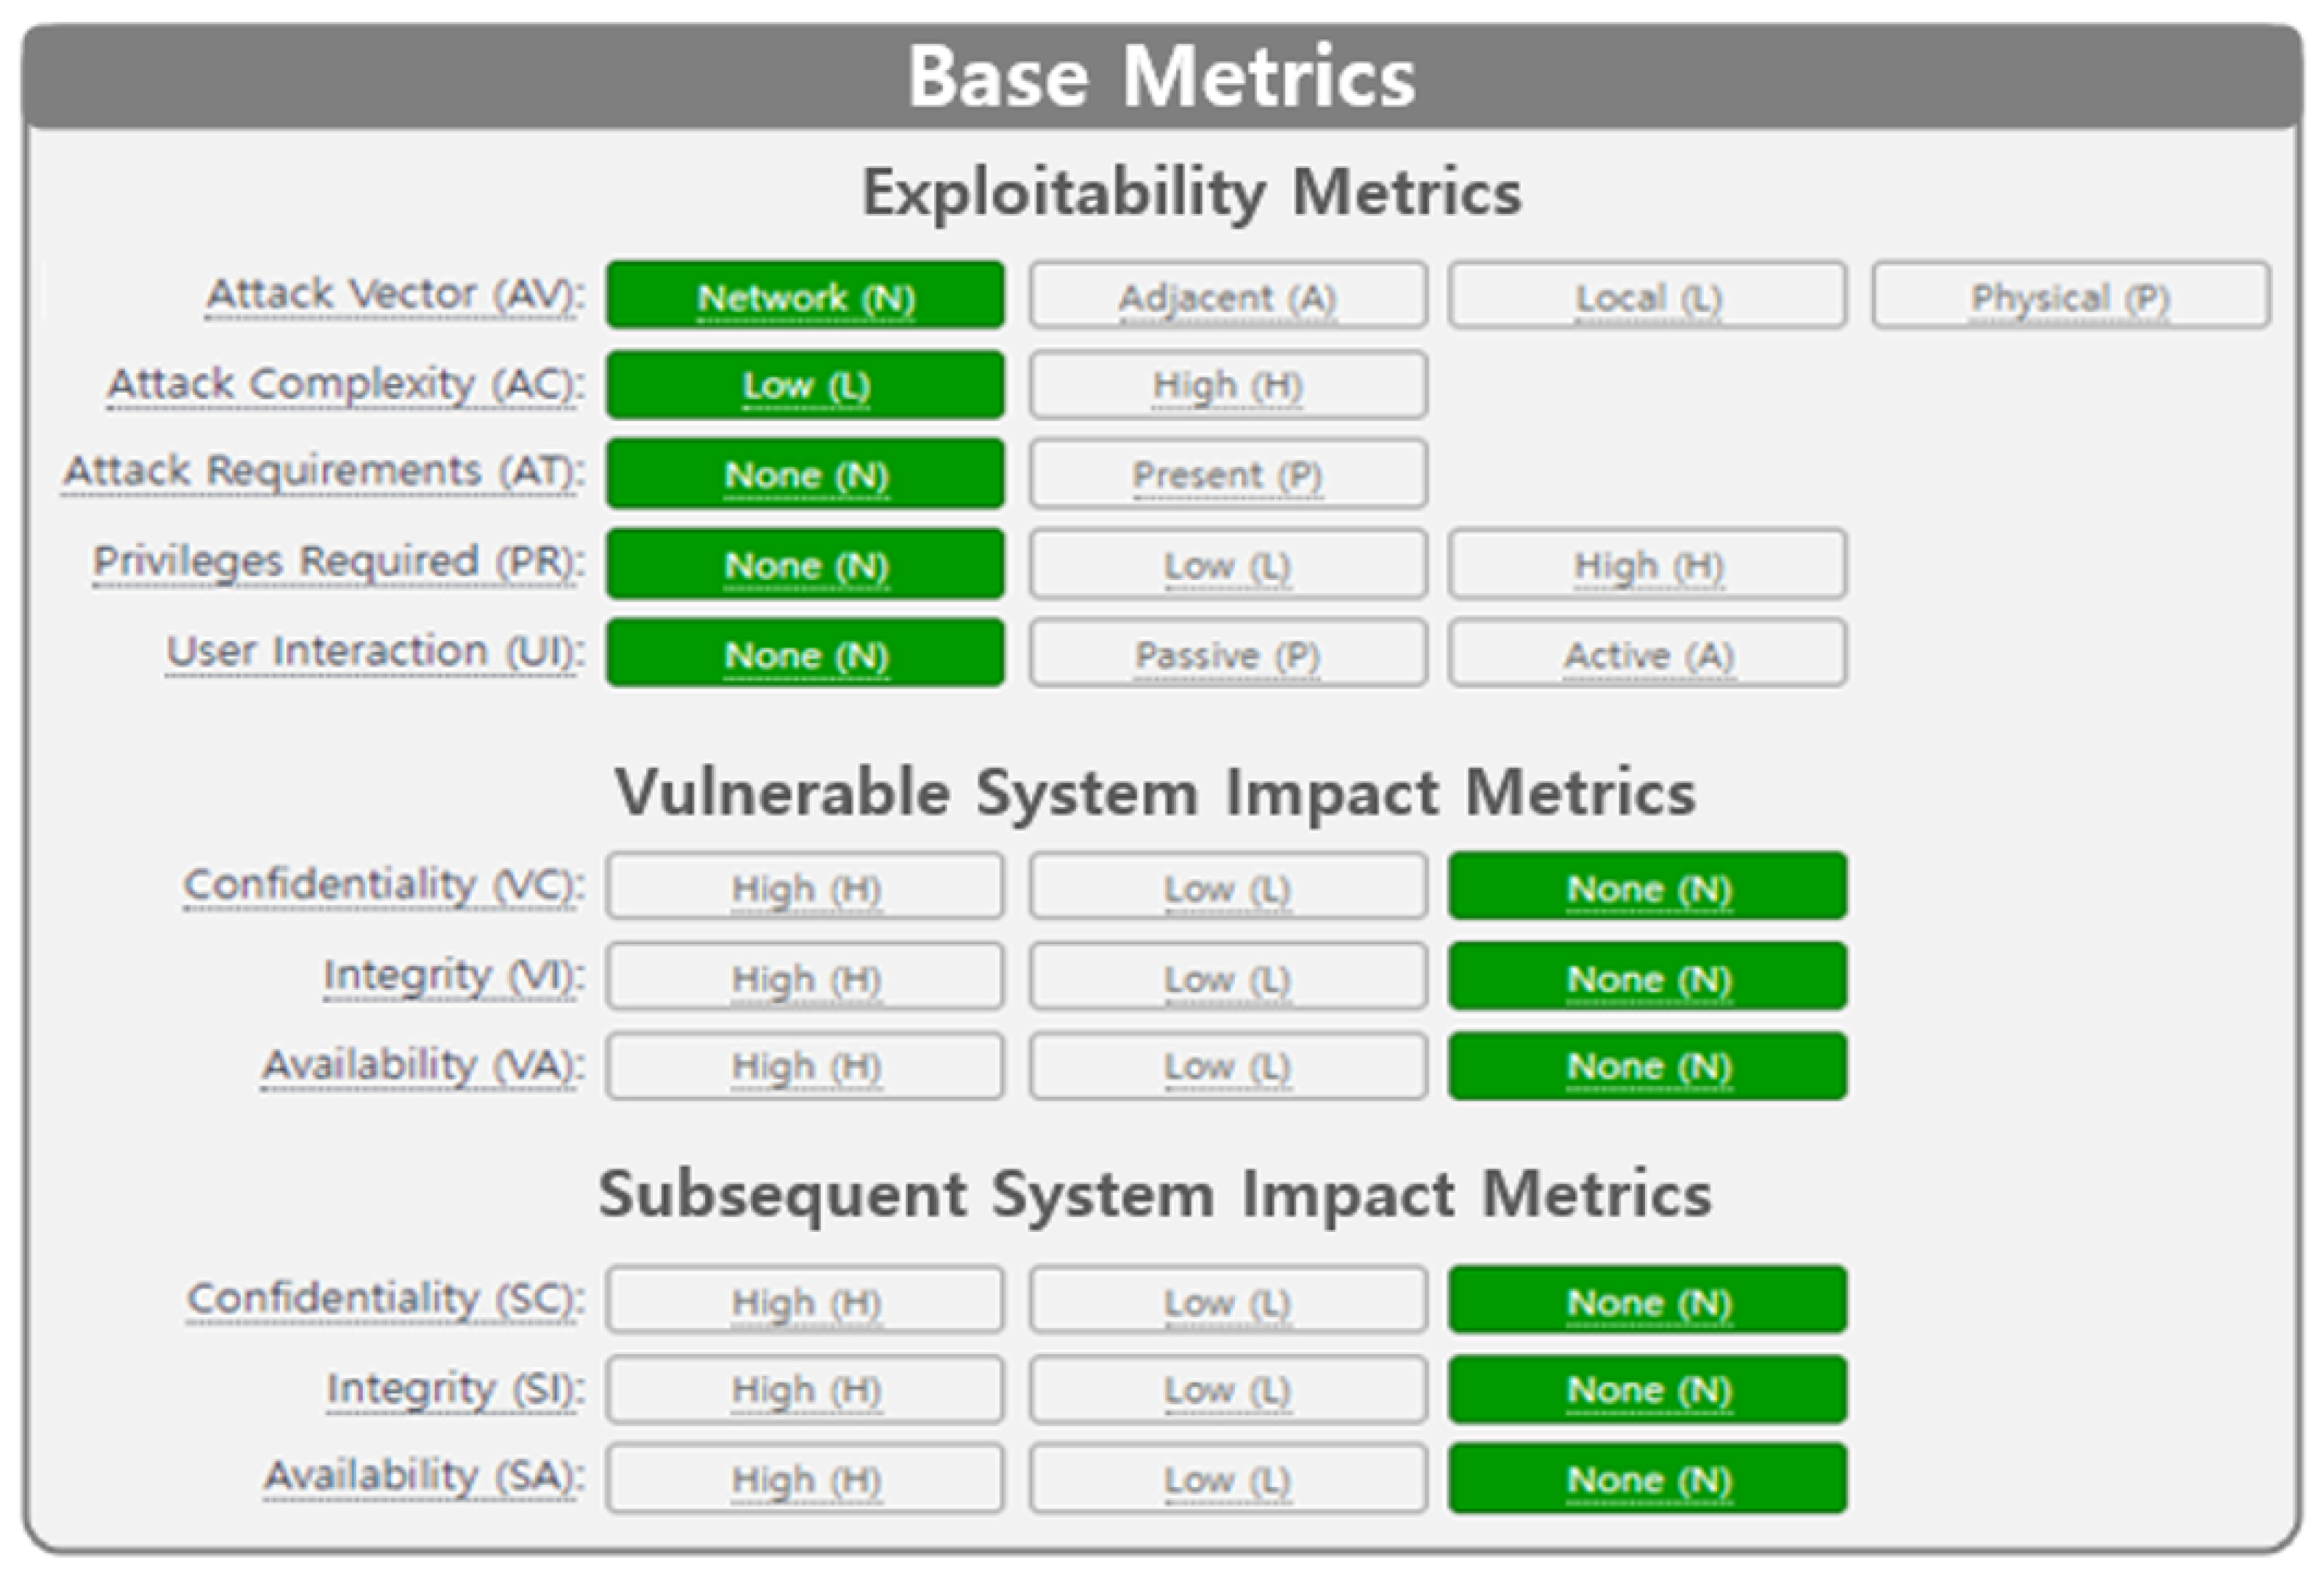
CVSS V4.0 consists of four groups: Base, Threat, Environment, and Supplement and each group is defined as shown in Figure 3. CVSS V4.0 vector string is a textual representation of the CVSS metric set and is used to record or transmit CVSS metric information in a concise, system-readable format.
The CVSS v4.0 vector string is a textual representation of the CVSS metric set, designed to record or transmit metric information in a concise and machine-readable format. It begins with the label “CVSS:” followed by the numeric version “4.0.” The subsequent metric information is expressed as a set of metric values, each separated by a slash (“/”) delimiter. For example, "CVSS:4.0/AV:N/AC:L/AT:N/PR:H/UI:N/VC:L/VI:L/VA:N/SC:N/SI:N/SA:N" can be displayed as the text-form and numerical score value "CVSS V4.0 Score: 5.1/Medium" by the CVSS V4.0 calculator.
3.2. User-Friendly UI/UX Design Principles
The design principles established aim to resolve the non-intuitive nature of conventional CVSS results and maximize the user’s instinctive risk perception. These principles focus on minimizing the cognitive load required for users to interpret complex scores and text.
3.2.1. Data Visualization and Risk Perception Scheme
The core objective is to ensure users can visually recognize the risk level instantly without needing to interpret scores or text. A clear color scheme of Red (High), Yellow (Medium), and Green (Low) was applied to distinguish security risk levels, following international convention. This scheme was applied not only to the final score and severity classification but also to the key metric values themselves that determine the risk, allowing users to quickly identify the root cause of the risk at a glance. For discrete metrics like ’Attack Vector’ (e.g., ’Network’, ’Adjacent’, ’Local’, ’Physical’) in the Base Metrics, the background color of the item image instantly changes based on the risk contribution of the selected value. For example, selecting a high-risk value causes the background to turn red, providing a clear visual ON/OFF indication of the metric’s risk level. To accommodate users with color vision deficiency and prevent over-reliance on color alone, additional cues such as patterns, text labels, or changes in line thickness were provided alongside color for risk levels. This ensures all users receive the same level of information and minimizes communication errors.
3.2.2. Information Hierarchy and Layout Optimization
The information hierarchy was carefully designed to allow users to efficiently navigate the complex four metric groups and numerous sub-metrics of CVSS V4.0. Top Placement and Priority (Base Group): The Base Metric Group, which defines the fundamental characteristics of the vulnerability, was placed in the top center of the dashboard. This prioritizes visibility, guiding the user to understand the core attributes of the vulnerability first, thereby increasing analysis efficiency. Decomposition and Drill-Down for Complexity Management: Metrics containing extensive or less frequently checked details, such as the Supplemental Metric Group, were summarized or hidden on the initial dashboard screen. A Drill-Down approach was implemented, where the information only expands when the user clicks a specific section or icon. This strategy prevents clutter from excessive information exposure on a single screen and helps users focus on the essential information needed at the moment.
3.2.3. Enhanced Interactivity
Interactive elements were incorporated to maximize user experience (UX) and system utility by granting users control over the information and access to detailed context. When the mouse pointer hovers over a visual element (icon, graph, or gauge) representing a CVSS metric, a concise and clear tooltip appears, explaining the metric’s meaning and the security interpretation of the currently selected value. This feature helps users quickly understand the metric’s significance without having to consult external documentation. For dashboards displaying lists of multiple vulnerabilities, functions were provided to allow users to filter or sort the data based on risk level (e.g., Critical, High) or CVSS score. This empowers users to rapidly focus their decision-making on high-priority risk groups. A Responsive Web UI was implemented to ensure accessibility to all information in both mobile and desktop environments. This provides users with the flexibility to check and respond to security risk information regardless of their location.
3.3. Design Summary and Expected Effects
The UI/UX proposed in this study focuses on effectively translating the complex and non-intuitive quantitative information of CVSS V4.0 into a Visual Language for the user. Ultimately, this design is expected to minimize the user’s Cognitive Load and contribute to increasing the efficiency and accuracy of decision-making based on security assessment results.
3.3.1. Design Summary
The UI/UX proposed in this research was meticulously crafted with the primary focus of effectively translating the complex, non-intuitive quantitative information of CVSS V4.0 into a clear Visual Language for the user. This strategic approach aims to significantly minimize the user’s Cognitive Load, which is the mental effort required to process information, and thereby enhance the efficiency and accuracy of security-related decision-making. The comprehensive design utilized three core strategies to fundamentally address the perceived lack of intuitiveness in traditional CVSS reporting.
The first strategy involved Visualization for Intuitiveness. To enable users to grasp risk levels instantaneously, a clear color scheme of Red (High), Yellow (Medium), and Green (Low) was applied universally to distinguish security risk levels, moving beyond reliance on complex numbers alone. This color coding was used for the final score and, critically, for the key metric values themselves, allowing users to quickly identify the components driving the high-risk score. Furthermore, visual emphasis was provided through status highlighting; for discrete metrics like ’Attack Vector’, the background color of the item image would instantly change based on the selected value’s risk contribution, presenting the risk status as a clear ON/OFF state. To ensure universal understanding, the design incorporated Accessibility Supplementation by providing patterns and text labels alongside the color coding, thereby ensuring accuracy for users with color vision deficiency and preventing ambiguity in information transmission.
The second core strategy was Information Focus through Hierarchical Structure, designed to manage the complexity inherent in the multiple CVSS V4.0 metric groups. This was achieved by prioritizing the Base Metric Group, which defines the fundamental characteristics of the vulnerability, placing it in the top center of the dashboard. This placement strategically guides the user to concentrate on the essential information first. Complexity management was further refined through the Drill-Down method, where less frequently checked or highly detailed sections, such as the Supplemental Metrics, were initially summarized or hidden, only revealing full details upon user interaction, thereby actively reducing screen clutter.
The third strategy focused on Enhancing Utility through Interactivity to maximize user experience and system functionality. This included applying Tooltips to icons and gauges, instantly providing users with a concise and clear interpretation of the metric and the security meaning of the current value when hovered over. Moreover, for dashboards displaying lists of multiple vulnerabilities, functions were provided for users to filter or sort the data based on risk level or score. This control empowers users to efficiently navigate and focus their attention on the highest priority risk groups, speeding up the decision process.
3.3.2. Expected Effects
This newly designed, dashboard-style UI/UX is anticipated to generate several significant, positive outcomes across practical and academic domains.
Firstly, it will lead to Increased Speed and Accuracy of Decision-Making. By enabling managers and non-experts to instantly judge vulnerability severity through visualized risk levels, time previously spent interpreting dense vector strings and complex scores is eliminated. This supports security response teams in making quick and accurate decisions, substantially boosting the practical effectiveness of the cybersecurity defense process.
Secondly, the user-friendly design will directly contribute to the Improvement in System Utilization and User Satisfaction. The enhanced utility and usability of the assessment system, driven by its intuitive design, will increase user satisfaction, which in turn encourages the sustained, long-term utilization of the assessment platform.
Thirdly, the system is expected to help Narrow the Risk Perception Gap. Since the previous system was often incomprehensible to non-technical personnel due to its reliance on text , the new design provides clear, visual anchors that allow both security experts and laypersons to share a common, accurate understanding of the risk.
Finally, the detailed methodology used for the user-centric visualization and interpretation of CVSS V4.0 metrics establishes a solid foundation for Future Research. The identified limitations, particularly concerning interactivity , will guide subsequent studies toward implementing a bidirectional interaction structure and incorporating further usability enhancements.
4. Experimentation and Verification
4.1. Experimentation Design
The core objective of this research was to objectively prove the effectiveness of the proposed user-friendly UI/UX. To achieve this, a comparative experiment against the existing system was systematically designed.
4.1.1. System and Target Definition
The user-friendly UI/UX proposed in this study was developed to enhance user convenience and usefulness, and it was implemented and used for the experiment in the form of a responsive webpage.
- System A (Comparison Target): System A, used as the basis for comparison, referred to the existing CVSS V4.0 calculator UI/UX. This system was primarily characterized by a text-based interface used to generate vector strings or calculate score conversion values based on input metrics. This system was known to have the problem that it was difficult for managers to intuitively judge risk due to the lack of visual information.
- Proposed System (Experiment Target): The Proposed System, the core target of the experiment, refers to the dashboard-type UI/UX designed and implemented in this paper, focusing on data visualization, clear information hierarchy, and interactivity. This system was designed so that users could intuitively understand the detailed element values of CVSS V4.0.

Table 1.
Survey Items.
| Item | Q# | Question List | Answers | |
|---|---|---|---|---|
| Usability | Q1 | What is a convenient system for finding key features of the UI? | A | B |
| Q2 | What is a system where the menus and navigation are intuitive and easy to understand? | A | B | |
| Q3 | What is a system where interaction elements are clearly separated? | A | B | |
| Usefulness | Q4 | What system provides sufficient and useful information? | A | B |
| Q5 | What system do you think has the features or services that adequately reflect user needs? | A | B | |
| Q6 | What systems do you think contain unnecessary or confusing features? | A | B | |
| Design | Q7 | Is the B system visually appealing? | 1∼10 | |
| Q8 | Are the design elements of System B, such as colors, fonts, and icons, consistent? | 1∼10 | ||
| Q9 | Is the text in System B readable and readable? | 1∼10 | ||
| Satisfaction | Q10 | How satisfied are you overall with System B? | A ∼ B or Scale | |
4.1.2. Experiment Goal and Methodology
The main goal of the experiment was to quantitatively compare whether the UI/UX of the Proposed System showed a significant improvement over System A’s UI/UX in terms of Usability, Usefulness, Design, and User Satisfaction. A survey method was adopted, where participants were presented with the UI/UX of the two systems and asked to compare and evaluate the results. This method allowed for the quantification of participants’ subjective experiences and perceptions. The questionnaire was specifically designed to evaluate the degree of improvement in the usefulness and usability of the Proposed System. The survey included items evaluating various aspects such as User Experience (UX), design, and accessibility. For the comparative evaluation, System A and the Proposed System’s UI/UX were clearly distinguished for presentation. Evaluation scales, including a 10-point scale for items like design satisfaction, were utilized for measurement. The survey was conducted targeting 50 students from IT departments who had an interest in cybersecurity. This group was selected as they represented potential users who understood the basic concepts of security assessment systems, allowing them to provide meaningful and objective evaluations of the system’s usefulness and design.
4.2. Experimentation Results and Analysis
Based on the collected survey data, the effectiveness of the proposed user-friendly dashboard UI/UX was analyzed across dimensions including design satisfaction, overall user satisfaction, usability, and interactivity. The survey was conducted targeting 50 students from IT departments interested in cybersecurity.
4.2.1. Design and Overall Satisfaction Evaluation
The Proposed System achieved very high user satisfaction in terms of visual elements and design compared to the existing text-based System A.
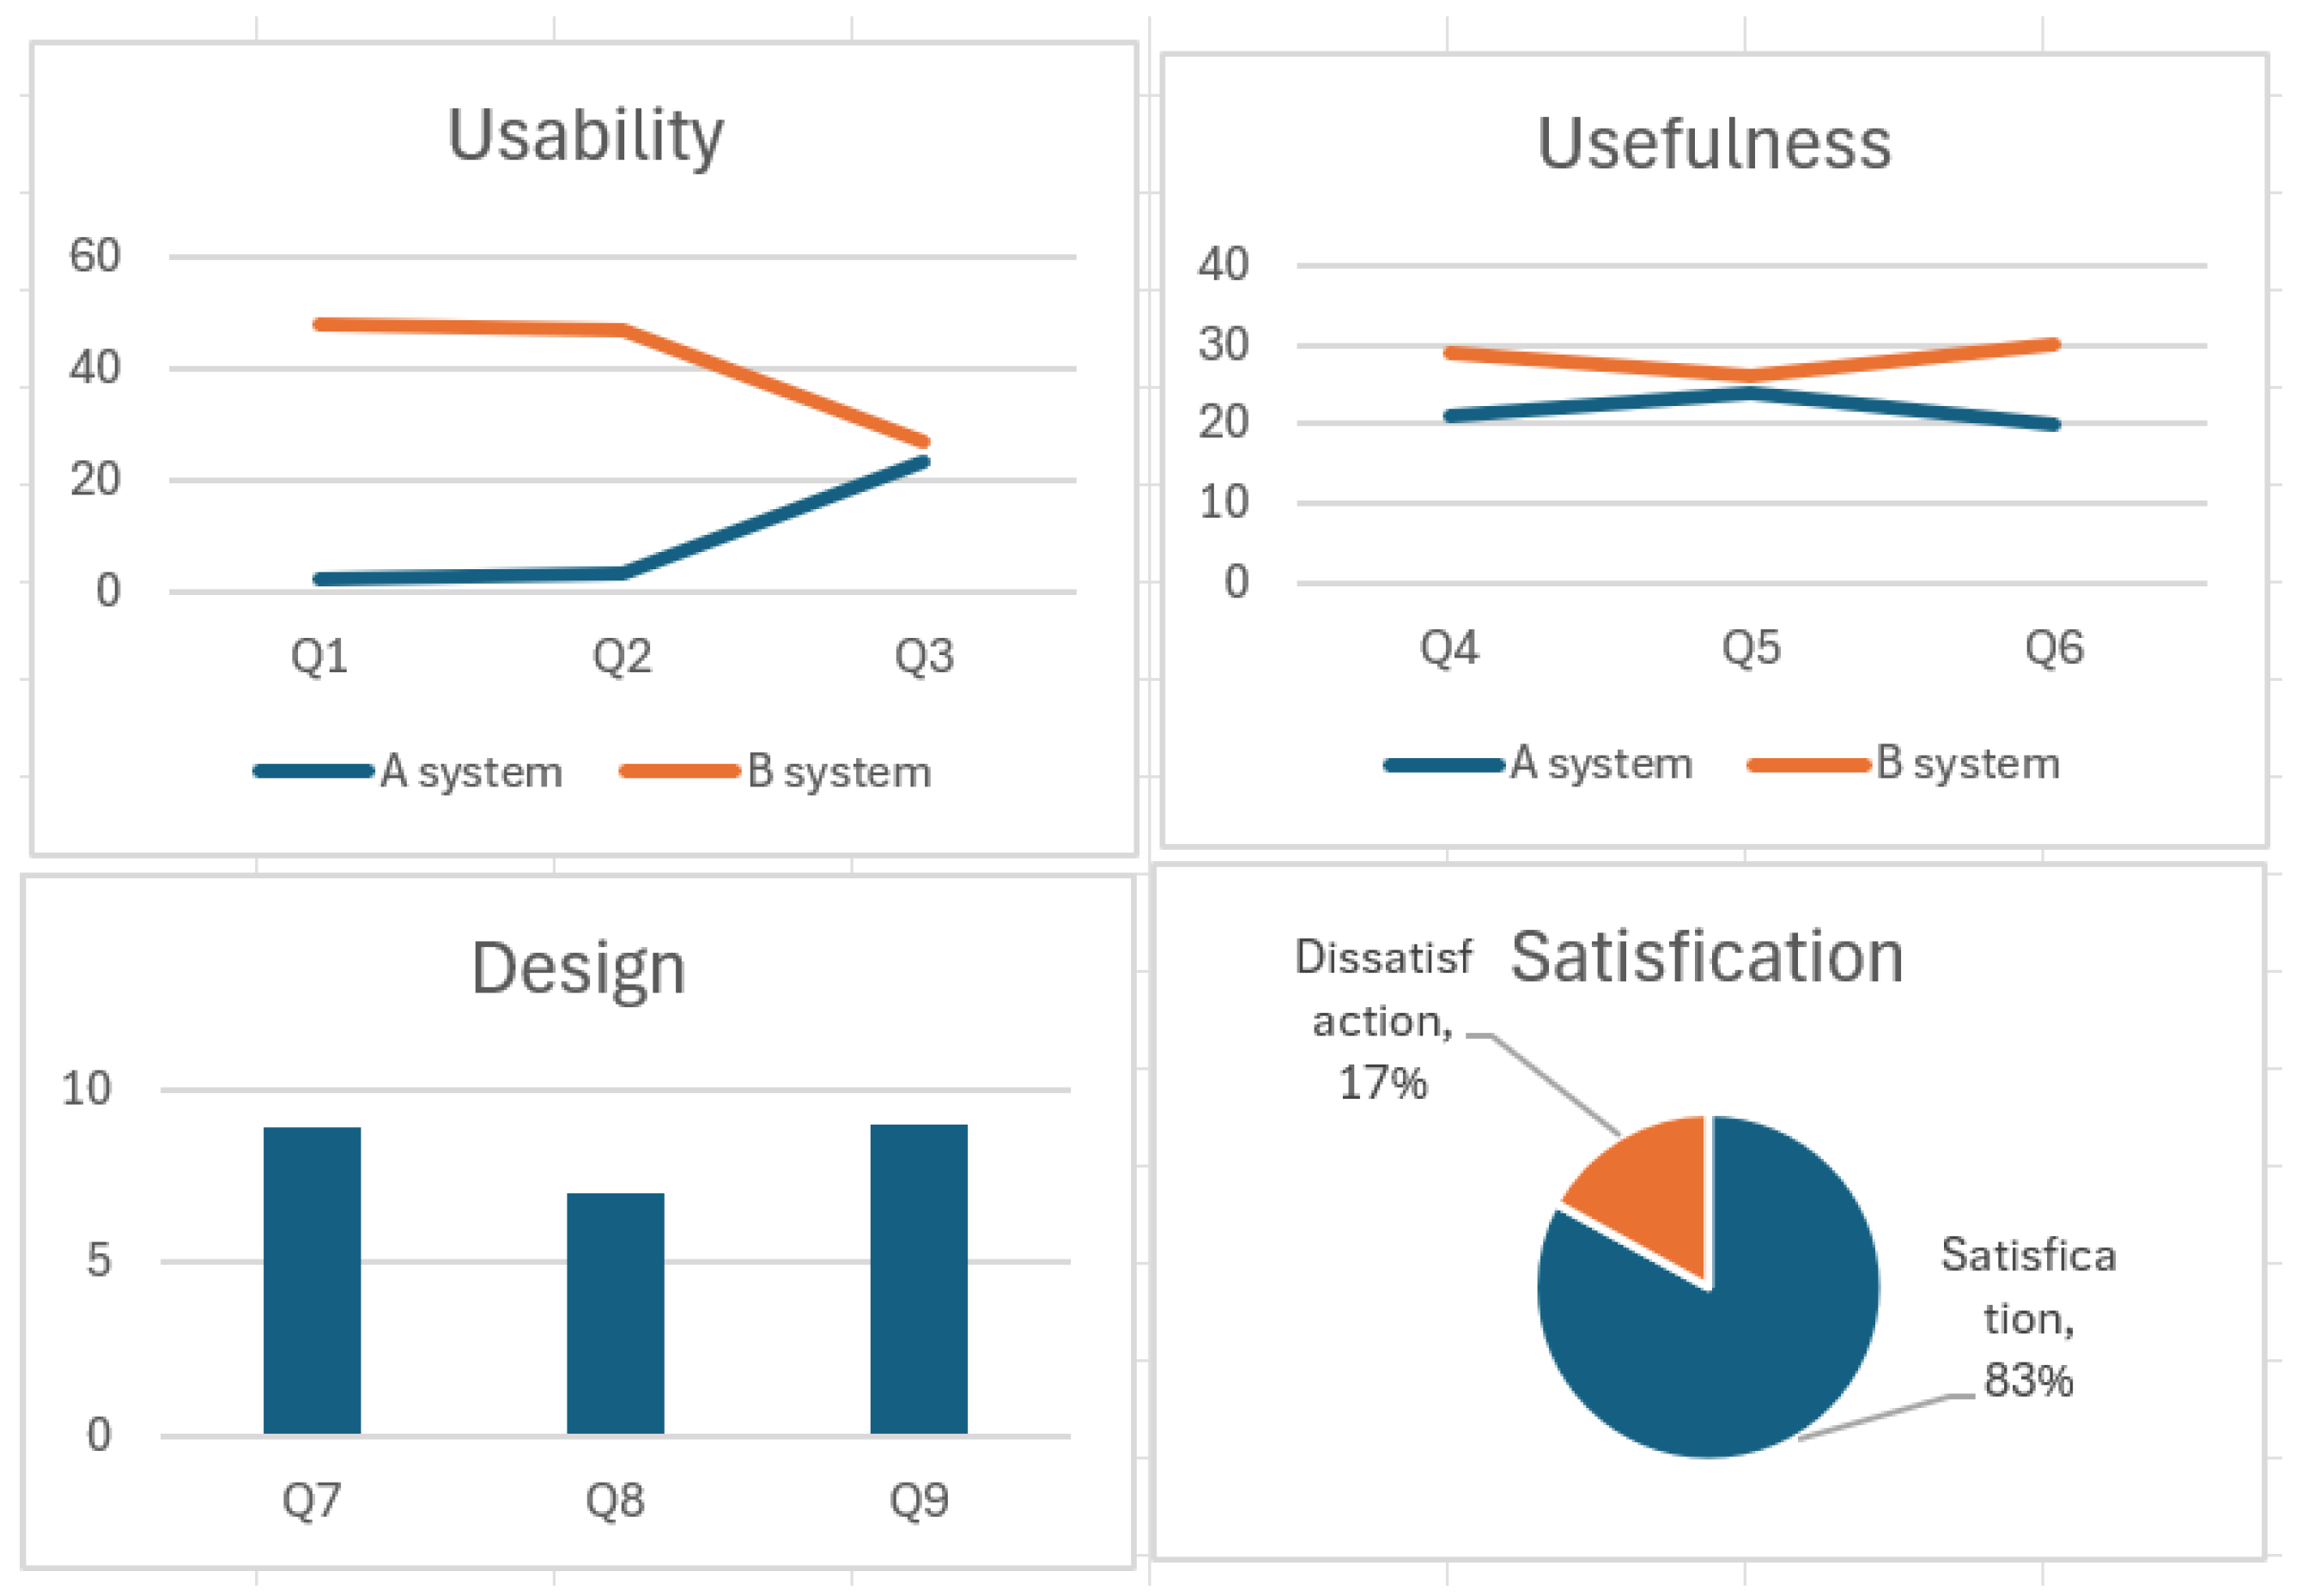
- Visual Satisfaction: The Proposed System recorded an average of 8.9 points, indicating that the visual elements were very positively received by users. This suggests that the design focused on data visualization significantly contributed to enhancing the user experience.
- Readability: In terms of readability, which is the ability to intuitively express complex metrics, the system recorded the highest satisfaction score, averaging 9.0 points. This strongly validates that the core design objective of the paper—expressing risk through color and hierarchical structure—significantly improved user comprehension of the information.
- Overall UI/UX Satisfaction: The overall user satisfaction for the Proposed System was evaluated at an average of 83%, confirming a very high level of general user acceptance regarding the system’s design and experience.
Table 2.
User Interface and Experience (UI/UX) evaluation results.
| Metric | Proposed System Average Score | Note |
|---|---|---|
| Visual Satisfaction | 8.9 points | High satisfaction. |
| Design Consistency | 7.0 points | High satisfaction. |
| Readability | 9.0 points | High satisfaction. |
| Overall UI/UX Satisfaction | 83% | High overall satisfaction. |
Notes: Scores in points are on a 0–10 scale; percentages are denoted with the symbol %.
4.2.2. Usability and Interactivity Evaluation
Apart from overall satisfaction, the specific results of the analysis on the functional aspects of the system, namely usability and interactivity, are as follows. The proposed UI/UX was evaluated as superior in terms of overall usability and usefulness compared to the UI of the existing CVSS V4.0 Calculator.
However, in the questions evaluating interaction among the usability items, there was no significant difference found between the two systems. The researchers analyzed this result as stemming from the characteristic of the proposed system primarily providing information, rather than being a deeply bidirectional interactive system with the user. In other words, the system lacked advanced two-way functionality, such as the real-time reflection of assessment results based on the user’s input or changes in settings.
Furthermore, while overall usefulness and usability showed superiority, certain detailed usability items were analyzed to have no significant difference from the existing system. This was attributed to the design’s focus being primarily on intuitively viewing text-based information through visualization, which suggests a need for further UI/UX supplementation in these specific areas.
Figure 4.
Evaluation Results.
4.2.3. Conclusions of Analysis
The experimentation and verification results quantitatively demonstrated that the proposed user-friendly dashboard UI/UX achieved significant improvement over the existing CVSS V4.0 Calculator system in terms of design, readability, and overall user satisfaction. Specifically, the visualization-centric design was confirmed to be highly effective in enhancing the comprehension of complex security metrics. However, the finding that there was no significant difference in the evaluation of the interactivity item suggests that the system remains limited to unidirectional information provision, thereby presenting a clear direction for future research to enhance bidirectional interaction functionality by improving the system structure.
5. Conclusions and Further Works
This research addressed the issues of complexity and non-intuitiveness associated with the CVSS V4.0 (Common Vulnerability Scoring System Version 4.0) metrics and presented a design proposal for a user-friendly UI/UX in the form of a dashboard, which contributes to enhancing the efficiency and user satisfaction of cyber security risk assessment. Given that the development of digital technology is accompanied by serious cyber threats, building security systems through strong vulnerability assessment is essential. This research provided a methodology for delivering those assessment results in a user-friendly manner.
While CVSS expresses risk using objective numerical scores derived from text-based vector strings and qualitative severity scales , the problem remains that it is difficult for general users to intuitively understand these results. To address this, the paper designed a user-friendly UI/UX as a dashboard for a cybersecurity and standardization evaluation simulator, focusing on data visualization, clear information hierarchy, and interactivity, and developed it as a web-based service.
- Quantitative Improvement Verification: Comparative experiments with the existing CVSS V4.0 Calculator UI demonstrated that the proposed UI/UX achieved significant improvement in terms of usability, design, and overall system satisfaction. Specifically, it recorded high scores, with Visual Satisfaction averaging 8.9 points, Readability averaging 9.0 points, and Overall UI/UX Satisfaction evaluated at 83%.
- Contribution to Complexity Reduction: The study’s key contribution lies in successfully transforming complex CVSS V4.0 metrics into an intuitive visual language. This transformation helps bridge the risk perception gap between security experts and non-experts, supporting quick and accurate decision-making.
Despite the high satisfaction scores, the analysis of the experimental results revealed certain limitations, which provide clear guidance for future research. In the questions evaluating interaction among usability items, no significant difference was found compared to the existing system. This was analyzed as being due to the system’s current characteristic of primarily providing information rather than functioning as a deeply interactive system. While overall satisfaction was high, certain detailed usability items did not show significant improvement compared to the existing system. This indicates that the initial design focused primarily on visually representing text-based information, and further supplementation is necessary.
The plan is to overcome the limitations of the current unidirectional information provision system by implementing a system structure capable of two-way interaction. This will allow for real-time feedback based on user input (e.g., changing environmental metrics). Future work will focus on supplementing the specific detailed usability items that were found to be lacking. This will enhance the system’s overall utility and practical applicability to users.
Through this subsequent research, the cybersecurity assessment simulator is expected to evolve beyond a simple score calculation tool into an advanced interactive platform that effectively supports practical risk management and decision-making.
Author Contributions
Conceptualization, Kwang-Man Ko and Jee-Hyun Koo; methodology, Kwang-Man Ko; software, Kwang-Man Ko; validation, Kwang-Man Ko, Han-Yong Choi and Jee-Hyun Koo; formal analysis, Kwang-Man Ko and Han-Yong Choi; resources, Kwang-Man Ko; data curation, Jee-Hyun Koo; writing—original draft preparation, Kwang-Man KO; writing—review and editing, Kwang-Man Ko, Han-Yong Choi and Jee-Hyun Koo;funding acquisition, Kwang-Man Ko and Han-Yong Choi. All authors reviewed the results and approved the final version of the manuscript
Funding
This research was supported by the Regional Innovation System & Education(RISE) program through the Gangwon RISE Center, funded by the Ministry of Education(MOE) and the Gangwon State(G.S.), Republic of Korea.(2025-RISE-10-005)
References
- S. B. Lee, "The Role of Software Security in the Era of Digital Transformation," IT Convergence Review, 2025.
- E. Chen, "The Escalating Threat of AI-Powered Cyber Attacks," Cybersecurity Quarterly, 2024.
- J.S.Lee, S.M.Choi, C.M.Ahn, Y.Yoo, "Trends and Implications of Cybersecurity Policies in Major Countries", Electronics and telecommunications trends, Vol.38, No.4, pp.58-69, 2023.
- S. K. Awasthi and S. S. Shrivastava, "An Integrated Security Model for Cloud Computing Using Machine Learning," Journal of Security Informatics, 2024.
- H. C. Oh, "Bridging the Gap: Translating CVSS Scores to Organizational Risk Tolerance," Risk Management Journal, 2023.
- S. K. Awasthi and S. S. Shrivastava, "An Integrated Security Model for Cloud Computing Using Machine Learning," Journal of Security Informatics, 2024.
- E. Chen, "The Escalating Threat of AI-Powered Cyber Attacks," Cybersecurity Quarterly, 2024.
- R. A. Johnson, "Proactive Cybersecurity Defense Strategies in AI-Driven Environments," International Cyber Policy Journal, 2024.
- D. S. Han, "Standardization of Vulnerability Management: A Review of CVE and NVD," Security Review Journal, 2022.
- Y. Choi, S. Pyo, and B. Kang, "Real-time Attack Visualization using Color-coded Log Data in IDS Dashboards," Journal of Visualization and Computer Graphics, 2024.
- D. Lee, M. Seo, and S. Han, "Dashboard Design for Threat Intelligence Visualization to Reduce Analyst Cognitive Load," Information Security and Applications, 2023.
- M. A. Hasan and M. S. Rahman, "Blockchain-Based Federated Learning for Enhanced IoT Security," IEEE Internet of Things Journal, 2023.
- J. P. Williams, "Zero Trust Architecture Implementation Challenges and User Experience," Security and Privacy Review, 2024.
- H. C. Kim, "Comparative Analysis of CVSS V3.1 and V4.0 for Critical Infrastructure Protection," Korean Journal of Security, 2023.
- J. Park and H. Kim, "Visualizing CVSS Scores for Enhanced Vulnerability Prioritization using Heatmaps," Journal of Information Visualization, 2022.
- T. Kim, J. Lee, and M. Hong, "Extended CVSS V4.0 Model for IoT Vulnerability Assessment," IEEE Transactions on Industrial Informatics, 2024.
- A. K. Gupta, "Impact of Gamification on User Engagement in Security Training Simulators," Computers & Security, 2023.
- C. L. Davis, "Understanding the Core Metrics of Common Vulnerability Scoring System," Security Metrics Today, 2022.
- B. K. Song, "Responsive Design Principles for Mobile Security Management Interfaces," UX/UI Studies, 2022.
- S. Lim, "The Role of Design Consistency in Enterprise Security Products," Journal of Digital Experience, 2024.
- D. Jung and Y. Ahn, "Optimizing Information Hierarchy in Security Monitoring Dashboards," Cognitive Informatics and Soft Computing, 2022.
- G. W. Smith, "Principles of Simplicity and Clarity in Data-Intensive User Interfaces," Human-Computer Interaction, 2023. [27] J. Lee and S. Park, "Designing Interactive UI for AI-based Security Risk Simulation," Information Systems Research, 2024.
- K. H. Park, "Usability Testing of Security Assessment Tools: A Comparative Study," International Journal of Usability, 2022.
- M. Jung and S. Ahn, "Accessibility Guidelines for Color-Blind Users in Data Visualization," Design and Disability Studies, 2022.
- T. L. White, "Enhancing User Control through Bidirectional Interaction in Security Dashboards," Security Technology Letters, 2025.
- P. R. Chen, "The Influence of UX Design on User Compliance with Security Policies," Cyber Law and Policy, 2023.
- D. S. Han, "Standardization of Vulnerability Management: A Review of CVE and NVD," Security Review Journal, 2022.
Figure 1.
Indication of Group CVSS 4.0.
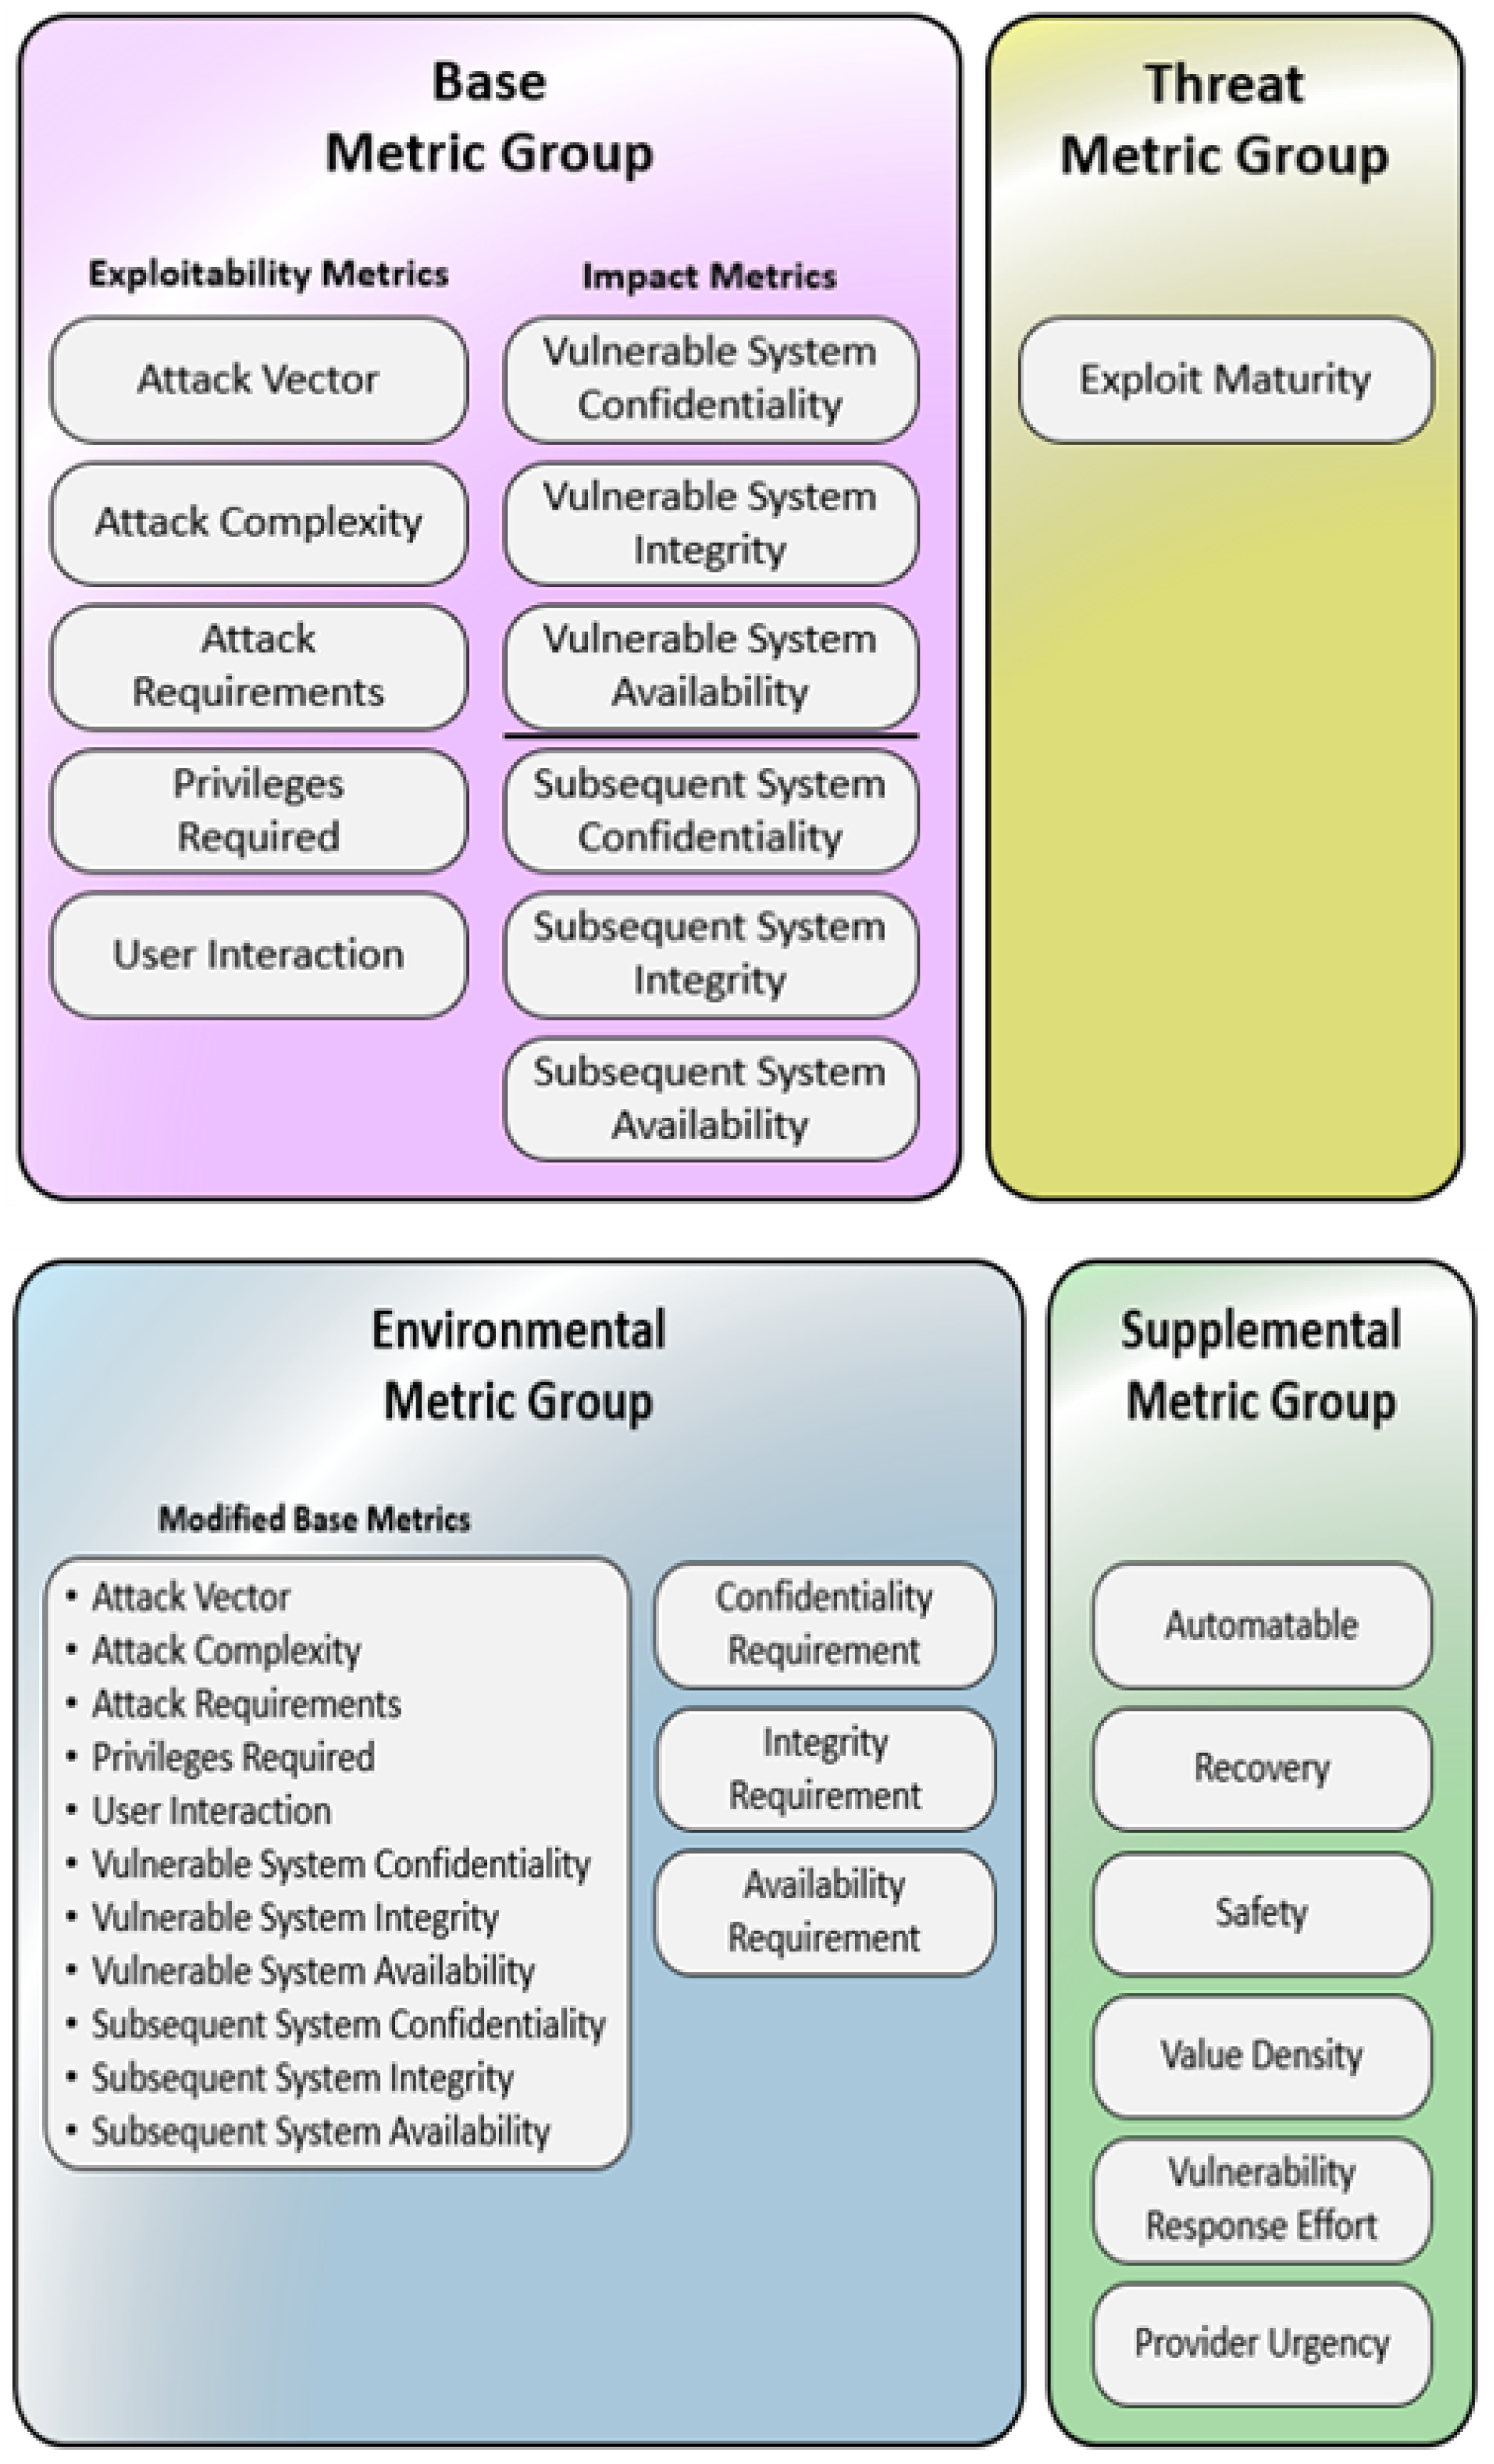
Figure 3.
CVSS 4.0 Calculator (Base Metrics).
Disclaimer/Publisher’s Note: The statements, opinions and data contained in all publications are solely those of the individual author(s) and contributor(s) and not of MDPI and/or the editor(s). MDPI and/or the editor(s) disclaim responsibility for any injury to people or property resulting from any ideas, methods, instructions or products referred to in the content. |
© 2026 by the authors. Licensee MDPI, Basel, Switzerland. This article is an open access article distributed under the terms and conditions of the Creative Commons Attribution (CC BY) license (http://creativecommons.org/licenses/by/4.0/).
Copyright: This open access article is published under a Creative Commons CC BY 4.0 license, which permit the free download, distribution, and reuse, provided that the author and preprint are cited in any reuse.


