Submitted:
04 January 2026
Posted:
06 January 2026
You are already at the latest version
Abstract
Digital technologies such as big data are reshaping resource allocation, raising interest in whether and how Heterogeneous science and technology innovation (STI) policies can help unlock urban carbon lock-in. Using panel data for 286 prefecture-level cities in China from 2009 to 2023, this paper examines the effects of heterogeneous STI policy intensity—classified as supply-side, demand-side, complementary-factor, and institutional-reform policies—on urban carbon unlocking efficiency. We develop a mechanism-based framework and empirically assess (i) the moderating roles of digital infrastructure, science and technology finance, and government green attention, and (ii) spatial spillover effects using spatial econometric models. The results show that all four policy types significantly improve local carbon unlocking efficiency, with institutional-reform policies exhibiting the largest marginal effect. When the four types are included jointly, only supply-side and demand-side policies retain statistically significant direct effects. Heterogeneity analyses indicate that demand-side, complementary-factor, and institutional-reform policies are more effective in low-pollution cities, whereas supply-side and demand-side policies have stronger effects in high energy-consuming cities. Mechanism tests further reveal that digital infrastructure amplifies policy effectiveness by facilitating factor mobility, science and technology finance strengthens policy impacts by easing financial constraints, and government green attention enhances policy effectiveness by improving implementation. Finally, carbon unlocking efficiency displays significant spatial dependence: supply-side and institutional-reform policies generate positive spillovers, while complementary-factor policies exhibit negative spillovers. Overall, the findings provide empirical evidence to inform the design and coordination of heterogeneous STI policy portfolios aimed at improving urban carbon unlocking efficiency.
Keywords:
heterogeneous innovation policy intensity
; urban carbon unlocking efficiency
; spatial spillover effects
1. Introduction
Unlocking urban carbon lock-in has become a critical global challenge in the transition toward low-carbon and high-quality development. Carbon emission rigidity, deeply embedded in long-term extensive growth trajectories, has increasingly constrained cities’ ability to achieve sustained decarbonization [1]. This challenge has attracted broad international recognition. From the United Nations Sustainable Development Goals (SDGs) to the Paris Agreement, breaking carbon lock-in and improving carbon unlocking efficiency are widely regarded as essential pathways for mitigating climate change and advancing sustainable development. Existing studies demonstrate that factors such as infrastructure upgrading, industrial structure adjustment, and the development of green finance play important roles in enhancing carbon unlocking efficiency [2,3,4,5]. However, as digital technologies—including big data and artificial intelligence—reshape innovation ecosystems, science and technology innovation (STI, thereafter) policies have gradually emerged as a potentially powerful yet underexplored instrument for addressing urban carbon lock-in. As core policy tools guiding the allocation of innovation resources, heterogeneous STI policy instruments can better align differentiated innovation demands across sectors, accelerate the research, development, and commercialization of green technologies, and ultimately activate new momentum for urban carbon unlocking.
As the world’s second-largest economy, China bears substantial responsibility in global decarbonization efforts [6,7]. The country has articulated clear “dual carbon” goals—peaking carbon dioxide emissions by 2030 and achieving carbon neutrality by 2060—and has introduced a comprehensive set of STI policies tailored to urban low-carbon transformation, ranging from targeted R&D subsidies for green technologies to institutional arrangements that facilitate the integration of innovation resources [8,9]. China’s national development strategies have consistently emphasized green and low-carbon development as a central pillar of modernization [10], with enhancing urban carbon unlocking efficiency representing a concrete and operational pathway to achieve these objectives [11]. This policy framework—characterized by strong implementation capacity and a diverse policy mix—provides a particularly valuable empirical setting for examining the relationship between heterogeneous STI policies and urban carbon unlocking. Investigating China’s experience not only contributes to addressing carbon lock-in challenges within Chinese cities but also offers transferable insights for other developing economies facing similar decarbonization pressures. Against this background, systematically evaluating the effects of heterogeneous STI policies on urban carbon unlocking has become an urgent and meaningful research agenda in the field of global green development.
However, existing research exhibits notable gaps in examining the relationship between STI policies and urban carbon unlocking. On the one hand, the majority of studies focus primarily on the challenges faced by STI policies [12] or their macroeconomic effects [13], often providing aggregate assessments of their impacts on indicators such as green total factor productivity or carbon emissions [14,15]. Such analyzes tend to overlook the inherently heterogeneous nature of policy supply. In practice, STI policies encompass fundamentally different instruments—including supply-side policies (e.g., R&D subsidies and mission-oriented technological programs), demand-side policies (e.g., green public procurement and subsidies for low-carbon products), complementary measures (e.g., innovation platform construction and incentives for industry–university–research collaboration), and institutional reforms (e.g., strengthened intellectual property protection and the establishment of low-carbon standards). These policy types differ substantially in their underlying mechanisms, implementation contexts, and regulatory intensity [16], implying that their effects on urban carbon unlocking are unlikely to be uniform. On the other hand, existing studies largely confine their analysis to estimating the direct effects of STI policies on carbon unlocking outcomes [17], with limited attention paid to the underlying transmission mechanisms. In particular, insufficient consideration has been given to how enabling conditions in the digital economy—such as digital infrastructure and science and technology finance—may moderate policy effectiveness. Moreover, the potential spatial interactions of policy effects across cities have rarely been incorporated into empirical analyzes. This omission constrains both the theoretical understanding of policy functioning and the empirical basis for designing more targeted and effective STI policy mixes.
Against this backdrop, this study employs a panel dataset of 286 prefecture-level cities in China spanning the period from 2009 to 2023. We construct a composite indicator system to measure the intensity of heterogeneous STI policies—covering supply-side, demand-side, complementary, and institutional reform policies—as the core explanatory variable, while urban carbon unlocking efficiency serves as the dependent variable. Based on this framework, the study systematically examines the effects of heterogeneous STI policy intensity on urban carbon unlocking efficiency. Specifically, the analysis proceeds in three steps. First, drawing on relevant theoretical frameworks, we explore the effects of the four categories of heterogeneous STI policies on urban carbon unlocking efficiency and conduct heterogeneity analyzes across cities with different levels of pollution intensity and energy consumption intensity. Second, we introduce regional digital infrastructure development, science and technology finance development, and government green attention as moderating variables to assess how these enabling conditions shape the effectiveness of STI policies. Finally, a spatial Durbin model is employed to identify the spatial spillover effects of heterogeneous STI policy intensity on urban carbon unlocking efficiency across cities.
Compared with the existing literature, this study makes three main contributions. First, from a theoretical perspective, this study moves beyond the prevailing homogeneous treatment of STI policies by distinguishing four heterogeneous policy types and developing an integrated analytical framework linking policy heterogeneity to urban carbon unlocking efficiency. This framework elucidates the differentiated effects of various STI policy instruments on carbon unlocking, thereby enriching the theoretical understanding of the relationship between STI policies and the low-carbon transition, and offering a novel perspective for future evaluations of policy effectiveness in the field of green innovation. Second, with respect to indicator construction, this study departs from the common practice of relying on single indicators or aggregate policy indices [13] and instead develops a multi-dimensional indicator of heterogeneous STI policy intensity based on policy functional orientation. By improving the precision and conceptual validity of policy intensity measurement, this indicator provides a robust measurement reference for future comparative studies across countries, regions, and time periods, particularly in developing economies characterized by diverse policy instruments. Third, in terms of practical relevance, this study not only empirically examines the direct effects of heterogeneous STI policies on urban carbon unlocking efficiency, but also incorporates analyzes of moderating mechanisms and spatial spillover effects, with particular attention to the role of enabling conditions in the digital economy. The identified multi-layered mechanism—linking policy supply, supporting conditions, and spatial interactions—offers concrete empirical evidence to support more differentiated and targeted policy design. For example, it can inform policymakers on how regions with varying levels of digital economy development may adopt more appropriate combinations of STI policies. Moreover, this mechanism provides transferable insights for other countries and regions confronting carbon lock-in challenges, especially emerging economies with pronounced regional disparities, to design context-specific low-carbon innovation policies.
2. Theoretical Analysis and Research Hypotheses
2.1. Direct Effects of Heterogeneous STI Policy Intensity on Urban Carbon Unlocking Efficiency
Urban carbon lock-in represents a multidimensional rigidity formed through the joint effects of technological path dependence, sunk capital accumulation, institutional inertia, and market failures. Breaking such lock-in requires policy instruments that can intervene in multiple dimensions simultaneously, rather than relying on homogeneous policy approaches [18,19]. In this regard, STI policies constitute a critical means of enhancing urban carbon unlocking efficiency by targeting the technological, market, systemic, and institutional foundations of carbon lock-in. From a functional perspective, heterogeneous STI policies can be categorized into four types: supply-side policies, demand-side policies, complementary policies, and institutional reform policies. These policy instruments differ fundamentally in their intervention logic, application contexts, and intensity, and they operate by targeting distinct core mechanisms underlying carbon lock-in. Consequently, variations in policy intensity across these categories are expected to generate differentiated effects on the efficiency and pathways of urban carbon unlocking. This classification is consistent with the framework proposed by Borrás and Edquist (2013) [20], who systematically examine the typology and selection logic of innovation policy instruments and emphasize the need for policies to precisely address different stages of the innovation process. Their work provides an important theoretical foundation for distinguishing heterogeneous STI policies. Moreover, empirical evidence based on Chinese cities indicates that innovation-oriented urban development policies can significantly enhance carbon unlocking efficiency [10], further supporting the practical relevance of STI policies as a core instrument for breaking carbon lock-in.
Specifically, supply-side STI policies—including R&D subsidies, tax incentives, basic research programs, and talent development initiatives—focus on strengthening the upstream technological supply of low-carbon innovation. The intensity of such policies directly determines the depth and robustness of the technological foundation for carbon unlocking. Edquist (2001) argues that innovation policy constitutes a form of public action that shapes technological change and innovation activities [21], with supply-side policies playing a pivotal role in alleviating technological path dependence. By enhancing low-carbon technological capabilities, stronger supply-side STI policies help break the vicious cycle of “high-carbon technological path dependence–insufficient low-carbon technology supply,” thereby improving urban carbon unlocking efficiency [22].
Demand-side STI policies, such as green public procurement, consumption subsidies, demonstration projects, and carbon pricing mechanisms, aim to cultivate market demand for low-carbon technologies [23]. The intensity of these policies directly affects the scale and speed of technology diffusion and commercialization, while insufficient technology adoption is a key mechanism through which carbon lock-in persists. Edler (2010) systematically develops the theory of demand-based innovation policy (DBIP) [24], highlighting how demand-side instruments stimulate innovation and application by creating market opportunities and commercialization scenarios. By expanding market demand and providing application contexts for low-carbon technologies, stronger demand-side STI policies can induce carbon unlocking from the demand side and thus enhance carbon unlocking efficiency [25].
Complementary STI policies—including green finance support, technology trading platforms, cross-regional innovation collaboration, and supporting infrastructure—focus on building an effective innovation ecosystem. Their intensity determines the degree of coordination and synergy in low-carbon innovation activities. Mohnen and Röller (2005) demonstrate that policy complementarity is crucial for improving innovation performance, as coordinated policy mixes can significantly enhance overall effectiveness [26]. By integrating innovation resources and alleviating coordination failures in the innovation process, complementary STI policies help remove bottlenecks in technology transformation and diffusion [27], thereby promoting urban carbon unlocking efficiency.
Finally, institutional reform-oriented STI policies, such as strengthened intellectual property protection, reforms in government performance evaluation, improvements in carbon trading systems, and the establishment of low-carbon standards, focus on optimizing the institutional environment for innovation. The intensity of these policies directly influences the long-term stability and sustainability of carbon unlocking. At a deeper level, carbon lock-in is rooted in institutional inertia—such as GDP-oriented governance incentives and persistent dependence on high-carbon industries—which can only be dismantled through institutional change. Integrating innovation system approaches into institutional design can effectively weaken path dependence and provide durable institutional support for carbon unlocking [28], thereby enhancing urban carbon unlocking efficiency.
Based on the above theoretical analysis, this study proposes the following hypothesis:
Hypothesis H1. Greater intensity of heterogeneous STI policies enhances urban carbon unlocking efficiency.
2.2. Mechanisms Through Which Heterogeneous STI Policy Intensity Affects Urban Carbon Unlocking Efficiency
The positive effects of heterogeneous STI policies on urban carbon unlocking efficiency do not operate in isolation; rather, they are significantly shaped by regional development conditions. In particular, regional digital infrastructure development, science and technology finance development, and government green attention strengthen the effectiveness of heterogeneous STI policies through three distinct channels: improving factor mobility, enhancing resource support, and reinforcing institutional enforcement. By improving the external environment in which policies operate, these conditions reduce implementation costs and amplify policy transmission efficiency, enabling heterogeneous STI policies to more precisely target the core mechanisms underlying urban carbon lock-in.
2.2.1. Regional Digital Infrastructure Development: An Amplifier of Policy Transmission Through Enhanced Factor Mobility
Regional digital infrastructure—represented by 5G networks, industrial internet platforms, and data centers—relaxes spatial and temporal constraints, reduces information asymmetries, and improves factor allocation efficiency [29,30]. Through these mechanisms, digital infrastructure significantly amplifies the positive effects of heterogeneous STI policies on urban carbon unlocking efficiency, with its moderating role extending across the entire policy transmission chain. According to Tobler (1970) first law of geography, spatial interaction weakens with distance [31]. Digital infrastructure mitigates this constraint through a “time–space compression” effect, thereby providing a technological foundation for scaling up policy effectiveness. For supply-side STI policies, digital infrastructure magnifies technological supply effects by accelerating knowledge spillovers [32]. As the core objective of supply-side policies is to stimulate low-carbon R&D, digital infrastructure facilitates the formation of virtual R&D communities, reducing the costs of cross-firm and cross-regional collaboration. As a result, the marginal returns to policy instruments such as R&D subsidies are substantially enhanced. Empirical evidence further suggests that digital technologies improve collaborative R&D efficiency and strengthen the contribution of low-carbon technological supply to carbon unlocking [33]. For demand-side STI policies, policy effectiveness critically depends on the breadth of market coverage. Digital infrastructure helps overcome the geographic limitations of traditional demand-side instruments [25], expanding policy reach and alleviating “local market lock-in.” By enlarging market access and accelerating information diffusion [34], digital infrastructure enhances the translation of demand-side policies into effective low-carbon technology adoption. With respect to complementary STI policies, digital infrastructure strengthens policy effectiveness through more precise resource matching [35]. Digital finance platforms improve the efficiency of green credit approval, while the digitalization of technology trading platforms facilitates cross-regional technology transactions [36]. Big data technologies further enhance coordination among policy instruments by enabling more accurate matching between financial resources and innovation needs [37], thereby alleviating problems of financial misallocation and transaction barriers that characterize traditional policy implementation. Finally, for institutional reform-oriented STI policies, digital infrastructure enhances the diffusion and enforcement of regulatory standards. Digital government platforms improve the cross-departmental and cross-regional dissemination of institutional arrangements such as carbon accounting standards and intellectual property protection rules [38], thereby strengthening the consistency and credibility of emission-reduction constraints. Taken together, by optimizing factor flows along the entire policy transmission chain, regional digital infrastructure functions as a key amplifier of the carbon unlocking effects of heterogeneous STI policies. Based on this reasoning, we propose the following hypothesis:
Hypothesis H2a. Regional digital infrastructure development positively moderates the relationship between heterogeneous STI policy intensity and urban carbon unlocking efficiency.
2.2.2. Science and Technology Finance Development: Strengthening Financial Support as a Resource Catalyst
The level of science and technology finance development—characterized by green credit, venture capital, and green bonds—provides essential financial support for the effective implementation of heterogeneous STI policies by lowering financing costs, diversifying innovation risks, and guiding capital toward low-carbon innovation activities . Through these mechanisms, science and technology finance significantly strengthens the positive effects of heterogeneous STI policies on urban carbon unlocking efficiency. For supply-side STI policies, R&D subsidies exhibit a “seed capital” nature. This role is consistent with Jaffe et al. (1995), who emphasize that innovation policies require financial instruments to amplify their intervention effects [39]. A well-developed science and technology finance system enhances the leverage effect of supply-side policies through mechanisms such as risk compensation and loan–investment linkage, enabling relatively limited public R&D subsidies to mobilize substantial private R&D investment [40]. This process improves the efficiency of technological transformation and amplifies the contribution of supply-side policies to urban carbon unlocking efficiency. For demand-side STI policies, science and technology finance activates market demand through consumer finance instruments. Financial incentives on the consumption side can substantially expand the market scale for low-carbon products and form synergies with demand-side STI policies [41], ensuring that policy-related financial inputs are more precisely directed toward carbon unlocking processes. With respect to complementary STI policies, the integration of diversified financial instruments enhances policy coordination through more effective resource matching. The science and technology finance system serves as a critical platform for integrating complementary policy tools [37], enabling synergy-enhancing effects through coordinated resource allocation. In particular, the deep integration of green finance instruments with science and technology finance forms a full-cycle financing chain—covering R&D financing, commercialization financing, and scale-up financing—which increases the implementation rate of low-carbon technologies. Moreover, green funds within the science and technology finance system participate in cross-regional innovation platforms through equity investment, mitigating potential “siphoning effects” whereby core cities attract excessive financial resources from neighboring areas. By promoting cross-regional capital allocation, science and technology finance helps strengthen the regional collaborative carbon unlocking effects of complementary STI policies [42]. Finally, science and technology finance reinforces the effectiveness of institutional reform–oriented and demand-side STI policies by enhancing enforcement credibility and market activation. Financial innovation strengthens the implementation of institutional rules [43]. In particular, carbon derivatives such as carbon futures and options supported by science and technology finance improve the price discovery function of carbon markets, reduce excessive price volatility, and enhance the stability and binding force of institutional policies. Based on the above analysis, this study proposes the following hypothesis:
Hypothesis H2b. Science and technology finance development positively moderates the relationship between heterogeneous STI policy intensity and urban carbon unlocking efficiency.
2.2.3. Government Green Attention: Strengthening Policy Implementation Through Institutional Support
Government green attention—reflected in the weighting of green performance indicators, targeted supervision of green policy implementation, and the establishment of dedicated leadership mechanisms—enhances the effectiveness of heterogeneous STI policies by strengthening enforcement capacity, improving policy coordination, and reducing implementation costs [44,45]. For supply-side STI policies, higher levels of government green attention enhance policy effectiveness by increasing enforcement rigidity. Governments with strong green orientation are more likely to establish dedicated supervision mechanisms for low-carbon R&D subsidies, improving fund disbursement rates and enhancing the emission-reduction effectiveness of public subsidies [46]. Woolthuis et al. (2005) emphasize that policy design must address systemic failures in implementation, and green-attention-driven supervision mechanisms represent targeted solutions that improve the technological conversion efficiency of supply-side policies [47]. For demand-side STI policies, government green attention enhances effectiveness by improving market cultivation and implementation precision. The success of demand-side policies depends heavily on local governments’ promotional efforts and supporting infrastructure provision. Governments with high green attention tend to implement initiatives such as green consumption campaigns and dedicated funds for charging infrastructure, increasing public awareness of policy incentives and enabling dynamic policy adjustment mechanisms. These efforts help avoid “policy fatigue” and enhance the marginal effectiveness of demand-side policies [25], thereby amplifying their contribution to urban carbon unlocking efficiency. With respect to complementary STI policies, government green attention strengthens resource integration through enhanced coordination mechanisms. Complementary policies typically involve multiple departments, including finance, science and technology, and housing and urban development. Governments with strong green orientation are more likely to establish cross-departmental coordination bodies that integrate processes such as green credit approval, technology transaction registration, and infrastructure support into “one-stop” services. This integration shortens project implementation cycles and improves the synergistic effectiveness of complementary STI policies. For institutional reform–oriented STI policies, strong government green attention facilitates the implementation of binding constraints, such as carbon reduction veto mechanisms. By strengthening institutional enforcement, government green attention helps dismantle institutional inertia associated with high-carbon development paths [48]. As a result, compliance rates in carbon trading systems increase, and enforcement efficiency in intellectual property protection related to low-carbon technologies improves, significantly enhancing the effectiveness of institutional policies. Overall, by combining rigid enforcement, coordinated governance, and adaptive policy adjustment, government green attention provides critical institutional support for amplifying the carbon unlocking effects of heterogeneous STI policies [49,50]. Accordingly, this study proposes the following hypothesis:
Hypothesis H2c. Government green attention positively moderates the relationship between heterogeneous STI policy intensity and urban carbon unlocking efficiency.
2.3. Spatial Effects of Heterogeneous STI Policy Intensity on Urban Carbon Unlocking Efficiency
Tobler (1970) first law of geography states that all things are related, but nearby things are more strongly related than distant ones, implying that spatial spillover effects decay with distance [31]. In the context of digital technologies weakening traditional spatial constraints, the cross-regional mobility of innovation factors such as knowledge and capital has increased substantially [51,52], providing favorable conditions for the spatial transmission of heterogeneous STI policies. By influencing factor mobility costs and alleviating information asymmetries, heterogeneous STI policies affect not only local urban carbon unlocking efficiency but also that of neighboring cities through channels such as factor flows and policy imitation. Importantly, these spatial spillover effects are heterogeneous across different types of STI policies. Supply-side STI policies, including R&D subsidies, basic research support, and talent development programs, exhibit positive spatial spillover effects. Regional policy imitation and coordination play a critical role in enhancing overall policy effectiveness [53]. Through transmission channels such as knowledge sharing, technological imitation, and collaborative innovation, the visible outcomes of supply-side policies—such as the strong linkage between R&D subsidies and patent output—are easily observed by neighboring cities, encouraging policy imitation and promoting regional carbon unlocking. In contrast, demand-side STI policies, such as green procurement, consumption subsidies, and demonstration projects, are constrained by local market lock-in and regional demand heterogeneity. The effectiveness of these policies depends heavily on local consumption structures and infrastructure conditions, making it difficult for their effects to transmit across regions and generate significant spatial spillovers. Complementary STI policies, including green finance support, technology trading platforms, and infrastructure provision, tend to exhibit negative spatial spillover effects. As highlighted by Oughton et al. (2002) in the “regional innovation paradox,” inherent imbalances exist between core and lagging regions in the allocation of innovation resources [54]. Complementary policies rely heavily on scarce factors such as capital and advanced services, which core cities are better positioned to attract due to agglomeration advantages. Consequently, these policies may intensify resource siphoning from neighboring cities, inhibiting their carbon unlocking processes. Finally, institutional reform-oriented STI policies generate positive spatial spillover effects due to the public-good nature of institutions and their high degree of compatibility and imitability. Effective institutional arrangements implemented in core cities often serve as benchmarks that diffuse to neighboring areas through regional cooperation and policy learning, reducing institutional barriers to cross-regional factor mobility. Standardized carbon accounting rules, intellectual property protection frameworks, and carbon trading systems can be directly adopted by neighboring cities, lowering institutional coordination costs. Moreover, institutional diffusion reflects systemic synergy [55], as integrated regional markets amplify the binding force of institutional constraints and enhance regional carbon unlocking efficiency. Based on the above analysis, this study proposes the following hypotheses:
Hypothesis H3a. Supply-side STI policy intensity generates positive spatial spillover effects on urban carbon unlocking efficiency.
Hypothesis H3b. Demand-side STI policy intensity does not generate significant spatial spillover effects on urban carbon unlocking efficiency.
Hypothesis H3c. Complementary STI policy intensity generates negative spatial spillover effects on urban carbon unlocking efficiency.
Hypothesis H3d. Institutional reform–oriented STI policy intensity generates positive spatial spillover effects on urban carbon unlocking efficiency.
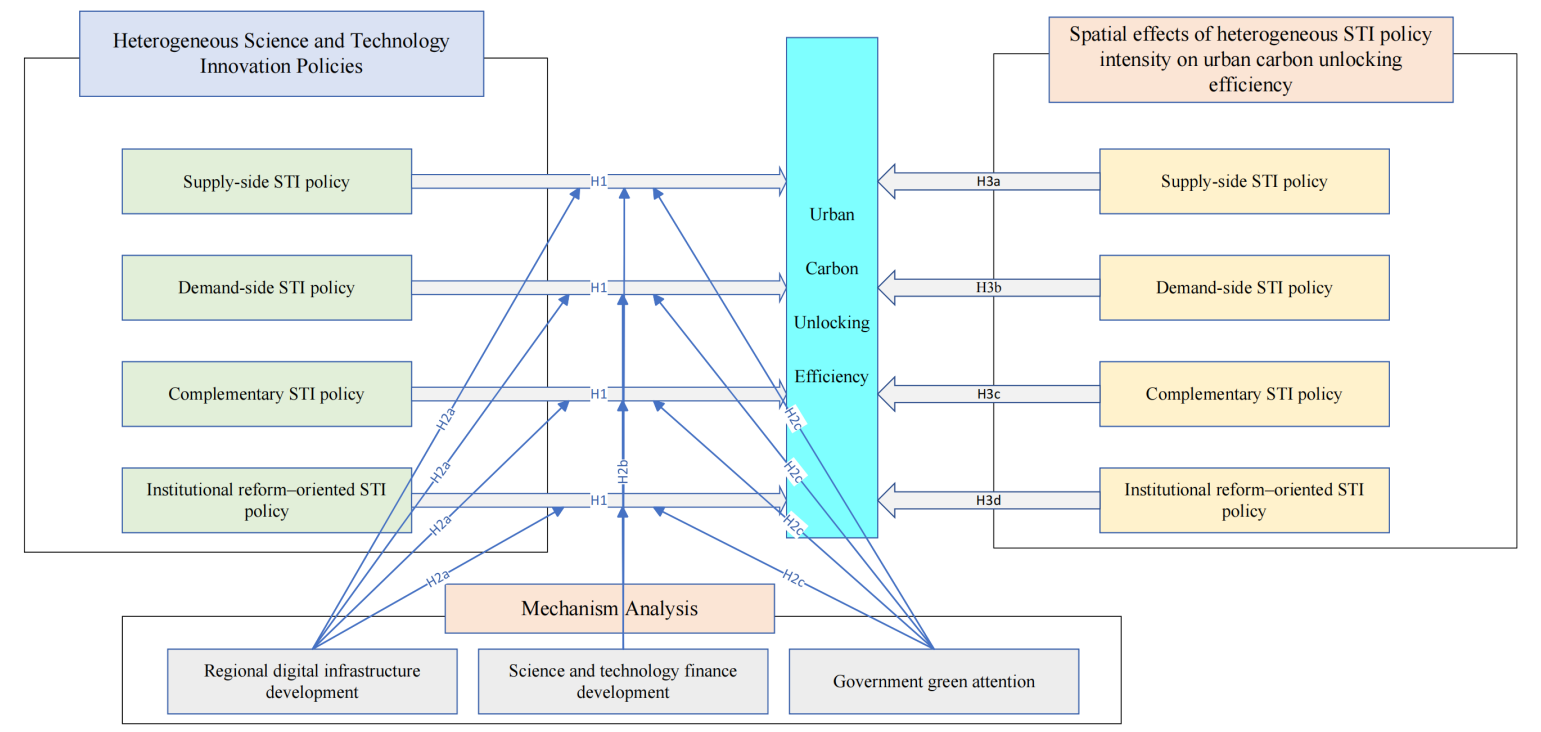
The theoretical analysis framework of this study is illustrated in Figure 1.
3. Research design
3.1. Empirical Model
To examine the effect of heterogeneous STI policy intensity on urban carbon unlocking efficiency, this study constructs a fixed-effects panel regression model based on prefecture-level city data, as specified below:
Where, is the dependent variable, representing the carbon unlocking efficiency of city in year . The core explanatory variables , , , and denote the intensities of heterogeneous STI policies in city in year , including supply-side policy intensity, demand-side policy intensity, complementary policy intensity, and institutional reform policy intensity, respectively. represents a set of control variables, including financial development (), economic development (), urbanization level (), local government expenditure (), per capita fixed-asset investment (), and informatization level (). and denote year-fixed effects and city-fixed effects, respectively, and is the stochastic error term. By simultaneously controlling for both city and year fixed effects, the coefficient captures the marginal effect of heterogeneous STI policy intensity on urban carbon unlocking efficiency.
3.2. Variable Design
3.2.1. Dependent Variables
Urban carbon unlocking efficiency () measures the efficiency of carbon decoupling in cities. Following Chen et al. (2024) [33], this study calculates using the non-radial directional distance function based on the SBM approach. Specifically, each city is treated as a decision-making unit (DMU). Suppose that the carbon unlocking efficiency of city involves inputs , mainly including environmental regulations, technical expenditures, and human capital, etc., which can generate desirable outputs and undesirable outputs . Here, desirable outputs correspond to the city’s regional GDP, while undesirable outputs represent annual CO2 emissions. In year , each city encompasses the environmental production technology for both desirable and undesirable outputs, denoted as :can produce , . Following Xia & Xu (2020) [35], assuming variable returns to scale, the non-radial, non-oriented SBM directional distance function for city in year , which jointly considers desirable and undesirable outputs, can be expressed as:
Where denotes the minimization operator, and represents the directional distance function under the assumption of variable returns to scale. denote the input, desirable output, and undesirable output vectors of city in year , respectively. The slack variables capture input excesses, shortfalls in desirable outputs, and excesses in undesirable outputs, respectively. is the intensity vector. To incorporate dynamic changes over time, and following the geometric mean approach, this study constructs the SBM–Malmquist–Luenberger (SBM-ML) index by comparing two adjacent periods, and , as follows:
Based on the above estimation framework, inputs include environmental regulation and technological inputs. Environmental regulation is proxied by a text-based measure derived from the frequency of environment-related keywords in prefecture-level government work reports. Technological inputs mainly consist of the number of technical personnel and expenditures on science and technology at the city level. In terms of outputs, both desirable and undesirable outputs are considered. Desirable output is measured by each city’s gross domestic product (GDP), while undesirable output is proxied by urban CO2 emission intensity. As the carbon unlocking efficiency index obtained from the SBM–ML approach reflects a growth rate—capturing year-on-year changes relative to the previous period—we follow Zhang and Wang (2020) to transform it into a level-based index [56]. Specifically, 2009 is set as the base year with a value of 1. The carbon unlocking efficiency for 2010 is calculated as the base-year value multiplied by the 2010 efficiency index. The value for 2011 is obtained by multiplying the 2010 level by the 2011 efficiency index, and this process is iteratively applied to subsequent years, thereby yielding the level of urban carbon unlocking efficiency for each city over time.
Figure 2 reports the spatial distribution of urban carbon unlocking efficiency (UCE) in 2010, 2014, 2019, and 2023. From a spatial perspective, UCE exhibits a pronounced east–west disparity, characterized by a clear “high-in-the-east, low-in-the-west” pattern. High-efficiency clusters (darker shades) are persistently concentrated in eastern coastal regions and core cities in central China, whereas most western regions remain in low-efficiency areas (lighter shades or missing values). This spatial configuration closely corresponds to regional differences in economic foundations and innovation resource endowments. From a temporal perspective, the spatial coverage of high UCE values shows a continuous expansion over time. In 2010, high-efficiency areas were sporadically distributed in parts of eastern China. By 2014, these areas had expanded across most eastern cities and parts of central China, accompanied by an increased density of cities within the high-efficiency interval (6.55–10.52). In 2019, several cities in Northeast China entered the high-efficiency range, and high-value clusters in central China became more contiguous. By 2023, the agglomeration of high UCE values in eastern and central core cities became more pronounced, while some cities in central and western China also experienced efficiency improvements. Nevertheless, western regions as a whole remained at relatively low efficiency levels. Overall, during the period 2010–2023, urban carbon unlocking efficiency in China exhibited a trend of overall improvement, spatial diffusion, yet persistent regional disparities. The expansion of high-efficiency areas reflects the regional transmission of carbon unlocking capabilities, whereas the lagging performance of western regions highlights the constraining role of uneven regional development foundations in the carbon unlocking process.
3.2.2. Core Explanatory Variables
The core explanatory variables are the intensities of heterogeneous STI policies, denoted as,,and . Given that innovation policies differ substantially in their functional orientation, existing studies have proposed several classification schemes. Early research distinguishes innovation policies into supply-side, demand-side, and environmental policies [57]. Subsequent studies classify innovation policies according to their mode of innovation, such as incremental, radical, autonomous, and adaptive policies [58]. Barrow (1996) further extends this framework by introducing complementary policies that emphasize industry–university collaboration and the mobilization of firms’ internal and external resources [59]. Building on these strands, Stcinmucller (2010) incorporates institutional reform–oriented policies that provide stable institutional support and promote the commercialization of scientific and technological outcomes [60]. Following the classification framework proposed by Stcinmucller (2010) [60], this study categorizes STI policies into four types: supply-side policies, demand-side policies, complementary policies, and institutional reform policies. Specifically, supply-side STI policies aim to address underinvestment and bottlenecks in the innovation process by directly strengthening scientific research and technological development through instruments such as subsidies and dedicated funding programs. These policies primarily target constraints related to insufficient R&D investment and impeded technology diffusion. Demand-side STI policies emphasize demand-driven innovation by stimulating market demand for new technologies and providing stronger expected returns, thereby incentivizing firms to increase innovation efforts. Such policies focus on aligning technological innovation with market needs and accelerating technology adoption. Complementary STI policies seek to expand the availability of resources for innovation activities by enhancing coordination among financial, technological, and infrastructural elements, thereby reducing innovation bottlenecks and improving overall innovation efficiency. Finally, institutional reform-oriented STI policies focus on optimizing the institutional environment for innovation by clarifying the division of responsibilities in R&D activities, strengthening incentives for firms’ technological innovation, and promoting the construction of platforms that facilitate the transformation and commercialization of scientific and technological achievements.
3.2.3. Control Variables
Urban carbon unlocking efficiency may be influenced not only by heterogeneous STI policy intensity but also by a range of city-level characteristics. Following Wu et al. (2023) [61], this study includes a set of control variables to account for potential confounding factors, namely financial development (), economic development (), urbanization level (), local government expenditure (), per capita fixed-asset investment (), and informatization level ().
Specifically, financial development () is measured by the ratio of year-end deposits and loans of financial institutions to GDP. Economic development () is proxied by GDP per capita (in 10000 yuan). Urbanization level () is measured as the proportion of urban population to total population. Local government expenditure () is captured by the ratio of general public budget expenditure to GDP. Per capita fixed-asset investment () is measured by the ratio of total fixed-asset investment to total population. Informatization level ) is proxied by the logarithm of the number of Internet users in each city. Detailed definitions of all variables are reported in Table

Table 1.
Variable Definitions.
| Variable name | Symbol | Definition | |
| Dependent variable | Urban carbon unlocking efficiency | Measured using the non-radial SBM directional distance function with undesirable outputs | |
| Core explanatory variables | Supply-side STI policy intensity | Number of policies related to supply-side STI policies at the city level | |
| Demand-side STI policy intensity | Number of policies related to demand-side STI policies at the city level | ||
| Complementary STI policy intensity | Number of policies related to complementary STI policies at the city level | ||
| Institutional reform–oriented STI policy intensity | Number of policies related to institutional reform–oriented STI policies at the city level | ||
| Control variables | Financial development | Ratio of year-end deposits and loans of financial institutions to GDP | |
| Economic development | Logarithm of GDP per capita | ||
| Urbanization level | Ratio of urban population to total population | ||
| Local government expenditure | Ratio of general public budget expenditure to GDP | ||
| Per capita fixed-asset investment | Ratio of total fixed-asset investment to total population | ||
| Informatization level | Logarithm of the number of Internet users |
3.3. Data Sources
The empirical analysis is based on an unbalanced panel dataset covering 286 prefecture-level cities in China over the period 2009–2023. Data for the dependent variable—urban carbon unlocking efficiency—and the control variables, including financial development, economic development, urbanization level, local government expenditure, per capita fixed-asset investment, and informatization level, are primarily obtained from the China City Statistical Yearbook. Data on the core explanatory variables—heterogeneous STI policy intensity—are manually collected from the official websites of prefecture-level municipal governments and their science and technology departments, as well as from policy databases such as Peking University’s Law Database. The classification of STI policies follows the framework proposed by Stcinmucller (2010) [60], which distinguishes supply-side, demand-side, complementary, and institutional reform–oriented policies. For a small number of cities and years with missing observations, interpolation methods are applied to ensure data continuity. After data processing, the final sample consists of 4290 city–year observations. Descriptive statistics for all variables are reported in Table 2.
4. Empirical Analysis
4.1. Baseline Results
Table 3 reports the baseline regression results examining the effects of heterogeneous STI policy intensity on urban carbon unlocking efficiency. Columns (1)–(5) present the estimated effects of supply-side, demand-side, complementary, and institutional reform–oriented STI policies, as well as their joint effects when all policy types are included simultaneously. The results in column (1) show that supply-side STI policy intensity () has a significantly positive effect on urban carbon unlocking efficiency () at the 1% significance level, with an estimated coefficient of 0.0749. This implies that a one-unit increase in supply-side policy intensity is associated with an approximately 7.49% increase in urban carbon unlocking efficiency. Column (2) indicates that demand-side STI policy intensity () also exerts a significantly positive impact on at the 1% level, with a coefficient of 0.0885, suggesting a stronger marginal effect relative to supply-side policies. Column (3) shows that complementary STI policy intensity () has a positive effect on at the 5% significance level, with an estimated coefficient of 0.0609. Similarly, column (4) reveals that institutional reform–oriented STI policy intensity () is positively associated with at the 5% level, with a coefficient of 0.0929.
When all four types of STI policies are included simultaneously in column (5), only supply-side () and demand-side () policy intensities remain significantly positive, whereas the coefficients on complementary () and institutional reform–oriented () policies become statistically insignificant. This pattern suggests that supply-side and demand-side policies directly enhance urban carbon unlocking efficiency by simultaneously strengthening low-carbon technology supply and stimulating market demand. Specifically, supply-side policies reduce R&D costs and accelerate technological breakthroughs, while demand-side policies expand market demand through instruments such as green procurement, consumption subsidies, and carbon pricing, thereby facilitating the diffusion and adoption of low-carbon technologies. In contrast, complementary and institutional reform–oriented STI policies tend to operate through longer-term and indirect channels. Complementary policies primarily focus on building supporting service systems and innovation ecosystems, while institutional reform policies emphasize rule-setting and long-term incentive alignment. Their effects may require coordination between both supply and demand sides to materialize fully. As a result, when these policies are included alongside direct supply- and demand-side instruments, their immediate effects on urban carbon unlocking efficiency are less likely to be captured in the baseline specification. Overall, the baseline regression results provide strong empirical support for Hypothesis H1, confirming that greater intensity of heterogeneous STI policies—particularly supply-side and demand-side policies—significantly enhances urban carbon unlocking efficiency.
4.2. Endogeneity Treatment
The estimated relationship between heterogeneous STI policy intensity and urban carbon unlocking efficiency may be subject to potential endogeneity concerns. On the one hand, unobservable factors—such as local governance capacity or latent innovation culture—may simultaneously affect both STI policy intensity and urban carbon unlocking efficiency, leading to omitted variable bias. Although this study controls for a rich set of macroeconomic and city-level characteristics, the possibility of residual omitted variables cannot be fully ruled out. On the other hand, reverse causality may also arise: cities with higher carbon unlocking efficiency may be more likely to attract or implement stronger heterogeneous STI policies. While the baseline regression results indicate that heterogeneous STI policy intensity significantly enhances urban carbon unlocking efficiency, improvements in carbon unlocking efficiency may in turn feed back into policy formulation and intensity. To address these potential endogeneity issues, this study adopts an instrumental variable (IV) approach, which is widely used in the literature to mitigate endogeneity concerns [62].
4.2.1. Lagged Instrumental Variable Strategy
Following existing studies, lagged values of the explanatory variables are employed as instruments under the panel data setting [63]. The underlying rationale is that heterogeneous STI policy intensity exhibits a certain degree of persistence over time, such that policy intensity in the previous period is highly correlated with current policy intensity, while being plausibly exogenous to contemporaneous shocks to urban carbon unlocking efficiency. Accordingly, the one-period lag of heterogeneous STI policy intensity is used as the instrumental variable. This strategy has been widely adopted in recent empirical studies [64]. The corresponding IV estimation results are reported in Table 4. Diagnostic tests indicate that the Kleibergen–Paap rk LM statistic and the Cragg–Donald Wald F statistic strongly reject the presence of under-identification and weak instruments across all model specifications, confirming the validity and relevance of the selected instruments. After instrumenting heterogeneous STI policy intensity with its lagged value, the estimated effects of supply-side STI policy intensity ) and demand-side STI policy intensity () on urban carbon unlocking efficiency () remain significantly positive. In contrast, the effects of complementary STI policy intensity () and institutional reform–oriented STI policy intensity () remain statistically insignificant, consistent with the baseline regression results. Overall, these findings suggest that the main conclusions of this study are robust after accounting for potential endogeneity.
4.2.2. Alternative Instrumental Variable Strategy Based on University Student Scale
After using lagged heterogeneous STI policy intensity as an instrumental variable, this study further adopts an alternative identification strategy by employing the scale of university students in the region where firms are located as an instrumental variable, following Xu et al. (2022) [15]. The rationale for this instrument is twofold. First, regions with a higher concentration of universities tend to be focal areas for government innovation resource allocation. Such regions are more likely to introduce supporting supply-side policies—such as R&D subsidies and talent incentive programs—and to attract firms through abundant human capital, thereby facilitating the formulation and implementation of demand-side STI policies. As a result, the scale of university students is strongly correlated with the intensity of heterogeneous STI policies, satisfying the relevance condition of a valid instrument. Second, the scale of university students is primarily determined by historical patterns of educational resource allocation and higher-education enrollment planning. These factors are plausibly exogenous to contemporaneous shocks affecting urban carbon unlocking efficiency and are unlikely to influence carbon unlocking outcomes through channels other than STI policy intensity. Therefore, this instrument satisfies the exclusion restriction. Accordingly, this study constructs the instrumental variable as the interaction between the number of enrolled university students in the city and a linear time trend. The corresponding estimation results are reported in Table 5. Diagnostic tests based on the Kleibergen–Paap rk LM statistic and the Cragg–Donald Wald F statistic indicate that none of the model specifications suffer from under-identification or weak instrument problems, confirming the validity of the chosen instrument. After instrumenting heterogeneous STI policy intensity with the regional university student scale, the estimated effects of heterogeneous STI policies on urban carbon unlocking efficiency remain consistent with the baseline regression results. This finding suggests that the main conclusions of this study are robust after further addressing potential endogeneity concerns.
4.3. Robustness Checks
To verify the robustness of the baseline regression results, this study conducts a series of robustness checks using five alternative approaches, including replacing the measurement of the dependent variable, adopting alternative regression specifications, excluding directly administered municipalities, controlling for additional policy shocks, and accounting for public health emergencies. This subsection reports the results from replacing the measurement of the dependent variable.
4.3.1. Alternative Measurement of Urban Carbon Unlocking Efficiency
In the baseline analysis, urban carbon unlocking efficiency is calculated using the SBM approach, while environmental regulation—one of the key input variables—is proxied by a text-based measure derived from the frequency of environment-related terms in government work reports. To further enhance measurement robustness and mitigate potential bias arising from text-based indicators, this study employs an alternative measure of environmental regulation based on data from the Environmental Penalty Research Database (EPRD), which records officially disclosed environmental penalties at the city level. Specifically, environmental penalty data from the EPRD are used to reconstruct the environmental regulation input, and the SBM–GML model is subsequently applied to re-estimate urban carbon unlocking efficiency. Based on this alternative measurement, the baseline regression model is re-estimated to examine the effects of heterogeneous STI policy intensity on urban carbon unlocking efficiency. The corresponding results are reported in Table 6. The results indicate that, after replacing the measurement of urban carbon unlocking efficiency, supply-side STI policy intensity () and demand-side STI policy intensity () continue to exhibit significantly positive effects on urban carbon unlocking efficiency. In contrast, the estimated effects of complementary STI policy intensity () and institutional reform–oriented STI policy intensity () remain statistically insignificant. These findings are fully consistent with the baseline regression results, providing strong evidence for the robustness of the main conclusions.
4.3.2. Alternative Regression Model
Given the distributional characteristics of urban carbon unlocking efficiency, the dependent variable may be subject to censoring at the lower bound, which could lead to biased estimates under linear regression. To address this concern, and following Long et al. (2024) [65], this study adopts an alternative estimation strategy by re-estimating the baseline specification using a Tobit model. The estimation results are reported in Table 7. Consistent with the baseline regression findings, supply-side STI policy intensity () and demand-side STI policy intensity () continue to exhibit significantly positive effects on urban carbon unlocking efficiency (). In contrast, the estimated coefficients of complementary STI policy intensity () and institutional reform–oriented STI policy intensity () remain statistically insignificant, which is also in line with the baseline results. Overall, the consistency between the Tobit estimates and the baseline regression results indicates that the main conclusions are not sensitive to the choice of estimation method, thereby providing further support for the robustness of the empirical findings.
4.3.3. Alternative Sample
In the baseline analysis, the sample includes all prefecture-level cities, including the four centrally administered municipalities—Beijing, Tianjin, Shanghai, and Chongqing. However, compared with other prefecture-level cities, these municipalities exhibit substantial advantages in terms of economic scale, population size, land area, and administrative authority [47]. Including them in the full sample may therefore introduce potential bias in estimating the relationship between heterogeneous STI policy intensity and urban carbon unlocking efficiency. To address this concern, this study excludes the four centrally administered municipalities from the sample and re-estimates the baseline regression model. The corresponding results are reported in Table 8. The estimation results show that heterogeneous STI policy intensity continues to exert a significantly positive effect on urban carbon unlocking efficiency () after excluding Beijing, Tianjin, Shanghai, and Chongqing. Moreover, the estimated coefficients remain qualitatively consistent with those obtained from the baseline regressions. Overall, these findings suggest that the main conclusions are not driven by the inclusion of centrally administered municipalities, providing further evidence for the robustness of the empirical results.
4.3.4. Excluding the Influence of Other Policy Interventions
Since 2008, China has successively launched pilot programs for innovation-oriented cities, and by 2022, a total of 103 cities (districts) had been approved as pilot areas [15]. These pilot cities typically receive preferential policy support and greater resource allocation, which may independently enhance urban carbon unlocking efficiency through pilot-related policy dividends rather than through general STI policies. As a result, failing to account for innovation-city pilot programs may confound the estimated effects of heterogeneous STI policy intensity. To address this concern and isolate the effect of baseline STI policies, this study further controls for the potential influence of innovation-oriented city pilot programs. Specifically, cities designated as innovation-oriented pilots are excluded from the sample, and the baseline regression model is re-estimated. The corresponding results are reported in Table 9. The estimation results indicate that, after controlling for innovation-oriented city pilot policies, the estimated effects of heterogeneous STI policy intensity on urban carbon unlocking efficiency remain consistent with the baseline regression results. This finding suggests that the main conclusions are not driven by the presence of innovation-oriented city pilot programs, thereby providing further evidence for the robustness of the empirical findings.
4.3.5. Excluding Years Affected by Major Exogenous Events
Studies examining the effects of innovation policies on urban carbon unlocking efficiency inevitably involve the period affected by the COVID-19 pandemic. However, pandemic-related shocks may introduce external disturbances to the estimated relationship between heterogeneous STI policies and urban carbon unlocking efficiency. On the one hand, containment measures implemented during the pandemic—such as production shutdowns, mobility restrictions, and traffic controls—may have temporarily reduced energy consumption and carbon emissions, leading to an artificial increase in measured carbon unlocking efficiency and potentially masking the true effects of STI policies. On the other hand, governments introduced temporary countercyclical measures during the pandemic, including short-term fiscal stimulus and green recovery policies, which may have interacted with existing STI policies and biased the evaluation of their effectiveness. To ensure the accuracy and reliability of the empirical results, this study excludes the pandemic years 2020 and 2021 from the sample and re-estimates the baseline regression model. The corresponding results are reported in Table 10. The estimation results show that, after excluding pandemic-affected years, the effects of heterogeneous STI policies—namely , , and —on urban carbon unlocking efficiency () remain consistent with those obtained from the baseline analysis. Overall, these findings indicate that the main conclusions of this study are not driven by pandemic-related shocks, thereby further confirming the robustness of the empirical results.
4.4. Heterogeneity Analysis
Baseline regression results indicate that increasing the intensity of heterogeneous STI policies significantly enhances urban carbon unlocking efficiency. However, China exhibits substantial regional disparities in economic foundations, pollution intensity, and energy consumption patterns [65], which may lead to heterogeneous policy effects across cities. To comprehensively examine whether and how heterogeneous STI policy intensity affects urban carbon unlocking efficiency under different regional conditions, this study conducts heterogeneity analyzes along two dimensions: urban pollution intensity and energy consumption intensity.
4.4.1. Heterogeneity by Urban Pollution Intensity
To investigate whether the effects of heterogeneous STI policy intensity vary with urban pollution conditions, this study measures urban pollution intensity as the ratio of city-level carbon dioxide emissions to gross regional product. Cities are then divided into high- and low-pollution groups based on the median value (P50) of pollution intensity. Using a group-wise regression approach, this study examines differences in the effects of heterogeneous STI policy intensity on urban carbon unlocking efficiency across pollution regimes. The corresponding results are reported in Table 11. Columns (1) and (2) show that supply-side STI policy intensity () exerts a significantly positive effect on urban carbon unlocking efficiency () in both high- and low-pollution cities. A coefficient difference test further indicates that the effect of supply-side policies does not significantly differ across pollution levels. This finding suggests that technological innovation supported by supply-side policies constitutes a universal foundation for carbon unlocking, regardless of the initial pollution intensity of a city. In contrast, columns (3)–(8) reveal pronounced heterogeneity in the effects of demand-side (), complementary (), and institutional reform–oriented () STI policies. Based on coefficient estimates and corresponding statistical tests, these policy effects are significantly stronger in low-pollution cities than in high-pollution cities. This pattern can be explained by differences in industrial structure, market conditions, and institutional environments. From the perspective of supply-side policies, technological innovation plays a central role in carbon unlocking across all pollution regimes: in high-pollution cities, low-carbon technological breakthroughs are critical for mitigating emissions from heavy industrial sectors, while in low-pollution cities, technological upgrading primarily improves energy efficiency and production processes. By contrast, the regional heterogeneity of non-supply-side policies is more pronounced. Low-pollution cities tend to have lighter industrial structures, higher levels of marketization, and more mature innovation ecosystems, allowing demand-side policies (e.g., green procurement) to rapidly stimulate market demand, complementary policies (e.g., science–finance coordination) to efficiently allocate innovation resources, and institutional reform–oriented policies (e.g., carbon trading rules) to be effectively enforced. These conditions are consistent with Nordhaus’s (2019) argument that emission reduction efficiency depends on policy–market coordination [66]. In contrast, high-pollution cities are often constrained by heavy industrial inertia, weak market demand for low-carbon products, and high institutional implementation costs, which limit the short-term effectiveness of demand-side, complementary, and institutional reform–oriented STI policies. As a result, non-supply-side policies are less able to translate into immediate improvements in urban carbon unlocking efficiency in highly polluted regions.
4.4.2. Heterogeneity by Energy Consumption Intensity
To examine whether the effect of heterogeneous STI policy intensity on urban carbon unlocking efficiency varies with cities’ energy consumption conditions, this study classifies cities into high energy-intensity and low energy-intensity groups based on the median (P50) of energy consumption intensity. A coefficient-difference approach is then employed to assess heterogeneity in the effects of heterogeneous STI policies across the two groups. The corresponding results are reported in Table 12. The results indicate that, based on empirical p-values, the effects of supply-side STI policy intensity () and demand-side STI policy intensity () on urban carbon unlocking efficiency () are significantly stronger in high energy-intensity cities. In contrast, the effects of complementary STI policy intensity () and institutional reform–oriented STI policy intensity () are more pronounced in low energy-intensity cities. This heterogeneity can be explained by differences in industrial structure, technological constraints, and institutional environments. High energy-intensity cities are typically dominated by heavy and energy-intensive industries, where carbon reduction critically depends on technological breakthroughs that relax binding constraints on energy use and emissions. In this context, supply-side policies—such as R&D subsidies—accelerate the deployment of low-carbon technologies, while demand-side policies facilitate firm-level transformation by stimulating market demand. This mechanism is consistent with Acemoglu et al.’s (2012) theory of directed technical change, which emphasizes the role of targeted innovation policies in steering technological progress toward cleaner technologies [67]. The stronger mitigation effects observed in high energy-intensity cities thus reflect the higher marginal returns to technology-oriented policy interventions. By contrast, low energy-intensity cities tend to exhibit more advanced industrial structures and relatively lower dependence on energy-intensive production. In these cities, the focus of carbon unlocking shifts toward improving innovation ecosystems and strengthening institutional arrangements. Complementary policies enhance the efficiency of technology diffusion and resource coordination, while institutional reform–oriented policies stabilize emission-reduction expectations and improve regulatory enforcement. This pattern aligns with the view that emission reduction effectiveness depends on policy–market coordination and institutional capacity, and is consistent with Pizer et al. (2021) [68], who show that regions with lower emission intensity are better positioned to realize mitigation potential through institutional and regulatory channels.
5. Mechanism Analysis of the Effects of Heterogeneous STI Policy Intensity on Urban Carbon Unlocking Efficiency
Based on the preceding theoretical analysis, regional digital infrastructure development, the level of science and technology finance, and government green attention are expected to shape the relationship between heterogeneous STI policy intensity and urban carbon unlocking efficiency. Following Edwards and Lambert (2007)[69], a moderated regression model is constructed as follows:
Where denotes the dependent variable, measuring the urban carbon unlocking efficiency of city in year . , , , and are the core explanatory variables, capturing the intensity of heterogeneous STI policies in city iii at time ttt, including supply-side policies, demand-side policies, complementary-factor policies, and institutional reform policies, respectively. , , and are moderating variables, representing the level of regional digital infrastructure development, the development of science and technology finance, and government green attention. denotes a vector of control variables consistent with the baseline regression. Year fixed effects and city fixed effects are denoted by and , respectively. The error term is assumed to follow a normal distribution, .
Regarding the measurement of regional digital infrastructure development (), this study follows the approach of Chao et al. (2021) [70]. Specifically, government work reports of prefecture-level cities from 2009 to 2023 are first collected, and keywords related to new digital infrastructure are identified. Python is then employed to conduct text segmentation and frequency analysis of the reports, calculating both the total number of words and the frequency of digital-infrastructure-related terms. The ratio of digital infrastructure keywords to total words is used as a baseline indicator. Considering the strong correlation between digital infrastructure development and employment in information-related sectors, the baseline indicator is further weighted by the share of information industry employment in the total population of each city. The interaction of these two components is taken as a comprehensive measure of regional digital infrastructure development. The level of science and technology finance development () is measured by the logarithm of the number of newly registered technology-oriented enterprises at the prefecture-level city. Government green attention () is proxied using text analysis of government work reports. Specifically, keywords related to green development are identified, and Python is used to compute their frequencies. The ratio of green-related keywords to total word count in each report is employed to capture the intensity of government green attention.
5.1. Mechanism Test: Regional Digital Infrastructure Development
Table 13 reports the mechanism test results concerning the role of regional digital infrastructure development in moderating the relationship between heterogeneous STI policy intensity and urban carbon unlocking efficiency. The results indicate that the interaction between regional digital infrastructure development () and supply-side STI policy intensity () is positive and statistically significant at the 1% level. This finding suggests that a higher level of digital infrastructure development strengthens the positive effect of supply-side policies on urban carbon unlocking efficiency. Similarly, the interaction term between digital infrastructure development and demand-side STI policy intensity () is significantly positive at the 10% level, indicating that well-developed digital infrastructure also amplifies the effectiveness of demand-side policies in promoting carbon unlocking efficiency. In contrast, the interaction between digital infrastructure development and complementary-factor STI policy intensity () is statistically insignificant, implying that digital infrastructure does not significantly condition the effect of complementary-factor policies on urban carbon unlocking efficiency. Finally, the interaction term between digital infrastructure development and institutional-reform STI policy intensity () is positive and significant at the 5% level, suggesting that digital infrastructure development enhances the effectiveness of institutional reform policies in improving urban carbon unlocking efficiency. Taken together, these results indicate that regional digital infrastructure development plays a significant moderating role in the relationship between heterogeneous STI policy intensity and urban carbon unlocking efficiency. By improving factor mobility and information transmission efficiency, digital infrastructure functions as a “transmission amplifier,” thereby strengthening the carbon-unlocking effects of STI policies. This evidence provides empirical support for Hypothesis H2a.
5.2. Mechanism Test: Regional Science and Technology Finance Development
Table 14 presents the mechanism test results regarding the moderating role of regional science and technology finance development in the relationship between heterogeneous STI policy intensity and urban carbon unlocking efficiency. The results show that the interaction term () between regional science and technology finance development () and supply-side STI policy intensity () is positive and statistically significant at the 1% level. This finding indicates that a higher level of science and technology finance development strengthens the positive effect of supply-side policies on urban carbon unlocking efficiency by enhancing financial support for low-carbon technological innovation. Similarly, the interaction between science and technology finance development and demand-side STI policy intensity () is significantly positive at the 1% level, suggesting that well-developed science and technology finance systems amplify the effectiveness of demand-side policies in stimulating market demand for low-carbon technologies and accelerating their diffusion. Moreover, the interaction term between science and technology finance development and complementary-factor STI policy intensity () is also positive and statistically significant at the 1% level. This result implies that science and technology finance development enhances the coordination effect of complementary-factor policies by facilitating resource matching and reducing financing constraints along the innovation chain. Finally, the interaction between science and technology finance development and institutional-reform STI policy intensity () is positive and significant at the 1% level, indicating that science and technology finance development reinforces the effectiveness of institutional reform policies by strengthening the financial foundations for policy implementation and long-term innovation incentives. Taken together, these findings demonstrate that regional science and technology finance development plays a significant positive moderating role in the relationship between heterogeneous STI policy intensity and urban carbon unlocking efficiency. By reinforcing financial support and mitigating innovation-related risks, science and technology finance functions as a “resource catalyst,” thereby amplifying the carbon-unlocking effects of heterogeneous STI policies. These results provide strong empirical support for Hypothesis H2b.
5.3. Mechanism Test: Government Green Attention
Table 15 reports the mechanism test results concerning the moderating role of government green attention in the relationship between heterogeneous STI policy intensity and urban carbon unlocking efficiency. The empirical results indicate that the interaction () between government green attention () and supply-side STI policy intensity () is positive and statistically significant at the 1% level. This finding suggests that a higher level of government green attention strengthens the effectiveness of supply-side policies in promoting urban carbon unlocking efficiency by enhancing policy enforcement and prioritizing low-carbon technological innovation. Similarly, the interaction term between government green attention and demand-side STI policy intensity () is significantly positive at the 1% level. This result implies that strong governmental emphasis on green development amplifies the impact of demand-side policies by improving policy credibility, increasing public awareness, and facilitating the market diffusion of low-carbon products. Moreover, the interaction between government green attention and complementary-factor STI policy intensity () is also positive and statistically significant at the 1% level. This finding indicates that heightened government green attention enhances the coordination effect of complementary policies by reducing administrative fragmentation and improving cross-departmental policy alignment, thereby strengthening their contribution to carbon unlocking efficiency. Finally, the interaction term between government green attention and institutional-reform STI policy intensity () is positive and significant at the 1% level. This result suggests that strong government green attention reinforces the effectiveness of institutional reform policies by improving regulatory enforcement, increasing compliance incentives, and mitigating institutional inertia associated with high-carbon development paths. Overall, these results demonstrate that government green attention plays a significant positive moderating role in the relationship between heterogeneous STI policy intensity and urban carbon unlocking efficiency. By strengthening policy enforcement, enhancing coordination, and improving institutional credibility, government green attention functions as an institutional safeguard that amplifies the carbon-unlocking effects of heterogeneous STI policies. These findings provide robust empirical support for Hypothesis H2c.
6. Spatial Effects of Heterogeneous STI Policy Intensity on Urban Carbon Unlocking Efficiency
The preceding analyzes indicate that heterogeneous STI policy intensity significantly promotes urban carbon unlocking efficiency. However, given the strong interregional linkages across Chinese cities, urban carbon unlocking efficiency may exhibit spatial dependence. Meanwhile, increases in heterogeneous STI policy intensity in one city may influence not only local carbon unlocking outcomes but also those of neighboring cities through factor mobility, policy diffusion, and interregional interactions. Therefore, building on the baseline and mechanism analyzes, this section incorporates spatial interaction effects into the analytical framework to examine whether heterogeneous STI policy intensity generates spatial spillover effects on urban carbon unlocking efficiency. By explicitly modeling spatial dependence, this analysis aims to provide a more comprehensive assessment of the overall policy impact and to further verify the role of heterogeneous STI policies in shaping regional carbon unlocking dynamics.
6.1. Specification of the Spatial Econometric Model
From the perspective of spatial econometric modeling, commonly used specifications include the spatial autoregressive model (SAR), the spatial error model (SEM), and the spatial Durbin model (SDM). LeSage and Pace (2009) argue that, compared with SAR and SEM, the SDM offers greater flexibility by simultaneously capturing spatial dependence in both the dependent variable and explanatory variables [71], thereby effectively mitigating omitted-variable bias arising from unobserved spatial spillovers. Following this rationale, and drawing on the empirical strategy of Jia et al. (2021), this study employs the spatial Durbin model to investigate the spatial effects of heterogeneous STI policy intensity on urban carbon unlocking efficiency [72]. In the empirical analysis, Wald tests are further conducted to verify the appropriateness of the SDM specification. Accordingly, the spatial Durbin model is specified as follows:
Where denotes the dependent variable, representing the urban carbon unlocking efficiency of city in year . , , , and are the core explanatory variables, capturing the intensity of heterogeneous STI policies in city in year , including supply-side, demand-side, complementary-factor, and institutional-reform policy intensity, respectively. represents the vector of control variables, which is consistent with the baseline regression specification. denotes the spatial weight matrix. Accordingly, , , , and represent the spatially lagged terms of heterogeneous STI policy intensity, reflecting the spillover effects of supply-side, demand-side, complementary-factor, and institutional-reform policies across neighboring cities. Similarly, represents the spatial lag of urban carbon unlocking efficiency, capturing spatial dependence in the dependent variable. Following Xu and Zhang (2017) [73], this study incorporates economic proximity into the construction of the spatial weight matrix and adopts an economic-distance-based spatial weight matrix. Specifically, economic distance is embedded into the geographical framework to better capture spatial interactions driven by economic similarity rather than purely physical distance.
Where denotes the inverse of the straight-line Euclidean distance between city and city .represents the average GDP of the city over the observation period; denotes the average GDP of all cities during the observation period. The geographical data used to construct the spatial weight matrix are obtained from the National Geomatics Center of China.
6.2. Spatial Autocorrelation Test
To further verify whether urban carbon unlocking efficiency exhibits spatial dependence, a spatial autocorrelation test is conducted. Table 16 reports the Moran’s I statistics for urban carbon unlocking efficiency. The results show that, under the economic–geographical distance-based spatial weight matrix, urban carbon unlocking efficiency does not exhibit significant spatial autocorrelation in 2010 and 2011. However, from 2012 to 2023, the Moran’s I statistics are significantly positive, indicating the presence of positive spatial dependence in urban carbon unlocking efficiency across Chinese cities. Overall, the Moran’s I statistics for the period 2010–2023 are predominantly positive and statistically significant, although their magnitudes fluctuate over time. This pattern suggests that urban carbon unlocking efficiency is not randomly distributed across space, but instead displays evolving spatial dependence and clustering characteristics. The observed spatial agglomeration implies that neighboring cities tend to exhibit similar levels of carbon unlocking efficiency, highlighting the necessity of explicitly accounting for spatial interactions when assessing the effects of heterogeneous STI policies.
6.3. Spatial Spillover Effects of Heterogeneous STI Policy Intensity on Urban Carbon Unlocking Efficiency
Based on the spatial analysis of urban carbon unlocking efficiency, the results indicate that urban carbon unlocking efficiency exhibits significant spatial effects. Accordingly, this section further employs the spatial Durbin model (SDM) to empirically examine the spatial spillover effects of heterogeneous STI policy intensity on urban carbon unlocking efficiency. Following Jia et al. (2021) [72], Wald tests are conducted to assess the appropriateness of the SDM specification. The results reported in Table 17 show that both the Wald SAR and Wald SEM test statistics are statistically significant, indicating that the SDM cannot be simplified into either the spatial autoregressive model (SAR) or the spatial error model (SEM). This confirms the suitability of adopting the SDM for the spatial analysis. In addition, the goodness-of-fit statistics, including , and , suggest that the estimated models exhibit satisfactory explanatory power and reliability, providing mutual support for the robustness of the empirical results. Moreover, the spatial autoregressive coefficient () is statistically significant at conventional confidence levels (above the 10% significance level), indicating the presence of significant spatial spillover effects in the relationship between heterogeneous STI policy intensity and urban carbon unlocking efficiency. Specifically, the estimated coefficients of supply-side STI policy intensity (), demand-side STI policy intensity (Policy_D), complementary-factor STI policy intensity (Policy_C), and institutional-reform STI policy intensity (Policy_I) are all positive and statistically significant. These results imply that, after explicitly accounting for spatial interactions, heterogeneous STI policy intensity continues to exert a positive effect on urban carbon unlocking efficiency. Overall, the findings confirm that heterogeneous STI policies not only enhance local carbon unlocking performance but also generate positive spatial spillover effects across neighboring cities.
The above results indicate that, after accounting for spatial dependence, heterogeneous STI policy intensity continues to exert a positive effect on urban carbon unlocking efficiency. However, the baseline spatial regression does not explicitly distinguish between the effects of heterogeneous STI policies on local cities and their impacts on neighboring cities. Therefore, following LeSage and Pace (2009) [71], this study further decomposes the spatial Durbin model (SDM) to obtain the direct effects, indirect effects, and total effects of heterogeneous STI policy intensity on urban carbon unlocking efficiency. The estimation results are reported in Table 18. The results in column (1) show that the indirect effect of supply-side STI policy intensity () on urban carbon unlocking efficiency () is significantly positive. This finding suggests that, while supply-side policies enhance carbon unlocking efficiency in the local city, they also generate positive spatial spillover effects that significantly improve carbon unlocking efficiency in neighboring cities. Column (2) reports that the indirect effect of demand-side STI policy intensity () on urban carbon unlocking efficiency () is not statistically significant, indicating a lack of empirical evidence supporting the existence of significant spatial spillover effects associated with demand-side policies. Column (3) shows that the indirect effect of complementary-factor STI policy intensity () on urban carbon unlocking efficiency () is significantly negative. This result implies that increases in complementary-factor policy intensity may inhibit improvements in carbon unlocking efficiency in surrounding cities, possibly due to resource reallocation or competitive effects. Finally, the results in column (4) indicate that the indirect effect of institutional-reform STI policy intensity () on urban carbon unlocking efficiency () is significantly positive. This finding suggests that institutional reform policies not only enhance local carbon unlocking efficiency but also promote improvements in neighboring cities through positive spatial spillover effects.
7. Conclusions and Policy Implications
As digital technologies such as big data increasingly reshape resource allocation processes, understanding how heterogeneous science and technology innovation (STI) policy intensity influences urban carbon unlocking efficiency has become a critical issue for achieving low-carbon and high-quality urban development. Against this backdrop, this paper investigates the effects of heterogeneous STI policy intensity on urban carbon unlocking efficiency using panel data for 286 prefecture-level cities in China over the period 2009–2023. The analysis proceeds in several steps. First, the theoretical foundations and transmission mechanisms through which heterogeneous STI policies affect urban carbon unlocking efficiency are articulated. Second, the relationship between heterogeneous STI policy intensity and urban carbon unlocking efficiency is empirically examined, with heterogeneity analyzes conducted along pollution intensity and energy consumption intensity dimensions. Third, the moderating roles of regional digital infrastructure development, science and technology finance development, and government green attention are explored. Finally, spatial dependence is explicitly incorporated into the empirical framework to assess the spatial spillover effects of heterogeneous STI policies on urban carbon unlocking efficiency.
The main findings can be summarized as follows. First, baseline regression results show that all four types of heterogeneous STI policy intensity—supply-side, demand-side, complementary-factor, and institutional-reform policies—significantly promote urban carbon unlocking efficiency, with institutional-reform policies exhibiting the largest marginal effect. When all four policy types are included simultaneously, only supply-side and demand-side policies remain statistically significant, while the direct effects of complementary-factor and institutional-reform policies become insignificant, likely due to their lagged effects and stronger dependence on policy coordination. A series of endogeneity treatments and robustness checks confirm the stability of these core conclusions. Second, heterogeneity analyzes reveal notable regional differences. From the perspective of pollution intensity, the effects of supply-side policies do not differ significantly between high- and low-pollution regions, whereas demand-side, complementary-factor, and institutional-reform policies are more effective in low-pollution regions. From the perspective of energy consumption intensity, supply-side and demand-side policies exert stronger effects in high-energy-consumption regions, while complementary-factor and institutional-reform policies play a more prominent role in low-energy-consumption regions. Third, mechanism analyzes indicate that regional digital infrastructure development acts as a “transmission amplifier” by improving factor mobility, science and technology finance development functions as a “resource catalyst” by strengthening financial support, and government green attention serves as an “institutional safeguard” by enhancing policy enforcement. Together, these factors positively moderate the relationship between heterogeneous STI policy intensity and urban carbon unlocking efficiency, significantly amplifying the effectiveness of all types of innovation policies. Fourth, spatial analyzes show that urban carbon unlocking efficiency exhibits significant spatial autocorrelation. Results from the spatial Durbin model indicate that all four types of STI policies significantly enhance local carbon unlocking efficiency. Further decomposition of spatial effects reveals that supply-side and institutional-reform policies generate positive spatial spillover effects, demand-side policies do not exhibit significant spillovers, and complementary-factor policies produce negative spatial spillover effects.
The findings provide strong empirical support for the role of heterogeneous STI policy intensity in promoting urban carbon unlocking efficiency and yield several important policy implications. First, given the differentiated effects of heterogeneous STI policies, policymakers should construct a coordinated policy mix characterized by “supply–demand leadership and complementary–institutional synergy.” On the one hand, supply-side and demand-side policies should be strengthened as direct drivers. On the supply side, increasing R&D subsidies, improving innovation infrastructure, and cultivating high-skilled technical talent can reduce the costs of green technology development and accelerate low-carbon technology commercialization [74]. On the demand side, expanding green public procurement, improving carbon pricing mechanisms, and enhancing low-carbon consumption subsidies can stimulate market demand and better align technological supply with carbon unlocking needs [75,76]. On the other hand, the lagged effects of complementary-factor and institutional-reform policies should be addressed. This requires building cross-departmental innovation service platforms to integrate intellectual property protection, technology transfer, and related services, as well as establishing long-term evaluation mechanisms for institutional reforms. Strengthening coordination between these policies and supply- and demand-side instruments—such as embedding low-carbon R&D requirements into fiscal subsidy schemes or incorporating green market demand indicators into carbon trading rules—can activate their indirect enabling effects. In addition, dynamic policy monitoring systems should be established to regularly assess marginal effects and policy synergies, allowing timely adjustments in policy intensity and implementation rhythm.
Second, greater emphasis should be placed on reinforcing the enabling roles of digital infrastructure, science and technology finance, and government green attention. In terms of digital infrastructure, accelerating the deployment of 5G networks, industrial internet platforms, and other new digital infrastructures—particularly in economically less developed regions—can help narrow the digital divide. Promoting data openness and sharing among government departments can further facilitate precise policy targeting and dynamic adjustment, for example by using digital platforms to deliver R&D subsidy information directly to low-carbon technology firms. In terms of science and technology finance, a multi-tiered support system combining green credit, venture capital, and carbon finance instruments should be developed. This includes encouraging banks to offer dedicated loans for low-carbon technology R&D, establishing government-guided green innovation funds, and piloting new instruments such as carbon-backed financing and carbon options to expand green financing channels for technology-oriented enterprises [77,78]. Regarding government green attention, incorporating carbon unlocking efficiency into local government performance evaluation systems can strengthen enforcement incentives. Increasing the prominence of green development themes in government work reports and embedding low-carbon technology requirements into public procurement standards can further amplify the carbon-unlocking effects of innovation policies through administrative guidance.
Third, differentiated policy strategies should be implemented based on regional differences in pollution intensity and energy consumption intensity. For high-pollution regions, supply-side policies should continue to focus on breaking technological bottlenecks in industrial emission reduction, such as establishing pilot platforms for low-carbon technologies in heavy industrial clusters. For low-pollution regions, greater emphasis should be placed on demand-side, complementary-factor, and institutional-reform policies, leveraging lighter industrial structures to stimulate green consumption, improve technology transfer ecosystems, and optimize emission reduction governance through flexible institutional arrangements. From the perspective of energy consumption intensity, high-energy-consumption regions should prioritize coordinated supply-side and demand-side interventions, combining R&D subsidies with carbon pricing mechanisms to promote energy efficiency improvements. Low-energy-consumption regions, by contrast, should focus on optimizing complementary-factor and institutional-reform policies, building collaborative low-carbon innovation networks and strengthening regional coordination in carbon trading markets. Finally, interregional policy coordination mechanisms should be established. These would facilitate knowledge sharing between regions with high and low levels of pollution and energy consumption, promote cross-regional learning, and support the adaptive diffusion of effective innovation policy practices.
Author Contributions
Conceptualization, J.L. and M.Y.; methodology, J.L.; software, J.L.; validation, J.L.; formal analysis, J.L.; investigation, J.L.; resources, M.Y.; data curation, J.L.; writing—original draft preparation, J.L.; writing—review and editing, M.Y.; visualization, J.L.; supervision, M.Y.; project administration, M.Y.; funding acquisition, M.Y.. All authors have read and agreed to the published version of the manuscript.
Funding
This research was funded by National Social Science Fund of China, grant number 24XJY028.
Institutional Review Board Statement
Not applicable.
Informed Consent Statement
Not applicable.
Data Availability Statement
Dataset available on request from the authors.
Conflicts of Interest
The authors declare no conflicts of interest.The funders had no role in the design of the study; in the collection, analyses, or interpretation of data; in the writing of the manuscript; or in the decision to publish the results.
References
- David, J. M.; Venkateswaran, V. The Sources of Capital Misallocation. The American Economic Review 2019, 109(7), 2531-2567. [CrossRef]
- Chen, Y,; Luo, Q. I.; Ma, C. Carbon unlocking efficiency study based on super-efficiency SBM-Malmquist. RAIRO-Operations Research 2024, 58(1), 457-474. [CrossRef]
- Weng, S.; Tao, W.; Lu, Y .Unlocking the carbon emission efficiency improvement path of technological innovation: a perspective on industrial restructuring and R&D element flows. Environmental Science & Pollution Research 2024, 31(14), 21189-21207. [CrossRef]
- Liu,Y.; Zhao, C.; Dong, K.; Wang, K.; Sun, L. How does green finance achieve urban carbon unlocking? Evidence from China. Urban Climate 2023, 101742. [CrossRef]
- Zhang, D.; Guo, Y.; Taghizadeh-Hesary, F. Green finance and energy transition to achieve net-zero emission target. Energy Economics 2023, 106936. [CrossRef]
- Kyriakopoulou, D.; Xia, L. Q.; Xie, C. Internationalism in Climate Action and China’s Role. Progress in Energy 2023, 5(2), 022001. [CrossRef]
- Davidson, M. R. Managing the Decline of Coal in a Decarbonizing China. Wiley Interdisciplinary Reviews: Climate Change 2024, 15(6), e918. [CrossRef]
- Zhong, X. W.; Yang, X. D. Science and Technology Policy Reform and Its Impact on China’s National Innovation System. Technology in Society 2007, 29(3), 317-325.
- Wang, P.; Li, F. Science, Technology and Innovation Policy in Russia and China–Mapping and Comparisons in Objectives, Instruments and Implementation. Technological Forecasting and Social Change 2021, 162, 120386. [CrossRef]
- Zhao, F.; Hu, Z.; Zhao, X. Does Innovative City Construction Improve Urban Carbon Unlocking Efficiency? Evidence from China. Sustainable Cities and Society 2023, 92, 104494. [CrossRef]
- Javed, S. A.; Bo, Y.; Tao, L. The ‘Dual Circulation’ Development Model of China: Background and Insights. Rajagiri Management Journal 2023, 17(1), 2-20.
- Morlacchi, P.; Martin, B. R. Emerging challenges for science, technology and innovation policy research: A reflexive overview. Research policy 2009, 38(4), 571-582. [CrossRef]
- Padilla-Pérez, R.; Gaudin. Y. Science, technology and innovation policies in small and developing economies: The case of Central America. Research Policy 2014, 43(4), 749-759. [CrossRef]
- Wang, H.; Cui, H.; Zhao, Q. Effect of green technology innovation on green total factor productivity in China: Evidence from spatial durbin model analysis. Journal of Cleaner Production 2021, 288, 125624. [CrossRef]
- Xu, H.; Liu, B.; Lin, K.; et al. Towards carbon neutrality: carbon emission performance of science and technology finance policy. International Journal of Environmental Research and Public Health 2022, 19(24), 16811. [CrossRef]
- Schot, J.; Steinmueller, W. E. Three frames for innovation policy: R&D, systems of innovation and transformative change. Research Policy 2018, 47(9), 1554-1567. [CrossRef]
- Zhao, F.; Hu, Z.; Zhao, X. Does innovative city construction improve urban carbon unlocking efficiency? Evidence from China. Sustainable Cities and Society 2023, 92, 104494. [CrossRef]
- Unruh, G. C. Escaping Carbon Lock-In. Energy Policy 2002, 30(4), 317-325. [CrossRef]
- Seto, K. C.; Davis, S. J.; Mitchell, R. B.; et al. Carbon Lock-In: Types, Causes, and Policy Implications. Annual Review of Environment and Resources 2016, 41(1), 425-452. [CrossRef]
- Akcigit, U.; Hanley, D.; Serrano-Velarde, N. Back to basics: Basic research spillovers, innovation policy, and growth. The Review of Economic Studies 2021, 88(1), 1-43. [CrossRef]
- Borrás, S.; Edquist, C. The choice of innovation policy instruments. Technological Forecasting and Social Change 2021, 80(8), 1513-1522. [CrossRef]
- Edquist, C. The Systems of Innovation Approach and Innovation Policy: An account of the state of the art. DRUID Conference, Aalborg 2001, 12, 15.
- Fan, R.; Chen, R.; Wang, Y.; et al. Simulating the Impact of Demand-Side Policies on Low-Carbon Technology Diffusion: A Demand-Supply Coevolutionary Model. Journal of Cleaner Production 2022, 351, 131561. [CrossRef]
- Edler, J. Demand-based innovation policy. The Theory and Practice of Innovation Policy. Edward Elgar Publishing, 2010.
- Boon, W.; Edler, J. Demand, challenges, and innovation. Making sense of new trends in innovation policy. Science and Public Policy 2018, 45(4), 435-447. [CrossRef]
- Mohnen, P.; Röller, L. H. Complementarities in innovation policy. European Economic Review 2005, 49(6), 1431-1450.
- Smits, R.; Kuhlmann, S. The rise of systemic instruments in innovation policy. International Journal of Foresight and Innovation Policy 2004, 1(1-2), 4-32. [CrossRef]
- Chaminade, C.; Edquist, C. From theory to practice: the use of the systems of innovation approach in innovation policy. Innovation, Science, and Institutional Change: A Research Handbook 2006, 141-163.
- Pan, Y.; Yang, M. Y. Research on the Impact of Digital Infrastructure on the Allocation Efficiency of Green Resources in the Service Industry. American Journal of Economics and Sociology 2024, 83(1), 223-247. [CrossRef]
- Lu, Y.; Zhuang, J.; Yang, C.; et al. How the Digital Economy Promotes Urban–Rural Integration Through Optimizing Factor Allocation: Theoretical Mechanisms and Evidence from China. Frontiers in Sustainable Food Systems 2025, 9, 1494247. [CrossRef]
- Tobler, W. R. A computer movie simulating urban growth in the Detroit region. Economic Geography 1970, 46(sup1), 234-240. [CrossRef]
- Kirschning, R.; Mrożewski, M. Revisiting the Knowledge Spillover Paradox: The Impact of Infrastructure. Small Business Economics 2024, 63(1), 1-20. [CrossRef]
- Chen, Y.; Luo, Q. I.; Ma, C. S. Carbon Unlocking Efficiency Study Based on Super-Efficiency SBM-MALMQUIST. RAIRO Operations Research 2024, 58(1), 457-474. [CrossRef]
- Yang, Z.; Zhang, J. Digital Infrastructure Construction and the Development of New-Quality Productive Forces in Enterprises. Scientific Reports 2025, 15(1), 24671. [CrossRef]
- Xia, F.; Xu, J. Green total factor productivity: A re-examination of quality of growth for provinces in China. China Economic Review 2020, 62(8), 101454. [CrossRef]
- Guo, B.; Hu, P.; Lin, J. The Effect of Digital Infrastructure Development on Enterprise Green Transformation. International Review of Financial Analysis 2024, 92, 103085. [CrossRef]
- Shen, N.; Zhang, G.; Zhou, J.; et al. Can big data policy drive urban carbon unlocking efficiency? A new approach based on double machine learning. Journal of Environmental Management 2024, 372, 123296. [CrossRef]
- Tu, C.; Xie, Y.; Li, Y.; et al. Carbon unlocking strategy analysis of China’s iron and steel industry based on evolutionary game theory. Journal of Cleaner Production 2025, 523, 146455. [CrossRef]
- Jaffe, A. B.; Stavins, R. N. Dynamic incentives of environmental regulations: The effects of alternative policy instruments on technology diffusion. Journal of Environmental Economics and Management 1995, 29(3), S43-S63. [CrossRef]
- Becker, B. Public R&D Policies and Private R&D Investment: A Survey of the Empirical Evidence. Journal of Economic Surveys 2015, 29(5), 917-942. [CrossRef]
- Guan, Y.; Shan, Y.; Hang, Y.; et al. Unlocking global carbon reduction potential by embracing low-carbon lifestyles. Nature Communications 2025, 16(1), 4599. [CrossRef]
- Chen, X.; An, T.; Liu, Y.; et al. Exploring the Role of Science and Technology Finance in Carbon Emissions Reduction: Evidence from China. Climatic Change 2025, 178(8), 157. [CrossRef]
- Liu, Y.; Wang, J. Unlocking Sustainable Growth in Urban Agglomerations: A Case Study of Carbon Emissions Trading in China. Sustainability 2024, 16(20), 8808. [CrossRef]
- Man, H.; Sun, Y.; Wang, X.; et al. Effect of Government Environmental Attention on Green Transformation: Empirical Analysis from a Spatiotemporal Perspective in China. Journal of Cleaner Production 2024, 473, 143595. [CrossRef]
- Shen, M.; Ma, N.; Chen, Q. Has Green Finance Policy Promoted Ecologically Sustainable Development Under the Constraints of Government Environmental Attention? Journal of Cleaner Production 2024, 450, 141854. [CrossRef]
- Liu, Z.; Tang, Y.; Wilson, J.; et al. Influence of Government Attention on Environmental Quality: An Analysis of 30 Provinces in China. Environmental Impact Assessment Review 2023, 100, 107084. [CrossRef]
- Woolthuis, R. K.; Lankhuizen, M.; Gilsing, V. A system failure framework for innovation policy design. Technovation 2005, 25(6), 609-619. [CrossRef]
- Metcalfe, J. S. Systems failure and the case for innovation policy, Innovation Policy in a Knowledge-Based Economy: Theory and Practice; Springer Berlin Heidelberg: Berlin, Heidelberg, Germany, 2005; pp. 47-74.
- Zhu, K.; Du, L.; Feng, Y. Government Attention on Environmental Protection and Firms’ Carbon Reduction Actions: Evidence from Text Analysis of Manufacturing Enterprises. Journal of Cleaner Production 2023, 423, 138703. [CrossRef]
- Yuan, G.; Liu, J.; Wang, Y. Low-Carbon City Pilot Policies, Government Attention, and Green Total Factor Productivity. Finance Research Letters 2025, 77, 107043. [CrossRef]
- Abendin, S.; Pingfang, D. Capital Mobility and Business Cycle Synchronization in Sub-Saharan Africa: The Role of the Digital Economy. The Journal of International Trade & Economic Development 2022, 31(7), 1108-1126. [CrossRef]
- Kravchuk, O. Digital Transformation of Human Capital Management: Enhancing Social Mobility in the Digital Economy. Journal of Vasyl Stefanyk Precarpathian National University 2025, 12(2), 80-100. [CrossRef]
- McCann, P.; Ortega-Argilés, R. Modern regional innovation policy. Cambridge Journal of Regions, Economy and Society 2013, 6(2), 187-216. [CrossRef]
- Oughton, C.; Landabaso, M.; Morgan, K. The regional innovation paradox: innovation policy and industrial policy. The Journal of Technology Transfer 2002, 27(1), 97-110. [CrossRef]
- Schot, J.; Steinmueller, W. E. Three frames for innovation policy: R&D, systems of innovation and transformative change. Research Policy 2018, 47(9), 1554-1567. [CrossRef]
- Zhang, J.; Wang, B. Digital economy development and green total factor productivity improvement. Journal of Audit & Economics 2023, 38(2), 107-115.
- Rothwell, R.; Zegveld, W. Reindustrialization and Technology; Longman, M.E. Sharpe: New York, USA, 1985.
- Teubal, M. What Is the Systems Perspective to Innovation and Technology Policy (ITP) and How Can We Apply It to Developing and Newly Industrialized Economies. Journal of Evolutionary Economics 2002, 12(1/2), 233-257. [CrossRef]
- Barrow, C. W. The Strategy of Selective Excellence: Redesigning Higher Education for Global Competition in a Postindustrial Society. Higher Education 1996, 31(4), 447-469. [CrossRef]
- Stcinmucller, W. E. Economics of Technology Policy[A]. Hall, B. H, and N. Roscnbcrg. Handbook of the Eeonomics of Innovation(Vol.2). Netherlands: North-Holland, 2010.
- Wu, H.; Hao, Y.; Geng, C.; Sun, W.; Zhou, Y.; Lu, F. Ways to improve cross-regional resource allocation: Does the development of digitalization matter? Journal of Economic Analysis 2023, 2(4), 1-30. [CrossRef]
- Hsiao, C.; Taylor, G. Some remarks on measurement errors and the identification of panel data models. Statistica Neerlandica 1991, 45(2), 187-194. [CrossRef]
- Fan, M.; Li, M.; Liu, J. Is high natural resource dependence doomed to low carbon emission efficiency? Evidence from 283 cities in China. Energy Economics 2022, 115, 106328. [CrossRef]
- Hu, J.; Zhang, H.; Irfan, M. How does digital infrastructure construction affect low-carbon development? A multidimensional interpretation of evidence from China. Journal of Cleaner Production 2023, 396, 136467. [CrossRef]
- Long, Y.; Liu, L.; Yang, B. The effects of enterprise digital transformation on low-carbon urban development: Empirical evidence from China. Technological Forecasting and Social Change 2024, 201, 123259. [CrossRef]
- Nordhaus, W. Climate Change: The Ultimate Challenge for Economics. American Economic Review 2019, 109(6), 1991-2014. [CrossRef]
- Acemoglu, D.; Aghion, P.; Bursztyn, L. The Environment and Directed Technical Change. American Economic Review 2012, 102, 1-38.
- Pizer, W. A.; Newell, R. G.; Fisher-Vanden, K.; et al. The Role of Policy and Market Design in Unlocking Low-Carbon Investment. Nature Climate Change 2021, 11(5), 389-397.
- Edwards, J. R.; Lambert, L. S. Methods for integrating moderation and mediation: a general analytical framework using moderated path analysis. Psychological Methods 2007, 12(1), 1. [CrossRef]
- Chao, X. J.; Lian, Y. M.; Luo, L. X. Impact of new digital infrastructure on high-quality development of manufacturing industry. Finance and Trade Research 2021, 32(10), 1-13.
- Lesage, J. P.; Pace, R. K. Spatial econometric modeling of origin-destination flows. Journal of Regional Science 2008, 48(5), 941-967. [CrossRef]
- Jia, R.; Fan, M.; Shao, S. Urbanization and haze-governance performance: evidence from China’s 248 cities. Journal of Environmental Management 2021, 288, 112436. [CrossRef]
- Yu, Y. Z.; Zhang, S. H. Urban Housing Prices, Purchase Restriction Policies and Technological Innovation. China Industrial Economics 2017, (6), 98-116.
- Bai, Y.; Song, S.; Jiao, J.; et al. The Impacts of Government R&D Subsidies on Green Innovation: Evidence from Chinese Energy-Intensive Firms. Journal of Cleaner Production 2019, 233, 819-829. [CrossRef]
- Zheng, S.; Wen, J. Green Public Procurement and Corporate Environmental Performance: An Empirical Analysis Based on Data from Green Procurement Contracts. International Review of Economics & Finance 2024, 96, 103578. [CrossRef]
- Narassimhan, E.; Gallagher, K. S.; Koester, S.; et al. Carbon Pricing in Practice: A Review of Existing Emissions Trading Systems. Climate Policy 2018, 18(8), 967-991. [CrossRef]
- Hao, P.; Wang, Y.; Fan, L. Government-Guided Fund, Social Resources, and Corporate Green Innovation. International Review of Financial Analysis 2025, 98, 103898. [CrossRef]
- Fu, C.; Lu, L.; Pirabi, M. Advancing Green Finance: A Review of Sustainable Development. Digital Economy and Sustainable Development 2023, 1(1), 20. [CrossRef]
Figure 1.
Theoretical analysis diagram of this study.
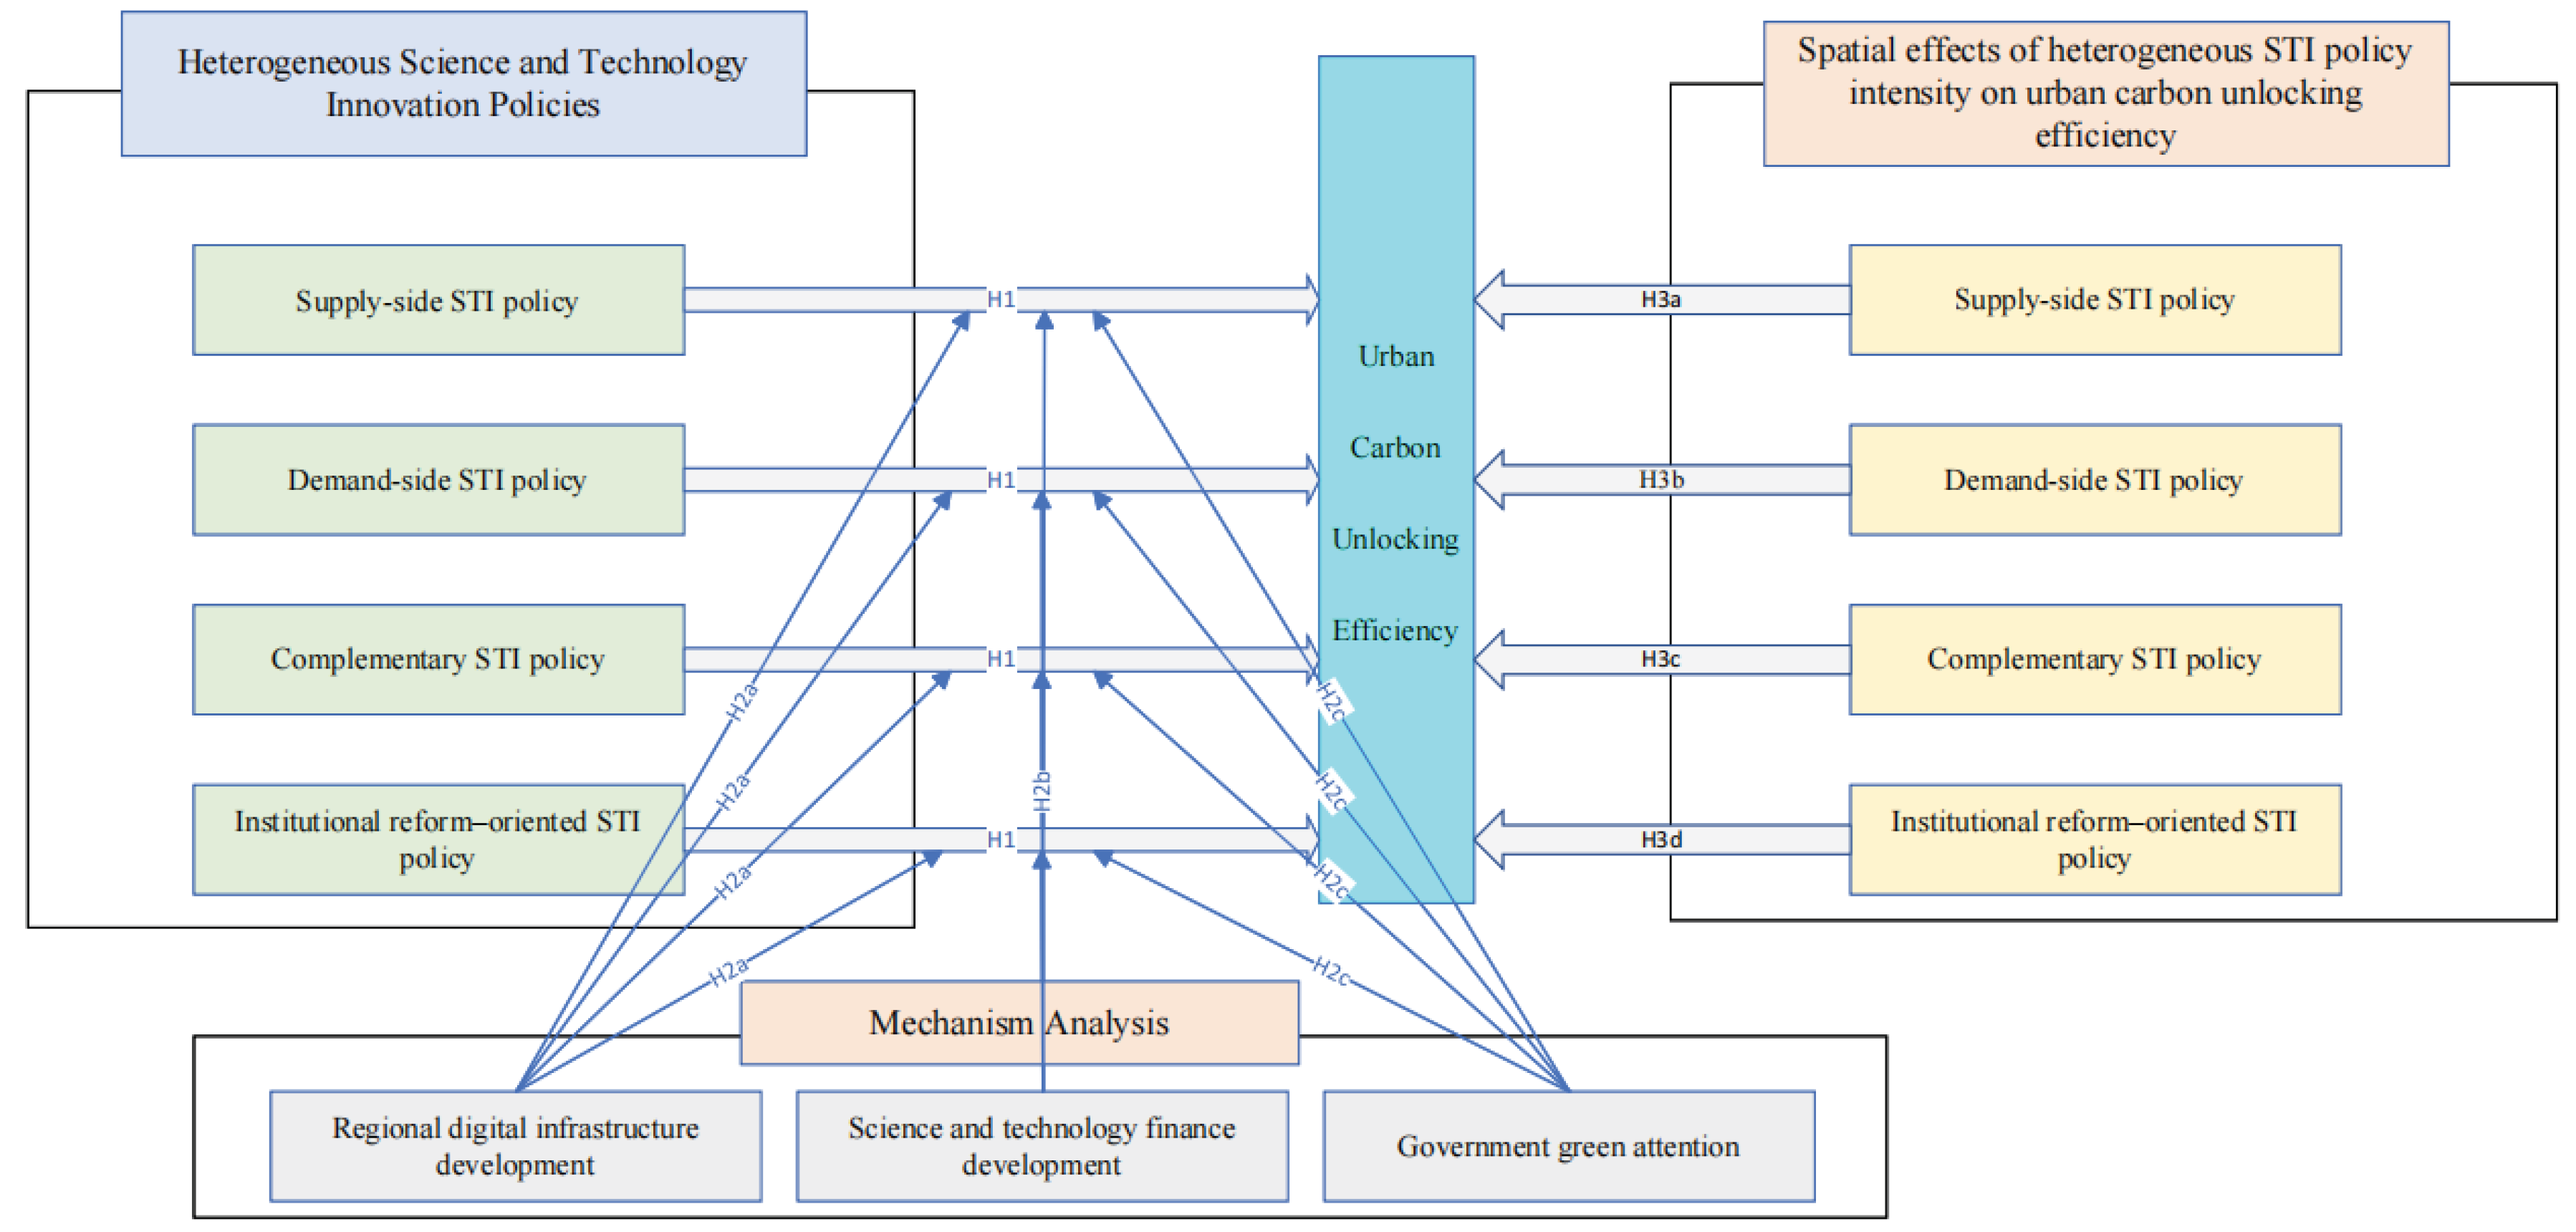
Figure 2.
Spatial distribution of urban carbon unlocking efficiency in 2010, 2014, 2019, and 2023.
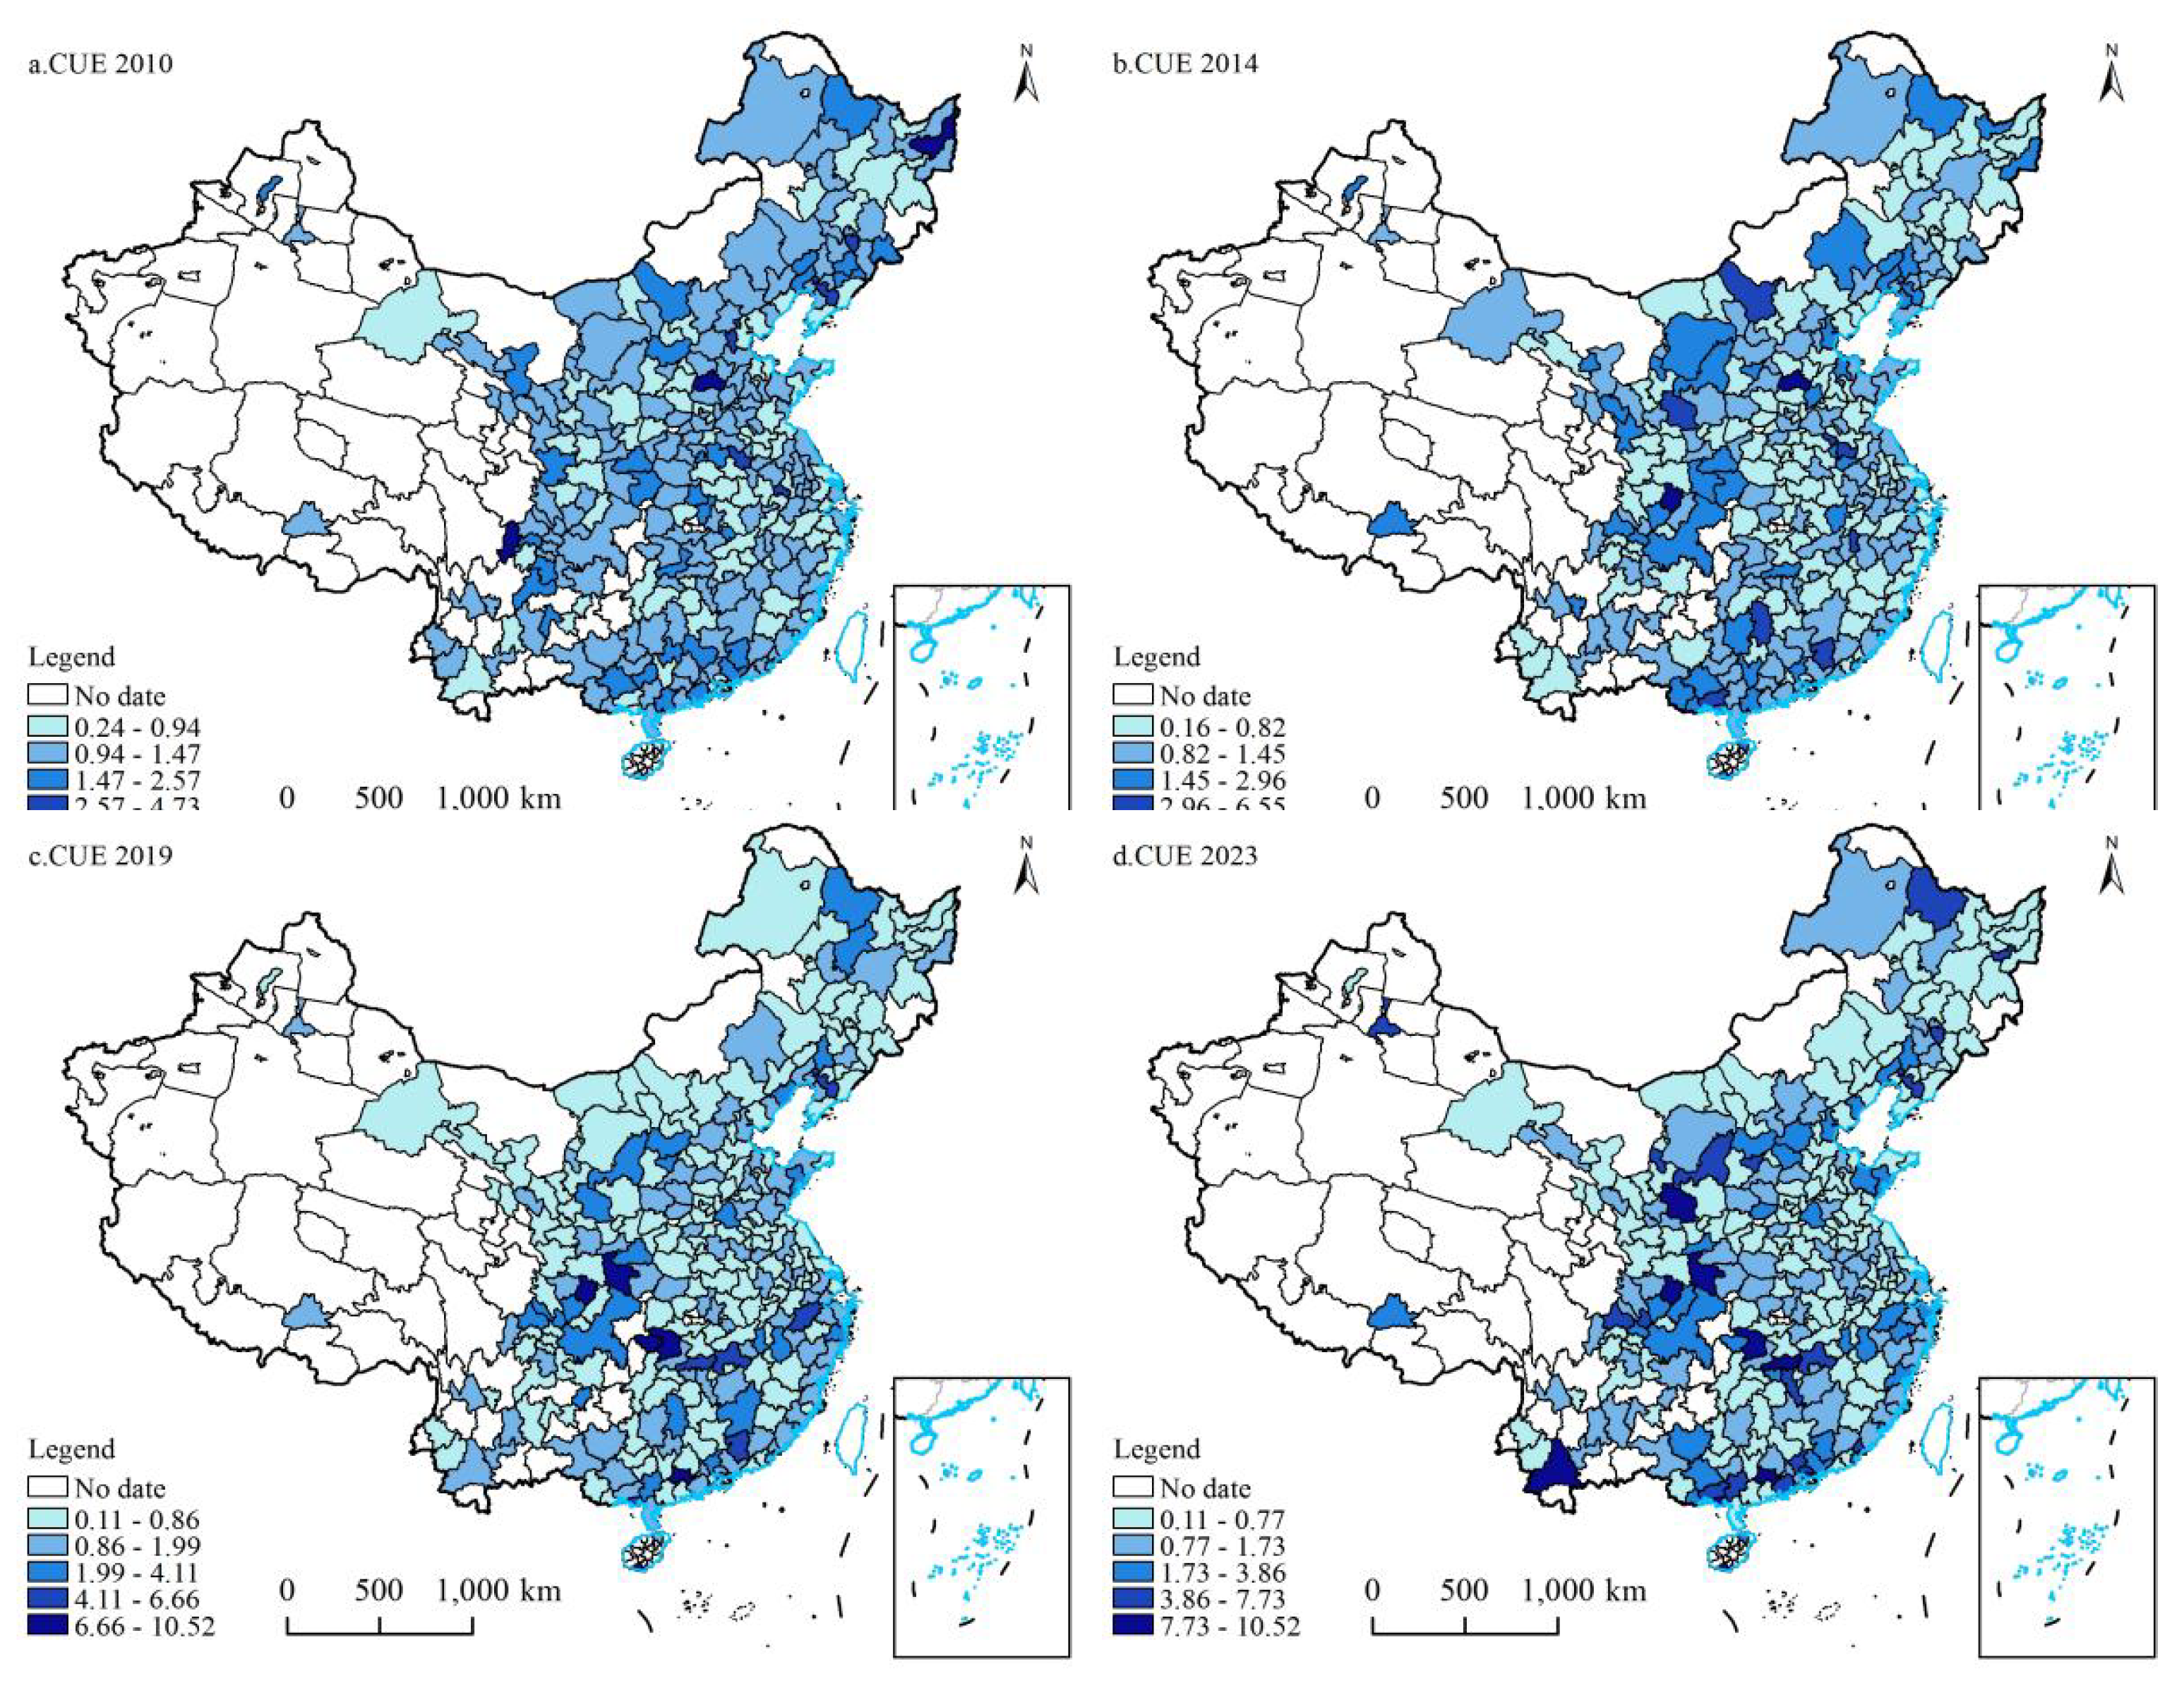
Table 2.
Descriptive statistics.
| Variable | Obs | Mean | SD | Min | Max | |
| Dependent variable | 4290 | 1.2270 | 1.4310 | 0.1070 | 10.5200 | |
| Independent variable | 4290 | 1.6490 | 1.9710 | 0.0000 | 24.0000 | |
| 4290 | 0.8710 | 1.3810 | 0.0000 | 23.0000 | ||
| 4290 | 1.1490 | 1.4420 | 0.0000 | 22.0000 | ||
| 4290 | 1.0580 | 1.4330 | 0.0000 | 16.0000 | ||
| Control variables | 4290 | 2.5600 | 1.2000 | 0.9900 | 6.9990 | |
| 4290 | 10.7200 | 0.6140 | 9.2320 | 12.0900 | ||
| 4290 | 0.3950 | 0.2100 | 0.1070 | 0.9960 | ||
| 4290 | 0.1990 | 0.0985 | 0.0743 | 0.6060 | ||
| 4290 | 0.2640 | 0.2560 | 0.0294 | 1.7590 | ||
| 4290 | 13.4400 | 1.0400 | 9.2100 | 17.7600 |
Table 3.
Baseline regression results of heterogeneous STI policy intensity on urban carbon unlocking efficiency.
Table 3.
Baseline regression results of heterogeneous STI policy intensity on urban carbon unlocking efficiency.
| Dependent variable: urban carbon unlocking efficiency() | |||||
| (1) | (2) | (3) | (4) | (5) | |
| 0.0749*** (4.405) |
0.0467** (2.335) |
||||
| 0.0885*** (3.519) |
0.0466* (1.713) |
||||
| 0.0609** (2.532) |
0.0010 (0.040) |
||||
| 0.0929*** (3.418) |
0.0315 (1.000) |
||||
| 2.0664 (1.304) |
2.0716 (1.287) |
2.3856 (1.477) |
2.3400 (1.458) |
1.7888 (1.124) |
|
| Control Variables | YES | YES | YES | YES | YES |
| City FE | YES | YES | YES | YES | YES |
| Year FE | YES | YES | YES | YES | YES |
| Observations | 4290 | 4290 | 4290 | 4290 | 4290 |
| R2 | 0.4258 | 0.4257 | 0.4243 | 0.4254 | 0.4268 |
note: Adjusted robust standard errors for city-level and year-level clustering are in parentheses; *** p < 0.01, ** p < 0.05, * p < 0.1; this note applies to all subsequent tables.
Table 4.
Endogeneity treatment of heterogeneous STI policy intensity on urban carbon unlocking efficiency: lagged variables as instruments.
Table 4.
Endogeneity treatment of heterogeneous STI policy intensity on urban carbon unlocking efficiency: lagged variables as instruments.
| Dependent variable: urban carbon unlocking efficiency() | ||||
| (1) | (2) | (3) | (4) | |
| 0.1253*** (4.366) |
||||
| 0.1482*** (3.246) |
||||
| 0.1578*** (3.273) |
||||
| 0.1416*** (3.208) |
||||
| 2.1906 (1.362) |
2.1450 (1.321) |
2.4295 (1.492) |
2.6911* (1.654) |
|
| Kleibergen-Paap rk LM statistic | 67.670*** [0.000] |
20.875*** [0.000] |
32.084*** [0.000] |
49.491*** [0.000] |
| Cragg-Donald Wald F statistic | 2184.342 {16.38} |
2427.823 {16.38} |
1577.434 {16.38} |
2813.794 {16.38} |
| Control Variables | YES | YES | YES | YES |
| City FE | YES | YES | YES | YES |
| Year FE | YES | YES | YES | YES |
| Observations | 4004 | 4004 | 4004 | 4004 |
| R2 | 0.4535 | 0.4530 | 0.4507 | 0.4535 |
Notes: (1) *, **, and *** denote statistical significance at the 10%, 5%, and 1% levels, respectively. (2) Robust standard errors are reported in parentheses. (3) The under-identification test is based on the Kleibergen–Paap rk LM statistic; p-values for the Chi-square (2) test are reported in square brackets [[ ]. (4) The weak-instrument test is conducted using the Cragg–Donald Wald F statistic; the Stock–Yogo critical value at the 10% significance level is reported in curly brackets { }. The same notation applies to the following tables.
Table 5.
Endogeneity treatment of heterogeneous STI policy intensity on urban carbon unlocking efficiency: regional university student scale as an instrument.
Table 5.
Endogeneity treatment of heterogeneous STI policy intensity on urban carbon unlocking efficiency: regional university student scale as an instrument.
| Dependent variable: urban carbon unlocking efficiency() | ||||
| (1) | (2) | (3) | (4) | |
| 0.5627*** (3.965) |
||||
| 0.8087*** (4.469) |
||||
| 0.7482*** (3.699) |
||||
| 0.7071*** (4.217) |
||||
| -1.9938 (-1.151) |
-3.2978* (-1.775) |
-1.7738 (-1.033) |
-0.4417 (-0.283) |
|
| Kleibergen-Paap rk LM statistic | 23.321*** [0.000] |
41.284*** [0.000] |
21.151*** [0.000] |
30.584*** [0.000] |
| Cragg-Donald Wald F statistic | 190.716 {16.38} |
134.892 {16.38} |
188.611 {16.38} |
222.168 {16.38} |
| Control Variables | YES | YES | YES | YES |
| City FE | YES | YES | YES | YES |
| Year FE | YES | YES | YES | YES |
| Observations | 4290 | 4290 | 4290 | 4290 |
| R2 | 0.3230 | 0.2743 | 0.3076 | 0.3361 |
Table 6.
Robustness Checks: Alternative measurement of urban carbon unlocking efficiency.
| Dependent variable: urban carbon unlocking efficiency() | ||||
| (1) | (2) | (3) | (4) | |
| 0.0262* (1.823) |
||||
| 0.0674*** (3.635) |
||||
| 0.0369* (1.854) |
||||
| 0.0640*** (2.789) |
||||
| -6.2530*** (-4.262) |
-6.5581*** (-4.419) |
-6.2512*** (-4.217) |
-6.3186*** (-4.266) |
|
| Control Variables | YES | YES | YES | YES |
| City FE | YES | YES | YES | YES |
| Year FE | YES | YES | YES | YES |
| Observations | 4290 | 4290 | 4290 | 4290 |
| R2 | 0.5686 | 0.5697 | 0.5687 | 0.5693 |
Table 7.
Robustness Checks: Alternative regression model.
| Dependent variable: urban carbon unlocking efficiency() | ||||
| (1) | (2) | (3) | (4) | |
| 0.0749*** (4.256) |
||||
| 0.0885*** (4.132) |
||||
| 0.0609*** (2.615) |
||||
| 0.0929*** (3.908) |
||||
| 1.4823 (0.993) |
1.4346 (0.960) |
1.7074 (1.143) |
1.6930 (1.136) |
|
| Control Variables | YES | YES | YES | YES |
| City FE | YES | YES | YES | YES |
| Year FE | YES | YES | YES | YES |
| Observations | 4290 | 4290 | 4290 | 4290 |
| Log | -6434.7106 | -6435.2292 | -6440.3325 | -6436.1269 |
Table 8.
Robustness Checks: Alternative sample.
| Dependent variable: urban carbon unlocking efficiency() | ||||
| (1) | (2) | (3) | (4) | |
| 0.1034*** (4.993) |
||||
| 0.1782*** (5.184) |
||||
| 0.1104*** (3.009) |
||||
| 0.1557*** (4.247) |
||||
| 2.1185 (1.325) |
2.0222 (1.251) |
2.4607 (1.509) |
2.4296 (1.497) |
|
| Control Variables | YES | YES | YES | YES |
| City FE | YES | YES | YES | YES |
| Year FE | YES | YES | YES | YES |
| Observations | 4230 | 4230 | 4230 | 4230 |
| R2 | 0.4262 | 0.4275 | 0.4244 | 0.4265 |
Table 9.
Robustness Checks: Controlling for innovation-oriented city pilot programs.
| Dependent variable: urban carbon unlocking efficiency() | ||||
| (1) | (2) | (3) | (4) | |
| 0.0769*** (4.480) |
||||
| 0.0901*** (3.531) |
||||
| 0.0635*** (2.609) |
||||
| 0.0956*** (3.490) |
||||
| 2.4343 (1.535) |
2.4344 (1.512) |
2.7429* (1.697) |
2.7110* (1.689) |
|
| Control variables | YES | YES | YES | YES |
| Innovation-oriented city pilots | YES | YES | YES | YES |
| City FE | YES | YES | YES | YES |
| Year FE | YES | YES | YES | YES |
| Observations | 4230 | 4230 | 4230 | 4230 |
| R2 | 0.4266 | 0.4264 | 0.4250 | 0.4262 |
Table 10.
Robustness Checks: Excluding years affected by major exogenous events.
| Dependent variable: urban carbon unlocking efficiency() | ||||
| (1) | (2) | (3) | (4) | |
| 0.0826*** (3.939) |
||||
| 0.0842*** (2.963) |
||||
| 0.0743** (2.362) |
||||
| 0.0952*** (2.809) |
||||
| -0.2047 (-0.120) |
-0.1140 (-0.066) |
0.0376 (0.022) |
0.1294 (0.075) |
|
| Control variables | YES | YES | YES | YES |
| City FE | YES | YES | YES | YES |
| Year FE | YES | YES | YES | YES |
| Observations | 3718 | 3718 | 3718 | 3718 |
| R2 | 0.3862 | 0.3856 | 0.3845 | 0.3855 |
Table 11.
Robustness Checks: Excluding years affected by major exogenous events.
| Panel A: | ||||
| Dependent variable: urban carbon unlocking efficiency() | ||||
| (1) | (2) | (3) | (4) | |
| High-pollution cities | Low-pollution cities | High-pollution cities | Low-pollution cities | |
| 0.0827*** (2.723) |
0.0697*** (3.511) |
|||
| 0.0307 (0.723) |
0.0947*** (3.083) |
|||
| 4.4871** (2.254) |
3.1745 (1.311) |
4.3404** (2.173) |
2.8783 (1.156) |
|
| Control variables | YES | YES | YES | YES |
| City FE | YES | YES | YES | YES |
| Year FE | YES | YES | YES | YES |
| Observations | 2145 | 2145 | 2145 | 2145 |
| R2 | 0.3311 | 0.4776 | 0.3293 | 0.4781 |
| Empirical p-value | 0.442 | 0.000*** | ||
| Panel B: | ||||
| Dependent variable: urban carbon unlocking efficiency() | ||||
| (5) | (6) | (7) | (8) | |
| High-pollution cities | Low-pollution cities | High-pollution cities | Low-pollution cities | |
| 0.0001 (0.002) |
0.0693** (2.417) |
|||
| 0.0102 (0.193) |
0.1110*** (3.481) |
|||
| 4.2340** (2.135) |
3.6257 (1.463) |
4.2709** (2.138) |
3.2596 (1.332) |
|
| Control variables | YES | YES | YES | YES |
| City FE | YES | YES | YES | YES |
| Year FE | YES | YES | YES | YES |
| Observations | 2145 | 2145 | 2145 | 2145 |
| R2 | 0.3291 | 0.4765 | 0.3291 | 0.4783 |
| Empirical p-value | 0.000*** | 0.000*** | ||
Table 12.
Robustness Checks: Excluding years affected by major exogenous events.
| Panel A: | ||||
| Dependent variable: urban carbon unlocking efficiency() | ||||
| (1) | (2) | (3) | (4) | |
| High energy-intensity regions | Low energy-intensity regions | High energy-intensity regions | Low energy-intensity regions | |
| 0.0859*** (4.312) |
0.0830** (2.513) |
|||
| 0.0716*** (3.093) |
0.2002*** (3.373) |
|||
| 7.7739*** (3.834) |
-0.2660 (-0.094) |
7.8782*** (3.855) |
-1.6829 (-0.569) |
|
| Control variables | YES | YES | YES | YES |
| City FE | YES | YES | YES | YES |
| Year FE | YES | YES | YES | YES |
| Observations | 2115 | 2115 | 2115 | 2115 |
| R2 | 0.3592 | 0.4760 | 0.3565 | 0.4790 |
| Empirical p-value | 0.000*** | 0.000*** | ||
| Panel B: | ||||
| Dependent variable: urban carbon unlocking efficiency() | ||||
| (5) | (6) | (7) | (8) | |
| High energy-intensity regions | Low energy-intensity regions | High energy-intensity regions | Low energy-intensity regions | |
| 0.0420** (1.969) |
0.1359** (2.310) |
|||
| 0.0729*** (2.896) |
0.1872*** (3.149) |
|||
| 8.1100*** (3.958) |
-0.8392 (-0.283) |
8.1787*** (3.997) |
-0.9036 (-0.311) |
|
| Control variables | YES | YES | YES | YES |
| City FE | YES | YES | YES | YES |
| Year FE | YES | YES | YES | YES |
| Observations | 2115 | 2115 | 2115 | 2115 |
| R2 | 0.3542 | 0.4765 | 0.3557 | 0.4785 |
| Empirical p-value | 0.000*** | 0.000*** | ||
Table 13.
Mechanism Analysis: The moderating role of regional digital infrastructure development.
| Dependent variable: urban carbon unlocking efficiency() | ||||
| (1) | (2) | (3) | (4) | |
| -1.3573*** (-3.698) |
-1.1459*** (-3.518) |
-1.0803*** (-2.983) |
-1.2411*** (-3.685) |
|
| 0.0323 (1.006) |
||||
| 0.3071*** (2.643) |
||||
| 0.0992 (1.554) |
||||
| 0.3421* (1.673) |
||||
| 0.0686 (1.120) |
||||
| 0.1923 (1.182) |
||||
| 0.0882 (1.568) |
||||
| 0.3375** (2.041) |
||||
| 2.1626 (1.362) |
2.1835 (1.347) |
2.7494* (1.689) |
2.4612 (1.517) |
|
| Control variables | YES | YES | YES | YES |
| City FE | YES | YES | YES | YES |
| Year FE | YES | YES | YES | YES |
| Observations | 4209 | 4209 | 4209 | 4209 |
| R2 | 0.4335 | 0.4348 | 0.4311 | 0.4341 |
Table 14.
Mechanism Analysis: The moderating role of regional science and technology finance development.
Table 14.
Mechanism Analysis: The moderating role of regional science and technology finance development.
| Dependent variable: urban carbon unlocking efficiency() | ||||
| (1) | (2) | (3) | (4) | |
| -0.0383 (-0.953) |
-0.0567 (-1.394) |
-0.1115** (-2.152) |
-0.1118** (-2.491) |
|
| -0.0533* (-1.747) |
||||
| 0.0518*** (5.348) |
||||
| -0.0713 (-1.429) |
||||
| 0.0929*** (5.559) |
||||
| -0.1180** (-2.465) |
||||
| 0.0964*** (5.227) |
||||
| -0.0692 (-1.568) |
||||
| 0.1011*** (6.249) |
||||
| 0.2551 (0.165) |
-0.3914 (-0.251) |
0.0762 (0.049) |
-0.3918 (-0.253) |
|
| Control variables | YES | YES | YES | YES |
| City FE | YES | YES | YES | YES |
| Year FE | YES | YES | YES | YES |
| Observations | 4226 | 4226 | 4226 | 4226 |
| R2 | 0.4339 | 0.4372 | 0.4347 | 0.4384 |
Table 15.
Mechanism Analysis: The moderating role of government green attention.
| Dependent variable: urban carbon unlocking efficiency() | ||||
| (1) | (2) | (3) | (4) | |
| -53.9221*** (-10.071) |
-54.0788*** (-10.862) |
-54.9788*** (-10.629) |
-55.4769*** (-10.794) |
|
| 0.0307* (1.737) |
||||
| 3.1918** (2.554) |
||||
| 0.0276 (1.543) |
||||
| 6.3757*** (3.656) |
||||
| 0.0035 (0.168) |
||||
| 5.2339*** (3.160) |
||||
| 0.0195 (0.739) |
||||
| 6.1095*** (3.495) |
||||
| 1.4106 (0.903) |
1.3992 (0.886) |
1.7194 (1.085) |
1.7495 (1.109) |
|
| Control variables | YES | YES | YES | YES |
| City FE | YES | YES | YES | YES |
| Year FE | YES | YES | YES | YES |
| Observations | 4290 | 4290 | 4290 | 4290 |
| R2 | 0.4478 | 0.4490 | 0.4471 | 0.4486 |
Table 16.
Moran’s I Statistics of Urban Carbon Unlocking Efficiency.
| Moran’s I | Z-value | P-value | |
| 2010 | 0.000 | 0.582 | 0.280 |
| 2011 | -0.002 | 0.303 | 0.381 |
| 2012 | 0.005* | 1.341 | 0.090 |
| 2013 | 0.009** | 1.990 | 0.023 |
| 2014 | 0.006* | 1.505 | 0.060 |
| 2015 | 0.014*** | 2.715 | 0.003 |
| 2016 | 0.012*** | 2.525 | 0.006 |
| 2017 | 0.007** | 1.675 | 0.047 |
| 2018 | 0.011*** | 2.316 | 0.010 |
| 2019 | 0.017*** | 3.208 | 0.001 |
| 2020 | 0.045*** | 7.590 | 0.000 |
| 2021 | 0.039*** | 6.609 | 0.000 |
| 2022 | 0.027*** | 4.797 | 0.000 |
| 2023 | 0.042*** | 6.975 | 0.000 |
Table 17.
Spatial spillover effects of heterogeneous sti policy intensity on urban carbon unlocking efficiency.
Table 17.
Spatial spillover effects of heterogeneous sti policy intensity on urban carbon unlocking efficiency.
| Dependent variable: urban carbon unlocking efficiency() | ||||
| (1) | (2) | |||
| 0.0700*** (4.000) |
||||
| 0.4277*** (4.468) |
||||
| 0.0833*** (3.853) |
||||
| 0.1247 (1.056) |
||||
| 0.0695*** (2.948) |
||||
| -0.2231** (-2.092) |
||||
| 0.0724*** (2.963) |
||||
| 1.5486*** (4.660) |
||||
| 0.1754* (1.656) |
0.3000*** (3.154) |
0.3000*** (3.150) |
0.2261* (1.906) |
|
| 1.1544*** (46.401) |
1.1662*** (46.146) |
1.1671*** (46.150) |
1.1577*** (46.304) |
|
| Wald SAR (p) | 41.09*** [0.000] |
22.73*** [0.001] |
41.09*** [0.000] |
22.73*** [0.001] |
| Wald SEM (p) | 47.85*** [0.000] |
26.34*** [0.000] |
47.85*** [0.000] |
26.34*** [0.000] |
| Control variables | YES | YES | YES | YES |
| City FE | YES | YES | YES | YES |
| Year FE | YES | YES | YES | YES |
| Observations | 4290 | 4290 | 4290 | 4290 |
| 0.0058 | 0.0001 | 0.0030 | 0.0000 | |
Table 18.
Direct, indirect, and total effects of heterogeneous STI policy intensity on urban carbon unlocking efficiency.
Table 18.
Direct, indirect, and total effects of heterogeneous STI policy intensity on urban carbon unlocking efficiency.
| (1) | (2) | (3) | |
| Direct effects | Indirect effects | Total effects | |
| 0.0713*** (3.975) |
0.5319*** (4.743) |
0.6032*** (5.357) |
|
| 0.0845*** (3.807) |
0.2129 (1.250) |
0.2975* (1.718) |
|
| 0.0698*** (2.884) |
-0.2946** (-1.977) |
-0.2248 (-1.496) |
|
| 0.0764*** (3.062) |
2.0367*** (4.209) |
2.1131*** (4.393) |
Notes: (1) *, **, and *** indicate statistical significance at the 10%, 5%, and 1% levels, respectively. (2) Z-values are reported in parentheses.
Disclaimer/Publisher’s Note: The statements, opinions and data contained in all publications are solely those of the individual author(s) and contributor(s) and not of MDPI and/or the editor(s). MDPI and/or the editor(s) disclaim responsibility for any injury to people or property resulting from any ideas, methods, instructions or products referred to in the content. |
© 2026 by the authors. Licensee MDPI, Basel, Switzerland. This article is an open access article distributed under the terms and conditions of the Creative Commons Attribution (CC BY) license (http://creativecommons.org/licenses/by/4.0/).
Copyright: This open access article is published under a Creative Commons CC BY 4.0 license, which permit the free download, distribution, and reuse, provided that the author and preprint are cited in any reuse.


