Submitted:
01 January 2026
Posted:
06 January 2026
You are already at the latest version
Abstract
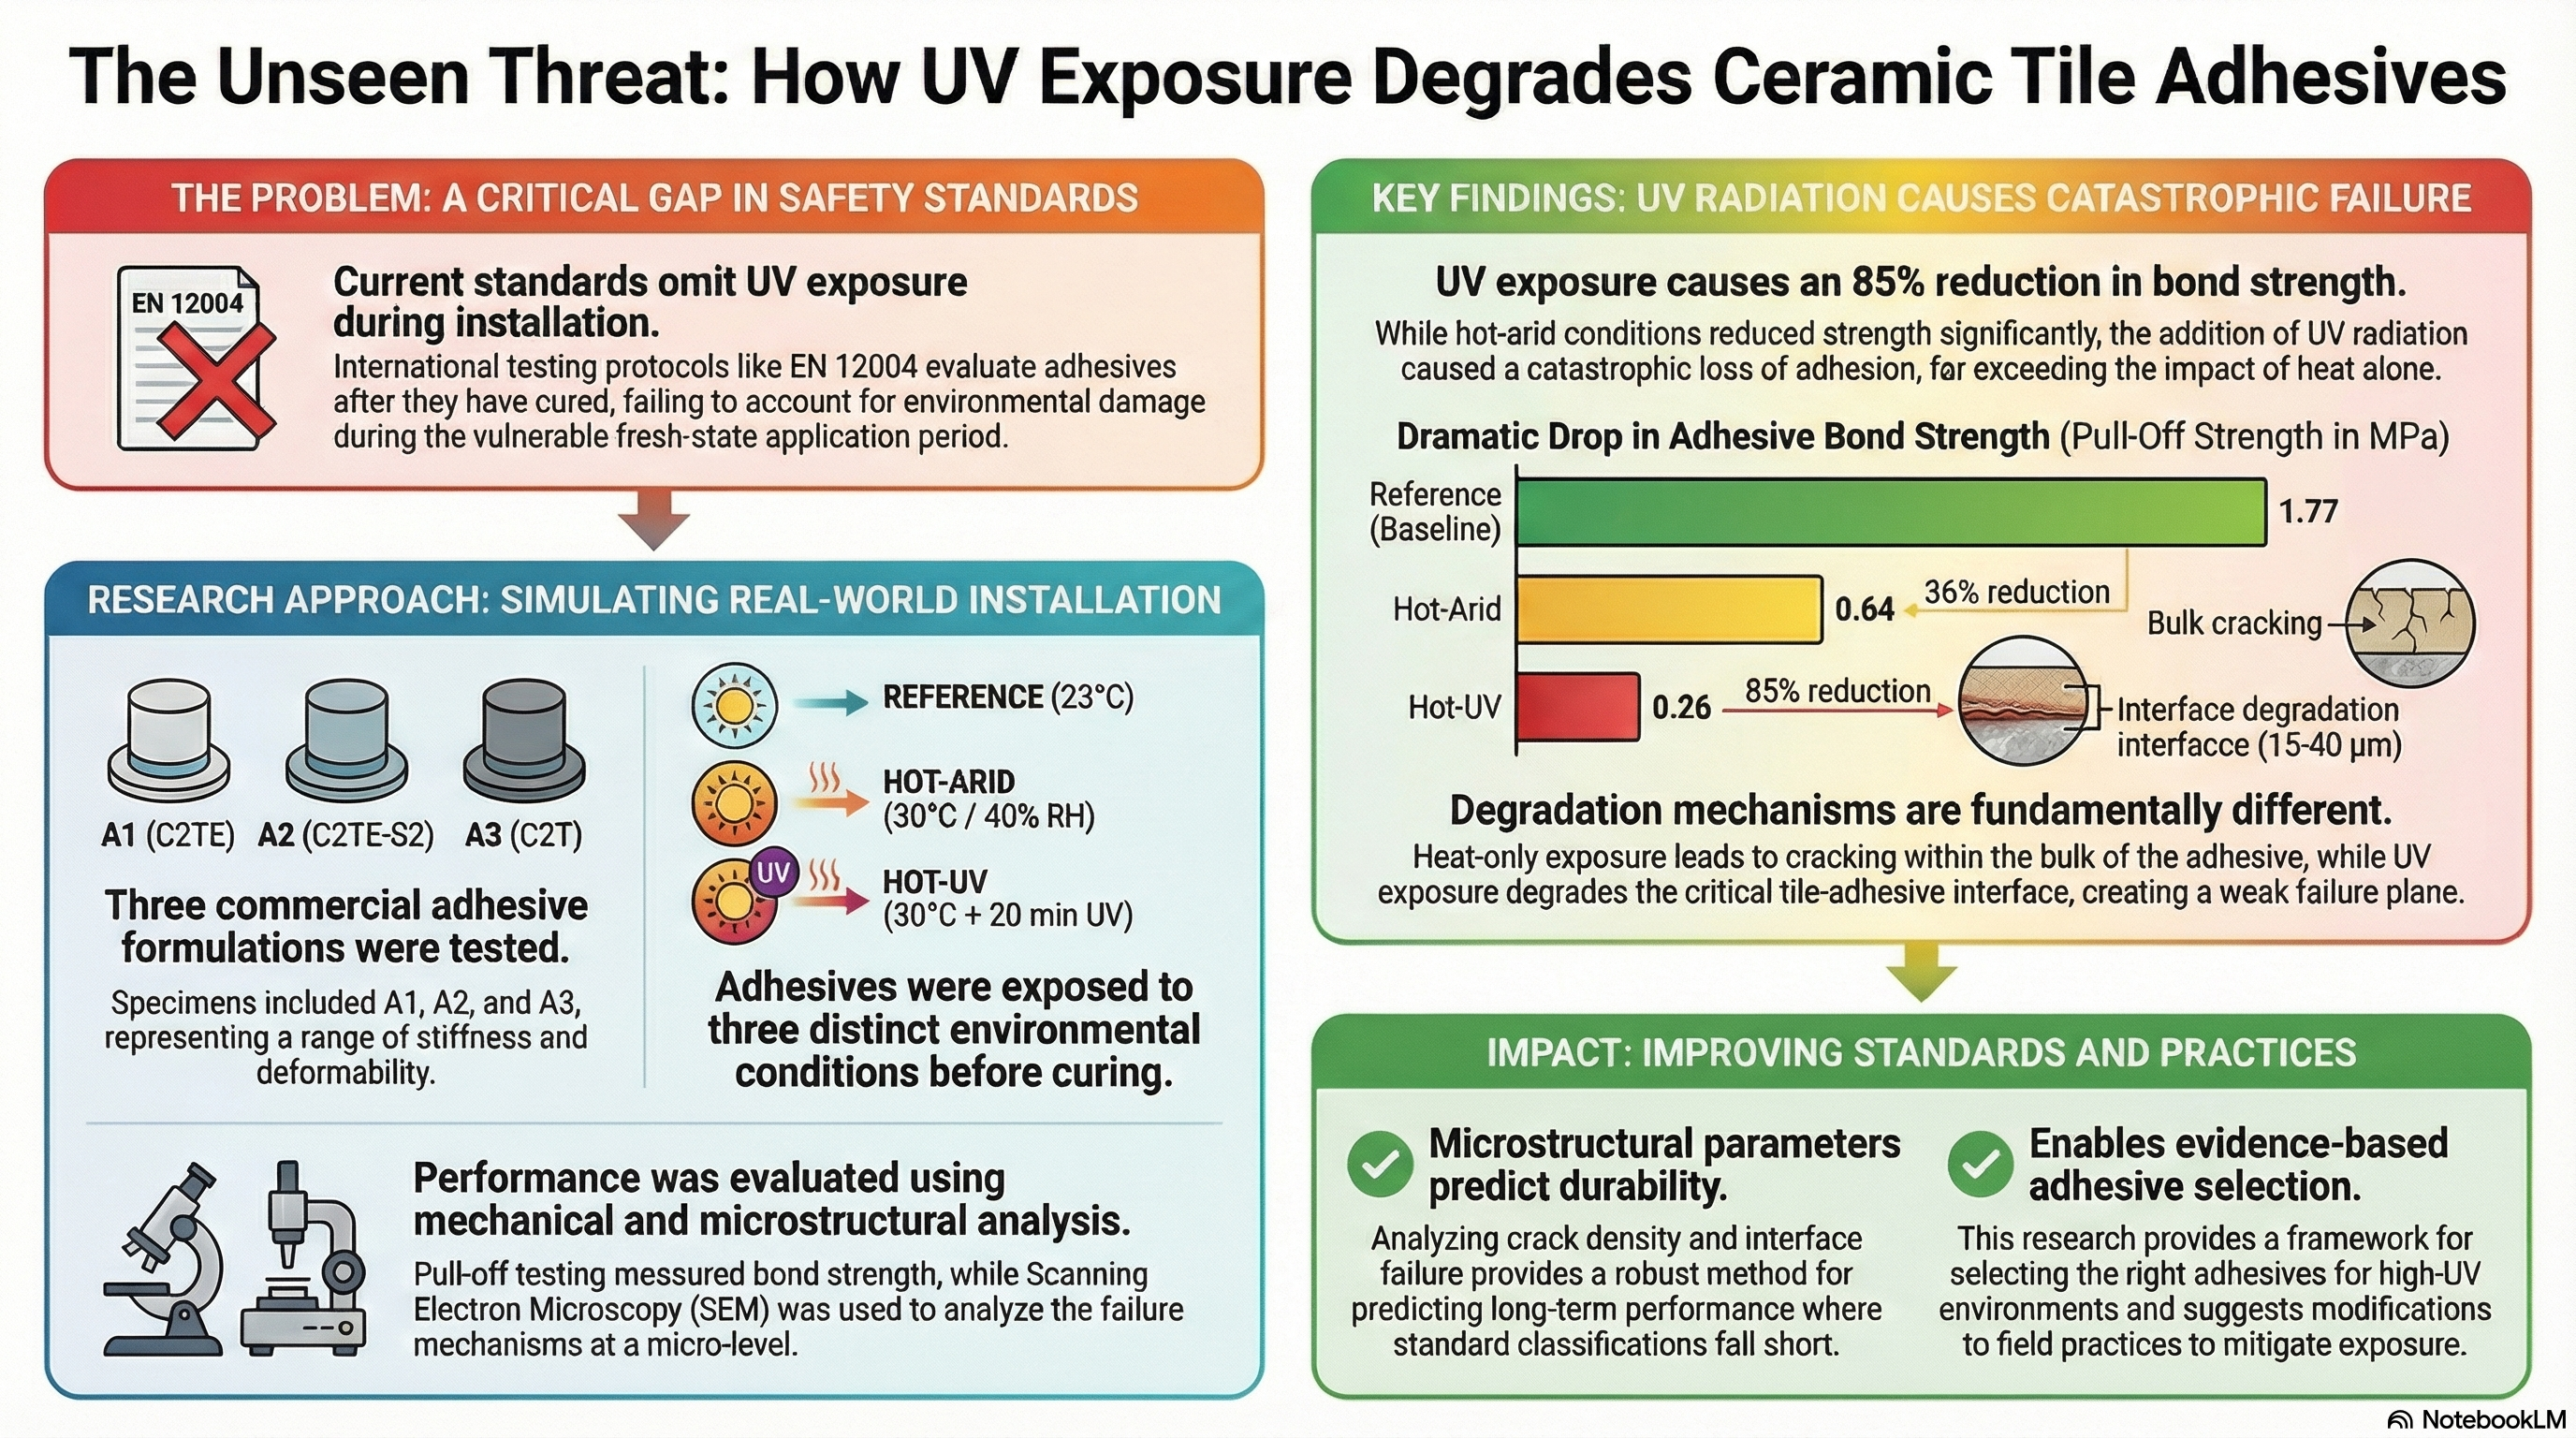
Current international standards (EN 12004; SI 4004) are testing ceramic tile adhesives under post-cure thermal aging. However, the standards do not address UV radiation exposure during the fresh-adhesive phase. This research investigated the bond strength of three commercial polymer-modified cement adhesives (C2TE, C2TE-S2, C2T) to porcelain stoneware tiles under simulated Eastern Mediterranean and desert conditions. Three commercial adhesives were exposed during the initial (uncured) period to elevated temperature (30°C), humidity variation (40-65% RH), and UV radiation (295-365 nm, 1.5-2.0 mW/cm²) for 20 minutes, followed by 28 days of curing. Pull-off testing and scanning electron microscopy, combined with quantitative directionality analysis, were used to characterize the mechanical performance and microstructural degradation. UV exposure of adhesives during tiling working time caused a drop of mean bond strength from 1.77 to 0.26 MPa (85% reduction) compared with 1.77 to 0.64 MPa (36% reduction) under hot-arid conditions. Microstructural analysis of the hardened pull-off adhesives revealed that exposure of the fresh adhesive to UV radiation causes thinning and degradation of the interfacial layer (15-40 µm), leading to a drop in macroscopic strength. In contrast, hot-arid exposure induces adhesive bulk cracking while preserving interface integrity. Fracture surface directionality (goodness parameter), crack density, and delamination percentage together distinguish interface failure from adhesive bulk degradation and provide a forecast of long-term durability. This combined SEM-mechanical approach identified critical gaps in testing protocols and enables evidence-based adhesive selection, as current EN 12004 classifications, which are based solely on mechanical properties, prove insufficient.
Keywords:
polymer-modified cement adhesives
; UV degradation
; porcelain stoneware adhered veneers
; interface failure
; microstructural analysis
; pull-off strength
; Mediterranean climate
; testing standards
; tile delamination
; environmental exposure
1. Introduction
The failure of ceramic tile façades is a critical issue in sustainable global construction, which results in building deterioration, energy inefficiency, and environmental degradation. Ceramic tile façades are widely used as construction materials due to their aesthetic appeal and long-lasting properties. Commonly, they are integrated into composite systems that fail, undermining the high cost of implementing the veneer [1,2]. The influence of material selection is fundamental to building sustainability: sustainable building materials directly affect structural integrity and operational efficiency [3]. Nevertheless, in ceramic façades, when processes such as adhesive failure, substrate degradation, and environmental weathering occur, one needs a comprehensive understanding of the many possible degradation phenomena [4].
1.1. Ceramic Facade Failures and Environmental Degradation
The need for systematic methodologies for predicting service life has become increasingly important in modern practice. The pioneer research conducted by Shohet and Laufer [7] laid the foundation for the more in-depth techniques developed by Shohet and Paciuk [8,9]. They introduced a practical empirical method for forecasting the service life of components, based on systematic field surveys and statistical evaluation. Predictable models (R² values of 0.86-0.93 at the 0.0001 significance level) predicted a typical deterioration path, based on regression analyses of findings from their investigation of exterior cladding under case-control and failure scenarios. Modern degradation index-based models build on these principles by means of severity-of-degradation indices that relate facade deterioration to age and building characteristics [10]. Quantitative assessments reveal significant variations across different regions: the average service life of 43-45 years in Brasília, Brazil, is notably comparable to the 46-50 years estimated for Portugal, illustrating the relevance of these methods in diverse climatic and construction contexts. Degradation of the facade is polynomially progressive, with a slow initial change followed by subsequent acceleration due to natural aging processes of defect accumulation and low maintenance [10].
Environmental stressors form complex degradation pathways that significantly affect facade durability. Hot and dry climates pose challenges, with wide temperature variations, intense solar radiation, limited rainfall, heavy UV radiation, and wind-blown particles. Climate change projections indicate that many regions are heading towards hotter, drier conditions, including the Mediterranean region, which is expected to evolve towards a hot-summer climate by 2071-2100 [11]. Temperature changes run the gamut from 20-30°C during the day, increasing exposure to recurring thermal stress cycles that, over time, result in cracks, gaps, and structural failures. Thermal stress primarily affects materials with the highest thermal expansion coefficients, and polymer materials show the most pronounced alterations due to changes in chemical composition [11,12]. In fact, UV radiation is one of the most violent factors accelerating surface degradation, and, through photochemical reactions that break polymer chains, it is one of its most significant effects. As a consequence of the effect of UV radiation and elevation of temperature, an enhanced synergy exists, which is greater than that of any effect of individual factors, and surface temperatures exceed more than normal air conditions up to twenty-30 °C on account of solar heating [12].
Extensive investigations of 300 facades under six cladding types can lead to the generation of two degradation types, including Group I (most durable): ceramic tiling systems (CTS), natural stone claddings (NSC), and architectural concrete facades (ACF) and Group II (least durable): rendered facades, painted surfaces, or External Thermal Insulation Composite Systems (ETICS) [13]. In comparison, CTS shows the best performance, with 75% of its samples having degradation indices below 4%. In contrast, ETICS shows the worst performance, with very poor performance and a strong susceptibility to moisture degradation. Brasília studies applied the Degradation Measurement Method to 117 ceramic tiling systems, revealing that facades subjected to a heavy load of driving rain and solar radiation had service life estimates of about 26 years, while facades exposed to a low load only had service life estimates of about 35 years [14]. Facade orientation significantly influences degradation through varying levels of solar radiation. South-facing facades, in conjunction with the effects of wind-driven rain and thermal cycling, demonstrate less degradation compared to their north-facing counterparts [13]. The specificities of urban environments amplify failures beyond the generalities observed in other systems, where facades are exposed to acid rain, higher atmospheric carbon dioxide levels, and harmful chemical agents not characteristic of rural environments [15]. Air pollution, particularly emissions from automobiles (including CO, SO₂, NO₂, NOₓ, and PM₁₀), affects 72% of the facades examined. Elevated levels of pollution notably influence the degradation quality by promoting gypsum formation and the dissolution of carbonates [13,16]. The service life of buildings with severe exposure to pollution would end at about 37 years, while 43 years would be the service life in a protected environment, as a consequence of the aggressive chemical effects of pollutants in the urban environment [10].
1.2. Knowledge Gaps and Research Objectives
However, even though there has been significant progress in materials science, there is still a significant amount of in-depth research and understanding necessary to understand complex adhesion and interfacial failure, as well as the long-term performance of ceramic-adhesive composites under environmental tension. The current data on the ceramic-adhesive interface state consists largely of fragmentary knowledge, notably the major physicochemical characteristics of bonding and interfacial transition mechanisms. Conceptualized within conventional adhesion theories, the application of classical theory to complex ceramic-polymer cement systems is found to limit its applicability severely. Other studies showed improved surface modification results with organosilane coupling agents, as evidenced by bond-strength enhancements of up to 36% on mercaptosilane-modified surfaces and 20% on aminosilane-modified surfaces [17]. But the enhancement still focuses on specific chemical functionalities, and the underlying mechanism remains unclear. The gaps in knowledge remain significant to unravel the interactions of organosilane functional groups with polymer-modified mortars: hydrophilic silanes (mercapto, amino, isocyanate) significantly enhance adhesion, whereas hydrophobic silanes (vinylsilane) result in a 70% reduction [18].
Studies on interface topography point out the need for systematic characterization of surface energy structure, wettability, and molecular-level structural interactions at ceramic-polymer interfaces. Contemporary research on interfacial transition zones (ITZ) between ceramic tiles and adhesive mortars reports ITZ thicknesses ranging from 15 to 40 μm, with calcium-to-silicon ratios indicating bond strength [19]. But this has not been applied in contemporary polymer-cement adhesive systems, as the interface chemistry encompasses complicated dynamics between inorganic cement hydrates, organic polymer phases, and ceramic surfaces. SEM analysis of the microstructural evolution of polymer-cement adhesives subjected to environmental stress reveals intricate interactions between organic and inorganic phases, resulting in microstructures that affect not only mechanical properties but also durability. The SEM studies show polymer modifications produce characteristic patterns like polymer film formation, pore-structure changing, and ITZ formation [20]. The formation of polymer film in cement matrices is critically dependent on the condition at the curing point, where temperature and humidity affect polymer coalescence and distribution across cement matrices [21]. Studies prove that incomplete polymer film and the formation of microstructural heterogeneities may create microstructural differences, which become preferred paths for environmental degradation during application, and these may also contribute to environmental degradation pathways, especially in ceramic tiles, because of the field process that can lead to improper curing of tiles. The environmental degradation pathways affecting a ceramic-adhesive interface remain largely under-characterized, but are an important criterion of long-term performance. Presence of moisture enhances degradation by promoting multiple pathways: dissolution of cement hydration products, freeze-thaw damage in temperate climates, and the development of osmotic pressure at interfaces [22]. Due to the mutual contributions of moisture, temperature cycling, and UV radiation, degradation conditions for which individual environmental exposure protocols fail effectively are given. It has been found in previous studies that joint environmental stress creates modes of failure qualitatively different from the single-factor test failure [23,24].
Photochemical degradation of polymer phases in adhesives is a particularly important mechanism that should be considered, but it is insufficiently covered in today’s testing standard. UV radiation in the 280-400 nm range has enough photon energy to activate polymer chain scission on the ground by direct photolysis and free radical processes [25]. Research on polymer-modified cement found that UV radiation in the fresh adhesive period may result in damaging and severe degradation of the organic material before the protective cement hydration products fully develop [26]. Current testing designs cannot replicate the field exposure conditions enough for the pivotal adhesive insertion period. Standard protocols consider post-cure thermal aging effects and fail to account for UV light, hygrothermal cycling, and synergistic environmental stressors experienced during working time, periods when adhesives become most susceptible [27].
The connection between these initial adhesive application conditions and future failure performance is known to be a major limitation since the variable of degradation in the conventional systems is explained by the variation of installation quality, accounting for 58% [14]. No predictive models have been developed to account for failure mode transitions with varying environmental conditions [27]. Concepts for the characterization of chemistry, physical, and mechanical properties of altered interfaces must develop suitable methodologies for standardization. The correlation of knowledge of ceramic-adhesive interface with more general building envelope performance assessment methods is still emerging, as the classical moisture management protocols are inadequate and cannot accommodate the intricate interplay of individual material properties, practices adopted for the implementation, and environmental impact with moisture exposure [28].
Several research models in modern buildings have recently started to consider the intricacy of the facade sustainability assessment framework. Nevertheless, only a few studies cover whole buildings, and many studies lack examining building-independent constructions, like envelope and facade [29]. This discrepancy cannot be more significant when it comes to facades, the initial defense against external influence - and the single most important component to building sustainability, due to the reduction of energy usage and the enhancement of thermal comfort. This study fills this gap by analyzing the adhesion behavior of polymer-modified cement tile adhesive in an environment that simulates the Eastern Mediterranean and desert climate scenarios, focusing on the UV exposure (especially at the fresh adhesive period) - a principal field property that is not covered in current practice. This study uses integrated microstructural analysis with scanning electron microscopy and tests the mechanical performance to distinguish pathways of environmental degradation and establish quantitative relationships between micro-scale damage patterns and macroscopic adhesion performance. This method allows for the selection of adhesive materials based on actual, evidence-based assessment and evaluation in difficult ecologies, in contrast to previous classification systems based on mechanical properties alone.
2. Standards, Practices, and Performance Mechanisms in External Ceramic Cladding Systems
The performance and longevity of external ceramic cladding systems depend fundamentally on integrating appropriate standards, construction practices, and an understanding of the underlying performance mechanisms. This chapter examines technical frameworks, standardization efforts, and scientific knowledge of the degradation mechanisms that govern contemporary practice.
2.1. Current Standards and Testing Protocols
New standards for externally mounted ceramic cladding are international, regional, or national in scope, covering everything from material characteristics to installation requirements. The European standards framework includes detailed specs: EN 12004 for adhesives, EN 14411 for ceramic tiles, and EN 13888-2 for grouting materials [30,31,32], detailing standards detail performance requirements including adhesive tensile strength specifications (typically 1.0 MPa for external applications), limits on water absorption for ceramic tiles (0.5% to 20% based on classification), and chemical resistance specifications. Due to their emphasis on performance-based testing methodologies, ASTM C482 [33] describes bond-strength testing for concrete building construction materials, whilst the ANSI A108 series outlines comprehensive installation standards [34]. Japanese Industrial Standards (JIS A 5209) develop performance standards emphasizing thermal shock resistance and long-term durability against earthquakes [35]. Installation standards represent an important link between specifications and performance in the field. German requirements set by DIN 18515 standards [36], which cover all requirements for external wall cladding installation, are more complex, and Australian specifications such as AS 3958 standards [37] are available to provide the exact frequency of inspection and installation testing requirements, including pull-off testing at specified frequency intervals and adhesive coverage check [38].
Mechanical, thermal, and durability tests are part of the standard test methodologies for assessing ceramic cladding system performance. According to EN 1542, pull-off testing quantitatively measures adhesive bond strength, although acceptance standards vary from 0.5 MPa for protected applications to 1.5 MPa for harmful exposure [39]. Thermal cycling testing protocols such as ASTM C1026 and ISO 10545-9 are developed to simulate the years of service used through the controlled temperature changes for ceramic assemblies [39,40]. Water absorption and permeability test, as specified in EN 12808 and ASTM C413, is an important method for evaluating the resistance of grouted assemblies to penetration rates of the moisture [41,42], which provides vital data. Yet it is usually not possible to account for weathering and aging in terms of permeability attributes.
2.2. Interfacial Bonding and Failure Mechanisms
The interfacial chemistry between ceramic tiles and polymer-cement adhesives is driven by physical and chemical interactions that significantly influence both the initial bond strength and the long-term durability of the materials. Surface energy affects the initial bond formation and wetting behavior, influencing both the contact area and the degree of mechanical interlocking. Treatments such as sandblasting, acid etching, and chemical functionalization can significantly modify ceramic surfaces, resulting in substantial changes in surface energy and adhesion properties. Chemical bonding of organosilane coupling agents with ceramics is achieved through hydrolysis of alkoxysilane groups and condensation reactions to form covalent Si-O-Si bonds with surface hydroxyl groups, achieving bond-strength improvements of 20-36% across different functional group chemistries. Nevertheless, their long-term stability under environmental stress remains under investigation.
Ceramic-adhesive interfaces must be mechanically tested, and some separation of interfacial properties from bulk material properties must be done. Pull-off testing, as prescribed by EN 1542, is a practical procedure for assessing bond strength and a standard method; however, data analysis relies on the mode of failure, stress distribution, and material properties [38]. The use of shear testing approaches, including lap shear and torsional shear tests, provides additional insight into interfacial performance under various loading conditions [43], in addition to shear and tensile bond strengths, which may exhibit different sensitivities to environmental conditioning and aging. Fracture mechanics techniques provide a more fundamental characterization by quantifying release rates of critical strain energy and fracture toughness parameters, offering in-depth insight into crack initiation and propagation characteristics that are not possible with traditional strength testing [44].
3. Research Objectives
The extensive review in Chapters 1 and 2 demonstrates that ceramic tile facade failures constitute a principal problem in sustainable construction. The prevalence of adhesive failures in the interface between tiles and the mortar, representing between 77-83% of recorded cases, and underlying knowledge gaps in interfacial response under environmental loading, require specific directions for research to ameliorate these problems [4,27]. Current standards do not address the effect of the complex environmental variables during installation. Pull-off tests assess adhesive performance under controlled laboratory or thermal conditions, which fail to adequately mimic the UV exposure scenarios found in actual construction environments [39]. Although installation quality explains 58% of the variation in degradation in conventional systems, a systematic understanding of how environmental installation conditions affect long-term adhesion performance remains largely absent from current practice [14].
By integrating microstructural analysis with mechanical performance evaluations, this research established correlations between environmental conditions during tile installation and the adhesive bond strength in external ceramic tile veneers. Specific environmental exposure conditions for Eastern Mediterranean/desert climates; the study investigates reference conditions (23°C, 50% RH) to provide a baseline performance reference, hot-arid exposure (30°C elevated temperature during 60-minute pot life then 20-minute exposure at 30°C/40% RH simulating reduced humidity during open time), combined hot-UV exposure (30°C elevated temperature during pot life followed by 20-minute UV exposure at 295-365 nm, 1.5-2.0 mW/cm²).
This investigation systematically reviews three commercial polymer-modified cement adhesives that differ in their mechanical properties (C2TE, C2TE-S2, C2T) in accordance with EN 12004 [30]. Data collected has been used to standardize concrete substrates and porcelain stoneware tiles for all investigations (water absorption < 0.5%) to facilitate standardization and a more immediate translation of the results into practical situations. The study is based on the integrated assessment methodology, incorporating scanning electron microscopy (SEM), which was used for microstructural analysis of fracture surfaces and pull-off adhesion testing in accordance with EN 1348 [51]. Three numerical microstructural parameters facilitate characterization of degradation mechanisms via digital imaging: crack density (mm/mm²) quantifies bulk damage accumulation; fracture surface directionality (goodness and dispersion parameters) indicates whether failure occurred along organized interface planes or random bulk networks; and delamination percentage measures tile-adhesive interface separation.
An integrated method has the potential to predict adhesive placement based on specific climatic characteristics and to be used in projects where current engineering classification parameters based solely on mechanical properties are not complete per EN 12004 [30].
4. Materials and Methods
4.1. Materials Characterization
Material selection and characterization procedures comply with Israeli and European requirements for external ceramic tile applications. The adhesive specifications are regulated by Israeli Standard SI 4004 [48]. Their classification criteria are the same as European Standard EN 12004 [30], including all key performance values such as the amount of open time (20 minutes or more according to EN 1346 [49]), slip resistance (≤0.5 mm according to EN 1308 [50]), and application temperature limits (5-35°C). European standards also offer other methods for analysis, including tensile bond strength (EN 1348 [51]) and deformation capability assessment (EN 12002 [52]). Israeli Standard SI 1555 Part 1 [53] specifies minimum bond strength (average 0.5 MPa, minimum for an individual specimen 0.25 MPa) and installed practices according to tile size. Tile characterization is described according to the Israeli Standard SI 314 [54] and the European Standard EN 14411 [31] by tile water absorption profiles: Group B-I-a (≤0.5%) for porcelain stoneware and Group B-II-a (3-6%) for ceramic tiles.
Three commercially available polymer-modified cement adhesives were selected, corresponding to various formulations widely used in outdoor ceramic tile applications (Table 1).
The adhesive selection is a systematic progression of mechanical properties according to type of Adhesive based on EN 12004 [30] classification: Adhesive 1 has the highest stiffness (elastic modulus 6300–9000 MPa) with C2TE classification, Adhesive 2 exhibits the highest flexibility (elastic modulus 1800–2800 MPa) with C2TE-S2 classification, and Adhesive 3 presents intermediate stiffness (elastic modulus 3400–3900 MPa) with C2T classification. All adhesives are compliant with the requirements of Israeli Standard IS 4004 [48] for external applications and are enhanced C2 classification compliant with EN 12004 [30], which requires a tensile bond strength greater than 1.0 MPa, as specified in EN 1348 [51]. Dry industrialized mixtures and water were acclimatized for 24 hours at normal reference conditions (21°C/55% RH) or in hot-climate chambers (30°C/40% RH). Each cement batch comprises 8.3 kg of dry mixture and 1.7 kg of water, as recommended by the manufacturer. Mixing was carried out using a 10 L laboratory paddle mixer to blend all the cement homogeneously. Then the polymer was evenly distributed by five to ten minutes of maturation, followed by further mixing for about 1.5 minutes.
Tiles have been designated as water-absorbing materials according to Israeli Standard SI 314 [54] and European Standard EN 14411 [31] (Table 2).
Porcelain Stoneware (<0.5% water absorption) is a typical low-porosity ceramic tile used in exterior applications in Israel and is classified as Group B-I-a per EN 14411 [31]. For standardization of the experiment, samples measuring 50×50 mm were cut with a diamond blade according to SI 314 [54]. Specimens were prepared and cured in normal experimental conditions (20°C and 65% RH) for 24 h before testing.
The substrates used were standardized precast concrete blocks (Type A, Aloni Ltd.) as described in Table 3. The concrete blocks conform to Israeli Standard SI 216 [55] for precast concrete products and provide a standardized surface for evaluating adhesive bond strength per EN 1348 [51], with sufficient mechanical strength to ensure cohesive failure within the adhesive rather than substrate failure during pull-off testing per SI 1555 [53].
4.2. Tile Installation and Environmental Conditioning
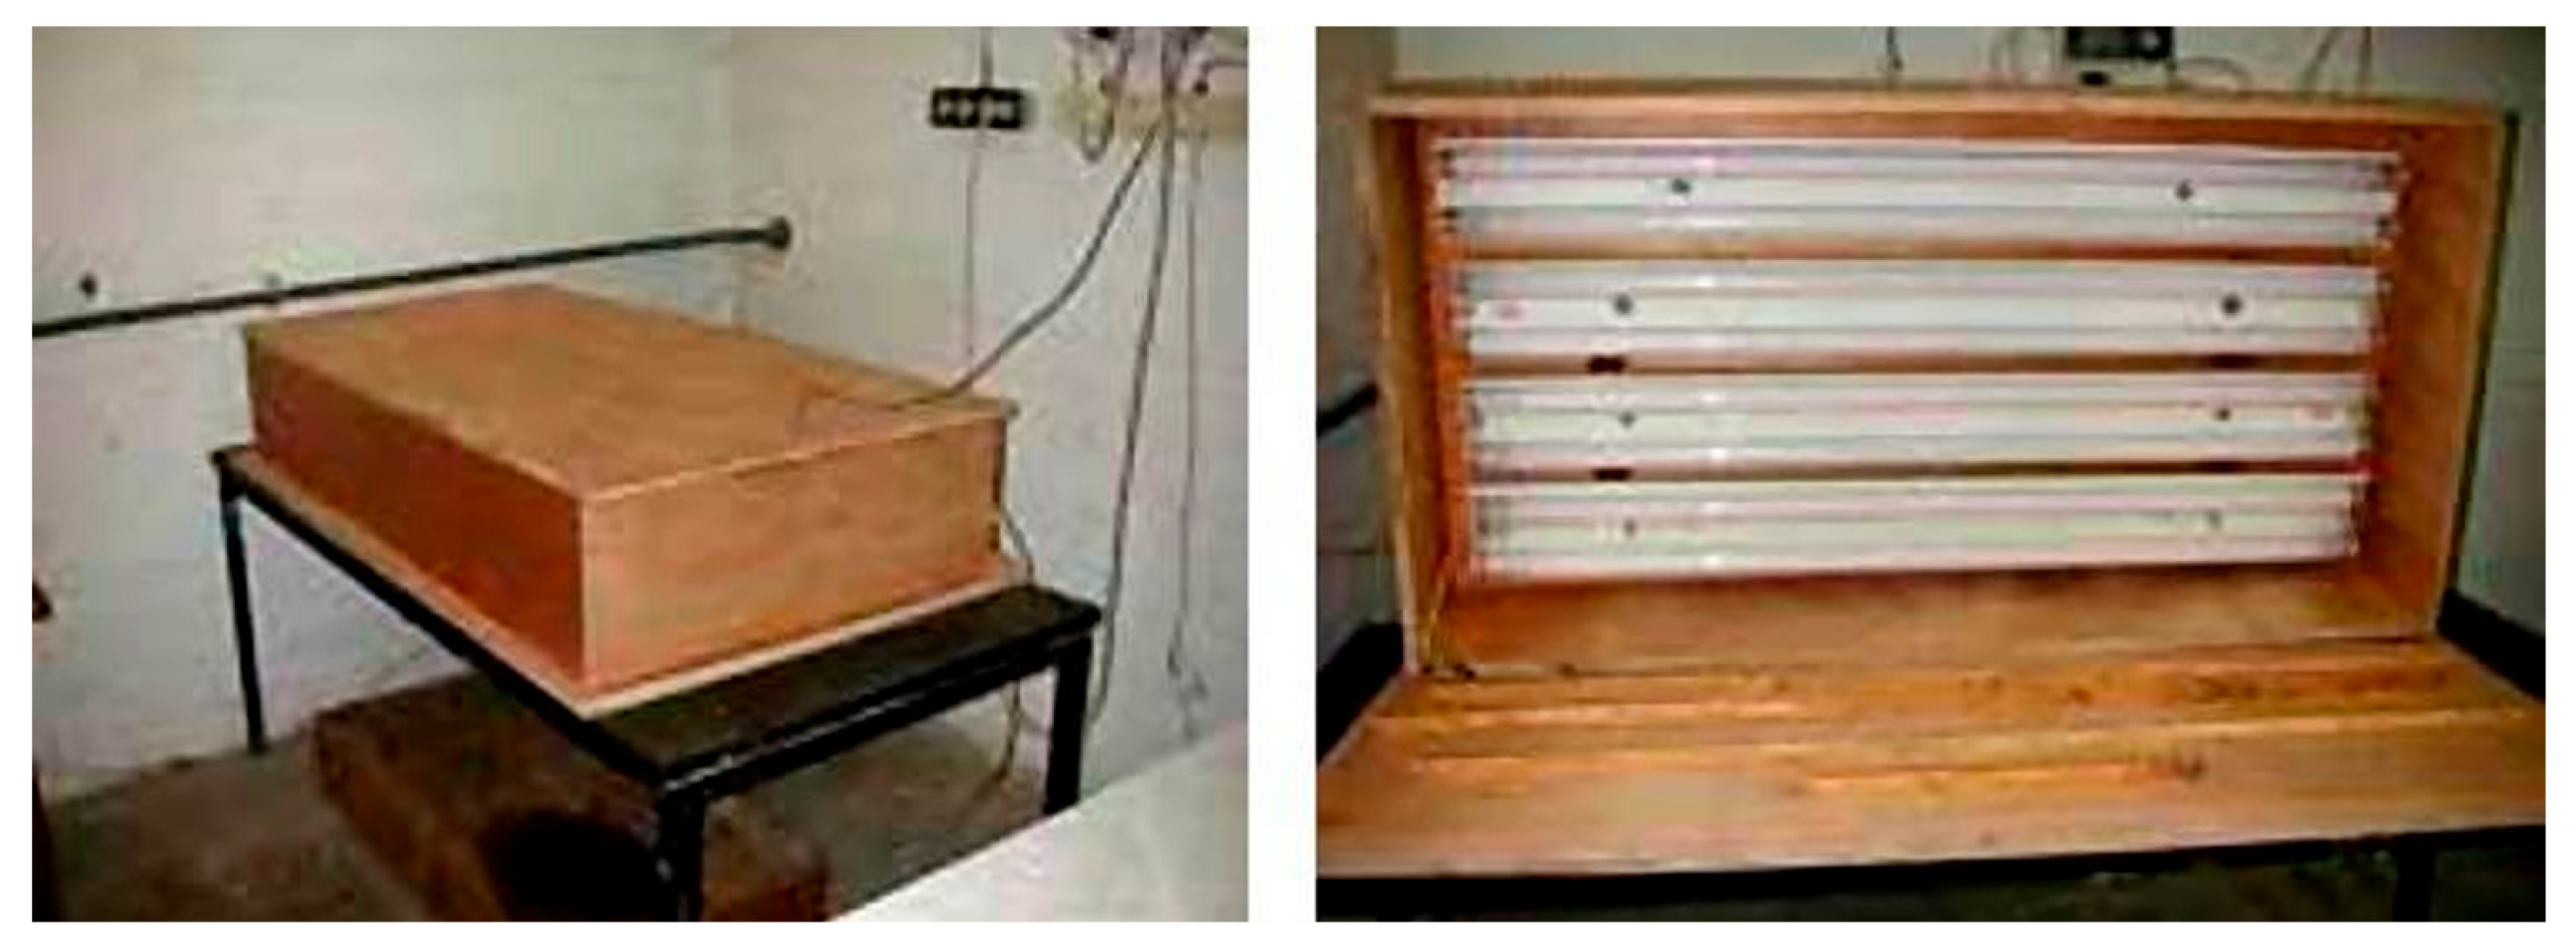
Installation of ceramic tiles was performed according to the Israeli Standard SI 1555 Part 1 [53]. The thickness of the adhesive layer was maintained at 6-7 mm using a specialized plastic plate fixture (See Figure A1.1, Appendix A1). Each concrete substrate housed five ceramic tiles. Controlled environmental conditioning simulated high temperatures, ultraviolet radiation, and humidity to emulate hot ceramic cladding field conditions. Prior to tile installation, substrates and tiles were acclimatized for 24 hours in reference laboratory (RC - 21°C/65%RH), simulated arid (AC - 30°C/40%RH), and simulated Mediterranean coastal hot (HC - 30°C/65%RH) conditions. Facade surfaces in hot Mediterranean climates can reach temperatures ranging from 30-65°C in direct sunlight [12]. Following adhesive application, the specimens were exposed for 0 or 20 minutes in the reference laboratory (RC - 20±1°C/65%RH) with polyethylene covering, simulated hot conditions (HC - 30±1°C/65%RH) with polyethylene covering, simulated arid conditions (AC - 30±1°C/40%RH) with polyethylene covering, or simulated direct UV radiation exposures. The applied UV intensity was adjusted based on direct measurements in the Neve Shaanan district in Haifa, Israel (see Appendix A2), and natural solar radiation levels were measured (ranging from 1.4-2.4 mW/cm²) under different sky conditions, using the UV Light Meter Tester Photometer Model YK-35UV (Lutron, Taiwan). Eight UVA-340 lamps were used in the simulated UV exposure, peak emission at 340 nm at 8 cm separation and 15 cm above the adhesive surface, simulating the practical observation of solar ultraviolet light radiation (295–365 nm) according to ASTM G154’s standard for fluorescent UV irradiation [13] (see Figure A1.2, Appendix A1). 72% glycerin solutions provided constant humidity. Conditioning occurred during the adhesive optimal pot life (60 min) and during the experimental “open” period (0-20 min), based on laboratory studies and realistic delay estimates from the time of initial adhesive application to when the tiles were placed. The systematic sample specification process is presented in Table 4.
Each experimental condition was tested with two replicate specimens (denoted A and B in the Tables), except when material availability limited testing to a single specimen, as indicated in the results tables.
- Example 1: T1-A1-RC (60+20)-80A (Porcelain Stoneware with Adhesive formulation 1, prepared and kept in Reference conditions for 60 min, and exposed to Reference Conditions for 20 minutes before tile bonding, Replicate A).
- Example 2: T1-A2-HC60+AC20-80A (Porcelain Stoneware with Adhesive formulation 2, prepared and kept in Hot conditions for 60 min, and exposed to Arid Conditions for 20 minutes before tile bonding, Replicate A).
- Example 3: T1-A3-HC60+UV20-80B (Porcelain Stoneware with Adhesive formulation 3, prepared and kept in Hot conditions for 60 min, and exposed to UV for 20 minutes before tile bonding, Replicate B).
Following conditioning, reference specimens were cured under standard laboratory conditions (21°C/65% RH) for 28 days, while environmental specimens underwent accelerated aging in custom chambers under hot conditions (30°C/65% RH) with constant humidity achieved using 72% glycerin solutions.
4.3. Testing Methodology
Fractured pull-off adhesive surfaces were studied by scanning electron microscopy (SEM) under varying environmental conditions during the installation process to characterize the internal microstructure and investigate microstructural alterations that occurred following accelerated aging procedures. To investigate the impact of environmental exposure on adhesive matrix integrity and interfacial bonding properties, SEM was used to characterize the microstructure. Preparation of samples was performed according to the standard procedure for cementitious materials, including vacuum impregnation in epoxy resin, polishing with diamond suspensions to a one μm finish, and carbon coating to achieve good conductivity during imaging. High-resolution imaging was performed with secondary electron (SE) detection at x2000 magnification to capture hard adhesive surfaces after pull-off, with specific attention paid to the interface between the adhesive and the ceramic substrate, which typically ranged in thickness from 15–40 μm. An axial tensile adhesion (pull-off) test was performed to assess adhesive performance in accordance with Israeli Standards SI 1555 Part 1 [14] and SI 4004 [15].
The ceramic and porcelain tile assemblies adhered to precast concrete panels were tested using calibrated pull-off equipment, and failure patterns were recorded in accordance with Israeli and European standards. The adhesive bond strength was measured at 28 days. [27] found adhesive failure at the tile-adhesive interface (AF-T), the most common failure mode in ceramic facade systems, thus informed the failure classification scheme applied above, where cohesive failure in adhesive (CF-A), cohesive failure of substrate (CF-S), and adhesive failure at the substrate (AF-S) or tile interface (AF-T) were characterized, presented in Figure 1.
Using digital photographs of pull-off specimens, the percentage of delamination was calculated by measuring the area of separation of the tile-adhesive interface compared to the aggregate fracture surface area, which allowed us to identify failure at the interface through visual inspection, then classify them according to failure in the form of AF-T, AF-S, CF-A, and CF-S.
SEM micrographs were estimated quantitatively using ImageJ software [65] to investigate the microstructural characteristics of polymer-modified cementitious adhesives affected by various environmental conditions. This analysis included the quantification of crack networks through automated edge detection. Furthermore, interface zones were studied using digital morphological techniques, revealing widths between 15 and 40 μm in ceramic adhesive systems [19]. A detailed description of the methodology is provided in Table 5.
Microcrack network measurements were quantitatively characterized by various skeletal analysis approaches that have been previously done for cementitious materials [59,60,61]. High-resolution SEM images were achieved at ×2000 magnification following standard FIJI/ImageJ procedures that consisted of binary segmentation, morphological cleaning, skeletonization, and topological network extraction. Surface-connected microcracks ≥1 μm wide with an acceptable field of view (70-100 μm coverage at 50 nm per pixel spatial resolution) were observed in the imaging protocol to characterize typical crack network regions [63]. The backbone-based measurement process transforms binary crack maps into one-pixel-wide centers with network topology remaining the same, providing the extraction of primary microstructural attributes. The protocol has a good mechanical predicting relationship (R² > 0.90) [61]. Studies on polymer-modified cementitious systems have confirmed that microstructural alterations caused by outdoor use in construction can affect the formation of polymer films and the integrity of the matrix [21,24,67,68,69].
Microstructural conditions have four quantitative parameters: total crack length (mm/mm²) for each region gives direct measurement of micro-structural damage extent that is positively associated with the bond strength reduction, mean branch length (μm) indicates average length of individual crack segments between junction points, representing fracture behavior of material with segment-length distributions indicating differences in matrix brittleness and crack propagation mechanics; tortuosity represents actual crack path length / straight-line distance between endpoints, where value of 1.0 corresponds to straight crack paths and a higher value that refers to sinuous paths quantifies energy dissipation characteristics; Branching index (junctions/mm) indicates the number of cracks intersection points per unit length, indicative of damage interconnection network of high degree of branching indicating more advanced, interconnected crack systems that are a characteristic of advanced material deterioration. A directional assessment of fracture surfaces revealed during pull-off was performed using fast Fourier transform-based approaches to analyze the topographic organization of impaired adhesive surfaces [66]. Hardened adhesive surfaces were assessed on secondary electron imaging after mechanical tests, where intricate topographical structures of bond failure were detected. Gaussian smoothing (σ=1.0 pixels) has been employed to reduce noise while preserving orientation data.
The FIJI directionality module pulled orientation histograms with 1-degree angle resolution to quantify the surface feature alignment descriptor. It has been argued that environmental features would modify the microstructural qualities of polymer-modified adhesive systems and, consequently, the mechanical behavior and failure mechanisms [67,68,69]. The main parameters responsible for the description of fracture surface organization are direction (°), indicating center of dominant Gaussian peak in the orientation histogram, representing preferred alignment angle of topographic features to applied stress direction and between -90° and +90° as defined according to standard mathematical convention, 0° represents horizontal orientation and angles increasing counterclockwise [64]; dispersion (°) signifies angular dispersion of orientations based on primary direction, where low value (<20°) show clear fracture patterns with a common feature alignment whereas high value (>30°) describe distribution containing multiple competing orientations, measuring the degree of overall orientation coherence for failure surface topology; goodness is a coherence parameter from 0 (random orientation distribution) to 1 (perfectly organized structure) measuring reliability and strength of directional measurements, with values approaching 1 indicating strong directional preferences and values near 0 indicating complex, multi-directional topographic patterns.
5. Results
5.1. SEM Observations
Scanning electron microscopy characterization of adhesives 1-3 following environmental exposure during the uncured period revealed distinct microstructural modifications (Figure 2, Figure 3 and Figure 4). All specimens were exposed to environmental conditioning protocols before porcelain tile bonding, then cured for 28 days before microscopic examination.
5.2. Fracture Surface Directionality Analysis
Fracture surface topographies were quantified using directionality analysis following the methodology described in Section 4.3.3. The directionality analysis of fracture surface topographies was performed to quantify the fracture surface topographies in accordance with the method specified in Section 4.3.3. Four parameters describe the angular distribution of surface features: direction (°) specifies the dominant orientation angle; dispersion (°) measures the angular spread around the dominant direction; amount (0-1) represents the fraction of the surface exhibiting directional preference; and goodness (0-1) quantifies how well the measured distribution fits the expected directional model. Table 6 illustrates the values for all the specimens evaluated.
Results for all tested specimens are presented in Table 6.
Negative directional values suggest that fracture characteristics are aligned in certain quadrants in relation to the direction of applied stress. When goodness values exceed 0.6 and dispersion is below 20°, this signifies the presence of coherent directional cracking. Conversely, low amount values under 0.3 combined with high dispersion above 25° point to surface textures that are predominantly random.
5.3. Crack Network Quantification
Crack networks in adhesive fracture surfaces were measured using skeleton analysis, as described in Section 4.3.2.1>. Crack network can be characterized by four geometric parameters: crack density (total crack length per unit area, mm/mm²), mean branch length (average length of individual crack segments between junction points, µm), tortuosity (the ratio between the length of the path and straight-line distance), and branching index (number of junction points per unit length).
The results are summarized in Table 7.
Value ranges are values taken from duplicate samples (A/B sample sets) for each adhesive-exposure combination. Single values are calculated from individual samples. Adhesive A3 showed exceptionally high crack density (1111-1425 mm/mm²) under both hot + arid and hot + UV conditions, approximately 50-fold higher than reference values (24-46 mm/mm²). Adhesives A1 and A2 demonstrated modest crack density variations (24-52 mm/mm²) across all exposure conditions.
5.4. Pull-Off Testing Results
5.4.1. Adhesion Strength by Exposure Condition
Pull-off testing conducted within 28 days of curing time, per SI 1555 Part 1 [53] and SI 4004 [48], showed wide-ranging performance differences under environmental exposure conditions (Table 8). The performance testing program consisted of nine ceramic adhesive system configurations in three adhesive formulations (A1, A2, A3) under three environmental exposure protocols applied during the installation period.
Mean pull-off strength of reference condition samples (21°C/65%RH) was rated 1.77 MPa (between 1.5-2.0 MPa, CV 14%). However, hot + arid exposure (30°C/40 % RH) lowered mean strength to 0.64 MPa (range: 0.6-0.7 MPa, CV 9%), i.e., 64% of the reference conditions. For example, a high heat + UV condition (30°C/65%RH, 20 min UV radiation at a range of 295–365 nm, 1.5–2.0 mW/cm²) yields a mean strength of 0.26 MPa (range: 0.1–0.6 MPa, CV 104%), which is an 85% reduction compared to reference factors. The significant coefficient for hot + UV reflects a formulation-dependent response, showing that adhesive A1 maintained a medium strength (0.57 MPa), while adhesives A2 and A3 also showed a substantially lower value (0.10 MPa each).
5.4.2. Failure Mode Distribution
After pull-off testing, failure modes were classified based on a visual inspection of the fracture surfaces. AF-T (adhesive failure at tile-adhesive interface) was present in 8 of 9 specimens. CF-A (cohesive failure within adhesive layer) was observed in one specimen (T1-A1-HC60+AC20-80AB). The AF-T failure mode followed on all specimens (n=3) exposed to UV radiation was 88-100% for delamination, irrespective of adhesive formulation. AF-T failure was observed in 2 of 3 specimens subjected to hot, arid exposure, with one CF-A exception, indicating 26% delamination. AF-T failure occurred in all three specimens under the Reference conditions, and delamination ranged from 47% to 72%.
6. Discussion
6.1. Mechanistic Interpretation of UV-Induced Degradation
6.1.1. Photochemical Polymer Chain Scission
The 85% strength reduction observed under UV exposure (85% strength reduction, from 1.77 to 0.26 MPa) compared with hot + arid conditions (36% reduction, to 0.64 MPa) indicates qualitatively different molecular-level degradation mechanisms. Contemporary polymer-modified cement tile adhesives incorporate re-dispersible polymer powders at 2-5% of dry mass that provide critical functionality during the fresh state, including enhanced workability, improved adhesion, and flexibility after hardening [62,78].
The photon energies between 360-420 kJ/mol of UV radiation in the 295-365 nm wavelength range exceed the bond dissociation energies of the common polymer backbone structures, namely, C-C bonds (330-370 kJ/mol) and C-H bonds (410-440 kJ/mol). Such photon energies are sufficient to initiate photolysis reactions that cleave polymer chains via direct bond breakage [25]. In the specific case of vinyl acetate-ethylene copolymers and styrene-butadiene systems commonly used in tile adhesives, the absorption of UV rays by carbonyl groups and unsaturated bonds creates reactive radical species that propagate chain scission reactions throughout the exposed polymer phase [62].
6.1.2. Interface Layer Formation and Timing Criticality
Vulnerability is a natural part of the adhesive-curing process. Photochemical degradation occurs first in the initial stage (remnant adhesive), whereas cement hydration does not provide the desired protective mineral layers on the surface of the polymer. UV radiation reduces the surface area of the new adhesive, the site of polymer chain scission (see below). With this ongoing, irreversible loss of adhesive functionality, even with anticipated wet cementation afterwards. The resulting damaged surface layer (usually 15-40 µm thick, as measured from interface zones in polymer-cement systems [19]) develops into a unique weak plane at the tile-adhesive interface.
The almost total observation of AF-T failure mode with complete delamination (between 88% and 100%) on UV-exposed specimens suggests that photochemical degradation initiates a preferential failure path at this interface. Previous studies on polymer-modified cement systems indicate that UV exposure increases the likelihood of over-polymerization or cross-linking on exposed surfaces, leading to skin-centricity and compromising the effectiveness of mechanical bonding and cement hydration [67,68,69,70]. In contrast, high temperatures and low humidity negatively affect the bulk adhesive due to accelerated cement hydration kinetics and moisture loss. This affects the pore structure and morphology of hydration products but does not selectively affect the interface [71,73,74].
6.2. Microstructure-Performance Relationships
6.2.1. Integration of Microstructural and Mechanical Data
Microstructural parameters from adhesive SEM analysis and their macroscopic pull-off performance are in an odd relationship. High fracture surface goodness values (0.65-0.72) after UV exposure are responsible for catastrophically low pull-off strengths (0.10 MPa) of specimens. In contrast, specimens with extensively cracked microstructures (crack density >1200 mm/mm²) exhibit moderate bond strength (0.70 MPa). These seeming contradictions go away only once several degradation modes are recognized for their spatial localization.
Microstructural parameters obtained from SEM images of fracture surfaces were used to characterize the bulk adhesive that remained adhered to the concrete substrate after pull-off tests. The integrated dataset, presented in Table 9, comprises fracture surface directionality (Table 6), crack network descriptors (Table 7), and pull-off performance measures (Table 8), which systematically examine the relationships among surface-based properties across all adhesive formulations and exposure conditions.
6.2.2. Effect of Adhesive Formulation on Environmental Response
The three adhesive formulations can be compared across the exposure conditions, demonstrating how the classification-specific properties affect their degradation mechanisms under various environmental stressors. Thermal expansion mismatch, moisture loss, and the corresponding volumetric differences exploit mechanical property differences of formulations under hot and arid conditions (elevated temperature with reduced humidity).
On the surface, the rigid C2TE formulation (A1), boasting an elastic modulus of more than 6000 MPa (Table 1), is most sensitive to this stress pathway, and cohesive failure is observed within the bulk adhesive, the stiff matrix being unable to perform against imposed strains via deformation. At the same time, A2, a deformable C2TE-S2 formulation with an elastic modulus lower than 3000 MPa (Table 1), improved resistance due to matrix deformation and dissipating stress by preserving interface integrity with adhesive failure (AF-T) (30% for moderate strength retention) compared to A3. The intermediate C2T formulation (A3) obtained the best performance on a hot-arid environment with significant microcracking, maintaining around 39% strength through crack bridging induced due to its balance of elastic modulus of about 3400-3900 MPa (Table 1).
Exposure under both hot and UV conditions generated a critical pathway to degradation that mostly negated the mechanical properties gains achieved from exposure. All three formulations showed interface-dominated failure (AF-T) with high delamination (88-100%), which suggested that photochemical attack of the polymer phase over the fresh adhesive period resulted in a compromised interfacial zone and a preferential failure plane regardless of the bulk adhesive group.
However, residual strength retention varied significantly: the rigid C2TE formulation maintained 38% strength (0.57 MPa) while both flexible C2TE-S2 and intermediate C2T formulations collapsed to 5-5.5% retention (0.10 MPa). Thus, high elastic modulus and compressive strength provide some resistance to complete structural collapse even after interface degradation. In contrast, lower-modulus formulations lose load-bearing capacity once the interface fails.
Group-level statistics (Table 9, bottom rows) quantify these divergent degradation pathways. Hot and arid exposure caused extensive internal damage, with a 14.5-fold increase in the crack density (29.8 to 432.1 mm/mm²) while preserving mean interface integrity, resulting in a moderate 36% mean strength loss (1.77 to 0.64 MPa) and stable fracture. Surface organization (goodness 0.593). In contrast, exposure to both heat and UV strongly damaged the interface, resulting in an 85% mean strength loss (1.77 to 0.26 MPa) and a rise in delamination to 96% despite keeping the same bulk microstructural parameters (goodness 0.552, crack density 469.8 mm/mm²). As the crack density values in hot-arid (432 vs 470 mm/mm²) and hot-UV environments are similar, yet the performance results are vastly different (36% vs 85%), it is evident that adhesive failure of the material occurs through interface degradation, not bulk cracking, when subjected to environmental stresses. Classification as described in EN 12004 [30] is a powerful estimator of formulation performance in mechanical stress pathways (hot-arid conditions). Nonetheless, it does not account for photochemical resistance, which is a significant shortcoming in the existing adhesive testing and classification criteria.
6.3. Formulation-Dependent Responses to Environmental Exposure
The formulation-dependent responses presented in Table 9 support evidence-based adhesive choice taking into account the climatic conditions. The C2T formulation (A3) of intermediate stiffness showed excellent performance in hot, arid desert environments, which feature high temperatures and low humidity during the thermal cycle. This high-performance material assists crack-bridging mechanisms to accommodate bulk damage and prevent interface damage. C2TE-S2 deformable adhesive (A2) demonstrated medium efficacy, bringing its S2 flexibility to dissipate thermal stresses. Alternatively, rigid C2TE (A1) formulations were found to be the least suitable and displayed cohesive failure when placed in the adhesive solid phase due to insufficient strain accommodation capacity.
In Mediterranean coastal media, the predominant degradation process is caused by UV radiation, which is especially detrimental to joints during installation. These formulations showed substantial interface degradation (85-95% of the strength loss), with the rigid C2TE (A1) retaining marginally higher residual strength (38% vs 5% respectively) because of its superior compressive strength and elastic modulus. However, the low UV resistance in all classes suggests that the present formulations have to (1) revised methods of installation to reduce UV exposure during working time by the use of physical shading or timing adjustments at installation; or (2) development of the present formulation that is prepared based on UV-absorbing admixtures or modified polymer chemistry that can resist the photochemical attack during uncured periods.
Although the current EN 12004 classification criteria identify formulations with mechanical stress pathways as having overall different performance compared with formulations without photochemical resistance, this limits their predictive value in high-UV installations.
6.4. Implications for Testing Standards and Field Practice
6.4.1. Critical Gaps in Current Protocols
In fact, current worldwide standards for testing tile adhesives, such as EN 1348 [51] and SI 4004 [48], have accounted for the thermal aging effects of exposure to different temperatures over time but did not account for UV exposure during the crucial period of the fresh adhesive before curing. The EN 12004 [30] classification system specifies heat-aging resistance and deformability characteristics but does not address UV resistance, including any classification or testing methodology.
Here, we show that even brief UV exposure of the fresh polymer-cement adhesives leads to severe degradation of the tile-adhesive interface and substantially reduces long-term bond strength via photochemical processes distinct from thermal ageing. This formulation-dependent UV vulnerability (which occurs when polymer phases are still unprotected by cement hydration products) during the handiwork construction period is a critical field effect in Mediterranean climates and not captured by current post-cure aging protocols.
6.4.2. Proposed Methodology Revisions
Existing global testing requirements for tile adhesives evaluate formulation performance under post-cured aging conditions, but not environmental exposure of materials during the key fresh-adhesive period, when polymer phases remain unprotected by cement hydration products. A unified testing protocol combining two complementary assessment alternatives - standardized exposure protocols designed for grading uses, and microstructural screening for adhesive selection in specific environmental conditions in situ - is necessary. The standardized classification protocol is likely to expose the fresh adhesive with UV radiation (295-365 nm, 1.5-2.0 mW/cm²) for 20 minutes in simulated working time at typical installation temperatures (30°C, 40-65% RH fluctuation), cure specimens under a standardized temperature regime (23°C, 50% RH) for 28 days, test for pull-off according to EN 1348 [51], minimum maintenance toughness levels (e.g., ≥ 70% retention for UV-resistant classification) and failure modes (AF-T, CF-A, CF-S) that are documented with photographic evidence, quantitative delamination percentage and absolute bond strength values.
In particular, the present study shows that a combination of scanning electron microscopy and mechanical performance testing is a practical screening approach for project-specific adhesive selection prior to final material specification. This assessment integrates environmental exposure modes that replicate the anticipated field conditions during operational periods. It involves UV exposure in the wavelength range of 295-365 nm for 20 minutes, relevant to Mediterranean coastal projects; hot-arid environments with temperatures of 30°C and relative humidity of 40%, intended for desert applications.
The analysis includes pull-off testing, as outlined in EN 1348, to evaluate bond strength retention relative to reference conditions quantitatively; losses exceeding 50% indicate that the formulation is unsuitable. Additionally, scanning electron microscopy (SEM) microstructural analysis of fracture surfaces is conducted to identify degradation mechanisms through quantitative parameters: fracture surface directionality (with a goodness factor greater than 0.60 and dispersion below 20° indicating interface-controlled failure; a goodness factor below 0.40 coupled with dispersion above 25° suggesting bulk degradation), crack density (with values over 200 mm/mm² signifying significant microstructural damage), and delamination measurement (greater than 80% confirming dominance of interface failure).
Its execution relies on cross-engineering and collaboration of engineers, testing labs, and manufacturers. Engineers will need to request performance data specific to exposure, such as data that exceeds the standard classifications commonly used for high-exposure applications. Testing laboratories may establish screening protocols based on the methodology herein to provide comparative performance data between formulations under the same exposure conditions. Until standards include UV-resistance testing and classification, this microstructural screening protocol remains the most rigorous method for selecting an evidence-based adhesive in harmful environmental conditions.
6.4.3. Field Installation Practice Modifications
It is clear that new adhesives have long been sensitive to UV radiation, and the time when polymer-modified adhesives must be used should be re-evaluated in field installation activities. Planning recommendations could include: 1) reducing direct sun exposure by tile installation immediately following adhesive application to less than ten minutes; 2) using temporary structures or tarps to shadow during outdoor work; 3) early morning or late afternoon installation when solar radiation intensity drops below 1.0 mW/cm² within the UVA spectrum; 4) making use of portable UV meters deployed to the field to monitor environmental conditions and adjustment of working timing.
If the UV intensity is high and the area is Mediterranean or desert, the engineers could consider designating the adhesive formulations and specifying them in line with the tested methods for UV resistance. However, producing UV-resistant adhesive formulations means that manufacturers must either use UV-absorbing additives or modify polymer chemistry to minimize photochemical vulnerability - a need that existing standards do not encourage via classification guidelines.
7. Conclusions
This study showed that UV light exposure during the fresh adhesive phase leads to intense interfacial degradation of polymer-enhanced cement tile adhesives, with an average bond strength decrease of 85% (1.77 - 0.26 MPa), compared with 36% under hot, dry conditions. Photochemical polymer chain scission occurs prior to cement hydration, which establishes a protective structure, making the interfacial region (15-40 µm) a compromised zone that serves as the favored failure point. This temporal feedback is a central field circumstance not accounted for in existing international recommendations (EN 1348 [51], SI 4004 [48]) and applies only to post-cure thermal aging.
Integration of scanning electron microscopy (SEM) with pull-off testing allows for distinction of environmental degradation paths through three quantitative parameters: crack density quantifies bulk damage, fracture surface directionality indicates whether failure occurs within interface planes (goodness >0.60) or bulk networks (goodness <0.40), and delamination percentage measures interface compromise.
Hot-arid treatment uses differences in mechanical properties; rigid C2TE preparations exhibit bulk cohesive failure, whereas intermediate C2T preparations maintain interface integrity through crack-bridging despite numerous microcracks. UV exposure lacks the mechanical strength advantage and therefore attacks all formulations at the interface (regardless of formulation classification). This combined approach provides predictive capability only where mechanical properties are deemed sufficient, as defined by EN 12004 [30] classifications.
Existing rules should be reworked to mitigate work-related UV exposure. This method comprises exposing the new adhesive to UV treatment at 295-365 nm and a UV intensity of 1.5-2.0 mW/cm² for 20 minutes, followed by 28 days of curing. Retention of this adhesive should be determined at 70% or higher, and the process's duration and completion should be documented, with delamination documentation required as well. Engineers should also use project-related screening that includes exposure simulation, pull-off testing, and SEM readings, and should not accept formulas with >80% strength loss and >90% delamination under UV.
In situ testing requires immediate modification by shifting the schedule (including the working period when UV < 1.0 mW/cm²), implementing physical shading, reducing open time (< 10 min), and conducting on-site observation. Until standards for UV resistance classification are established, the SEM-mechanical screening analysis presented here is the most robust method for evidence-based adhesive selection in Mediterranean and desert climates.
Appendix 1. Experimental Setups
Figure A1.1.
Experimental setup for keeping the adhesive layer thickness.
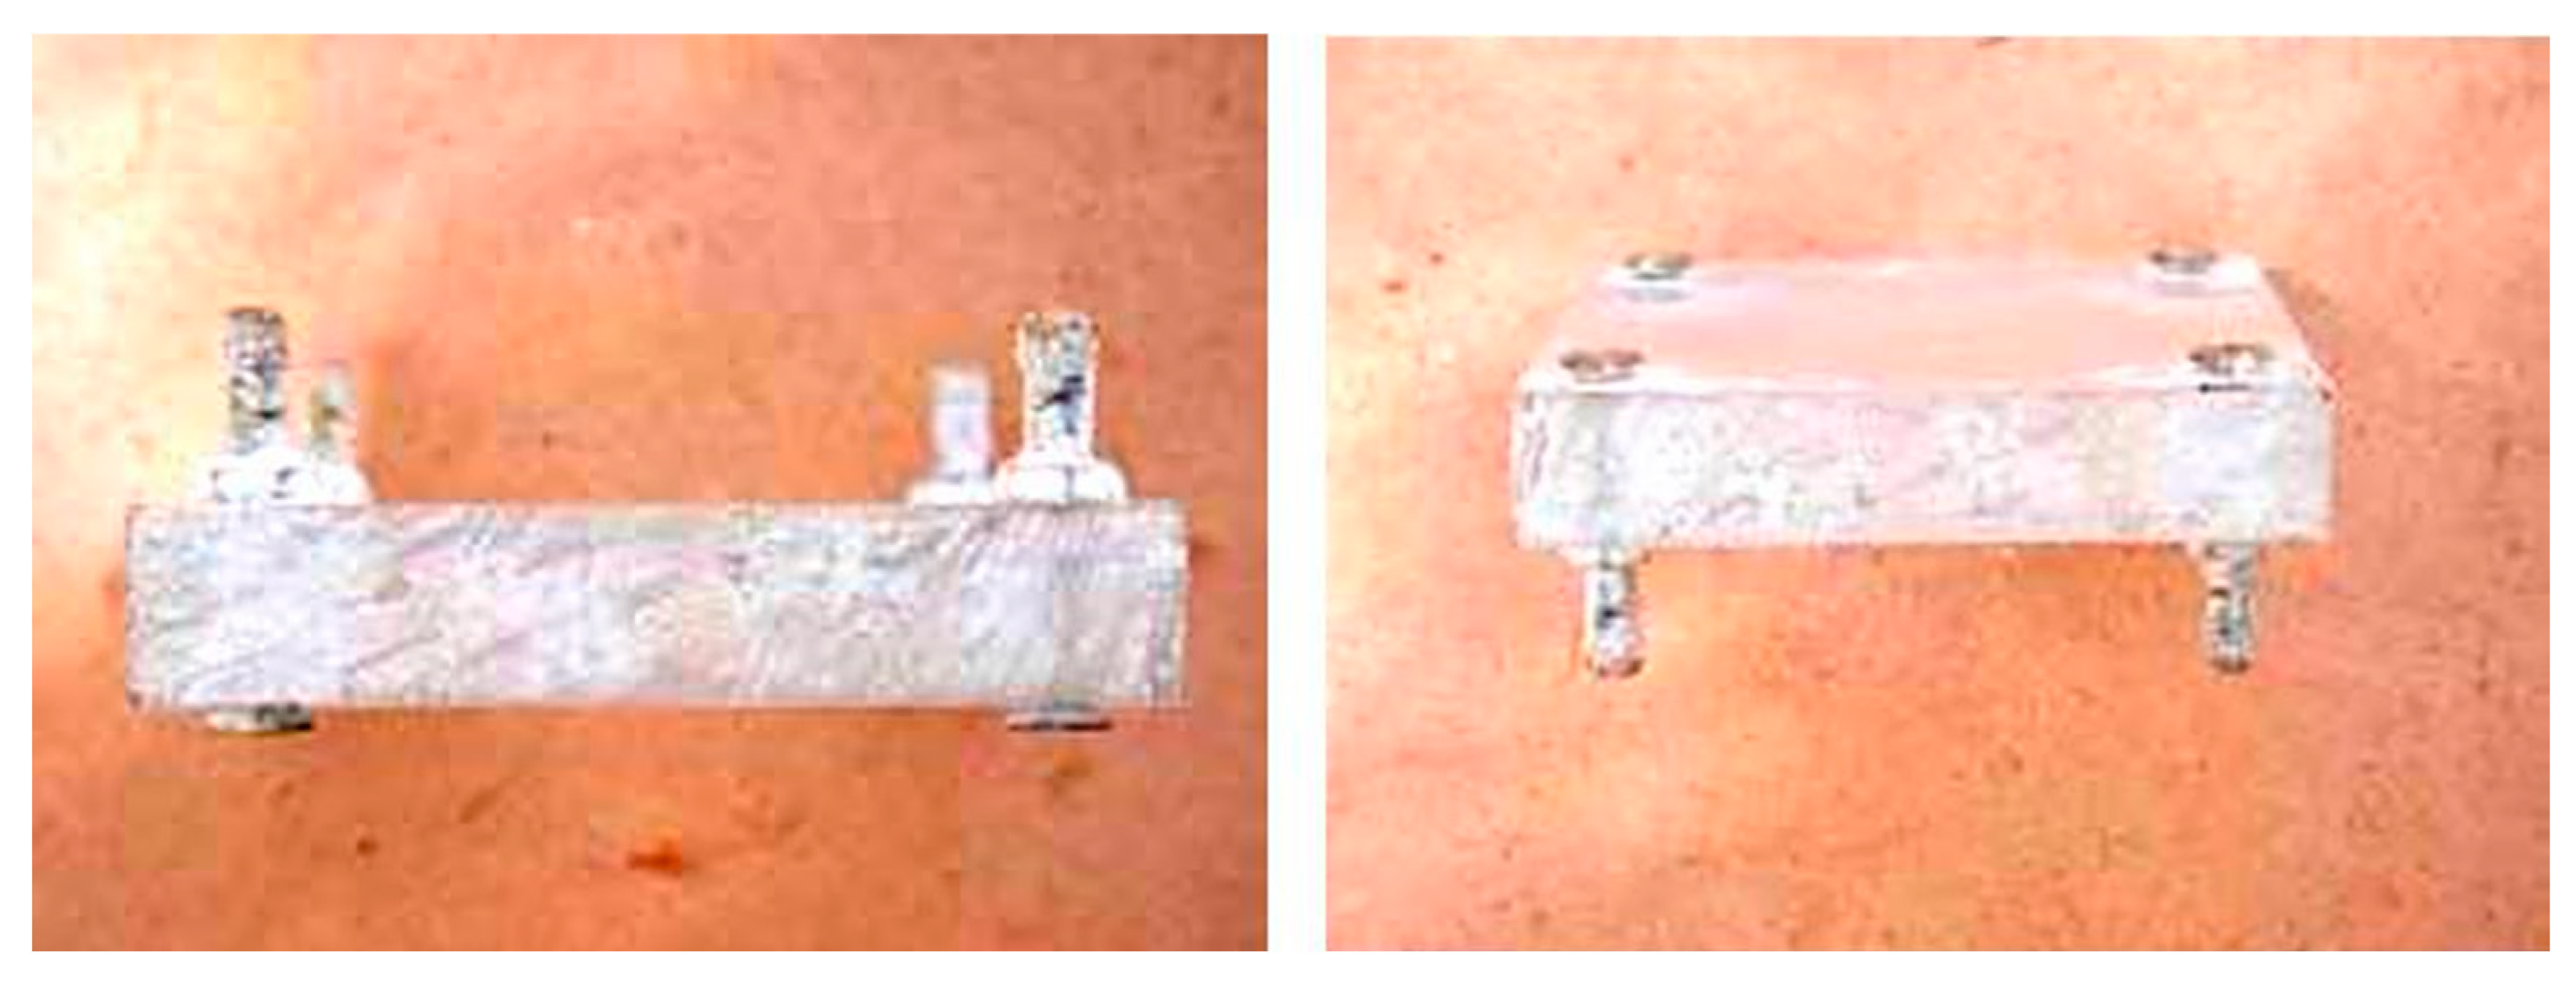
Figure A1.2.
Experimental setup using UVA-340 lamps for the exposure of fresh adhesive layers to ultraviolet (UV) radiation.
Figure A1.2.
Experimental setup using UVA-340 lamps for the exposure of fresh adhesive layers to ultraviolet (UV) radiation.
Appendix 2

Table A2.1.
UV radiation levels measured at the Neve Shaanan, Haifa, Israel.
| Time Period1 | Sun position | Sky characteristic | Time of measurement | Measured UV radiation, mW/cm2 |
|---|---|---|---|---|
| Mid of May | East | Clear | 10:15 | 1.49 |
| Mid of May | South | Cloudy | 10:25 | 0.51 |
| Mid of May | East | Cloudy | 13:10 | 0.55 |
| Mid of May | South | Clear | 13:15 | 0.51 |
| Mid of May | East | Cloudy | 07:35 | 2.20 |
| Mid of May | South | Cloudy | 07:35 | 0.35 |
| Mid of May | West | Cloudy | 07:35 | 0.10 |
| Mid of May | East | Cloudy | 08:35 | 1.50 |
| Mid of May | South | Clear | 08:35 | 0.35 |
| End of May | East | Clear | 07:40 | 2.40 |
| End of May | East | Clear | 06:55 | 2.40 |
| Beginning of June | East | Hazy and hot conditions | 07:15 | 1.80 |
| Beginning of June | East | Hazy and hot conditions | 08:35 | 1.44 |
| Beginning of June | East | Hazy and hot conditions | 10:35 | 0.77 |
| Beginning of June | N/A | All 8 UV Lamps On | Continuous | 1.60 – 2.00 |
Time periods classified as: Beginning of month: 1st –10th; Mid of month: 11th–20th; End of month: 21st –31st.
References
- Topličić-Ćurčić, G.; Grdić, D.; Ristić, N.; Grdić, Z. Ceramic facade cladding as an element of sustainable development. Facta Universitatis - Series Architecture and Civil Engineering 2015, 13(3), 219–231. [Google Scholar] [CrossRef]
- Gilani, G.; Pons, O.; de la Fuente, A. Towards the façades of the future: A new sustainability assessment approach. IOP Conference Series: Earth and Environmental Science 2019, 290, 012075. [Google Scholar] [CrossRef]
- Souza, J.; Silva, A.; de Brito, J.; Bauer, E. Service life prediction of ceramic tiling systems in Brasília-Brazil using the factor method. Construction and Building Materials 2018, 192, 38–48. [Google Scholar] [CrossRef]
- Lordsleem, A.C., Jr.; Batista Faro, H. Building facade cladding detachment: A case study. Revista ALCONPAT 2017, 7, 148–159. [Google Scholar] [CrossRef]
- Yılmaz, E.; Arslan, H.; Bideci, A. Environmental performance analysis of insulated composite facade panels using life cycle assessment (LCA). Construction and Building Materials 2019, 202, 806–813. [Google Scholar] [CrossRef]
- Souza, J.; Silva, A.; de Brito, J.; Bauer, E. Application of a graphical method to predict the service life of adhesive ceramic external wall claddings in the city of Brasília, Brazil. Journal of Building Engineering 2018, 19, 1–13. [Google Scholar] [CrossRef]
- Shohet, I.M.; Laufer, A. Exterior cladding methods: a techno-economical comparison. Journal of Construction Engineering and Management 1996, 122, 242–247. [Google Scholar] [CrossRef]
- Shohet, I.M.; Paciuk, M. Service life prediction of exterior cladding components under standard conditions. Construction Management and Economics 2004, 22, 1081–1090. [Google Scholar] [CrossRef]
- Shohet, I.M.; Paciuk, M. Service life prediction of exterior cladding components under failure conditions. Construction Management and Economics 2006, 24, 131–148. [Google Scholar] [CrossRef]
- Barrelas, J.; Silva, A.; de Brito, J.; Tadeu, A. Impact of climate change on the degradation of rendered façades: Expectations for a dry and hot summer temperate climate. IOP Conference Series: Earth and Environmental Science 2022, 1101, 022008. [Google Scholar] [CrossRef]
- Barrelas, J.; Silva, A.; de Brito, J.; Tadeu, A. Effects of climate change on rendered façades: Expected degradation in a progressively warmer and drier climate - A review based on the literature. Buildings 2022, 352, 13. [Google Scholar] [CrossRef]
- Barrelas, J.; Dias, I.S.; Silva, A.; de Brito, J.; Flores-Colen, I.; Tadeu, A. Impact of environmental exposure on the service life of façade claddings - A statistical analysis. Buildings 2021, 11, 615. [Google Scholar] [CrossRef]
- Silva, M.V.; Bauer, E. Variabilidade da degradação de fachadas revestidas com cerâmica em edifícios de Brasília, Brasil. Ambiente Construído 2024, 24, e133293. [Google Scholar] [CrossRef]
- Beasley, K.J. Building facade failures in the urban environment. Proceedings of the Institution of Civil Engineers - Forensic Engineering 2017, 170(1), 8–13. [Google Scholar] [CrossRef]
- Ferreira, C.; Barrelas, J.; Silva, A.; de Brito, J.; Dias, I.S.; Flores-Colen, I. Impact of environmental exposure conditions on the maintenance of facades' claddings. Buildings 2021, 11(4), 138. [Google Scholar] [CrossRef]
- Mansur, A.A.P.; Nascimento, O.L.; Orefice, R.L.; Mansur, H.S. Porcelain tile surface modification with isocyanate coupling agent: interactions between EVA modified mortar and silane improving adherence. Surface and Interface Analysis 2011, 43(3), 738–743. [Google Scholar] [CrossRef]
- Mansur, A.A.P.; Mansur, H.S. Enhancing polymer-modified mortar adhesion to ceramic tile surface by chemical functionalization with organosilanes. Surface Review and Letters 2009, 16(1), 127–139. [Google Scholar] [CrossRef]
- Botas, S.; Veiga, R.; Velosa, A.; Santos Silva, A. Compatible air lime mortars for historical tiled facades: Bond and mechanical strength versus tile–mortar interface microstructure. Journal of Materials in Civil Engineering 2020, 32(6), 04020112. [Google Scholar] [CrossRef]
- Fowler, D.W. Polymers in concrete: a vision for the 21st century. Cement and Concrete Composites 1999, 21(5-6), 449–452. [Google Scholar] [CrossRef]
- Mansur, A.A.P.; Mansur, H.S. Interface porcelain tile/PVA modified mortar: A novel nanostructure approach. Journal of Nanoscience and Nanotechnology 2009, 9(2), 1071–1075. [Google Scholar] [CrossRef]
- Ohama, Y. Polymer-based admixtures. Cement and Concrete Composites 1998, 20(2-3), 189–212. [Google Scholar] [CrossRef]
- Beeldens, A.; Van Gemert, D.; Schorn, H.; Ohama, Y.; Czarnecki, L. From microstructure to macrostructure: an integrated model of structure formation in polymer-modified concrete. Materials and Structures 2005, 38, 601–607. [Google Scholar] [CrossRef]
- Silva, D.A.; John, V.M.; Ribeiro, J.L.D.; Roman, H.R. Pore size distribution of hydrated cement pastes modified with polymers. Cement and Concrete Research 2001, 31(8), 1177–1184. [Google Scholar] [CrossRef]
- Afridi, M.U.K.; Ohama, Y.; Demura, K.; Iqbal, M.Z. Development of polymer films by the coalescence of polymer particles in powdered and aqueous polymer-modified mortars. Cement and Concrete Research 2003, 33(11), 1715–1721. [Google Scholar] [CrossRef]
- Sakai, E.; Sugita, J. Composite mechanism of polymer modified cement. Cement and Concrete Research 1995, 25(1), 127–135. [Google Scholar] [CrossRef]
- Castro, W.; Souza, J.; Gaspar, P.; Silva, A. Mapping the Risk of Occurrence of Defects in Façades with Ceramic Claddings. Buildings 2023, 13, 1209. [Google Scholar] [CrossRef]
- Kvande, T.; Bakken, N.; Bergheim, E.; Thue, J.V. Durability of ETICS with rendering in Norway-Experimental and field investigations. Buildings 2008, 8(7), 93. [Google Scholar] [CrossRef]
- Alegbe, M.; Hammed, N. Sustainability beyond the surface: Evaluating the long-term environmental and energy performance of selected cladding materials for housing retrofits. Journal of Sustainable Construction Materials and Technologies 2024, 9(3), 221–238. [Google Scholar] [CrossRef]
- Lacasse, M.A.; Gaur, A.; Moore, T.V. Durability and climate change-Implications for service life prediction and the maintainability of buildings. Buildings 2020, 10(3), 53. [Google Scholar] [CrossRef]
- European Committee for Standardization. EN 12004: Adhesives for tiles-Requirements, evaluation of conformity, classification and designation; CEN: Brussels, Belgium, 2017. [Google Scholar]
- European Committee for Standardization. EN 14411: Ceramic tiles - Definition, classification, characteristics, assessment and verification of constancy of performance and marking; CEN: Brussels, Belgium, 2016. [Google Scholar]
- European Committee for Standardization. EN 13888-2: Grouts for ceramic tiles - Part 2: Test methods. CEN: Brussels, Belgium, 2022.
- ASTM International. ASTM C482: Standard Test Method for Bond Strength of Ceramic Tile to Portland Cement Paste. ASTM: West Conshohocken, PA, USA, 2020.
- American National Standard Institute. ANSI A108-A118-A136.1 American National Specifications for the Installation of Ceramic Tile; ANSI. USA, 2024.
- Japanese Standards Association. JIS A 5209: Ceramic tiles. JSA: Tokyo, Japan, 2014.
- Deutsches Institut für Normung. DIN 18515: Außenwandbekleidungen. DIN: Berlin, Germany, 2018.
- Standards Australia. AS 3958: Guide to the installation of ceramic tiles; Standards Australia: Sydney, Australia, 2007. [Google Scholar]
- European Committee for Standardization. EN 1542: Products and systems for the protection and repair of concrete structures-Test methods-Measurement of bond strength by pull-off; CEN: Brussels, Belgium, 1999. [Google Scholar]
- ASTM International. ASTM C1026: Standard Test Method for Measuring the Resistance of Ceramic Tile to Freeze-Thaw Cycling; ASTM: West Conshohocken, PA, USA, 2019. [Google Scholar]
- International Organization for Standardization. ISO 10545-9; Ceramic tiles - Part 9: Determination of resistance to thermal shock. ISO: Geneva, Switzerland, 2013.
- European Committee for Standardization. EN 12808: Grouts for tiles -Test methods. CEN: Brussels, Belgium, 2001.
- ASTM International. ASTM C413: Standard Test Method for Absorption of Chemical-Resistant Mortars, Grouts, Monolithic Surfacings, and Polymer Concretes. ASTM: West Conshohocken, PA, USA, 2014.
- Kinloch, A.J. Adhesion and Adhesives: Science and Technology; Chapman & Hall: London, UK, 1987. [Google Scholar]
- Anderson, T.L. Fracture Mechanics: Fundamentals and Applications, 3rd ed.; CRC Press: Boca Raton, FL, USA, 2005. [Google Scholar]
- Pérez-Lombard, L.; Ortiz, J.; Pout, C. A review on buildings energy consumption information. Energy and Buildings 2008, 40, 394–398. [Google Scholar] [CrossRef]
- Nicoletti, G.M.; Notarnicola, B.; Tassielli, G. Comparative life cycle assessment of flooring materials: ceramic versus marble tiles. Journal of Cleaner Production 2002, 10(3), 283–296. [Google Scholar] [CrossRef]
- Aguiar, J.B.; Camões, A.; Moreira, P.M. Coatings for Concrete Protection against Aggressive Environments. Journal of Advanced Concrete Technology 2008, 6(1), 243–250. [Google Scholar] [CrossRef]
- Israeli Standards Institution. IS 4004: Adhesives for ceramic tiles - Requirements, evaluation of conformity, classification and designation. ISI: Tel Aviv, Israel, 2004.
- European Committee for Standardization. EN 1346: Adhesives for tiles - Determination of open time; CEN: Brussels, Belgium, 2010. [Google Scholar]
- European Committee for Standardization. EN 1308: Adhesives for tiles - Determination of slip; CEN: Brussels, Belgium, 2010. [Google Scholar]
- European Committee for Standardization. EN 1348: Adhesives for tiles - Determination of tensile adhesion strength; CEN: Brussels, Belgium, 2007. [Google Scholar]
- European Committee for Standardization. EN 12002: Adhesives for tiles - Determination of deformation characteristics; CEN: Brussels, Belgium, 2008. [Google Scholar]
- Israeli Standards Institution. IS 1555 Part 1: Ceramic tile installation on external walls - Requirements and test methods; ISI: Tel Aviv, Israel, 1998. [Google Scholar]
- Israeli Standards Institution. IS 314: Ceramic tiles - Specifications; ISI: Tel Aviv, Israel, 2010. [Google Scholar]
- Israeli Standards Institution. IS 216: Precast concrete products - General requirements; ISI: Tel Aviv, Israel, 1996. [Google Scholar]
- Israeli Standards Institution. IS 466: Concrete - Methods of test for compressive strength; ISI: Tel Aviv, Israel, 2018. [Google Scholar]
- Israeli Standards Institution. IS 3085; Methods of test for moisture content determination in building materials. ISI: Tel Aviv, Israel, 2005.
- Chong, B.W.; Ismail, M.; Hussin, M.W.; Abdullah, M.M.A.B.; Nor, N.A.M. Image analysis and pore structure characterization of fly ash mortar with waste materials. Materials 2021, 14, 1658. [Google Scholar] [CrossRef]
- Szeląg, M. Application of an automated digital image-processing method for quantitative assessment of cracking patterns in a lime cement matrix. Sensors 2020, 20, 3859. [Google Scholar] [CrossRef] [PubMed]
- Guo, L.; Wang, W.; Zhong, L.; Guo, L.; Zhang, F.; Guo, Y. Texture analysis of the microstructure of internal curing concrete based on image recognition technology. Case Studies in Construction Materials 2022, 17, e01360. [Google Scholar] [CrossRef]
- Liu, C.; Tang, C.-S.; Shi, B.; Suo, W.-B. Automatic quantification of crack patterns by image processing. Computers & Geosciences 2013, 57, 77–80. [Google Scholar] [CrossRef]
- Chandra, S.; Ohama, Y. Polymers in Concrete; CRC Press, 2020. [Google Scholar]
- Mohan, A.; Poobal, S. Crack detection using image processing: A critical review and analysis. Alexandria Engineering Journal 2018, 57(2), 787–798. [Google Scholar] [CrossRef]
- Schindelin, J.; Arganda-Carreras, I.; Frise, E.; Kaynig, V.; Longair, M.; Pietzsch, T.; Preibisch, S.; Rueden, C.; Saalfeld, S.; Schmid, B.; et al. Fiji: an open-source platform for biological-image analysis. Nature Methods 2012, 9, 676–682. [Google Scholar] [CrossRef]
- Ferreira, T.; Rasband, W. ImageJ User Guide. National Institutes of Health. 2012. Available online: https://imagej.net/ij/docs/guide/ (accessed on 16 December 2025).
- Issa, M. A.; Hammad, A. M. Assessment and evaluation of fractal dimension of concrete fracture surface digitized images. Cement and Concrete Research 1994, 24(2), 325–334. [Google Scholar] [CrossRef]
- de Souza, F.B.; Giam, A.; Geng, G.; et al. Weathering degradation mechanisms of cement tile-adhesive mortar: new microscale insights from confocal fluorescence microscopy. Mater Struct 2025, 58, 308. [Google Scholar] [CrossRef]
- Jenni, A.; Holzer, L.; Zurbriggen, R.; Herwegh, M. Influence of polymers on microstructure and adhesive strength of cementitious tile adhesive mortars. Cement and Concrete Research 2005, 35(1), 35–50. [Google Scholar] [CrossRef]
- Jenni, A.; Holzer, L.; Zurbriggen, R.; Herwegh, M. Changes in microstructures and physical properties of polymer-modified mortars during wet storage. Cement and Concrete Research 2006, 36(1), 79–90. [Google Scholar] [CrossRef]
- Winnefeld, F.; Kaufmann, J.; Hack, E.; Harzer, S. Moisture-induced length changes of tile adhesive mortars and their impact on adhesion strength. Cement and Concrete Composites 2012, 30, 426–438. [Google Scholar] [CrossRef]
- Wetzel, A.; Herwegh, M.; Zurbriggen, R.; Winnefeld, R. Influence of shrinkage and water transport mechanisms on microstructure and crack formation of tile adhesive mortars. Cement and Concrete Research 2012, 42(1), 39–50. [Google Scholar] [CrossRef]
- Mapei. Do outdoor tiles need to be installed with a special tile adhesive? Available online: https://www.mapei.com/in/en/tech-talk/detail/blog/2024/10/01/do-outdoor-tiles-need-to-be-installed-with-a-special-tile-adhesive (accessed on 15 December 2024).
- Yiu, C.; Ho, D.; Lo, S. Weathering effects on external wall tiling systems. Construction and Building Materials 2005, 21(3), 594–600. [Google Scholar] [CrossRef]
- De Freitas, V.; Delgado, João M.P.Q.; Corvacho, H.; Quintela, M. Assessing the durability of mortars tiles - a contribution for a prediction model. Engineering Failure Analysis 2014, 44, 36–45. [Google Scholar] [CrossRef]
- Bin Mobarak, M.; Hossain, Md. S.; Mahmud, M.; Ahmed, S. Redispersible polymer powder modified cementitious tile adhesive as an alternative to ordinary cement-sand grout. Heliyon 2021, 7(11), e08411. [Google Scholar] [CrossRef] [PubMed]
- Jenni, A.; Herwegh, M.; Zurbriggen, R.; Aberle, T.; Holzer, L. Quantitative microstructure analysis of polymer-modified mortars. Journal of Microscopy 2003, 212(2), 186–196. [Google Scholar] [CrossRef]
- Curci, H.C.F.; de Andrade, R. P.; Maranhão, F.L.; Gomes, H. C.; Campello, E.M.B. Analysis of adhered tiling systems based on experimental evaluation and numerical modeling. Construction and Building Materials 2022, 325, 126746. [Google Scholar] [CrossRef]
- Tripathi, B. Effects of Polymers on Cement Hydration and Properties of Concrete: A Review. ACS Omega 2024, 9(2), 2014–2021. [Google Scholar] [CrossRef] [PubMed]
Figure 1.
Failure classification scheme: a) AF-S - adhesive failure at substrate interface; b) AF-T - adhesive failure at tile interface; c) CF-S - cohesive failure in substrate; d) CF-A - cohesive failure in adhesive.
Figure 1.
Failure classification scheme: a) AF-S - adhesive failure at substrate interface; b) AF-T - adhesive failure at tile interface; c) CF-S - cohesive failure in substrate; d) CF-A - cohesive failure in adhesive.
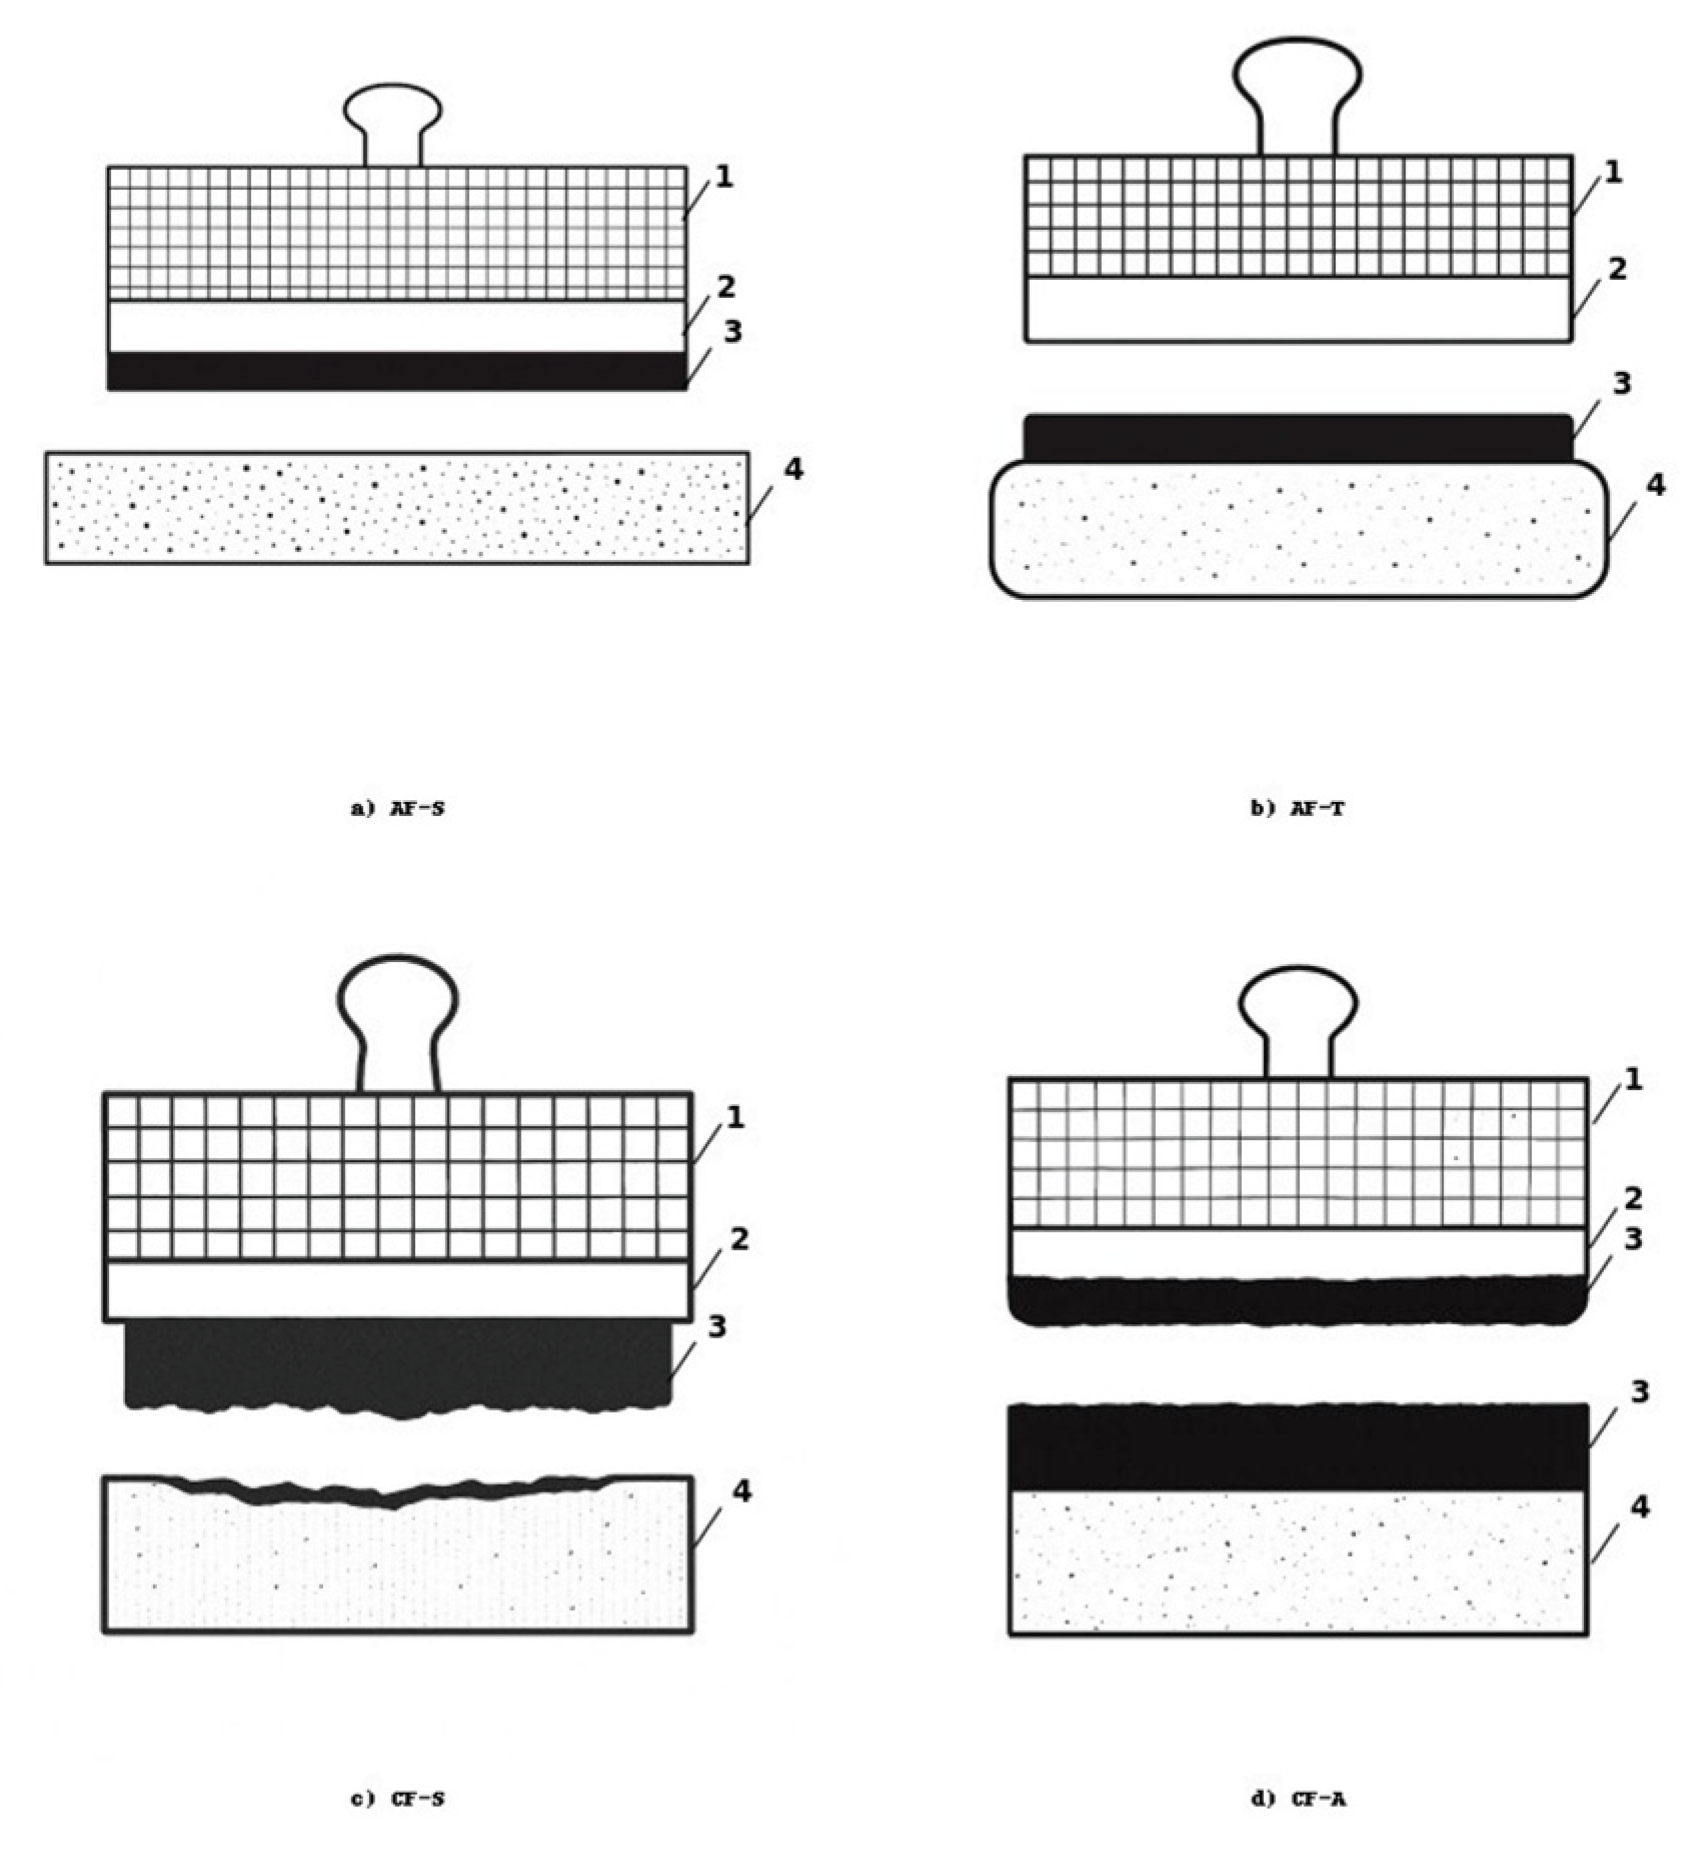
Figure 2.
SEM observations of the hardened Adhesive 1 exposed to the different environmental conditions during ceramic tile installation: a) T1-A1-RC (60+20)-80A/B; b) T1-A1-HC60+AC20-80A/B; c) T1-A1-HC60+UV20-80A/B. Sample designation codes are detailed in Table 4.
Figure 2.
SEM observations of the hardened Adhesive 1 exposed to the different environmental conditions during ceramic tile installation: a) T1-A1-RC (60+20)-80A/B; b) T1-A1-HC60+AC20-80A/B; c) T1-A1-HC60+UV20-80A/B. Sample designation codes are detailed in Table 4.
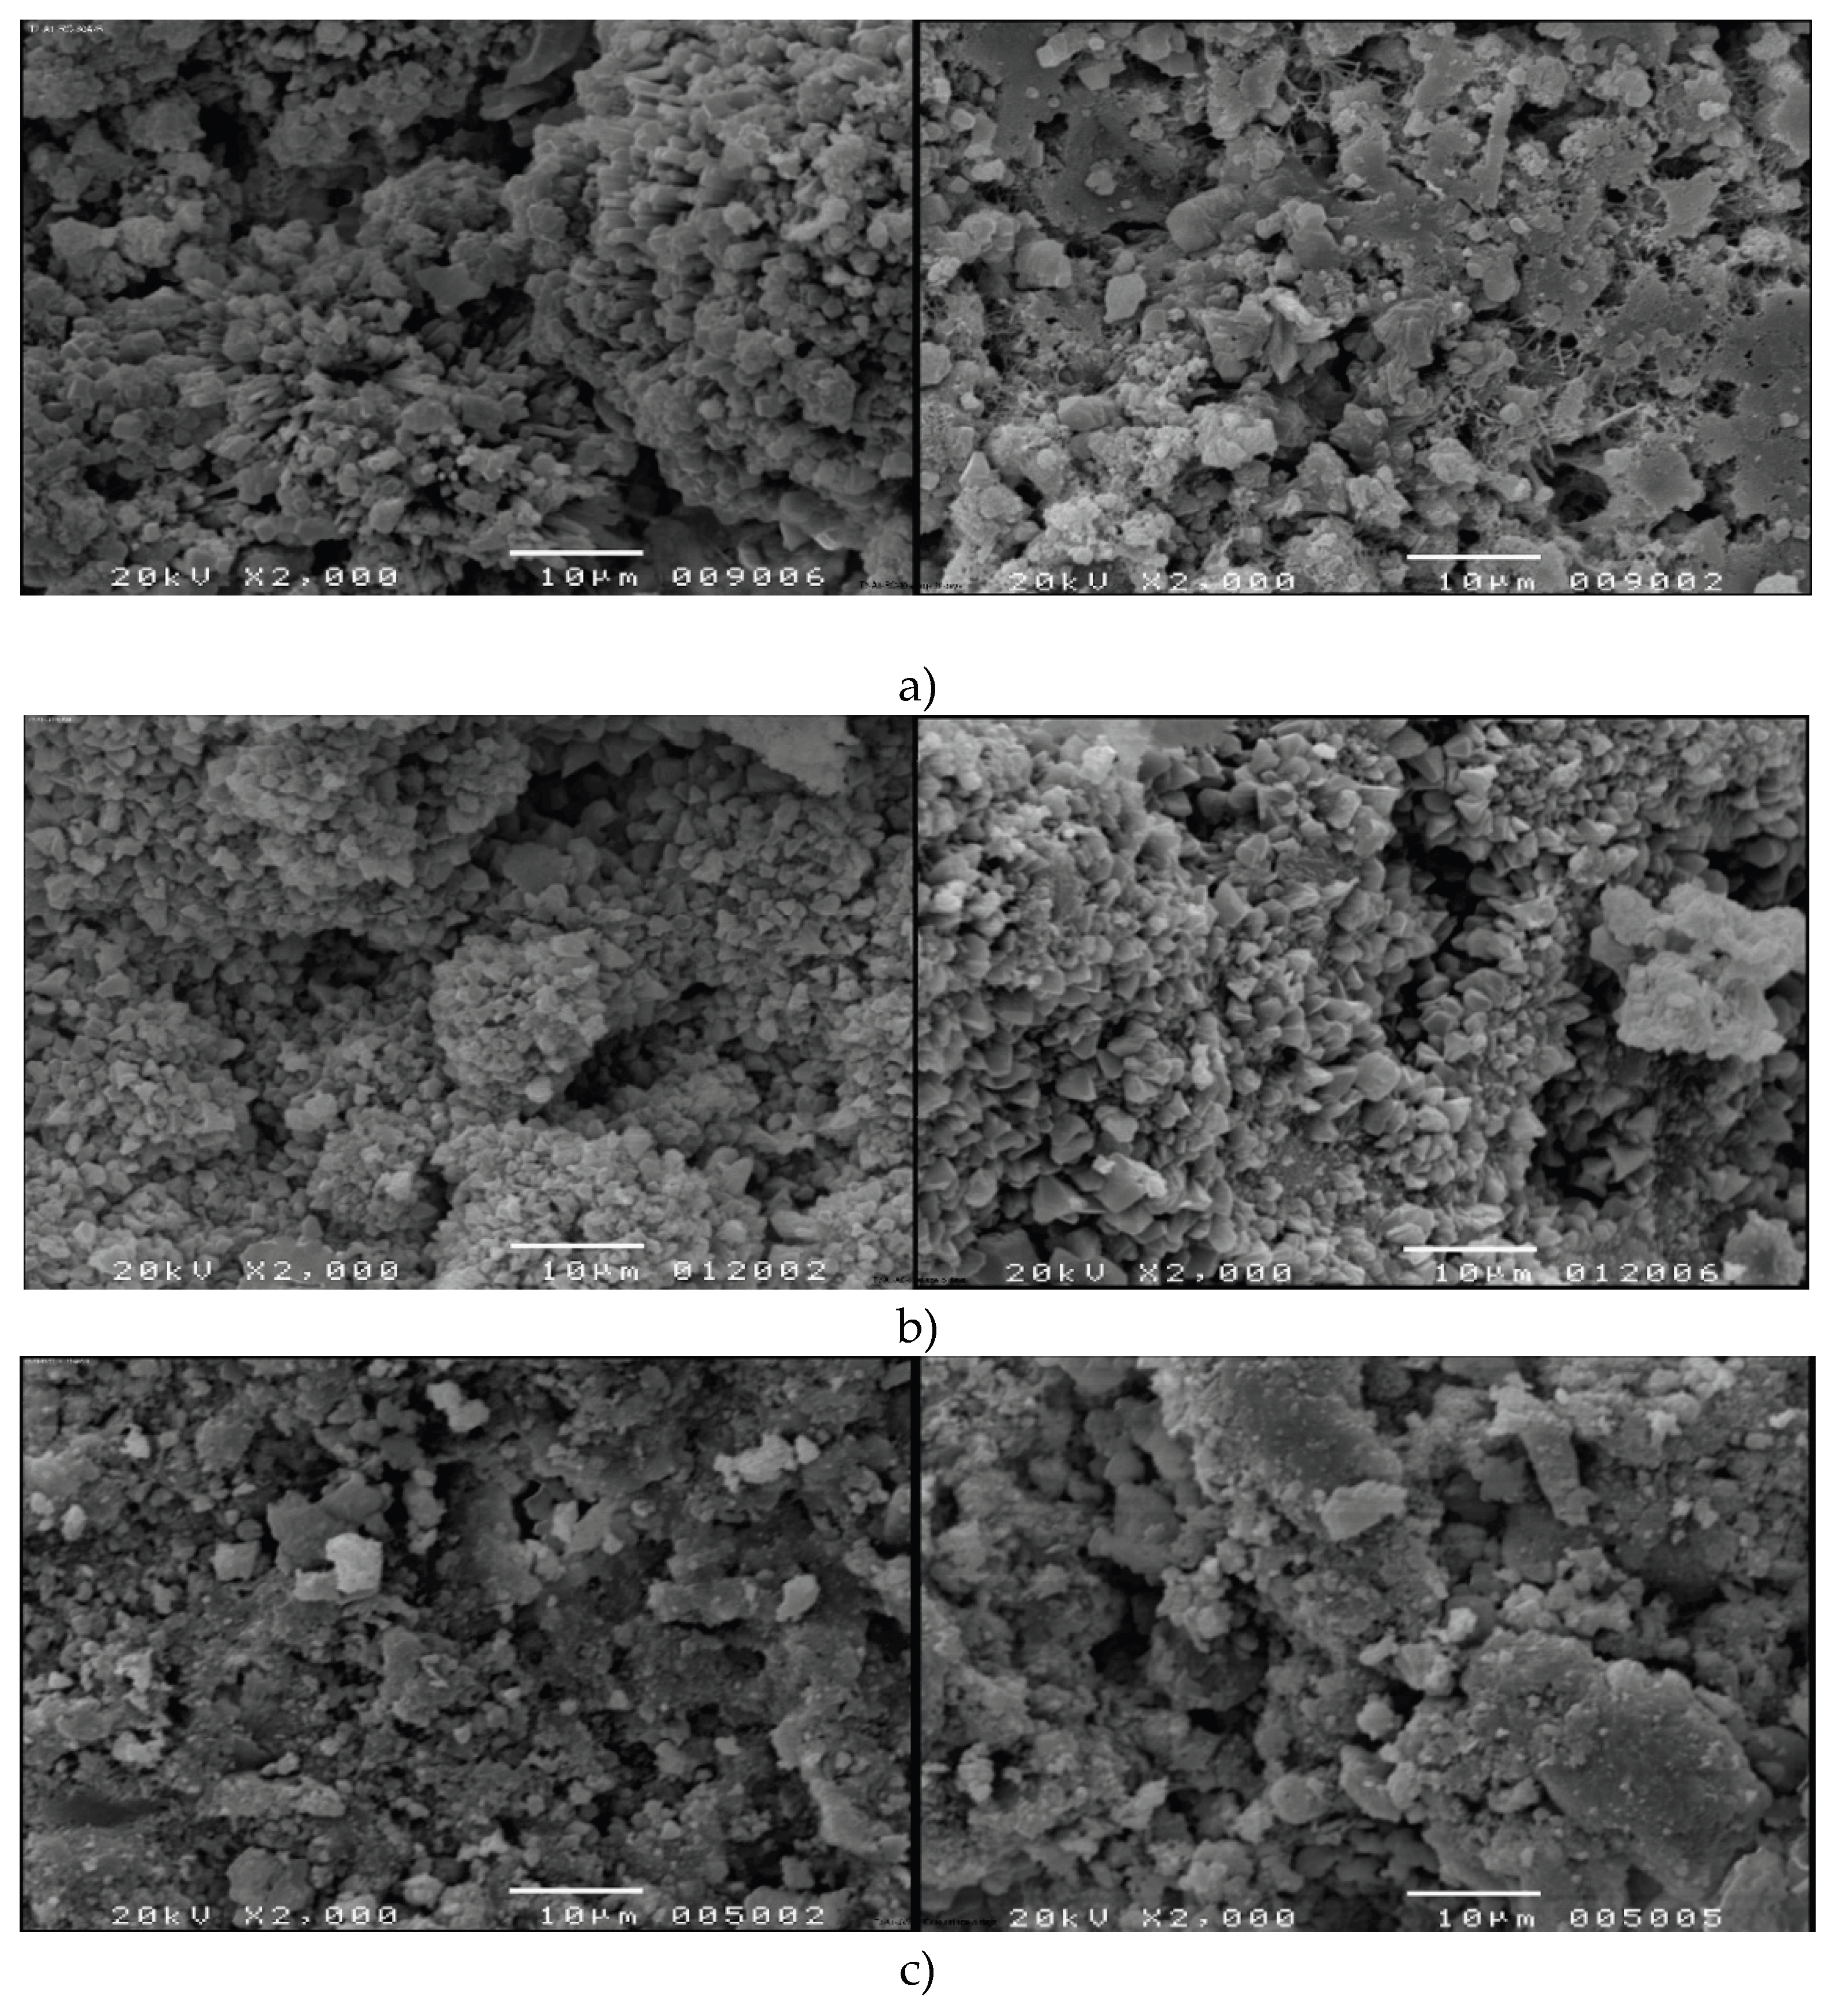
Figure 3.
SEM observations of the hardened Adhesive 2 exposed to the different environmental conditions during ceramic tile installation: a) T1-A2-RC (60+20)-80A/B; b) T1-A2-HC60+AC20-80A/B; c) T1-A2-HC60+UV20-80A/B. Sample designation codes are detailed in Table 4.
Figure 3.
SEM observations of the hardened Adhesive 2 exposed to the different environmental conditions during ceramic tile installation: a) T1-A2-RC (60+20)-80A/B; b) T1-A2-HC60+AC20-80A/B; c) T1-A2-HC60+UV20-80A/B. Sample designation codes are detailed in Table 4.
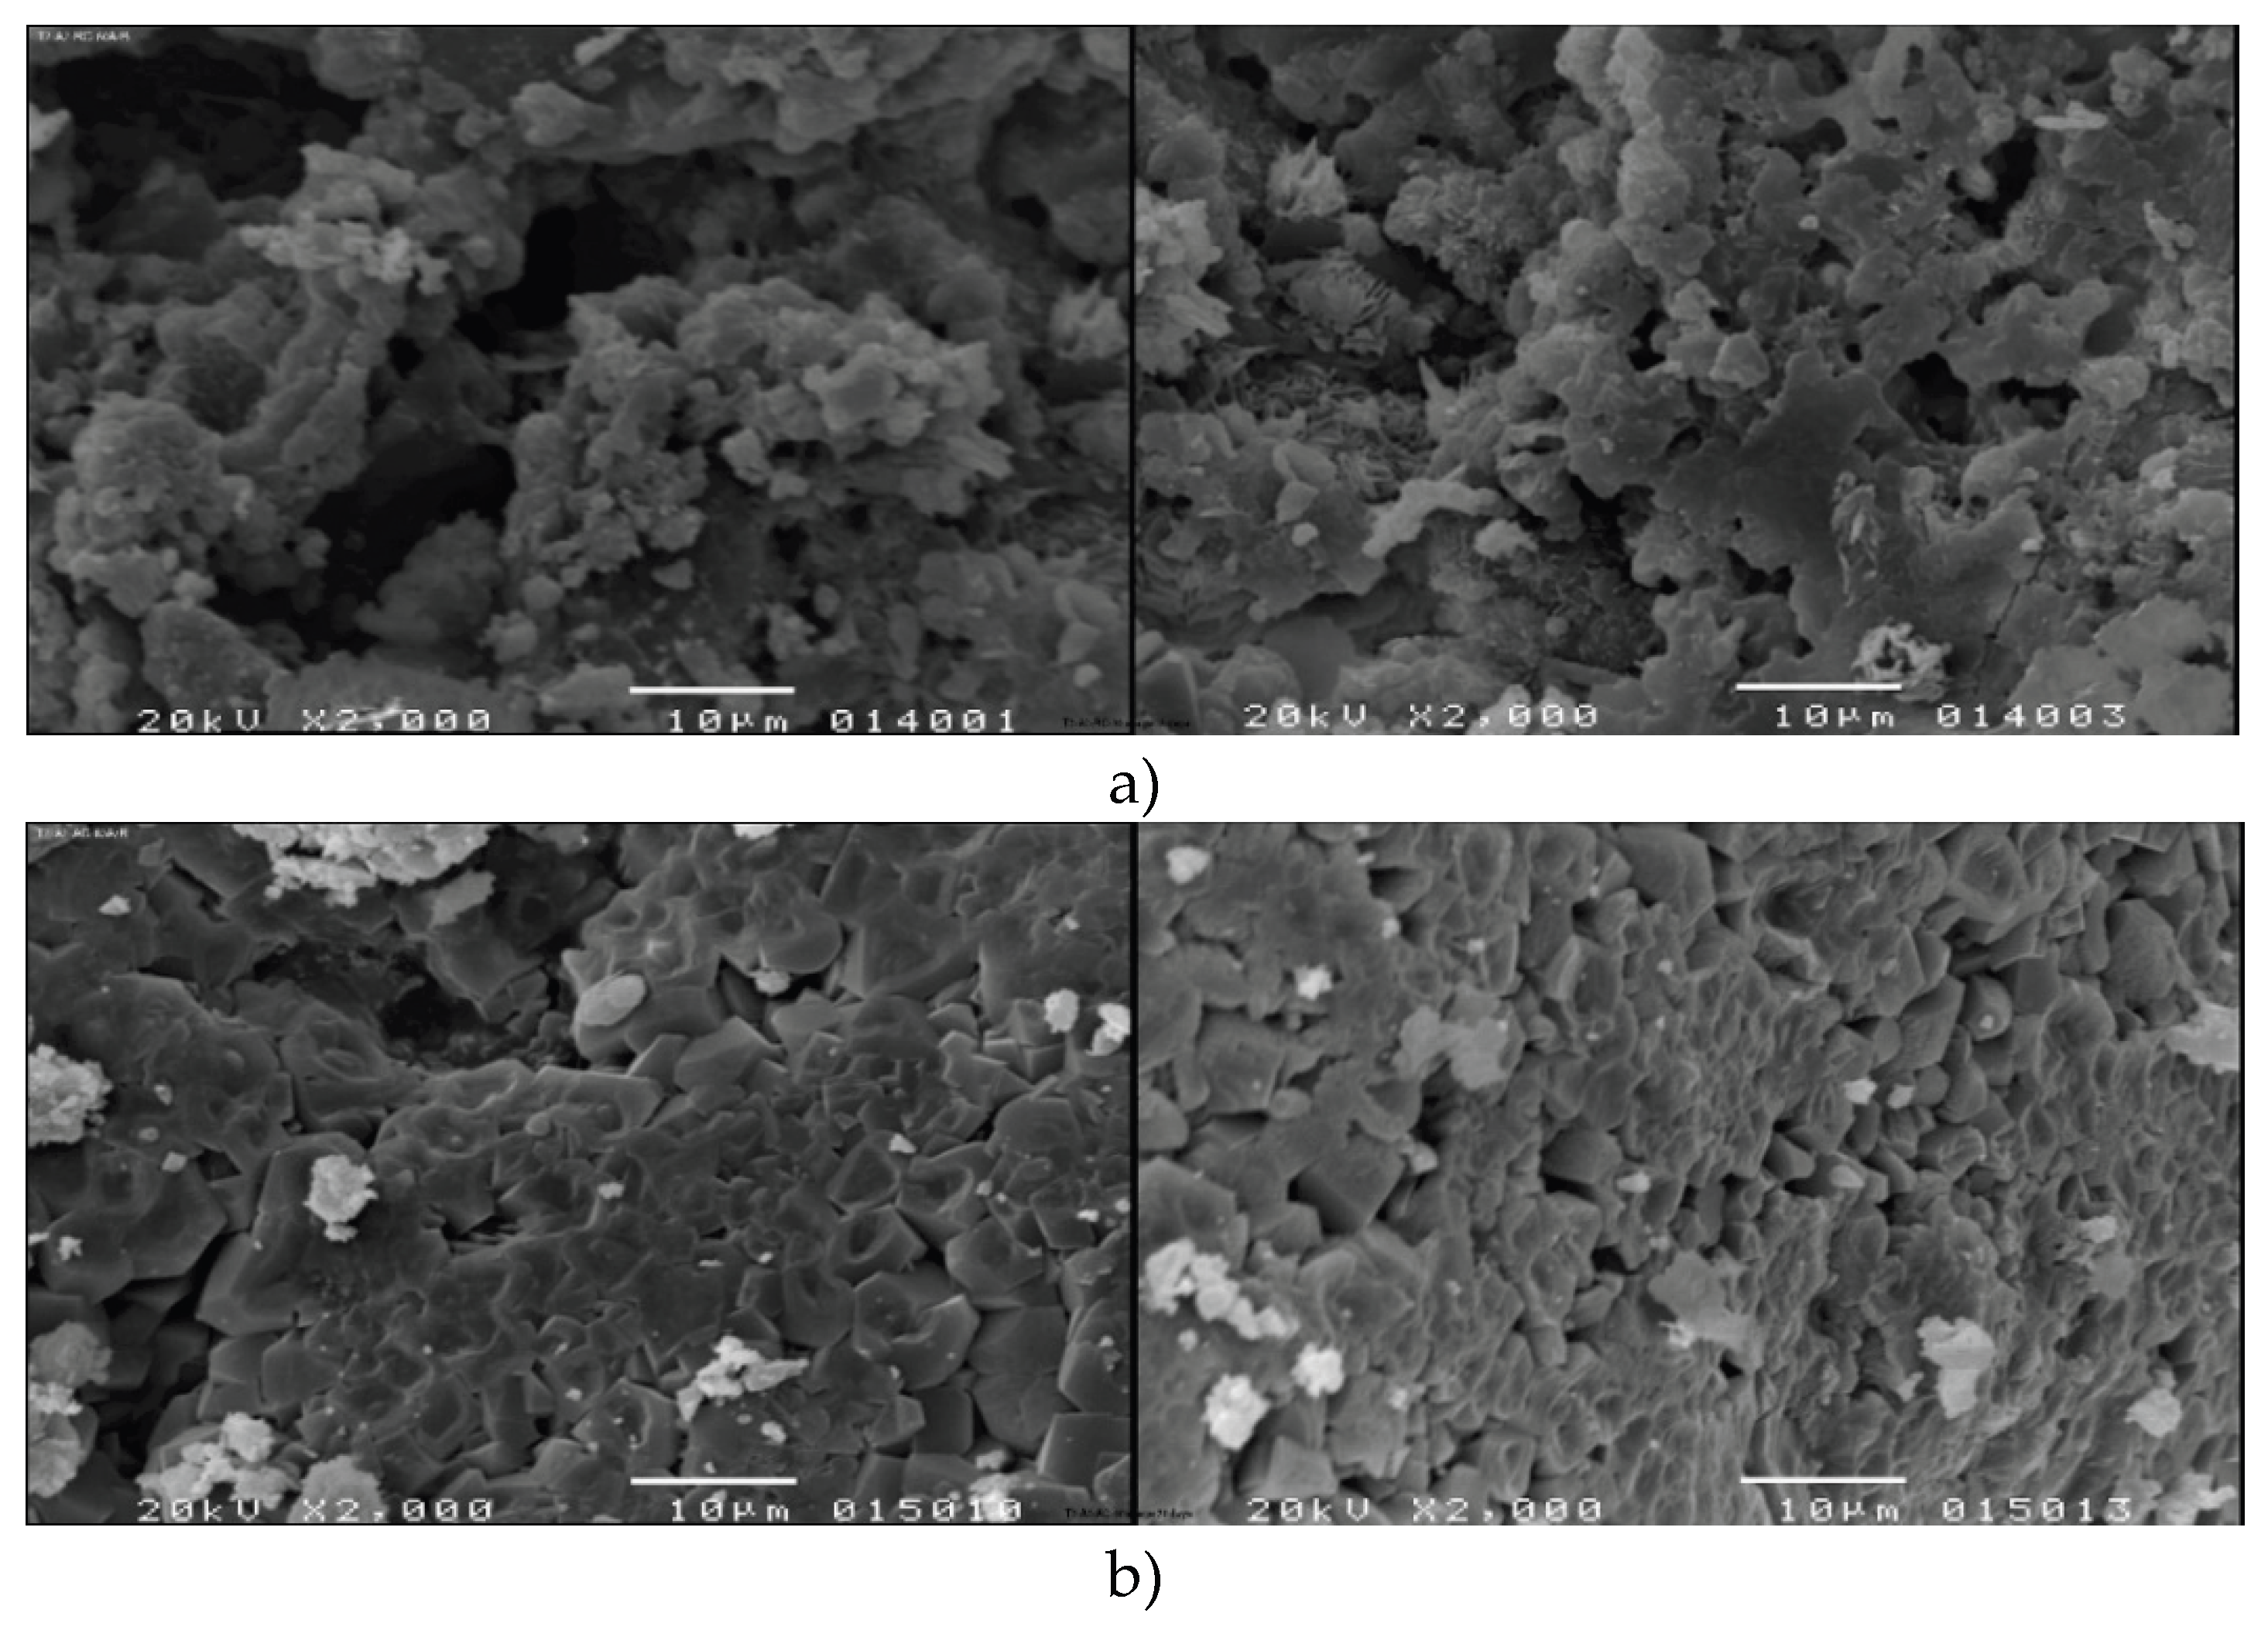
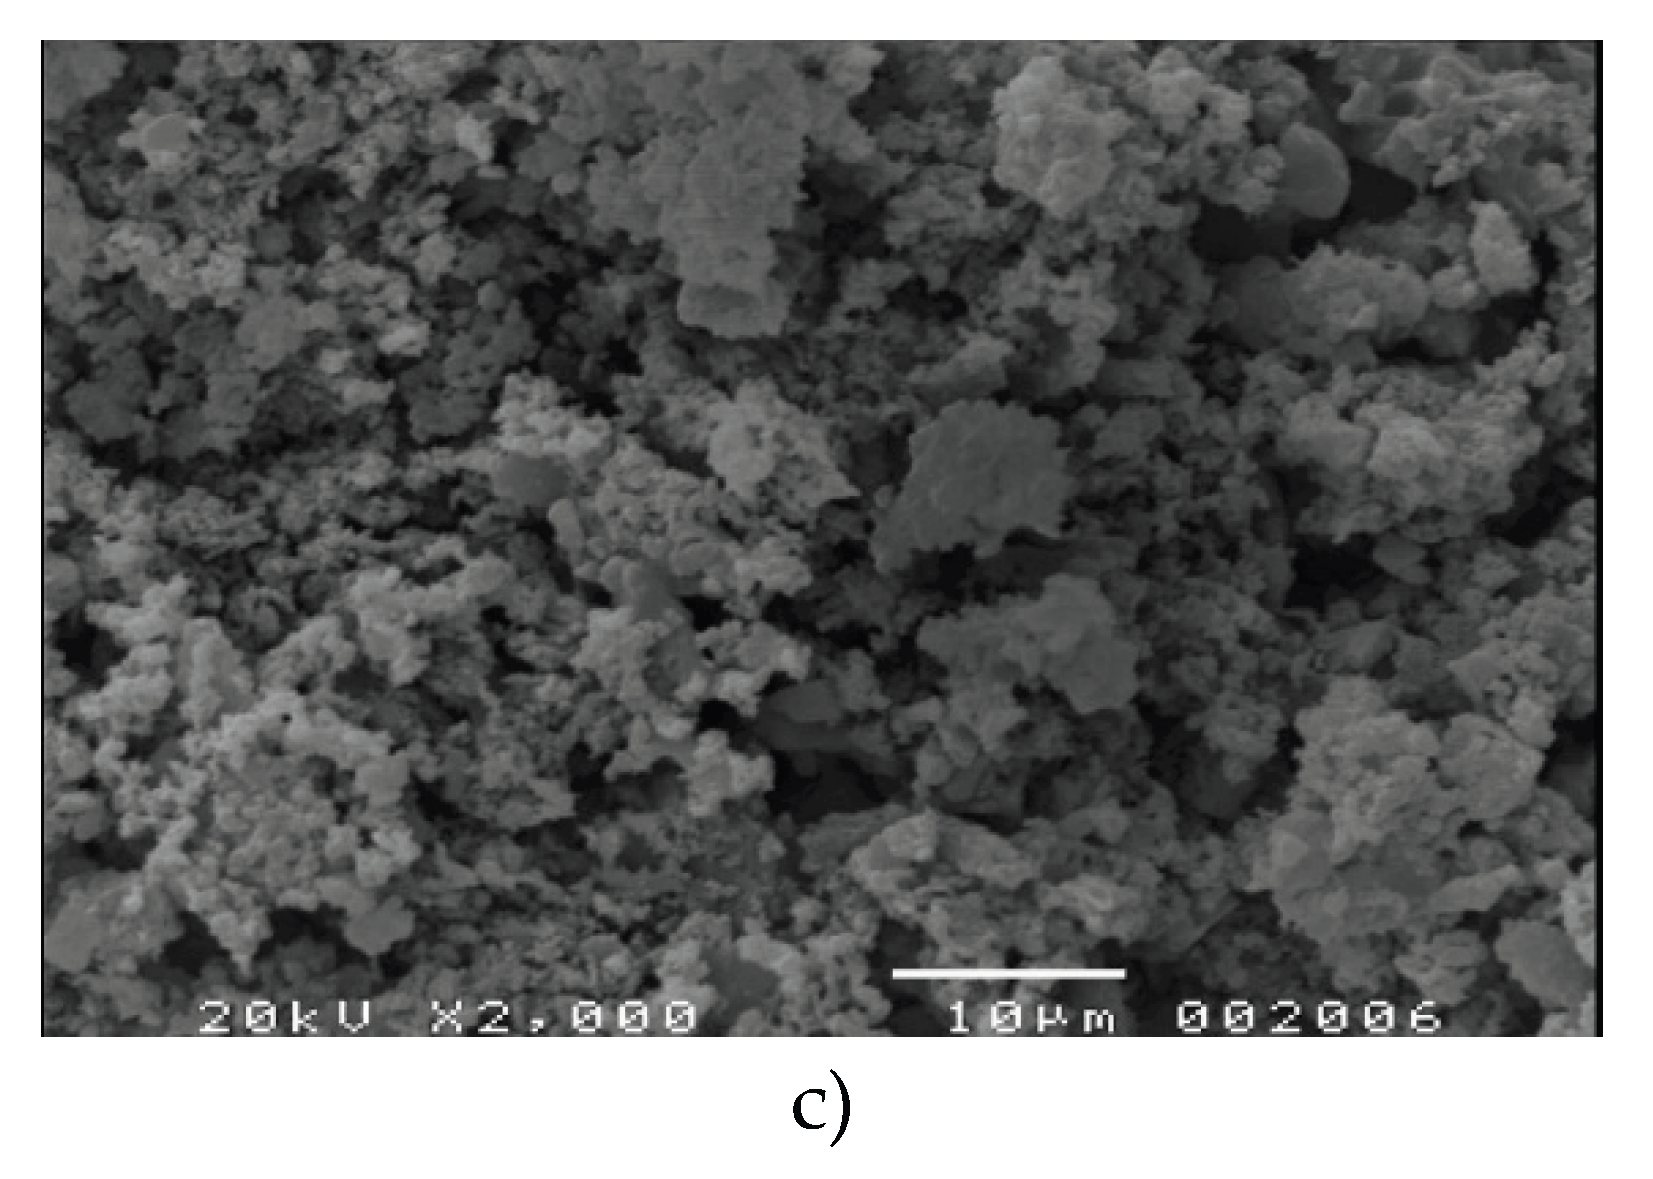
Figure 4.
SEM observations of the hardened Adhesive 3 exposed to the different environmental conditions during ceramic tile installation: a) T1-A3-RC (60+20)-80A/B; b) T1-A3-HC60+AC20-80A/B; c) T1-A3-HC60+UV20-80A/B. Sample designation codes are detailed in Table 4.
Figure 4.
SEM observations of the hardened Adhesive 3 exposed to the different environmental conditions during ceramic tile installation: a) T1-A3-RC (60+20)-80A/B; b) T1-A3-HC60+AC20-80A/B; c) T1-A3-HC60+UV20-80A/B. Sample designation codes are detailed in Table 4.
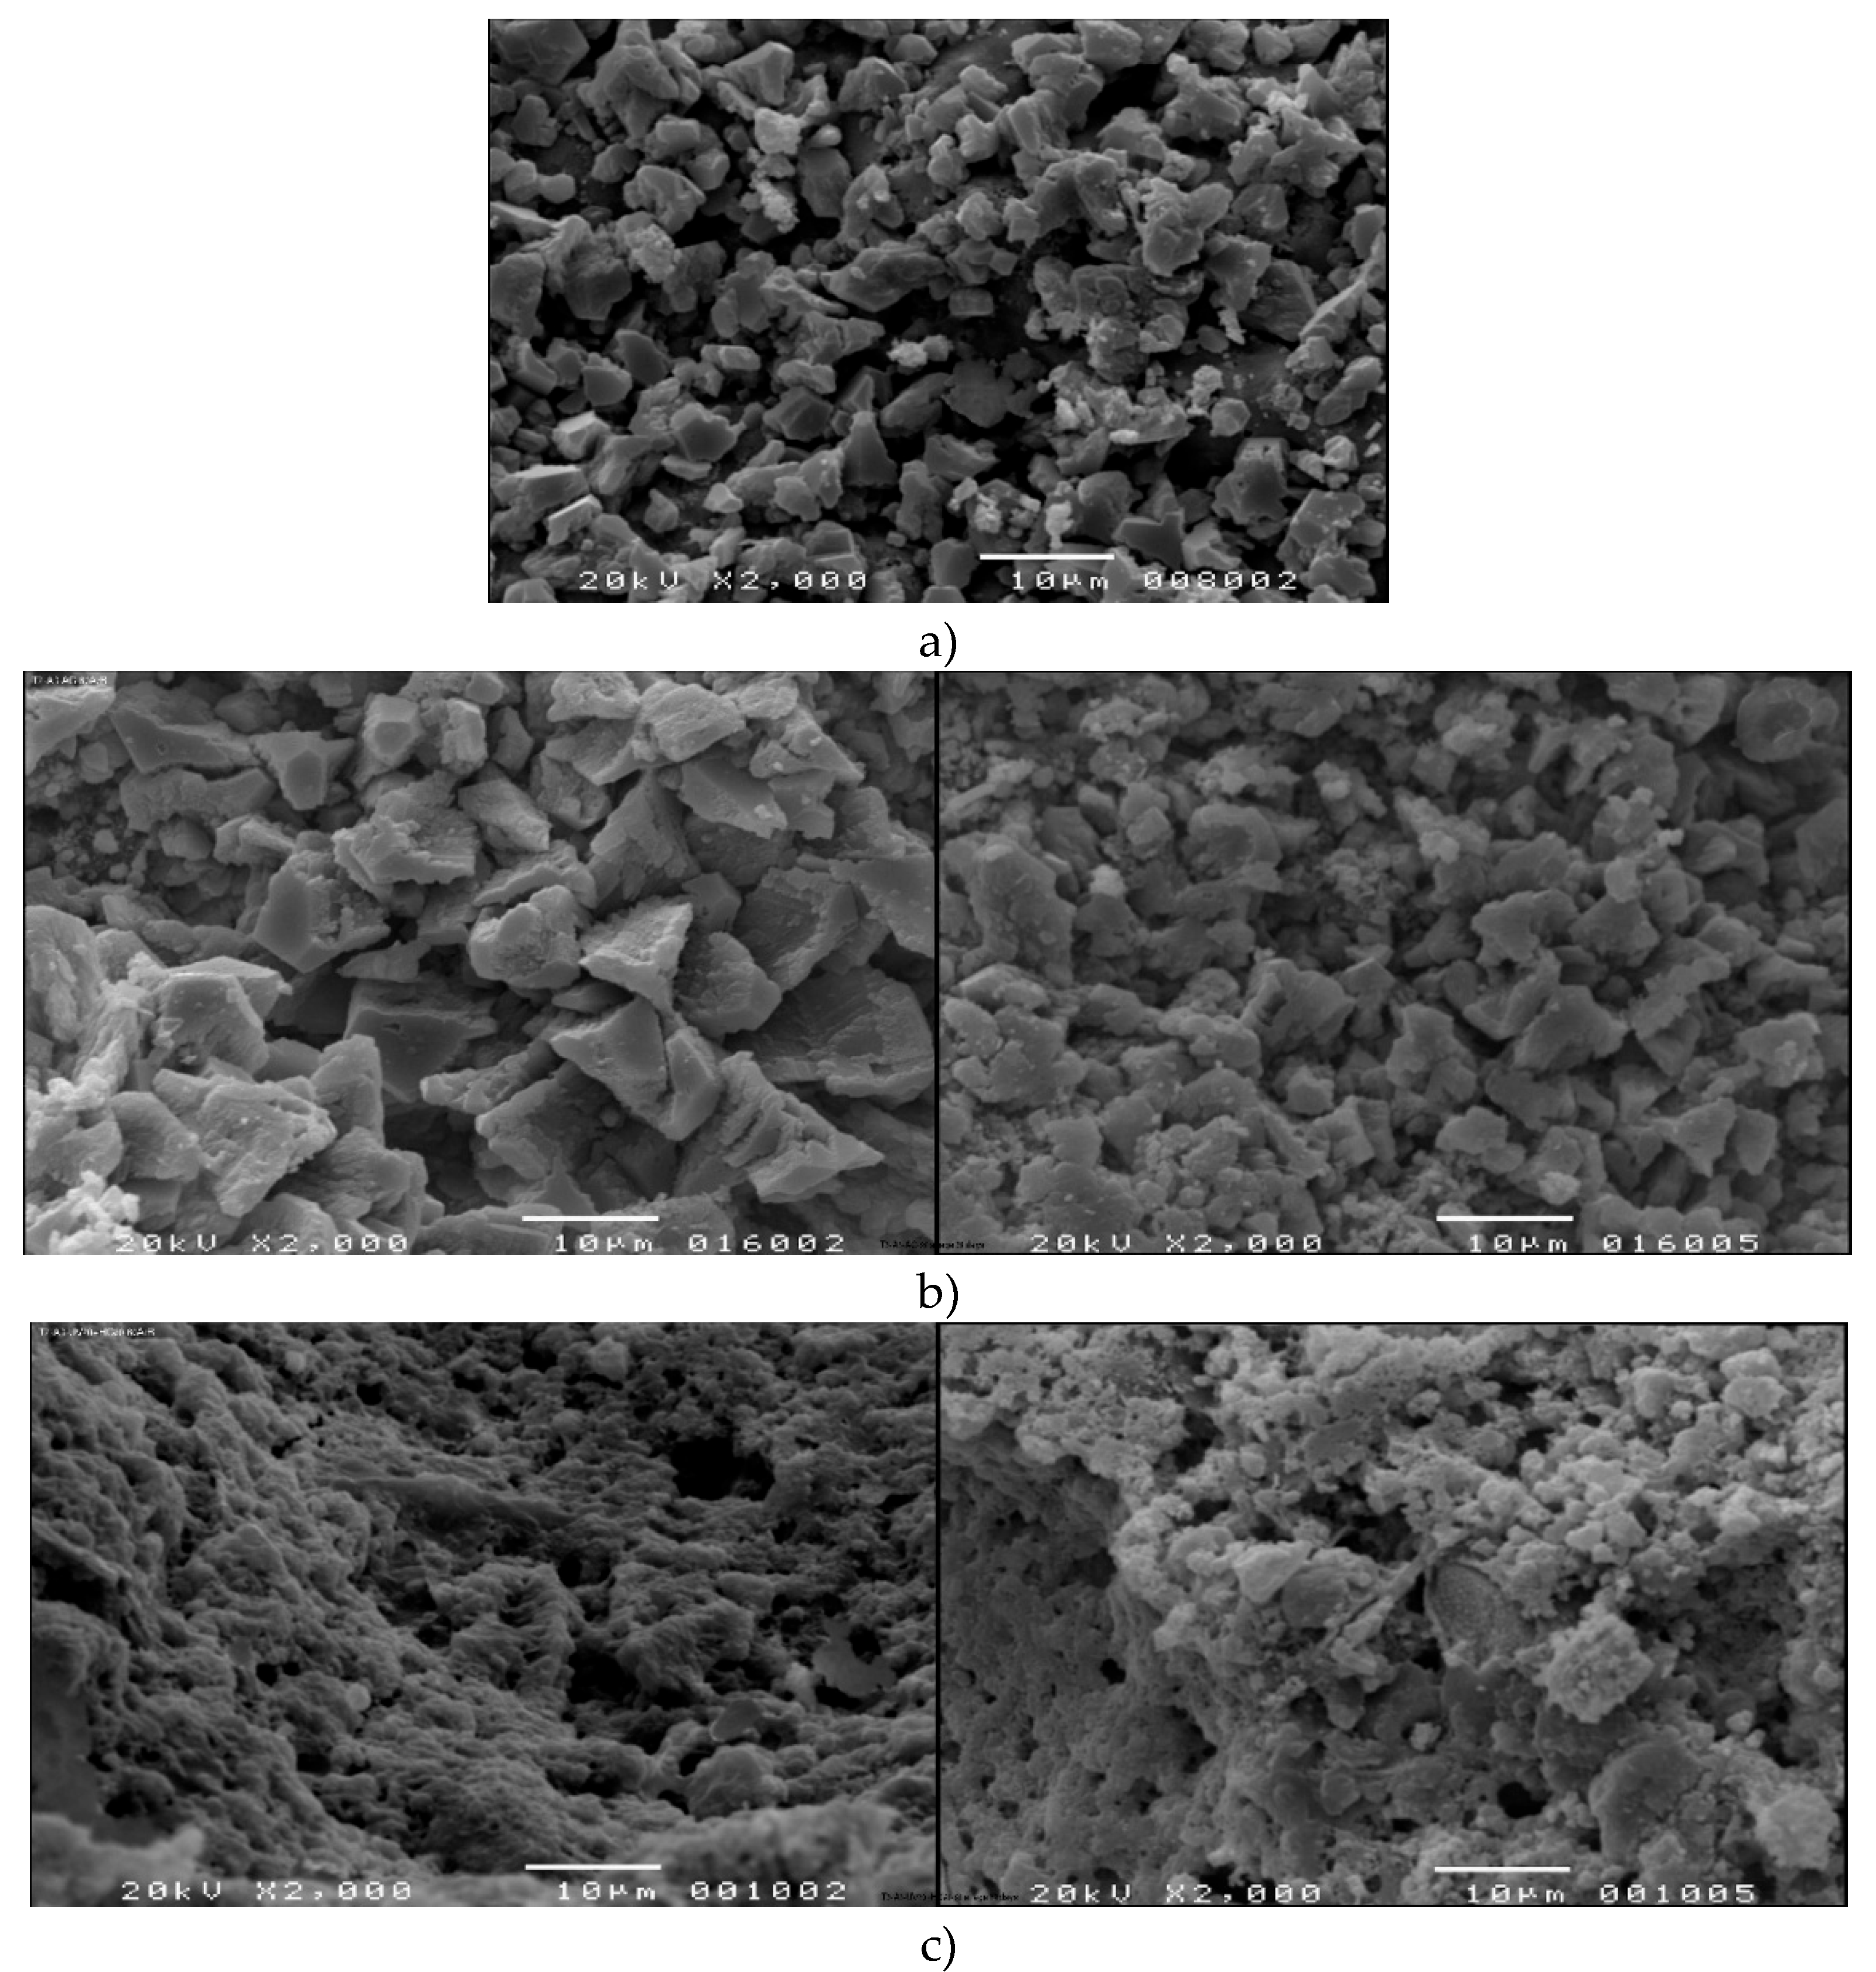
Table 1.
Polymer-Modified Cement Adhesive Properties.
| Property | Adhesive 1 | Adhesive 2 | Adhesive 3 | Test Method/ Standard | Source |
|---|---|---|---|---|---|
| Classification (EN 12004) | C2TE | C2TE-S2 | C2T | EN 12004 [30] | Manufacturer (EN 12004) |
| Bond Strength (28 days), MPa | >1.0 | >1.0 | >1.0 | EN 1348 [51] | Manufacturer (EN 1348) |
| Flexural Strength, MPa | 3.8 ± 0.07 | 3.0 ± 0.08 | 2.7 ± 0.20 | Beam test | Experimental |
| Compressive Strength, MPa | 19.7 ± 0.11 | 9.7 ± 0.06 | 9.7 ± 0.06 | Cube test | Experimental |
| 19.6 ± 0.13 | 4.9 ± 0.14 | 6.2 ± 0.06 | Experimental | ||
| 17.5 ± 0.12 | 5.3 ± 0.09 | 7.0 ± 0.14 | Experimental | ||
| Elastic Modulus, MPa | 7900 ± 0.15 | 2700 ± 0.06 | 3400 ± 0.09 | Beam flexural test | Experimental |
| 6300 ± 0.16 | 2800 ± 0.20 | 3400 ± 0.11 | Experimental | ||
| 9000 ± 0.09 | 1800 ± 0.25 | 3900 ± 0.22 | Experimental | ||
| Open Time, at least, minutes | 20 | 30 | 20 | EN 1346 [49]/ SI 4004 [48] |
Manufacturer |
| Maximal Pot Life, hours | Up to 3 | Up to 3 | Up to 1 | SI 4004 [48] | Manufacturer |
| Optimal Pot life, min | 60 | 60 | 60 | SI 4004 [48] | Experimental |
| Deformation Capability | Standard | S2 (≥2.5 mm) | Standard | EN 12002 [52] | Manufacturer |
| Application Temperature, °C | 5-35 | 5-35 | 5-35 | SI 4004 [48] | Manufacturer |
| Water-to-Powder Ratio | Per manufacturer | 4-6 L/25 kg | 5.5 L/20 kg | SI 4004 [48] | Manufacturer |
| Application Thickness, mm | 3-10 | 3-10 | 3-10 | SI 1555 [53] | Manufacturer |
| Minimum Bond Strength, MPa | ≥0.5 | ≥0.5 | ≥0.5 | SI 1555 Part 1 [53] | Manufacturer |
Table 2.
Tile Material Properties.
| Property | Porcelain Stoneware | Test Method | Standard |
|---|---|---|---|
| Dimensions, cm | 40×40×0.8 | Dimensional measurement | SI 314 [54]/EN 14411 [31] |
| Water Absorption (weight%) | <0.5 | Immersion method | SI 314 [54]/EN 14411 [31] |
| Classification | Group B-I-a | EN 14411 [31] | EN 14411 [31] |
| Surface Preparation | Unglazed back surface | Visual inspection | - |
Table 3.
Concrete Substrate Properties.
| Property | Value | Test Method | Standard |
|---|---|---|---|
| Compressive Strength | ≥25 MPa | Cube test | SI 466 [56] |
| Surface Texture | Unfinished cast surface | Visual/tactile assessment | SI 1555 [53] |
| Moisture Content | <3% by mass | Gravimetric method | SI 3085 [57] |
| Surface Preparation | Mechanically cleaned | Wire brushing | SI 1555 [53] |
Table 4.
Sample Designation System for Environmental Exposure Testing.
| Component | Code | Description |
|---|---|---|
| Tile Type | T1 | Porcelain Stoneware |
| Adhesive Type | A1/A2/A3 | Adhesive formulations 1-3 |
| Optimal Pot Life (min) | 60 | Adhesive was prepared and kept in reference or in hot conditions before the tile installation procedure |
| Previous Curing Conditions | RC/HC | Reference/Hot |
| Adhesive Exposure Condition | RC/AC/UV | Reference/Arid/Ultra-violet |
| Pot time (min) | 60 | Optimal pot life |
| Open time (min) | 20 | Exposure time |
| Total Installation Duration (min) | (60+20) | Pot time + Exposure time |
| Replicate | A/B | Statistical replicates |
Table 5.
Standardized SEM Image Analysis Procedures for Microstructural Quantification.
| Analysis Type | Step | Description |
|---|---|---|
| Crack Analysis | 1 | Acquiring a high-resolution SEM image of the specimen surface |
| 2 | Converting to 8-bit grayscale and enhancing contrast | |
| 3 | Applying contrast enhancement and noise filtering | |
| 4 | Binarization | |
| 5 | Edge thinning using the 'Skeletonize' tool | |
| 6 | Applying the 'Analyze Skeleton' plugin to extract morphometric data | |
| Fracture Surface Directionality | 1 | Acquiring an SE-SEM image of the hardened adhesive surface exposed after pull-off testing |
| 2 | Applying Gaussian smoothing (σ = 1.0 pixel) to reduce noise | |
| 3 | Executing the Fiji directionality plugin using the Fast Fourier Transform method | |
| 4 | Extracting orientation histogram with 1° angular resolution | |
| 5 | Calculating direction (°), dispersion (°), amount (0-1), and goodness (0-1) parameters | |
| 6 | Assessing fracture surface characteristics through statistical analysis of orientation distribution |
Table 6.
Summary of Directionality Parameters for All Adhesives and Exposure Conditions.
| Title & Adhesive | Exposure Condition (see Table 4) | Direction (°) | Dispersion (°) | Amount | Goodness |
|---|---|---|---|---|---|
| T1-A1 | RC (60+20)-80AB (Reference) | 9.4 - 12.1 | 26.0 - 28.0 | 0.64 - 0.70 | 0.66 - 0.85 |
| HC60+AC20-80AB (Hot + Arid) | (-107.29) - 13.64 | 1.04 - 24.75 | 0.0 - 0.63 | 0.27 - 0.62 | |
| HC60+UV20-80AB (Hot + UV) | (-60.47) - 18.43 | 17.65 - 22.8 | 0.32 - 0.57 | 0.17 - 0.57 | |
| T1-A2 | RC (60+20)-80AB (Reference) | 0.8 - 12.8 | 10.0 - 23.0 | 0.27 - 0.58 | 0.34 - 0.41 |
| HC60+AC20-80AB (Hot + Arid) | 19.78 - 72.55 | 9.11 - 27.25 | 0.26 - 0.7 | 0.65 - 0.72 | |
| UV20+HC60-80A (Hot + UV) | (-1.65) | 26.72 | 0.67 | 0.65 | |
| T1-A3 | RC (60+20)-80A (Reference) | (-4.76) | 16.55 | 0.46 | 0.65 |
| HC60+AC20-80AB (Hot + Arid) | 4.78 - 10.09 | 27.52- 30.61 | 0.69 - 0.79 | 0.51 - 0.79 | |
| UV20+HC60-80AB (Hot + UV) | (-16.24) - 12.64 | 27.64 - 36.75 | 0.77 - 0.85 | 0.37 - 0.90 |
Table 7.
Summary of Crack-Network Parameters for Adhesives.
| Tiles & Adhesive | Exposure Condition | Crack Density (mm/mm²) | Mean Branch Length (µm) | Tortuosity | Branching Index |
|---|---|---|---|---|---|
| T1-A1 | RC (60+20)-80AB (Reference) | 24.20 - 34.18 | 0.020 - 0.028 | 1.12 - 1.15 | 1.54 - 1.88 |
| HC60+AC20-80AB (Hot + Arid) | 26.23 - 29.03 | 0.025 - 0.029 | 1.12 - 1.12 | 1.95 - 2.54 | |
| HC60+ UV20-80AB (Heat + UV) | 25.19 - 26.48 | 0.024 - 0.026 | 1.13 - 1.14 | 1.80 - 2.21 | |
| T1-A2 | RC (60+20)-80AB (Reference) | 27.31 - 45.57 | 0.012 - 0.021 | 0.98 -1.10 | 0.78 - 1.11 |
| HC60+AC20-80AB (Hot + Arid) | 41.92 - 51.57 | 0.011 - 0.012 | 1.08 - 1.09 | 0.83 - 1.00 | |
| UV20+HC60-80A (Hot + UV) | 30.35 | 0.0207 | 1.096 | 1.138 | |
| T1-A3 | RC (60+20)-80AB (Reference) | 23.83 | 0.026 | 1.12 | 0.90 |
| HC60+AC20-80AB (Hot + Arid) | 1111.48 - 1332.32 | 0.984 - 1.116 | 1.19 - 1.19 | 0.83 - 1.13 | |
| UV20+HC60-80A (Hot + UV) | 1281.21 -1425.18 | 1.150 - 1.255 | 1.12 | 1.02 - 1.04 |
Table 8.
Summary Statistics of Pull-Off Adhesion Strength and Delamination by Environmental Exposure Condition.
Table 8.
Summary Statistics of Pull-Off Adhesion Strength and Delamination by Environmental Exposure Condition.
| Exposure Condition | Pull-Off Adhesion Strength | Delamination Percentage | ||||
|---|---|---|---|---|---|---|
| Range (MPa) | Mean (MPa) | CV (%) | Range (%) | Mean (%) | CV (%) | |
| Reference (21°C/65%RH) | 1.5 - 2.0 | 1.77 | 14 | 47 - 72 | 57 | 23 |
| Hot + Arid (30°C/40%RH) | 0.6 - 0.7 | 0.64 | 9 | 26 - 97 | 72 | 55ᵃ |
| Hot + UV (30°C/65%RH + UV 20 min) | 0.1 - 0.6 | 0.26 | 104ᵇ | 88 - 100 | 96 | 7 |
Notes: CV = Coefficient of Variation. ᵃ High CV (55%) for Hot + Arid delamination reflects single CF-A failure case (T1-A1: 26%) contrasting with predominant AF-T failures (T1-A2, T1-A3: 92-97%). ᵇ High CV (104%) for Hot + UV pull-off reflects formulation-dependent degradation, with A1 retaining moderate strength (0.57 MPa) while A2 and A3 exhibited catastrophic failure (0.10 MPa).
Table 9.
Integrated Microstructural Parameters and Pull-Off Performance.
| Sample | Exposure | Pull-Off Adhesion Strength | Delam. (%) | Failure | Goodness | Dispersion (°) | Crack Density (mm/mm²) | Branch Length (µm) | |
|---|---|---|---|---|---|---|---|---|---|
| MPa | Ratio | ||||||||
| T1-A1-RC | Reference | 1.50 | 100% | 52 | AF-T | 0.755 | 27.0 | 29.19 | 0.024 |
| T1-A1-HC60+AC20 | Hot + Arid | 0.61 | 41% | 26 | CF-A | 0.445 | 12.9 | 27.63 | 0.027 |
| T1-A1-HC60+UV20 | Hot + UV | 0.57 | 38% | 88 | AF-T | 0.370 | 20.2 | 25.84 | 0.025 |
| T1-A2-RC | Reference | 2.00 | 100% | 72 | AF-T | 0.375 | 16.5 | 36.44 | 0.017 |
| T1-A2-HC60+AC20 | Hot + Arid | 0.60 | 30% | 97 | AF-T | 0.685 | 18.2 | 46.75 | 0.012 |
| T1-A2-HC60+UV20 | Hot + UV | 0.10 | 5% | 100 | AF-T | 0.650 | 26.7 | 30.35 | 0.021 |
| T1-A3-RC | Reference | 1.80 | 100% | 47 | AF-T | 0.650 | 16.6 | 23.83 | 0.026 |
| T1-A3-HC60+AC20 | Hot + Arid | 0.70 | 39% | 92 | AF-T | 0.650 | 29.1 | 1221.9 | 1.050 |
| T1-A3-HC60+UV20 | Hot + UV | 0.10 | 5.5% | 100 | AF-T | 0.635 | 32.2 | 1353.2 | 1.203 |
| Reference Mean | 1.77 | 100% | 57% | - | 0.593 | 20.0 | 29.8 | 0.022 | |
| Hot + Arid Mean | 0.64 | 36% | 72% | - | 0.593 | 20.1 | 432.1 | 0.363 | |
| Hot + UV Mean | 0.26 | 15% | 96% | - | 0.552 | 26.4 | 469.8 | 0.416 | |
Disclaimer/Publisher’s Note: The statements, opinions and data contained in all publications are solely those of the individual author(s) and contributor(s) and not of MDPI and/or the editor(s). MDPI and/or the editor(s) disclaim responsibility for any injury to people or property resulting from any ideas, methods, instructions or products referred to in the content. |
© 2026 by the authors. Licensee MDPI, Basel, Switzerland. This article is an open access article distributed under the terms and conditions of the Creative Commons Attribution (CC BY) license (http://creativecommons.org/licenses/by/4.0/).
Copyright: This open access article is published under a Creative Commons CC BY 4.0 license, which permit the free download, distribution, and reuse, provided that the author and preprint are cited in any reuse.


