
Submitted:
26 December 2025
Posted:
29 December 2025
You are already at the latest version
Abstract
The emergence and application of Building Information Modelling, Internet of Things, and Computer Aided Virtual Environments (CAVEs) has created new opportunities for remote monitoring and decision-making in the operational built environment. However, there is a lack of research into the viability of CAVEs as an alternative for on-site decision-making in the built environment. This paper critiques previous literature before applying a framework for the evaluation of virtual environments, to compare task and human performance in a CAVE and real-world setting. Situation awareness, workload, presence, anxiety, usability, behaviour and user experience are all measured and compared between the two environments. The study found the CAVE system outperformed the real-world across several dimensions, indicating the viability of their use in this domain. Finally, the implication of the results are discussed with regards to the existing literature.
Keywords:
CAVE
; virtual reality
; built environment
; situation awareness
; cognitive load
; presence
; anxiety
; usability
; human-computer interaction
; engineering psychology
1. Introduction
The operation and monitoring of built assets increasingly rely on advanced digital infrastructures as a consequence of the Fourth Industrial Revolution [1]. Building Information Modelling (BIM) [2] and Internet of Things (IoT) networks can provide the data required for operational decision-making, and extended reality (XR) platforms are being progressively utilised due to their immersive benefits [3]. Within this trajectory, the CAVE Automatic Virtual Environment (CAVE) has re-emerged as a distinctive modality of XR: “a room-sized multi-person virtual environment in which parts or all of the walls, floors, and ceiling surround users with 1-to-1 scale display screens and audio” [4]. Unlike head-mounted displays (HMDs), CAVEs afford natural co-presence and collaboration, qualities that position them as candidates for remote inspection, training, and decision-support in the built environment. These technologies present an opportunity to visualise built environment operational conditions from a remote virtual environment. Yet, despite more than three decades of technical development since their introduction [5], the empirical evidence base for how CAVEs compare to equivalent real-world tasks remains underdeveloped, with limited understanding of their impact on user performance and psychophysiological state.
1.1. Previous Research
A recent systematic review by Pogmore, Davies and Cooke [4] synthesised 120 studies investigating the application of CAVEs to built environment tasks. This review identified three primary streams of research: (i) CAVEs as tools for conducting difficult or unsafe experiments, (ii) CAVEs as platforms for demonstrating novel capabilities, and (iii) CAVEs as comparators for alternative virtual or real task environments. Strikingly, only a minority (16) of studies compared CAVE use to a real-world equivalent. This illustrates a critical gap: while CAVEs are widely deployed for design review, training, and research, the evidence for their fidelity in replicating real-world built environment task performance, or in shaping users’ cognitive and emotional experiences, is sparse. Moreover, Pogmore, Davies and Cooke concluded that no established guidelines exist for designing or applying CAVEs as environments for remote decision-making in operations and maintenance contexts.
Whilst many studies have compared task and human performance factors between HMDs and the real world [6,7], there are limited studies which compare CAVEs to the real-world. Harty and Tryggestad [8] investigated differences in user reactions to the same building design in a CAVE and real-world setting. The CAVE evoked alternate design discussions amongst users when compared to the real-world, such as experiential and spatial qualities of the design. Wahlström et al. [9] evaluated a CAVE system for end-user participation in the design of hospital rooms and contrasted it to evaluations of the hospital design in the real-world. Participants exhibited behaviour indicating high presence, and CAVE-based evaluation was similar to real-world evaluation for the majority of design issues. However, participants did not have the same sense of space or bodily interactions with the rooms. Arias et al. [10] contrasted evacuation behaviour between participants in a CAVE, HMD and real-world mock-up of a building fire scenario. The authors found that evacuation behaviour between the HMD and real-world were similar, but CAVE differed significantly and suggested that navigation method (controller rather than head movement) was the dominant contributing factor to this difference in behavioural validity. A study by Brade et al. [11] compared participant’s presence for a wayfinding task between a CAVE and real-world setting and evaluated the impact of presence on usability and user experience. The authors found that CAVE users reported higher engagement and quality of experience, but lower pragmatism than the real-world. In addition, it was noted that within the CAVE, presence was positively correlated with both usability and user experience. The cognitive load when controlling an un-manned aerial vehicle through a CAVE or direct view was evaluated by Betancourt et al., who found that it was lower for the virtual system. In a study by Chen et al. [12], participants lifted virtual and real objects to investigate the method of virtual exertions, and reported similar perceived effort but higher mental, temporal, and frustration workload demand. Schneider et al. [13] compared pedestrian road-crossing behaviour in a CAVE, HMD and real-world environment, and found that behaviour differed systematically for both the CAVE and HMD compared to the real-world. Heldal, Spante and Connell [14] investigated collaboration and performance levels for individual and pairs of participants completing tasks in four different virtual environments and a real-world environment. Results indicated that performance of pairs was best in networked CAVEs compared to other distributed environments, and that pairs were superior to individuals. However, real-world task performance was found to be best overall with no significant difference between individuals or pairs of participants. To investigate the effectiveness of virtual reality training for industrial process training, Kotek et al. [15] developed emergency training scenarios in a CAVE, HMD, 2D (desktop) environment and for a real control panel, and found that participants had a higher human error rate using the virtual systems when compared to the real system. Dell’Unto et al. [16] utilised a CAVE for analysis and hypothesis testing of an archaeological site using a digital model. They found that digital and immersive representation contributed novel findings about the site that had not been identified through in-situ analysis. In a similar vein, Vote et al. [17] developed a novel CAVE-based tool for archaeological analysis, which was found to be valuable for synthesising data and collaboratively investigating the site. Shrestha, Chakraborty and Mohamed [18] compared user preferences to a CAVE and traditional (paper-based) for a wayfinding task within a digital model of an historical asset. Despite uncertainty around the technology, users reported that the task was easier when using the CAVE. Shiratuddin, Thabet and Bowman [19] compared the suitability of four different virtual environments (including a CAVE) for construction decision-making through subjective measures. The CAVE was ranked first for level of realism, quality of presentation, ease of navigation, and overall decision-making suitability. Whisker et al. [20] evaluated the value of a virtual model displayed in a CAVE with 2D drawings for design review, construction scheduling and constructability assessment of a nuclear power plant – finding that the CAVE facilitating improved sequencing. Finally, Ye et al. [21] compared CAVE, non-immersive (desktop) and traditional environments for an assembly planning task, and found that both the CAVE and non-immersive environments outperformed the traditional.
Across the studies which compare CAVEs to real-world equivalent environments, consistent patterns can be observed with regards to SA, workload, anxiety, presence, and usability. CAVEs are generally found to elicit high levels of presence; however, this does not necessarily correspond to high levels of task performance or experience across other constructs. In terms of the levels of SA proposed by Endley [34], whilst perception of the environment appears to be preserved, comprehension and projection is frequently altered relative to real-world performance. Cognitive load in CAVEs is commonly reported to be equal to or greater than that experienced in real-world environments, with increases attributed to interaction techniques, sensorimotor discrepancies, and the need for conscious interpretation of cues that are automatic in physical settings. Usability assessments of CAVEs indicate that, whilst CAVEs are generally rated highly in terms of experiential quality, realism, and navigation – the pragmatic usability (the degree to which the system supports effective and efficient task completion) is reduced. In addition, the studies suggest that presence is correlated with usability in CAVEs.
1.2. Theoretical Constructs of Interest
The review by Pogmore, Davies and Cooke [4] also highlighted that the constructs most frequently studied in CAVE research in the built environment were presence (18 studies), usability (12 studies), cognitive load (6 studies), stress (5 studies), and anxiety (2 studies). Presence, described as the subjective sense of ‘being there’ in a mediated environment [22], has been shown to be correlated to attention and cognitive resources for task performance [23,24]. Usability refers to the extent to which a system enables effective, efficient, and satisfying interaction. Cognitive load describes the demand placed on working memory when performing a task, with excessive or fluctuating load known to impair performance [25,26,27,28]. Finally, stress and anxiety directly influence cognitive processing, with increased anxiety found to reduce performance [29,30,31,32,33]. In addition, the engineering psychology literature repeatedly proposes the importance of situation awareness (SA) for decision-making [32,33], defined by Endsley [34] as “the perception of elements in an environment within a volume of time and space, the comprehension of their meaning, and the projection of their future status”. Yet, Pogmore, Davies, and Cooke [4] only found one study which investigated SA in a CAVE-based built environment task.
Collectively, these constructs provide a multidimensional account of user experience and performance in virtual environments. However, to date, no published study has measured all of them simultaneously in a controlled experimental CAVE versus real-world comparison. The lack of such an evaluation constrains theoretical insight (how constructs interact in immersive environments), industrial viability (if CAVE environments provide satisfactory environmental stimuli for decision-making) and practical guidance (how CAVEs should be designed for critical remote applications).
1.3. Toward a Holistic Evaluation Framework
To address this gap, Pogmore, Davies and Cooke [4] proposed the PERCEIVE (Performance and Cognitive Evaluation In Virtual Environments) framework; an evaluative model encompassing performance, experience, and psychophysiological variables. This study responds to converging calls in the XR literature for integrated evaluations that com-bine subjective (e.g., presence, usability, workload) and behavioural or psychophysiological measures, and that move beyond single-construct analyses [35,36,37,38,39,40]. PERCEIVE situates objective task performance alongside subjective measures of presence, usability, cognitive load, and anxiety, enabling a holistic understanding of how virtual environments mediate human activity. Importantly, the framework was designed not only as a conceptual synthesis but also as a blueprint for empirical testing. The present study reports the first application of the PERCEIVE framework in a direct comparison between CAVE and real-world task environments.
1.4. Contribution of the Present Study
Remote monitoring and decision-support are becoming increasingly viable in the built environment, particularly for high-risk or re-source-intensive operations. Technical specialists are often required on-site to provide expertise during inspections or emergencies, incurring cost, delay, and risk exposure. If CAVEs can provide sufficient fidelity of information and cognitive support to enable these tasks remotely, they may offer significant benefits in terms of efficiency, safety, and scalability. However, this potential is contingent on users being able to attain acceptable levels of SA, manage cognitive workload, and maintain comfort in the virtual environment. Empirical data directly comparing CAVE and real-world task performance is therefore essential to validate CAVEs as decision-support platforms in operations and maintenance.
The aim of the present study is to compare, through experimental measurement, the effect of environment on both human performance and experience for the same observation task. In this study, participants completed identical observational tasks in both virtual (CAVE) and real-world conditions, enabling systematic measurement of performance, SA, workload, presence, usability, and anxiety. By capturing these constructs in a single experimental design, the study advances methodological practice in immersive environment research and extends theoretical understanding of how psychological and behavioural variables co-occur in CAVEs. More broadly, the findings contribute to the evidence base necessary to inform the design of CAVEs as remote decision-support environments for the built environment – addressing the gap explicitly highlighted by Pogmore, Davies and Cooke [4].
1.5. Aims and Objectives
From the review of previous studies, four limitations were identified. First, there is a wide range of contexts and task ecology, which makes intra-study comparison difficult. Second, there is no common approach to CAVE system evaluation. The literature presents a range of difference variables of interest, with a range of difference measurement techniques. Only one prior study measured SA, and none jointly assessed workload, presence, usability, and anxiety within a single experimental design. Third, environment effects are frequently confounded by interface effects. Effect of display, effect of control, effect of real versus physical objects, effect of information access (way of interacting with data) – are all often included in studies which compare CAVE to reality, meaning the effect of just environment is unclear. Finally, no empirically grounded guidelines exist for the design of CAVE systems to support remote decision-making. These limitations present key gaps in the literature, which can be expressed in terms of research questions:
RQ1. How does human performance and experience differ between CAVE and real-world environments when undertaking the same task?
RQ2. What empirical insights can be derived to later inform the design of CAVE systems for remote decision-making in the built environment?
To answer these questions, the study pursues the following objectives:
- To investigate the effect of environment on SA, workload, anxiety, presence, and usability through the operationalisation of the PERCEIVE framework.
- To investigate the contributing factors to changes in psychological profile and to the usability of the CAVE system.
- To examine the inter-relationships between these variables in each environment.
- To validate the PSyFIVE model and its internal relationships.
- To generate empirical evidence that can inform the development of design guidelines for CAVE systems intended to support remote decision-making.
Together, these objectives directly address the previously identified gaps by providing the first experimental procedure to measure SA, workload, anxiety, presence and usability – and by offering evidence to inform the design of CAVE systems for remote operational tasks.
2. Materials and Methods
This section outlines the methodological framework adopted for the study and details the experimental design, participant recruitment criteria, measures and apparatus employed, and the simulation environments used. The procedures for conducting the experiment are described, followed by an overview of the data collection and processing methods. Together, these subsections provide transparency and replicability to ensure that the study can be critically evaluated and reproduced.
2.1. Experimental Design
The methodology deployed in this paper is the first operationalisation of the PERCEIVE framework, which “utilises the factors from the PSyFIVE model and presents an experimental methodology to evaluate their interdependencies and overall influence on task performance” [4]. The PSyFIVE (Psychological and System Factor Interdependencies for Virtual Environments) model is the theoretical basis used in this study. The methodology measured participants from two independent samples under two conditions: performing the task within the CAVE (Condition V) and performing the task in the real world (Condition R). Conditions V and R are so called to reflect the virtual and real environments in which the task is performed, respectively. As independent samples were tested under two conditions, the resulting data is unpaired and between-subject. Between-subject design was chosen in order to provide the exact same task to participants in both conditions, which is not possible in with-in-subject design without introducing the risk of learning and order effect. Participants were randomly assigned a condition in order to reduce the effect of individual factors.
2.2. Population and Exclusion Criteria
A total of 26 participants were recruited both through social media channels and word-of-mouth, with 13 in Condition R and 13 in Condition V (and 13 males and 13 females). Exclusion criteria for the study dictated that no participant was an expert CAVE user, had photosensitive epilepsy, or suffered from severe cybersickness. All participants completed a signed consent form, and full ethical approval was granted by the University of Birmingham Science, Technology, Engineering and Mathematics ethics committee (see Institutional Review Board Statement).
2.3. Apparatus and Measures
First, an Insta360 ONE X2 [41] 360° camera was used to record a benchmark simulation of the real environment in which actors moved around the experimental scene shown in Figure 1. The 360° video was then used to visualise the scenario within the CAVE system. After the benchmark video had been recorded, the 360°camera was removed and participants undertaking the task within the real condition (Condition R) were asked to stand in the same position as the 360°camera described in Figure 1. In Condition R, participants did not use any other apparatus besides paper-based questionnaires.
The virtual arrangement (Condition V) had participants use a CAVE system, namely the Fulcro FULmax VR-Hub Wide [42], in which they experienced the benchmark 360° video. A representation of the CAVE system and apparatus used in this study can be seen in Figure 2.
Six projectors within the CAVE surrounded participants both on the walls and ceiling, with approximately 222° of horizonal and 129° of vertical field of view [43]. An Xbox One [44] controller was used by the participant to rotate the field of view around a 360° field of regard. Audio recorded during the benchmark video was also present within the CAVE. The measurement techniques and materials used to capture the variables of interest of this study can be found in Table 1 below.
These variables and respective measurement techniques were selected due to their applicability in evaluating performance in CAVEs as suggested in previous work [4]. A mixed methods approach was adopted to provide a comprehensive evaluation of human performance and experience in a CAVE versus reality. To measure SA, the SAGAT was used for participants in both conditions. The SAGAT consists of question probes at random time intervals, with questions corresponding to increasing levels of SA, as per Endsley’s three level model of SA [34]. The percentage of correct answers is presented as the overall level of SA during the task for each participant.
To measure the subjective workload experienced by each participant during the task, the NASA-TLX was used [46]. NASA-TLX is a self-reported questionnaire which uses 7-point Likert scales to rate 6 subscales of workload: Mental Demand (MD), Physical Demand (PD), Temporal Demand (PD), Performance (Pe), Effort (Ef) and Frustration (Fr). Participants first rank the contribution of each subscale in pairwise comparisons, based on the influence of each subscale to the workload they experienced. The Likert scores of workload (Magnitude of Load, ML) are then weighted according to the Weight Load (WL) to form an Overall Workload (OW) score for each subscale (Equation 1). Weighted Workload (WW) is then calculated from the sum of the OWs (Equation 2) to create a single workload rating for each participant.
Subjective, self-rated measurements of state-anxiety were taken before and after the task. State-anxiety was measured using the STAI [47], which consists of 20 questions, scoring between 0 and 4 points, with higher values associated with higher levels of anxiety. The sum of all question scores gives a total out of 80 and reflects the state-anxiety experienced by the participant during the task. Spielberger et al. [47] proposed that scores between 20-39 indicated low state-anxiety, 40-59 indicated medium state-anxiety, and 60-80 indicated high state-anxiety.
The IPQ [48] measures presence across three subscales identified through factor analytic work: Spatial Presence (SP), which reflects the extent to which the virtual environment is experienced as the reference frame for perception and action; Involvement (INV), which captures the degree of attentional engagement and absorption in the virtual environment; and Experienced Realism (REAL), which assesses the perceived plausibility and coherence of the virtual environment. The questionnaire also includes a single General Presence (G) item to provide an overall subjective presence rating. X
The SUS [49] was used to determine the subjective opinions of CAVE usability for participants in the virtuality condition. The SUS is a 10-question 5-point Likert scale questionnaire, which generates a usability score between 0 and 100 after normalisation. An overall SUS score is derived from the sum of positive question scores (1,3,5,7,9) less the sum of responses from negative question scores (2,4,6,8,10) as described in Equation 3.
Though a grading system to contextualise the results of the SUS was not created by Brooke [51] research by Sauro [52], in which 246 studies were analysed, presented a curved grading scale centred around the average SUS score (68).
2.4. Situation Awareness Model and Simulation Environment
To support the interpretation of the SA results, a map of the ground truth in the experimental simulation was created (Figure 3).
This representation serves as the objective reference against which participants’ SA mental models, their internal understanding of what is happening and how the situation is unfolding, can be interpreted and compared. Within the simulation, actors wearing high visibility clothing (the task ‘elements’) moved around the scene. Elements A and B moved in a circular pattern, initially walking, and crossing paths when they intersected. The speed at which they moved changed throughout the simulation. Element C walked around the statue and threw a ball in the air when visible to the participant. The movement and actions of the elements were based on a predefined pattern, choreographed by the task administrator based on time intervals.
2.5. Procedure
The process followed by each participant, for both the real and virtual conditions, is described in Figure 4.
In Condition V, participants undertook the entire protocol inside a closed teaching space in which the CAVE is located. First, participants were presented with the Participant Information Sheet (PIS) and asked to complete the Consent Form if they agreed to the terms of the PIS. Participants then undertook a 5-minute guided diaphragmatic breathing protocol in order to establish a baseline measurement of state-anxiety and reduce the likelihood of “anxiety carryover” in initial measurement [56,57]. The STAI (Form Y) [47] was then administered to gather a baseline (“pre-test”) measurement of state-anxiety. Participants were then given 5 minutes (or until they stated they were content with their knowledge of the controls) of CAVE training for a different video in which the controls are the same as the task to be completed. Participants were read the task brief, their objectives, and asked if they had any further questions. The task was then performed. At set intervals (unknown to the participant), the administrator asked the participant to turn away from the CAVE, paused the video, and asked the participant questions relating to their awareness of the situation. After each round of questions, the participant was asked to return to face the CAVE, and the video was continued. At the end of the task, the participant was guided out of the CAVE and post-task questionnaires were administered. First, the STAI was completed for a second time to capture post-task state-anxiety levels. Then, the NASA-TLX was administered to capture the self-reported workload levels of the participant. The IPQ and SUS were then completed to measure presence and usability respectively.
Participants within Condition R were provided with the same PIS and signed consent forms were collected. Participants then received an identical (verbatim) task brief. Participants in Condition R did not receive CAVE training, and instead undertook the task, with the administrator probing with questions at the same intervals as in Condition V. The participants then completed the post-task STAI and NASA-TLX in the same way, but did not complete the IPQ or SUS. This was due to the lack of relevance of presence and usability to a real-world environment. To reduce the potential effects of timing bias, post-task questionnaires were administered immediately following task completion and in the same order for all participants.
2.6. Data Collection and Processing
Data for each participant was collected in accordance with the materials described in Table 1 (the measurement techniques table above). This resulted in a set of paper-based questionnaire results for all participants. For participants within Condition V, the paper-based results of the IPQ and SUS were also captured. Paper-based results were then manually entered into a digital spreadsheet, with graphical results such as the SAGAT map scanned and uploaded. Questionnaire data was then anonymised by assigning each participant a Participant ID (PID). The original data presented in this study was then stored for long-term Open Access (see the Data Availability Statement for more information).
2.7. Hypotheses and Planned Analyses
Based on the identified research gaps and the experimental design described above, a set of a priori hypotheses was formulated to examine environmental effects on human performance and experience, as well as relationships the variables of interest. These hypotheses were specific prior to analysis and are summarised in Table 2.
To ensure transparency, the planned analyses (statistical tests) for each hypothesis were specified prior to analysis and are summarised in Table 3 below.
As presence and induced anxiety were only captured for one condition (V), the sample was compared to the literature to determine relative performance. For presence, each participants’ scores for SP, INV, REAL and G were calculated from their questionnaire responses. The mean and standard deviation of the entire sample were then determined. These values were then compared to the mean and standard deviation from the IPQ database, which contains 542 cases of IPQ administration from the scientific community. These cases are ordered by type of visual display. To compare the sample collected in this study to other projection-screen type virtual environments, all cases (9) which used the IPQ for “monoscopic projection screen”, “stereoscopic projection screen”, “monoscopic multi-wall projection”, or “stereoscopic multi-wall projection” were analysed. These were grouped and referred to by their number of projection screens: Single Projection (n = 6) and multi-wall projection (n = 3). Furthermore, the Single Projection and Multi-Wall Projection cases from the IPQ database were pooled into a Combined Projection (n = 9) group. This allows the authors to compare the levels of presence experienced in the CAVE used in this study with a baseline from the literature. The results of the STAI were compared to Spielberger’s [47] scale to categorise the level of anxiety before and after the task, in order to infer the “induced anxiety” caused by task performance.
3. Results
The following section presents the results of the experiment, split in-to subsections by experimental measure. The three variables captured for all participants (SA, workload, and anxiety) are presented first, followed by the variables specific to participants in Condition V (presence and usability). Results are visualised, and where possible, statistical tests are applied to demonstrate the significance of any findings. For each measure, the null hypothesis, h0, is that there is no significant difference be-tween any of the two participant sample groups, and that any observed difference is due to sampling or experimental error [58].
3.1. Situation Awareness
The mean SAGAT score for Condition R was M = 56.8% (SD = 0.135, n = 13) and for Condition V was M = 92.1% (SD = 0.099, n = 13). Figure 5 below presents the mean SAGAT score and distribution of the sample for participants in Condition R and Condition V. Furthermore, the results of the SAGAT by SA level (as per Endsley’s 3LM) can be seen in Figure 6.
To determine whether SA differed between the two experimental conditions, a Mann-Whitney U test was conducted on the SA scores obtained using SAGAT. The Shapiro-Wilk preliminary assumption check indicated that the SA distributions in both groups departed significantly from normality (p < 0.05). As SA scores are bounded between 0-100% and are not normally distributed, the Mann-Whitney U test was selected as the most appropriate test for comparison. The results of the test revealed a statistically significant difference in SA between conditions, with SA scores in Condition V (Median = 100%) being significantly higher than those in Condition R (Median = 57.1%). Visualisation of mean SAGAT score by level clearly shows stepped reduction in SA between Level 1, 2, and 3 for participants in Condition R. On the other hand, SA only decreases slightly between Level 1 and Level 3 for participants in Condition V.
3.2. Workload
The mean ML for each subscale, by condition, are visualised in Figure 7. In addition, the mean WW for each condition is presented. These variables are useful in understanding both the sources of workload with-in a task, and the size of each workload relative to each other and as a total WW value.
In every workload subscale apart from Performance, Condition R reported higher mean values than Condition V. Welch’s independent samples t-test was conducted to compare WW scores between conditions, which found that Condition V reported substantially lower WW (M = 38.3, SD = 8.74) that Condition R (M = 53.8, SD = 6.49). Welch’s independent samples t-test was then applied for each workload subscale, and evidenced that MD, PD, TD and Fr were all significantly greater in Condition R. However, Pe was significantly greater in Condition V, with no significance found for the difference in Ef between conditions. Results of both statistical tests are presented in Table 4.
Categorical thresholds of WW are not defined in the NASA-TLX literature. However, based on a meta-analysis of NASA-TLX workload scores by [59], Condition R (M = 53.8) is slightly above the mean WW of monitoring (n = 174, M = 52.24) and tracking (n = 70, M = 51.00) studies. However, Condition V WW (M = 38.3) is in the bottom 25th per-centile for both monitoring (39.97) and tracking (39.25). When considering all 1151 studies, Condition R WW is approximately in the top 40%, whereas Condition V is in the bottom 30%. The mean WL of each work-load subscale, by condition, are presented in Figure 8.
Participants in both conditions reported, on average, a similar contribution of Mental Workload, Temporal Workload, Effort, and Frustration to their overall workload. From Welch’s independent samples t-test, it was found that the reported contribution of Physical Demand was significantly greater (t(24.6) = -2.96, p < 0.05) in Condition R than Condition V, but the reported contribution of Performance was significantly less (t(18.1) = 3.27, p < 0.05) in Condition R than Condition V.
3.3. Anxiety
The results of the STAI, administered both pre-test and post-test, are presented in Figure 9 for both conditions.
There is a clear trend of participants in Condition R reporting greater pre-task anxiety, decreasing over the duration of the task, and remaining slightly higher than Condition V post-task. The mean change in anxiety (induced anxiety) for Condition R was -13.2 () and for Condition V was -1 (. In context of Spielberger’s scale, participants in Condition R had medium anxiety throughout, with a significant decrease once the task was completed. The participants in Condition V had low anxiety throughout. The mean results by condition are visualised in Figure 10.
Welch’s independent samples t-test revealed that pre-task anxiety was significantly higher in Condition R (M = 53.9, SD = 17.4) than in Condition V (M = 27.6, SD = 4.6), with a large difference (t(13.53) = -5.28, p < 0.05). This difference remained significant post-task (t(17.52) = -3.93, p < 0.05). Using the paired-samples t-test, it was found that the reduction in anxiety displayed within Condition R was also significant (t(12) = 5.82, p < 0.05).
3.4. Presence
To examine whether any individual responses substantially deviated from the overall pattern of presence scores, z-scores were calculated for each participant on all four IPQ subscales (SP, INV, REAL and G). The z-scores revealed that Participant 19 consistently scored more than two standard deviations below the sample mean across multiple subscales, including an extremely low score on the G item. This pattern was not observed for any other participant and is typically interpreted as indicating a non-representative response, potentially due to non-engagement, misunderstanding of the questionnaire. As the task administrator did not notice any unusual aspects of task performance (reasons why presence should be lower when compared with other participants), Participant 19 was identified as an anomalous case and removed from quantitative analysis.
Assumption testing of both normality and variances was conducted prior to the t-test. Shapiro-Wilk tests showed that SP, INV, and REAL did not significantly deviate from normality (all p > 0.05), while G showed slight deviation (p < 0.05). However, as the t-test is robust to moderate violations of normality sample sizes are adequate and no extreme outliers are present (Field, 2018). Variances of both groups were assessed using Levene’s test, which indicated no significant differences in variances across any of the presence subscales (p > 0.05), but Welch’s t-test was still used due to the sensitivity of Levene’s test with relatively small sample sizes. Thus, the results of Welch’s t-test (α = 0.05, two-tailed) are presented in Table 5.
The mean subscale values for each of the Sample, Single Projection, Multi-Wall Projection, and Combined data can then be visualised in a presence profile, shown in Figure 11 below.
Analysis of Variance (ANOVA) was then applied to determine statistical significance in differences between the means of the Sample, Single Projection and Multi-Wall Projection groups. It is not statistically reliable to add the Combined Projection group to an ANOVA comparison as it is not an independent sample (it contains values from the other groups). The results of the ANOVA can be seen in Table 6.
The results of the one-way between-groups ANOVA indicates there were significant effects of condition on SP (F(2,17) = 4.22, MSe = 0.42, p = 0.032), INV (F(2,17) = 6.90, MSe = 0.40, p = 0.006), and REAL (F(2,17) = 22.86, MSe = 0.42, p < 0.001), but not on G (F(2, 17) = 0.24, MSe = 1.16, p = 0.786).
Post-hoc comparisons were conducted using the Games-Howell procedure [60], as this test does not assume equal variances or equal sample sizes. Given that the benchmark groups (Projection and Multi-Wall) were substantially smaller than the Sample group (n = 6 and n = 3 respectively), the Games-Howell post-hoc test provides a more appropriate evaluation of pairwise differences than Tukey’s Honestly Significant Difference test. Post-hoc comparisons showed that the Sample produced significantly higher REAL than both the Projection Screen group (p < 0.05) and the Multi-Wall Projection group (p < 0.05). The sample also produced higher INV than the Multi-Wall Projection group (p < 0.05), though not compared with the Projection Screen group (p > 0.05). SP showed no statistically reliable pairwise differences. These results indicate that the type of projection system used in this study resulted in significantly higher spatial presence, degrees of attentional engagement, and perceived realism of the environment in participants when compared to similar studies. However, the general sense of being physically located in the virtual environment was not significantly different from these similar studies. The results can be seen in Table 7.
3.5. Usability
The SUS score, by participant in Condition V, can be seen in Figure 12. The sample mean was 74.2 (SD = 14.2, n = 13) with a median alphabetised score of B. The distribution of responses to the questions asked by the SUS is presented in Figure 13.
Individual SUS scores ranged from 45 to 92.5 (M = 74.2, SD = 14.2), indicating generally positive evaluations of usability. A one-sample t-test was conducted to compare the mean SUS score to the industry benchmark value of 68 (grade C), which represents the 50th percentile of usability [61]. Prior to the analysis, the assumptions of the t-test were examined. Normality of the data was confirmed using the Shapiro-Wilk test (W = 0.948, p = 0.58), and visual inspection of the Q-Q plot indicated that scores closely followed a normal distribution. One mild low outlier (PID 10, SUS = 45) was identified but retained, as the t-test is robust to minor deviations from normality and single outliers when the sample size is greater than 10.
The one-sample two-tailed t-test indicated that mean usability was higher than the benchmark of 68, though not at a statistically significant level, t(12) = 2.03, p = 0.065. The effect size was moderate (d = 0.56), suggesting a meaningful difference. A 95% confidence interval for the mean difference [-0.6, 15.8] supports that the usability was generally above average, though the null hypothesis could not be rejected at the α = 0.05 level.
3.6. Correlation Analysis
To investigate the relationships between experimental variables and validate the PSyFIVE model introduced by Pogmore, Davies and Cooke [4], correlation analysis was undertaken. Correlation analysis aims to determine if correlation exists between two variables, the strength of this correlation, and the significance of the correlation (if it is likely that this correlation also exists at the population level). Correlation analysis was conducted for each pairwise comparison between SA, workload, anxiety, presence, and usability variables. Due to the large differences, as presented in the previous sections, between conditions, correlation analysis using the whole sample (condition V and R) caused in Simpson’s paradox to occur. This resulted in the correlations present at the condition-level to not exist or be reversed when considering the whole sample. Therefore, the correlations are presented by condition herein. Figure 14 and Figure 15 below present the correlations between Workload and SA for Condition R and V, respectively.
Figure 16 and Figure 17 visualise the correlations between workload and induced anxiety for Condition R and V.
Finally, Figure 18 and Figure 19 display the correlations between SA and induced anxiety for Condition V and R.
In addition to the three variables captured for all participants, correlation analysis was also applied to those only captured for Condition V. The results are presented in Table 8, where correlations significant at α = 0.05 (p < 0.05) at are shown in bold.
4. Discussion
At a high level, the results suggest that the CAVE afforded a more cognitively supportive context for the task than the real-world. Participants in the CAVE demonstrated significantly higher SA, particularly for comprehension and projection, whereas those in the real-world condition exhibited a clear step-down effect across SA levels. This pattern implies that while access to task-relevant information may have been similar in both environments, the real-world context introduced additional demands that interfered with the development of SA. In contrast, the CAVE appeared to present the information space (environment) in a manner that supports sustained SA development. Workload findings reinforce this interpretation, as participants in Condition R experienced significantly higher overall WW, with elevated MD, TD, PD, and Fr demands, whereas participants in the CAVE condition reported significantly higher Pe. The absence of a significant difference in Ef between conditions suggests that the increased workload observed in the real-world environment was not driven by greater task engagement, but rather by the demands imposed by environmental complexity, physical navigation, and time pressure. Together, these findings indicate that the CAVE reduced extraneous load while preserving participants’ sense of task effectiveness.
Participants in the Condition R reported moderate anxiety both before and after the task, with a large reduction during the task, whereas anxiety levels in the CAVE condition were consistently low. The elevated pre-task anxiety observed in Condition R is likely attributable to anticipatory concerns associated with operating in an uncontrolled, socially exposed, and unpredictable environment. In contrast, the CAVE provided a bounded and predictable setting that may have reduced these concerns. Importantly, although anxiety decreased substantially following task completion in Condition R, post-task anxiety remained significantly higher than in Condition V, suggesting that real-world task still carries a persistent state-anxiety even after task completion. The CAVE afforded significantly higher SP, INV, and REAL than projection-based systems reported in the literature, while usability ratings were (non-significantly) above benchmark values. This suggests that the observed performance benefits were not only a function of high usability, but also of how the immersive environment shaped users’ engagement with information and space. Correlations between variables also present insight into the development of SA, workload, and anxiety, which are all positively correlated. This suggests that the development of SA increases workload as it requires continuous information processing, which in turn induces anxiety (due to heightened arousal or pressure). The apparent preservation of this correlation, regardless of condition, indicates that the CAVE did not suppress task engagement or low-effort behaviour. However, we can derive from the positive correlations between SP and G with workload, that the immersive nature of the CAVE system and its possible benefits to SA did come at a cognitive cost.
Overall, the results provide strong support for H1a, confirming that SA differed significantly between environments, with the CAVE condition yielding superior SA. H1b was also supported, as significant differences were observed across multiple NASA-TLX subscales, including MD, TD, Pe, and Fr demand. In contrast, H1c was not supported, as Ef did not differ significantly between conditions, suggesting that increased immersion in the CAVE did not translate into increased exertion. H1d was supported by the significantly greater PD reported in Condition R, consistent with expectations that embodied navigation impose additional workload. H1e was supported as induced anxiety differed meaningfully between environments, with Condition R exhibiting both higher baseline anxiety and a larger reduction over time. The anticipated positive relationships between workload, anxiety, and SA (H2a, H2c, and H2b) were observed. These findings challenge the simplistic assumptions that increased workload or presence is inherently detrimental, and instead points to the importance of distinguishing between sources of cognitive load.
Two hypothesised relationships were not supported in Condition V (H2d and H2e). The negative relationship between SA and presence suggests that higher immersion may have competed with cognitive processes related to developing SA, with participants achieving higher SA by taking a more analytical, less engaged interaction style. Secondly, the positive relationship been usability and workload may indicate that higher usability enabled greater task engagement. Workload and presence were positively correlated across several subscales within the CAVE condition, supporting H2f. From a facilities management and remote decision-making perspective, these findings imply that CAVEs may be particularly well suited to tasks requiring sensemaking, while mitigating the physical burdens associated with real-world task execution.
These findings both converge with and extend prior CAVE–reality comparisons. Consistent with earlier studies, the CAVE elicited high levels of presence without uniformly improving all aspects of task experience or performance. However, unlike much of the existing literature, which often reports degraded comprehension or increased cognitive load in CAVEs relative to the real world, this study found superior SA and lower workload in Condition V. A key distinction is methodological: by holding task, interface, and information access constant, the present study isolated the effect of environment itself, avoiding confounding affects which characterised prior work. The present results suggest that for built environment tasks, the real-world environment may introduce unnecessary cognitive and physical demands that impair higher-level SA. Similarly, while previous studies have frequently attributed increased workload in CAVEs to interaction techniques or sensorimotor discrepancies, the current findings indicate that real-world environments may impose comparable or greater demands when task predictability and information structure are reduced.
5. Conclusions
This study set out to isolate and examine the effect of environment, CAVE versus real-world, on human performance and experience during an equivalent observational task, addressing long-standing gaps in the CAVE literature. The study achieved this aim, by operationalising the PERCEIVE framework, analysing the differences between conditions and correlations between variables, and providing evidence to support the relationships presented in the PSyFIVE model. It is suggested by the authors, that the results of this paper can be used to develop design guidelines for CAVE systems intended to support remote decision-making in the built environment, alongside a review of end-user requirements of such a system.
Author Contributions
Conceptualisation, writing-review and editing, A.C.P and R.J.D.; methodology, investigation, resources and data curation, A.C.P and E.M.V; formal analysis, writing-original draft preparation and visualization, A.C.P; supervision, R.J.D and N.J.D; project administration and funding acquisition, R.J.D. All authors have read and agreed to the published version of the manuscript.
Funding
This research was co-funded by the University of Birmingham School of Engineering (50%) and Fulcro Engineering Services Limited (50%). The APC was funded (100%) by the University of Birmingham.
Institutional Review Board Statement
The study was conducted in accordance with the Declaration of Helsinki and approved by the Ethics Committee of the University of Birmingham (review reference ERN_2715-Sep2024, modified 30/09/2024 12:31).
Informed Consent Statement
Informed consent was obtained from all subjects involved in the study.
Data Availability Statement
All anonymised data was uploaded to the University of Birmingham Institutional Research Archive (UBIRA) in the eData Respository for long-term Open Access.
Conflicts of Interest
The authors declare no conflicts of interest.
Abbreviations
The following abbreviations are used in this manuscript:
| CAVE | Cave Automatic Virtual Environment |
| BIM | Building Information Modelling |
| IoT | Internet of Things |
| XR | Extended Reality |
| HMD | Head-Mounted Device |
| SA | Situation Awareness |
| PERCEIVE | Performance and Cognitive Evaluation In Virtual Environments |
| PSyFVE | Psychological and System Factor Interdependencies for Virtual Environments |
| SAGAT | Situation Awareness Global Assessment Technique |
| NASA-TLX | NASA Task Load Index |
| STAI | State-Trait Anxiety Inventory |
| IPQ | Igroup Presence Questionnaire |
| SUS | System Usability Scale |
| MD | Mental Demand |
| PD | Physical Demand |
| TD | Temporal Demand |
| Pe | Performance |
| Ef | Effort |
| Fr | Frustration |
| ML | Magnitude of Load |
| WL | Weight Load |
| OW | Overall Load |
| WW | Weighted Workload |
| SP | Spatial Presence |
| INV | Involvement |
| REAL | Experienced Realism |
| G | General Presence |
| PIS | Participant Information Sheet |
| SD | Standard Deviation |
| ANOVA | Analysis of Variance |
References
- Colombo, A.W.; Karnouskos, S.; Kaynak, O.; Shi, Y.; Yin, S. Industrial Cyberphysical Systems: A Backbone of the Fourth Industrial Revolution. IEEE Industrial Electronics Magazine 2017, 11, 6–16. [Google Scholar] [CrossRef]
- ISO. ISO 19650 - Managing Information With Building Information Modelling (BIM). 2019.
- Fathi, S.; Sabeti, S.; Shoghli, O.; Heydarian, A.; Balali, V. Adoption of virtual and augmented reality in the architecture, engineering, construction, and facilities management (AEC-FM): mixed method analysis of trends, gaps, and solutions. Frontiers in Built Environment 2025, 11–2025. [Google Scholar] [CrossRef]
- Pogmore, A.C.; Davies, R.J.; Cooke, N.J. Virtual Versus Reality: A Systematic Review of Real-World Built Environment Tasks Performed in CAVEs and a Framework for Performance and Experience Evaluation. Virtual Worlds 2024, 3, 536–571. [Google Scholar] [CrossRef]
- Cruz-Neira, C.; Sandin, D.J.; DeFanti, T.A.; Kenyon, R.V.; Hart, J.C. The CAVE: audio visual experience automatic virtual environment. Communications of the ACM 1992/06// 1992, 64+. [Google Scholar] [CrossRef]
- Choueib, A.; Berkman, M.İ. Comparing Performance and Experience in VR vs. Real-World Through a Puzzle Game; Cham, 2024; pp. 72–85. [Google Scholar]
- da Silva Soares, R., Jr.; Ramirez-Chavez, K.L.; Tufanoglu, A.; Barreto, C.; Sato, J.R.; Ayaz, H. Cognitive Effort during Visuospatial Problem Solving in Physical Real World, on Computer Screen, and in Virtual Reality. Sensors (Basel) 2024, 24. [Google Scholar] [CrossRef]
- Harty, C.; Tryggestad, K. The Roles of Representations in Building Design: Materiality and Visualisation. In Proceedings of the Proceedings of the 28th Annual ARCOM Conference, 3-5 September 2012, 2012; pp. 45–55. [Google Scholar]
- Wahlström, M.; Aittala, M.; Kotilainen, H.; Yli-Karhu, T.; Porkka, J.; Nykänen, E. CAVE for collaborative patient room design: analysis with end-user opinion contrasting method. Virtual Reality 2010, 14, 197–211. [Google Scholar] [CrossRef]
- Arias, S.; Mossberg, A.; Nilsson, D.; Wahlqvist, J. A Study on Evacuation Behavior in Physical and Virtual Reality Experiments. Fire Technology 2022, 58, 817–849. [Google Scholar] [CrossRef]
- Brade, J.; Lorenz, M.; Busch, M.; Hammer, N.; Tscheligi, M.; Klimant, P. Being there again – Presence in real and virtual environments and its relation to usability and user experience using a mobile navigation task. International Journal of Human-Computer Studies 2017, 101, 76–87. [Google Scholar] [CrossRef]
- Chen, K.B.; Ponto, K.; Tredinnick, R.D.; Radwin, R.G. Virtual Exertions:Evoking the Sense of Exerting Forces in Virtual Reality Using Gestures and Muscle Activity. Human Factors 2015, 57, 658–673. [Google Scholar] [CrossRef]
- Schneider, S.; Maruhn, P.; Dang, N.-T.; Pala, P.; Cavallo, V.; Bengler, K. Pedestrian Crossing Decisions in Virtual Environments: Behavioral Validity in CAVEs and Head-Mounted Displays. Human Factors 2022, 64, 1210–1226. [Google Scholar] [CrossRef] [PubMed]
- Heldal, I.; Spante, M.; Connell, M. Are two heads better than one? object-focused work in physical and in virtual environments. In Proceedings of the Proceedings of the ACM symposium on Virtual reality software and technology, Limassol, Cyprus, 2006; pp. 287–296. [Google Scholar]
- Kotek, L.; Tuma, Z.; Subrt, K.; Kroupa, J.; Blecha, P.; Rozehnalova, J.; Blecha, R.; Heinrich, P. TESTING HUMAN ERRORS IN VIRTUAL REALITY TRAINING. MM Science Journal 2022, 2022. [Google Scholar] [CrossRef]
- Dell’Unto, N.; Leander, A.M.; Dellepiane, M.; Callieri, M.; Ferdani, D.; Lindgren, S. Digital reconstruction and visualization in archaeology: Case-study drawn from the work of the Swedish Pompeii Project. Proceedings of the 2013 Digital Heritage International Congress (DigitalHeritage) 2013, 2013, 621–628. [Google Scholar]
- Vote, E.; Feliz, D.A.; Laidlaw, D.H.; Joukowsky, M.S. Discovering Petra: archaeological analysis in VR. IEEE Computer Graphics and Applications 2002, 22, 38–50. [Google Scholar] [CrossRef]
- Shrestha, S.; Chakraborty, J.; Mohamed, M.A. A comparative pilot study of historical artifacts in a CAVE automatic virtual reality environment versus paper-based artifacts. In Proceedings of the Proceedings of the 18th International Conference on Human-Computer Interaction with Mobile Devices and Services Adjunct, Florence, Italy, 2016; pp. 968–977. [Google Scholar]
- Shiratuddin, M.F.; Thabet, W.; Bowman, D. Evaluating the effectiveness of virtual environment displays for reviewing construction 3D models. 2004. [Google Scholar]
- Whisker, V.; Baratta, A.; Yerrapathruni, S.; Messner, J.; Shaw, T.; Warren, M.; Rotthoff, E. Using immersive virtual environments to develop and visualize construction schedules for advanced nuclear power plants. Proceedings of ICAPP 2003. [Google Scholar]
- Ye, N.; Banerjee, P.; Banerjee, A.; Dech, F. A comparative study of assembly planning in traditional and virtual environments. IEEE Transactions on Systems, Man, and Cybernetics, Part C (Applications and Reviews) 1999, 29, 546–555. [Google Scholar] [CrossRef]
- Witmer, B.G.; Singer, M.J. Measuring Presence in Virtual Environments: A Presence Questionnaire. Presence: Teleoperators and Virtual Environments 1998, 7, 225–240. [Google Scholar] [CrossRef]
- Moreno, R.; Mayer, R. Learning Science in Virtual Reality Multimedia Environments: Role of Methods and Media. Journal of Educational Psychology 2002, 94, 598–610. [Google Scholar] [CrossRef]
- Stanney, K.M.; Kingdon, K.S.; Graeber, D.; Kennedy, R.S. Human Performance in Immersive Virtual Environments: Effects of Exposure Duration, User Control, and Scene Complexity. Human Performance 2002, 15, 339–366. [Google Scholar] [CrossRef]
- Dias, R.D.; Ngo-Howard, M.C.; Boskovski, M.T.; Zenati, M.A.; Yule, S.J. Systematic review of measurement tools to assess surgeons’ intraoperative cognitive workload. British Journal of Surgery 2018, 105, 491–501. [Google Scholar] [CrossRef] [PubMed]
- Evans, D.C.; Fendley, M. A multi-measure approach for connecting cognitive workload and automation. International Journal of Human-Computer Studies 2017, 97, 182–189. [Google Scholar] [CrossRef]
- Haapalainen Ferreira, E.; Kim, S.; Forlizzi, J.; Dey, A. Psycho-Physiological Measures for Assessing Cognitive Load. In Proceedings of the 12th ACM International Conference on Ubiquitous Computing, Copenhagen, Denmark, 26-29 September, 2010; pp. 301–310. [Google Scholar]
- Young, M.S.; Brookhuis, K.A.; Wickens, C.D.; Hancock, P.A. State of science: mental workload in ergonomics. Ergonomics 2015, 58, 1–17. [Google Scholar] [CrossRef] [PubMed]
- Pijpers, J.R.; Oudejans, R.R.D.; Bakker, F.C. Anxiety-Induced Changes in Movement Behaviour during the Execution of a Complex whole-body task. The Quarterly Journal of Experimental Psychology Section A 2005, 58, 421–445. [Google Scholar] [CrossRef]
- Pijpers, J.R.; Oudejans, R.R.D.; Bakker, F.C.; Beek, P.J. The Role of Anxiety in Perceiving and Realizing Affordances. Ecological Psychology 2006, 18, 131–161. [Google Scholar] [CrossRef]
- Pijpers, J.R.; Oudejans, R.R.D.; Holsheimer, F.; Bakker, F.C. Anxiety–performance relationships in climbing: a process-oriented approach. Psychology of Sport and Exercise 2003, 4, 283–304. [Google Scholar] [CrossRef]
- Schulz, C.M.; Endsley, M.R.; Kochs, E.F.; Gelb, A.W.; Wagner, K.J. Situation awareness in anesthesia: concept and research. Anesthesiology 2013, 118, 729–742. [Google Scholar] [CrossRef]
- Starke, S.D.; Baber, C.; Cooke, N.J.; Howes, A. Workflows and individual differences during visually guided routine tasks in a road traffic management control room. Applied Ergonomics 2017, 61, 79–89. [Google Scholar] [CrossRef] [PubMed]
- Endsley, M.R. Toward a Theory of Situation Awareness in Dynamic Systems. Human Factors 1995, 37, 32–64. [Google Scholar] [CrossRef]
- Bareišytė, L.; Slatman, S.; Austin, J.; Rosema, M.; van Sintemaartensdijk, I.; Watson, S.; Bode, C. Questionnaires for Evaluating Virtual Reality: a Systematic Scoping Review. Computers in Human Behavior Reports 2024, 16, 100505. [Google Scholar] [CrossRef]
- Peres, F.; Nunes, F.; Teixeira, J.; Mauricio, C.; Conceição, K.; Yoshida, L. Methods for Evaluating Immersive 3D Virtual Environments: a Systematic Literature Review; 2024; pp. 140–151. [Google Scholar]
- Salinas, D.; Muñoz-La Rivera, F.; Mora-Serrano, J. Critical Analysis of the Evaluation Methods of Extended Reality (XR) Experiences for Construction Safety. International Journal of Environmental Research and Public Health 2022, 19, 15272. [Google Scholar] [CrossRef]
- Skarbez, R.; Brooks, F.P.; Whitton, M.C. Immersion and Coherence: Research Agenda and Early Results. IEEE Trans Vis Comput Graph 2021, 27, 3839–3850. [Google Scholar] [CrossRef]
- Wang, D.; Peng, Y.; Haddouk, L.; Vayatis, N.; Vidal, P.-P. Assessing virtual reality presence through physiological measures: a comprehensive review. Frontiers in Virtual Reality 2025, 6–2025. [Google Scholar] [CrossRef]
- Wingler, D.; Joseph, A.; Bayramzadeh, S.; Robb, A. Using Virtual Reality to Compare Design Alternatives Using Subjective and Objective Evaluation Methods. Herd 2020, 13, 129–144. [Google Scholar] [CrossRef] [PubMed]
- Insta360. Insta360 ONE X2 - Waterproof 360 Action Camera with Stabilization. Available online: https://www.insta360.com/product/insta360-onex2 (accessed on 10 October).
- Fulcro. Fulcro - FULmax | VR | Construction Virtual Reality. Available online: https://fulcro.co.uk/fulmax (accessed on 10 October).
- Pogmore, A.; Davies, R.; Cooke, N. Development and Application of a VR BIM Digital Twin using Unity, IoT Sensor Data and Cave Automatic Virtual Environment. In Proceedings of the 31st International Workshop on Intelligent Computing in Engineering (EG-ICE) 2024, Vigo, Spain, 2024. [Google Scholar]
- Microsoft. Buy Xbox Wireless Controller + USB-C Cable - Microsoft Store United Kingdom. Available online: https://www.microsoft.com/en-gb/d/xbox-wireless-controller-usb-c-cable/8t8kcnb1xs3d (accessed on 10 October).
- Endsley, M.R. Situation awareness global assessment technique (SAGAT). Proceedings of the IEEE 1988 National Aerospace and Electronics Conference 1988, vol.783, 789–795. [Google Scholar]
- Hart, S.G.; Staveland, L.E. Development of NASA-TLX (Task Load Index): Results of Empirical and Theoretical Research. In Advances in Psychology; Hancock, P.A., Meshkati, N., Eds.; North-Holland, 1988; Volume 52, pp. 139–183. [Google Scholar]
- Spielberger, C.D.; Gorsuch, R.L.; Lushene, R.E. Manual for the State-Trait Anxiety Inventory; 1970. [Google Scholar]
- Schubert, T.; Friedmann, F.; Regenbrecht, H. The Experience of Presence: Factor Analytic Insights. Presence 2001, 10, 266–281. [Google Scholar] [CrossRef]
- Brooke, J. SUS -- a quick and dirty usability scale; 1996; pp. 189–194. [Google Scholar]
- RØDE. Wireless ME | Compact Wireless Microphone System | RØDE (GB). Available online: https://rode.com/en-gb/products/wireless-me (accessed on 10 October).
- Brooke, J. SUS: A quick and dirty usability scale. Usability Eval. Ind. 1995, 189. [Google Scholar]
- Sauro, J. A practical guide to the system usability scale: Background, benchmarks & best practices; Measuring Usability LLC, 2011. [Google Scholar]
- Adams, W.C. Conducting Semi-Structured Interviews. Handbook of Practical Program Evaluation 2015, 492–505. [Google Scholar]
- Bearman, M. Focus on Methodology: Eliciting rich data: A practical approach to writing semi-structured interview schedules. Focus on Health Professional Education: A Multi-Professional Journal 2019, 20, 1. [Google Scholar] [CrossRef]
- Galletta, A.; Cross, W.E. Mastering the Semi-Structured Interview and Beyond From Research Design to Analysis and Publication; NYU Press, 2013; Volume 55. [Google Scholar]
- Spielberger, C.D. Chapter 1 - CURRENT TRENDS IN THEORY AND RESEARCH ON ANXIETY. In Anxiety; Spielberger, C.D., Ed.; Academic Press, 1972; pp. 3–19. [Google Scholar]
- Zaccaro, A.; Piarulli, A.; Laurino, M.; Garbella, E.; Menicucci, D.; Neri, B.; Gemignani, A. How Breath-Control Can Change Your Life: A Systematic Review on Psycho-Physiological Correlates of Slow Breathing. Frontiers in Human Neuroscience 2018, 12–2018. [Google Scholar] [CrossRef]
- Brysbaert, M. Basic statistics for psychologists; Palgrave Macmillan: Houndsmill, UK, 2011. [Google Scholar]
- Grier, R.A. How High is High? A Meta-Analysis of NASA-TLX Global Workload Scores. Proceedings of the Human Factors and Ergonomics Society Annual Meeting 2016, 59, 1727–1731. [Google Scholar] [CrossRef]
- Games, P.A.; Howell, J.F. Pairwise Multiple Comparison Procedures with Unequal N’s and/or Variances: A Monte Carlo Study. Journal of Educational Statistics 1976, 1, 113–125. [Google Scholar] [CrossRef]
- Sauro, J.; Lewis, J.R. Quantifying the User Experience. In Chapter 8 - Standardized Usability Questionnaires; 2012; pp. 185–240. [Google Scholar] [CrossRef]
Figure 1.
Map of the experimental area.
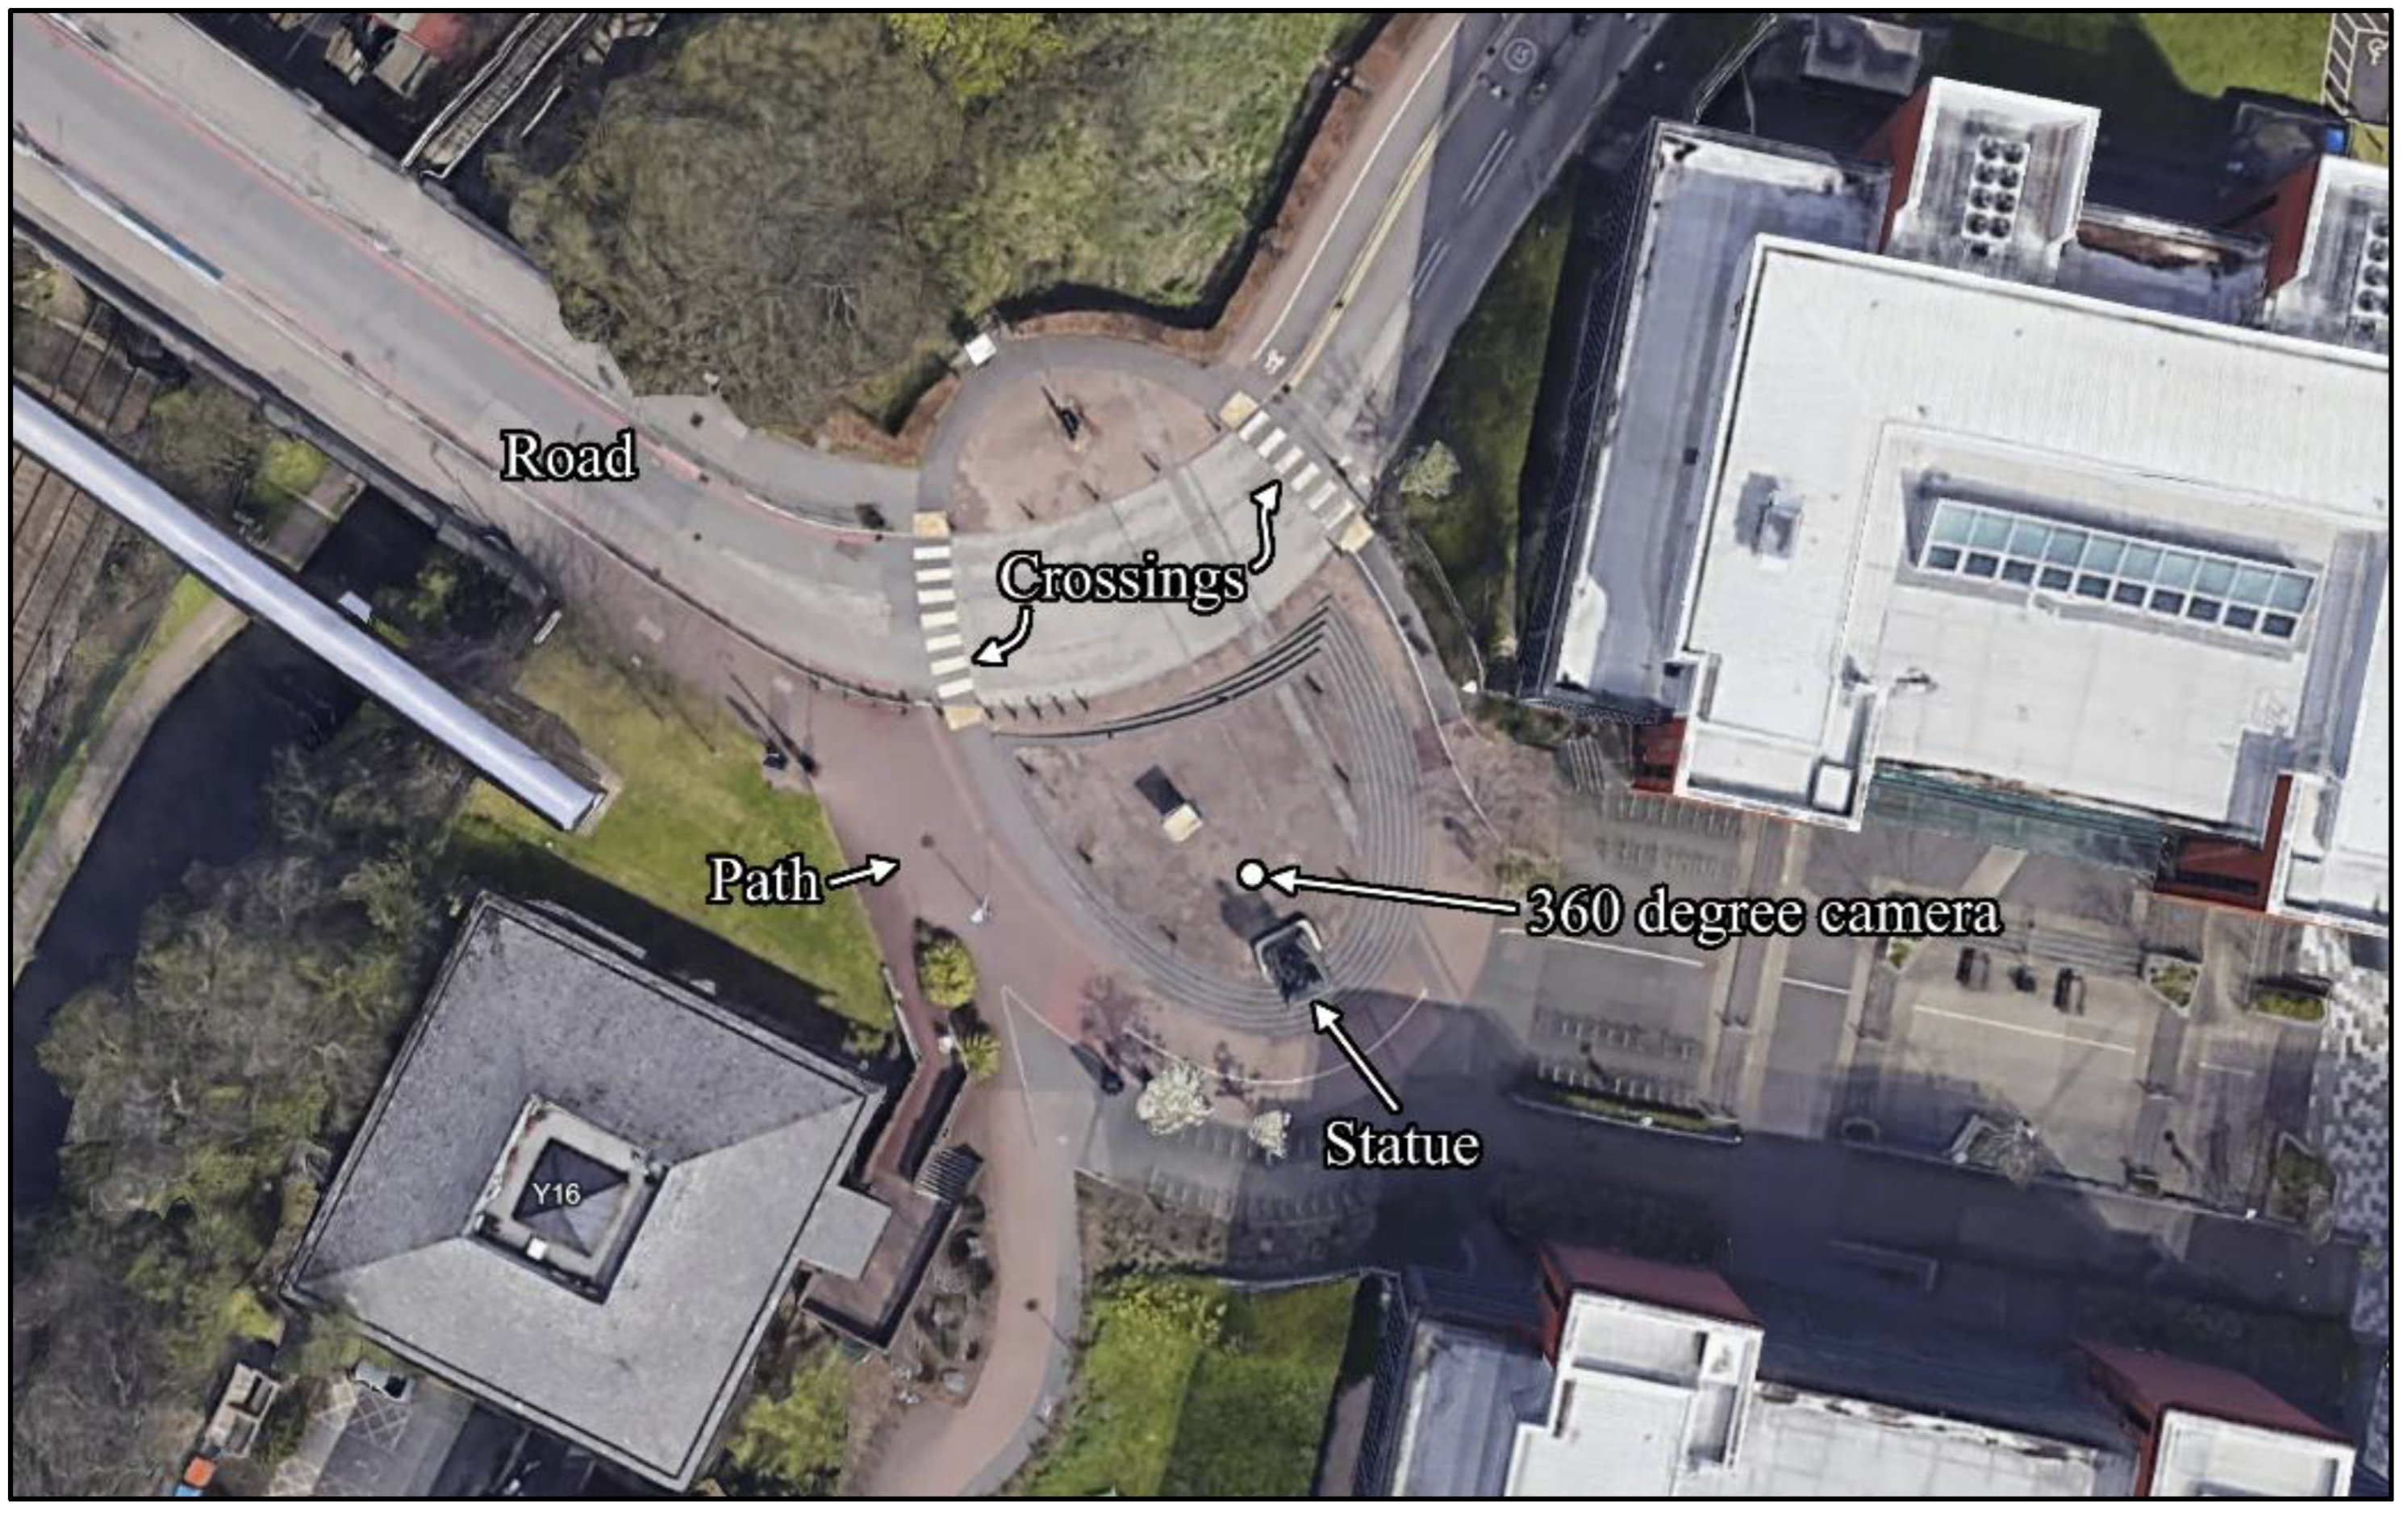
Figure 2.
Arrangement of CAVE system (FULmax VR-Hub Wide) from (a) top view, (b) side view, (c) front view and (d) isometric view.
Figure 2.
Arrangement of CAVE system (FULmax VR-Hub Wide) from (a) top view, (b) side view, (c) front view and (d) isometric view.
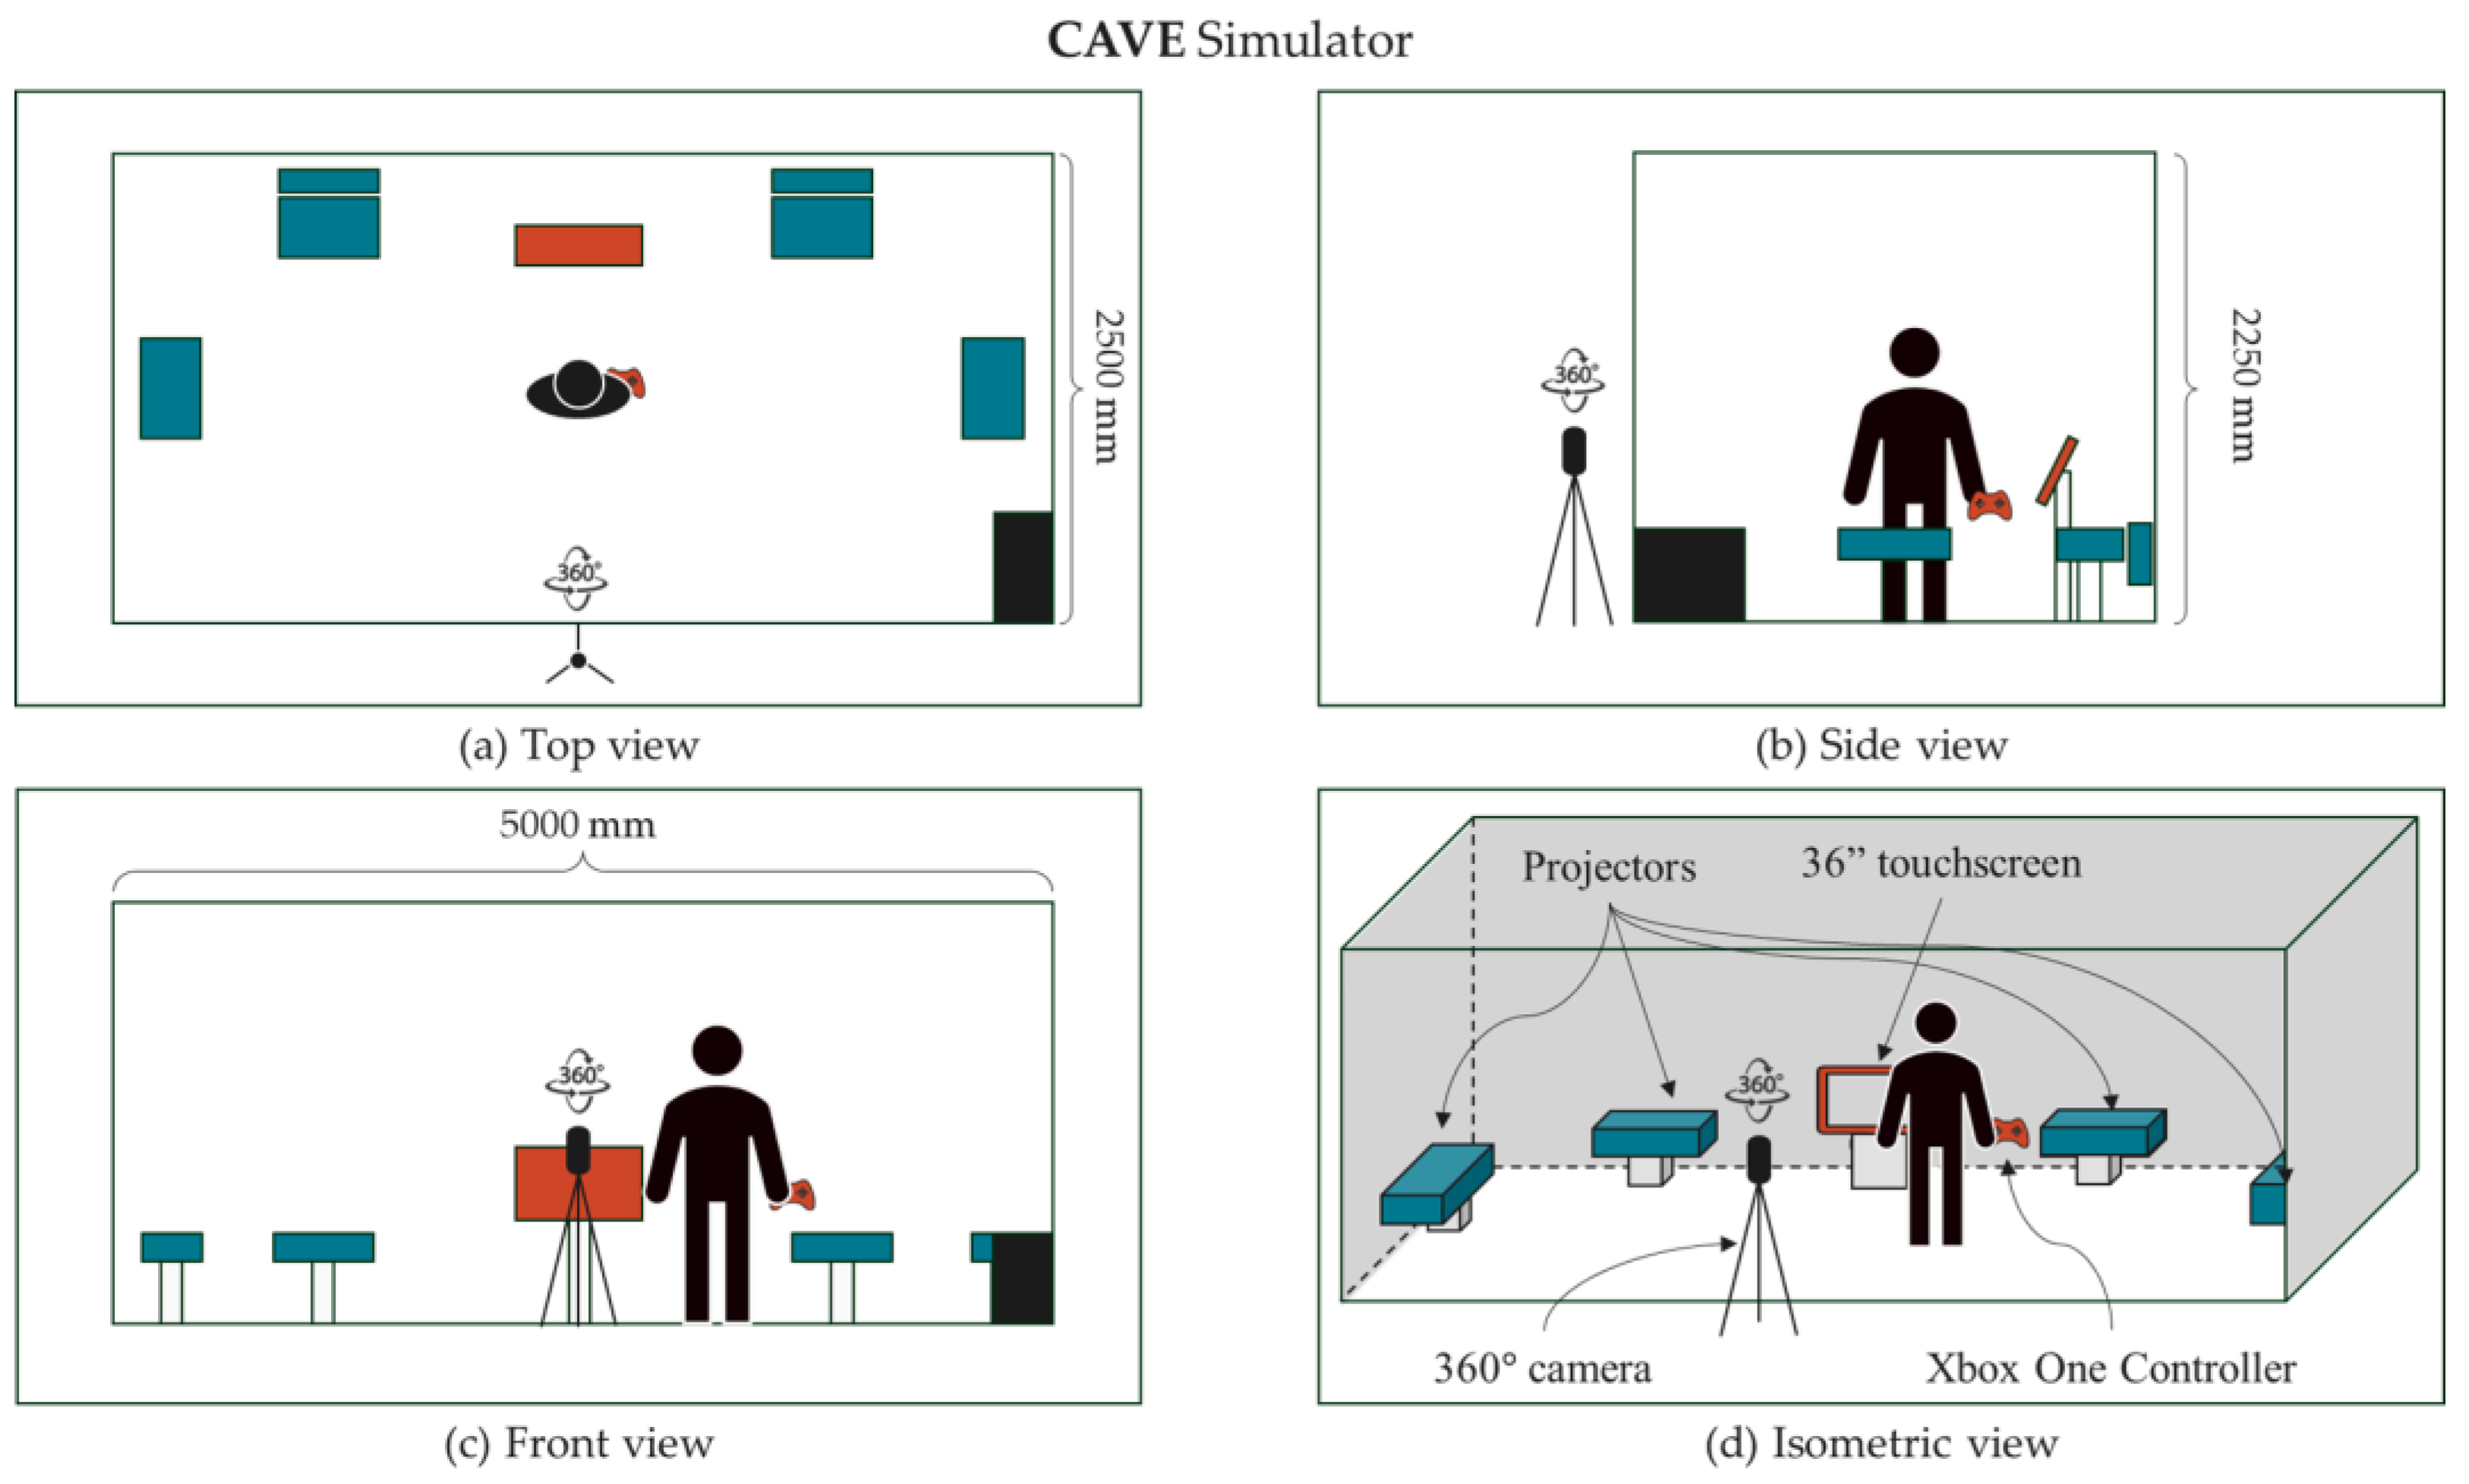
Figure 3.
Map of elements in the task environment.
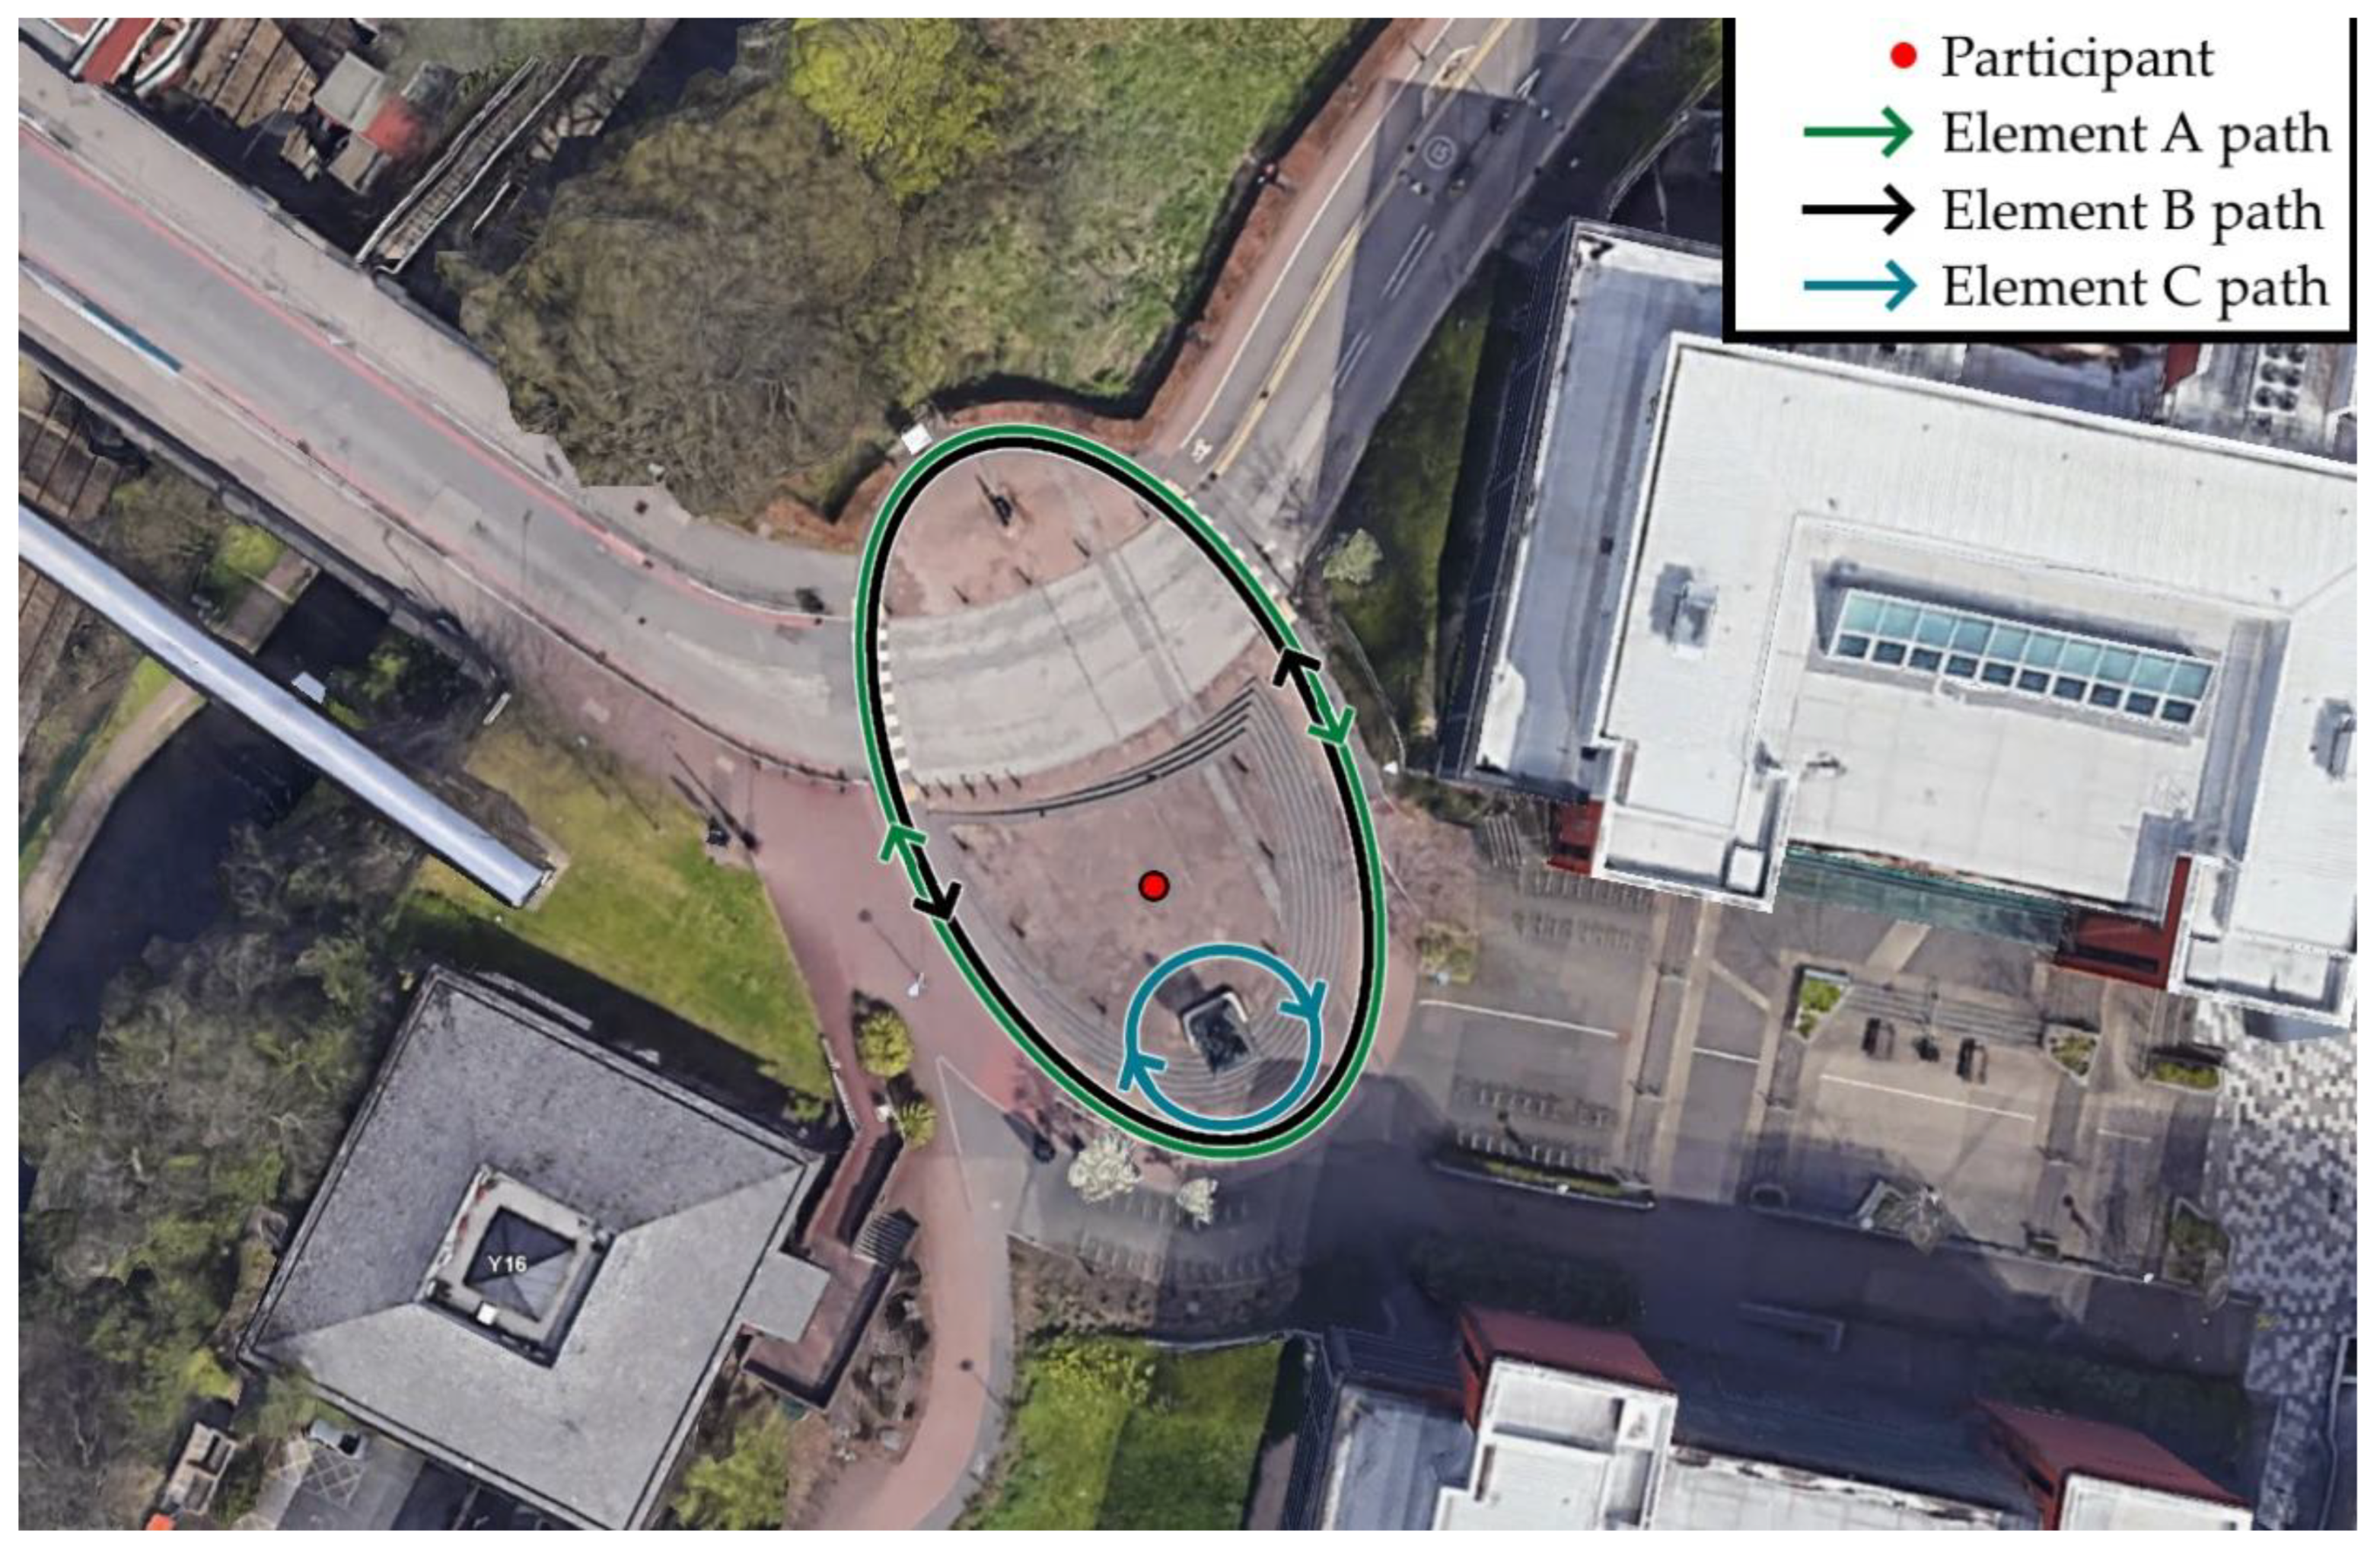
Figure 4.
The experimental procedure followed.
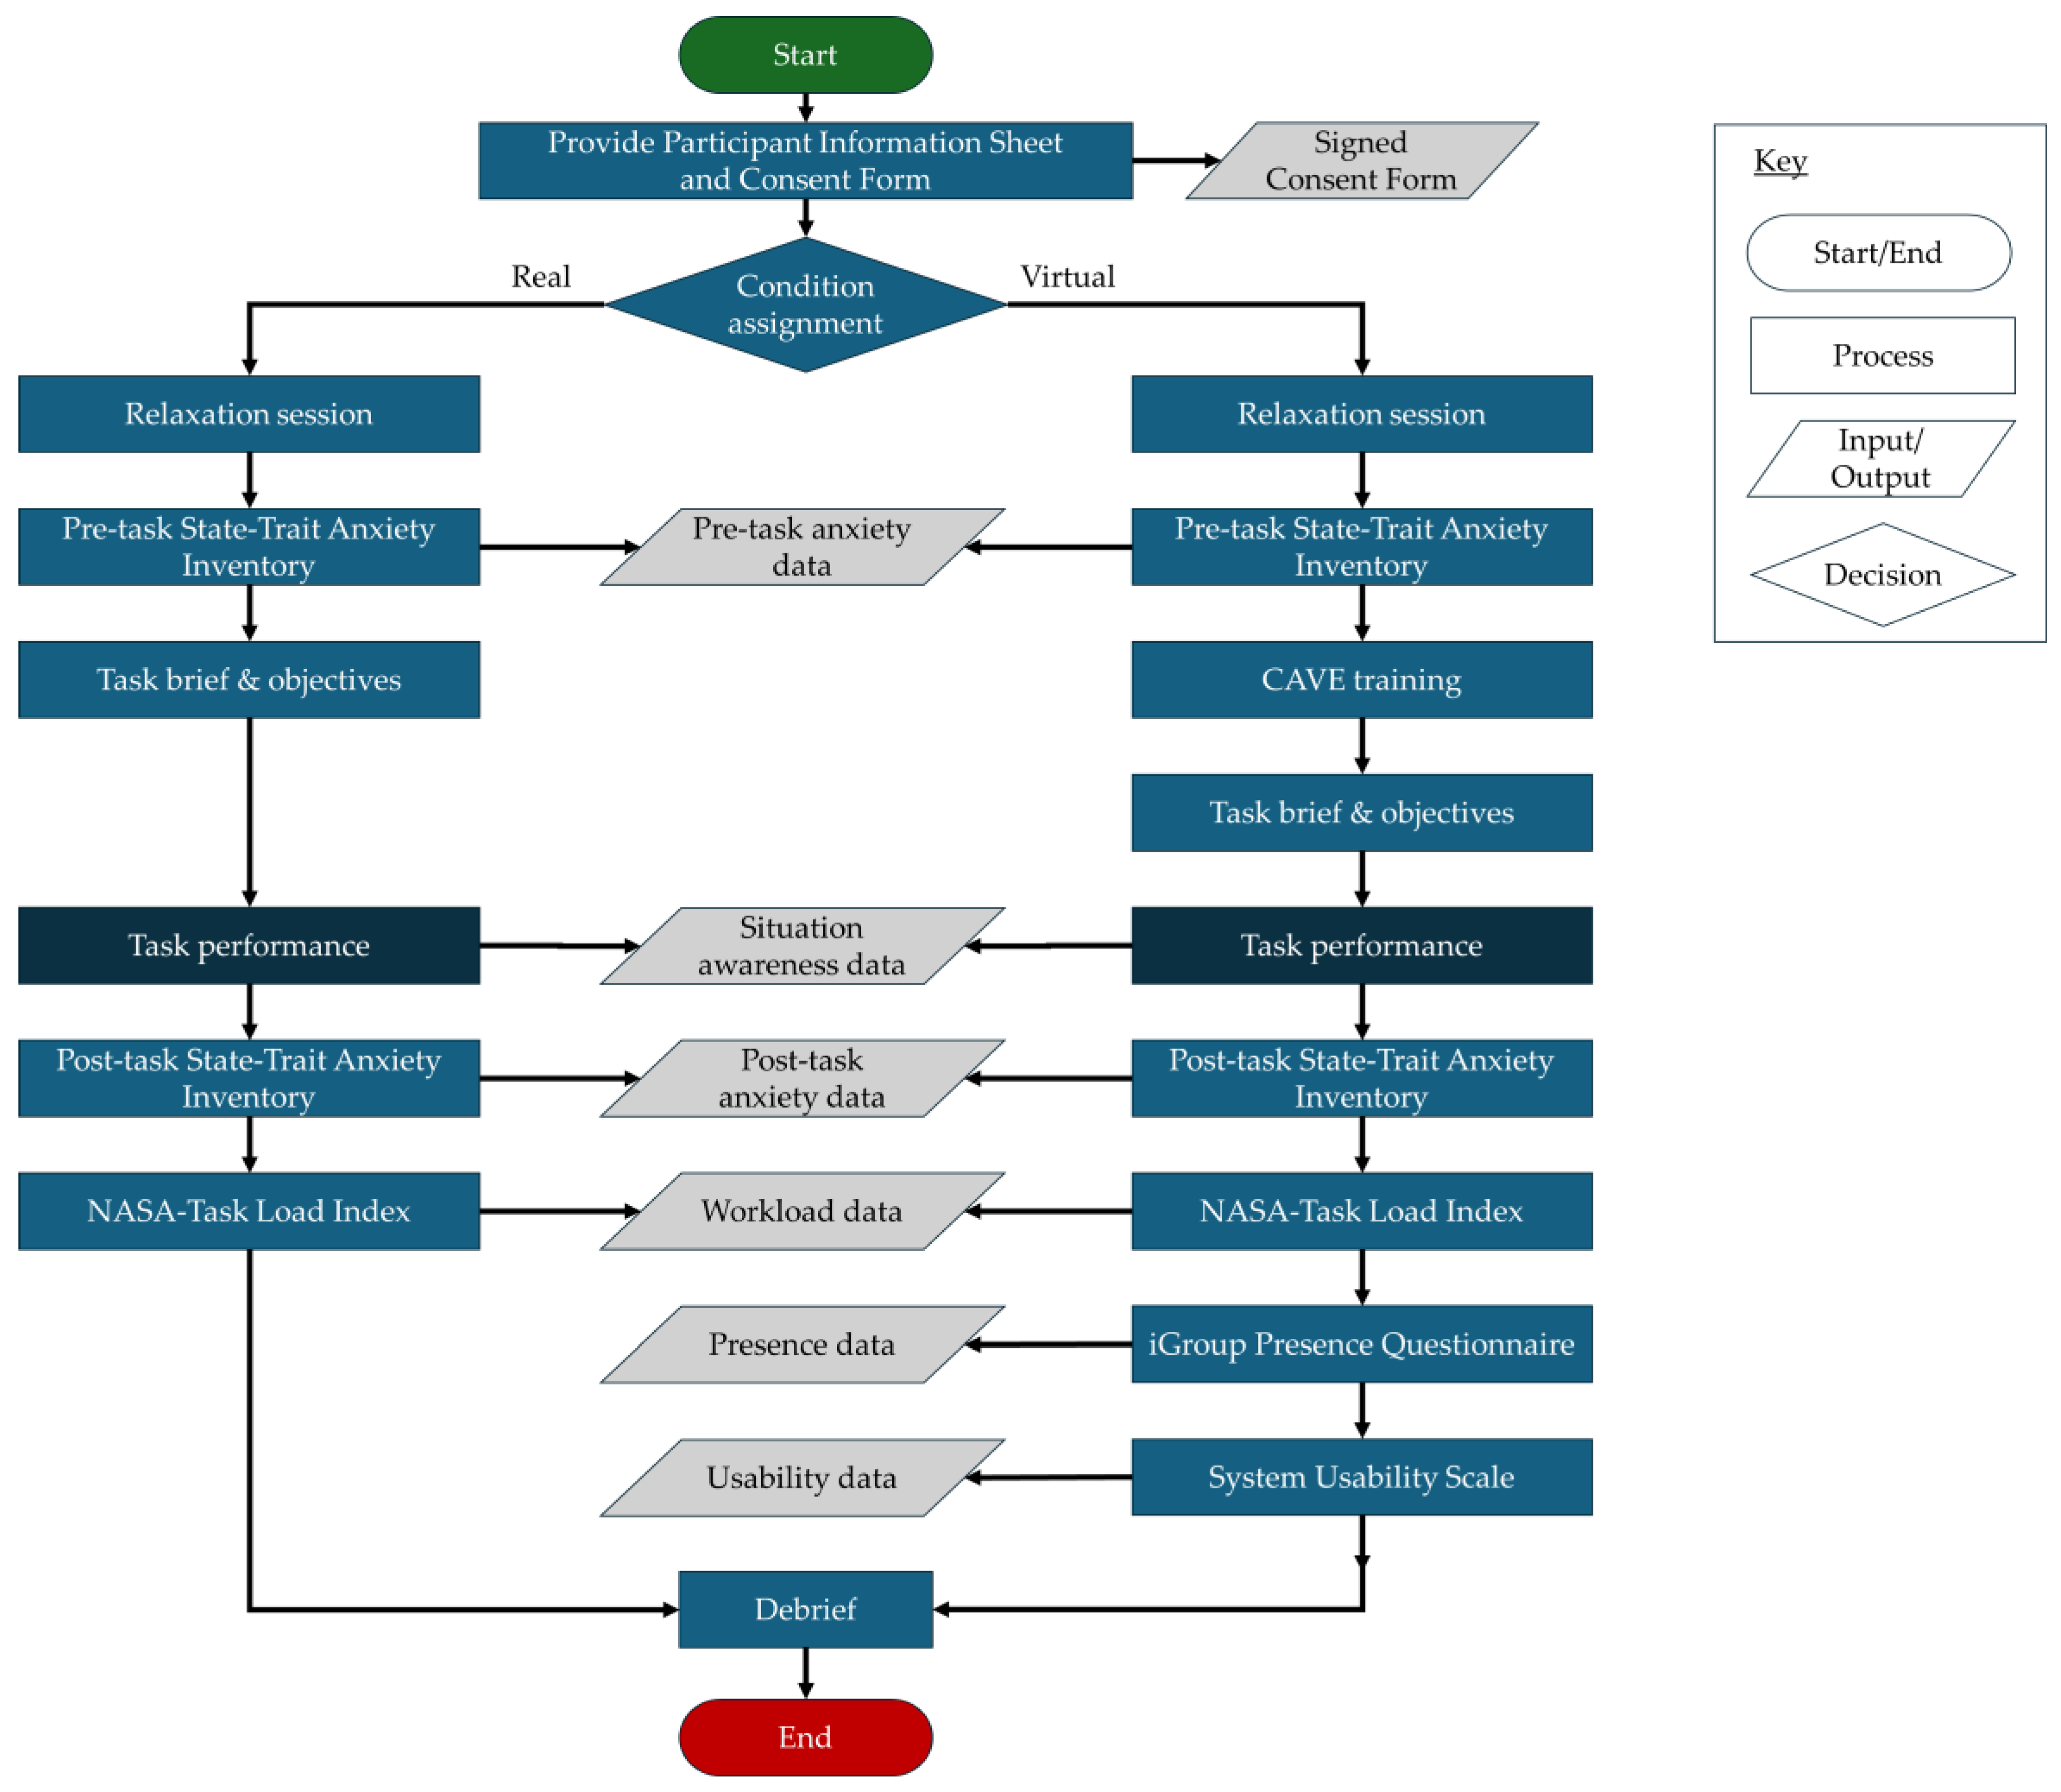
Figure 5.
Mean SAGAT score by condition.
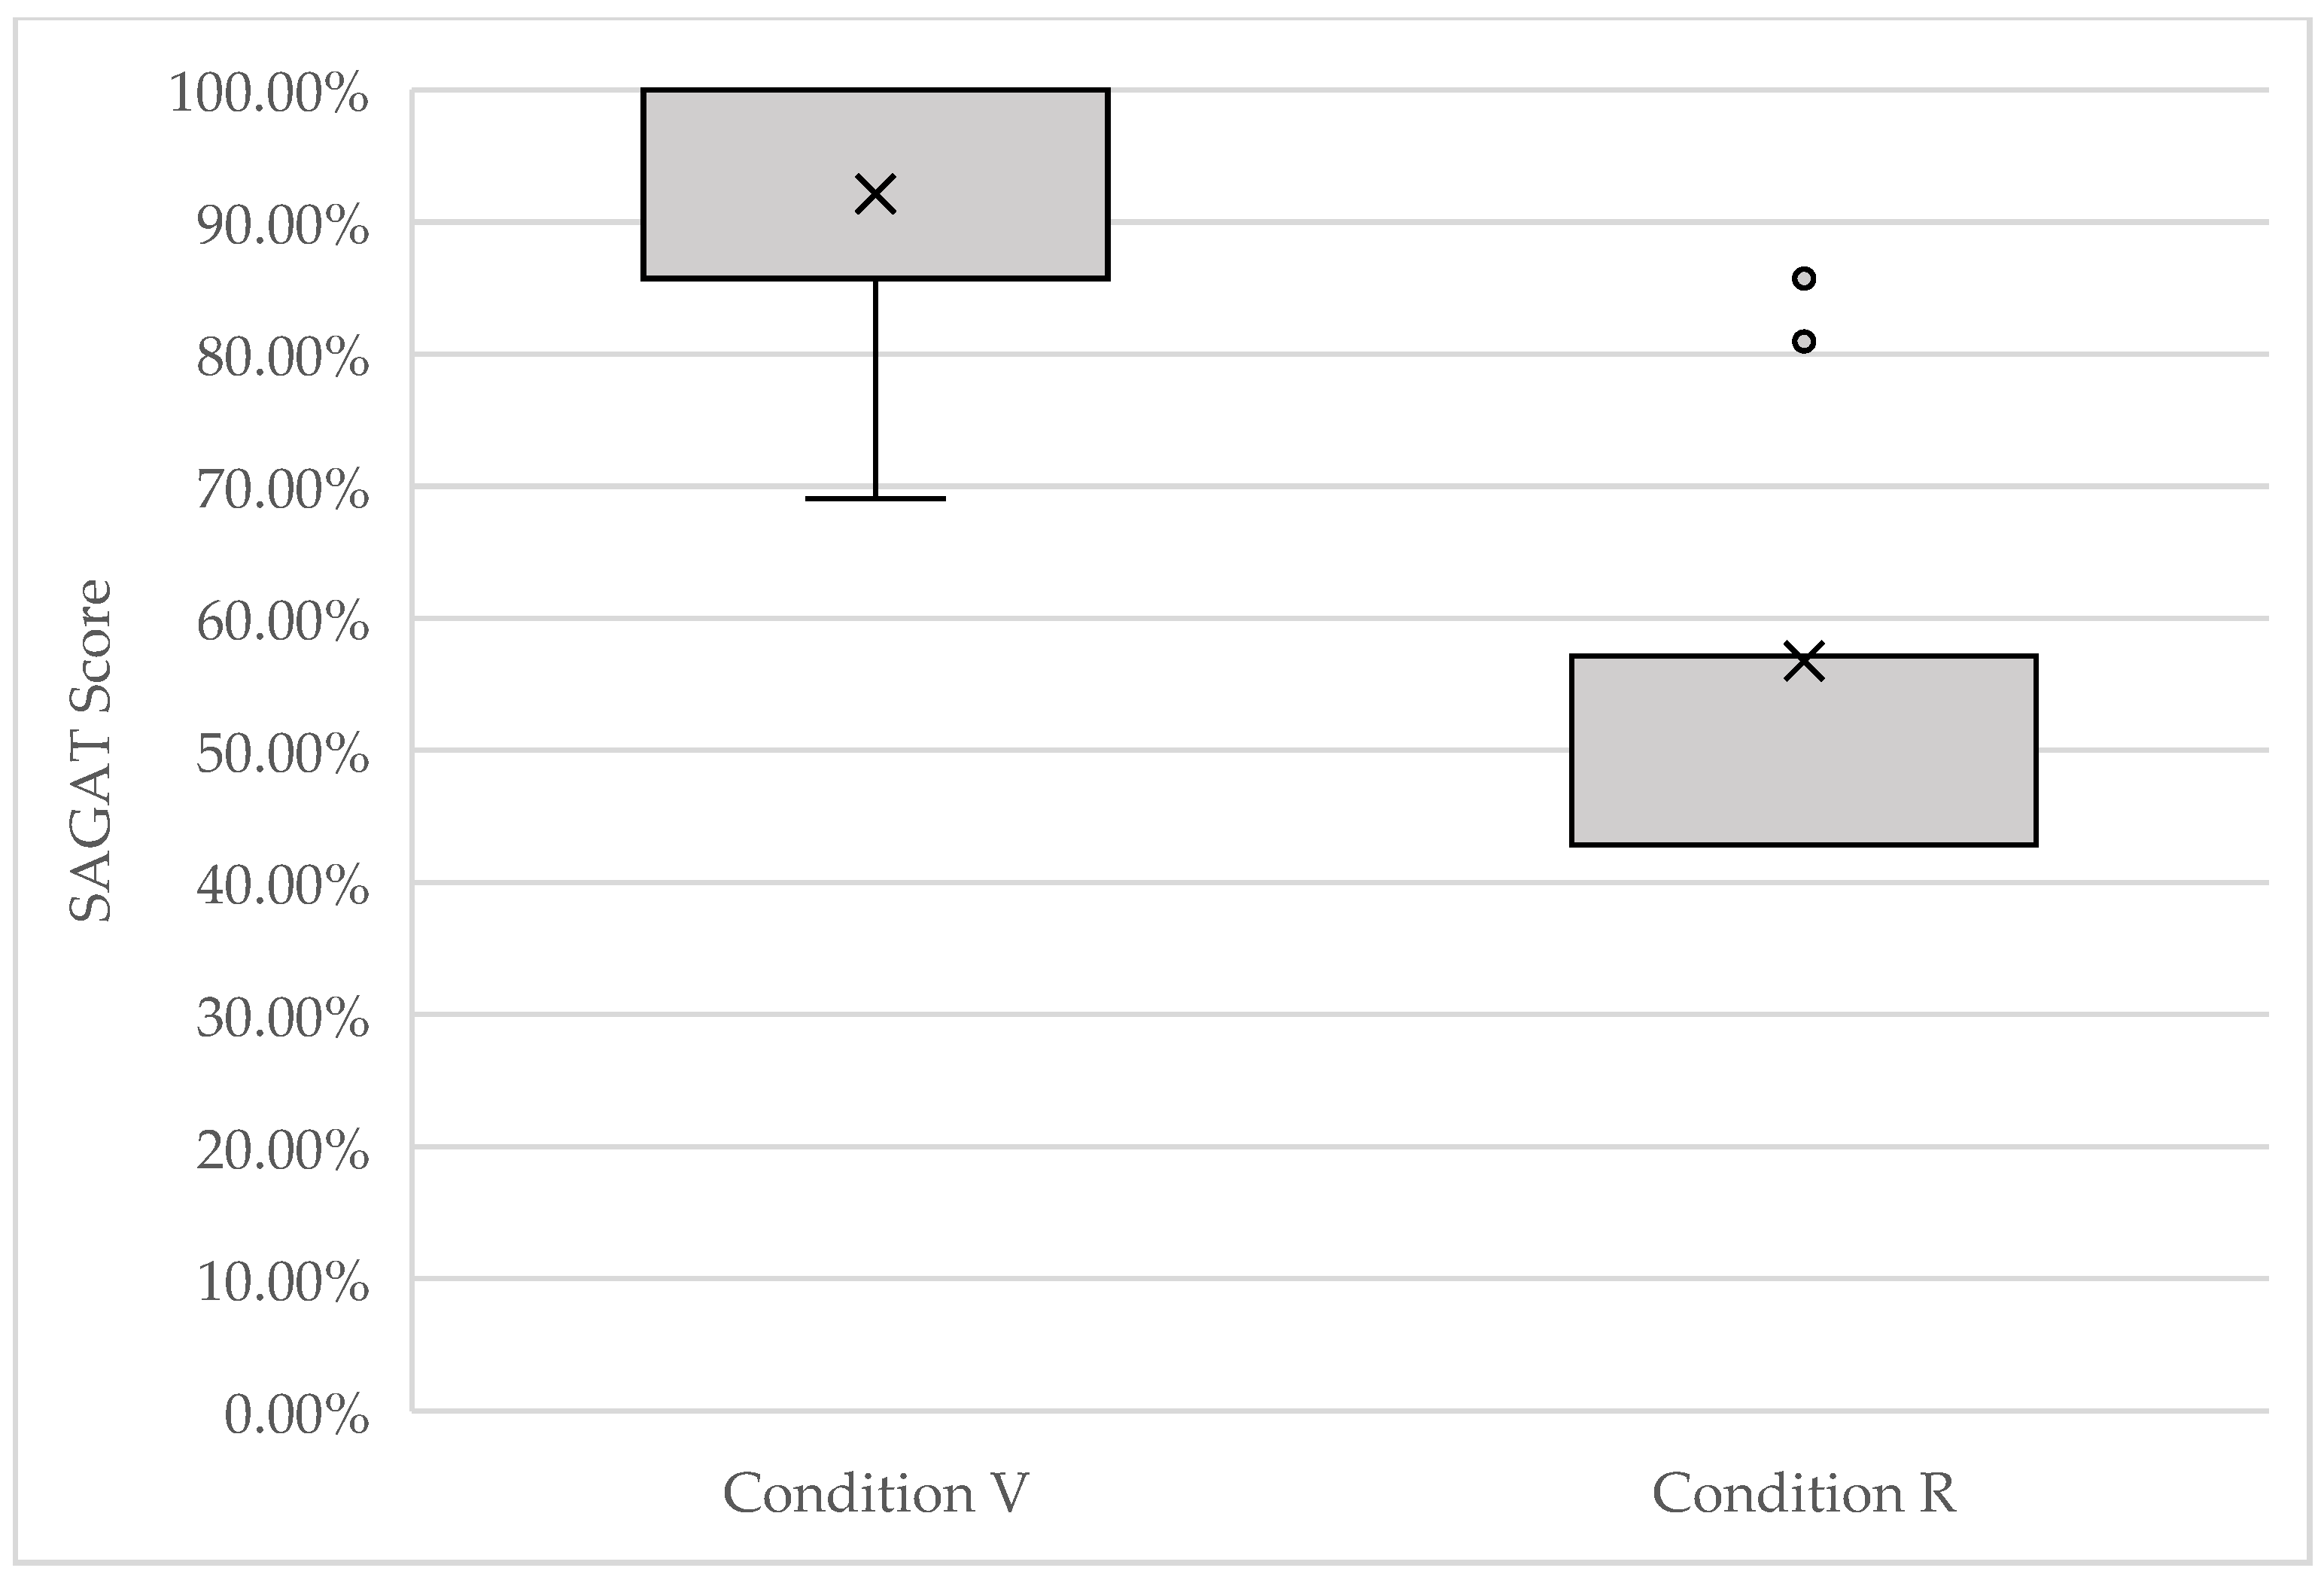
Figure 6.
Mean SAGAT score by SA level.
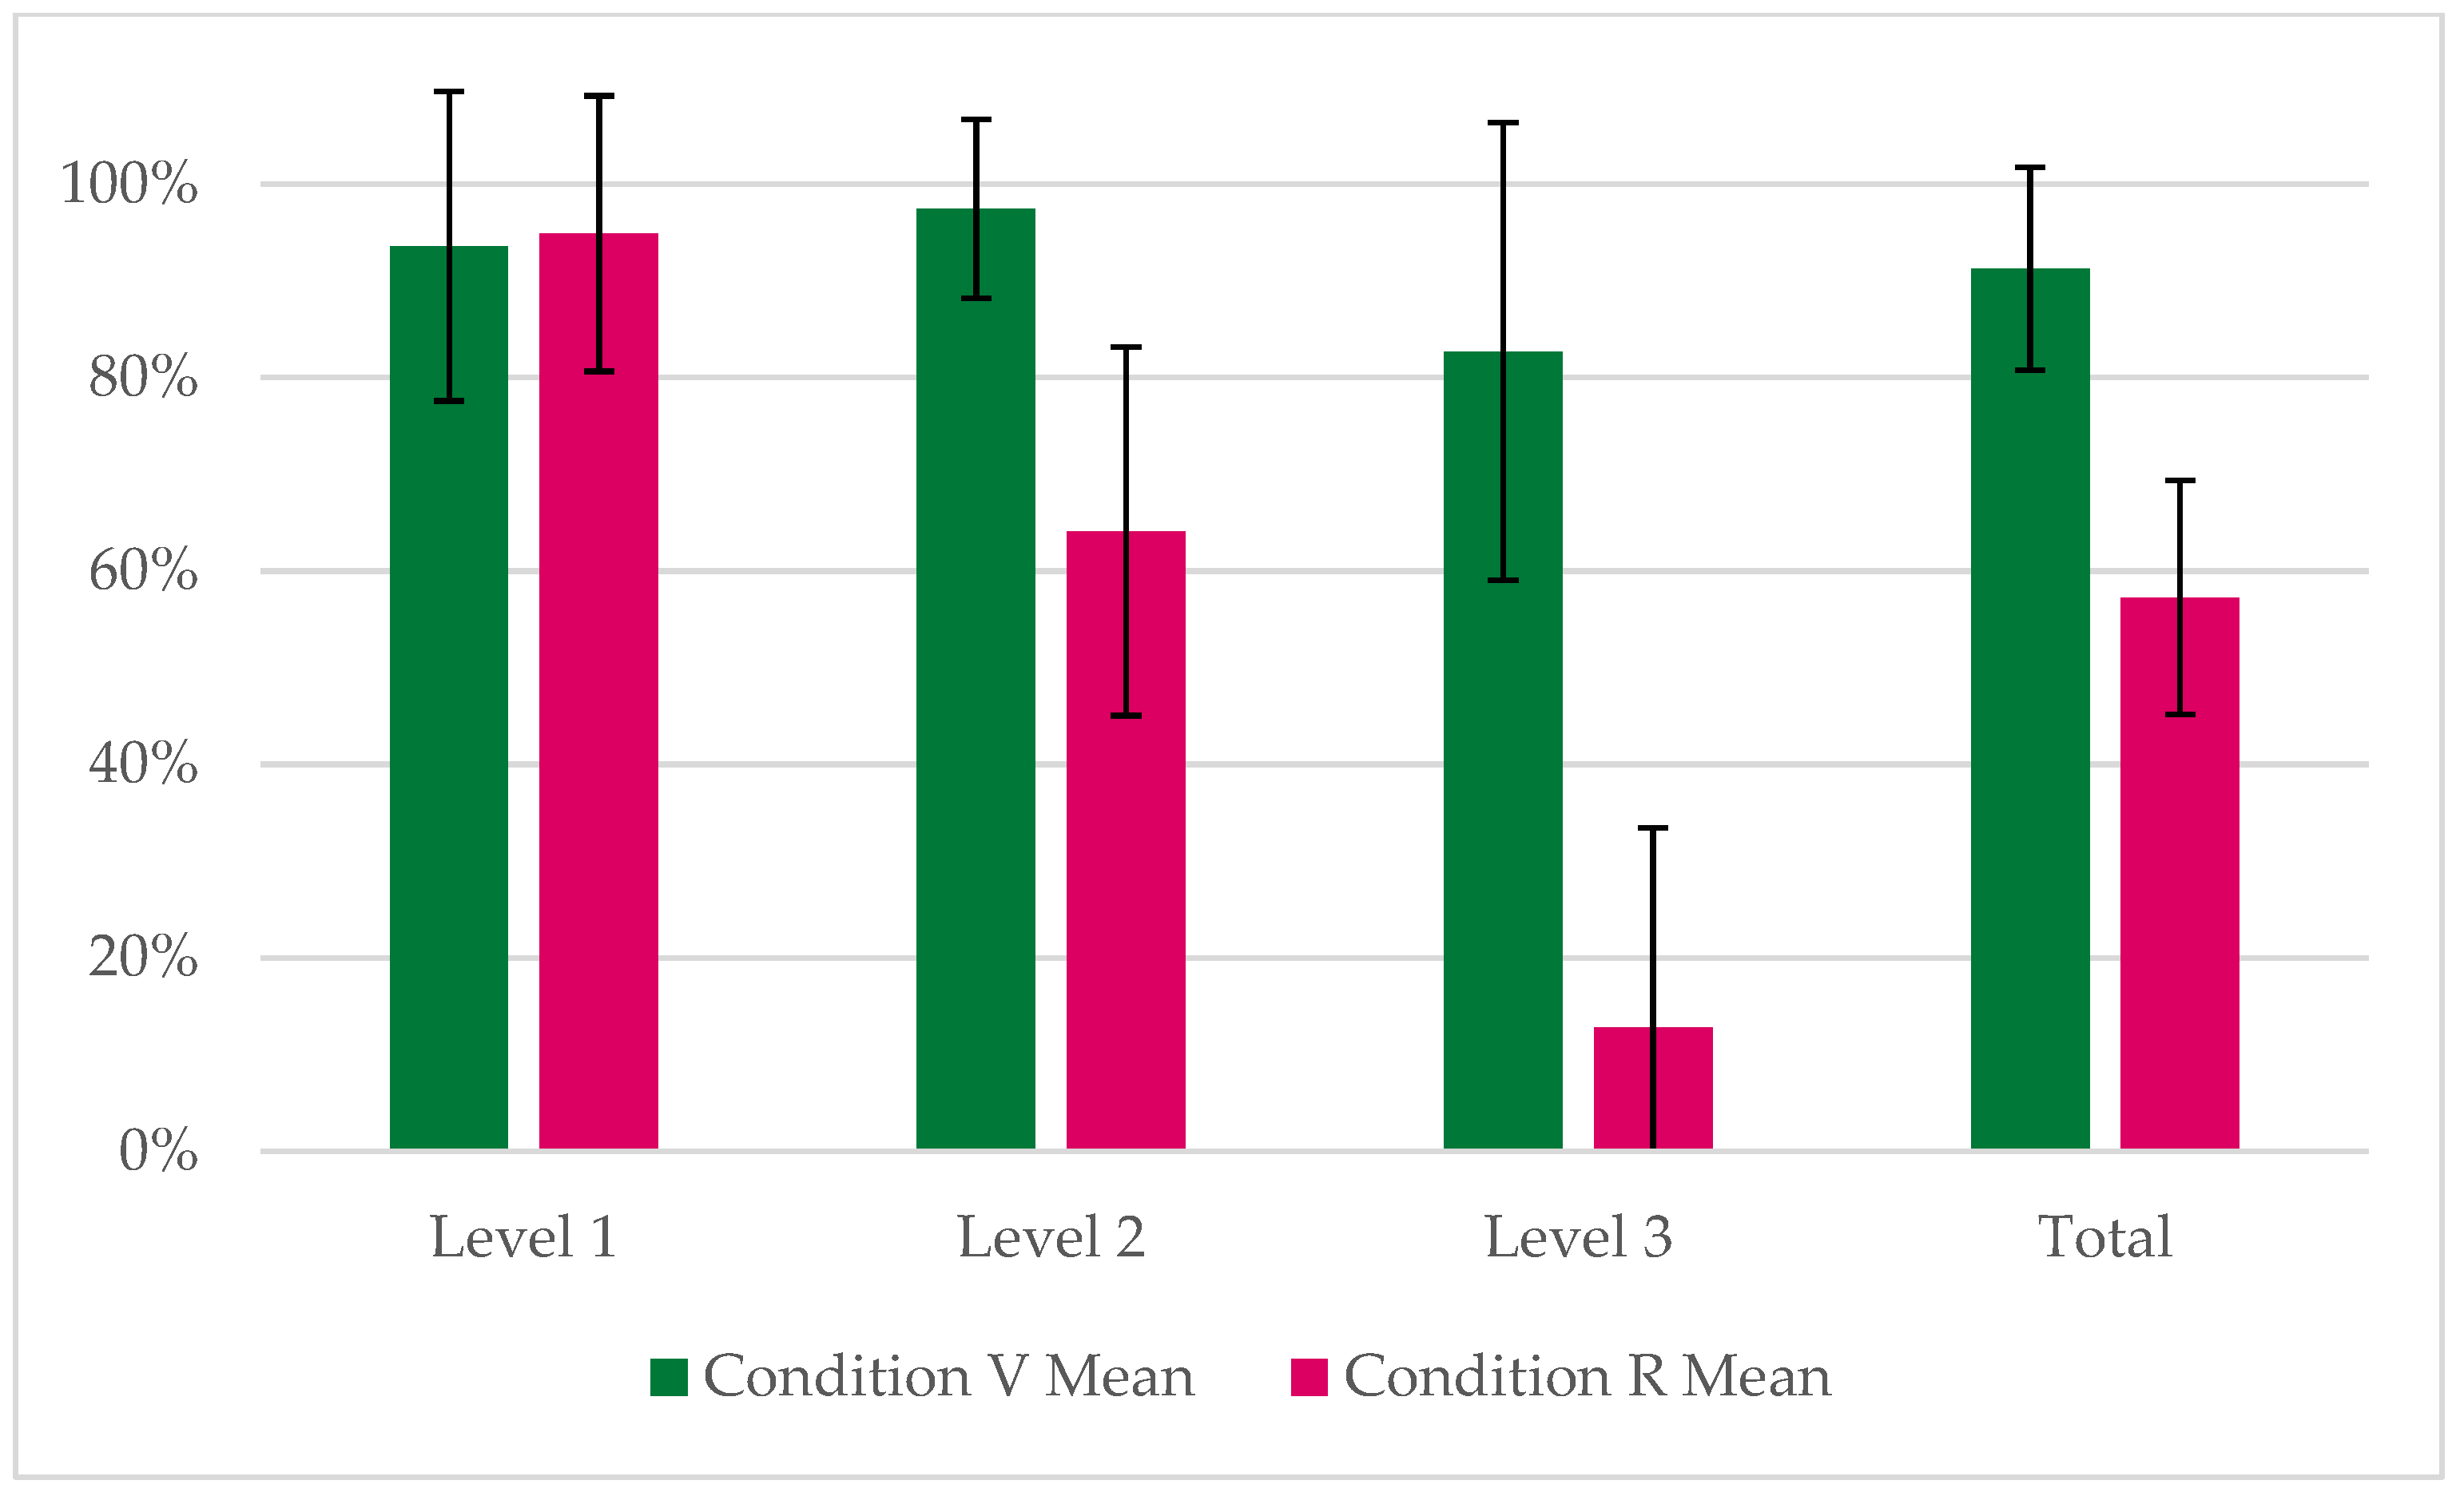
Figure 7.
The mean ML and WW for Conditions V and R.
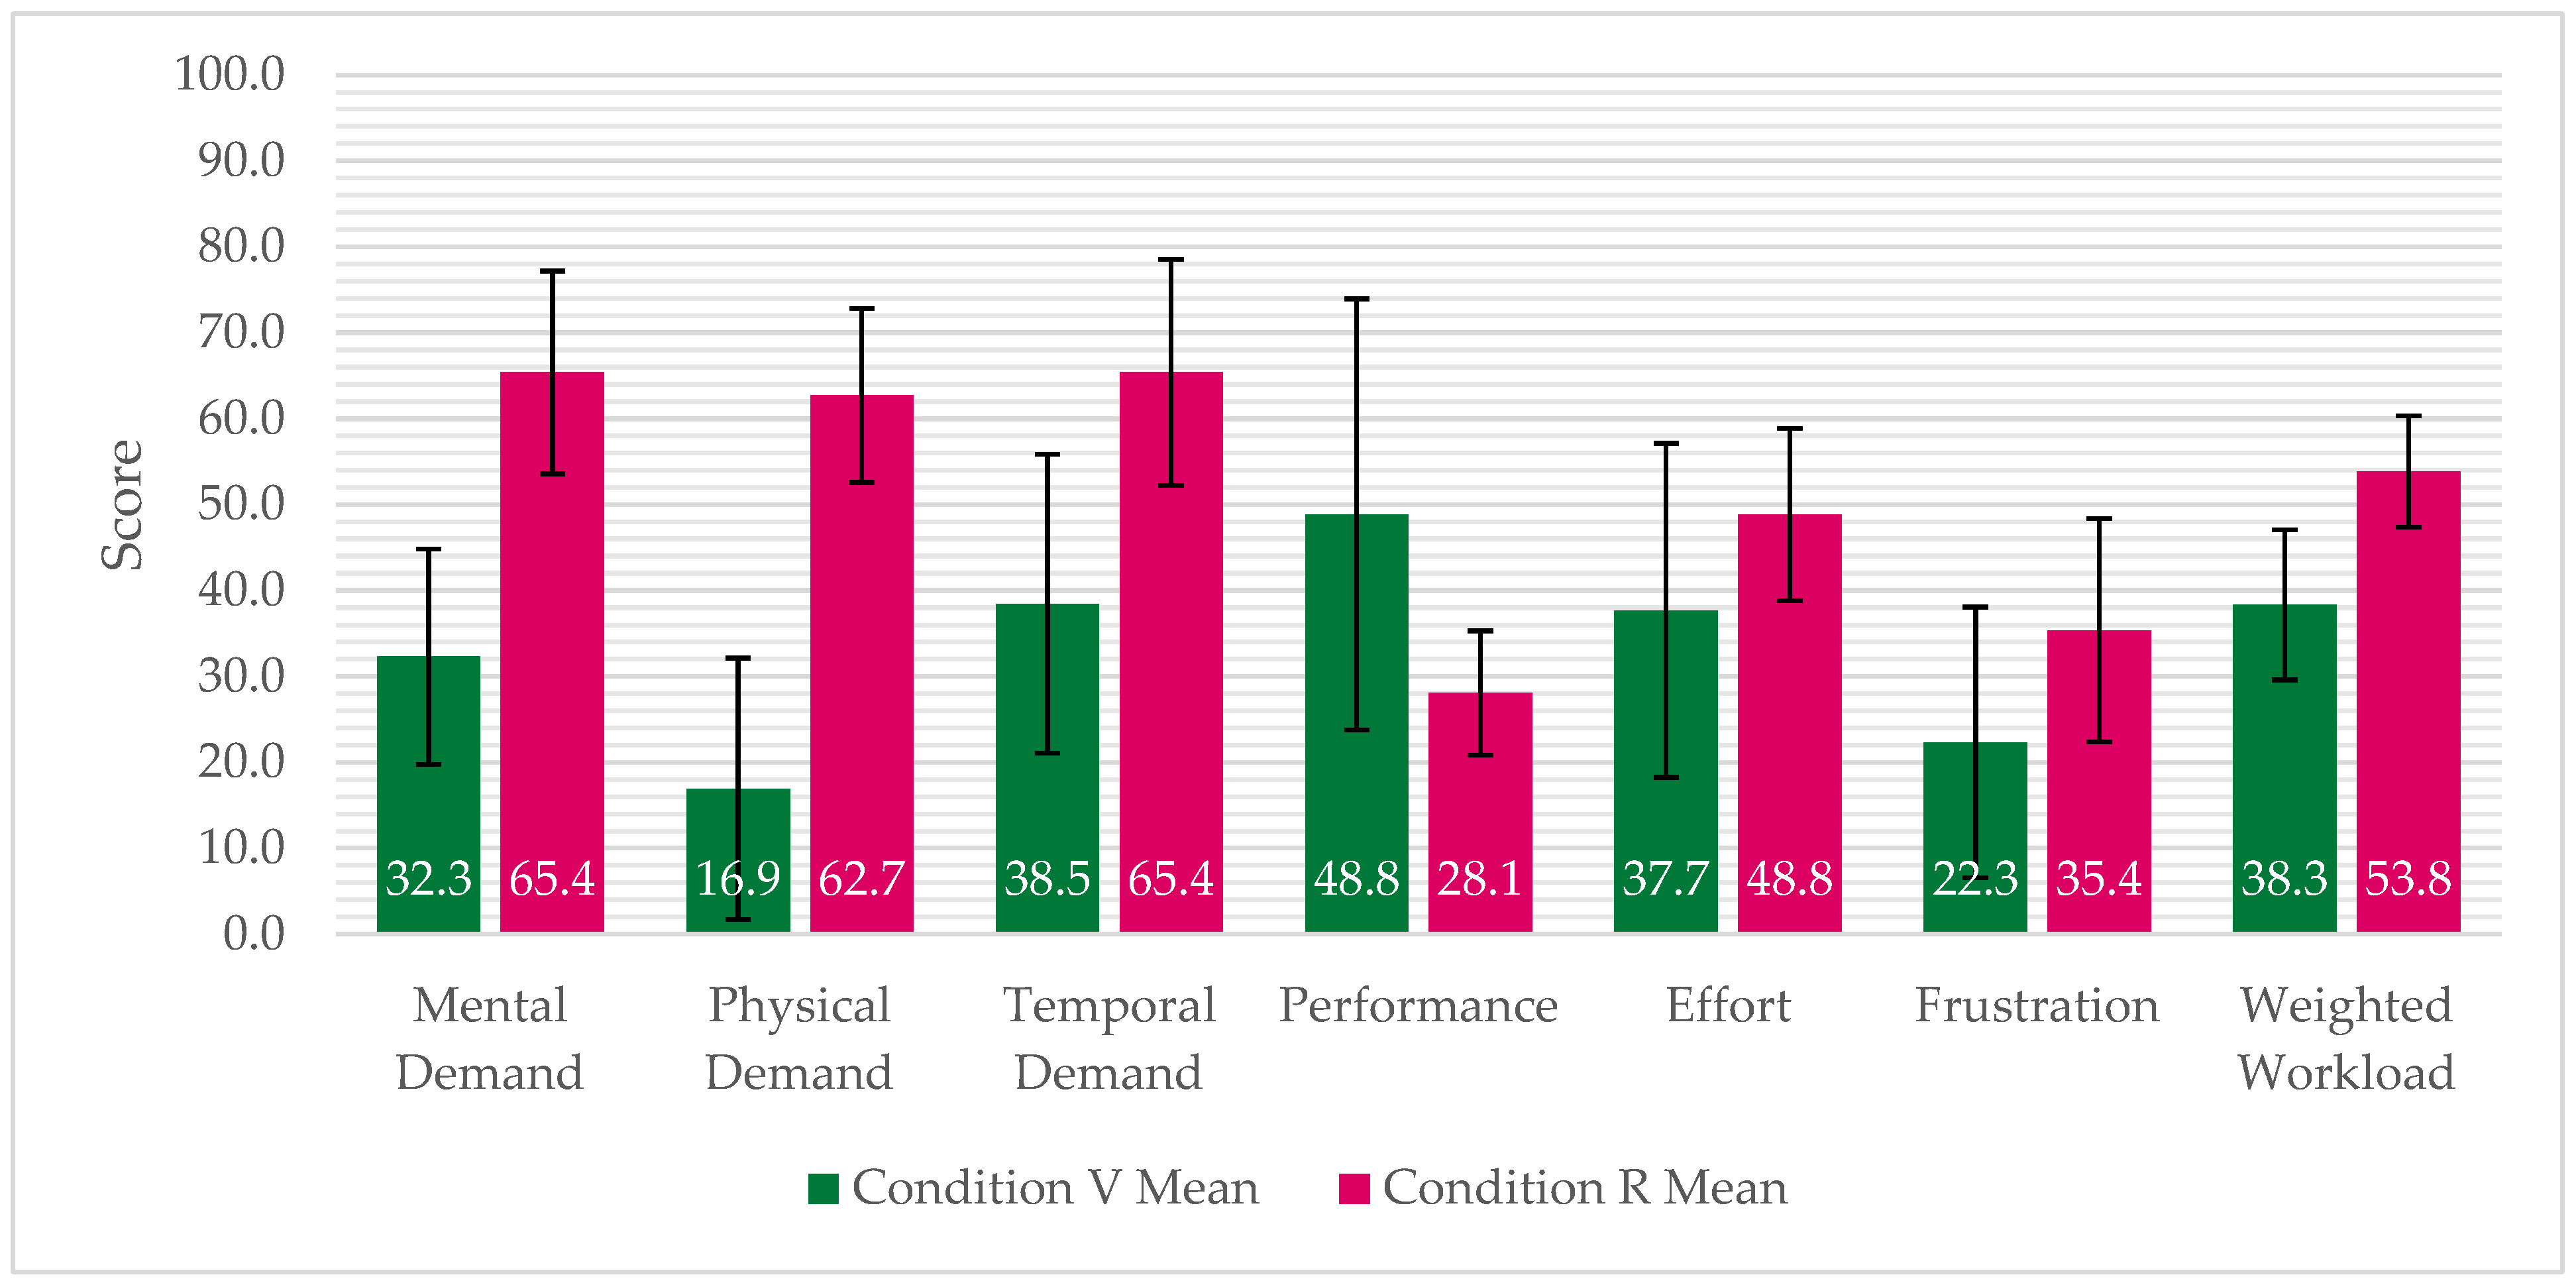
Figure 8.
Mean WL of each workload subscale by condition, as a percentage of total workload.
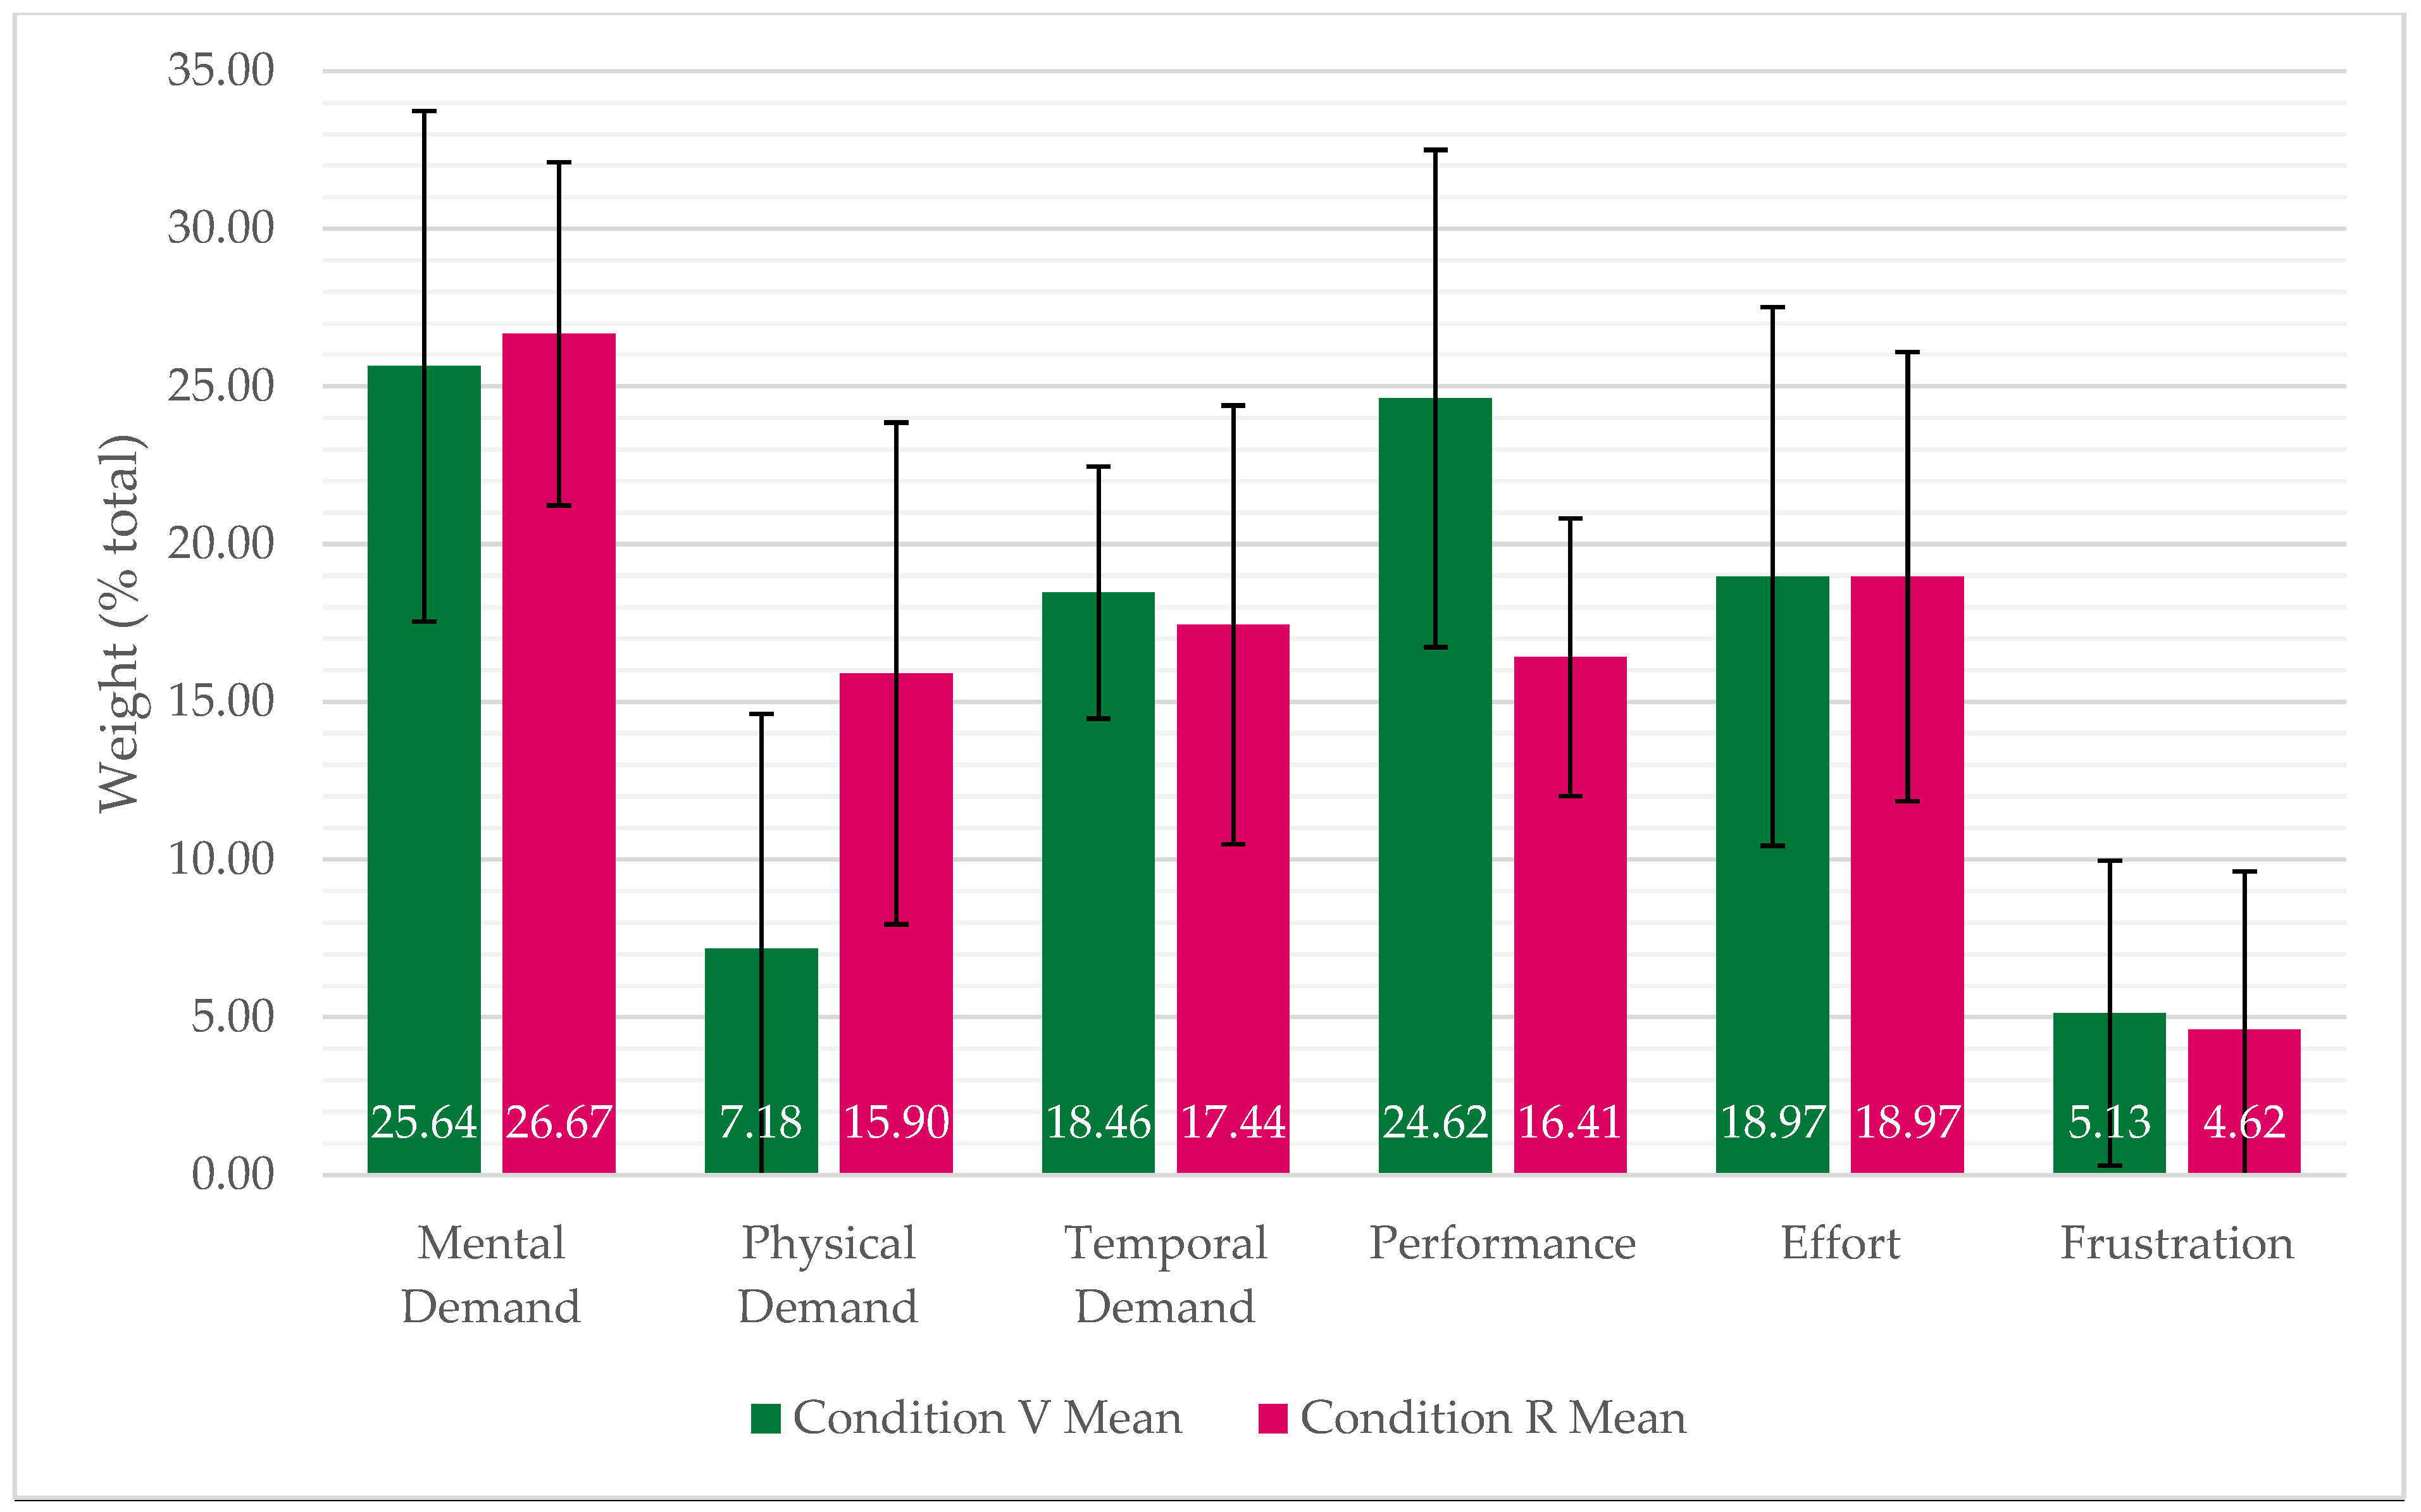
Figure 9.
Change in anxiety by participant.
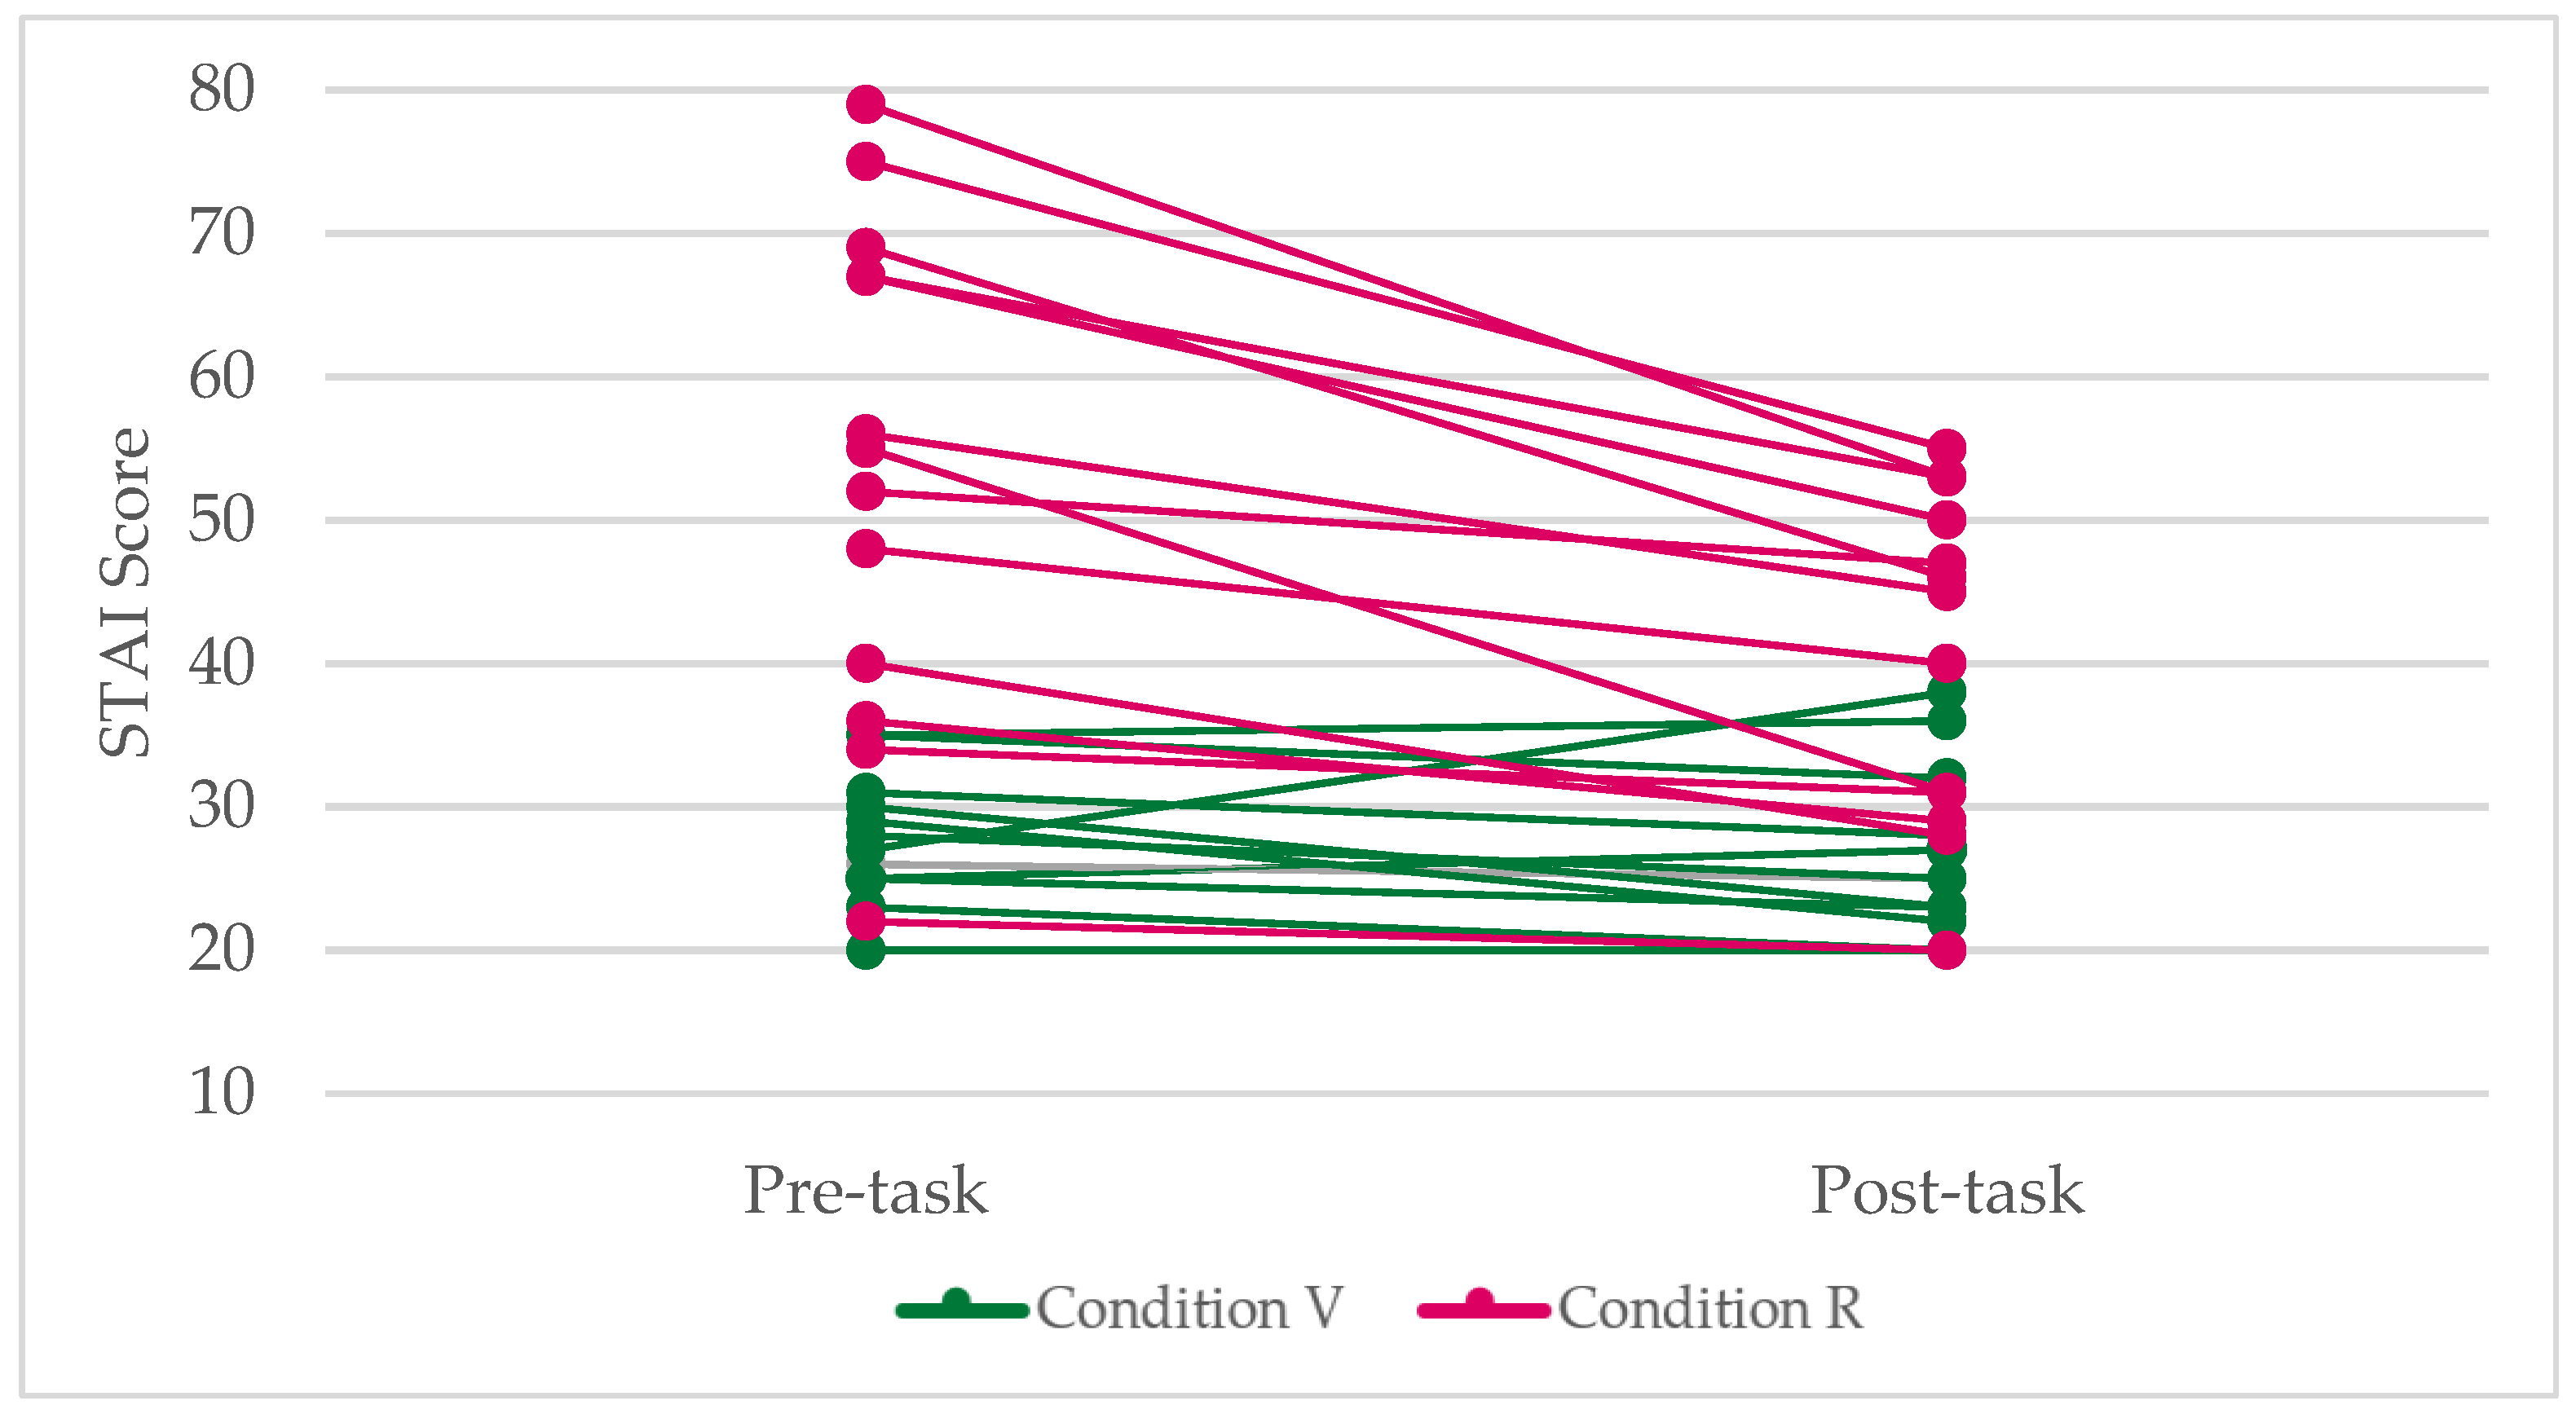
Figure 10.
Mean STAI score pre- and post-task.
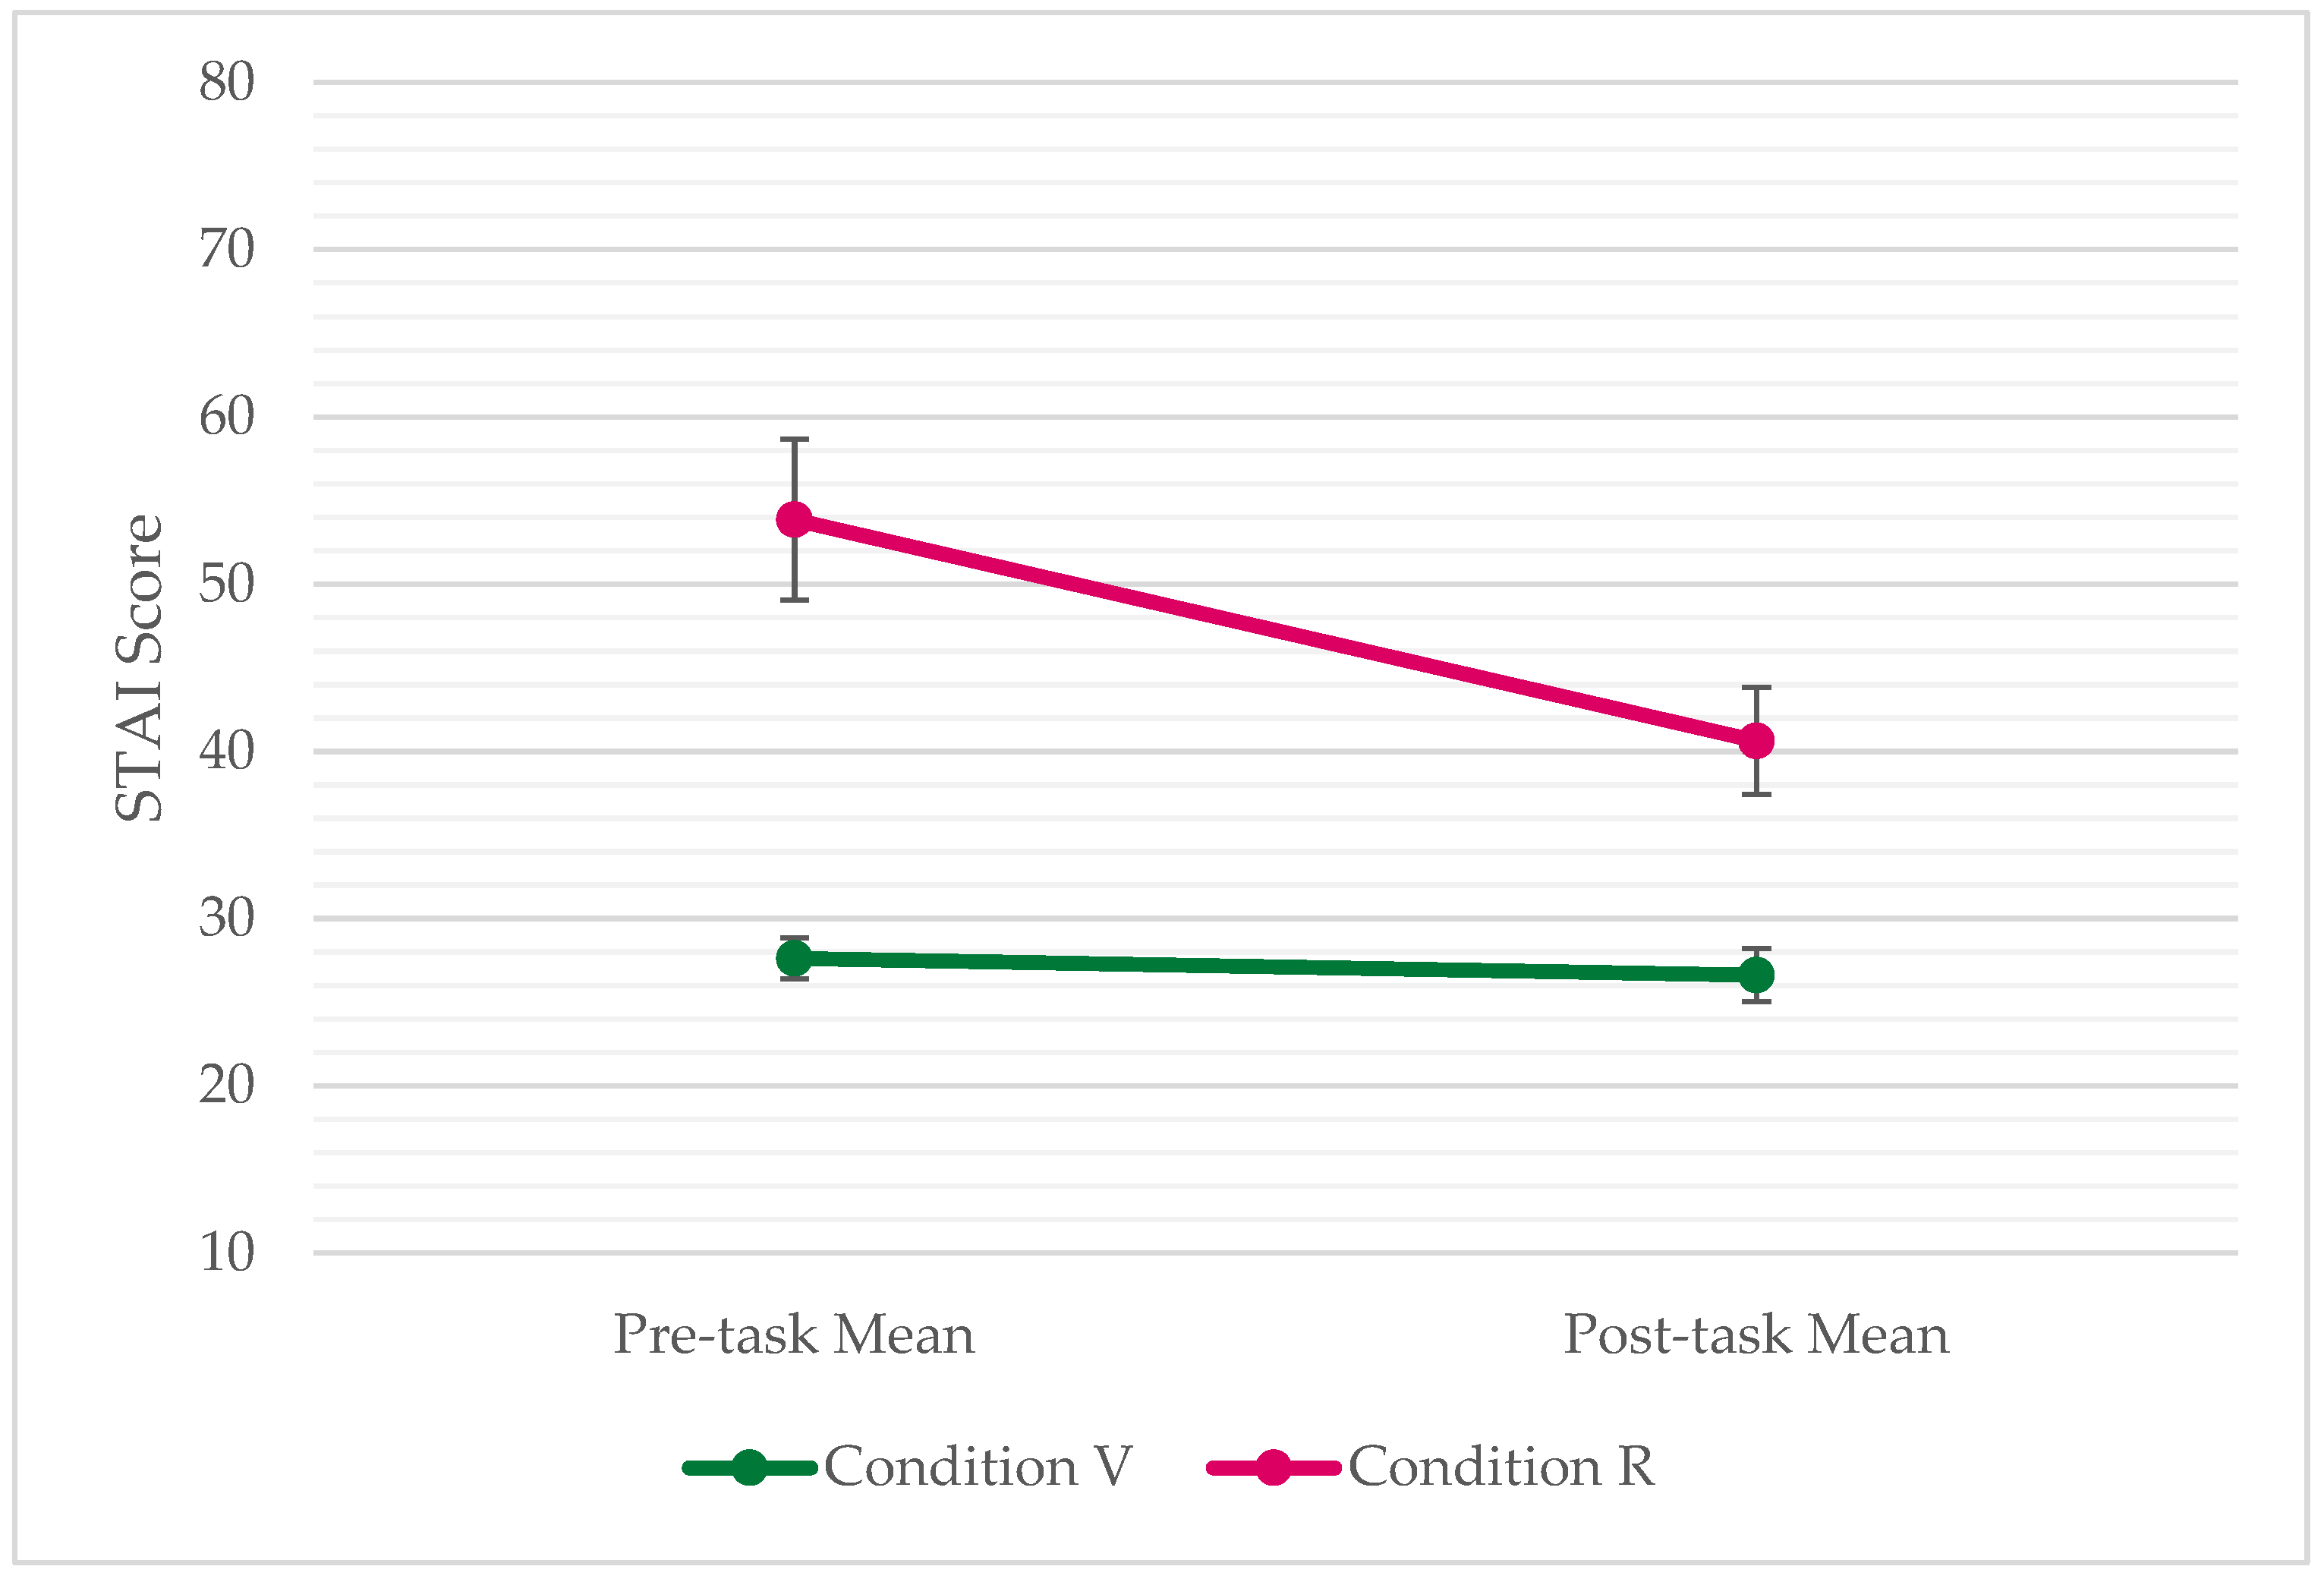
Figure 11.
Presence profile of the FULmax VR-Hub versus all other projection cases from the IPQ database.
Figure 11.
Presence profile of the FULmax VR-Hub versus all other projection cases from the IPQ database.
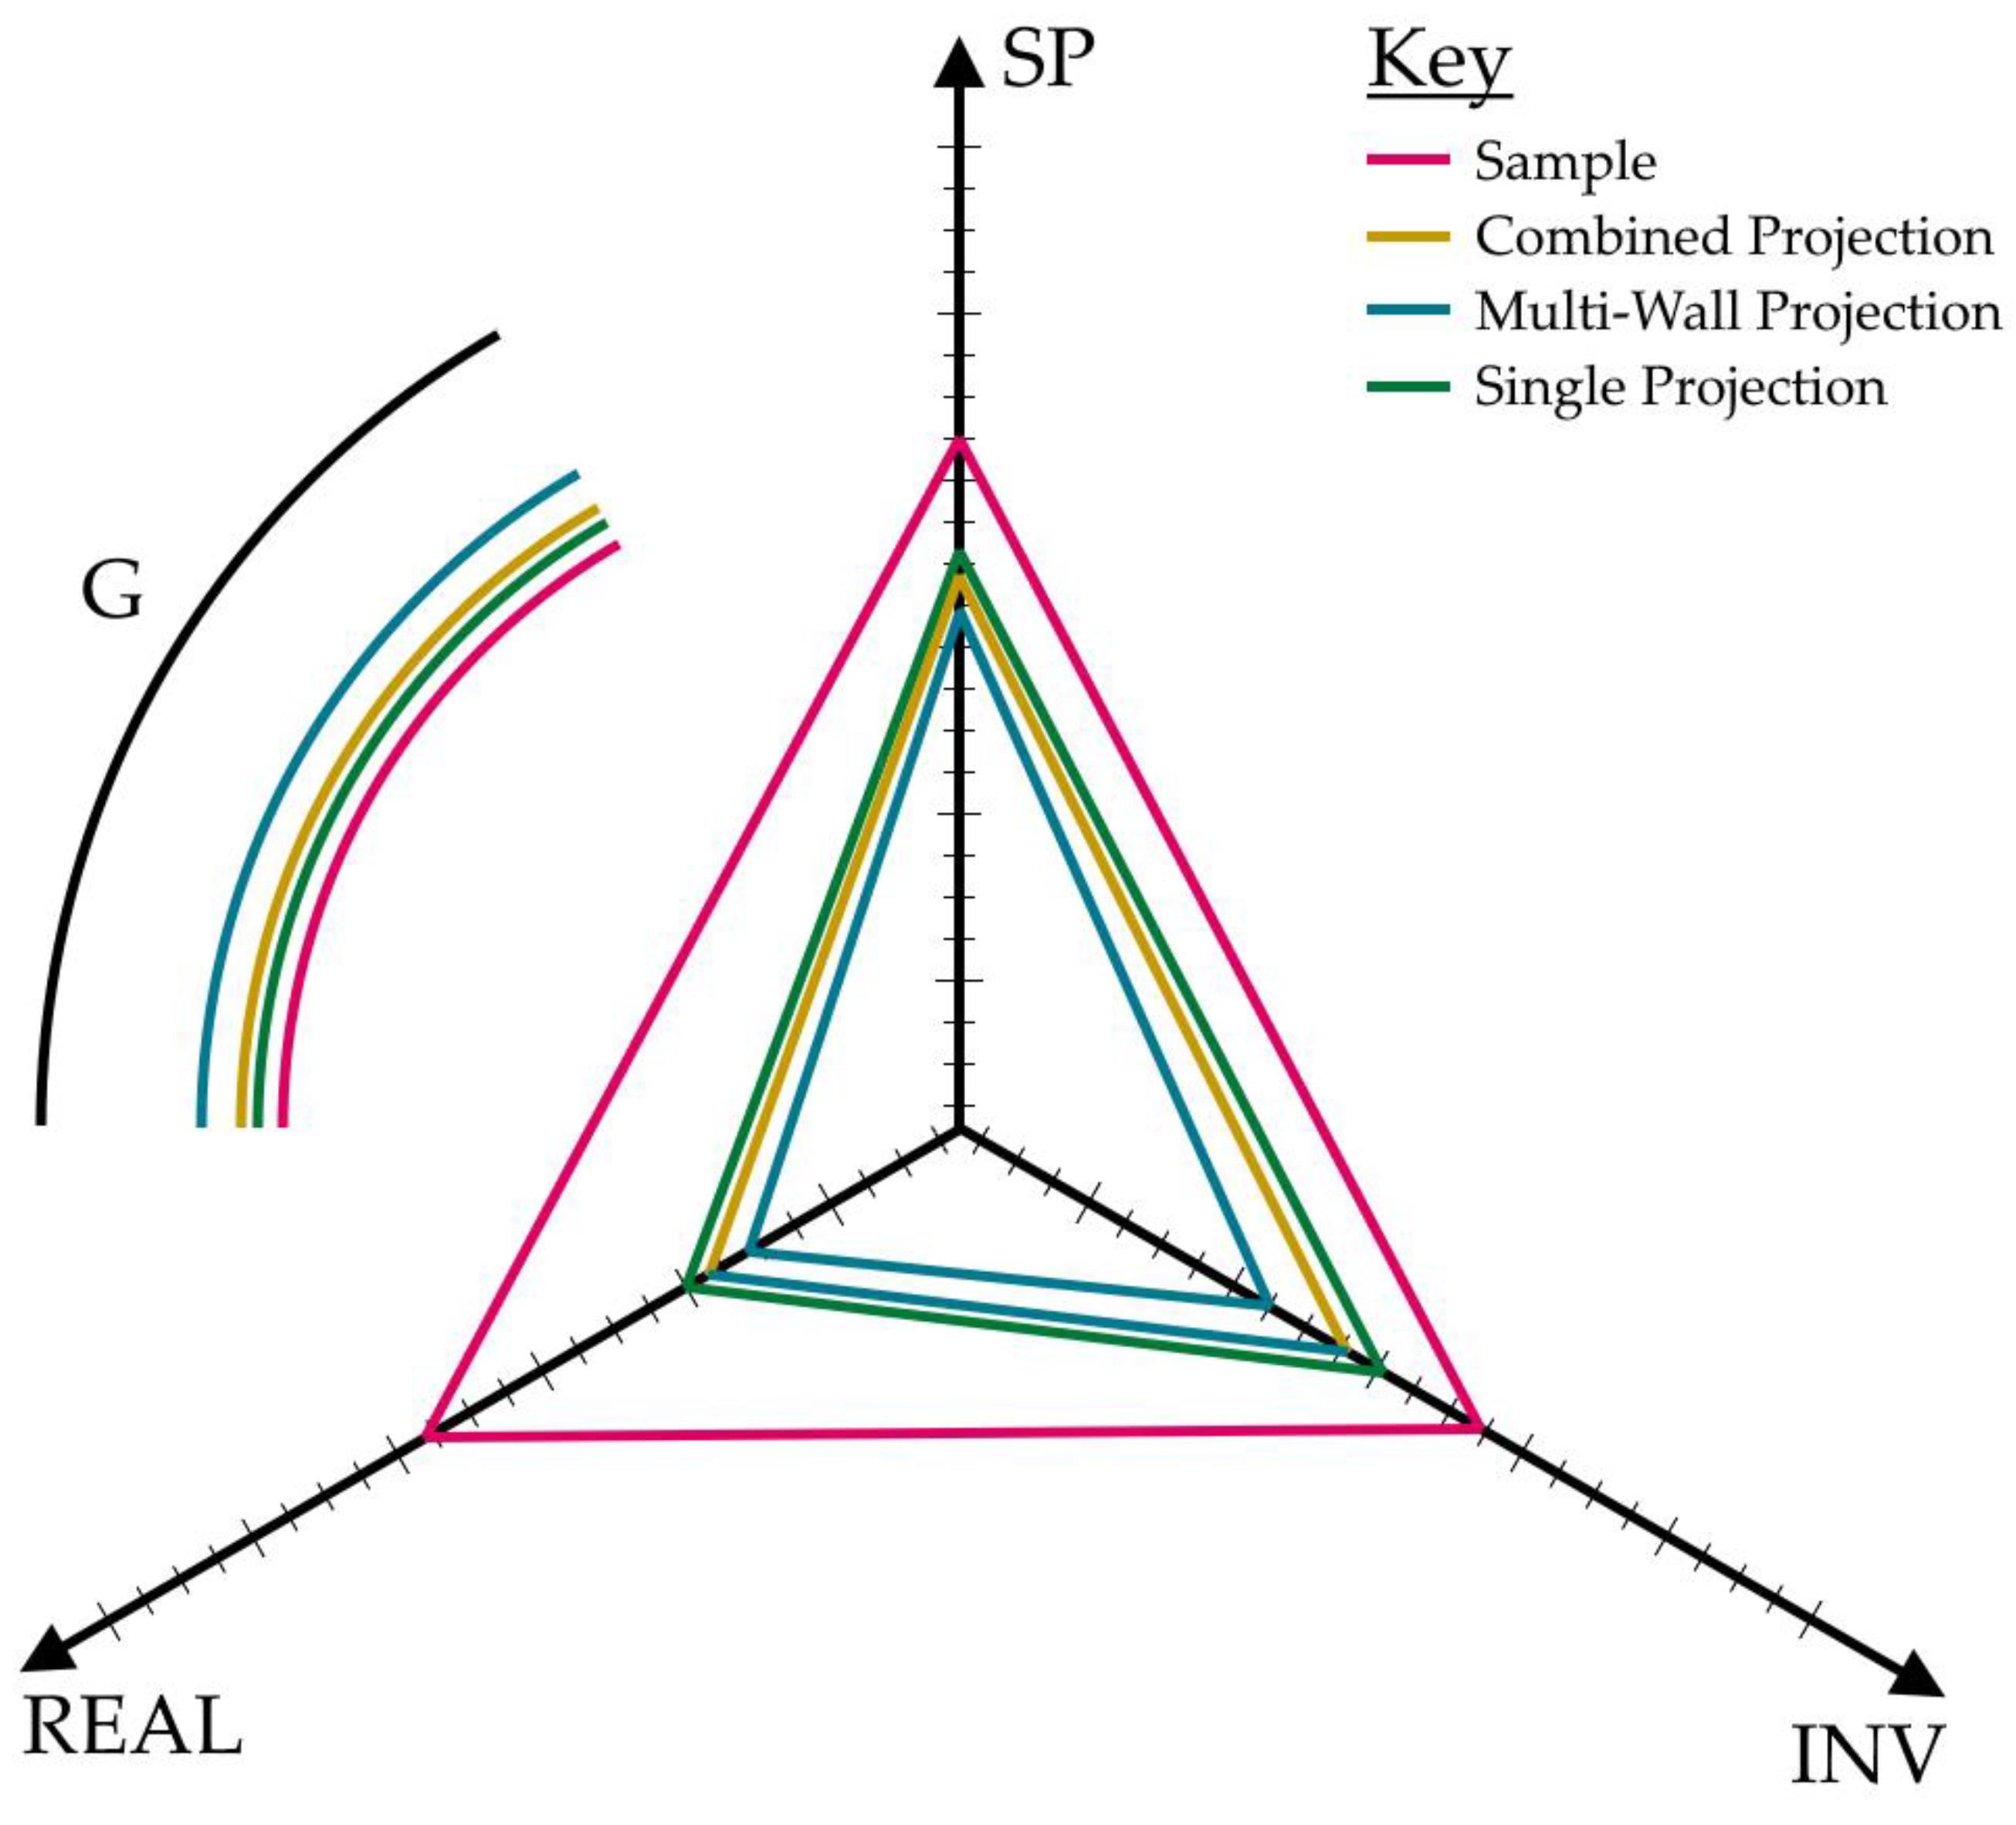
Figure 12.
SUS score by participant, sample mean, and SUS average.
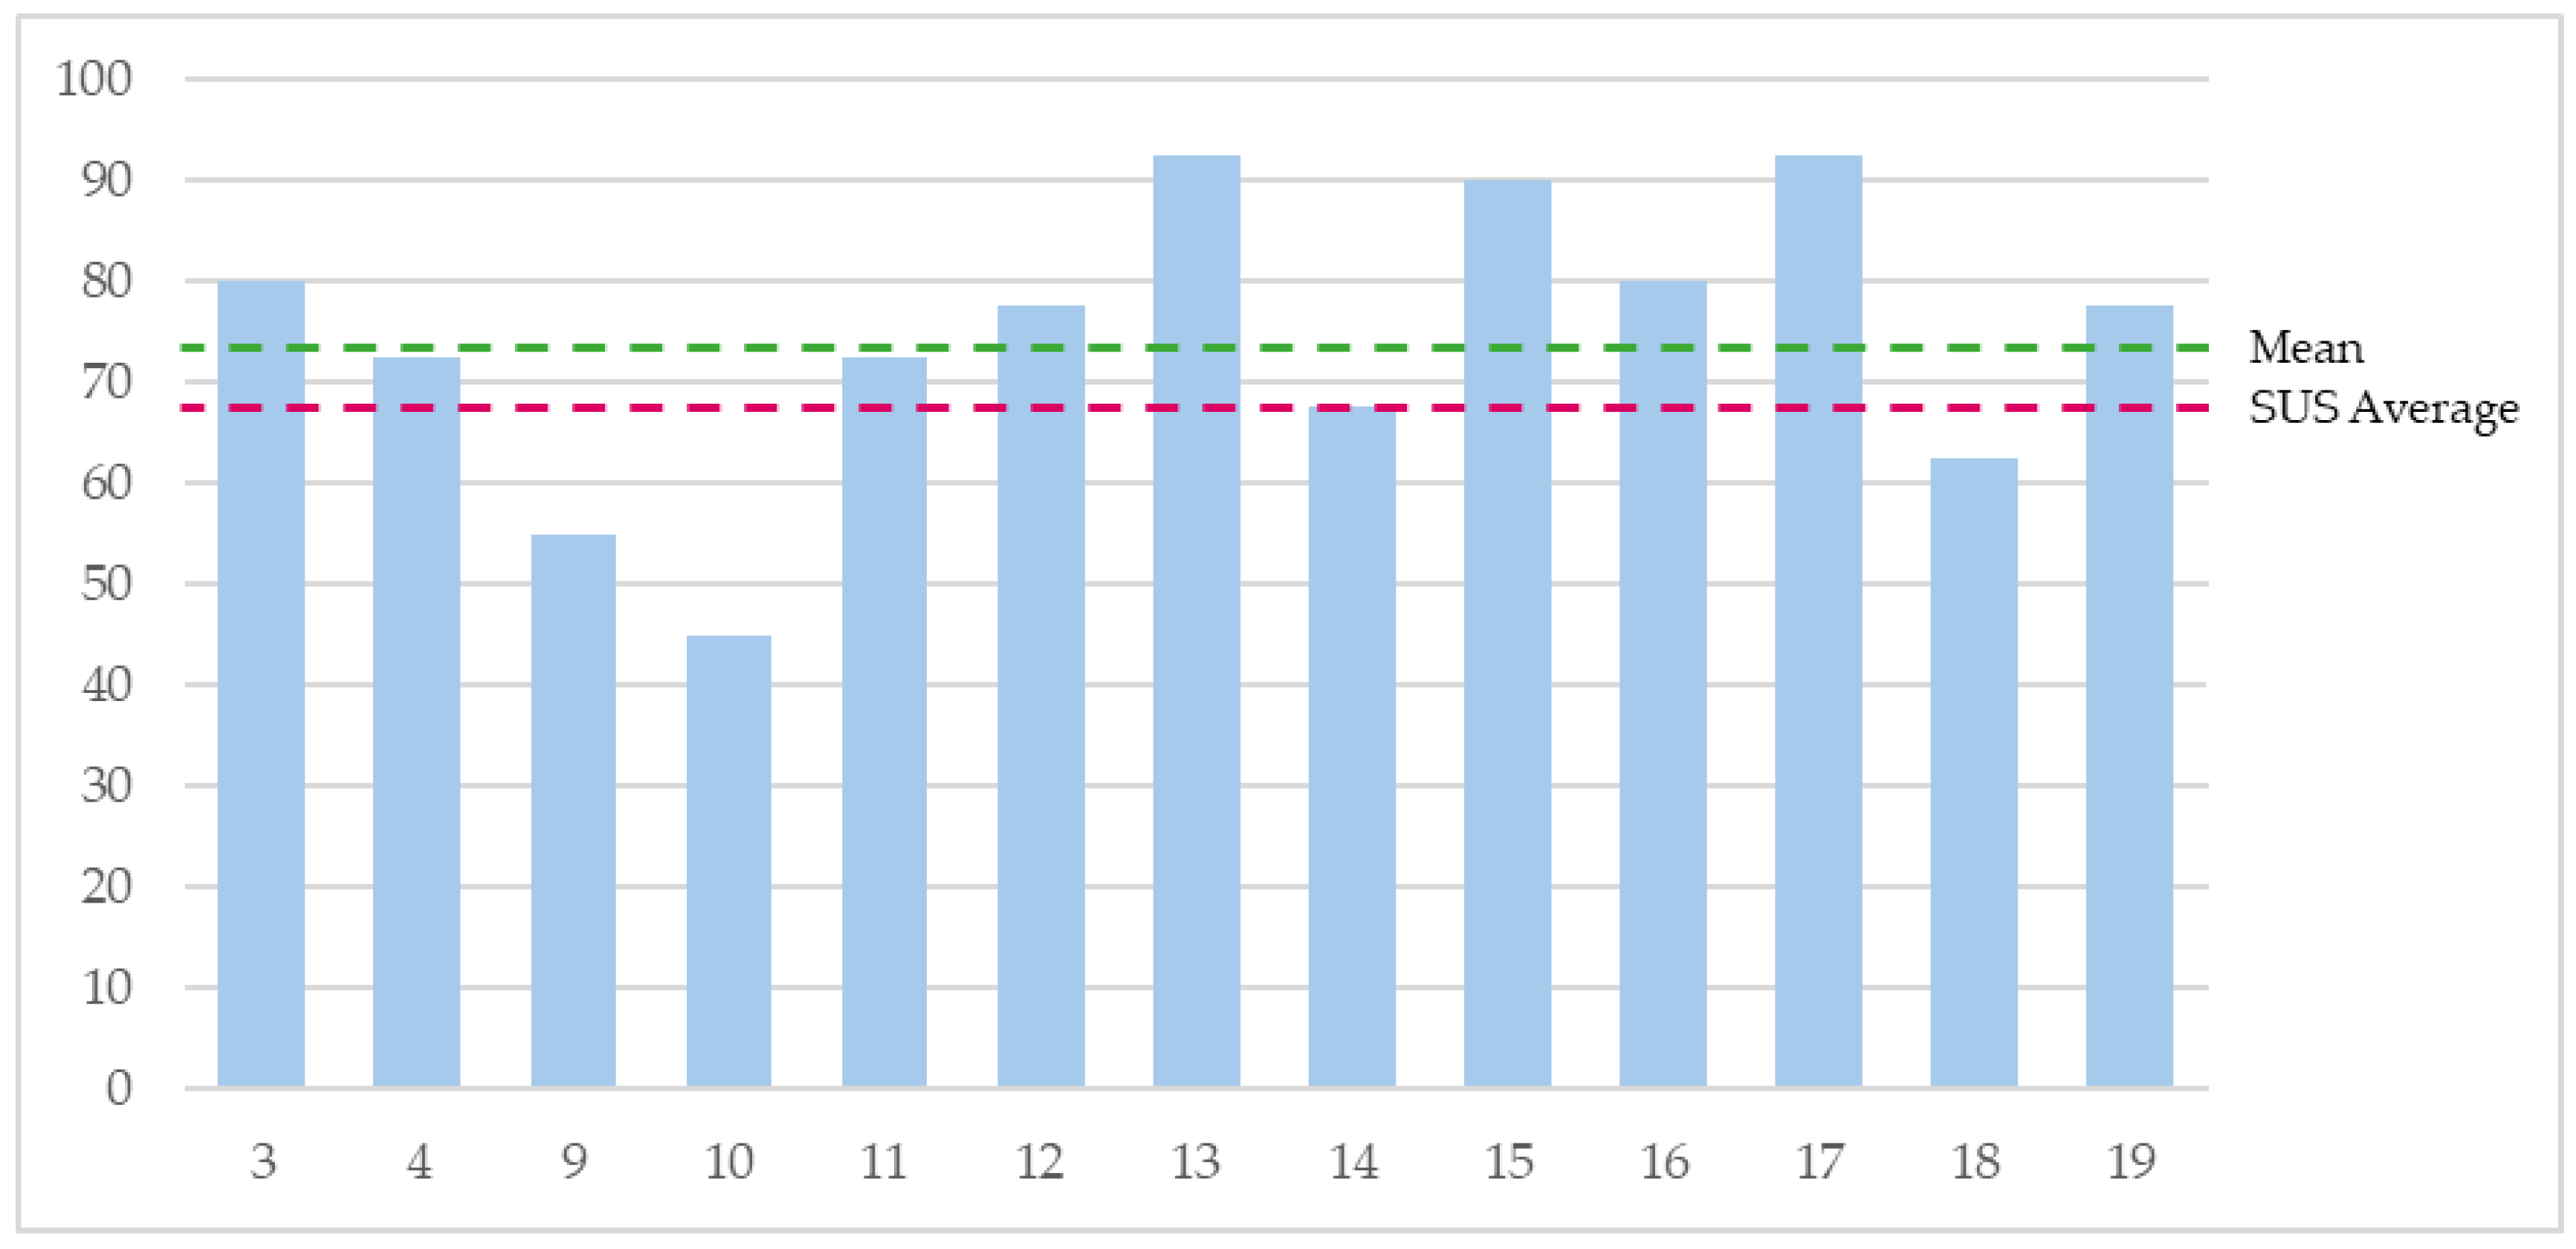
Figure 13.
Distribution of participant responses to each question on the SUS.
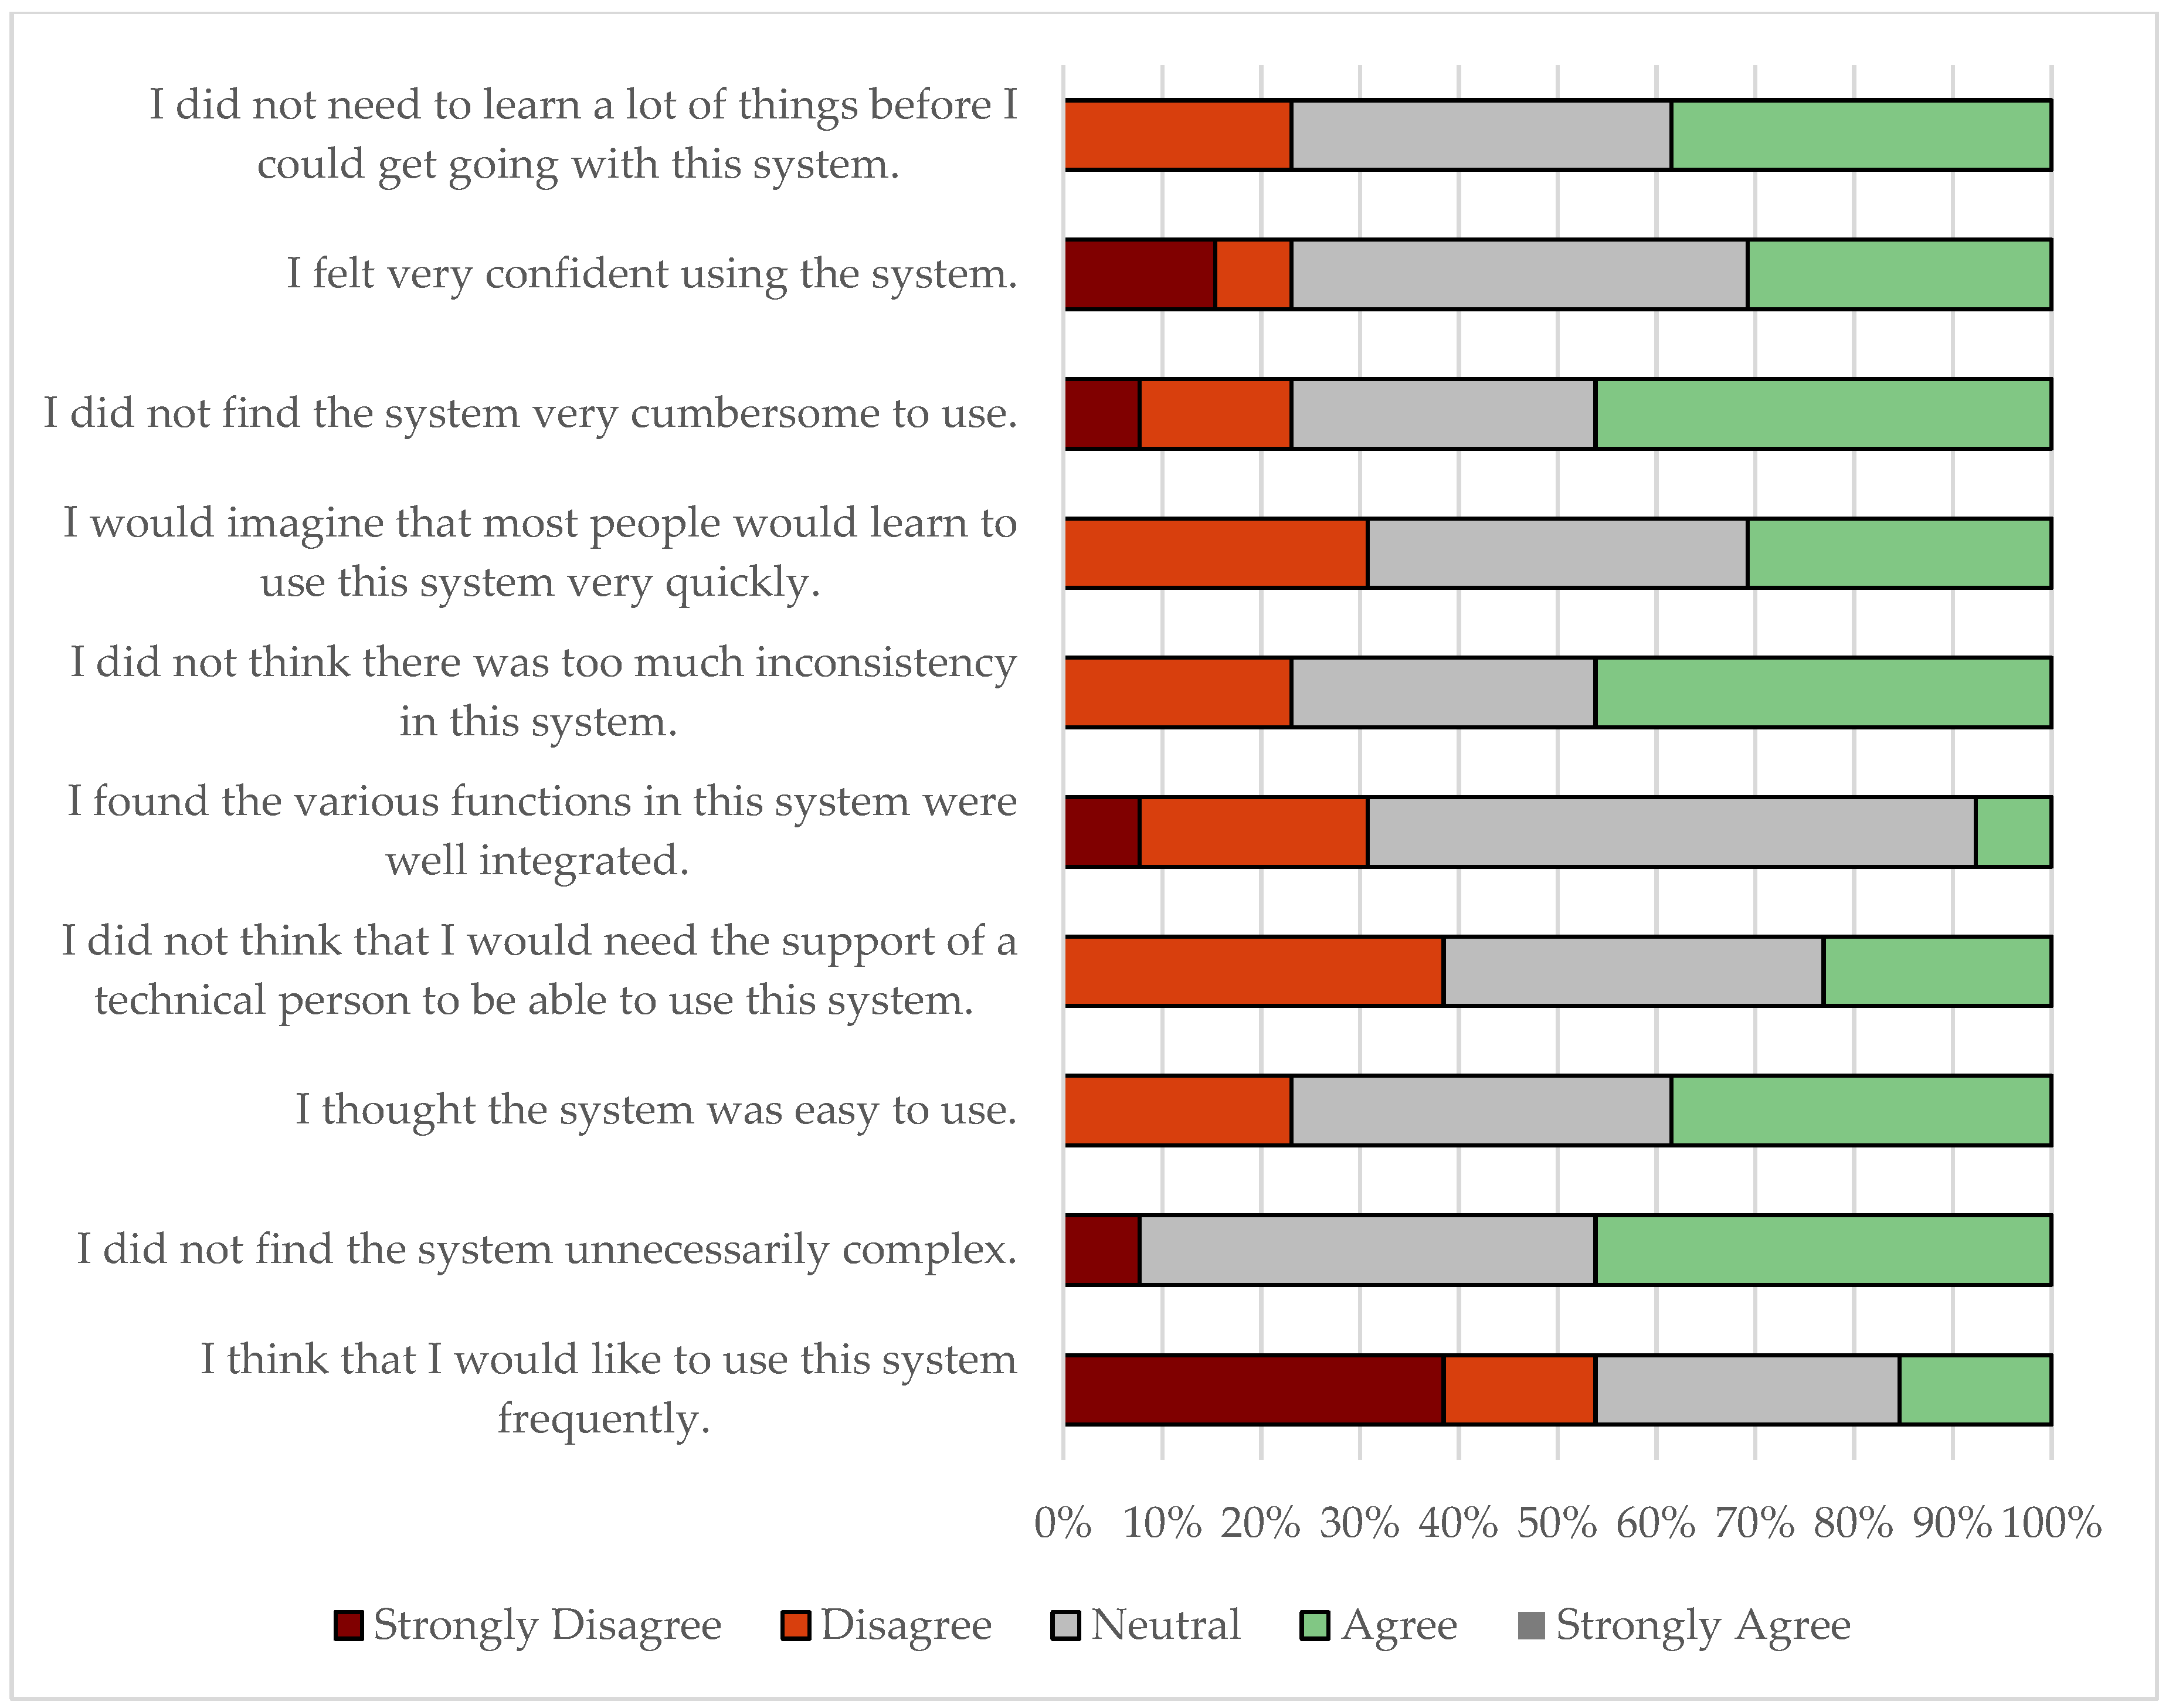
Figure 14.
Workload vs SA for Condition R.
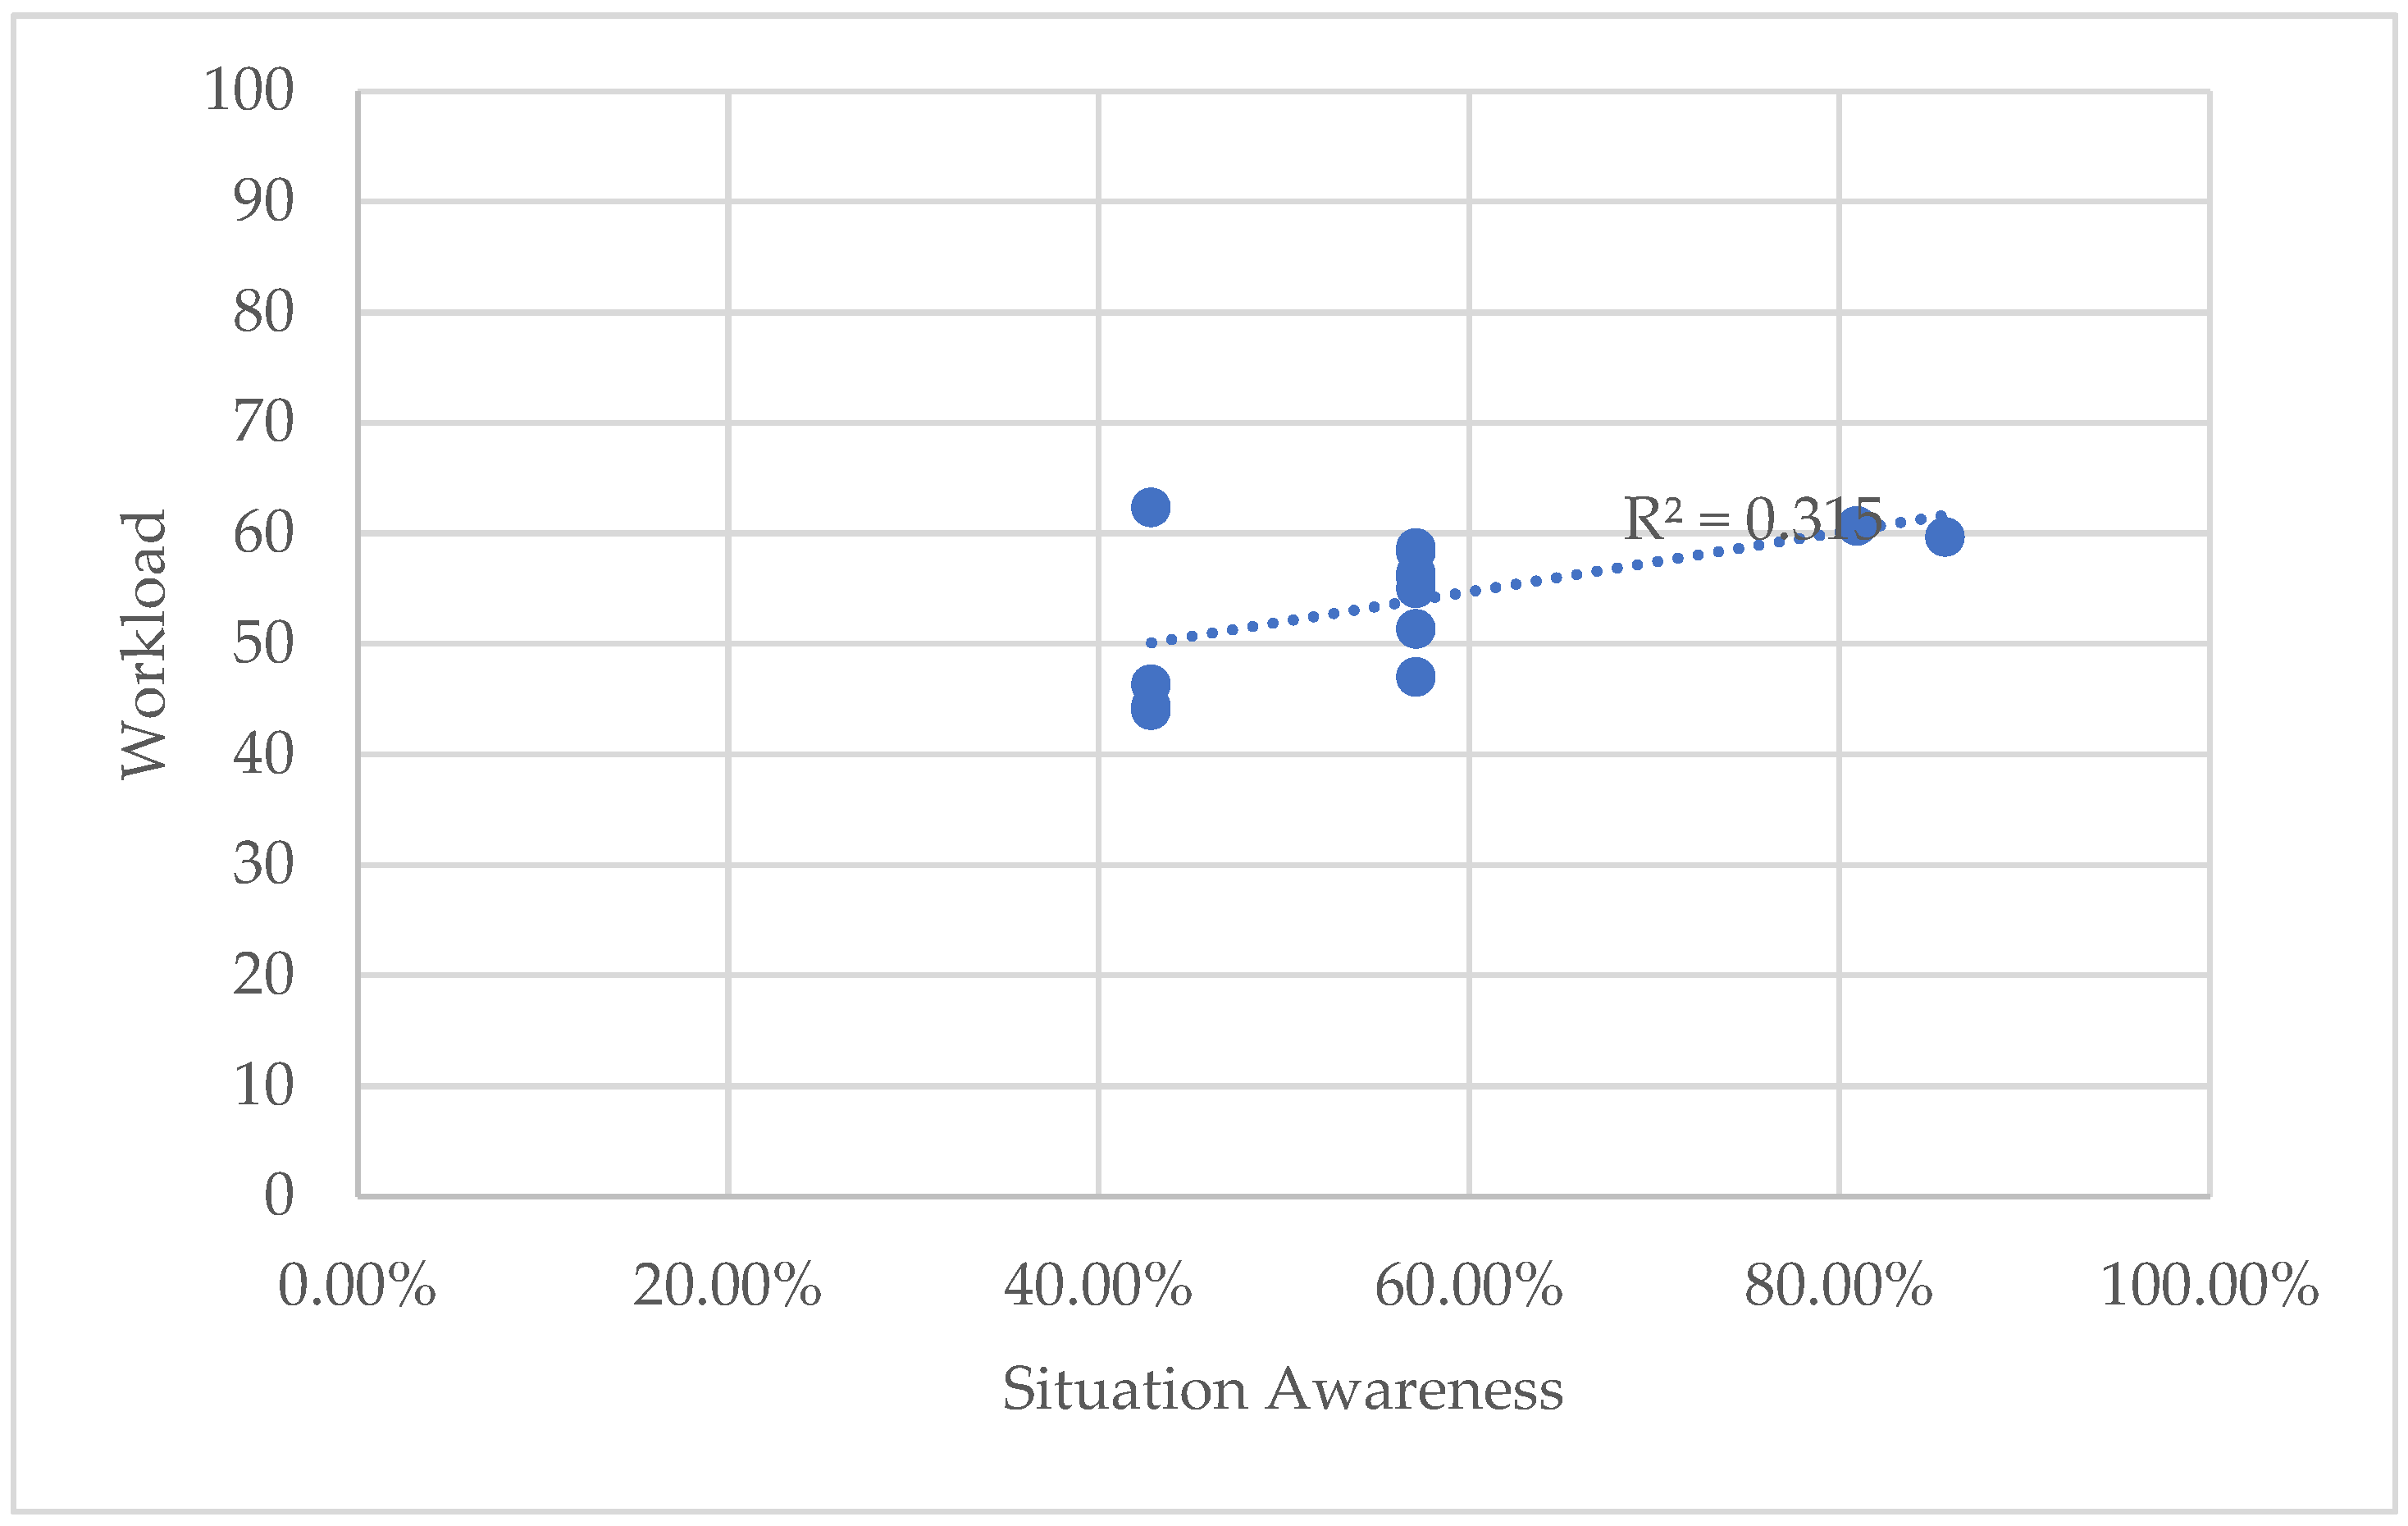
Figure 15.
Workload vs SA for Condition V.
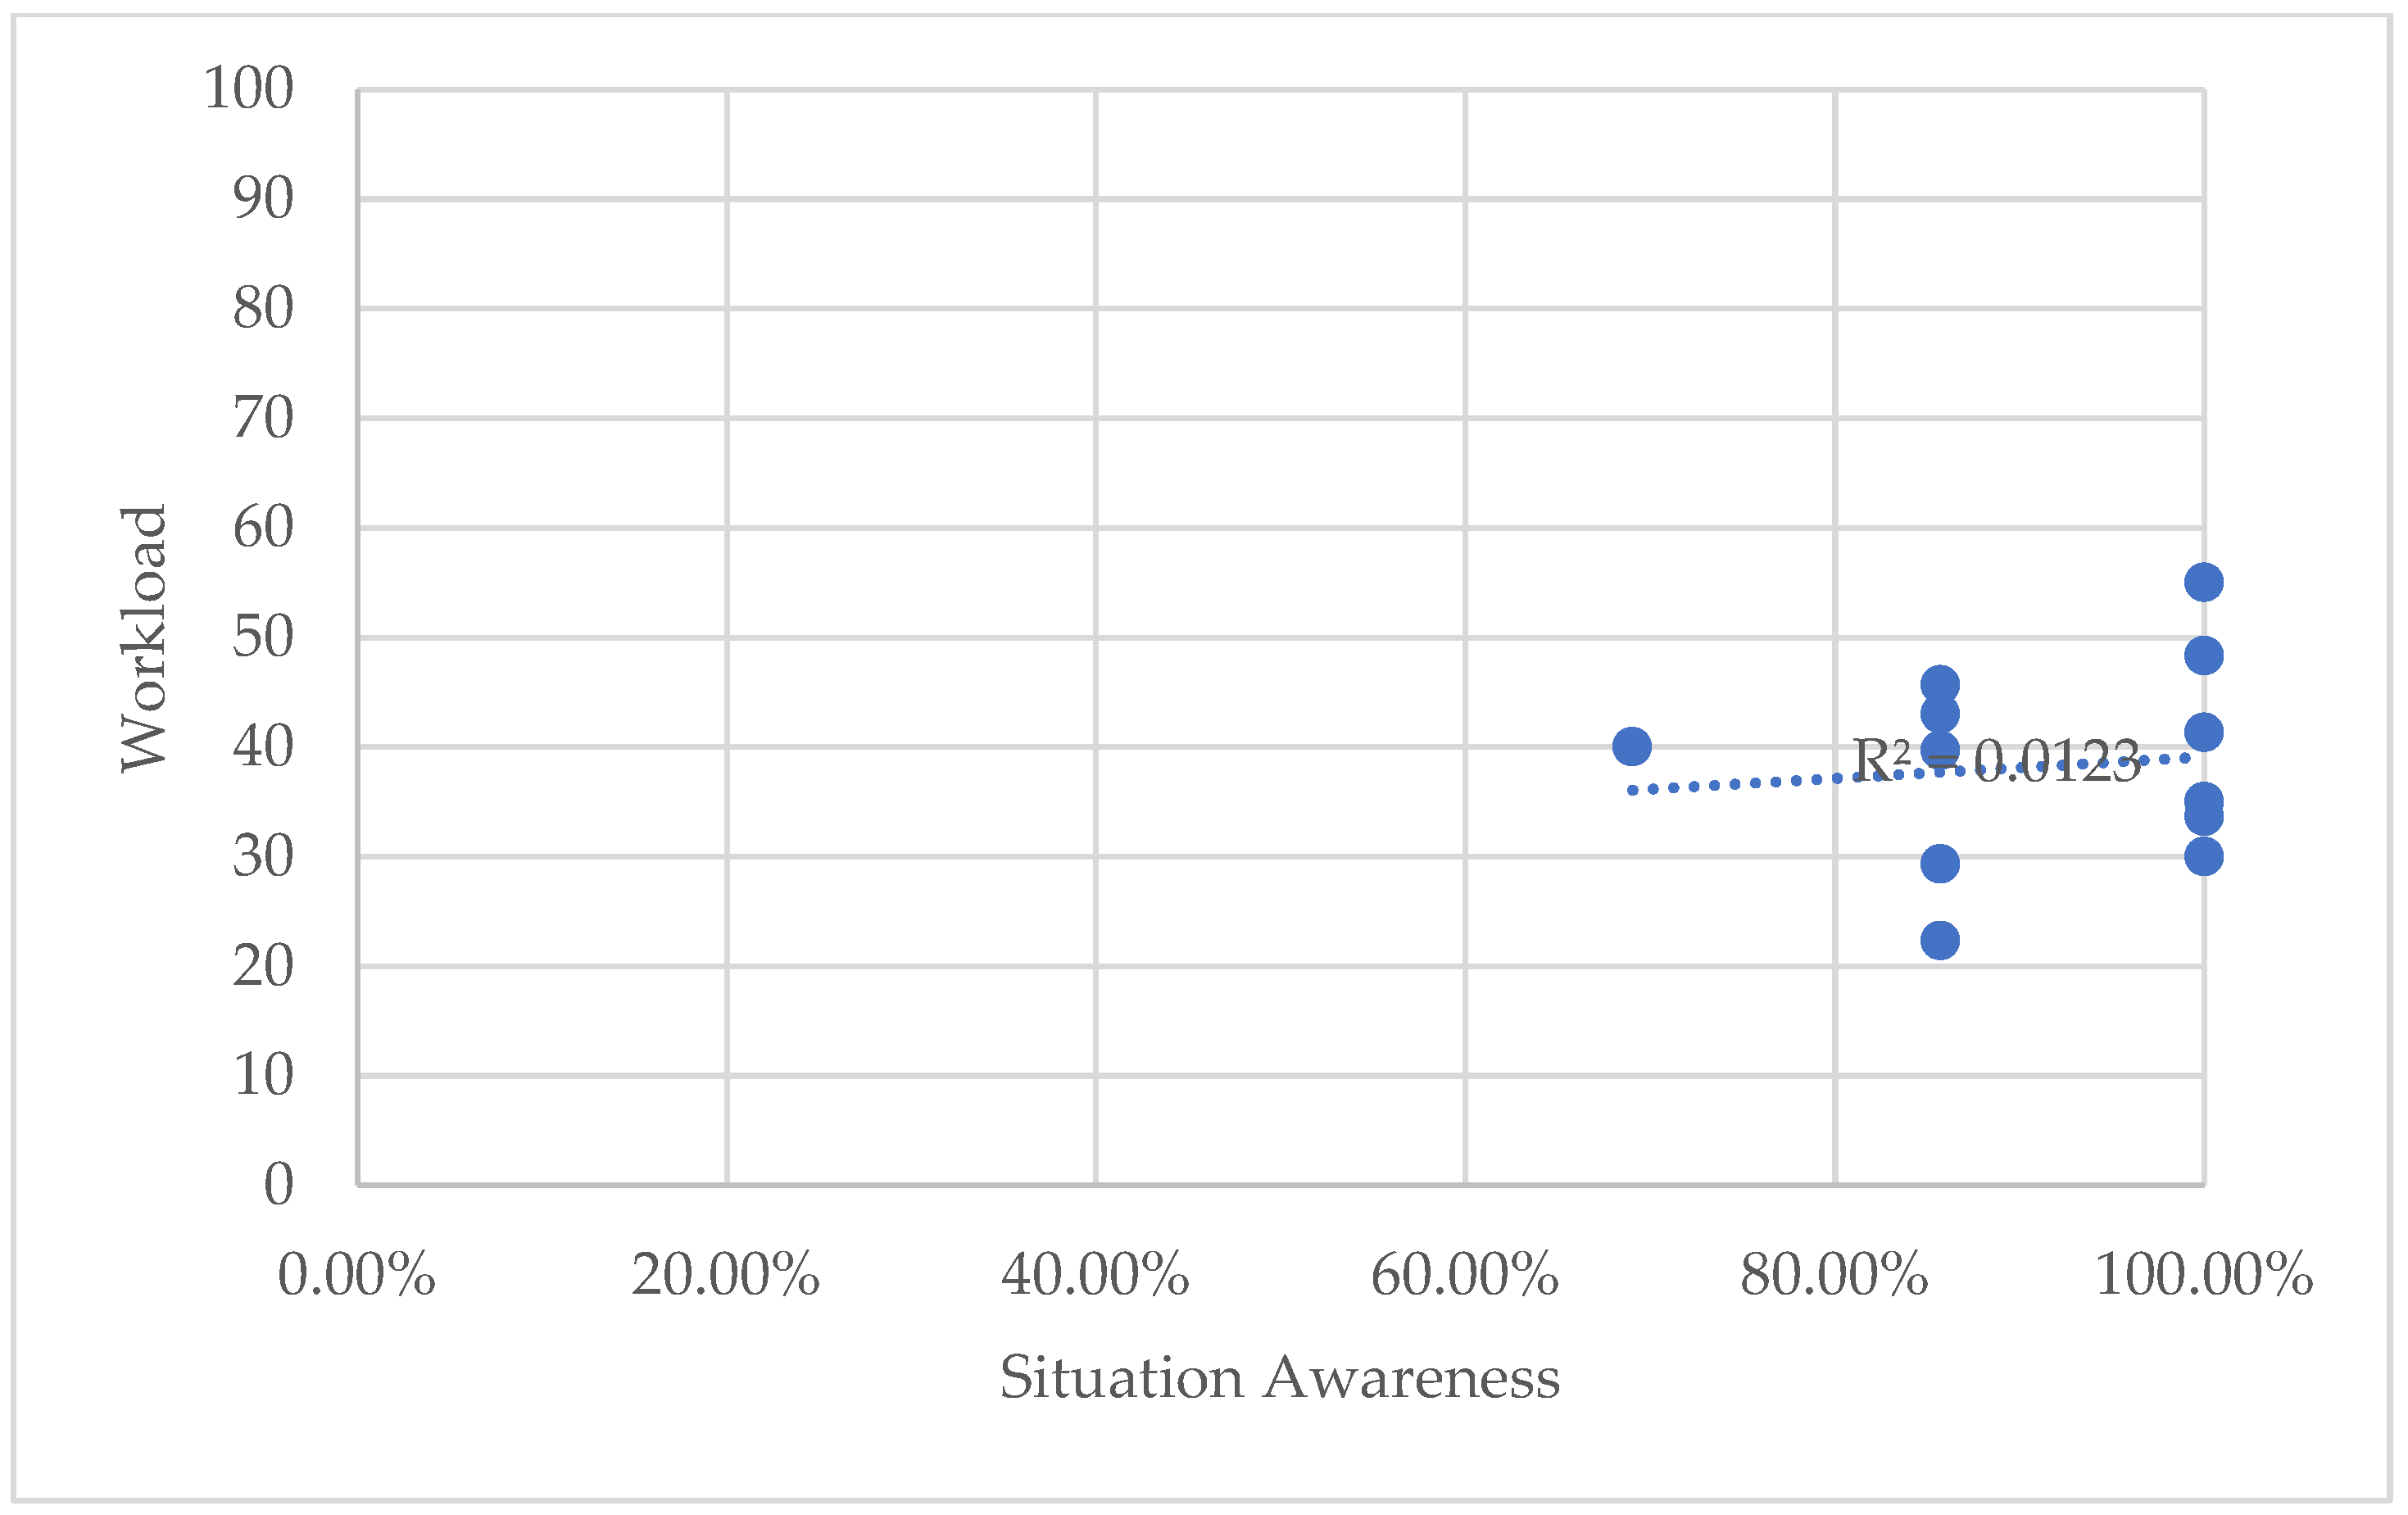
Figure 16.
Workload vs Induced Anxiety for Condition R.
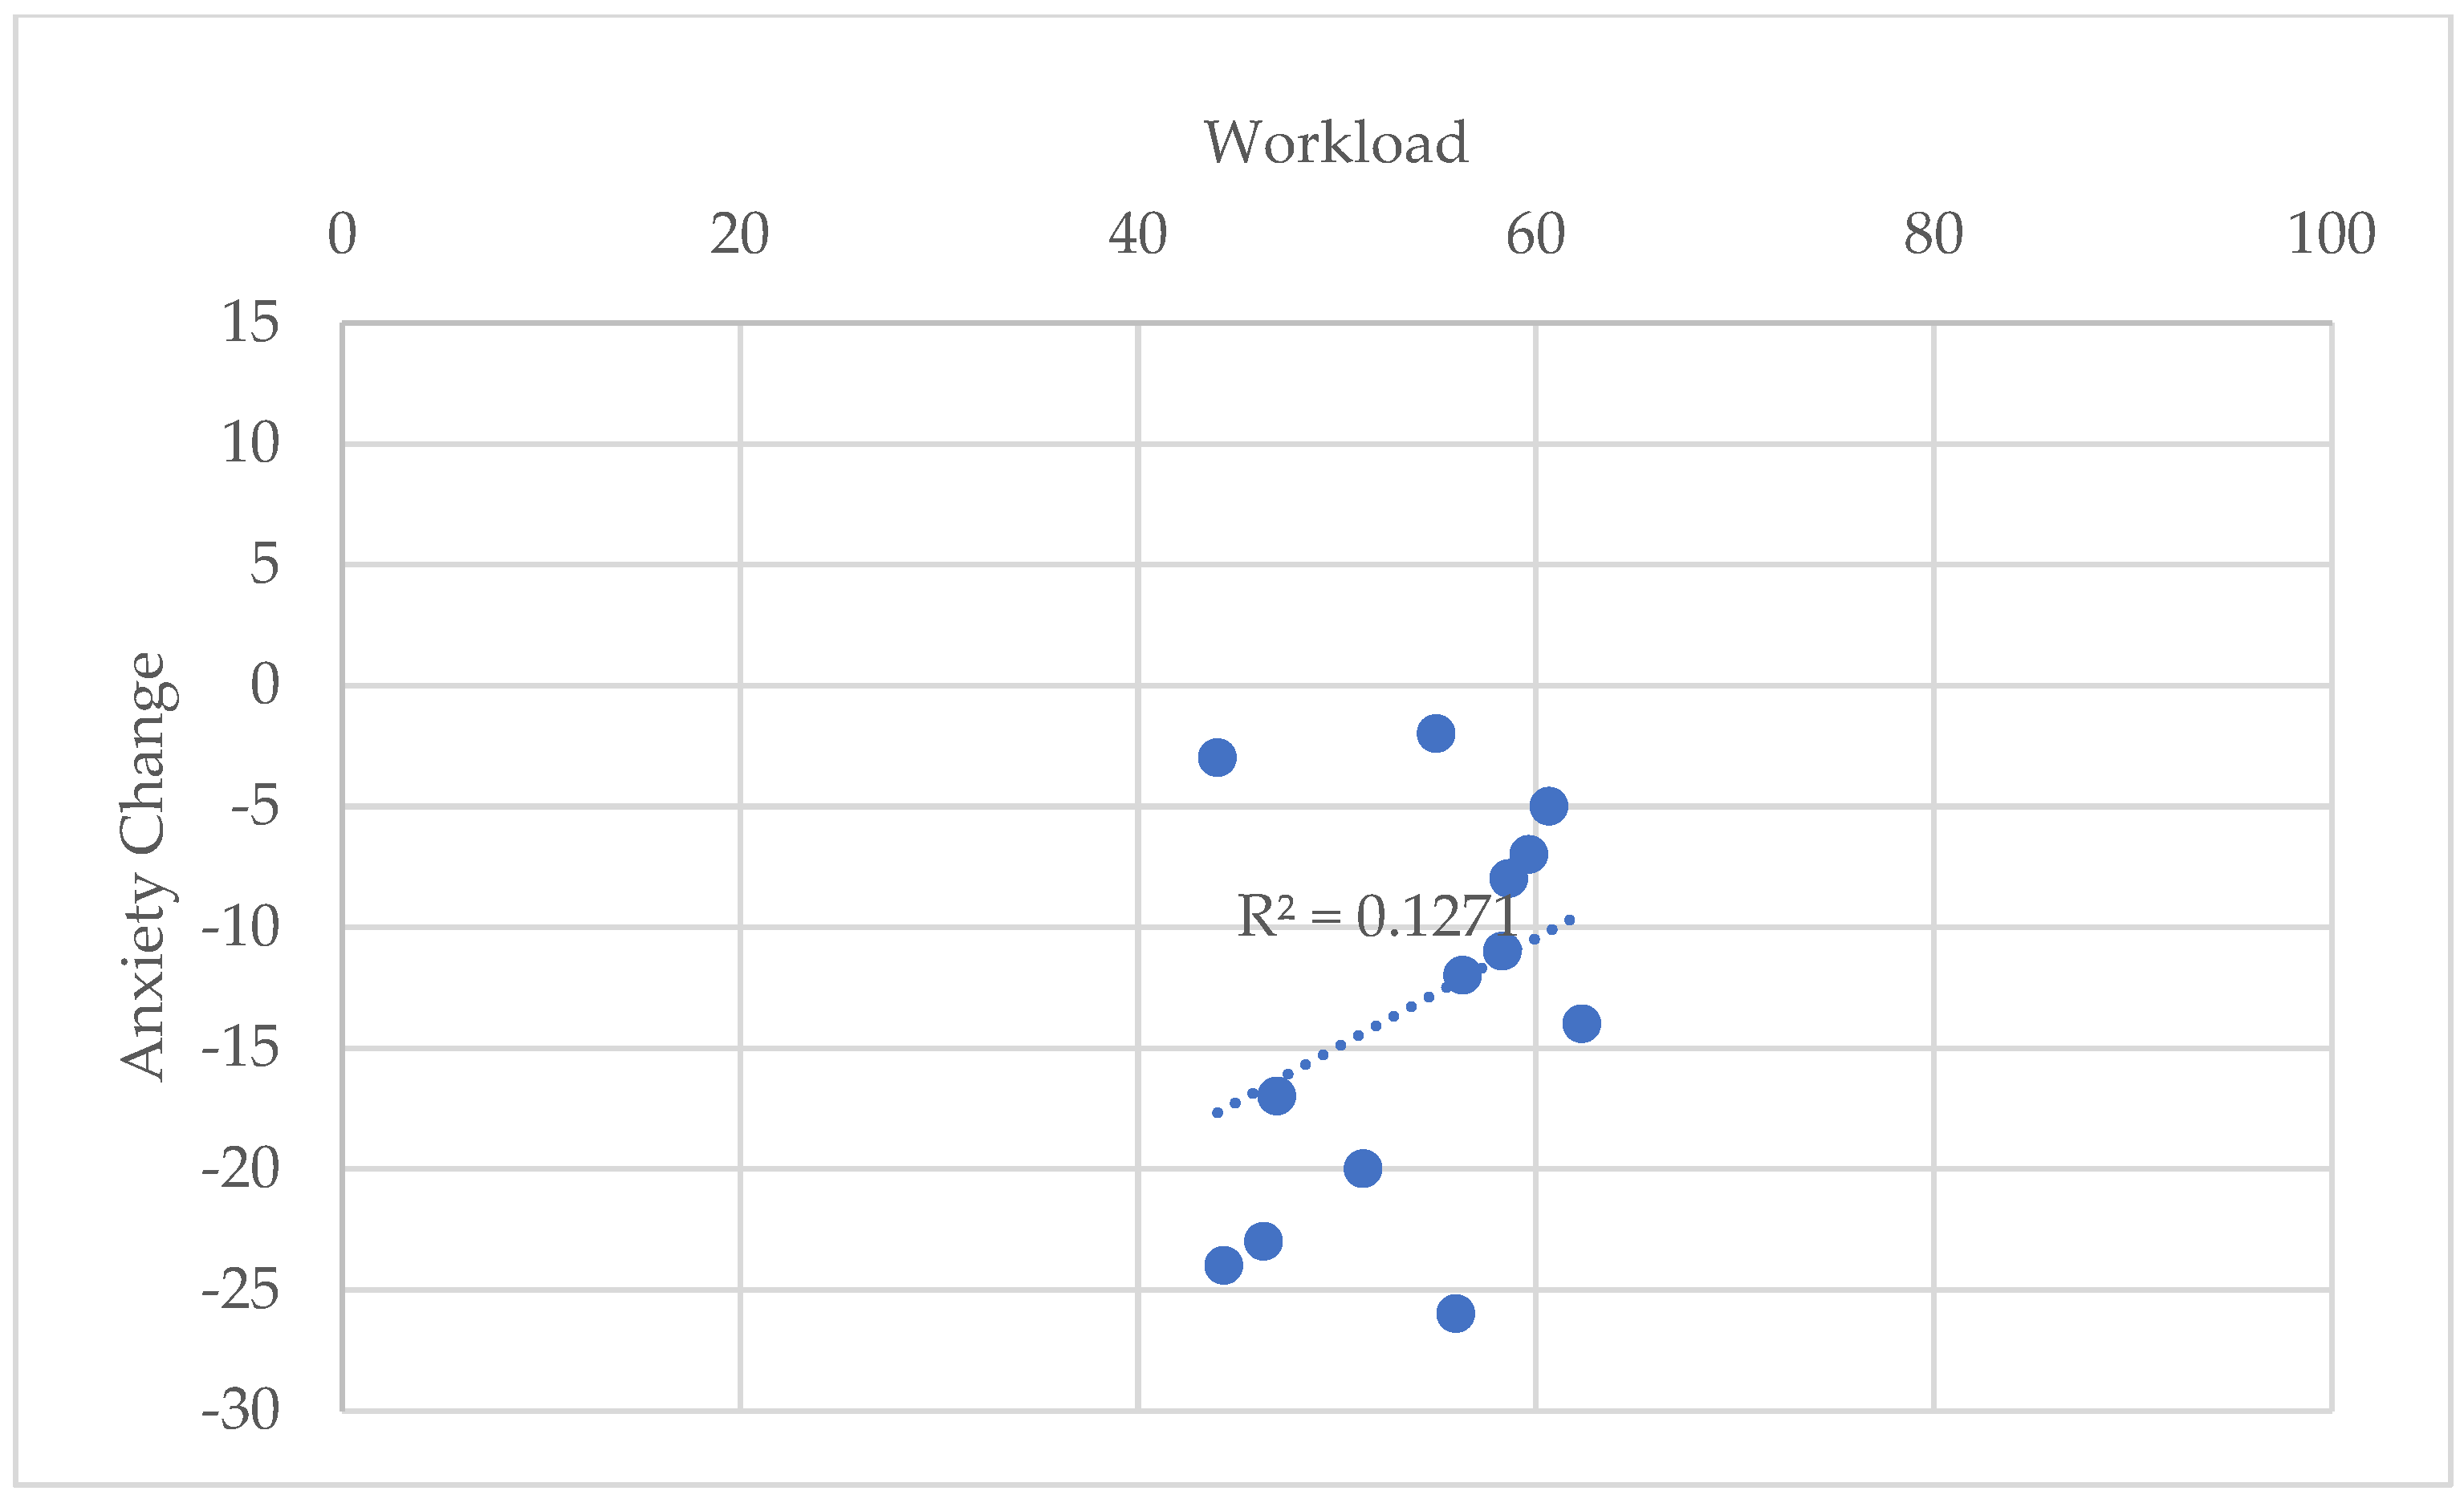
Figure 17.
Workload vs Induced Anxiety for Condition V.
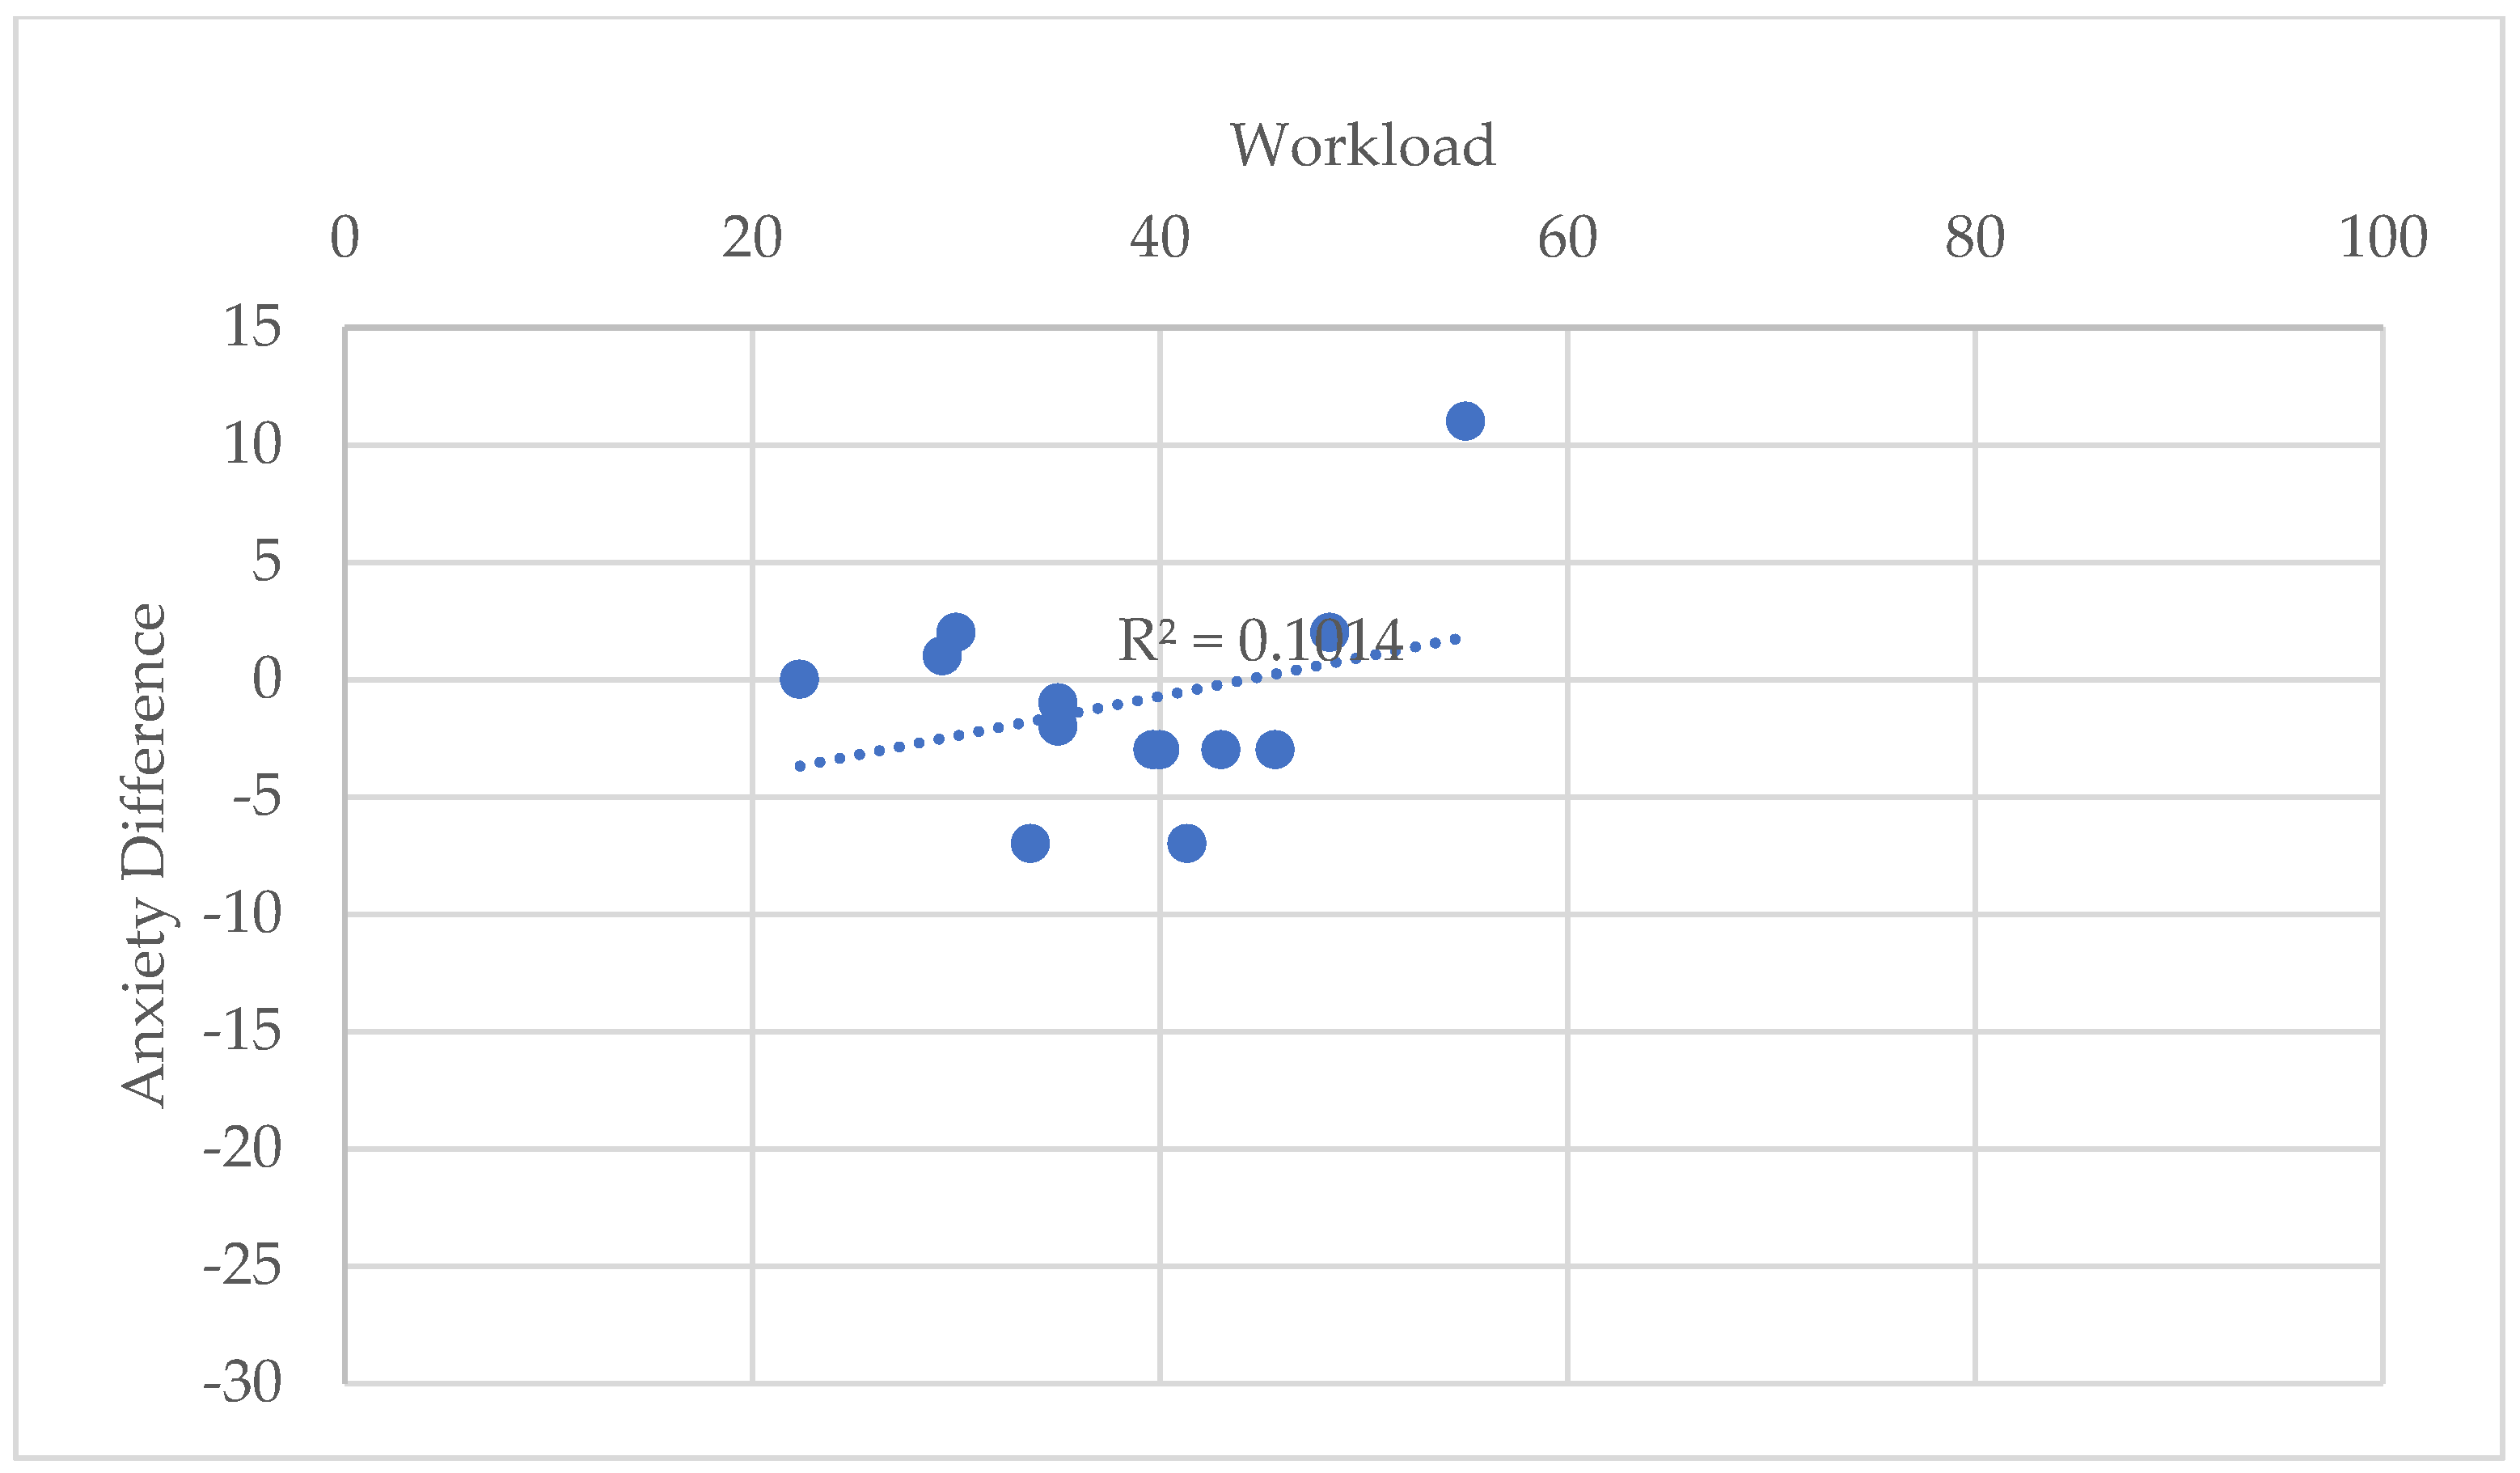
Figure 18.
SA vs Induced Anxiety for Condition R.
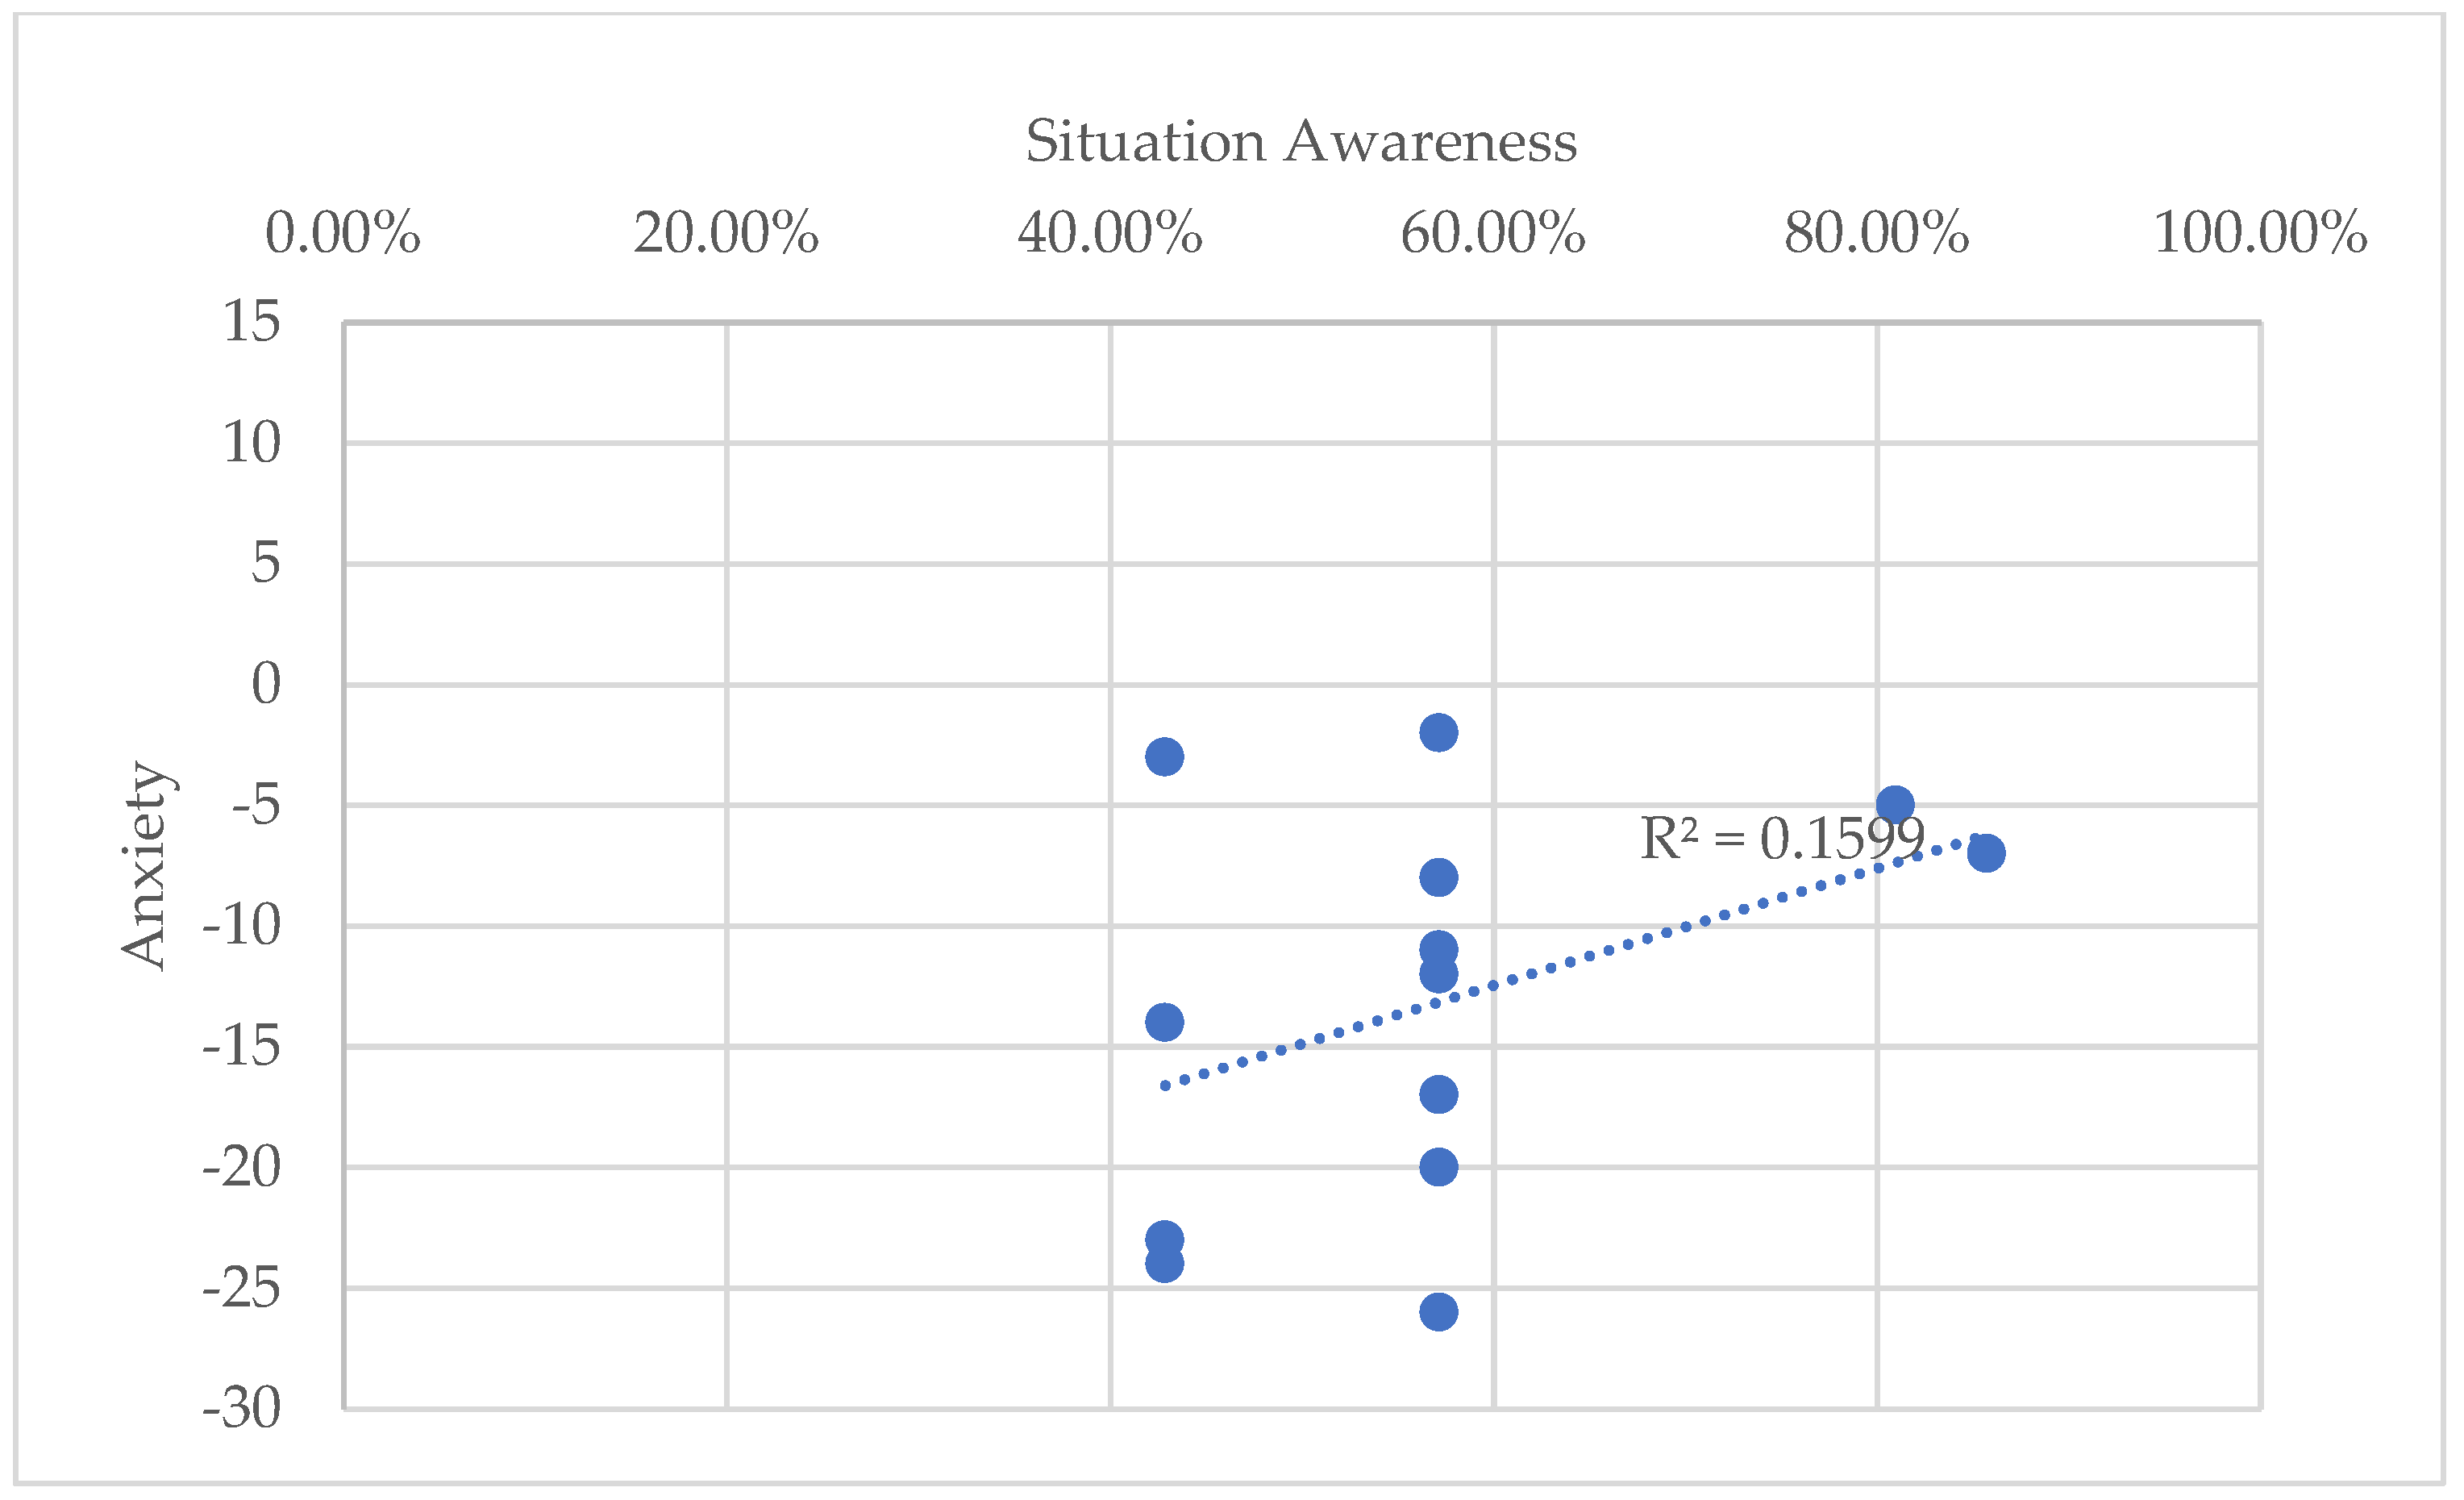
Figure 19.
SA vs Induced Anxiety for Condition R.
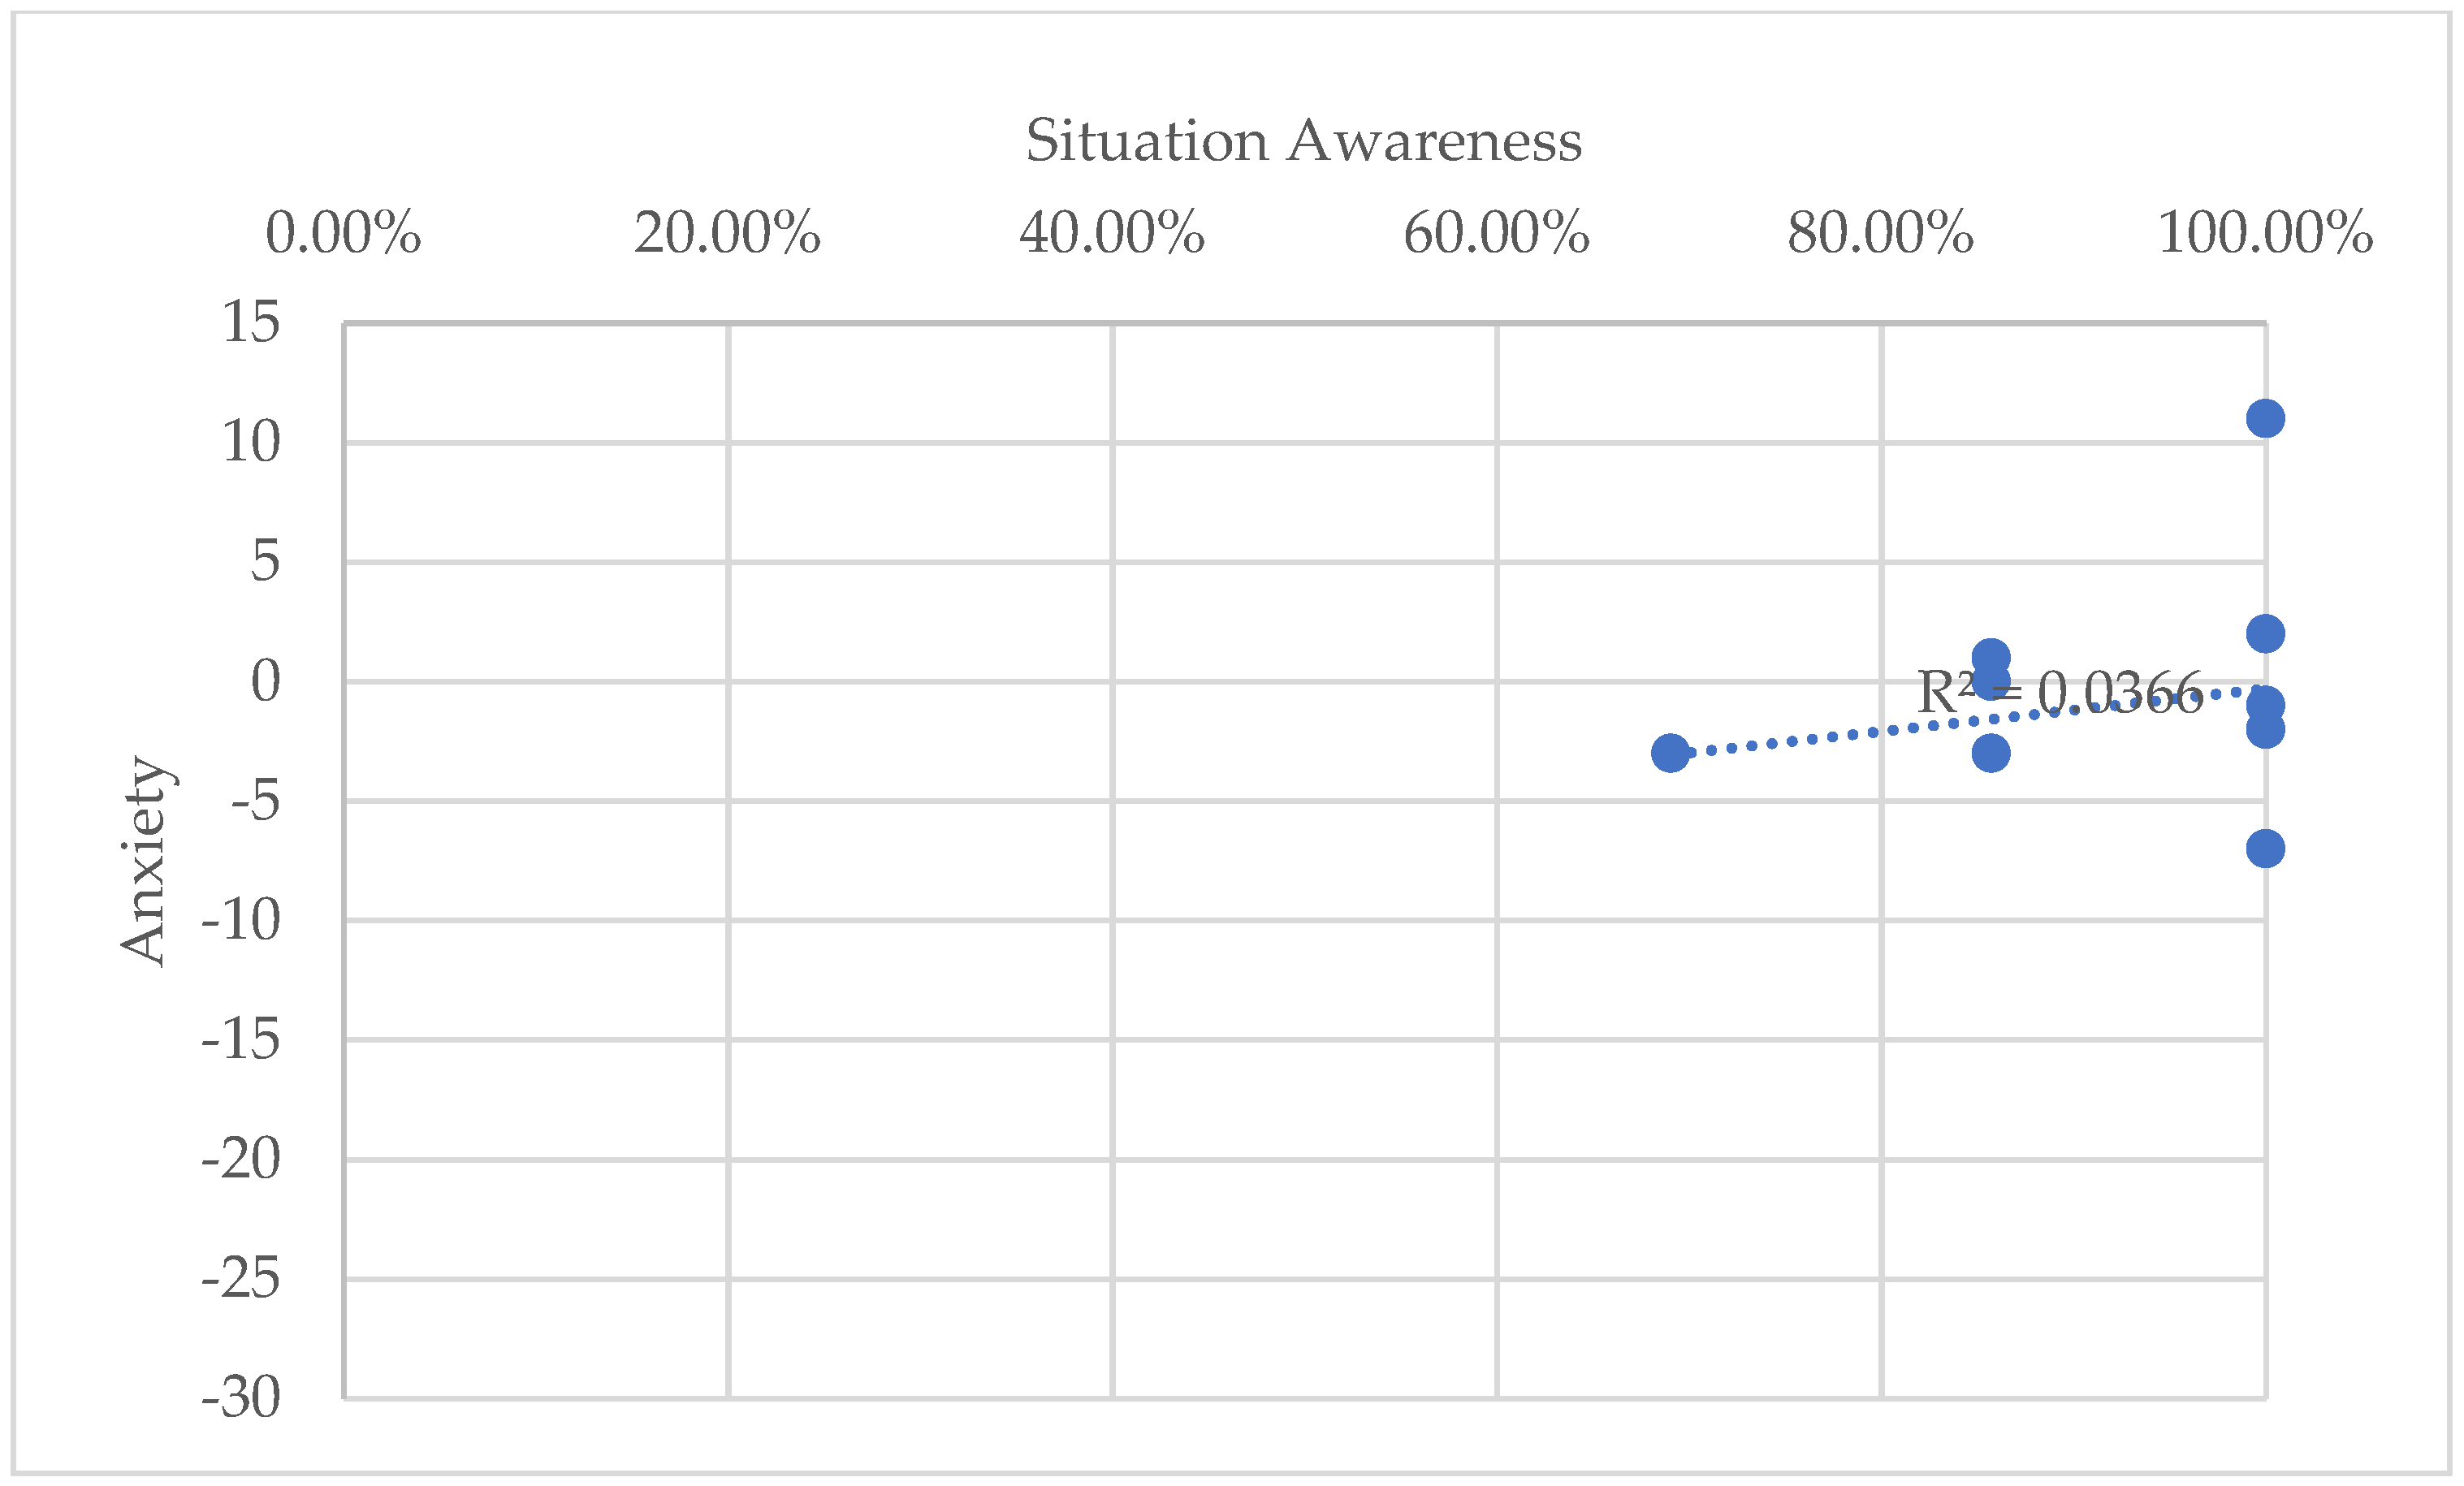

Table 1.
Measurement techniques and materials used to capture each variable of interest.
| Variable of Interest | Measurement technique | Materials |
| Situation awareness | Situation Awareness Global Assessment Technique (SAGAT) [45] | Paper-based area map and questions |
| Workload | NASA Task Load Index (NASA-TLX) [46] | Paper-based NASA-TLX printout |
| Anxiety | State-Trait Anxiety Inventory (STAI) [47] | Paper-based STAI (short form) printout |
| Presence | Igroup Presence Questionnaire (IPQ) [48] | Paper-based IPQ printout |
| Usability | System Usability Survey (SUS) [49] | Paper-based SUS printout |
Table 2.
Experimental hypotheses.
| Hypothesis | |
| H1a | SA will differ between the CAVE and real-world participant groups |
| H1b | Mental, temporal, performance and frustration (NASA-TLX) will differ between the CAVE and real-world participant groups |
| H1c | Participants in the CAVE group will report higher effort workload (NASA-TLX) than participants in the real-world group |
| H1d | Participants in the CAVE group will report lower physical demand (NASA-TLX) than participants in the real-world group |
| H1e | Induced anxiety will differ between the CAVE and real-world participant groups |
| H2a | Weighted workload will be positively correlated with SA within each environment |
| H2b | Induced anxiety will be positively correlated with SA within each environment |
| H2c | Weighted workload will be positively correlated with induced anxiety within the CAVE condition |
| H2d | SA will be positively correlated with the subscales of presence (IPQ) within the CAVE condition |
| H2e | Usability will be negatively correlated with weighted workload within the CAVE condition |
| H2f | Weighted workload will be correlated with the subscales of presence (IPQ) within the CAVE condition |
Table 3.
Planned statistical analyses for each hypothesis.
| Hypothesis | Variable(s) | Condition | Planned analysis |
| H1a | SA | R, V | Mann-Whitney U test |
| H1b | MD, TD, Pe, Fr | R, V | Welch’s independent samples t-test |
| H1c | Ef | R, V | Welch’s independent samples t-test |
| H1d | Pd | R, V | Welch’s independent samples t-test |
| H1e | Induced anxiety | R, V | Welch’s independent samples t-test, paired t-test |
| H2a | SA | R, V | Pearson’s correlation |
| H2b | SA | R, V | Pearson’s correlation |
| H2c | Induced anxiety | V | Pearson’s correlation |
| H2d | EXP, INV, REAL, G | V | Pearson’s correlation |
| H2e | WW | V | Pearson’s correlation |
| H2f | EXP, INV, REAL, G | V | Pearson’s correlation |
Table 4.
Results of Welch’s independent samples t-test for raw workload by subscale.
| Scale | t | df | p | Effect size (Cohen’s d) | Interpretation |
| MD | -7.37 | 24 | p < 0.05 | 2.04 | Significant |
| PD | -9.55 | 22 | p < 0.05 | 2.66 | Significant |
| TD | -4.61 | 23 | p < 0.05 | 1.28 | Significant |
| Pe | 3.05 | 14 | p < 0.05 | 1.16 | Significant |
| Ef | -2.04 | 19 | p > 0.05 | 0.69 | Not significant |
| Fr | -2.36 | 22 | p < 0.05 | 0.79 | Significant |
| WW | 5.14 | 22 | p < 0.05 | 2.02 | Significant |
Table 5.
The results of the IPQ for the sample collected in this study and all projection cases from the IPQ database.
Table 5.
The results of the IPQ for the sample collected in this study and all projection cases from the IPQ database.
| Subscale | Sample (SD) | Single Projection (SD) | Multi-Wall Projection (SD) | Combined Projection (SD) |
| SP | 0.53) | 0.53) | 1.20) | 0.75) |
| INV | 0.60) | 0.56) | 0.90) | 0.74) |
| REAL | 0.70) | 0.47) | 0.76) | 0.57) |
| G | 1.08) | 1.03) | 1.15) | 1.01) |
Table 6.
Results of the one-way independent groups ANOVA for the results of the IPQ.
| Subscale | F(2,17) | p-value | Interpretation |
| SP | 4.22 | 0.032 | Significant |
| INV | 6.90 | 0.006 | Significant |
| REAL | 22.76 | <0.001 | Significant |
| G | 0.24 | 0.786 | Not significant |
Table 7.
Results of the post-hoc pairwise comparison.
| Presence Subscale | Comparison | Mean Difference | p-value | Interpretation |
| SP | Projection | + 0.69 | p < 0.05 | Significant |
| MWP | + 1.05 | p > 0.05 | Not significant | |
| INV | Projection | + 0.66 | p < 0.05 | Significant |
| MWP | + 1.45 | p > 0.05 | Not significant | |
| REAL | Projection | + 1.82 | p < 0.05 | Significant |
| MWP | + 2.23 | p < 0.05 | Significant |
Table 8.
Matrix of Pearson correlation coefficients, r, for Condition V.
| Variable | SP | INV | REAL | G | Usability |
| SA | -0.301 | -0.238 | 0.284 | -0.156 | -0.326 |
| Workload | 0.645 | 0.526 | 0.292 | 0.585 | 0.417 |
| Anxiety | -0.0079 | 0.231 | -0.382 | 0.001 | 0.093 |
| SP | 0.442 | -0.092 | 0.349 | 0.190 | |
| INV | -0.437 | 0.525 | 0.202 | ||
| REAL | 0.587 | -0.030 | |||
| G | 0.307 |
Disclaimer/Publisher’s Note: The statements, opinions and data contained in all publications are solely those of the individual author(s) and contributor(s) and not of MDPI and/or the editor(s). MDPI and/or the editor(s) disclaim responsibility for any injury to people or property resulting from any ideas, methods, instructions or products referred to in the content. |
© 2026 by the authors. Licensee MDPI, Basel, Switzerland. This article is an open access article distributed under the terms and conditions of the Creative Commons Attribution (CC BY) license.
Copyright: This open access article is published under a Creative Commons CC BY 4.0 license, which permit the free download, distribution, and reuse, provided that the author and preprint are cited in any reuse.


