Submitted:
29 December 2025
Posted:
30 December 2025
You are already at the latest version
Abstract
This study draws on socio‑technical transition theory to examine how the dynamic inter-actions among producers, consumers, and the media within an experimental niche—Korea’s regulatory sandbox—shape the speed of policy and regulatory responses to emerging technologies. We construct a longitudinal dataset of 2,136 sandbox approvals between 2019 and 2025 and 1,374 cases in which related legal or administrative adjustments have been completed. Changes in actor couplings before and after sandbox approval are first assessed using Pearson correlation analysis, while temporal lead–lag relationships are identified via vector autoregression (VAR) and Granger causality tests. Determinants of regulatory response speed are then analyzed using ordered logistic regression, incorporating government policy orientation (progressive vs. conservative) as a moderating variable.
The results show, first, that the strong producer–consumer coupling observed prior to sandbox approval weakens afterwards, whereas the consumer–media linkage becomes substantially stronger. Second, the time-series analysis of technologies within the regulatory sandbox reveals a typical technology-push pattern and a self-reinforcing feedback loop. Specifically, producer activity initiates the signal sequence, preceding consumer re-actions; subsequently, media coverage significantly drives consumer engagement, and the resulting increase in consumer attention, in turn, stimulates further media coverage. Third, in the ordered logit model, media activity accelerates legal and regulatory reform, whereas consumer activity acts as a delaying factor, with producer activity showing no significant direct effect. Finally, government policy orientation systematically moderates the magnitude and direction of these effects.
Overall, the study proposes an actor‑centered mechanism in which learning generated in the sandbox is externalized through consumer–media channels and translated into regulatory pacing. Based on these findings, we derive practical implications for firms and regulators regarding proactive media engagement, transparent use of evidence, institutionalized channels for consumer input, and robust feedback standards that support sustainable commercialization of emerging technologies.
Keywords:
socio-technical transitions
; regulatory sandboxes
; multi‑actor dynamics
; dynamic interaction
; policy responsiveness
; regulatory speed
; government policy orientation
1. Introduction
Law and regulation (including conformity assessment and certification) constitute a socio-technical trust infrastructure that enables the market entry and diffusion of new technologies. New products inherently involve quality uncertainty regarding performance, safety and environmental compatibility, and information asymmetries between producers and consumers can discourage technology adoption [1]. To mitigate these problems, third-party certification schemes, standards and labeling systems have been established and are known to function as signals of trust that reduce transaction costs and improve market performance [2,3]. As the pace of technological innovation has accelerated, however, the “pacing problem” has intensified, whereby legal and regulatory systems fail to keep up with technological change [4,5]. This issue is further amplified by the Collingridge dilemma—that regulation is difficult to design in the early stages of a technology but difficult to revise once the technology has matured [6]. In this context, regulatory uncertainty operates as an adoption barrier within the social system [7], and inappropriate regulation can even suppress incremental innovation [8]. These challenges have prompted international organizations such as the World Economic Forum and the OECD to call for future-oriented regulatory innovation and experimental governance tools (e.g., regulatory sandboxes [9,10]). Similarly, studies by the World Bank and financial-sector researchers report that sandboxes support adaptive regulation through policy learning and foster innovation [11,12].
In South Korea, a comprehensive regulatory sandbox system involving multiple ministries was introduced in 2019 to address this technology–regulation gap, and has since operated fast-track confirmation, demonstration exemptions and temporary permit tracks across eight domains, including financial innovation and industrial convergence [13]. By January 2025, the scheme had granted demonstration exemptions to 1,737 innovative projects and completed 372 regulatory adjustments, indicating substantial quantitative achievements [14]. Yet numerous cases still experience commercialization delays because relevant standards, testing methods and certification schemes are not in place even after sandbox experiments are completed [11,13]. This reflects the long-standing “positive” regulatory tradition in Korea, under which only what is explicitly allowed by law is permitted. As a result, convergent technology services often face regulatory vacuums at market entry [15]. Firms consequently tend to view social and non-technical regulations as barriers to innovation while perceiving technical regulation as a mechanism that can stimulate innovation [16]. International research similarly shows that even stringent regulation can trigger disruptive innovation when regulatory uncertainty is low [17]. Together, these findings reinforce arguments that securing both objectivity and flexibility in regulatory design is essential for closing the gap between technological and institutional change [5,18].
This awareness of the problem can be framed within the perspective of socio-technical system (STS) transition theory. From an STS viewpoint, laws and institutions constitute a core set of rules that sustain a given technological regime and thus exert a structural influence on the pathway and speed of technological innovation [19,20]. Social acceptance of new technologies emerges through co-evolutionary processes in which technologies, norms, standards, and ethics evolve together [21,22]. Regulation therefore not only stabilizes existing systems but also operates as a key parameter that determines the pace of transitions when new technologies appear [20,23]. Nevertheless, prior research on regulatory sandboxes has largely focused on the effects of introducing specific schemes or on firm-level outcomes [24], paying relatively little attention to how dynamic interactions among diverse actors during technology diffusion are linked to the speed of regulatory response. Studies on expectations and actor interactions in science and technology highlight the importance of social discourse and expectation formation for technological transitions [25], but quantitative analyses that combine these insights with actual operational data from regulatory sandboxes remain scarce.
To address this gap, the present study conducts an empirical analysis of all regulatory sandbox approvals implemented in Korea between 2019 and 2025, examining the relationship—viewed through a socio-technical transition lens—between the dynamic interactions of producers (firms), consumers (the public), and the media (press) and the speed of legal and institutional adjustment (policy and regulatory responsiveness). Specifically, we investigate how patterns of coupling among actors are reorganized before and after sandbox approval. We then examine what kinds of temporal lead–lag and causal structures appear in the time series, and whether these actor signals accelerate or delay the pace at which laws and administrative measures are updated for sandbox-tested emerging technologies. In addition, we include government policy orientation (conservative vs. progressive) as a moderating variable to clarify how identical actor signals are interpreted and reflected differently depending on the political–institutional context—that is, to uncover the ideologically conditioned structure of policy responsiveness. Through this analysis, the study proposes a mechanism whereby learning and signals generated within the regulatory sandbox as an experimental niche circulate back to regime-level regulatory change via media and consumer channels. It also derives theoretical and policy implications for the design and operation of the Korean regulatory sandbox and for building a sustainable innovation ecosystem.
2. Theoretical Background and Hypothesis Development
2.1. Static and Dynamic Characteristics of Relationships among Actors
In the market entry and diffusion process of emerging technologies, the interaction patterns among various actors —such as producers (firms), consumers (the public), and the media (press)— exhibit inherently dynamic characteristics over time. In the early stages of innovation, the development and promotion of new technologies are typically driven by producers, while consumer interest and participation tend to remain relatively limited. However, once a specific event, performance outcome, or controversy is triggered, related media coverage can surge, public attention can expand rapidly, and social opinion evolves through distinct temporal cycles. These cyclical changes cannot be fully explained by improvements in technical performance alone; rather, they should be understood as the outcome of discursive processes in which social expectations, media framing, and public interpretation interact. For example, Gamson and Modigliani [26] and Hilgartner and Bosk [27] argue that media discourse on technology issues plays a crucial role in shaping both the direction and intensity of public opinion. In other words, the way the media frames issues and provides information can significantly influence how the public perceives and accepts new technologies [26,27,28].
From the perspective of socio-technical system (STS) transition theory, such multi-actor interactions are regarded as central analytical elements. The development of emerging technologies is depicted as a co-evolutionary process in which producers, consumers, policymakers, and the media continuously adjust their mutual expectations. Initially, technology development and diffusion tend to be dominated by producers (suppliers), but over time, the influence of consumers (demand side) and the media grows in importance. Borup et al. [25], in their sociological analysis of societal expectations toward future technologies and the dynamic interactions among diverse actors, emphasize that producer-led activities are prominent in the early diffusion stage, whereas consumers and the media gradually gain influence in subsequent phases.
Empirical studies employing dynamic analyses of actor networks in science and technology fields also show that interaction structures among actors are substantially reorganized over time [29].
In particular, the widespread adoption of social media has transformed consumers from passive recipients of information into active participants who create, share, and reproduce content, thereby giving rise to new forms of media–user interaction that go beyond the traditional one-way “press-to-public” model. As demonstrated by Rony et al. [30], Pentina and Tarafdar [31], and Shaw [32], users on digital platforms and social networking services directly contribute to information diffusion and opinion formation, reshaping the influence landscape of legacy mass media.
Recent work in sustainability research similarly highlights that online public discourse and social media engagement can shape organizational behavior, risk perception, and regulatory attention in areas such as safety management and environmental performance [33].
Taken together, these discussions suggest that even in the experimental niche environment of a regulatory sandbox (where new technologies are tested and demonstrated), the static correlation structure of relationships among actors is likely to change, and the patterns of dynamic causality among them are also likely to shift. That is, when comparing the pre-sandbox period (regime phase) with the post-sandbox period (niche phase), the coupling relationships among producers, consumers, and the media may differ significantly. To test this expectation, the present study empirically analyzes changes in correlation patterns among indicators of actor activities before and after sandbox approval. Accordingly, we formulate the following hypothesis (H1):
H1.
The pattern of interrelationships among actors (producers, consumers, and the media) will differ significantly before and after the approval of emerging technologies in the regulatory sandbox.
2.2. Actors and the Speed of Regulatory Response
The speed of policy and regulatory response to emerging technologies (i.e., the speed of legal and institutional adjustment) can be influenced by the activities of various actors. In particular, for the period between the completion of sandbox experimentation and the subsequent legal revision, we need to examine from a theoretical standpoint the roles of producers, consumers, and the media as key determinants. In what follows, we review the mechanisms discussed in prior research for each actor and, based on these insights, derive specific hypotheses for the present study.
First, prior research on the role of producers (firms) indicates that companies, as central agents of innovation, can play a decisive role in promoting regulatory change. As firms pursue the commercialization of new technologies, they may exert pressure on regulators through proactive actions such as industry lobbying, standard-setting, and self-regulatory initiatives. Trittin-Ulbrich and Böckel [34] show that firms can act as institutional or policy entrepreneurs, driving institutional change in the direction of responsible innovation. Korean studies similarly report that corporate behavior, through the interaction between technological development and institutional change, can shape innovation outcomes [35,36]. Walters and Wiseman [37] argue that in emerging industries, firm-led self-regulation and sectoral standardization reduce information asymmetry and uncertainty on the part of regulators, thereby enabling more rapid adjustment of laws and technical standards. Likewise, Scherrer [38] emphasizes that firms, as political actors, can significantly influence the direction as well as the speed of legal and institutional change by engaging in co-regulation, responsible lobbying, and industry standard-setting.
Recent sustainability research also suggests that firms’ strategic responses to environmental regulation—such as voluntary standards and green innovation practices—can anticipate and shape future regulatory frameworks, reinforcing the co-evolution between corporate strategy and regulatory design [39,40]. Taken together, these insights imply that proactive producer activity can function as a driver that enhances government policy responsiveness. Accordingly, we formulate the following hypothesis (H2):
H2.
A higher level of producer activity has a positive (+) effect on the speed of legal and institutional refinement for emerging technologies, thereby accelerating regulatory responses.
Second, the role of consumers (the public) has become increasingly important in shaping both the social acceptance of technology and the pressure for regulatory change. According to Rogers’ [7] diffusion of innovations theory, the spread of consumer participation through social networks can strengthen institutional pressure and create momentum for change. In other words, as early adopters’ reactions diffuse and user communities expand, the perceived need for new institutional adaptation gains broader social support. Vargo et al. [41] show that shifts in consumers’ value perceptions and their active engagement can trigger adaptive institutional change, thereby increasing the flexibility of regulatory systems. Aghion et al. [8] further suggest that overly stringent regulation that undermines user benefits can dampen innovation and consumer welfare, in turn prompting demands for regulatory reform.
Korean policy studies likewise highlight that user participation and demands are critical drivers of innovation-led growth [42], and that in the context of convergent new technologies, changes in consumer perceptions and active articulation of opinions function as key variables that promote institutional change [43].
In the sustainability domain, participatory and user-driven approaches are increasingly recognized as essential for aligning technological trajectories with societal values and for legitimizing regulatory reforms [33]. These discussions all suggest that vigorous activity within consumer groups can ultimately spur governments to adjust regulations to better fit new technologies. We therefore propose the following hypothesis (H3):
H3.
A higher level of consumer activity has a positive (+) effect on the speed of legal and institutional refinement for emerging technologies, thereby accelerating regulatory responses.
Third, the role of the media is recognized as a critical factor that influences the behavior of policymakers through its agenda-setting function and the mobilization of public opinion. According to the work by McCombs and Shaw [44], when mass media extensively covers specific issues, the likelihood of policymakers adopting them as agenda items increases. Furthermore, such media attention acts as a mechanism that triggers citizens’ awareness of issues and their political engagement [45].
Birkland [46] argues that media coverage of incidents or issues related to new technologies can function as a focusing event that catalyzes institutional reform. Empirically, sustained media attention has been found to accelerate institutional improvements related to emerging technologies, and from the standpoint of legislatures and regulatory agencies, issues that have gained high public visibility through media coverage become increasingly difficult to ignore [47]. At the same time, Wolfe [48] points out that excessive media coverage can produce fatigue among both the public and policymakers, potentially delaying policy change and indicating that media effects may be non-linear. Despite this, many studies have shown that consistent media attention and issue framing generally elevate policymakers’ awareness and act to increase the speed of response [47,49]. And Nam et al. [49] empirically demonstrate that the intensity of media coverage and the repeated framing of issues in terms of conflict dynamics can shape the perceptions of legislators and induce more rapid policy responses. Synthesizing these findings, we view the volume and tone of media coverage on emerging technologies as key variables that can influence the speed of governmental regulatory response. Accordingly, we present the following hypothesis (H4):
H4.
A higher level of media activity has a positive (+) effect on the speed of legal and institutional refinement for emerging technologies, thereby accelerating regulatory responses.
2.3. Moderating Effects of Government Policy Orientation
In the regulatory response process for emerging technologies, the government’s policy orientation (progressive vs. conservative) can serve as a key contextual factor that conditions how actor activities influence regulatory agencies. Prior work shows that governments and ruling parties with different ideological preferences exhibit distinct levels of responsiveness to the same external pressures. For example, an analysis of Belgian parliamentary data finds that the agenda-setting impact of media coverage varies with the characteristics and ideological leaning of governing parties, such that the degree to which media issues are translated into policy depends on who holds power [50].
Tsebelis’ veto player theory further suggests that institutional change slows as the number of veto players increases and ideological distance among them widens, because intense ideological conflict and a larger set of actors in the decision-making process make rapid legal or regulatory reform difficult even when strong signals from external stakeholders exist [51]. Empirical studies of EU legislation using survival analysis similarly show that institutional procedures, political conflict, and ideological configurations significantly affect the time required for policy adoption, while policy complexity and long stakeholder-consultation procedures further lengthen legislative duration [52,53].
In the Korean context, research has shown that interaction patterns among the president, the legislature, the media, and the public differ across administrations [54]. This implies that the pathways through which actor activities are converted into policy vary with the prevailing political environment, which provides a theoretical rationale for treating government policy orientation as a moderating variable in this study.
Building on these arguments, this study analyzes regulatory sandbox cases implemented since 2019 to test whether regulatory responsiveness differs by the ideological orientation of the government. During the 2019–2025 period in Korea, progressive and conservative governments alternated in power, creating an opportunity to examine how the effects of signals from producers, consumers, and the media vary across governments.
In general, progressive governments tend to emphasize consumer protection, social values, and risk management, whereas conservative governments place greater weight on economic growth and corporate vitality. Consequently, the type of actor signals that elicit the strongest response from regulators is likely to differ by government ideology. We expect these differences to result in systematic variation in the speed of follow-up measures after sandbox experimentation. On this basis, we formulate the following moderating-effect hypothesis (H5):
H5.
The influence of actors on the speed of regulatory responses varies depending on the government's policy orientation (progressive/conservative); that is, policy orientation moderates the effect of actor signals.
The five hypotheses derived above (H1–H5) are tested in the subsequent empirical analysis. Through this hypothesis testing, the study seeks to elucidate the mechanisms by which the dynamic interactions among actors during socio-technical transitions are linked to policy and institutional change, as well as to identify how regulatory responsiveness varies with the broader political and policy context.
3. Materials and Methods
3.1. Research Model
This study proposes the research model shown in Figure 1 to comprehensively examine how actor activities —those of producers (firms), consumers (the public), and the media (press)— interact with legal and institutional responses within the experimental niche environment of regulatory sandboxes. Each actor’s activity is operationalized as a technology-specific indicator, and we trace how these indicators influence one another over time. To assess how such multi-actor dynamics ultimately affect the speed of governmental legal and institutional responses, the model is structured to first analyze static relationships (correlation structures) among actor indicators, then identify dynamic causal linkages (time-lagged influence paths), and finally determine the factors that shape regulatory response speed, while explicitly incorporating government policy orientation (progressive vs. conservative) as a key moderating variable.
Following this research model, the empirical analysis proceeds in three major steps. First, we conduct a correlation analysis on multivariate time-series data to identify the static relationships among actor indicators. Second, we estimate a vector autoregression (VAR) model and perform Granger causality tests to uncover dynamic influence pathways that account for time lags among actors. Third, we apply ordered logistic regression to analyze the determinants of the speed of legal and institutional responses and to test the moderating effects of government policy orientation. Through these steps, we provide an integrated explanation of how changes in multi-actor signals generated in the regulatory sandbox niche translate into variation in the pacing of policy and regulatory responses.
3.2. Definition and Measurement of Variables
Table 1 summarizes the key variables used in this study and the way each is operationalized. In the paragraphs that follow, we provide more detailed explanations of the measurement indicators, data processing procedures, and theoretical rationale for each variable.
First, the dependent variable, Regulatory Response Speed, represents how quickly government regulation responded to the emergence of a new technology or to requests from industry. More specifically, for each technology we measured the elapsed time from the point at which it was approved in the regulatory sandbox —through rapid confirmation, special exemption, or temporary permits— until the relevant laws or regulations were enacted or revised. This measure was then discretized and treated as a five-level ordinal variable: cases in which legal or institutional changes were completed within 6 months were coded as 5, those completed in 6–12 months as 4, 12–24 months as 3, 24–36 months as 2, and those taking more than 36 months or remaining unrevised as 1.
The reason for converting a continuous time measure into an interval-based categorical one is that the impact of policy response time is not expected to increase linearly with every additional day or month, but rather to exhibit threshold-like properties. In other words, what matters is whether the response occurs within a certain window; being a few days or months faster within the same time band may not make a substantive difference in policy effectiveness once a threshold has been crossed.
As noted by Dedehayir & Steinert [55], multiple actors enter the innovation ecosystem sequentially in its early formation, and regulatory agencies generally appear as lagging actors that respond only after technological development and diffusion have reached a certain level. Reflecting this characteristic, it is analytically useful to interpret policy response speed in qualitatively distinct categories—such as “fast” versus “slow” responses—rather than as a purely continuous measure. By using an ordinal scale, we can capture administrative promptness in a stepwise fashion, which facilitates intuitive interpretation of regulatory agility vis-a-vis technological change and supports the analysis of its relationships with other variables
Second, the independent variable for producers (firms) is measured as the absolute number of patent applications filed in the relevant technological field, which serves as an indicator of the scale of technological innovation activity. This measure directly reflects the intensity of research and development efforts invested in the given technology domain. Prior studies have also used patent counts to capture the level of producers’ innovation activities; for example, Jun [56] examined hybrid vehicles and measured producers’ technological responses using patent data.
Treating the producer variable as an intensity indicator allows us to capture both the cumulative effects of technological progress and temporal variation in activity levels. In many technology fields, patent applications tend to follow an S-shaped pattern over the technology life cycle: the number of patents increases only gradually at first, then surges sharply as adoption accelerates, and finally slows down again as the technology matures. Thus, using patent counts as an intensity indicator provides an intuitive measure of producers’ activity over time.
Third, the independent variable for consumers (the public) is used as an indicator of changes in user base and perceptions. In this study, we employ the search volume index provided by Naver Data Lab, which normalizes the frequency of a given search term to a relative value between 0 and 100. Normalizing search volume data are useful because it controls for changes in overall search activity over time and differences in baseline popularity across keywords, thereby making relative changes in interest for the focal technology more clearly visible. Put differently, the normalized search index shows how much attention a particular technology receives at a given point in time relative to the overall search volume, making it possible to identify how much public interest rises above or falls below its usual level. In practice, Jun [56] used web search traffic to explain the spikes and declines in user interest along Gartner’s hype cycle, showing that Google search indices can reveal hype-cycle patterns in which interest rapidly increases and then decreases.
On the other hand, Dedehayir & Steinert [55] point out that not all emerging technologies follow such a canonical hype cycle and that search behavior may incorporate temporary fads or non-rational elements. Nonetheless, search volume remains a useful indicator that reflects changes in public attention in near real time and thus provides meaningful insight into the evolving level of social expectations surrounding a technology.
Fourth, the independent variable for media (press) is designed to capture the extent to which a specific emerging-technology issue rises to the level of a public agenda, and is measured in terms of coverage intensity. Concretely, we aggregate the monthly number of news articles containing the relevant technology keywords using the BigKinds database of the Korea Press Foundation. We adopt an intensity measure for the media variable because the sheer volume of press coverage exerts tangible pressure on policymakers’ attention and processing speed, consistent with the agenda-setting mechanism of the mass media [44].
In particular, concentrated coverage and focusing events—such as accidents or major incidents—have been shown to trigger and accelerate regulatory reform [46]. At the same time, excessive coverage may generate policy fatigue and delay decision-making, suggesting the possibility of non-linear effects [48]. By using an intensity-based indicator, we secure the stability and comparability of the media variable while leaving room for such non-linear relationships to be explored in the empirical analysis.
Fifth, the moderating variable government policy orientation (progressive vs. conservative) reflects the idea that, even under the same external activities by producers, consumers, and the media, the slope and speed of policy responses may differ according to the ideological stance and institutional context of the incumbent government. We code the government in each month of the analysis period as a dummy variable (conservative = 0, progressive = 1) and include this variable in the model along with interaction terms between each actor variable and policy orientation to estimate moderating effects.
This setup allows us to examine, for example, whether producer activity (patent intensity) exerts a stronger influence on the pace of deregulation and institutional adjustment under conservative governments, whereas consumer and society-level activities (search volumes, public opinion) carry greater weight under progressive governments. In reality, the strength with which media agendas translate into policy change is known to interact with the broader political context [50], and institutional variables such as the number of veto players and ideological distances among them are known to impose structural constraints on the speed of legislative and regulatory change [51].
Accordingly, the moderation terms in this study help verify whether the effects of actor activities on the speed of legal and institutional adjustments are amplified or attenuated by government policy orientation, thereby shedding light on the contextual responsiveness of follow-up regulatory adjustments after sandbox experiments.
3.3. Analytical Sample and Data Collection
The empirical analysis in this study covers a total of 2,136 emerging-technology projects that received regulatory sandbox approval in Korea between the introduction of the scheme in 2019 and August 2025. These projects are classified into eight domains—ICT convergence, industrial convergence, financial innovation, regulation-free special zones, smart-city, R&D special zones, mobility, and circular economy—and all involve cases in which regulatory exemptions (rapid confirmation, special exemption, or temporary permits) were granted for emerging technologies.
Overall information on the status of the sandbox program and basic project-level metadata—such as firm name, lead ministry, responsible regulatory authority, type of exemption, main content, and additional conditions (i.e., core identifiers of each technology)—were obtained from public data on the Regulatory Sandbox Integrated Portal (www.sandbox.go.kr) operated by the Office for Government Policy Coordination. Based on this metadata, we extracted core terms from project titles and descriptions and reconstructed them as “collection keywords.” These keywords were then applied consistently across data sources for producers (patent trends), consumers (search trends), and media (news trends), thereby creating a coherent mapping of actor activities at the project level.
The resulting dataset was organized as a monthly time series spanning three years prior to and two years after each project’s regulatory sandbox approval (a total of five years, or 60 months). This structure enables quantitative tracking of dynamic changes in producer, consumer, and media activities before and after sandbox approval. The multi-layered configuration of the data provides a solid foundation for comprehensively analyzing how the socio-technical environment surrounding the introduction of innovative technologies is reorganized, from the perspective of economic and business sustainability.
From the producer side, we analyze the number of domestic patent applications filed by the firms participating in each project as an indicator of innovation activity. Patent counts are widely used as a representative quantitative measure of firms’ technological efforts and innovation outcomes [58,59]. Accordingly, we use the Korean Intellectual Property Office’s patent information system KIPRIS (www.kipris.or.kr) to extract, for each lead firm, the monthly number of domestic patent applications. Variations in monthly patent filings at the firm level provide a meaningful indicator of the intensity of technological innovation activities and thus serve as a key measure of producer-side innovation. This approach follows the logic of earlier studies that employed patent data as a proxy for innovation performance, and reflects the longstanding recognition of patent-based indicators as reliable measures of firms’ innovative activity [58,59].
To capture consumer-side activity, we utilize Naver’s big-data search platform, Naver DataLab (datalab.naver.com). Using the technology- and firm-specific keywords defined earlier, we query the integrated search trend service of Naver DataLab and collect the time-series of search volume indices associated with each project. This allows us to measure how online interest among general consumers in a given new technology evolves over time. The search volume index expresses the frequency of searches for a particular keyword as a relative value between 0 and 100, normalized such that the maximum search volume in the specified period corresponds to 100.
Online search frequency data have been widely used in prior research as a useful tool for tracking consumer interest and demand trends [60,61]. In particular, web search trend data have been shown to be effective indicators for monitoring and forecasting the diffusion of new technologies and products [61]. Therefore, in this study, we adopt the search volume index as a core measure of consumer-side activity that captures changes in public interest and the degree of diffusion around sandbox-approved technologies over time.
To examine media-side discourse dynamics and societal attention, we draw on the BigKinds news big-data analysis system operated by the Korea Press Foundation (BigKinds, www.bigkinds.or.kr). Using the same set of keywords defined above, we search for news articles in major daily newspapers and online outlets that mention the relevant technology or firm names and aggregate the number of such articles by month. Monthly article counts serve as a representative indicator of media attention and the intensity of social discourse surrounding the issue or technology.
To capture dynamics and public salience on the media side, we used the BigKinds news big-data analytics system operated by the Korea Press Foundation (BigKinds, www.bigkinds.or.kr). Applying the same keywords defined above, we retrieved articles from major daily newspapers and online outlets that mentioned the focal technologies or firm names and aggregated the number of such articles per month, treating this monthly article count as an indicator of media attention and the intensity of public debate.
Classic agenda-setting research shows that higher frequencies of news coverage increase the likelihood that citizens view an issue as important [44], and broad media exposure to novel technologies can shape public awareness and attitudes [62]; accordingly, we adopted the volume of technology-specific news coverage as our measure of media activity and analyzed how this media salience changed before and after regulatory sandbox approval.
Finally, the moderating variable, government policy orientation (conservative vs. progressive), is coded using political and administrative statistics from the national statistical portal, KOSIS (www.kosis.kr). For the entire study period, we assign a dummy value of 1 to months under a progressive government and 0 to months under a conservative government.
3.4. Analysis Procedure and Details
Figure 2 presents the sequence of analytical procedures used in this study. Each step and its associated methods are described in detail below.
Step 1. Selection of emerging-technology keywords in regulatory sandboxes
In Step 1, we constructed the set of collection keywords for each regulatory sandbox project. For all 2,136 emerging-technology projects approved under the regulatory sandbox between 2019 and August 2025, we used project-level basic metadata—such as project title, main content, and additional conditions—to extract core terms. Specifically, following the morphological analysis technique used in Kim et al. [63], we applied a morpheme analyzer to the Korean project descriptions, extracted the main noun and compound noun phrases, and then reconstructed them into a set of core labels. These labels were refined and designated as the project’s collection keywords, which subsequently served as common identifiers across all data sources.
Step 2. Data collection for each variable
In Step 2, we collected the indicators of actor activities and the regulatory response indicator for each sandbox case.
First, as an indicator of producer activity, we used the number of patent applications filed by firms active in the relevant technology field. Patent data were obtained from KIPRIS, the Korean patent information search service, and monthly patent application counts were aggregated for each project from 36 months before to 24 months after sandbox approval.
Second, as a consumer activity indicator, we captured public interest in each emerging technology using online search trends. For this purpose, we employed Naver DataLab’s search-trend service (Naver DataLab), extracting the search volume of each project’s main keywords over the same window (36 months before to 24 months after approval).
Third, as a media activity indicator, we used the frequency of news coverage about each technology. Using the BigKinds news database operated by the Korea Press Foundation, we searched article counts by project keyword and collected the monthly number of articles over the identical period (36 months before to 24 months after approval).
Finally, the regulatory response indicator was constructed based on the speed of legal and institutional adjustments after sandbox experimentation. Using government press releases and official documents, we calculated, for each case, the time elapsed from sandbox approval to the completion of relevant legal or standard-setting measures (e.g., legislative amendments, revisions of subordinate regulations, or adjustments of technical standards). The elapsed time was then categorized into an ordinal dependent variable: projects with revisions completed within 6 months were coded as 5; those completed in 6–12 months as 4; 12–24 months as 3; 24–36 months as 2; and those taking more than 36 months or remaining unrevised as 1.
In addition, to control for the political environment that may influence regulatory response speed, we extracted information on the government’s policy orientation (progressive vs. conservative) for each period from the national statistical portal (KOSIS) and election results, and merged these data into the dataset. By combining information on producer, consumer, and media activities with indicators of institutional response, we thus constructed a multi-actor, multi-layer dataset that enables empirical analysis of the linkages between dynamic actor interactions and regulatory responses within the socio-technical system.
Step 3. Preprocessing of variables
In Step 3, the collected multivariate time-series data were preprocessed to make them suitable for analysis. Because the units and magnitudes of the actor activity indicators differ across variables, we first applied normalization to enhance comparability.
The search volume index from Naver DataLab is already reported as a relative measure (0–100), where the maximum search volume within the specified period is normalized to 100. We converted this index into a monthly intensity measure of public interest. For patent applications and news article counts, we either rescaled the values as percentages relative to each project’s maximum or applied logarithmic transformations to normalize the scales.
This process of converting raw counts into relative indicators is analogous to prior studies that used Google Trends data [60,61], and it facilitates pattern comparison and integrative analysis of time-series data across heterogeneous variables.
Step 4. Analysis of actors’ dynamic interactions before and after sandbox approval
In Step 4, we examined how the relationships among actors change around the sandbox approval event.
First, we analyzed changes in correlation structure among actor activity indicators by comparing the pre- and post-approval periods. For all 2,136 cases combined, we conducted Pearson correlation analysis on the producer, consumer, and media indicators and compared the correlation coefficients for two periods: the pre-approval period (regime phase) and the post-approval period (niche phase). Statistical significance of correlation differences was tested using Fisher’s r-to-z transformation, and we applied False Discovery Rate (FDR) correction to control for Type I error due to multiple comparisons [64].
Next, to identify the direction of causal influence over time, we estimated a vector autoregression (VAR) model and performed Granger causality tests. For all time series, we conducted Augmented Dickey–Fuller (ADF) unit root tests to establish stationarity; the original level series exhibited unit roots, but after first differencing (log-differencing for patent and media variables, simple differencing for the consumer variable), all variables satisfied stationarity at the 5% significance level. Based on comparisons of information criteria, particularly the Schwarz–Bayesian Information Criterion (BIC), we selected a VAR(2) model with a two-month lag as the optimal specification. This choice balances explanatory power with parsimony, avoiding unnecessary model complexity. Using the VAR(2) model, we estimated the time-lagged influence paths among actors and identified significant Granger causal relationships.
Step 5. Analysis of determinants of regulatory response speed
In Step 5, we investigated the determinants of legal and institutional response speed using ordered logistic regression (OLR). Because the dependent variable—regulatory response speed—is measured on a five-point ordinal scale, it is methodologically more appropriate to use OLR, which assumes an ordinal outcome, than to apply linear regression, which assumes a continuous dependent variable. Under the proportional odds assumption, OLR estimates how each explanatory variable affects the cumulative odds of the dependent variable being at or below a given category and is widely used to analyze Likert-type responses and ordinal indicators [65,66].
The independent variables in the regression model are indicators that capture changes in the activity levels of the actors. Specifically, we use preprocessed values that represent the increase in producer activity (number of patent applications), the change in consumer activity (search volume), and the change in media activity (news coverage), operationalized as log-difference terms for producers and media (patent_dlog, media_dlog) and a first-difference term for consumers (cons_diff). These specifications are designed to reflect the degree of increase or decrease in each actor’s activity before and after regulatory sandbox approval.
In addition, a dummy variable representing government policy orientation (progressive = 1, conservative = 0) is included as a moderating variable. This allows us to test the possibility that the effects of actor activities interact with the political context, under the assumption that the tendency toward regulatory reform may differ by government ideology (for example, the view that conservative governments are more proactive in deregulation). Accordingly, the final regression model includes the main-effect variables (producer, consumer and media), the policy-orientation dummy, and their interaction terms; model fit is evaluated by comparing the baseline model with the moderated model, and the inclusion of interaction terms yields a statistically significant reduction in the –2 log-likelihood and marked improvements in AIC and BIC, indicating superior explanatory power.
4. Results
4.1. Annual Trends in Regulatory Sandbox Approvals
Since its introduction in 2019, Korea’s regulatory sandbox regime has shown a generally upward trend in the number of approved cases. Table 2 presents the annual distribution of approvals, indicating that —supported by the continuous emergence of Fourth Industrial Revolution technologies— the number of sandbox approvals has expanded almost every year. In particular, the recent boom in artificial intelligence (AI) has led to a marked increase in applications and approvals in the industrial convergence and financial innovation domains. By August 2025, a cumulative total of 2,136 sandbox cases had been approved across eight policy domains: ICT convergence, industrial convergence, financial innovation, regulation-free special zones, smart-city, R&D special zones, mobility, and the circular economy.
At the sectoral level, the regulation-free special zone domain (under the Ministry of SMEs and Startups) shows a gradual decline in the number of cases compared to the early years. Initially, many projects focused on region-specific pilots of new technologies, but recently these have often evolved into IT/AI-linked technologies and migrated to the general sandbox tracks led by central ministries such as the Ministry of Trade, Industry and Energy. In contrast, the mobility domain (under the Ministry of Land, Infrastructure and Transport) newly appeared in 2024, and from this point onward projects involving transport innovations such as autonomous vehicles and shared mobility began to be approved in earnest. Thus, even against an overall backdrop of growth, the scale of approvals and growth trajectories differ by sector, revealing heterogeneous development paths across domains.
These descriptive patterns indicate that regulatory sandbox approvals have expanded over time and have increasingly been used across technology domains, including AI-related applications. This trend underscores the growing policy relevance of sandboxes as an experimental governance tool in discussions of sustainable innovation and commercialization.
4.2. Dynamic Interactions among Actors
4.2.1. Correlation Analysis
For each technology, the observation period was divided into a pre-approval of regulatory sandbox “regime” phase and a post-approval “niche” phase, and Pearson correlation coefficients were calculated among the three actor activity indicators (producers, consumers, and media). The analysis pooled 2,136 regulatory sandbox cases, and changes in correlations were formally tested using Fisher’s r-to-z transformation, with false discovery rate (FDR) correction applied to control Type I error under multiple comparisons. Table 3 reports the resulting shifts in correlations among actor activities before and after regulatory sandbox approval.
Before approval, producer and consumer activities exhibited a very strong positive correlation (r = 0.880), indicating tightly coupled movements between firms’ innovative efforts and consumer interest. By contrast, producer–media and consumer–media pairs showed strong negative correlations, implying that media coverage tended to decline when firm and consumer activity around emerging technologies became more intense, revealing an inverse co-movement pattern. This suggests that, in the pre-approval phase, attention to emerging technologies was largely confined within the market (firm–consumer) sphere, while media agendas remained focused on existing issues and devoted relatively little coverage to these new technologies.
After regulatory sandbox approval, the correlation structure shifted markedly. The consumer–media correlation turned clearly positive, and the correlation between consumer interest and media coverage reached r = 0.613, indicating a substantial increase in synchronization between the two actors. The producer–media correlation also flipped from negative to a weakly positive association, whereas the producer–consumer correlation remained positive but weakened (r = 0.391), showing that the bond between firms and consumers became less tight once sandbox approval had been granted.
Fisher’s z-tests for changes in correlations confirmed that these shifts were statistically significant (p < 0.01), meaning that the pattern of inter-actor correlations differed meaningfully between the pre- and post-approval phases. In other words, the correlation structure among actors does not simply scale up or down, but changes in sign and magnitude in ways that are substantively important. These findings provide preliminary support for Hypothesis H1 by indicating that the relational configuration among producers, consumers, and the media are restructured around the time of regulatory sandbox approval.
4.2.2. Vector Autoregression (VAR) Model and Granger Causality Tests
To identify the time-lagged influences among actors, we estimated a vector autoregression (VAR) model and conducted Granger causality tests.
Prior to VAR estimation, Augmented Dickey–Fuller (ADF) unit-root tests were applied to each time series. As summarized in Table 4, all level series exhibit unit roots, whereas the log-differenced patent and media series and the first-differenced consumer series are stationary at the 5% significance level. These transformations address non-stationarity and reduce the risk of spurious regression, thereby increasing the reliability of the subsequent VAR estimation and Granger-causality inference.
To determine the optimal lag length for the VAR model, several candidate lag orders were compared using information criteria, and the specification with the smallest Schwarz–Bayesian Information Criterion (BIC) was selected. As reported in Table 5, a model with two lags, VAR(2), minimized the BIC, striking a balance between explanatory power and parsimony by avoiding unnecessary over-parameterization.
Using the producer, consumer, and media activity indicators, a VAR(2) model was estimated and Granger causality between each ordered pair of variables was evaluated via F-tests. Table 6 presents the results, incorporating FDR-adjusted q-values to account for multiple testing across six directional pairs. Among the six possible directions, statistically significant Granger causality at the 5% level (with FDR correction) is found only along three paths.
First, the path from producers to consumers yields an F-statistic of 6.023, p = 0.003, and q(FDR) = 0.015, indicating that producer activity Granger-causes subsequent changes in consumer activity. Second, media activity Granger-causes consumer activity (F = 4.745, p = 0.009, q = 0.018), implying significant predictive power of media coverage for consumer search behavior. Third, consumer activity Granger-causes media activity (F = 4.805, p = 0.008, q = 0.018), showing that heightened consumer interest also feeds back into increased media coverage.
* Note: The figure depicts producers (Patent) exerting a one-way influence on consumers (Search Trend), while consumers and the media (News) are connected through a bidirectional feedback loop. Media also exert a one-way influence on consumers, whereas paths involving producers and media directly are not statistically significant in the VAR–Granger tests.
By contrast, no significant Granger causality is detected from consumers to producers, from media to producers, or from producers to media, as the corresponding F-statistics (0.159, 0.241, and 1.334) and q-values (0.853, 0.853, and 0.396) all exceed 0.05. In summary, the VAR–Granger analysis identifies a directional interaction structure characterized by three significant paths—“producer → consumer”, “media → consumer”, and “consumer → media”—with a feedback loop specifically linking consumers and the media. This causal interaction network is visualized in Figure 3.
4.2.3. Testing Hypothesis H1
Hypothesis H1 does not focus on changes in the activity level of each actor in isolation; instead, it asks whether the pattern of inter-actor couplings among the three actors is structurally reorganized around the point at which regulatory sandbox approval is granted. To examine this, we used the pre- and post-approval correlation coefficients reported in Section 4.2.1 and compared, for each pair of variables (producer–consumer, producer–media, consumer–media), whether the two coefficients were statistically indistinguishable across periods.
The tests show that, for all three pairs, the difference between pre- and post-approval correlations is statistically significant at the 5% level. This result implies not only a rescaling of relationships but a substantive change in the sign and magnitude of the correlations themselves, quantitatively corroborating the shift from a “producer–consumer-centered configuration” prior to approval to a “consumer–media-centered configuration” after approval, as described in Section 4.2.1 and Section 4.2.2. In practical terms, the core axis of interaction moves from a tight linkage between producers and consumers in the pre-approval phase to a structure in which consumers and the media jointly shape social awareness and discourse around emerging technologies once sandbox approval has been granted.
Taken together, these statistical tests clearly demonstrate that the pattern of relationships among producers, consumers, and the media differ significantly before and after regulatory sandbox approval. Accordingly, Hypothesis H1 is supported. This indicates that the regulatory sandboxes serves as a critical institutional juncture that reconfigures not only emerging technologies themselves but also the structure and influence pathways of the actor network surrounding those technologies.
4.3. Analysis of the Determinants of Regulatory Response Speed
4.3.1. Ordered Logistic Regression (OLR) Analysis
Out of the 2,136 total regulatory sandbox approvals, this study focuses on 1,374 cases for which legal and institutional adjustments have been completed after regulatory sandbox approval. We measured the time elapsed from regulatory sandbox approval to the completion of relevant legal/institutional revisions on a five-point ordinal scale, which serves as our dependent variable—regulatory response speed. The distribution of this ordinal response is shown in Table 7. Among the 1,374 cases, the largest share (36.17%, 497 cases) falls into category 1 (“over 36 months”), the slowest response category. The next most common is category 3 (“12–24 months”, 23.65%), followed by category 2 (“24–36 months”, 15.72%). In contrast, only 10.26% (141 cases) and 14.19% (195 cases) of cases experienced relatively rapid responses (categories 4 and 5, corresponding to under 12 months). In other words, the vast majority of regulatory sandbox projects underwent slower regulatory responses (categories 1–3), yielding a highly skewed distribution.
This pattern suggests a substantial time lag between the emergence of a regulatory issue and its institutional resolution, reflecting the phenomenon of so-called regulatory lag or legislative inertia. Indeed, prior studies have pointed out that regulatory systems often lag structurally behind fast-changing technological and market environments, resulting in policy delays and institutional inertia [67,68].
This study also constructed an OLR model with regulatory response speed as the dependent variable in order to analyze the determinants of regulatory responsiveness. To test how government policy orientation moderates the influence of other actors, we specified three nested models (Model 1–3): Model 1 includes only the main effects of producer, consumer, and media activity; Model 2 additionally incorporates the government policy orientation variable; and Model 3 further adds the interaction terms between policy orientation and each actor variable. Comparing these models allows us to assess how much the inclusion of the moderating variable improves model performance and to evaluate whether the added analytical complexity enhances the validity of our results.
As shown in Table 8, incorporating the government orientation variable and its interaction with other variables substantially improves model fit. Using the full sample of 1,374 cases, Model 1’s log-likelihood is –1834.610, Model 2’s is– 1711.014, and Model 3’s is –1684.148. This indicates that the absolute value of the log-likelihood decreases (i.e., likelihood increases) as the model becomes more complex.
Information criteria also steadily decline: the Akaike Information Criterion (AIC) drops from 3683.219 (Model 1) to 3438.027 (Model 2) to 3396.296 (Model 3), and the Bayesian Information Criterion (BIC) drops from 3719.797 to 3479.831 to 3469.453. McFadden’s pseudo-R² rises from 0.083 in Model 1 to 0.145 in Model 2 and 0.158 in Model 3. In sum, Model 3 achieves significantly higher explanatory power than Model 1, while the consistent decline in fit indices suggests that this added complexity did not lead to overfitting.
A likelihood-ratio test comparing Model 3 to Model 1 confirms that the improvement in log-likelihood is statistically significant at p < 0.001, indicating that the inclusion of the interaction terms yields a significantly better model. We therefore base our interpretation of regression coefficients and hypothesis tests on Model 3 (the moderated model).
We also checked for multicollinearity using variance inflation factors (VIF). In Models 1 and 2, all predictors had VIF values in the range of 1.0 to 3.6, indicating no serious multicollinearity concern. In Model 3, most variables similarly showed acceptable VIF levels; however, the producer activity variable and its interaction term (Producer × M) showed very high VIF values (45.749 and 46.570, respectively). To address this, we did not interpret the numerical magnitude of the affected coefficients, focusing only on their signs and significance instead.
The estimation results of the ordered logit model are summarized in Table 9 (coefficients and standard errors for Models 1–3) and Table 10 (detailed z-values, p-values, odds ratios, and confidence intervals for the full Model 3). Below, we describe the key findings for each variable.
First, the coefficient for Producer Activity in Model 3 is β = 29.339, a positive point estimate but with an extremely large standard error (SE = 229.577). This indicates a very unstable estimate. Consequently, the z-value is only 0.128 and the p-value is 0.898, showing that the direct effect of producer activity on regulatory response speed is not statistically significant.
Second, the regression coefficient for Consumer Activity was estimated at β = −0.022 with a standard error of 0.002, indicating a highly significant negative effect (z = −10.744, p < 0.0001). The corresponding odds ratio (OR) is 0.978, and the 95% confidence interval [0.974, 0.982] lies entirely below 1. This means that higher levels of consumer activity significantly reduce the cumulative odds of falling into the upper response categories (i.e., faster regulatory responses), implying that more intense consumer engagement tends, on average, to delay regulatory adjustment.
Third, the coefficient for Media Activity was β = 0.653 with a standard error of 0.158, showing a statistically significant positive impact (z = 4.130, p < 0.0001). The associated odds ratio is 1.922, with a 95% confidence interval of [1.409, 2.620], all above 1. Thus, an increase in media activity significantly raises the odds that a case will be classified in the faster-response categories, indicating that strong media attention acts as an accelerator of legal and institutional adjustment.
Fourth, the dummy variable for Government Policy Orientation (M; progressive government = 1) yielded a regression coefficient of β = −1.801 with a standard error of 0.137 (z = −13.130, p < 0.0001), indicating a very strong negative effect. The corresponding odds ratio is 0.165, and its 95% confidence interval [0.126, 0.216] is far below 1. This suggests that, under progressive governments, overall regulatory response speeds are significantly slower and that the time required to complete legal and institutional revisions is longer than under conservative governments, which serve as the reference category.
Fifth, the interaction term between Consumer Activity and Government Policy Orientation had a coefficient of β = 0.022 with a standard error of 0.004, a positive effect that is statistically significant (z = 5.525, p < 0.0001). The odds ratio for this interaction is 1.022, with a 95% confidence interval of [1.014, 1.030], entirely above 1. This indicates the presence of a systematic moderating effect: the impact of consumer activity on regulatory response speed differs depending on the government’s ideological stance.
Sixth, the interaction between Media Activity and Government Policy Orientation was estimated at β = −0.492 with a standard error of 0.195, representing a statistically significant negative effect (z = −2.528, p = 0.0115). The odds ratio for this interaction is 0.611, and the 95% confidence interval [0.417, 0.895] lies below 1, implying that under progressive governments the accelerating effect of media activity on regulatory speed is weaker than under conservative governments. In contrast, the interaction term between producer activity and government policy orientation was estimated at −15.142, but with a very large standard error (SE = 250.397) and was not statistically significant (p > 0.05). This indicates that no robust moderating effect of government orientation on producer signals was detected.
Figure 4. Odds ratios with 95% confidence intervals for the key variables in Model 3 (moderated OLR), shown as a forest plot. The vertical line indicates OR = 1 (no effect). Estimates to the left of the line (OR < 1) denote factors that slow down the regulatory response (e.g., high consumer activity, progressive orientation), while those to the right (OR > 1) denote factors that speed up the response (e.g., high media activity). The confidence intervals for all shown variables (including interaction terms) do not cross OR = 1, confirming the statistical significance and direction of the effects shown in Table 9 and Table 10.
This pattern illustrates that higher levels of consumer activity reduce the cumulative odds of falling into the “rapid response” category, whereas greater media activity increases those cumulative odds, and that the magnitude of both effects is systematically conditioned by the government’s policy orientation
Figure 5, which depicts the interaction between consumer activity and government policy orientation, plots consumer activity (mean ± 1 standard deviation) on the horizontal axis and the predicted probability of a “rapid response” (regulatory response speed of 4 or 5) on the vertical axis. Under a conservative government, the predicted probability of a rapid response gradually decreases as consumer activity intensifies, whereas under a progressive government the predicted probability remains very low and almost flat across the entire range of consumer activity.
Figure 6, showing the interaction between media activity and government policy orientation, displays a similar pattern. Under a conservative government, higher media activity is associated with a gradual increase in the predicted probability of a rapid response, while under a progressive government changes in media activity lead to only limited variation in that probability.
The estimation results show that the AME of consumer activity is a small negative value close to zero, indicating that changes in the level of consumer activity do not substantially alter the probability of a rapid response in a statistically meaningful way. By contrast, media activity exhibits the largest positive AME among the predictors, implying that higher media activity significantly increases the predicted probability that a case will fall into the rapid-response category (scores 4–5).
Figure 7.
Average Marginal Effects of Key Variables on the Probability of a Rapid Response (Categories 4–5).
Figure 7.
Average Marginal Effects of Key Variables on the Probability of a Rapid Response (Categories 4–5).
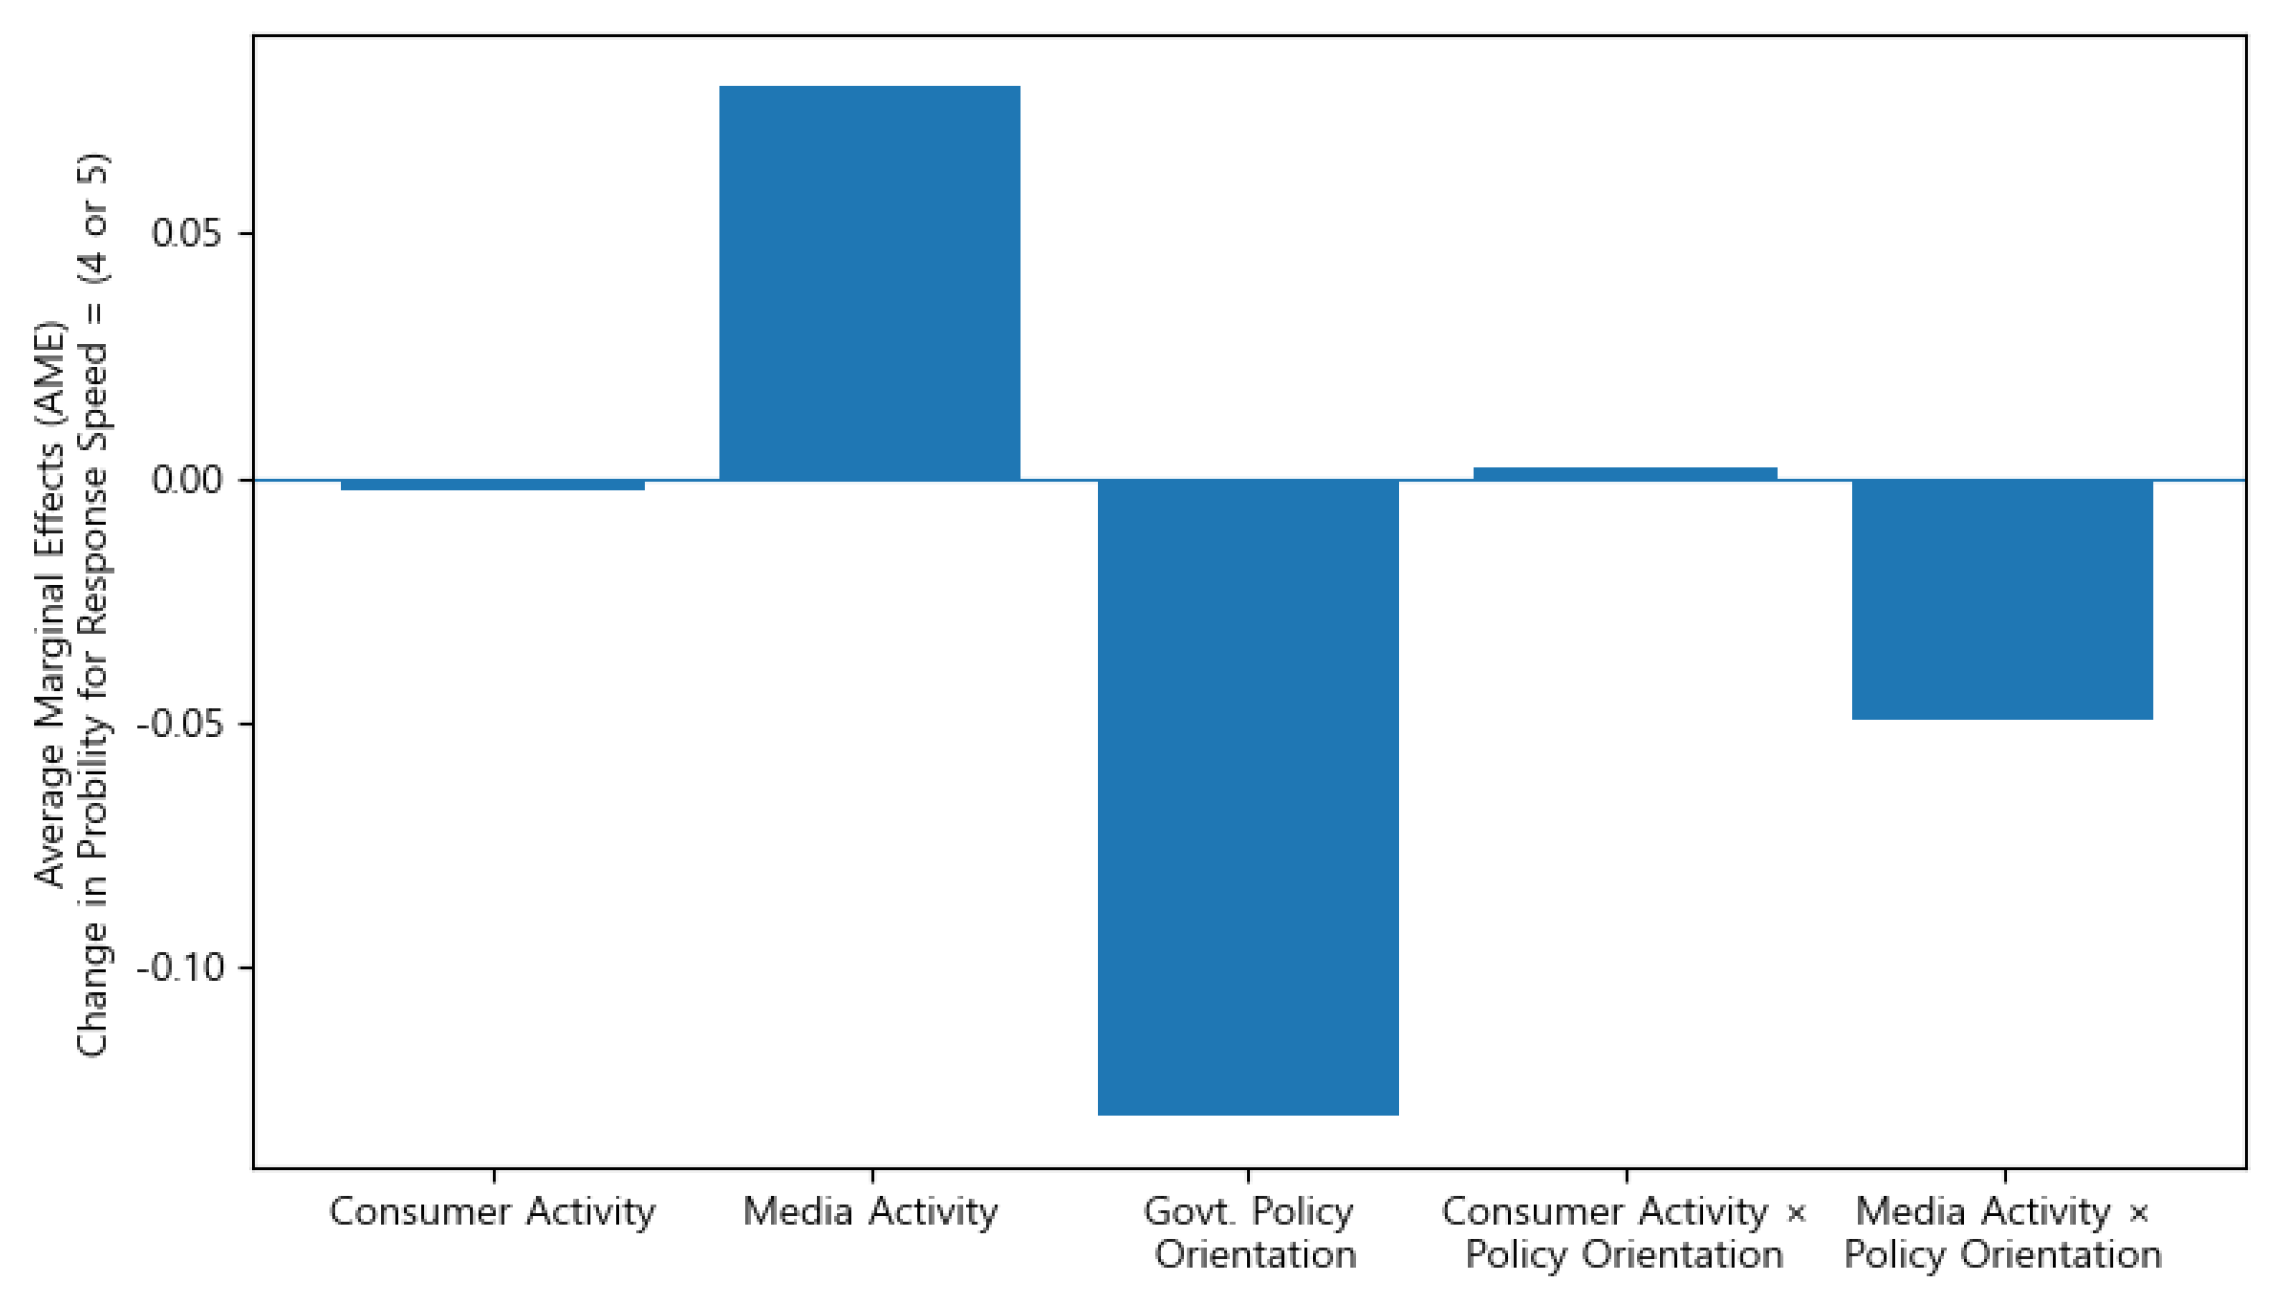
The AME of government policy orientation is sizeable and negative, revealing that, on average, the conditional probability of a rapid response is lower under progressive governments than under conservative ones. For the interaction terms, the consumer-activity × policy-orientation interaction displays a small positive AME close to zero, whereas the media-activity × policy-orientation interaction yields a statistically significant negative AME. In summary, media activity produces the strongest positive average marginal effect and government policy orientation the strongest negative one on the probability of a rapid response, with a particularly pronounced negative effect observed for the interaction between media activity and government policy orientation.
Finally, the ordered logit model can be expressed in the following cumulative logit form. Let Yi be the regulatory response speed for the ith sandbox case (on the 5-point ordinal scale). The general model is:
where θk is the intercept (threshold) for category k, and ηi is the linear predictor for case i.
In this study, we specify a moderated ordered logit (OLR) model in which the vector of independent variables is Xi = (Produceri , Consumeri, Mediai) and the moderating variable is Mi (government policy orientation, coded 0 = conservative, 1 = progressive).
where Prodi, Consi, and Medi denote the producer (patent_dlog), consumer (cons_diff), and media (media_dlog) activity levels for case i, and Mi is the government’s policy orientation (0 = conservative, 1 = progressive) for that case.
The coefficients β1, β2, β3 are the main effects of each actor’s activity, βM is the main effect of government orientation, and β1M, β2M, β3M are the interaction coefficients indicating how government orientation moderates each actor’s effect.
Based on the estimated coefficients of the moderated model, the empirical form of the linear predictor ηi can be written accordingly. The coefficients for the producer-related terms are reported to preserve the full model specification, even though they are not statistically significant at conventional levels.
Additionally, we assessed the proportional odds assumption of the OLR. A Brant test indicated no significant violations of this assumption in our model (i.e., the effects of predictors did not differ substantially across the different cut-points of the response variable). This suggests that the OLR’s parallel regression assumption holds in our data, validating the use of the standard ordered logit framework for our analysis.
4.3.2. Testing Hypotheses H2–H5
Hypotheses H2–H5 examine how the activity levels of the key actors and the government’s policy orientation affect the legal–institutional response speed after a regulatory sandbox approval. To test these hypotheses, we relied on the estimation results of the moderated ordered logistic regression model (Model 3) presented in Section 4.3.1 (Table 9).
Each hypothesis was evaluated based on whether the corresponding regression coefficient differs significantly from zero in the expected direction, as indicated by the Wald z-statistics and p-values, while the moderation hypothesis H5 was additionally assessed using changes in model fit (log-likelihood, AIC, BIC) between the baseline and moderated models.
- (1)
- Test of H2: Direct Effect of Producer Activity
H2 posits that a higher level of producer activity accelerates the legal–institutional response to emerging technologies.
To test this, we examined the coefficient and significance of the producer activity (dlog) variable in the moderated model (Model 3, Table 9 and Table 10). The estimated coefficient for producer activity was β = 29.339, but the standard error was very large (SE = 229.577), indicating numerical instability of the estimate (z = 0.128, p = 0.898). Because the coefficient is not statistically different from zero at conventional significance levels, there is no robust evidence that producer activity exerts a systematic direct effect on legal–institutional response speed.
Accordingly, the hypothesis that producer activity has a significant positive direct effect on response speed (H2) is rejected.
- (2)
- Test of H3: Direct Effect of Consumer Activity
H3 assumes that rising consumer interest and demand will positively influence the speed of regulatory response to emerging technologies.
In other words, more active consumer engagement was expected to be associated with a faster legal–institutional adjustment. In the moderated model, however, the coefficient for consumer activity (diff) was estimated at β = −0.022 with a standard error of 0.002, yielding a highly significant negative effect (z = −10.744, p < 0.0001; Table 9 and Table 10). The corresponding odds ratio is OR = 0.978, and its 95% confidence interval [0.974, 0.982] lies entirely below 1, implying that higher consumer activity reduces the cumulative odds of falling into the “faster response” categories.
Put differently, more intense consumer activity is associated with a statistically significant slowing of regulatory response, and thus Hypothesis H3 is rejected.
- (3)
- Test of H4: Direct Effect of Media Activity
H4 states that stronger media activity will have a positive effect on the legal–institutional response speed to emerging technologies.
This hypothesis reflects the expectation that news coverage and media attention accelerate the timing of regulatory adjustments by increasing issue salience for regulators.
In the moderated model, the coefficient for media activity (dlog) was β = 0.653 with a standard error of 0.158, and is strongly significant in the positive direction (z = 4.130, p < 0.0001; Table 9 and Table 10). The odds ratio is OR = 1.922, with a 95% confidence interval of [1.409, 2.620], and the entire interval lies above 1, indicating that higher media activity significantly increases the odds that a case will fall into the “faster response” categories.
Therefore, media activity has a statistically significant accelerating effect on legal–institutional response speed, and Hypothesis H4 is supported.
- (4)
- Test of H5: Moderating Effect of Government Policy Orientation
H5 hypothesizes that the government’s policy orientation moderates the legal–institutional response speed to emerging technologies. More specifically, it predicts that the magnitude and direction of the effects of actor activities —especially those of consumers and the media— on response speed differ systematically between conservative and progressive governments.
To evaluate H5, we first compared the model fit between the baseline model including only the main effects of actor activities and the moderated model including the government policy orientation dummy and its interaction terms. When the two models were compared in terms of log-likelihood, AIC, BIC, and McFadden’s R², the moderated model exhibited improved log-likelihood, lower AIC and BIC values, and an increase in McFadden’s R² from 0.086 to 0.158 (Table 8). A likelihood-ratio test for the difference in log-likelihoods between the two models rejected the null hypothesis that all moderation terms are jointly zero at the 1% significance level, indicating that including the interaction terms significantly improves explanatory power.
Second, we examined the individual moderation coefficients in Model 3. The main effect of government policy orientation (M; progressive = 1) was β = −1.801 with SE = 0.137, which is highly significant and negative (z = −13.130, p < 0.0001), with an odds ratio of OR = 0.165 and a 95% confidence interval of [0.126, 0.216]. This implies that, holding other variables constant, the cumulative odds of a “faster response” are substantially lower under progressive governments than under conservative governments. The interaction between consumer activity and government policy orientation was β = 0.022, SE = 0.004, and is significantly positive (z = 5.525, p < 0.0001), with an odds ratio of OR = 1.022 and a 95% confidence interval of [1.014, 1.030].
Thus, the effect of consumer activity on response speed is systematically conditioned by the government’s policy orientation, such that the negative impact of consumer activity on response speed becomes less pronounced under progressive governments.
By contrast, the interaction between media activity and government policy orientation was β = −0.492, SE = 0.195, and is significantly negative (z = −2.528, p = 0.0115), with an odds ratio of OR = 0.611 and a 95% confidence interval of [0.417, 0.895], indicating that media-driven acceleration of regulatory response is attenuated under progressive governments.
In the same model, the interaction term between producer activity and government policy orientation was estimated at β = −15.142, but its standard error (SE = 250.397) was extremely large, and the coefficient was statistically insignificant (p > 0.05).
In summary, the hypothesis tests based on the ordered logistic regression indicate that H2 and H3 are rejected, whereas H4 and H5 are supported.
The theoretical and policy implications of these findings are discussed in greater detail in the following section.
5. Discussion
5.1. Key Findings and Theoretical Implications
The empirical results show a marked shift in market and societal responses to emerging technologies once they enter the regulatory sandbox niche. Prior to regulation sandbox approval, producer and consumer activities rose in close synchrony, whereas media coverage moved in the opposite direction and remained submerged within pre-existing discursive agendas. This pattern suggests that information and debate on innovative technologies were trapped behind the cognitive barriers of the incumbent regime and therefore failed to diffuse widely.
After sandbox approval created a protected experimental space (niche), consumer interest and media coverage displayed a clear positive co-movement. This shift indicates that knowledge and outcomes generated within the niche began to spill over into the wider environment and feed processes of social learning. Empirically, the correlation between consumers and the media rose significantly to about r ≈ +0.61 after approval, revealing a feedback loop in which niche learning is mutually amplified through media and consumer channels.
The emergence of this consumer–media bond is consistent with the “niche learning feeds back to the regime” mechanism highlighted in the multi-level perspective (MLP) and strategic niche management (SNM) literature [19,72]. In this sense, the findings provide empirical support for socio-technical transition theory, which posits that learning in protected spaces induces change in existing systems through external networks.
Vector autoregression (VAR) and Granger causality analysis further show that, for technologies admitted to the regulatory sandboxes, producer activity systematically initiates the sequence of reactions and significantly precedes consumer responses, revealing a typical technology-push pattern through which technological learning accumulated in the niche is translated into market demand. The same analysis identifies a bidirectional feedback loop in which media reports drive consumer behavior while rising consumer interest, in turn, stimulates additional media coverage. This dynamic evidence corroborates the strengthened consumer–media bond observed in the static correlations and can be interpreted as the externalization of social learning along the media–consumer channel.
Moreover, the consumer–media feedback loop identified here resonates with prior research on the causal interplay between news demand and news supply. Gravino et al. [73] show that an increase in public search demand markedly expands the supply of news, while Zhao et al. [74] demonstrate that heightened media attention can itself accelerate the diffusion of electric vehicles by translating media visibility into adoption decisions—together mirroring our finding that consumers influence media agendas and the media, in turn, reshape consumer preferences and behavior.
Taken together, these results suggest that, for emerging technologies trialed in regulatory sandboxes, diffusion dynamics follow a typical technology-push pattern at the outset, with producers triggering the initial cascade of signals, but that over time the dynamic feedback between consumers and the media becomes the primary engine driving both the growth of social demand and the evolution of public discourse.
Results from the ordered logistic regression model reveal that socio-technical transitions are conditionally structured by the surrounding political and institutional context. Even when consumer and media signals are similar, the magnitude and direction of their effects on the speed of regulatory adjustment differ according to the policy orientation of the incumbent government, underscoring the importance of multi-level governance and power relations emphasized in transition studies [75,76]. Put differently, the feedback of sandbox-based learning into the regime via consumer–media channels is filtered and amplified by institutional parameters such as government ideology, which in turn act as a key adjustment mechanism governing the pace and trajectory of socio-technical transitions.
Average marginal effects (AMEs) further highlight these moderating patterns. Increases in media activity exert the largest positive impact on the probability of a “rapid response”. Meanwhile, heightened consumer interest tends to delay legal and institutional reactions (OR < 1), and the policy-orientation dummy shows the strongest negative effect, indicating that progressive governments are less likely than conservative ones to institutionalize sandbox outcomes quickly. Meanwhile the delaying effect of consumer activity disappears under conservative administrations. Taken together, these results imply that government policy orientation acts as a filter through which the influence of consumer and media signals is selectively amplified or dampened, yielding a nonlinear structure of regulatory responsiveness.
At first glance, the finding that growing consumer interest slows deregulation conflicts with the common expectation that rising market demand will spur regulatory relaxation. This 'Consumer Delay Paradox' can be theoretically grounded in the concept of a risk-averse bureaucracy and blame avoidance behavior [77,78]. In public administration, bureaucrats often exhibit a 'negativity bias,' where the motivation to avoid blame for potential policy failures outweighs the incentive to claim credit for innovation.
High consumer interest typically signals increased public scrutiny and the potential for social conflict (as seen in the 'TADA' ride-sharing controversy [79]), which sharply elevates the perceived personal and reputational risks for decision-makers. Under these conditions, officials are likely to retreat into 'cautious mediocrity' or procedural formalism to protect themselves from liability, thereby unintentionally decelerating the regulatory adjustment process.
These results highlight the importance of political and institutional context. The study empirically demonstrates that, even when market signals such as increased consumer interest and intensified media coverage are similar, the speed with which they translate into policy decisions varies according to the ideological leaning of the government. This implies that conventional explanations for delayed deregulation based solely on economic factors (e.g., market size and costs) or technological factors (e.g., safety and maturity) are insufficient, and that the political opportunity structure must also be examined.
In other words, understanding how regulatory agencies respond to emerging technologies requires integrated analysis of macro-political variables such as power configurations, party ideology, and executive–legislative relations. By incorporating this political-science perspective into the study of technology–regulation interactions, the present research broadens the scope of interdisciplinary debate and shows that models which explicitly account for political actors and interests are useful for explaining both successful and stalled regulatory innovation. These insights are expected to provide an important basis for future theoretical advances in this field.
Finally, the study also extends methodological approaches to research on regulatory innovation. By combining time-series analysis of dynamics with cross-sectional regression, it proposes a new analytical framework that links macro-level phenomena with micro-level outcomes, measuring actor activities with objective indicators and regressing regulatory response speed on these measures to place qualitative arguments on a quantitative footing. This integration of multiple methods not only offers a reference model for future work but also promotes interdisciplinary dialogue between public policy and technology-innovation management, demonstrating that complex social-scientific contexts can be captured through mixed-method designs and thereby contributing to the methodological development of research on sustainable innovation and regulation.
5.2. Implications
This study offers integrated implications for understanding socio-technical transitions, regulatory governance, and innovation practice in the context of regulatory sandboxes. The empirical results indicate that regulatory sandboxes function as a niche-level governance arrangement through which learning generated by experimentation is transmitted into the broader regulatory regime. Actor signals emerging within the sandbox—particularly those mediated by consumers and the media—do not remain confined to the experimental space but feed back into institutional decision-making processes. This finding supports the view that technological innovation and regulation co-evolve through multi-actor interactions rather than progressing independently.
A key contribution of this study lies in its actor-centric perspective on regulatory responsiveness. By jointly modeling producers, consumers, and the media, the analysis demonstrates that different actors play structurally distinct roles in shaping the speed of legal and institutional adjustment. Among these actors, media activity emerges as the most influential accelerator of regulatory response, whereas consumer activity is associated with delayed responses, and producer activity shows limited direct effects. This differentiation suggests that regulatory change is not driven by a single dominant force but by the configuration and interaction of heterogeneous social signals.
Importantly, the results also reveal that the effects of these actor signals are systematically conditioned by government policy orientation. Even when levels of consumer interest and media attention are comparable, the speed with which these signals translate into regulatory action varies depending on whether the government is conservative or progressive. This indicates that market demand and technological maturity alone are insufficient to explain regulatory outcomes; instead, they operate within a broader political opportunity structure that shapes how external signals are interpreted and acted upon. In this sense, the regulatory sandbox should be understood not as a neutral technical instrument but as a governance mechanism whose outcomes are filtered through political and institutional contexts.
From a governance perspective, these findings suggest that regulatory sandbox policies should move beyond a narrow focus on temporary exemptions and be institutionalized as mechanisms for evidence-based regulatory learning. While regulatory sandbox approvals have expanded across technological domains, only a subset of experimental outcomes is translated into permanent legal or institutional change. Establishing formal procedures that connect sandbox experimentation to follow-up regulatory action—such as structured post-experiment reviews or inter-ministerial coordination mechanisms—would help ensure that learning generated within the sandbox is systematically reflected in the regulatory framework.
At the same time, the strong accelerating effect of media activity highlights the importance of transparency and public communication in regulatory governance. Given that media attention exerts the largest positive influence on regulatory response speed, regulators should pursue proactive and structured engagement with the media. Rather than treating media coverage as an external pressure, public authorities can leverage it as a governance resource by disclosing experimental outcomes in a timely and evidence-based manner. Such engagement can facilitate public understanding, reduce uncertainty, and contribute to more timely and legitimate regulatory adjustment.
The findings also underscore the need to reconsider how consumer signals are incorporated into regulatory processes. Increased consumer attention alone does not accelerate regulatory responses and may even contribute to delay when conflicts among stakeholder groups intensify. This suggests that diffuse consumer signals are not automatically translated into policy action. Creating institutionalized channels for consumer participation—such as public consultations, advisory committees, or digital participation platforms—can help transform consumer interest into constructive policy input and reduce the political costs associated with late-stage conflict.
Finally, the results carry practical implications for firms and regulatory practitioners. Firms developing emerging technologies should complement technological innovation strategies with proactive non-market engagement, including early communication with regulators, coordination through industry associations, and the development of voluntary standards or codes of conduct. Strategic use of the regulatory sandbox can generate credible evidence, build public trust, and shorten the pathway to full market entry. For regulatory practitioners, the findings suggest that media attention and public opinion need not be viewed solely as constraints; when combined with early coordination and transparent communication, they can serve as resources for overcoming institutional inertia and enabling more timely regulatory responses.
6. Conclusions
6.1. Summary
Drawing on the multi-level perspective of socio-technical transition theory, this study analyzed how dynamic interactions among producers, consumers, the media, and government within an experimental niche—the regulatory sandbox—shape the speed of legal and institutional responses to emerging technologies. To this end, we constructed a panel-type dataset for sandbox approvals implemented in Korea since 2019, combining project-level information with monthly indicators of patenting activity, online search traffic, news coverage, regulatory adjustment timelines, and government policy orientation.
First, correlation analysis and VAR–Granger causality tests were used to examine how patterns of actor coupling and causal pathways are reorganized before and after sandbox approval. The results show that a configuration dominated by producer-driven signals in the pre-approval phase shifts, in the post-approval phase, into a feedback structure in which consumer and media activities mutually reinforce each other.
This indicates that, in regulatory sandboxes, emerging technologies tend to follow a typical technology-push pattern: producer-driven signals dominate the pre-approval phase, but as these technologies pass through sandbox experimentation and attract broader attention, not only do the technologies themselves mature, but consumer interest and media discourse surrounding them expand in tandem.
Second, to identify the determinants of regulatory response speed, we estimated ordered logistic regression models. The results show that higher levels of consumer activity reduce the probability of falling into the “rapid response” category, whereas more intensive media activity significantly increases the likelihood of faster legal and institutional adjustment. In addition, regulatory updates tend to proceed more slowly under progressive than under conservative administrations.
Third, when government policy orientation is introduced as a moderator, clear interaction patterns emerge. For consumer activity, the probability of a rapid regulatory response declines as consumer activity increases under conservative governments, whereas under progressive governments it remains uniformly low regardless of consumer activity levels. For media activity, greater media coverage steadily raises the probability of a rapid response under conservative governments, while under progressive governments changes in media attention lead to only modest shifts in that probability.
Finally, the average marginal effects indicate that media activity has the strongest positive impact on the probability of a rapid regulatory response, identifying the media as a key driver that accelerates regulatory adjustment. By contrast, progressive government orientation exerts a sizeable negative effect, corresponding to slower overall response speeds. The effects of consumer activity and its interaction with government orientation are small and close to zero, whereas the interaction between media activity and government orientation is negative, suggesting that the accelerating influence of media coverage is systematically weaker under progressive administrations.
In sum, this study shows that dynamic signals from producers, consumers, and the media in regulatory sandboxes, filtered through government policy orientation, jointly shape the speed of legal and institutional responses. The intensity of consumer and media activity and the ideological stance of government together determine how quickly, and in what direction, regulators adjust, providing empirical support for socio-technical transition accounts that stress the co-evolution of multi-actor networks and institutional context [19,25].
Practically, the results suggest that regulators can accelerate post-sandbox rule-making by combining proactive media engagement with transparent, evidence-based communication and institutionalized channels for consumer input, while firms can support sustainable commercialization by sharing credible sandbox evidence and coordinating communication and compliance strategies with regulators.
6.2. Limitations and Future Research
6.2.1. Limitations
First, this study is constrained by the available data and by the proxies used to measure actor activities. The behavior of producers, consumers, and the media were operationalized using patent counts, web-search volumes, and news-article frequencies. These indicators capture only part of each actor’s activity and do not fully reflect qualitative aspects. For example, patent applications indicate the scale of firms’ technological innovation but do not measure standard-setting efforts, self-regulation, or policy lobbying. Likewise, online search volumes show the level of public interest but do not necessarily translate into actual adoption, usage, or willingness to pay; and the number of news articles measures the intensity of media attention but not the tone, depth, or framing of coverage. Because of these limitations, it is difficult to capture the substantive content and perceived legitimacy of each actor’s interventions. Future work should therefore complement quantitative proxies with survey data, social-media text, or in-depth qualitative materials to obtain a more fine-grained picture of actor behavior.
Second, the scope and methods of the study are subject to important restrictions. Empirically, the analysis focuses solely on Korea’s regulatory sandbox and on the early implementation period from 2019 to 2025. The Korean case is characterized by a long-standing “positive” regulatory tradition and by the recent introduction of experimental relaxation schemes; patterns observed here may not generalize directly to countries with different legal or administrative systems. In addition, because our data cover only the initial years of the sandbox, the analysis cannot fully reflect longer-term changes in actor relationships or in governmental attitudes toward emerging technologies. On the modelling side, the analysis does not include internal characteristics of regulatory organizations—such as administrative capacity, professional expertise, or intra-organizational politics—nor does it explicitly incorporate other relevant actors such as academic experts or civil-society organizations. Finally, the exclusive reliance on correlation analysis, time-series methods (VAR and Granger causality), and ordered logistic regression means that the study is better suited to explaining the timing of regulatory responses than to assessing the substantive quality or broader societal impacts of those responses.
Third, our empirical strategy based on ordered logistic regression and moderation analysis also has methodological limitations. The ordered logit model relies on the proportional-odds assumption, meaning that each predictor is assumed to have the same effect across all cut-points of the outcome; in practice, regulatory response speeds may be more sensitive in some ranges than in others, so more flexible specifications such as generalized or partial proportional-odds models could be explored in future research [80]. Moreover, the odds ratios and average marginal effects we report compress complex, potentially nonlinear and heterogeneous relationships into single summary values, which can mask variation across industries, sandbox tracks, and regulatory domains [81,82]. The reported coefficients and marginal effects should therefore be viewed as describing overall tendencies in the full sample rather than definitive causal effects for specific subgroups, and, as in all observational studies, residual endogeneity and omitted-variable bias cannot be fully excluded.
6.2.2. Future Research
To address these limitations, future research should adopt more layered and integrated approaches.
First, this study modelled government policy orientation as a simple progressive–conservative dummy, whereas political and institutional environments are multidimensional. Future work could incorporate finer-grained indicators—such as party system configurations, the balance of power between parliament and bureaucracy, the number and type of veto players, and the expertise or autonomy of regulatory agencies—to identify which aspects of the political opportunity structure most strongly shape regulatory responsiveness [76].
Second, the interaction effects reported here are estimated on a cross-sectional basis and thus represent a static moderating structure. Dynamic panel models or system-dynamics approaches (e.g., Forrester [83]) could be used to trace how actor signals and regulatory responses co-evolve over successive stages of the policy cycle, and whether the influence of media attention or consumer pressure on regulatory speed intensifies or weakens as sandbox experiments mature and political conditions change [75,84].
Third, future research should move beyond response speed and examine the quality and sustainability of regulatory outcomes. Linking post-sandbox legal and institutional reforms to indicators of firms’ sustainability performance, innovation investment, and consumer welfare would enable a more comprehensive assessment of the net economic and business impacts of sandbox-based regulatory innovation [85], while exploring how standards, testing, certification, and voluntary conformity-assessment schemes can be aligned with broader sustainability objectives would further deepen this perspective [86].
Fourth, rather than reporting average marginal effects only for the full sample, subsequent work could decompose these effects by industry, sandbox track, or policy field. Comparing AMEs across such subgroups would generate more fine-grained insight into the contexts in which consumer and media signals are especially powerful in inducing regulatory responses [84,85], support ex ante simulations of alternative policy portfolios, and help identify which actor channels should be prioritized to enhance regulatory responsiveness and secure sustainable transition pathways in different sectors.
Author Contributions
Conceptualization, Y.K. and K.C.; methodology, Y.K.; validation, Y.K. and K.C.; formal analysis, Y.K.; writing—original draft preparation, Y.K.; writing—review and editing, Y.K. and K.C.; and supervision, K.C. All authors have read and agreed to the published version of the manuscript.
Funding
This study received no external funding.
Institutional Review Board Statement
Not applicable.
Informed Consent Statement
Not applicable.
Data Availability Statement
Publicly available datasets were analyzed in this study. This data can be found here: Regulatory Sandbox Integrated Portal (www.sandbox.go.kr), KIPRIS (www.kipris.or.kr), Naver DataLab (datalab.naver.com), BigKinds (www.bigkinds.or.kr), and KOSIS (www.kosis.kr).
Conflicts of Interest
The authors declare no conflicts of interest.
References
- Akerlof, G.A. The market for “lemons”: Quality uncertainty and the market mechanism. Q. J. Econ. 1970, 84, 488–500. [Google Scholar] [CrossRef]
- Corbett, C.J.; Montes-Sancho, M.J.; Kirsch, D.A. The financial impact of ISO 9000 certification in the United States: An empirical analysis. Manag. Sci. 2005, 51, 1046–1059. [Google Scholar] [CrossRef]
- Houde, S.; Aldy, J.E. Consumers’ response to product certification: A study of the ENERGY STAR program. J. Ind. Econ. 2018, 66, 301–338. [Google Scholar]
- Downes, L. The Laws of Disruption: Harnessing the New Forces That Govern Life and Business in the Digital Age; Basic Books: New York, NY, USA, 2009. [Google Scholar]
- OECD. OECD Science, Technology and Innovation Outlook 2021: Times of Crisis and Opportunity; OECD Publishing: Paris, France, 2021. [Google Scholar]
- Collingridge, D. The Social Control of Technology; St. Martin’s Press: New York, NY, USA, 1982. [Google Scholar]
- Rogers, E.M. Diffusion of Innovations, 5th ed.; Free Press: New York, NY, USA, 2003. [Google Scholar]
- Aghion, P.; Bergeaud, A.; Van Reenen, J. The impact of regulation on innovation. Am. Econ. Rev. 2023, 113, 2894–2936. [Google Scholar] [CrossRef]
- World Economic Forum. Agile Governance: Reimagining Policy-making in the Fourth Industrial Revolution; World Economic Forum: Geneva, Switzerland, 2018. [Google Scholar]
- OECD. OECD Regulatory Policy Outlook 2024; OECD Publishing: Paris, France, 2024. [Google Scholar]
- World Bank. Enabling the Use of Regulatory Sandboxes to Support Innovation in Fintech: The Republic of Korea’s Approach; World Bank Group: Washington, DC, USA, 2020. [Google Scholar]
- Cornelli, G.; Doerr, S.; Gambacorta, L.; Merrouche, O. Regulatory Sandboxes and Fintech Funding: Evidence from the UK; BIS Working Papers No. 901; Bank for International Settlements: Basel, Switzerland, 2020. [Google Scholar]
- Cho, Y.; Kim, T.; Park, S. Performance analysis of regulatory sandbox and improvement measures. J. Regul. Stud. 2020, 29, 1–28. (In Korean) [Google Scholar]
- Office for Government Policy Coordination. Current Status and Achievements of Regulatory Sandbox Operation; March 2025 Report; Office for Government Policy Coordination: Sejong, Republic of Korea, 2025. (In Korean) [Google Scholar]
- Yang, C. Regulatory vacuum issues of new technology convergence services and legal response directions. J. Korea Technol. Innov. Soc. 2024, 32, 45–68. (In Korean) [Google Scholar]
- Yoo, J. A study on corporate perception and response to technology regulation. Sci. Technol. Policy 2020, 30, 102–119. (In Korean) [Google Scholar]
- Park, M.; Wu, S.; Funk, R.J. Regulation and innovation revisited: How restrictive environments can promote destabilizing new technologies. Organ. Sci. 2025, 36, 240–260. [Google Scholar] [CrossRef]
- Yoon, H. Adaptation of technological innovation to regulatory change: Seeking adaptive regulation. Sci. Technol. Policy 2017, 27, 102–115. (In Korean) [Google Scholar]
- Geels, F.W. From sectoral systems of innovation to socio-technical systems: Insights about dynamics and change from sociology and institutional theory. Res. Policy 2004, 33, 897–920. [Google Scholar] [CrossRef]
- Berkhout, F.; Smith, A.; Stirling, A. Socio-technological regimes and transition contexts. In System Innovation and the Transition to Sustainability; Elzen, B., Geels, F.W., Green, K., Eds.; Edward Elgar: Cheltenham, UK, 2004; pp. 48–75. [Google Scholar]
- Smith, A.; Stirling, A.; Berkhout, F. The governance of sustainable socio-technical transitions. Res. Policy 2005, 34, 1491–1510. [Google Scholar] [CrossRef]
- Jasanoff, S. The idiom of co-production. In States of Knowledge: The Co-production of Science and Social Order; Jasanoff, S., Ed.; Routledge: London, UK, 2004; pp. 1–12. [Google Scholar]
- Geels, F.W. The multi-level perspective on sustainability transitions: Responses to seven criticisms. Environ. Innov. Soc. Transit. 2011, 1, 24–40. [Google Scholar] [CrossRef]
- Zetzsche, D.A.; Buckley, R.P.; Arner, D.W.; Barberis, J.N. Regulating a revolution: From regulatory sandboxes to smart regulation. Fordham J. Corp. Financ. Law 2017, 23, 31–103. [Google Scholar] [CrossRef]
- Borup, M.; Brown, N.; Konrad, K.; Van Lente, H. The sociology of expectations in science and technology. Technol. Anal. Strateg. Manag. 2006, 18, 285–298. [Google Scholar] [CrossRef]
- Gamson, W.A.; Modigliani, A. Media discourse and public opinion on nuclear power: A constructionist approach. Am. J. Sociol. 1989, 95, 1–37. [Google Scholar] [CrossRef]
- Hilgartner, S.; Bosk, C.L. The rise and fall of social problems: A public arenas model. Am. J. Sociol. 1988, 94, 53–78. [Google Scholar] [CrossRef]
- Schafraad, P.; Hoes, A.C.; Te Kulve, H. Framing emerging technologies: High expectations versus deep uncertainties. Sci. Public Policy 2015, 42, 831–844. [Google Scholar]
- Lee, H. Dynamic analysis of cooperation networks in science and technology: Using social network analysis. J. Korea Technol. Innov. Soc. 2018, 21, 45–67. (In Korean) [Google Scholar]
- Rony, M.M.U.; Hassan, N.; Yousuf, M. Diving deep into clickbaits: Who use them to what extents in which topics with what effects? In Proceedings of the 2017 IEEE/ACM International Conference on Advances in Social Networks Analysis and Mining, Sydney, Australia, 31 July–3 August 2017. [Google Scholar]
- Pentina, I.; Tarafdar, M. From “information” to “knowing”: Exploring the role of social media in contemporary news consumption. Comput. Hum. Behav. 2014, 35, 211–223. [Google Scholar] [CrossRef]
- Shaw, A. Social media, extremism, and radicalization. Sci. Adv. 2023, 9, eadk2031. [Google Scholar] [CrossRef]
- Sun, H.; Xu, D.; Wang, L.; Wang, K. How does public opinion influence production safety within small and medium enterprises in the sustainability context? Sustainability 2023, 15, 3519. [Google Scholar] [CrossRef]
- Trittin-Ulbrich, H.; Böckel, A. Institutional entrepreneurship for responsible digital innovation: The case of corporate digital responsibility. Creat. Innov. Manag. 2022, 31, 447–459. [Google Scholar] [CrossRef]
- Choi, B.; Bae, K.; Park, J. A study on the expectation dynamics of nanotechnology through newspaper content analysis. In Proceedings of the 2012 Fall Conference of the Korean Association for Science and Technology Studies, Seoul, Republic of Korea, November 2012. (In Korean). [Google Scholar]
- Seo, Y.; Lee, J.; Kim, M. Changes in regulatory environment and corporate strategies for the development of emerging industries. J. Korea Technol. Innov. Soc. 2016, 24, 45–67. (In Korean) [Google Scholar]
- Walters, D.E.; Wiseman, H.J. Self-regulation in emerging and innovative industries: Balancing certainty and flexibility. Houston Law Rev. 2025, 62, 523–560. [Google Scholar]
- Scherrer, F. Co-regulation and corporate political activity in the digital economy. J. Public Aff. 2023, 23, e2760. [Google Scholar]
- Yang, X.; Liu, Y. Research on the impact of environmental regulation on the green innovation efficiency of manufacturing enterprises in the Yangtze River Economic Belt. Sustainability 2024, 16, 856. [Google Scholar]
- Yang, Z.; Zha, X. How do Environmental regulation and media pressure influence greenwashing behaviors in chinese manufacturing enterprises? Sustainability 2025, 17, 5066. [Google Scholar] [CrossRef]
- Vargo, S.L.; Wieland, H.; Akaka, M.A. Innovation through institutionalization: A service ecosystems perspective. Ind. Mark. Manag. 2015, 44, 63–72. [Google Scholar] [CrossRef]
- Song, W.; Park, H.; Yoon, Y. A Study on the Impact of User Participation on Innovation; Science and Technology Policy Institute: Sejong, Republic of Korea, 2018. (In Korean) [Google Scholar]
- Kwon, H. Direction of regulatory innovation in preparation for the era of converged new technologies. J. Inf. Law 2021, 25, 49–72. (In Korean) [Google Scholar]
- McCombs, M.E.; Shaw, D.L. The agenda-setting function of mass media. Public Opin. Q. 1972, 36, 176–187. [Google Scholar] [CrossRef]
- Kiousis, S.; McDevitt, M.; Wu, X. The genesis of civic awareness: Agenda setting in political socialization. J. Commun. 2007, 57, 1–18. [Google Scholar] [CrossRef]
- Birkland, T.A. Focusing events, mobilization, and agenda setting. J. Public Policy 1998, 18, 53–74. [Google Scholar] [CrossRef]
- Cho, S. A study on the legislative influence of media coverage: The effect of quantitative and qualitative characteristics of newspaper articles on the enactment and revision of laws. Korean J. Commun. Inf. 2021, 113, 33–64. (In Korean) [Google Scholar]
- Wolfe, M. Putting on the brakes: Media, attention, and the speed of policymaking. Policy Stud. J. 2012, 40, 109–126. [Google Scholar] [CrossRef]
- Nam, C.; Kim, H.; Song, Y. A study on the policy making process of conflict issues: Focusing on the agenda setting and legislative process of the humidifier disinfectant case. J. Legis. Stud. 2016, 12, 169–198. (In Korean) [Google Scholar]
- Vliegenthart, R.; Walgrave, S. When the media matter for politics: Partisan moderators of the mass media’s agenda-setting influence on parliament in Belgium. Party Politics 2011, 17, 321–342. [Google Scholar] [CrossRef]
- Tsebelis, G. Veto Players: How Political Institutions Work; Princeton University Press: Princeton, NJ, USA, 2002. [Google Scholar]
- Golub, J. Survival analysis and European Union decision-making. Eur. Union Politics 2007, 8, 155–179. [Google Scholar] [CrossRef]
- Hurka, S.; Haag, M. Policy complexity and legislative duration in the European Union. Eur. Union Politics 2020, 21, 87–108. [Google Scholar] [CrossRef]
- Won, I.; Kim, D. Macro-dynamics of agenda setting in the Korean policy process: Interactions among the President, Assembly, Media, and Public. Korean Public Adm. Rev. 2020, 29, 251–285. (In Korean) [Google Scholar]
- Dedehayir, O.; Steinert, M. The hype cycle model: A review and future directions. Technol. Forecast. Soc. Chang. 2016, 108, 28–41. [Google Scholar] [CrossRef]
- Jun, S.-P. An empirical study of users’ hype cycle based on search traffic: The case study on hybrid cars. Scientometrics 2012, 91, 81–99. [Google Scholar] [CrossRef]
- Jun, S.-P. A comparative study of hype cycles among actors within the socio-technical system: With a focus on the case study of hybrid cars. Technol. Forecast. Soc. Chang. 2012, 79, 1413–1430. [Google Scholar] [CrossRef]
- Acs, Z.J.; Audretsch, D.B. Patents as a measure of innovative activity. Kyklos 1989, 42, 171–180. [Google Scholar] [CrossRef]
- Griliches, Z. Patent statistics as economic indicators: A survey. J. Econ. Lit. 1990, 28, 1661–1707. [Google Scholar]
- Choi, H.; Varian, H. Predicting the present with Google Trends. Econ. Rec. 2012, 88, 2–9. [Google Scholar] [CrossRef]
- Jun, S.-P.; Yeom, J.; Son, J. A study of the method using search traffic to analyze new technology adoption. Technol. Forecast. Soc. Chang. 2014, 81, 82–95. [Google Scholar] [CrossRef]
- Scherrer, A. How media coverage of technologies affects public opinion: Evidence from alternative fuel vehicles in Germany. Environ. Innov. Soc. Transit. 2023, 47, 100727. [Google Scholar] [CrossRef]
- Kim, S.; Ahn, S.; Kim, D.; Lee, E.; Seo, Y. Analysis of accuracy by part-of-speech of morphological analyzers. In Proceedings of the Korean Institute of Information Technology Summer Conference, Jeju, Republic of Korea, June 2022; pp. 378–381. (In Korean). [Google Scholar]
- Benjamini, Y.; Hochberg, Y. Controlling the false discovery rate: A practical and powerful approach to multiple testing. J. R. Stat. Soc. Ser. B Methodol. 1995, 57, 289–300. [Google Scholar] [CrossRef]
- Yu, H.; Ye, X.; Yan, X.; Wang, T.; Chen, J.; Ran, B. Searching for the inflection point of travel well-being from the views of travel characteristics based on the ordered logistic regression model. Sustainability 2023, 15, 15673. [Google Scholar] [CrossRef]
- Zhu, B.; Tian, S.-Q.; Wang, C.-C. Improving the sustainability effectiveness of traditional arts and crafts using supply–demand and ordered logistic regression techniques in Taiyuan, China. Sustainability 2021, 13, 11725. [Google Scholar] [CrossRef]
- Ko, Y.; Bae, K.; Kim, Y. Theory and practice of regulatory lag: Focusing on cases of conformity certification for industrial convergence new products. Legis. Policy 2018, 10, 171–191. (In Korean) [Google Scholar]
- Eyal-Cohen, M. Unintended legislative inertia. Ga. Law Rev. 2021, 55, 1193–1270. [Google Scholar] [CrossRef]
- Alrumaidhi, M.; Rakha, H.A. An econometric analysis to explore the temporal variability of the factors affecting crash severity due to COVID-19. Sustainability 2024, 16, 1233. [Google Scholar] [CrossRef]
- Antonides, G.; Welvaarts, M. Effects of default option and lateral presentation on consumer choice of the sustainable option in an online choice task. Sustainability 2020, 12, 5484. [Google Scholar] [CrossRef]
- Seong, J.; Valle de Souza, S.; Peterson, H.C. Seeds of industry sustainability: Consumer attitudes towards indoor agriculture benefits versus its advanced technology. Sustainability 2023, 15, 2369. [Google Scholar] [CrossRef]
- Schot, J.; Geels, F.W. Strategic niche management and sustainable innovation journeys: Theory, findings, research agenda, and policy. Technol. Anal. Strateg. Manag. 2008, 20, 537–554. [Google Scholar] [CrossRef]
- Gravino, P.; Prevedello, G.; Galletti, M.; Loreto, V. The supply and demand of news during COVID-19 and assessment of questionable sources production. Nat. Hum. Behav. 2022, 6, 1069–1078. [Google Scholar] [CrossRef] [PubMed]
- Zhao, X.; Li, X.; Zhao, Z.; Luo, T. Media attention and electric vehicle adoption: Evidence from 275 cities in China. Transp. Res. Part A Policy Pract. 2024, 190, 104269. [Google Scholar] [CrossRef]
- Heininger, R.; Jost, T.E.; Stary, C. Enriching socio-technical sustainability intelligence through sharing autonomy. Sustainability 2023, 15, 2590. [Google Scholar] [CrossRef]
- Schaefer, M.; Schmitt Olabisi, L.; Arola, K.; Poitra, C.M.; Matz, E.; Seigel, M.; Schelly, C.; Adesanya, A.; Bessette, D. Understanding socio-technological systems change through an Indigenous community-based participatory framework. Sustainability 2021, 13, 2257. [Google Scholar] [CrossRef]
- Weaver, R.K. The politics of blame avoidance. J. Public Policy 1986, 6, 371–398. [Google Scholar] [CrossRef]
- Wang, F.; Zhou, M.; Yu, H. Is more always better? Government attention and environmental governance efficiency: Empirical evidence from China. Sustainability 2024, 16, 7146. [Google Scholar] [CrossRef]
- Kim, S.; Lee, H.; Son, S.-W. Emerging diffusion barriers of shared mobility services in Korea. Sustainability 2021, 13, 7707. [Google Scholar] [CrossRef]
- Norton, E.C.; Dowd, B.E. Log odds and the interpretation of logit models. Health Serv. Res. 2018, 53, 859–878. [Google Scholar] [CrossRef]
- Mize, T.D. Best practices for estimating, interpreting, and presenting nonlinear interaction effects. Sociol. Sci. 2019, 6, 81–117. [Google Scholar] [CrossRef] [PubMed]
- Abrudan, I.-N.; Pop, C.-M.; Lazăr, P.-S. Using a general ordered logit model to explain the influence of hotel facilities, general and sustainability-related, on customer ratings. Sustainability 2020, 12, 9302. [Google Scholar] [CrossRef]
- Forrester, J.W. Industrial Dynamics; MIT Press: Cambridge, MA, USA, 1961. [Google Scholar]
- Tomai, M.; Ramani, S.V.; Papachristos, G. How can we design policy better? Frameworks and approaches for sustainability transitions. Sustainability 2024, 16, 690. [Google Scholar] [CrossRef]
- Moro-Visconti, R.; Cruz Rambaud, S.; López Pascual, J. Sustainability in FinTechs: An explanation through business model scalability and market valuation. Sustainability 2020, 12, 10316. [Google Scholar] [CrossRef]
- Mianes, R.L.; Reguly, A.; ten Caten, C.S. From quality infrastructure to sustainability: A 14-step path for voluntary conformity assessment in Brazil. Sustainability 2025, 17, 9783. [Google Scholar] [CrossRef]
Figure 1.
Research Model.
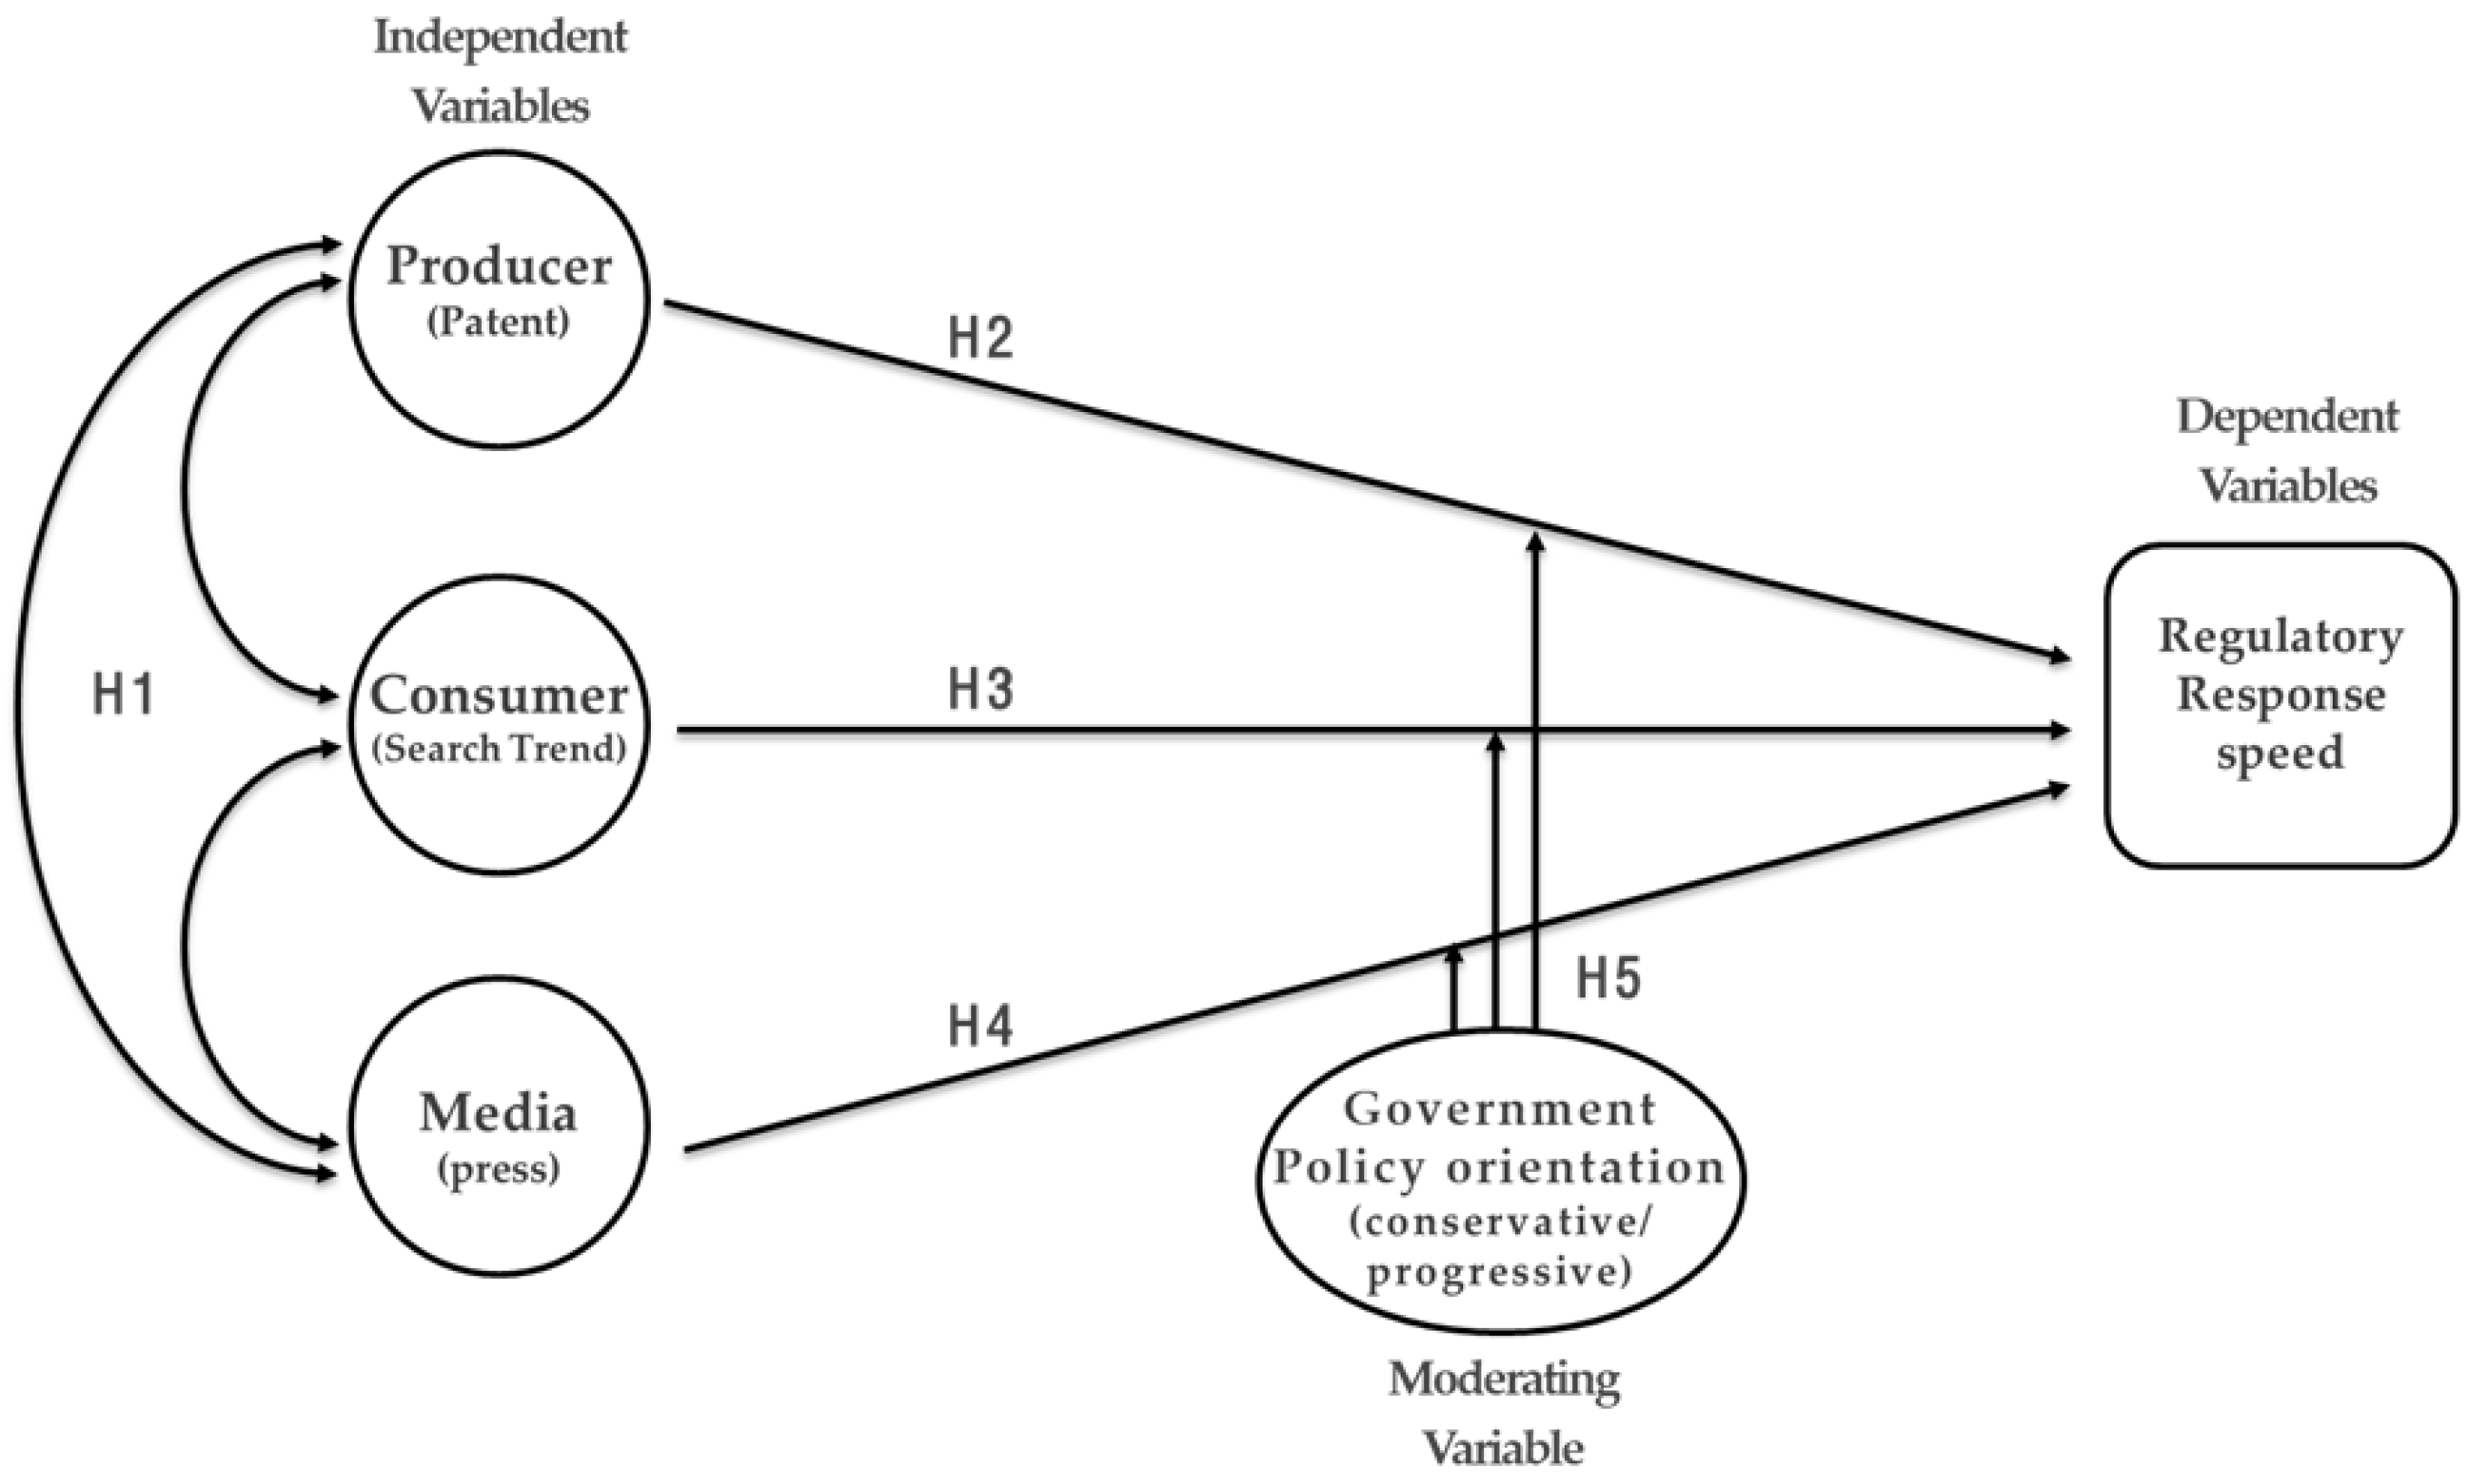
Figure 2.
Analysis Procedure.
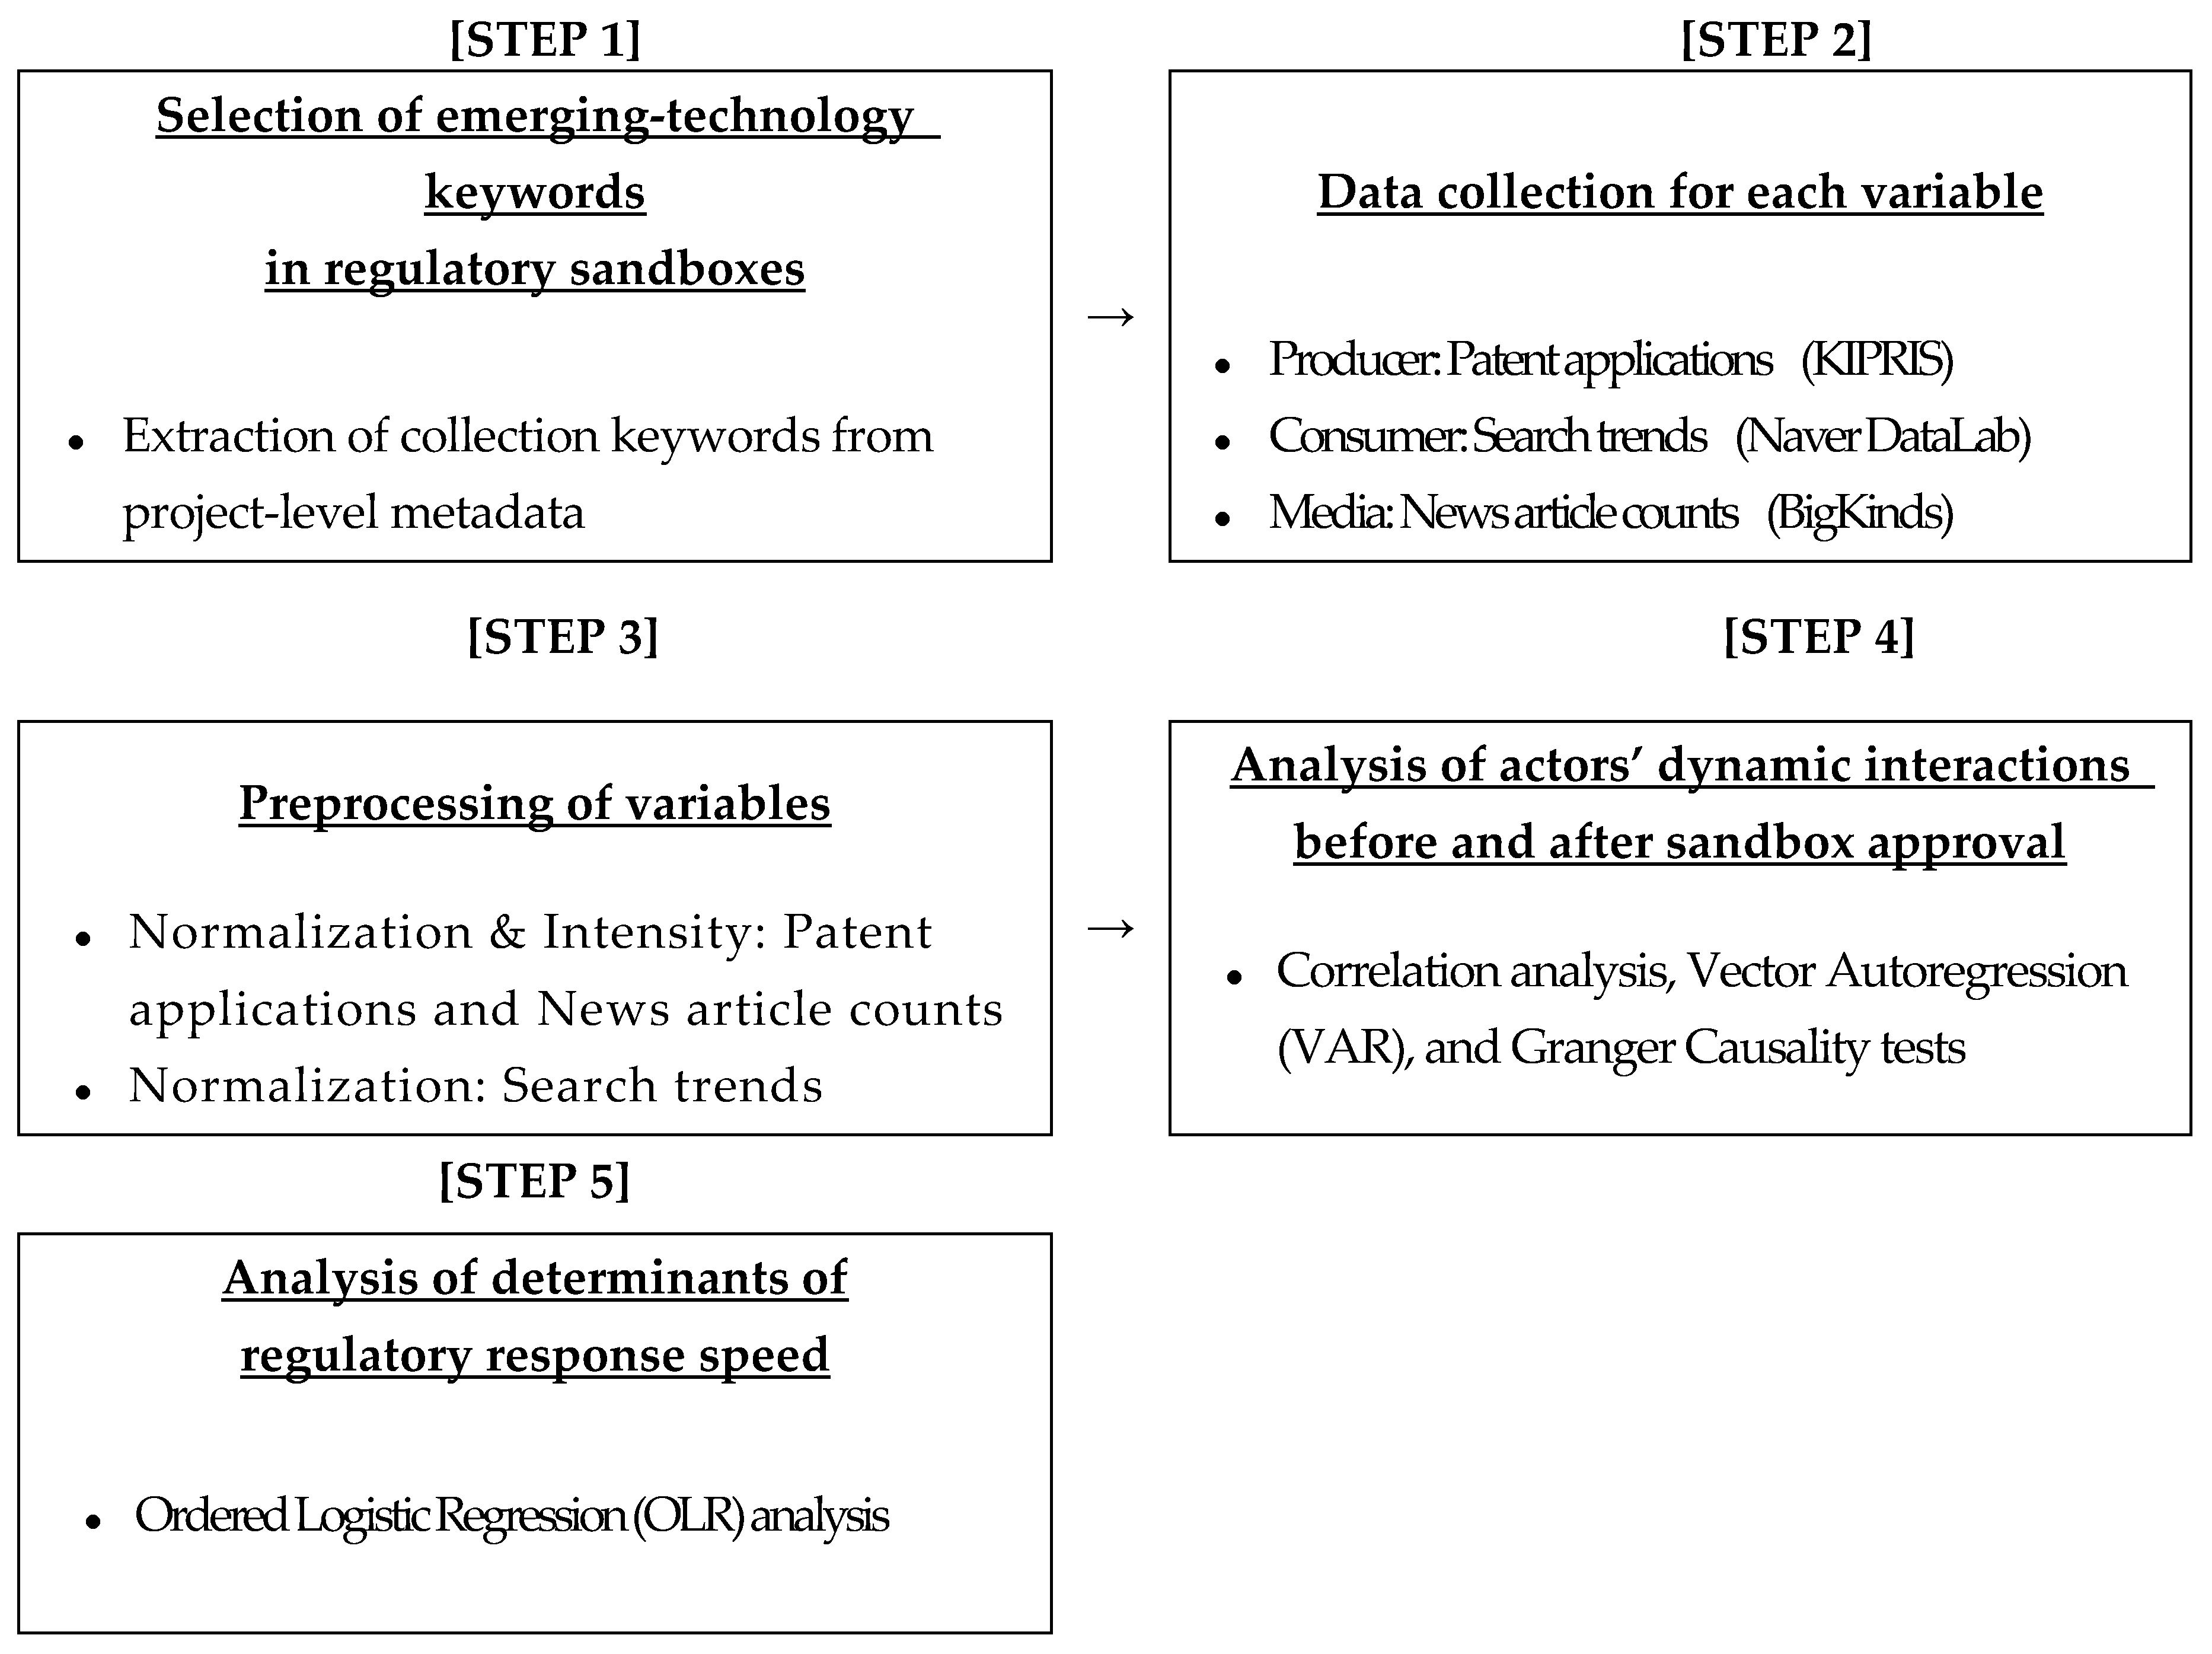
Figure 3.
Causal relationships among actors (producers, consumers, media).
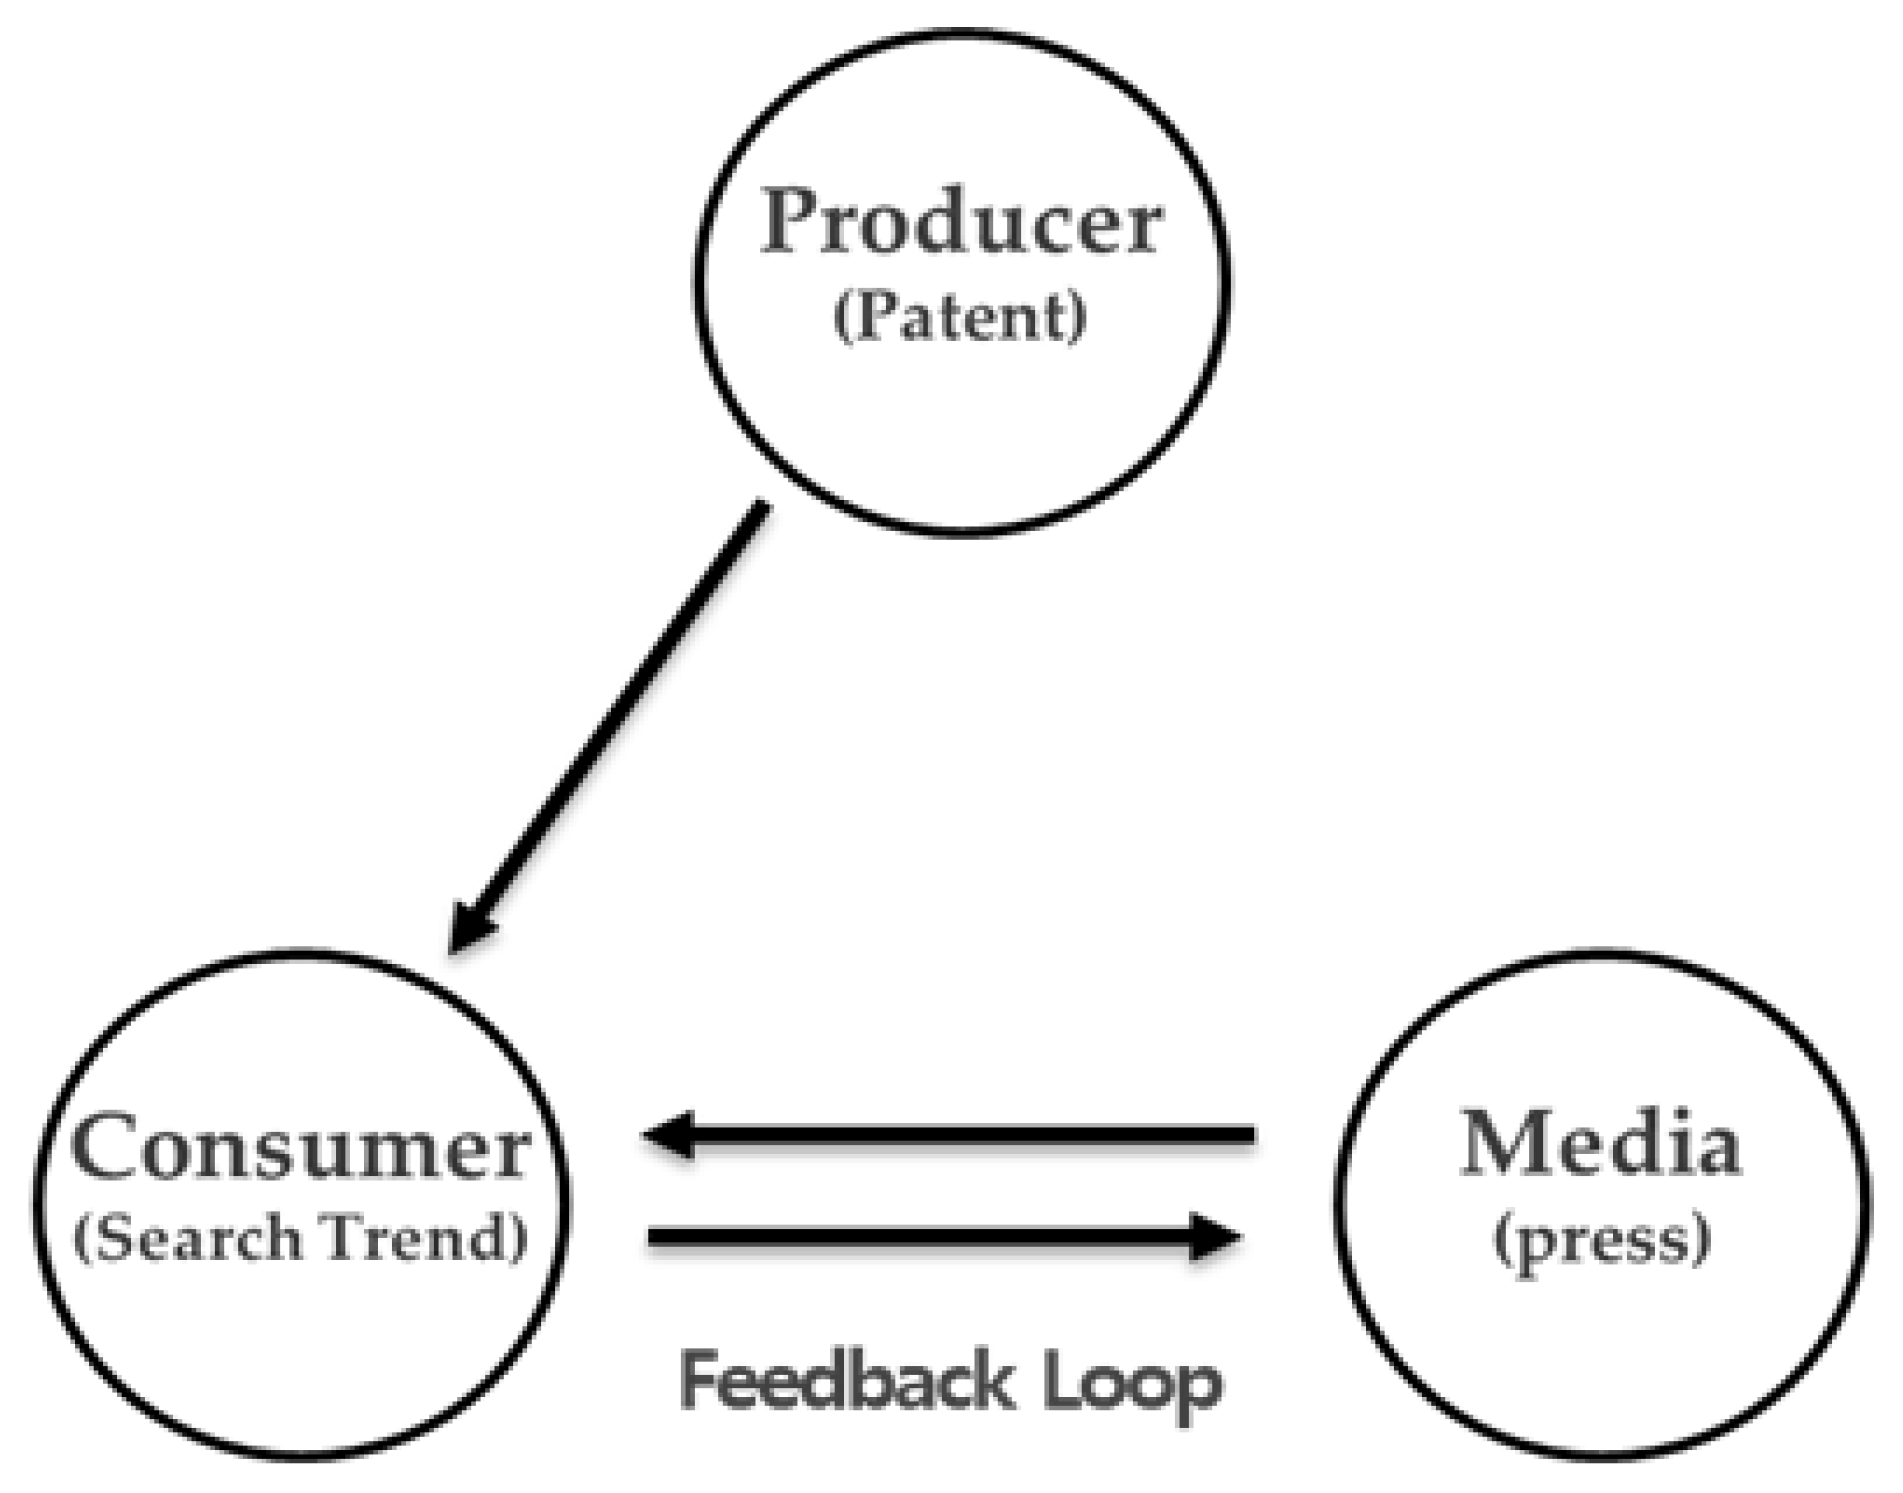
Figure 4.
Estimated Effects on Regulatory Response Speed in Model 3.
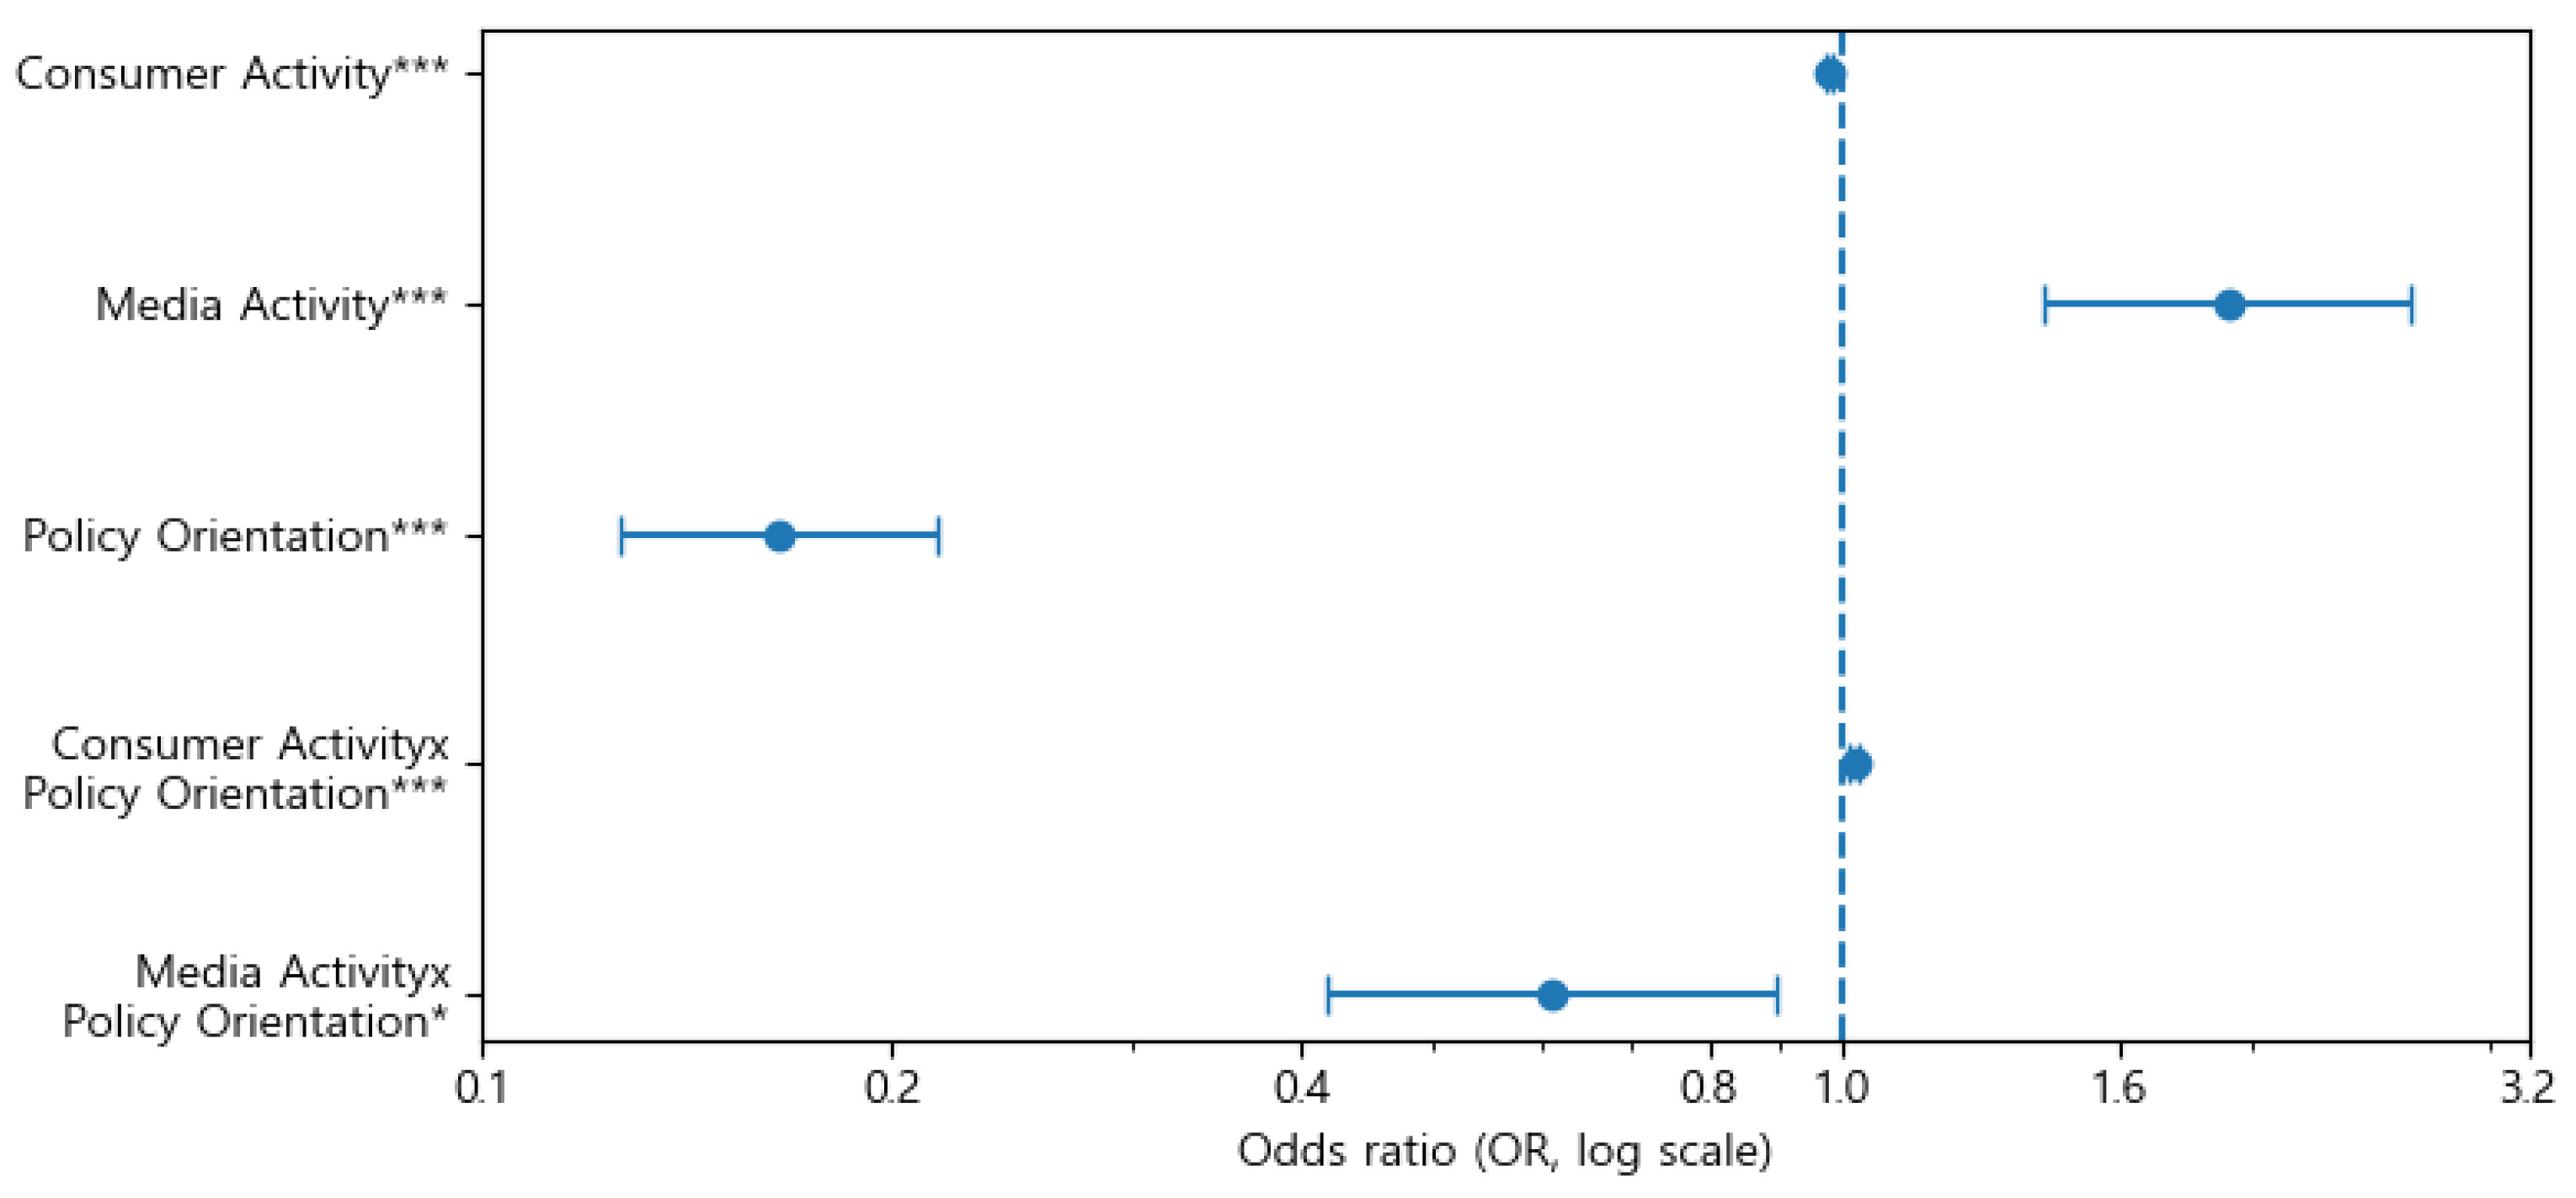
Figure 5.
Interaction Effect between Consumer Activity and Government Policy Orientation.
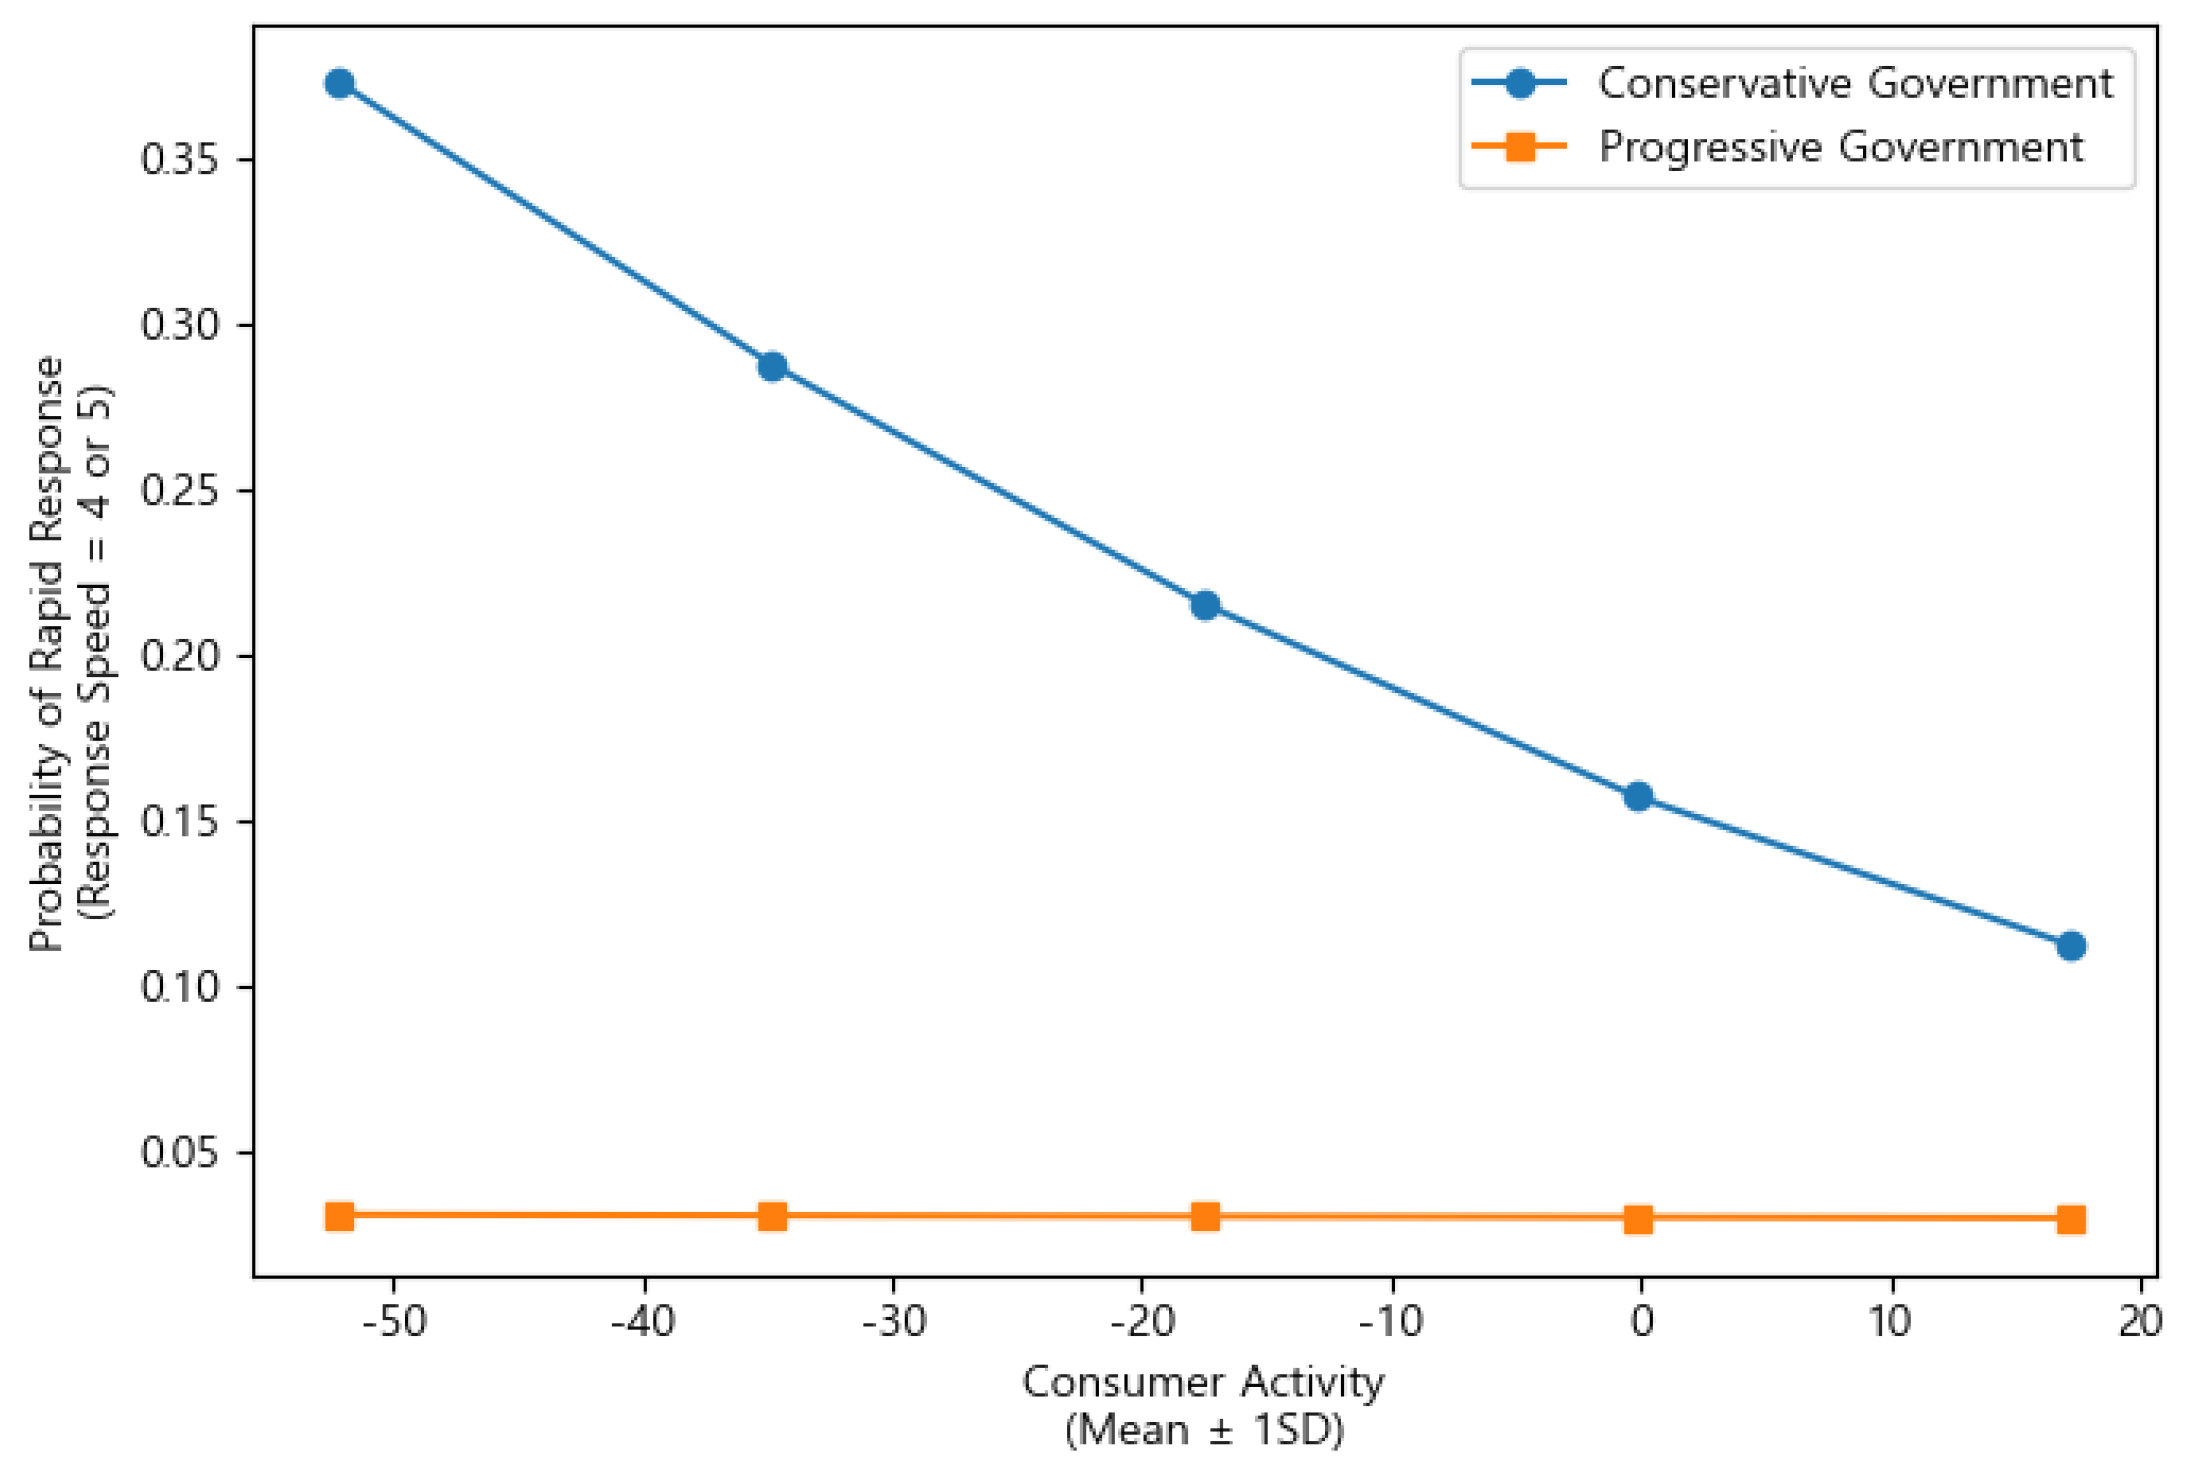
Figure 6.
Interaction Effect between Media Activity and Government Policy Orientation.
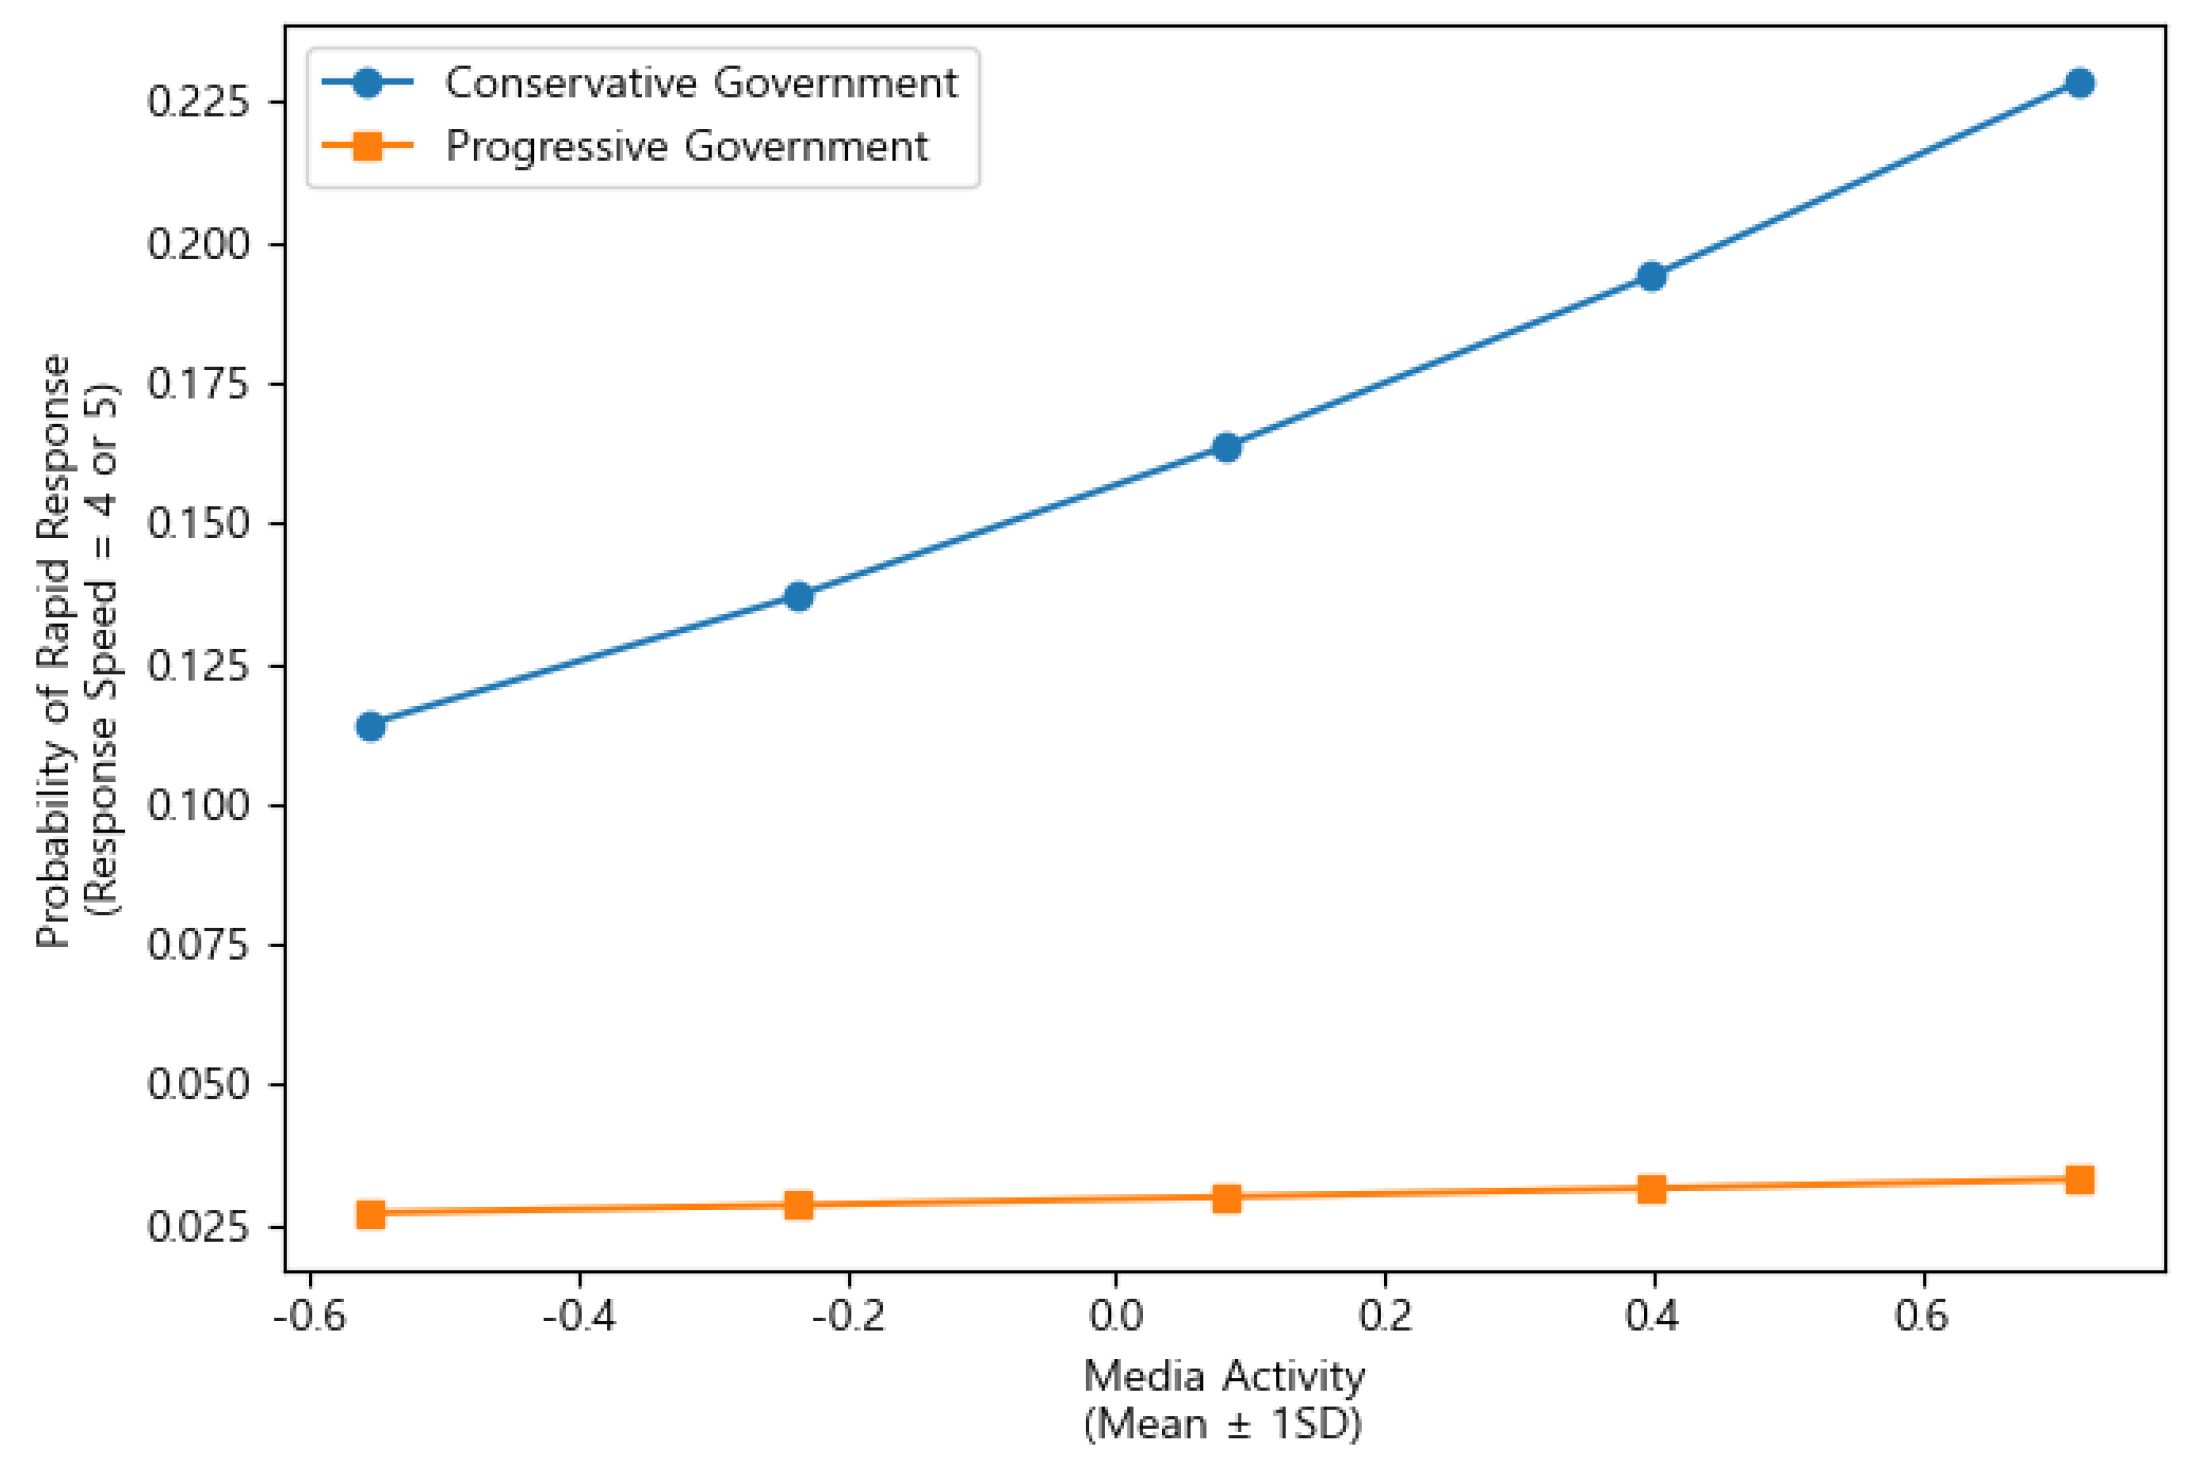

Table 1.
Definitions and measurement of variables.
| Research Variable | Measurement scale | Operational Definition | Measurement Method | |
|---|---|---|---|---|
| Dependent Variables | Regulatory response speed | Categorical (ordinal) |
Speed at which the government implements legal and administrative measures after regulatory sandbox approval of a given technology; reflects the level of policy responsiveness in adjusting relevant institutions (e.g., legislation, ministerial ordinances, technical standards) to the diffusion of emerging technologies. | For each sandboxed technology, classified into a five-level ordered category based on the time from sandbox approval (rapid confirmation, special exemption, or temporary permits) to completion of relevant legal/institutional revision: 5 = within 6 months; 4 = 6–12 months; 3 = 12–24 months; 2 = 24–36 months; 1 = more than 36 months or not revised. |
| Independent Variables | Producer (firms) |
Quantitative (continuous) | Level of innovation activity by producers (firms) leading the development and demonstration of emerging technologies, including standardization efforts, self-regulation, and policy engagement. | Number of patent applications filed in the relevant technology field (patent data) as an indicator of innovation intensity [55,56]. |
| Consumer (public) |
Quantitative (continuous) | Level of consumer (user) interest and participation in an emerging technology, including expansion of the user base, changes in perceptions, and active expression of opinions. | Naver search volume index for the relevant technology keyword(s), collected as a normalized search intensity indicator [55,56]. | |
| Media (press) |
Quantitative (continuous) | Degree to which an emerging technology becomes a public agenda item, captured by the volume and salience of media coverage; represents the level of media attention and agenda-setting around the technology. | Monthly number of news articles containing the relevant technology keyword(s) in the BigKinds news database, aggregated as a media coverage intensity indicator [36,55,57]. | |
| Moderating Variable | Government policy orientation | Categorical (dummy) | Ideological orientation of the incumbent governing coalition, which affects regulatory response—particularly its basic stance on technology regulation (e.g., progressive governments emphasizing consumer protection vs. conservative governments emphasizing deregulation and growth). | Coded as a dummy variable based on the ideological orientation of the administration during the analysis period: conservative = 0, progressive = 1, using official seat distributions and political statistics from the National Election Commission and the National Assembly Secretariat (KOSIS). |
Table 2.
Regulatory Sandbox Approvals by Year and Sector (Number of Approved Projects).
| Year | 2019 | 2020 | 2021 | 2022 | 2023 | 2024 | 2025 (to Aug.) |
|
ICT Convergence (Ministry of Science and ICT) |
40 | 46 | 49 | 27 | 38 | 51 | 31 |
|
Industrial Convergence (Ministry of Trade, Industry and Energy) |
39 | 63 | 96 | 129 | 160 | 221 | 121 |
|
Financial Innovation (Financial Services Commission) |
77 | 58 | 50 | 52 | 56 | 207 | 257 |
|
Regulation-Free Special Zones (Ministry of SMEs and Startups) |
39 | 26 | 10 | 5 | 4 | 12 | 7 |
|
Smart-City (Ministry of Land, Infrastructure and Transport) |
0 | 16 | 18 | 5 | 12 | 4 | 1 |
|
R&D Special Zones (Ministry of Science and ICT) |
0 | 0 | 5 | 10 | 9 | 19 | 3 |
|
Mobility (Ministry of Land, Infrastructure and Transport) |
0 | 0 | 0 | 0 | 0 | 26 | 25 |
|
Circular Economy (Ministry of Environment) |
0 | 0 | 0 | 0 | 0 | 9 | 3 |
| Total | 195 | 209 | 228 | 228 | 279 | 549 | 448 |
* Note: 2025 (to Aug.)” indicates approvals recorded up to the end of August 2025.
Table 3.
Correlations among actors (producers, consumers, media) before and after regulatory sandbox approval.
Table 3.
Correlations among actors (producers, consumers, media) before and after regulatory sandbox approval.
| Actor Pair | Pre-Approval r |
Post-Approval r |
△ r | Fisher r-to-z | FDR-adjusted q |
Significance | |
|---|---|---|---|---|---|---|---|
| Difference of z | Difference of p | ||||||
|
Producer -Consumer |
0.880*** | 0.391 | -0.489 | -3.45 | 0.000553 | 0.000553 | Significant |
|
Producer -Media |
-0.869*** | 0.261 | +1.130 | 5.72 | 1.08×10⁻⁸ | 1.63×10⁻⁸ | Significant |
|
Consumer -Media |
-0.869*** | 0.613** | +1.482 | 7.32 | 2.57×10⁻¹³ | 7.7×10⁻¹³ | Significant |
* Note: * p < 0.05, ** p < 0.01, *** p < 0.001 for individual correlations. Significance in last column refers to whether the change Δr is significant after FDR correction.
Table 4.
Results of Augmented Dickey-Fuller (ADF) Stationarity Test.
| Series Type | Variable | ADF Statistic | p-value | Result |
| Level (Original) |
Producer | -1.400 | 0.582 | Non-Stationary |
| Consumer | -1.443 | 0.561 | Non-Stationary | |
| Media | -1.761 | 0.400 | Non-Stationary | |
| First Difference (Transformed) |
Producer | -3.007 | 0.034 | Stationary |
| Consumer | -4.122 | 0.001 | Stationary | |
| Media | -5.913 | 0.000 | Stationary |
Table 5.
Optimal Lag Length Selection using Bayesian Information Criterion (BIC).
| Lag (Months) | BIC | Lag (Months) | BIC |
|---|---|---|---|
| 1 | -20.199 | 6 | -19.869 |
| 2 | -20.371* | 7 | -19.708 |
| 3 | -20.275 | 8 | -19.644 |
| 4 | -20.246 | 9 | -19.729 |
| 5 | -20.114 | 10 | -19.980 |
* Note: The optimal lag length is determined to be p =2 based on the lowest BIC value.
Table 6.
Vector Autoregression (VAR) and Granger Causality Test Results (p = 2).
|
Causal Path ( Cause→ Effect ) |
F-Statistic | p-value | q-value (FDR) | Significance ( FDR < 0.05 ) |
| consumer→producer | 0.159 | 0.853 | 0.853 | Not Significant |
| media→producer | 0.241 | 0.786 | 0.853 | Not Significant |
| producer→consumer | 6.023 | 0.003** | 0.015** | Significant |
| media→consumer | 4.745 | 0.009** | 0.018* | Significant |
| producer→media | 1.334 | 0.264 | 0.396 | Not Significant |
| consumer→media | 4.805 | 0.008** | 0.018** | Significant |
* Note: * p < 0.05, ** p < 0.01, *** p < 0.001, * q < 0.05, ** q < 0.01, *** q < 0.001.
Table 7.
Frequency Distribution of Regulatory Response Speed.
| Regulatory Response Speed | Frequency (N) | Percentage (%) | ||
|
Slower responses |
1 | > 36 months (or unrevised) | 497 | 36.17 |
| 2 | 24 – 36 months | 216 | 15.72 | |
| 3 | 12 – 24 months | 325 | 23.65 | |
| Rapid responses. |
4 | 6 – 12 months | 141 | 10.26 |
| 5 | < 6 months | 195 | 14.19 | |
| Total | 1,374 | 100.0 | ||
Table 8.
Comparison of model fit statistics (Ordered Logistic Regression).
| Model | N | LogLikelihood | AIC | BIC | McFadden R² |
|---|---|---|---|---|---|
|
Model 1 (Main Effects) |
1374 | -1834.610 | 3683.219 | 3719.797 | 0.083 |
|
Model 2 (With Moderator) |
1374 | -1711.014 | 3438.027 | 3479.831 | 0.145 |
|
Model 3 (Full Interaction) |
1374 | -1684.148 | 3396.296 | 3469.453 | 0.158 |
Table 9.
Ordered Logistic Regression Results (Models 1–3).
| Variable | Model 1 (Main Effects) |
Model 2 (With Moderator) |
Model 3 (Full Interaction) |
|||||
| Coeff. (β) | SE | Coeff. (β) | SE | Coeff. (β) | SE | |||
| Producer Activity(dlog) | -7.251 | 25.654 | -32.177 | 26.072 | 29.339 | 229.577 | ||
| Consumer Activity(diff) | -0.028*** | 0.002 | -0.016*** | 0.002 | -0.022*** | 0.002 | ||
| Media Activity(dlog) | 0.198* | 0.081 | 0.372*** | 0.084 | 0.653*** | 0.158 | ||
|
Policy Orientation(M) (Progressive=1) |
- | -1.975*** | 0.130 | -1.801*** | 0.137 | |||
|
Producer Activity(dlog) ×Policy Orientation(M) |
- | -15.142 | 250.397 | |||||
|
Consumer Activity(diff) ×Policy Orientation(M) |
- | 0.022*** | 0.004 | |||||
|
Media Activity(dlog) ×Policy Orientation(M) |
- | -0.492* | 0.195 | |||||
* Note: * p < 0.05, ** p < 0.01, *** p < 0.001, The reference group for Policy Orientation is Conservative (0).
Table 10.
Detailed Statistical Metrics for Model 3 (Full Interaction Model) – significance tests and odds ratios.
Table 10.
Detailed Statistical Metrics for Model 3 (Full Interaction Model) – significance tests and odds ratios.
| Variable | z-value | p-value | Odds Ratio (OR) |
95% CI (Lower) |
95% CI (Upper) |
|---|---|---|---|---|---|
| Producer Activity(dlog) | 0.128 | 0.8983 | - a) | 2.1 ×10-183 | 1.45×10208 |
| Consumer Activity(diff) | -10.744 | <0.0001 | 0.978 | 0.974 | 0.982 |
| Media Activity(dlog) | 4.130 | <0.0001 | 1.922 | 1.409 | 2.620 |
|
Policy Orientation(M) (Progressive=1) |
-13.183 | <0.0001 | 0.165 | 0.126 | 0.216 |
|
Producer Activity(dlog) ×Policy Orientation(M) |
5.525 | <0.0001 | 1.022 | 1.014 | 1.030 |
|
Consumer Activity(diff) ×Policy Orientation(M) |
-2.528 | 0.0115 | 0.611 | 0.417 | 0.895 |
|
Media Activity(dlog) ×Policy Orientation(M) |
-0.060 | 0.9518 | 2.65×10⁻⁷ | 1.91 ×10-220 | 3.68 ×10206 |
* Note: a) The Odds Ratio (OR) for Producer Activity is omitted due to the excessively large standard error which makes its value unreliable. Since the producer coefficient is statistically insignificant (p > 0.05), this omission does not affect the hypothesis testing results.
Disclaimer/Publisher’s Note: The statements, opinions and data contained in all publications are solely those of the individual author(s) and contributor(s) and not of MDPI and/or the editor(s). MDPI and/or the editor(s) disclaim responsibility for any injury to people or property resulting from any ideas, methods, instructions or products referred to in the content. |
© 2026 by the authors. Licensee MDPI, Basel, Switzerland. This article is an open access article distributed under the terms and conditions of the Creative Commons Attribution (CC BY) license.
Copyright: This open access article is published under a Creative Commons CC BY 4.0 license, which permit the free download, distribution, and reuse, provided that the author and preprint are cited in any reuse.


