
Submitted:
27 December 2025
Posted:
29 December 2025
You are already at the latest version
Abstract
Hemostasis depends on the coordinated interaction between platelets, coagulation factors, endothelium and shear forces. Current point-of-care (POC) assays evaluate isolated components of haemostasis or operate under nearly static conditions, limiting their ability to reproduce physiological thrombus formation. In this study, we performed the technical validation of Smart Clot, a fully automated, microfluidic POC platform that quantifies platelet aggregation, fibrin formation, and total thrombus growth under controlled arterial shear using unmodified whole blood. Recalcified citrated blood was perfused over collagen at \( \dot{\gamma} \)w = 300 s⁻¹. Dual-channel epifluorescence microscopy acquired platelet and fibrin(ogen) signals at 1 frame per second. Integrated Density time-series were fitted with a five-parameter logistic model; first derivatives and their integrals yielded standardized pseudo-volumes for platelets, fibrin, and total thrombus. Sixty-two healthy donors established reference distributions; one-hundred-thirteen patients on antithrombotic therapy assessed pharmacodynamic sensitivity. Platelets-derived parameters were approximately normally distributed, whereas fibrin(ogen) and total-thrombus values followed log-normal patterns. Anticoagulants and antiplatelet agents produced graded, mechanism-consistent inhibition of all thrombus components. Cardiopulmonary-bypass samples showed profound but transient suppression of platelet and fibrin activity. Across activity ranges, multiple statistical assessments supported high analytical repeatability. Smart Clot provides rapid, reproducible, flow-aware quantification of platelet–fibrin dynamics, capturing pharmacological modulation and peri-operative impairment with high sensitivity. These results support its potential as a next-generation POC assay for physiological hemostasis assessment.
Keywords:
Smart Clot
; point-of-care
; flow-based hemostasis
; platelet–fibrin interactions
; thrombin generation
; integrated density
; microfluidics
; anticoagulants
; antiplatelet therapy
; cardiopulmonary bypass
1. Introduction
Hemostasis is a vital physiological process that prevents excessive bleeding when blood vessels are injured and allows normal blood fluidity in basal conditions. It involves a complex series of events leading to the formation of a stable blood clot, which temporarily seals the injury and preserves circulatory integrity. Understanding these mechanisms is crucial for diagnosing and treating bleeding disorders and thrombotic conditions.
Blood clotting can be divided into primary and secondary hemostasis, which operate in a tightly coordinated manner. Primary hemostasis involves platelet adhesion, activation, and aggregation at the site of vascular injury, forming the initial platelet plug [1]. Secondary hemostasis relies on the enzymatic coagulation cascade, generating insoluble, cross-linked fibrin that stabilizes the plug and incorporates blood cells [2]. Platelets and coagulation factors act interdependently: platelets provide a catalytic surface for coagulation complex assembly, while thrombin generated in secondary hemostasis further activates platelets and amplifies clot formation [3,4].
Conventional coagulation assays, although widely used in clinical laboratories, present intrinsic limitations. Many tests are performed on separated blood fractions, require exogenous activators or inhibitors, and lack the fluid-dynamic environment characteristic of the vasculature [1,5]. This reductionist approach prevents assessment of the coordinated interplay between platelets and coagulation, leading to partial representation of the hemostatic process. As a result, current diagnostics may fail to reflect a patient’s actual hemostatic status, particularly in emergency or therapeutic monitoring scenarios [6,7,8]. Microfluidic systems replicating vascular flow have been developed as research tools to study thrombus formation in vitro. These platforms have provided valuable mechanistic insights but remain complex, manual and time consuming, and unsuitable for point-of-care (POC) implementation [9]. Despite decades of progress, there is still no clinically available method capable of integrating platelet aggregation, fibrin formation, and thrombus stabilization under physiological flow conditions.
Point-of-care testing has emerged as a strategy to monitor coagulation at the patient’s bedside. Current POC methods are limited, focusing either on platelet adhesion/aggregation or on viscoelastic properties of clot formation, often under static conditions and with restricted clinical applicability [10,11,12,13].
The Smart Clot system is a fully automated POC device designed to overcome these limitations. It reproduces the physiological interplay between platelets, coagulation factors, and shear forces, without adding external activators or inhibitors. In a microfluidic chamber, whole blood flows over a collagen-coated surface, enabling platelet adhesion and aggregation (primary hemostasis), subsequent thrombin generation, and fibrin mesh formation (secondary hemostasis) [3,10,14]. Smart Clot thus provides a quantitative assessment of the full thrombotic process, capturing both platelet and fibrin contributions and their integration in thrombus formation under near-physiological conditions.
This work reports the technical validation of Smart Clot. Specifically, we analyzed (i) healthy blood donors, to establish reference distributions and assess inter-individual variability, and (ii) patients with cardiovascular disease receiving antiplatelet or anticoagulant therapy, to evaluate the system’s ability to detect pharmacological modulation of hemostasis. This dual approach demonstrates both the robustness of the technology in physiological conditions and its translational potential for clinical practice.
2. Materials and Methods
2.1. Device Description and Optical System Calibration
The Smart Clot instrument (Sedicidodici S.r.l., Pordenone, Italy) has been described in detail previously [14]. It consists of a computerized microscopy unit with a high-precision motorized stage and integrated fluorescence illumination, coupled to a disposable microfluidic cartridge designed for single use. The analytical workflow is fully automated, encompassing reagent handling, flow control, temperature regulation, and image acquisition.
Each cartridge forms a rectangular microchannel (21 mm × 2.1 mm × 0.2 mm, length × width × height) made of medical-grade silicone with a glass roof coated with type I fibrillar collagen. This configuration mimics a vascular surface and provides a reproducible environment for platelet adhesion and fibrin formation under flow. Whole blood is recalcified immediately before testing and perfused at a constant wall shear rate (w = 300 s⁻¹), representative of an average value in large arterial vessels [15]. The wall shear rate was calculated as:
where Q is the volumetric flow rate and r is the hydraulic radius of the channel.
Epifluorescence microscopy was performed with a 20× objective (RMS20X, Olympus Corporation, Tokyo, Japan) and a monochrome CMOS camera (C13752-50U, Hamamatsu Photonics, Hamamatsu, Japan), providing submicron spatial resolution. Illumination was achieved with high-stability green (Mic-LED-550A) and blue (Mic-LED-500A) LEDs (Prizmatix, Holon, Israel), supplemented by a white LED source (LSQ-00-050-2-W-24V, TMS Lite, Sungai Ara Penang, Malaysia). Excitation and emission were controlled by narrow-band filters (ET546/22x, ET480/30x, and 59004m, Chroma Technology, Bellows Falls, VT, USA).
Calibration of optical response and detector homogeneity was performed using InSpeck™ Green and Orange microspheres (Thermo Fisher Scientific, Waltham, MA, USA). These 2.5 µm polystyrene beads, comparable in size to platelets, provide defined fluorescence intensities (0–100%). Calibration ensured a linear detector response and uniform illumination across the dynamic range, as recommended for quantitative fluorescence microscopy [16,17].
2.2. Test Procedure and Experimental Workflow
Acid-soluble type I collagen (200 µL) was introduced into the Smart Clot cartridge, and reagents from the automation kit were loaded according to manufacturer instructions. Once inserted, the cartridge was automatically heated to 37 °C and pre-incubated for 7 min to stabilize the collagen coating on the bottom of the slide of the cartridge that contains the perfusion microchannel.
During initialization, platelets were stained with DiOC6(3) (green fluorochrome) to label platelet membranes. Autofocus was achieved using micro-engraved fiducial marks on the slide. After rinsing with saline (0.9% NaCl), CaCl₂ (10 mM) and Alexa Fluor™ 546–conjugated fibrin(ogen) were sequentially aspirated before blood introduction.
The perfusion phase lasted 7 minutes and 30 seconds, during which platelets adhered and aggregated, while fibrin formed through endogenous thrombin. Images were recorded at 1 frame/second per channel, yielding an effective 2 seconds temporal resolution per fluorochrome.
Dual-channel fluorescence alternated between green (platelets) and red (fibrin) without spectral overlap. Fluorescence images were captured every second per channel, alternating excitation wavelengths to separately acquire platelet and fibrin(ogen) signals. Composite pseudo-color images (merged DiOC6(3) + Alexa 546) were obtained using ImageJ v1.54i [18].
2.3. Image Processing and Quantitative Analysis
Automated analysis was conducted using Smart Clot software v30.0.8 (A.S.T. Biomedical, Albino, Italy). Each image sequence was binarized using adaptive thresholding optimized for platelet and fibrin structures. Segmented stacks were merged, small artifacts (< 2 pixels) were removed, and binary masks were multiplied by original grayscale images to restore intensity information. Each pixel represented 0.4 µm², enabling visualization of individual platelets (~ 2 µm diameter).
For each frame, the software computed:
- Area (µm²);
- Mean gray value (0–255);
- Integrated Density (ID) = Area × Mean Gray Value, corresponding to a pseudo-volume of adherent/aggregated elements.
Time-series of ID were plotted from t = 0 s (Ca²⁺ addition) to 450 s. Curves were fitted with a Richards’ five-parameter logistic (5PL) model using robust regression to minimize outlier impact. For comparison, a fifth-degree polynomial model (as in [14]) was applied; goodness of fit was assessed by calculating mean Robust Sum of Squares (RSS) and ∆RSS (poly₋5PL).
Across platelet, fibrin, and total-thrombus curves, the 5PL model yielded superior fit quality and smoother derivatives (see the supplementary data section, Table S1). From these fits, first derivatives (rate of thrombus growth) and numerical integrals (area under the derivative curve) were computed, representing standardized thrombus pseudo-volumes under flow [19,20]. This pipeline suppressed optical noise and enhanced reproducibility of platelet–fibrin kinetics.
2.4. Reagents
- Type I collagen (Merck, Darmstadt, Germany) prepared at 1–1.5 mg/mL [21].
- Alexa Fluor™ 546–fibrinogen (Thermo Fisher Scientific, Waltham, MA, USA) used at 10 µg/mL in DPBS;
- DiOC6(3) (Thermo Fisher Scientific, Waltham, MA, USA) resuspended in DMSO [22] and used at 0.87 µM (DMSO < 1%);
- Calcium chloride (10 mM) and NaCl 0.9% were analytical grade (Merck, Darmstadt, Germany).
2.5. Blood Sampling from Healthy Donors and Patients
The study was approved by the Unique Regional Friulian Ethics Committee (CEUR, CRO-2017-31) and the Territorial Ethics Committee Lombardy 1 (I.R.C.C.S. San Donato Hospital, CET 40-2023), following the Declaration of Helsinki and National Law. All patients signed the study-specific informed consent.
Healthy donors (n = 62, aged 18–65) had no medication for ≥ 3 weeks and met Italian Ministry of Health eligibility criteria (DLGS 2015).
Patients (n = 113) with cardiovascular conditions were on stable antithrombotic therapy > 4 weeks and divided into six groups:
- Vitamin K Antagonists (VKAs), n = 6 — Warfarin/Acenocoumarol, INR 2.01–3.21;
- Direct Oral Anticoagulants (DOACs), n = 18 — Anti-Xa or anti-IIa agents, INR 1.01–1.91;
- Acetylsalicylic Acid (ASA), n = 24 — aspirin 100 mg/day;
- P2Y12 receptor inhibitors (P2Y12 inh), n = 11 — clopidogrel 75 mg/day;
- Dual Antiplatelet Therapy (DAPT), n = 32 — ASA + Clopidogrel dual therapy;
- Extracorporeal Circulation (ECC), n = 22 — Cardiopulmonary bypass patients. All pre-ECC patients were on low-dose aspirin (100 mg/day) for secondary prevention, and during surgery were treated with heparin 300 IU/kg followed by protamine sulfate at a 1:1 heparin-to-protamine ratio (EACTS 2024 guidelines).
Samples were collected into 3.2% sodium citrate, discarding the first tube. Processing occurred within 2.5 h at 20–25 °C to preserve platelet function.
2.6. Repeatability of the Smart Clot Assay
Intra-assay repeatability was tested using 60 whole-blood samples grouped by activity range relative to normal donor mean area under the first derivative curve (AUC ID):
- High (≈ 100%), healthy donors (n = 20);
- Intermediate (≈ 50%), patients under anticoagulant/antiplatelet therapy (n = 20);
- Low (< 30%), patients with marked therapeutic suppression (n = 20).
Each sample was run in duplicate, within 1 hour, under identical conditions. For each pair, the bias, absolute bias, standard deviation (SD), standard error of the mean (SEM %), and intraclass correlation coefficient (two-way random, single measures, absolute agreement; ICC(2,1)) were computed to assess precision.
2.7. Statistics
All statistical analyses were performed using GraphPad Prism 10.6.1 (GraphPad Software, San Diego, CA, USA) and Microsoft Excel 365 (Microsoft Corporation, Redmond, WA, USA). The first was employed both for data processing and for the generation of graphs. Quantitative data were first tested for normality and homogeneity of variance, in order to determine the appropriate statistical tests to apply. Depending on the dataset, descriptive statistics (mean ± standard deviation or median with interquartile range, IQR) were calculated, and comparative analyses were performed using parametric or non-parametric tests as appropriate.
For Integrated Density distribution histograms (Section 3.3), bins number and widths were selected according to the Freedman-Diaconis rule.
3. Results
3.1. Analytical Framework and Kinetic Behavior in Healthy Donors
Smart Clot analysis of 62 healthy donors (aged 18–65 years) established the reference dataset for thrombus-formation kinetics under physiological flow. Each time-series of ID for platelets, fibrin(ogen), and total thrombus was fitted using the 5PL model, which yielded excellent fitting accuracy and smoother derivatives compared to polynomial regression (see Supplementary Data, Table S1).
The mean first derivative curve calculated from the sigmoidal curves (total thrombus) revealed a characteristic unimodal shape (Figure 1), whose lag time - derived from the fibrin(ogen) derivative - occurred at approximately 241 ± 39 s, marking the onset of endogenous thrombin generation. AUC ID values quantified the thrombus pseudo-volume (platelet + fibrin components), while the peak of the derivative represented the maximal rate of thrombus growth.
Mean and percentile distributions of AUC ID values demonstrated that platelet values were approximately normally distributed, whereas fibrin and total-thrombus values exhibited right-skewed, log-normal patterns, indicating greater variability in secondary-hemostasis dynamics (see Section 3.3). These parameters provide a comprehensive kinetic fingerprint of physiological thrombus formation in native whole blood. The peak value of the first derivative is omitted from the calculations for simplicity and pending full validation.
3.2. Intra-Assay Repeatability of Smart Clot
Intra-assay repeatability was evaluated across three analytical ranges of thrombus-formation activity: high (≈ 100% of normal donor AUC ID), intermediate (≈ 50%), and low (< 30%) (Table 1).
Each group comprised 20 whole-blood samples tested in duplicate under identical conditions.
Across all activity levels, SEM values remained below 10% and ICC(2,1)) ranged 0.7–0.9, confirming excellent intra-assay precision. Bias and standard-deviation analyses showed no systematic drift between replicates, even in samples with markedly reduced AUC ID. The method therefore demonstrated consistent reproducibility over a broad dynamic range of platelet and fibrin contributions.
These results validate the system’s analytical robustness as a quantitative POC platform, comparable or superior to established microfluidic and viscoelastic assays [5,9,10]. The low dispersion across biological activity gradients supports its suitability for both research and clinical monitoring contexts.
3.4. Distribution of Quantitative Thrombus Parameters
Blood samples from 62 healthy donors (aged 18–64 years, without stratification for sex, weight, or lifestyle) were analyzed using the Smart Clot system. Quantitative parameters were derived from the integrals of the first derivative of the fitted sigmoidal curves describing platelet aggregation, fibrin formation, and total thrombus growth. These integrals correspond to the pseudo-volume of the thrombus expressed in AUC ID units, providing a standardized quantitative descriptor of clot kinetics and composition.
Statistical analysis revealed distinct distribution patterns for the three hemostatic components. Platelet-derived AUC ID values followed an approximately normal (Gaussian) distribution, reflecting a relatively uniform aggregation behavior within the donor population. In contrast, fibrin(ogen)-derived and total-thrombus parameters showed a right-skewed log-normal distribution, with the shift toward higher values becoming more pronounced when platelet and fibrin contributions were combined (Figure 2, Table 2).
The distribution of measured parameters was assessed using Shapiro–Wilk and D’Agostino–Pearson tests (α = 0.05). Platelet data appeared approximately normally distributed, with p > 0.05 for both normality and log-normality tests, indicating that neither distribution could be rejected. Fibrin(ogen) and total-thrombus parameters showed p < 0.05 for normality but p > 0.05 for log-normality, i.e., normality was rejected while log-normality could not be rejected, consistent with an asymmetric distribution skewed toward higher thrombus pseudo-volumes. These results suggest that, even among apparently healthy individuals, the global hemostatic response under flow tends to evolve toward increased fibrin contribution and integrated thrombus size—an intrinsic variability that may underlie population-level heterogeneity in coagulation potential. The statistical analysis results, including p-values and the corresponding distribution interpretation, are provided in Supplementary Table S2.
3.5. Effects of Anticoagulant and Antiplatelet Therapy on Thrombus Formation
Smart Clot testing revealed distinct inhibitory profiles associated with different classes of antithrombotic therapy under physiological flow conditions. In patients treated with DOACs or VKAs, both platelet- and fibrin(ogen)-derived AUC ID values were markedly reduced compared with healthy donors (Figure 3A). The decrease was most pronounced in total-thrombus formation, confirming a global anticoagulant effect.
Interestingly, VKAs-treated patients with subtherapeutic INR values (1.27–1.94, data shown in Supplementary Materials, Table S3) exhibited intermediate Total Thrombus AUC ID levels (mean = 4.75 × 10⁷ µm² x MGV), suggesting that Smart Clot quantitatively captures gradations of anticoagulant intensity. This finding indicates a potential correlation between thrombus pseudo-volume and pharmacodynamic effect, although the exact relationship with INR remains to be clarified.
Representative fluorescence composites (Figure 3B) confirm the quantitative data: compared with donor controls, DOACs and VKAs produced progressively smaller, less cohesive thrombi, with reduced co-localization of platelet (green) and fibrin(ogen) (red) signals and corresponding flattening of the 3D Integrated Density profiles. Quantitative AUC ID parameters are provided in Supplementary Table S3.
Antiplatelet agents exerted a more selective inhibition pattern (Figure 4A). ASA caused a moderate reduction in total-thrombus AUC ID, while clopidogrel (P2Y12 receptor inhibitor) induced a more marked decrease, consistent with its central role in ADP-mediated aggregation. DAPT resulted in a synergistic effect, producing the lowest total-thrombus values across all treatment groups (p < 0.0001 vs controls). These findings reflect the complementary mechanisms of ASA and P2Y12 receptor inhibitors blockade on primary hemostasis under flow. Qualitative imaging (Figure 4B) further corroborates the quantitative inhibition: the pseudo-merged fluorescence images show diminished platelet–fibrin(ogen) overlap and reduced yellow co-localization, mirrored by shallow pseudo-3D reconstructions. The full-length comparative video between a healthy donor and a DAPT patient is provided in Supplementary Video S1, illustrating the markedly slowed kinetics and diminished thrombus architecture induced by dual therapy. Quantitative AUC ID parameters are provided in Supplementary Table S4.
In patients undergoing cardiopulmonary bypass (ECC), Smart Clot detected profound but transient impairment of thrombus formation (Figure 5A). Post-ECC samples collected immediately after protamine administration (t₀) exhibited minimal platelet and fibrin(ogen) activity, while samples obtained at ICU admission (≈ 1.5 h later) showed partial recovery. These changes paralleled hematological alterations: platelet count fell by ≈ 35% on average (range 17–62%), and fibrinogen levels declined from 191–484 mg/dL pre-ECC to 106–305 mg/dL post-ECC ICU (Table 3).
Pre-ECC samples, which represent the patients’ basal hemostatic state prior to extracorporeal circulation, showed a pattern comparable to that observed in ASA-treated subjects (Figure 4A). Platelet-derived Integrated Density displayed a mild, non-significant reduction relative to healthy donors, whereas fibrin(ogen)-derived values were significantly lower. This behaviour is consistent with the chronic low-dose aspirin regimen (≈100 mg/day) recommended for secondary cardiovascular prevention and routinely administered in this patient population (see Materials and Methods). Despite the marked suppression of platelet-, fibrin(ogen)- and total-thrombus AUC IDs in both Post-ECC t₀ and Post-ECC ICU samples, conventional plasma-based indices (INR and aPTT) remained within or close to normal ranges (Table 3). This divergence suggests that Smart Clot detects functional impairments of thrombus formation that are not captured by routine coagulation assays in the early post-bypass phase. The corresponding pseudo-merged and 3D reconstructions (Figure 5B) reveal near-absence of organized thrombus immediately after ECC, followed by partial re-establishment of platelet–fibrin(ogen) co-localization during early recovery. Quantitative AUC ID parameters are provided in Supplementary Table S5.
Overall, these results demonstrate that Smart Clot effectively discriminates between the pharmacodynamic signatures of anticoagulant and antiplatelet therapies, as well as surgery-induced coagulopathy, under flow. The concordance between quantitative (AUC ID) and qualitative (imaging) findings highlights the system’s sensitivity in detecting both the magnitude and temporal evolution of thrombus inhibition.
4. Discussion
4.1. Physiological Relevance of Smart Clot under Flow
A defining feature of the Smart Clot assay is its ability to reproduce, within a fully automated point-of-care configuration, the coordinated sequence of events that governs thrombus formation under physiological flow.
Consistent with the recommendations of the Biorheology Subcommittee of the SSC of the ISTH, Smart Clot integrates native whole blood, collagen as a physiologically relevant substrate, and controlled shear flow to preserve the spatiotemporal sequence of thrombus formation [9]. Under these conditions, platelet recruitment is initiated by von Willebrand Factor (vWF)-mediated tethering through the GPIb–IX–V complex, followed by firm adhesion and activation via αIIbβ3–vWF, GPVI, and α₂β₁ interactions [1,2,3,24,25]. These early adhesive events trigger intracellular Ca²⁺ signaling and granule secretion, promoting phosphatidylserine exposure and platelet-associated tissue factor activity, which together support the assembly of procoagulant enzyme complexes on the platelet surface [2,3,4,5,26,27,28,29,30]. This integrated biomechanical and biochemical environment distinguishes Smart Clot from conventional plasma-based assays and viscoelastic systems, which primarily interrogate isolated components of coagulation or fibrin mechanics under static or artificially activated conditions. By preserving shear-dependent platelet function and endogenous thrombin generation, Smart Clot captures the functional coupling between primary and secondary hemostasis that underlies physiological thrombus growth [7,14]. The original schematic in Supplementary Figure S1, grounded in recent literature, provides the reference model through which Smart Clot-derived measurements of platelet, fibrin(ogen), and total thrombus pseudo-volumes should be read and discussed. Importantly, this design choice is not intended as a qualitative demonstration per se, but as the prerequisite that enables the system to resolve pharmacological modulation and perioperative perturbations of thrombus formation observed in subsequent analyses.
The sensitivity of Smart Clot to antiplatelet agents, anticoagulants, and cardiopulmonary bypass–associated coagulopathy can therefore be interpreted as a direct consequence of operating within a flow-dependent, physiologically faithful hemostatic context, bridging experimental microfluidic models [11,31] and clinically applicable point-of-care diagnostics.
4.2. Analytical Robustness and Comparison with Conventional POC Systems
Smart Clot exhibited high analytical repeatability across the entire thrombus-formation spectrum, with SEM ≤ 10% and ICC(2,1) ≥ 0.8 for all parameters. The dynamic response was captured through sigmoidal kinetic modeling, which better described thrombus growth than fifth-degree polynomial fits (Table S1), confirming the robustness of image-based quantification [32].
Unlike viscoelastic systems (TEG, ROTEM) that mainly reflect fibrin mechanics [5,23], Smart Clot quantifies discrete and integrated components—platelet, fibrin(ogen), and total thrombus pseudo-volumes—derived directly from real-time microscopy. Platelet-specific assays (PFA-100, aggregometry) and global thrombin-generation tests (TGT) provide partial functional readouts [33,34] and require longer analysis times. In contrast, Smart Clot combines these functional dimensions in a single automated 15-minute test, capturing the interplay of shear, adhesion, enzymatic activation, and structural stabilization in whole blood.
4.3. Clinical Interpretability and Therapeutic Modulation
Quantitative Smart Clot parameters mirrored the expected pharmacological modulation of hemostasis. In anticoagulated patients, DOACs and therapeutic-range VKAs groups showed significant reductions in platelet, fibrin(ogen), and total thrombus pseudo-volumes compared with healthy donors, confirming inhibition of both primary and secondary pathways. Interestingly, sub-therapeutic VKAs (INR 1.27–1.94; not shown in Figure 3) yielded intermediate values (mean ≈ 4.8×10⁷ AUC ID), demonstrating proportional sensitivity of the assay to graded anticoagulation.
Antiplatelet therapy produced a stepwise suppression of total thrombus volume: ASA > clopidogrel > dual therapy (DAPT). The accompanying pseudo-3D reconstructions (Figure 4B) visually confirmed the progressive loss of platelet–fibrin cohesion, particularly evident under DAPT, and are supported by the comparative supplementary video (control vs DAPT). It should be noted that the greater variability observed in the clopidogrel group may be related, at least in part, to the absence of systematic screening for high on-treatment platelet reactivity using vasodilator-stimulated phosphoprotein (VASP) phosphorylation assays, despite the well-documented prevalence of clopidogrel non-responsiveness in otherwise stable patients [35]. Interestingly, in ASA-treated patients the inhibitory effect appeared proportionally greater on fibrin(ogen)-derived than on platelet-derived AUC ID values, suggesting that low-dose aspirin may attenuate the platelet-dependent support of thrombin generation, by limiting procoagulant phosphatidylserine exposure and assembly of coagulation complexes on the platelet surface, beyond its effect on bulk aggregation [36,37].
In cardiopulmonary bypass (ECC) patients, Smart Clot detected a marked reduction of thrombus formation immediately after protamine neutralization (Post-ECC t₀) and during early ICU admission, consistent with transient postoperative hypocoagulability. This correlated with reduced platelet counts and fibrinogen concentrations (Table 3), underscoring the assay’s ability to reflect multifactorial impairment of hemostasis [38].
Collectively, these results demonstrate that Smart Clot can discriminate the functional impact of major antithrombotic therapies and perioperative conditions within a single, short-duration assay, providing an integrated fingerprint of thrombus dynamics rather than isolated endpoints.
Of note, the disproportionate suppression of fibrin(ogen) versus platelet pseudo-volumes observed in ASA-treated patients suggests that, under flow, low-dose aspirin may preferentially impair the procoagulant platelet phenotype rather than simple adhesive/aggregatory function. This interpretation is consistent with evidence that a small subset of highly procoagulant, phosphatidylserine-exposing, TF-positive platelets provides the dominant membrane scaffold for tenase and prothrombinase assembly and thereby governs thrombin generation and fibrin growth under arterial shear [4,15]. In this context, COX-1 inhibition and reduced TXA₂-dependent signaling could limit the transition of activated platelets into this fully procoagulant state, leading to a relatively stronger impact on fibrin formation than on the early phases of platelet accumulation captured by Smart Clot.
4.4. Limitations and Future Perspectives
This study represents a technical validation rather than a clinical trial. Sample size was limited in some subgroups—particularly Post-ECC t₀ (n = 6)—and anticoagulant classes (anti-Xa vs anti-IIa) were pooled due to recruitment constraints. Moreover, ethical and protocol limitations on blood-draw volumes precluded direct statistical comparisons with other POC systems (TEG, PFA-100, TGT).
Nevertheless, existing literature supports the superior physiological relevance of flow-based assays [6,7,11,15]. Smart Clot uniquely combines this physiological environment with automation and quantitative imaging, positioning it as a potential next-generation tool for translational hemostasis research. Its capacity to simultaneously quantify platelet, fibrin, and total thrombus parameters suggests utility for detecting subclinical hyper- or hypocoagulability, therapy monitoring, and patient-specific risk assessment.
The log-normal distribution observed for fibrin(ogen) and total-thrombus parameters in healthy donors mirrors the right-skewed population distributions reported for von Willebrand factor and factor VIII levels, which are well-recognized biochemical determinants of inter-individual thrombotic risk. This parallel suggests that the upper tail of the fibrin-driven thrombus response captured by Smart Clot may reflect a physiologic propensity toward heightened coagulation potential, even within clinically normal ranges [39,40,41].
Several studies have shown that PT/INR and aPTT have limited sensitivity to clinically relevant coagulopathies in cardiopulmonary bypass patients, because they assess only isolated plasma pathways and do not reflect platelet-dependent thrombin generation or fibrin formation under flow [42,43].
In our cohort, Smart Clot identified substantial reductions in platelet contribution and fibrin-dependent thrombus formation after ECC, even when INR and aPTT remained largely normal. This discrepancy is consistent with reports indicating that early post-bypass hemostatic impairment is often multifactorial—platelet dysfunction, reduced phospholipid surface availability, hemodilution, and fibrinogen depletion—conditions not reliably detected by routine clot-time assays.
These findings support the concept that whole-blood, flow-based measurements provide additional information on thrombus-forming capacity beyond conventional plasma tests, particularly in high-risk perioperative settings.
Future efforts will focus on prospective clinical validation in complex scenarios such as extracorporeal circulation, sepsis, and cancer-related thrombosis, as well as on algorithmic expansion to extract additional parameters from video data (e.g., clot heterogeneity, fibrin network density, and spatial dynamics).
In summary, Smart Clot introduces a paradigm shift from static, reagent-driven coagulation testing to dynamic, physiology-based functional profiling. By capturing the synergy between platelets and coagulation in real time, it may fill longstanding diagnostic gaps in personalized hemostasis evaluation.
Supplementary Materials
The following supporting information can be downloaded at: https://www.mdpi.com/article/doi/s1, Figure S1: Sequential mechanisms of platelet activation and thrombus formation under flow; Table S1: Model comparison between 5-parameter logistic (5PL) and 5th-degree polynomial fitting (Poly-5) for Smart Clot Integrated Density (ID) curves.; Table S2: Statistical comparison of normal versus log-normal distribution of Smart Clot quantitative parameters in healthy donors; Table S3: Quantitative thrombus parameters of anticoagulant-treated patients; Table S4: Quantitative thrombus parameters of antiplatelet-treated patients; Table S5: Quantitative thrombus parameters of patients undergoing Extra Corporeal Circulation (ECC); Video S1: Comparative visualization of thrombus formation under flow in a healthy donor versus a patient under dual antiplatelet therapy (DAPT).
Author Contributions
Conceptualization, A.F., S.L., E.B., L.R., M.R. and M.M.; Methodology, A.F., S.L., E.B., M.A., E.L., M.R. and M.M.; Software, A.F., S.L. and M.M.; Validation, A.F., S.L., E.B., M.R. and M.M.; Formal Analysis, A.F., S.L. and M.M.; Investigation, A.F., S.L., E.B., R.V., F.A. and R.T.T; Resources, A.F., S.L., E.B., M.A., E.L., M.V., R.V., F.A., R.T.T., M.R. and M.M.; Data Curation, A.F., S.L., E.B. and M.M.; Writing—Original Draft Preparation, A.F., S.L., M.R. and M.M.; Writing—Review and Editing, A.F., E.B., E.L., R.V., F.A., M.R. and M.M.; Visualization, A.F. and M.M.; Supervision, A.F., S.L., E.B., R.V., M.R. and M.M.; Project Administration, A.F., S.L., E.B., M.A., E.L., R.V., M.R. and M.M.; Funding Acquisition, L.R. and M.M. All authors have read and agreed to the published version of the manuscript.
Funding
This project was supported by Italian Ministry of Health (“Bando Ricerca Finalizzata 2010” project, grant # RF-2010-2317993) and by Regione Autonoma Friuli Venezia Giulia (“POR FESR 2014–2020 Asse 1 Attività 1.3.b n.1489/2017” project, procedure # 40250/2017).
Institutional Review Board Statement
The study was conducted in accordance with the Declaration of Helsinki, and approved by the Unique Regional Friulian Ethics Committee (CEUR, protocol code CRO-2017-31) and the Territorial Ethics Committee Lombardy 1 (I.R.C.C.S. San Donato Hospital, protocol code CET 40-2023).
Informed Consent Statement
Informed consent was obtained from all subjects involved in the study.
Data Availability Statement
The raw data supporting the conclusions of this article will be made available by the authors on request.
Acknowledgments
We acknowledge the precious collaboration of Stefania Zanolin and Sonia Alfieri. During the preparation of this manuscript, the authors used ChatGPT, version GPT-5.1 (OpenAI, San Francisco, CA, USA), to assist with minor language editing and translation. The authors have reviewed and edited the output and take full responsibility for the content of this publication.
Conflicts of Interest
A.F. and S.L. are employees of Sedicidodici s.r.l. L.R. and M.M. are shareholders of Sedicidodici s.r.l. and L.R. is a member of Sedicidodici’s Board of Directors. The other authors declare no conflicts of interest. Agreements are in force between Sedicidodici s.r.l. and CRO-IRCCS Aviano for the production and exploitation of patents, scientific and possibly commercial development of the “Smart Clot” automated system (Exclusive Patent License Agreement 2 December 2010; CRO-DDG n.204, 20 December 2012; Prot. N. DG/S 1904, Integration Exclusive Patent License Agreement 30 January 2014). These agreements, which regulate the relationship between Sedicidodici s.r.l. (Private Company) and CRO-IRCCS Aviano (Public Institute) and which have been ratified since the design of Smart Clot, comply with the laws and guidelines of the Italian State on the subject of scientific and technological transfer (CRO-DDG n.102, 21 February 2024).
Abbreviations
The following abbreviations are used in this manuscript:
| POC | Point-of-care |
| ID | Integrated Density |
| AUC ID | Area under the first derivative curve |
| PLTS | Platelets |
| FIB | Fibrin(ogen) |
| TT | Total Thrombus |
| 5PL | Richard’s five-parameter logistic equation |
| RSS | Robust sum of squares |
| VKA | Vitamin K antagonist |
| DOAC | Direct oral anticoagulant |
| ASA | Acetylsalicylic acid |
| P2Y12 inh | P2Y12 receptor inhibitor (clopidogrel) |
| DAPT | Dual antiplatelet therapy |
| ECC | Extracorporeal circulation |
| ICU | Intensive care unit |
| SD | Standard deviation |
| SEM | Standard error of the mean |
| ICC(2,1) | Intraclass correlation coefficient (two-way random, single measures, absolute agreement) |
| IQR | Interquartile range |
| SW | Shapiro-Wilk test |
| DP | D’Agostino-Pearson test |
| CI | Confidence Interval |
| vWF | Von Willebrand Factor |
| TGT | Thrombin generation tests |
| VASP | Vasodilator-stimulated phosphoprotein |
References
- Kroll, M.; Hellums, J.; McIntire, L.; Schafer, A.; Moake, J. Platelets and Shear Stress. Blood 1996, 88, 1525–1541. [CrossRef]
- Monroe, D.M.; Hoffman, M. What Does It Take to Make the Perfect Clot? Arterioscler Thromb Vasc Biol 2006, 26, 41–48. [CrossRef]
- Versteeg, H.H.; Heemskerk, J.W.M.; Levi, M.; Reitsma, P.H. New Fundamentals in Hemostasis. Physiol Rev 2013, 93, 327–358. [CrossRef]
- Brambilla, M.; Becchetti, A.; Rovati, G.E.; Cosentino, N.; Conti, M.; Canzano, P.; Giesen, P.L.A.; Loffreda, A.; Bonomi, A.; Cattaneo, M.; et al. Cell Surface Platelet Tissue Factor Expression: Regulation by P2Y 12 and Link to Residual Platelet Reactivity. Arterioscler Thromb Vasc Biol 2023, 43, 2042–2057. [CrossRef]
- Hartmann, J.; Hermelin, D.; Levy, J.H. Viscoelastic Testing: An Illustrated Review of Technology and Clinical Applications. Res Pract Thromb Haemost 2023, 7, 100031. [CrossRef]
- Ranucci, M.; Baryshnikova, E. Sensitivity of Viscoelastic Tests to Platelet Function. J Clin Med 2020, 9, 189. [CrossRef]
- Yoon, I.; Han, J.H.; Jeon, H.-J. Advances in Platelet-Dysfunction Diagnostic Technologies. Biomolecules 2024, 14, 714. [CrossRef]
- Wool, G.D.; Carll, T. Viscoelastic Testing: Critical Appraisal of New Methodologies and Current Literature. Int J Lab Hematol 2023, 45, 643–658. [CrossRef]
- Roest, M.; Reininger, A.; Zwaginga, J.J.; King, M.R.; Heemskerk, J.W.M. Flow Chamber-based Assays to Measure Thrombus Formation in Vitro: Requirements for Standardization. Journal of Thrombosis and Haemostasis 2011, 9, 2322–2324. [CrossRef]
- Sahli, S.D.; Rössler, J.; Tscholl, D.W.; Studt, J.-D.; Spahn, D.R.; Kaserer, A. Point-of-Care Diagnostics in Coagulation Management. Sensors 2020, 20, 4254. [CrossRef]
- Kang, M.; Bresette, C.A.; Ku, D.N. Advancing Microfluidic Point-of-Care Platelet Function Tests: Opportunities and Challenges from Bench to Market. Front Bioeng Biotechnol 2024, 12, 1507972. [CrossRef]
- Yassen, K.A.; Shahwar, D.I.; Alrasasi, A.Q.; Aldandan, F.; Alali, D.S.; Almuslem, M.Y.; Hassanein, N.; Khan, I.; Görlinger, K. Viscoelastic Hemostatic Testing as a Diagnostic Tool for Hypercoagulability in Liver Transplantation: A Narrative Review. J Clin Med 2024, 13, 6279. [CrossRef]
- Ihtasham, A.; Waqas, S.; Hamza, M.; Imran, H.; Chaudhary, S.S.; Qayyum, T.; Batool, S.; Devi, N.; Muzammil, M.A.; Oduoye, M.O. Innovative Strategies in Coagulation Management for Cardiothoracic Surgery: A Narrative Review of Pharmacological and Nonpharmacological Approaches. J Cardiothorac Surg 2025, 20, 305. [CrossRef]
- Foladore, A.; Lattanzio, S.; Lombardi, E.; Durante, C.; Baryshnikova, E.; Anguissola, M.; Rota, L.; Ranucci, M.; Mazzucato, M. A New Shear-Stress-Based Point-of-Care Technology for Evaluation of the Hemostatic Pattern in Whole Blood. Biosensors (Basel) 2024, 14, 518. [CrossRef]
- Mangin, P.H.; Gardiner, E.E.; Nesbitt, W.S.; Kerrigan, S.W.; Korin, N.; Lam, W.A.; Panteleev, M.A. In Vitro Flow Based Systems to Study Platelet Function and Thrombus Formation: Recommendations for Standardization: Communication from the SSC on Biorheology of the ISTH. Journal of Thrombosis and Haemostasis 2020, 18, 748–752. [CrossRef]
- Rai, M.R.; Li, C.; Greenbaum, A. Quantitative Analysis of Illumination and Detection Corrections in Adaptive Light Sheet Fluorescence Microscopy. Biomed Opt Express 2022, 13, 2960. [CrossRef]
- Lee, J.-S.; Wee, T.-L. (Erika); Brown, C.M. Calibration of Wide-Field Deconvolution Microscopy for Quantitative Fluorescence Imaging. J Biomol Tech 2014, 25, 31–40. [CrossRef]
- Schneider, C.A.; Rasband, W.S.; Eliceiri, K.W. NIH Image to ImageJ: 25 Years of Image Analysis. Nat Methods 2012, 9, 671–675. [CrossRef]
- Westmoreland, D.; Shaw, M.; Grimes, W.; Metcalf, D.J.; Burden, J.J.; Gomez, K.; Knight, A.E.; Cutler, D.F. Super-resolution Microscopy as a Potential Approach to Diagnosis of Platelet Granule Disorders. Journal of Thrombosis and Haemostasis 2016, 14, 839–849. [CrossRef]
- Choi, J.-S.; Ham, D.-H.; Kim, J.-H.; Marcial, H.B.F.; Jeong, P.-H.; Choi, J.-H.; Park, W.-T. Quantitative Image Analysis of Thrombus Formation in Microfluidic In-Vitro Models. Micro and Nano Systems Letters 2022, 10, 23. [CrossRef]
- Folie, B.; McIntire, L.; Lasslo, A. Effects of a Novel Antiplatelet Agent in Mural Thrombogenesis on Collagen-Coated Glass. Blood 1988, 72, 1393–1400. [CrossRef]
- Bode, A.; Orton, S.; Frye, M.; Udis, B. Vesiculation of Platelets during in Vitro Aging. Blood 1991, 77, 887–895. [CrossRef]
- Mauch, J.; Spielmann, N.; Hartnack, S.; Madjdpour, C.; Kutter, A.P.N.; Bettschart-Wolfensberger, R.; Weiss, M.; Haas, T. Intrarater and Interrater Variability of Point of Care Coagulation Testing Using the ROTEM Delta. Blood Coagulation & Fibrinolysis 2011, 22, 662–666. [CrossRef]
- Mazzucato, M.; Cozzi, M.R.; Battiston, M.; Jandrot-Perrus, M.; Mongiat, M.; Marchese, P.; Kunicki, T.J.; Ruggeri, Z.M.; De Marco, L. Distinct Spatio-Temporal Ca2+ Signaling Elicited by Integrin A2β1 and Glycoprotein VI under Flow. Blood 2009, 114, 2793–2801. [CrossRef]
- Mazzucato, M.; Pradella, P.; Cozzi, M.R.; De Marco, L.; Ruggeri, Z.M. Sequential Cytoplasmic Calcium Signals in a 2-Stage Platelet Activation Process Induced by the Glycoprotein Ibα Mechanoreceptor. Blood 2002, 100, 2793–2800. [CrossRef]
- Naudin, C.; Burillo, E.; Blankenberg, S.; Butler, L.; Renné, T. Factor XII Contact Activation. Semin Thromb Hemost 2017, 43, 814–826. [CrossRef]
- Gailani, D.; Renné, T. Intrinsic Pathway of Coagulation and Arterial Thrombosis. Arterioscler Thromb Vasc Biol 2007, 27, 2507–2513. [CrossRef]
- Coughlin, S.R. Protease-activated Receptors in Hemostasis, Thrombosis and Vascular Biology. Journal of Thrombosis and Haemostasis 2005, 3, 1800–1814. [CrossRef]
- Muszbek, L.; Bereczky, Z.; Bagoly, Z.; Komáromi, I.; Katona, É. Factor XIII: A Coagulation Factor With Multiple Plasmatic and Cellular Functions. Physiol Rev 2011, 91, 931–972. [CrossRef]
- Nesbitt, W.S.; Westein, E.; Tovar-Lopez, F.J.; Tolouei, E.; Mitchell, A.; Fu, J.; Carberry, J.; Fouras, A.; Jackson, S.P. A Shear Gradient–Dependent Platelet Aggregation Mechanism Drives Thrombus Formation. Nat Med 2009, 15, 665–673. [CrossRef]
- Gui, X.; Tullemans, B.M.E.; de Laat, B.; Heemskerk, J.W.M.; Swieringa, F. Automated Imaging and Analysis of Platelet, Coagulation and Fibrinolysis Activities Using a Novel Flow Chip-Based System at Physiological Temperature. Micromachines (Basel) 2025, 16, 1253. [CrossRef]
- van Geffen, J.P.; Brouns, S.L.N.; Batista, J.; McKinney, H.; Kempster, C.; Nagy, M.; Sivapalaratnam, S.; Baaten, C.C.F.M.J.; Bourry, N.; Frontini, M.; et al. High-Throughput Elucidation of Thrombus Formation Reveals Sources of Platelet Function Variability. Haematologica 2019, 104, 1256–1267. [CrossRef]
- Favaloro, E.J.; Pasalic, L.; Lippi, G. Towards 50 Years of Platelet Function Analyser (PFA) Testing. Clinical Chemistry and Laboratory Medicine (CCLM) 2023, 61, 851–860. [CrossRef]
- Tripodi, A.; Clerici, M.; Scalambrino, E.; Peyvandi, F. Thrombin Generation Assays: What Are the Current Clinical Applications? Semin Thromb Hemost 2025, 21, 1971–1984. [CrossRef]
- Warlo, E.M.K.; Arnesen, H.; Seljeflot, I. A Brief Review on Resistance to P2Y12 Receptor Antagonism in Coronary Artery Disease. Thromb J 2019, 17, 11. [CrossRef]
- Reddy, E.C.; Rand, M.L. Procoagulant Phosphatidylserine-Exposing Platelets in Vitro and in Vivo. Front Cardiovasc Med 2020, 7, 21. [CrossRef]
- Musiał, J.; Radwan, J.; Szczeklik, A. Aspirin Delays Thrombin Generation in Vitro through Interaction with Platelet Phospholipids. Thromb Res 1997, 85, 367–368.
- Fang, Z.A.; Navaei, A.H.; Hensch, L.; Hui, S.-K.R.; Teruya, J. Hemostatic Management of Extracorporeal Circuits Including Cardiopulmonary Bypass and Extracorporeal Membrane Oxygenation. Semin Thromb Hemost 2020, 46, 062–072. [CrossRef]
- Kamphuisen, P.W.; Eikenboom, J.C.J.; Bertina, R.M. Elevated Factor VIII Levels and the Risk of Thrombosis. Arterioscler Thromb Vasc Biol 2001, 21, 731–738. [CrossRef]
- Lenting, P.J.; Christophe, O.D.; Denis, C. V. Von Willebrand Factor Biosynthesis, Secretion, and Clearance: Connecting the Far Ends. Blood 2015, 125, 2019–2028. [CrossRef]
- Bloemen, S.; Huskens, D.; Konings, J.; Kremers, R.M.; Miszta, A.; de Laat, B.; Kelchtermans, H. Interindividual Variability and Normal Ranges of Whole Blood and Plasma Thrombin Generation. J Appl Lab Med 2017, 2, 150–164. [CrossRef]
- Ripoll, J.G.; Warner, M.A.; Hanson, A.C.; Marquez, A.; Dearani, J.A.; Nuttall, G.A.; Kor, D.J.; Mauermann, W.J.; Smith, Mark.M. Coagulation Tests and Bleeding Classification After Cardiopulmonary Bypass: A Prospective Study. J Cardiothorac Vasc Anesth 2023, 37, 933–941. [CrossRef]
- Bartoszko, J.; Karkouti, K. Managing the Coagulopathy Associated with Cardiopulmonary Bypass. Journal of Thrombosis and Haemostasis 2021, 19, 617–632. [CrossRef]
Figure 1.
Mean first derivative curve calculated from the sigmoidal fits of 62 healthy donors Integrated Density (ID) time-series, representing total thrombus formation. Confidence limits (95%) are shown as shaded areas around the mean curve. The dashed arrow on the left indicates the lag time for fibrin(ogen) formation (~240 s), corresponding to the onset of endogenous thrombin generation. The horizontal double-headed arrow indicates the total thrombus pseudo-volume (integral of the derivative curve), while the vertical dashed arrow identifies the peak growth rate of the thrombus.
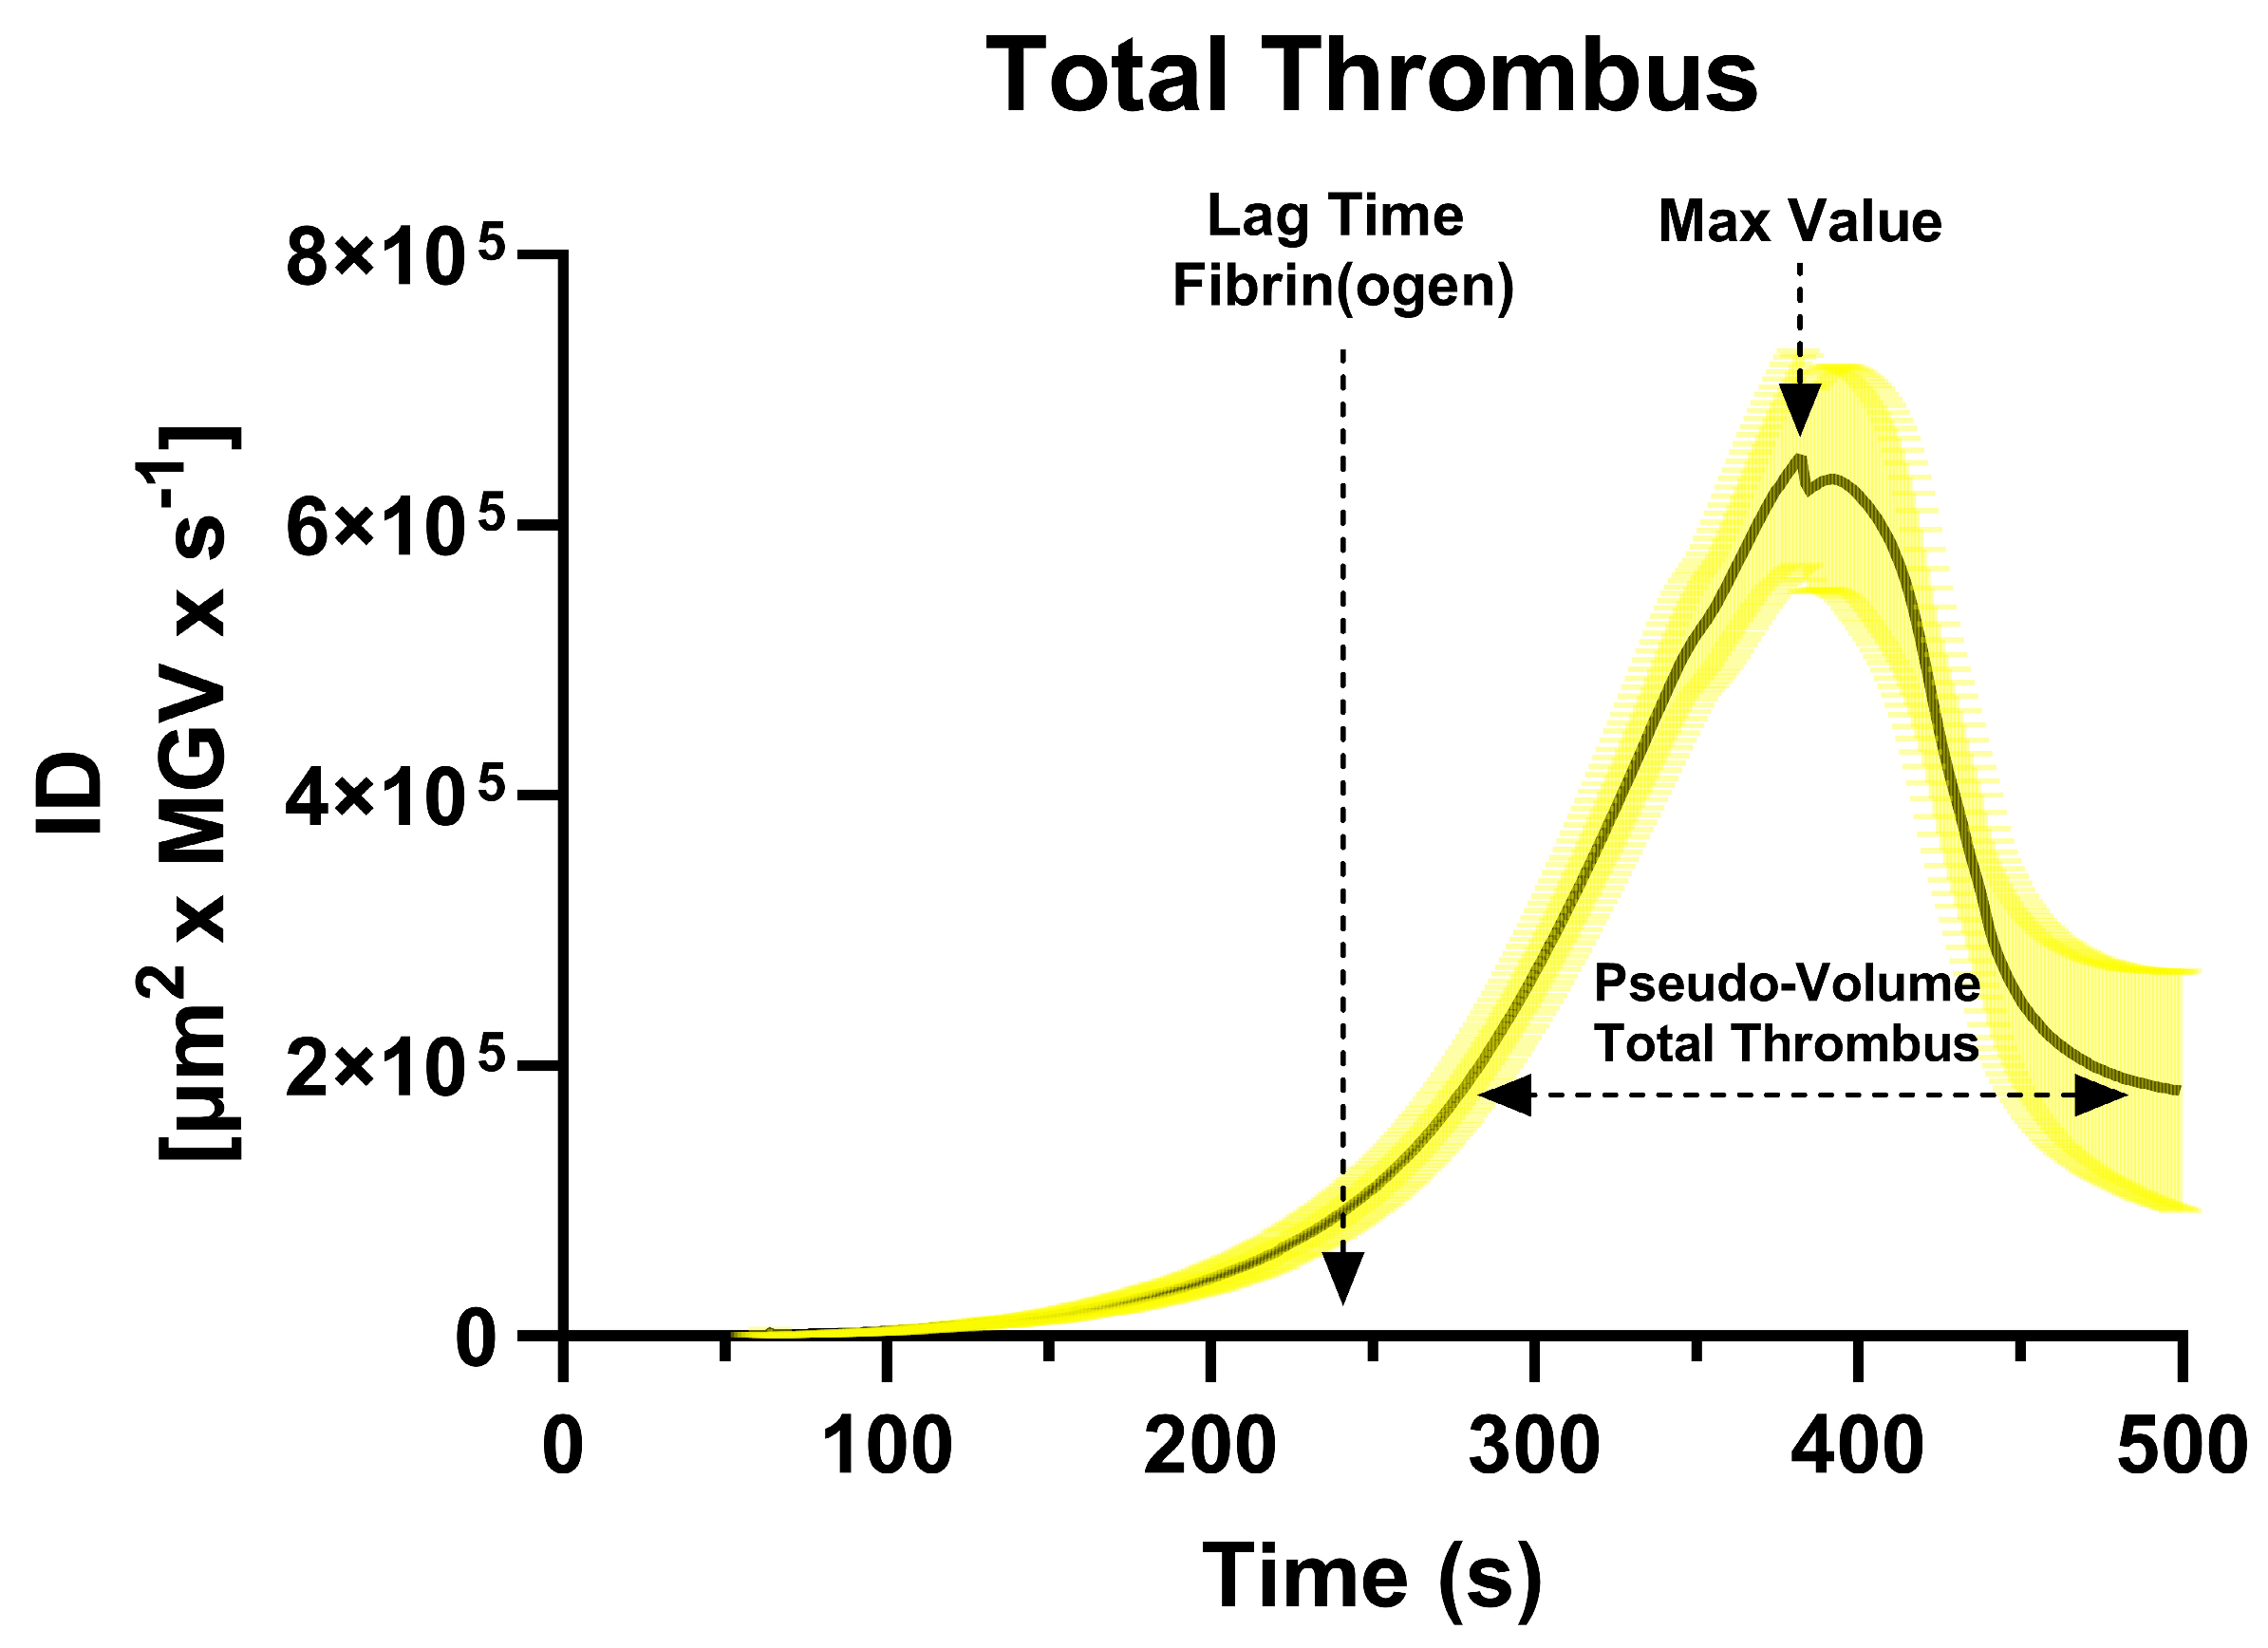
Figure 2.
Histograms (panels’ left side) with probability density overlays and corresponding Q–Q plots (panels’ right side) show the distributions of (A) platelets (PLTS), (B) fibrin(ogen) (FIB), and (C) total thrombus (TT) AUC ID in 62 healthy donors. For each histogram, the 5th and 95th percentiles are indicated by dashed lines. for Platelet-derived values followed an approximately normal distribution, while fibrin(ogen) and total thrombus values exhibited right-skewed log-normal behavior. Normality and lognormality were assessed by Shapiro–Wilk (SW) and D’Agostino–Pearson (DP) tests, of which p-values are reported in the figure, as in Table S2.
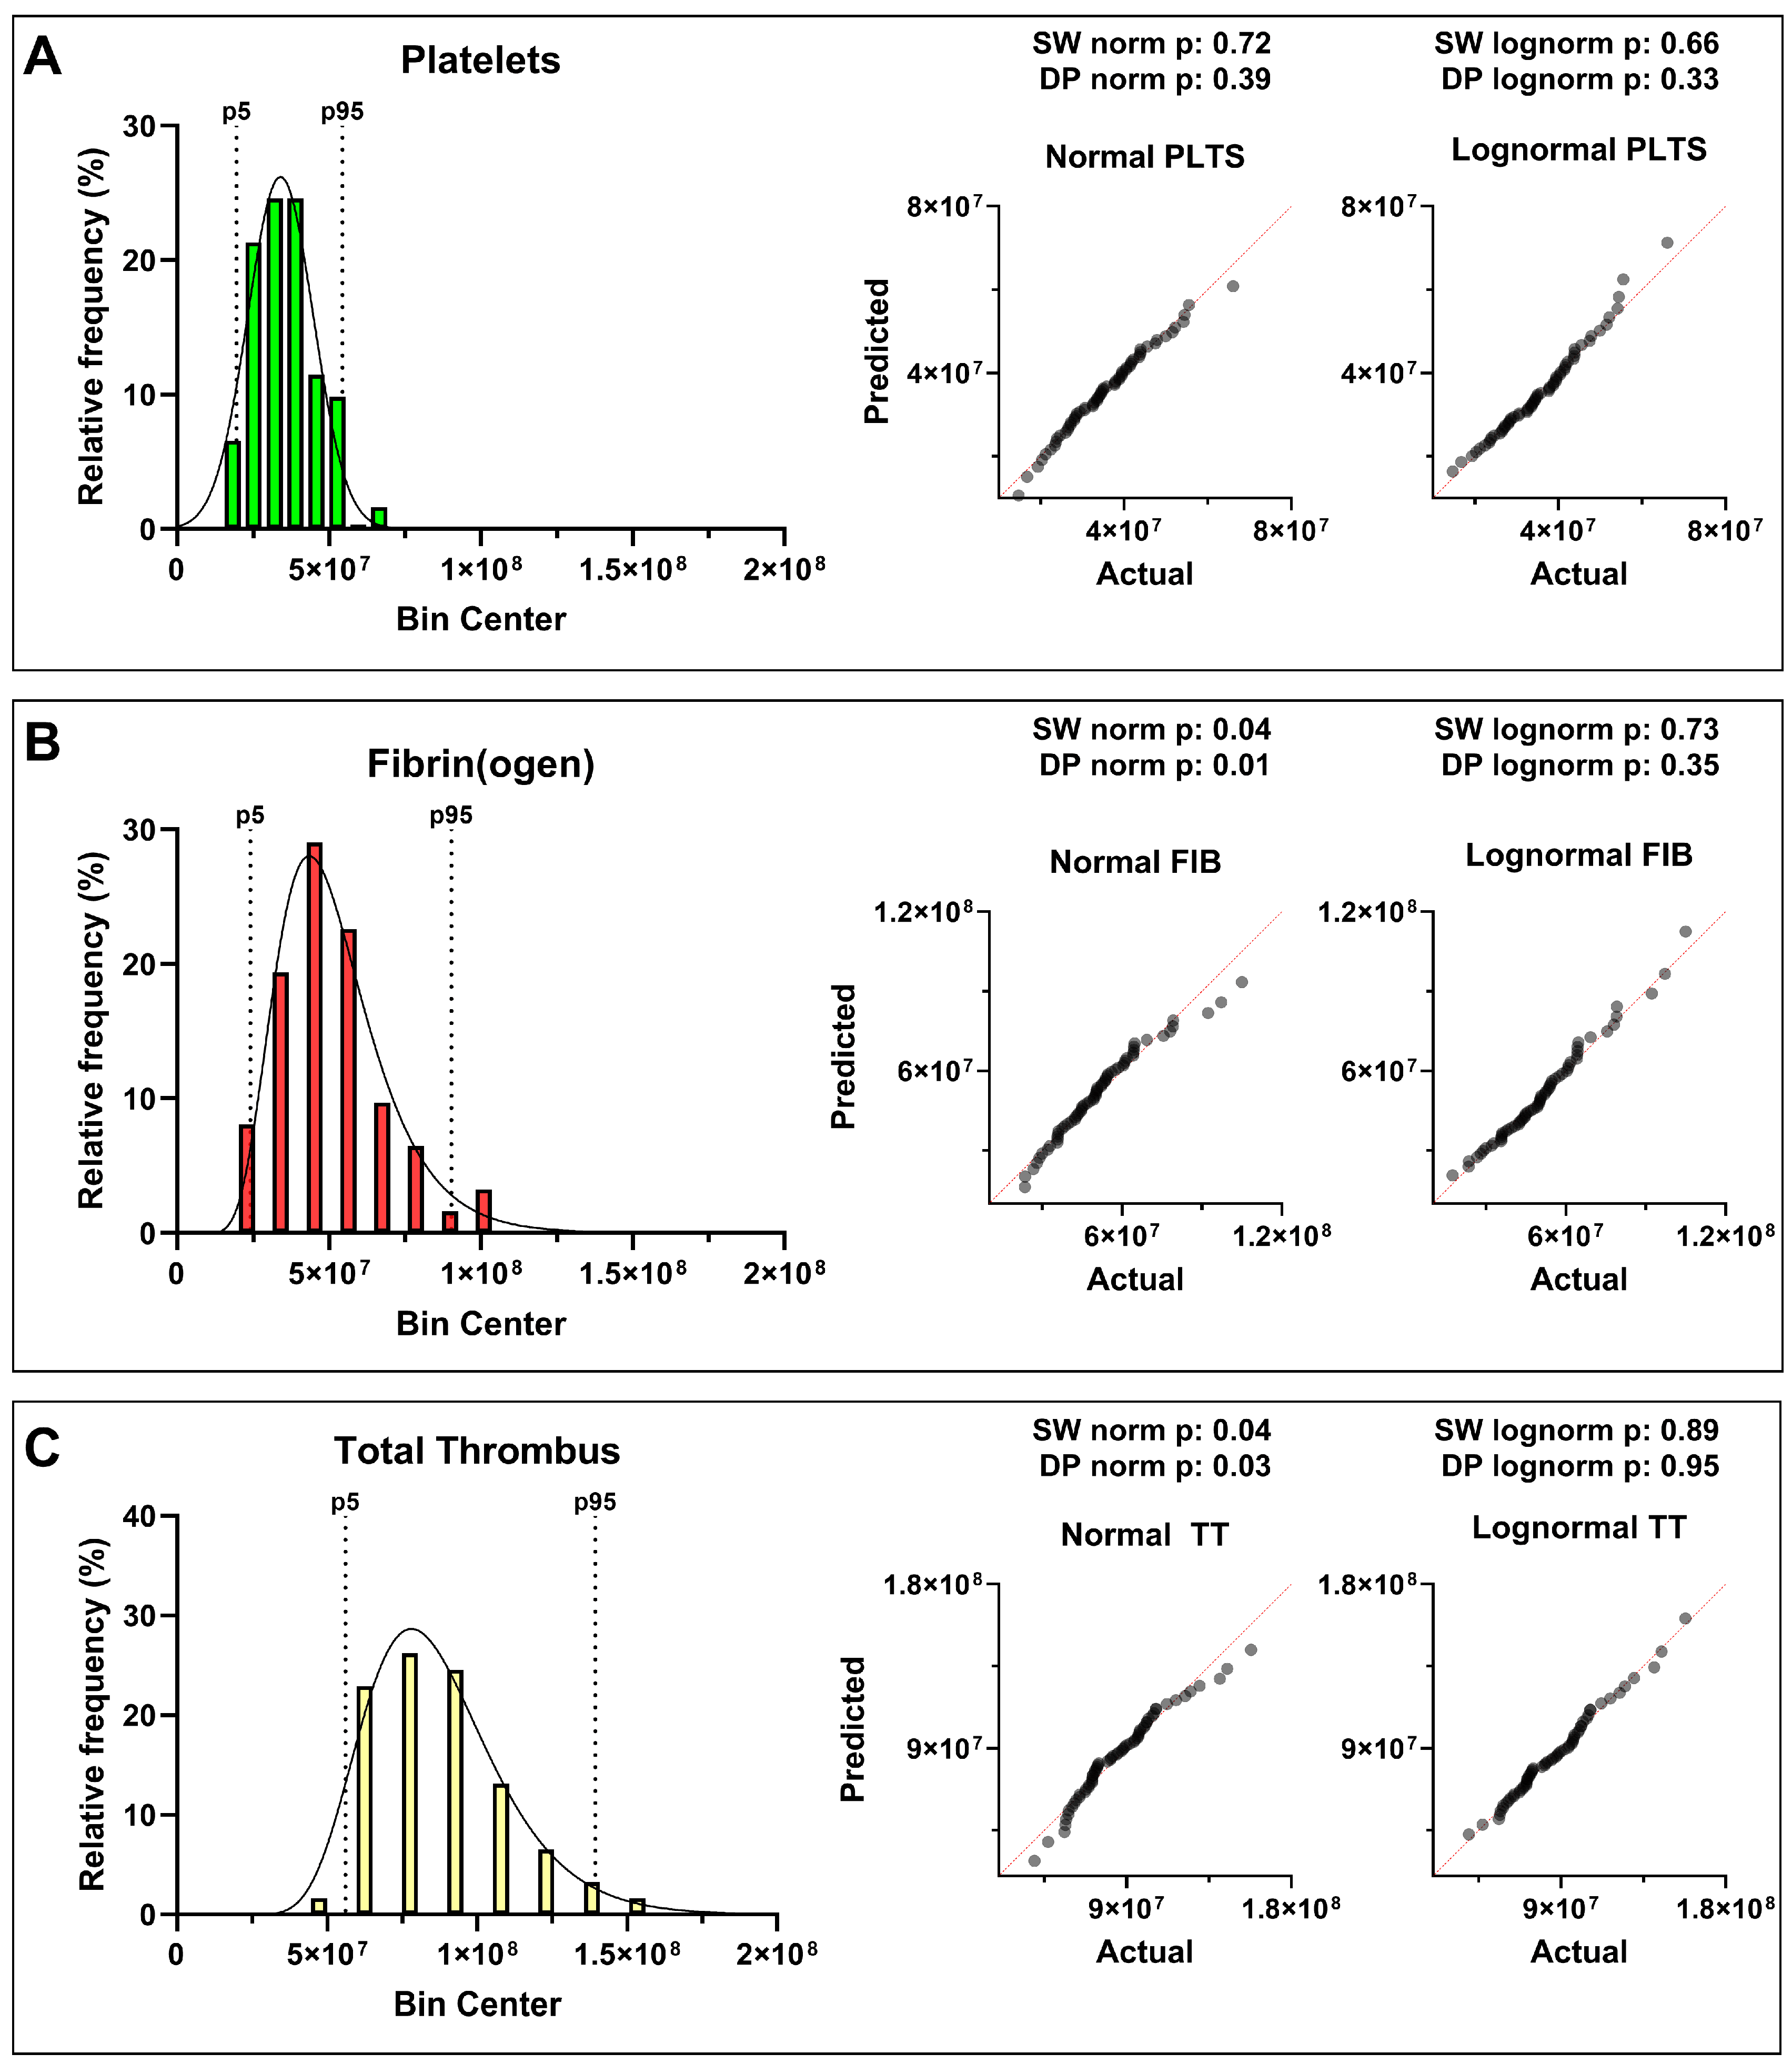
Figure 3.
(A) Box-and-whiskers plots (median, mean, 5th–95th percentiles) of platelets, fibrin(ogen), and total thrombus pseudo-volumes (AUC ID) in healthy donors (n = 62), patients on direct oral anticoagulants (DOACs, n = 18), and vitamin K antagonists (VKAs, n = 6, INR > 2). A consistent reduction in thrombus formation was observed, particularly in total thrombus Integrated Density (p < 0.0001 vs donors). (B) Composite fluorescence images and pseudo-3D renderings of total thrombi (platelets in green, fibrin(ogen) in red, merged in yellow) at 7’30’’ (scale bar = 150 µm). ns: p > 0.05; *: p < 0.05; ****: p < 0.0001.
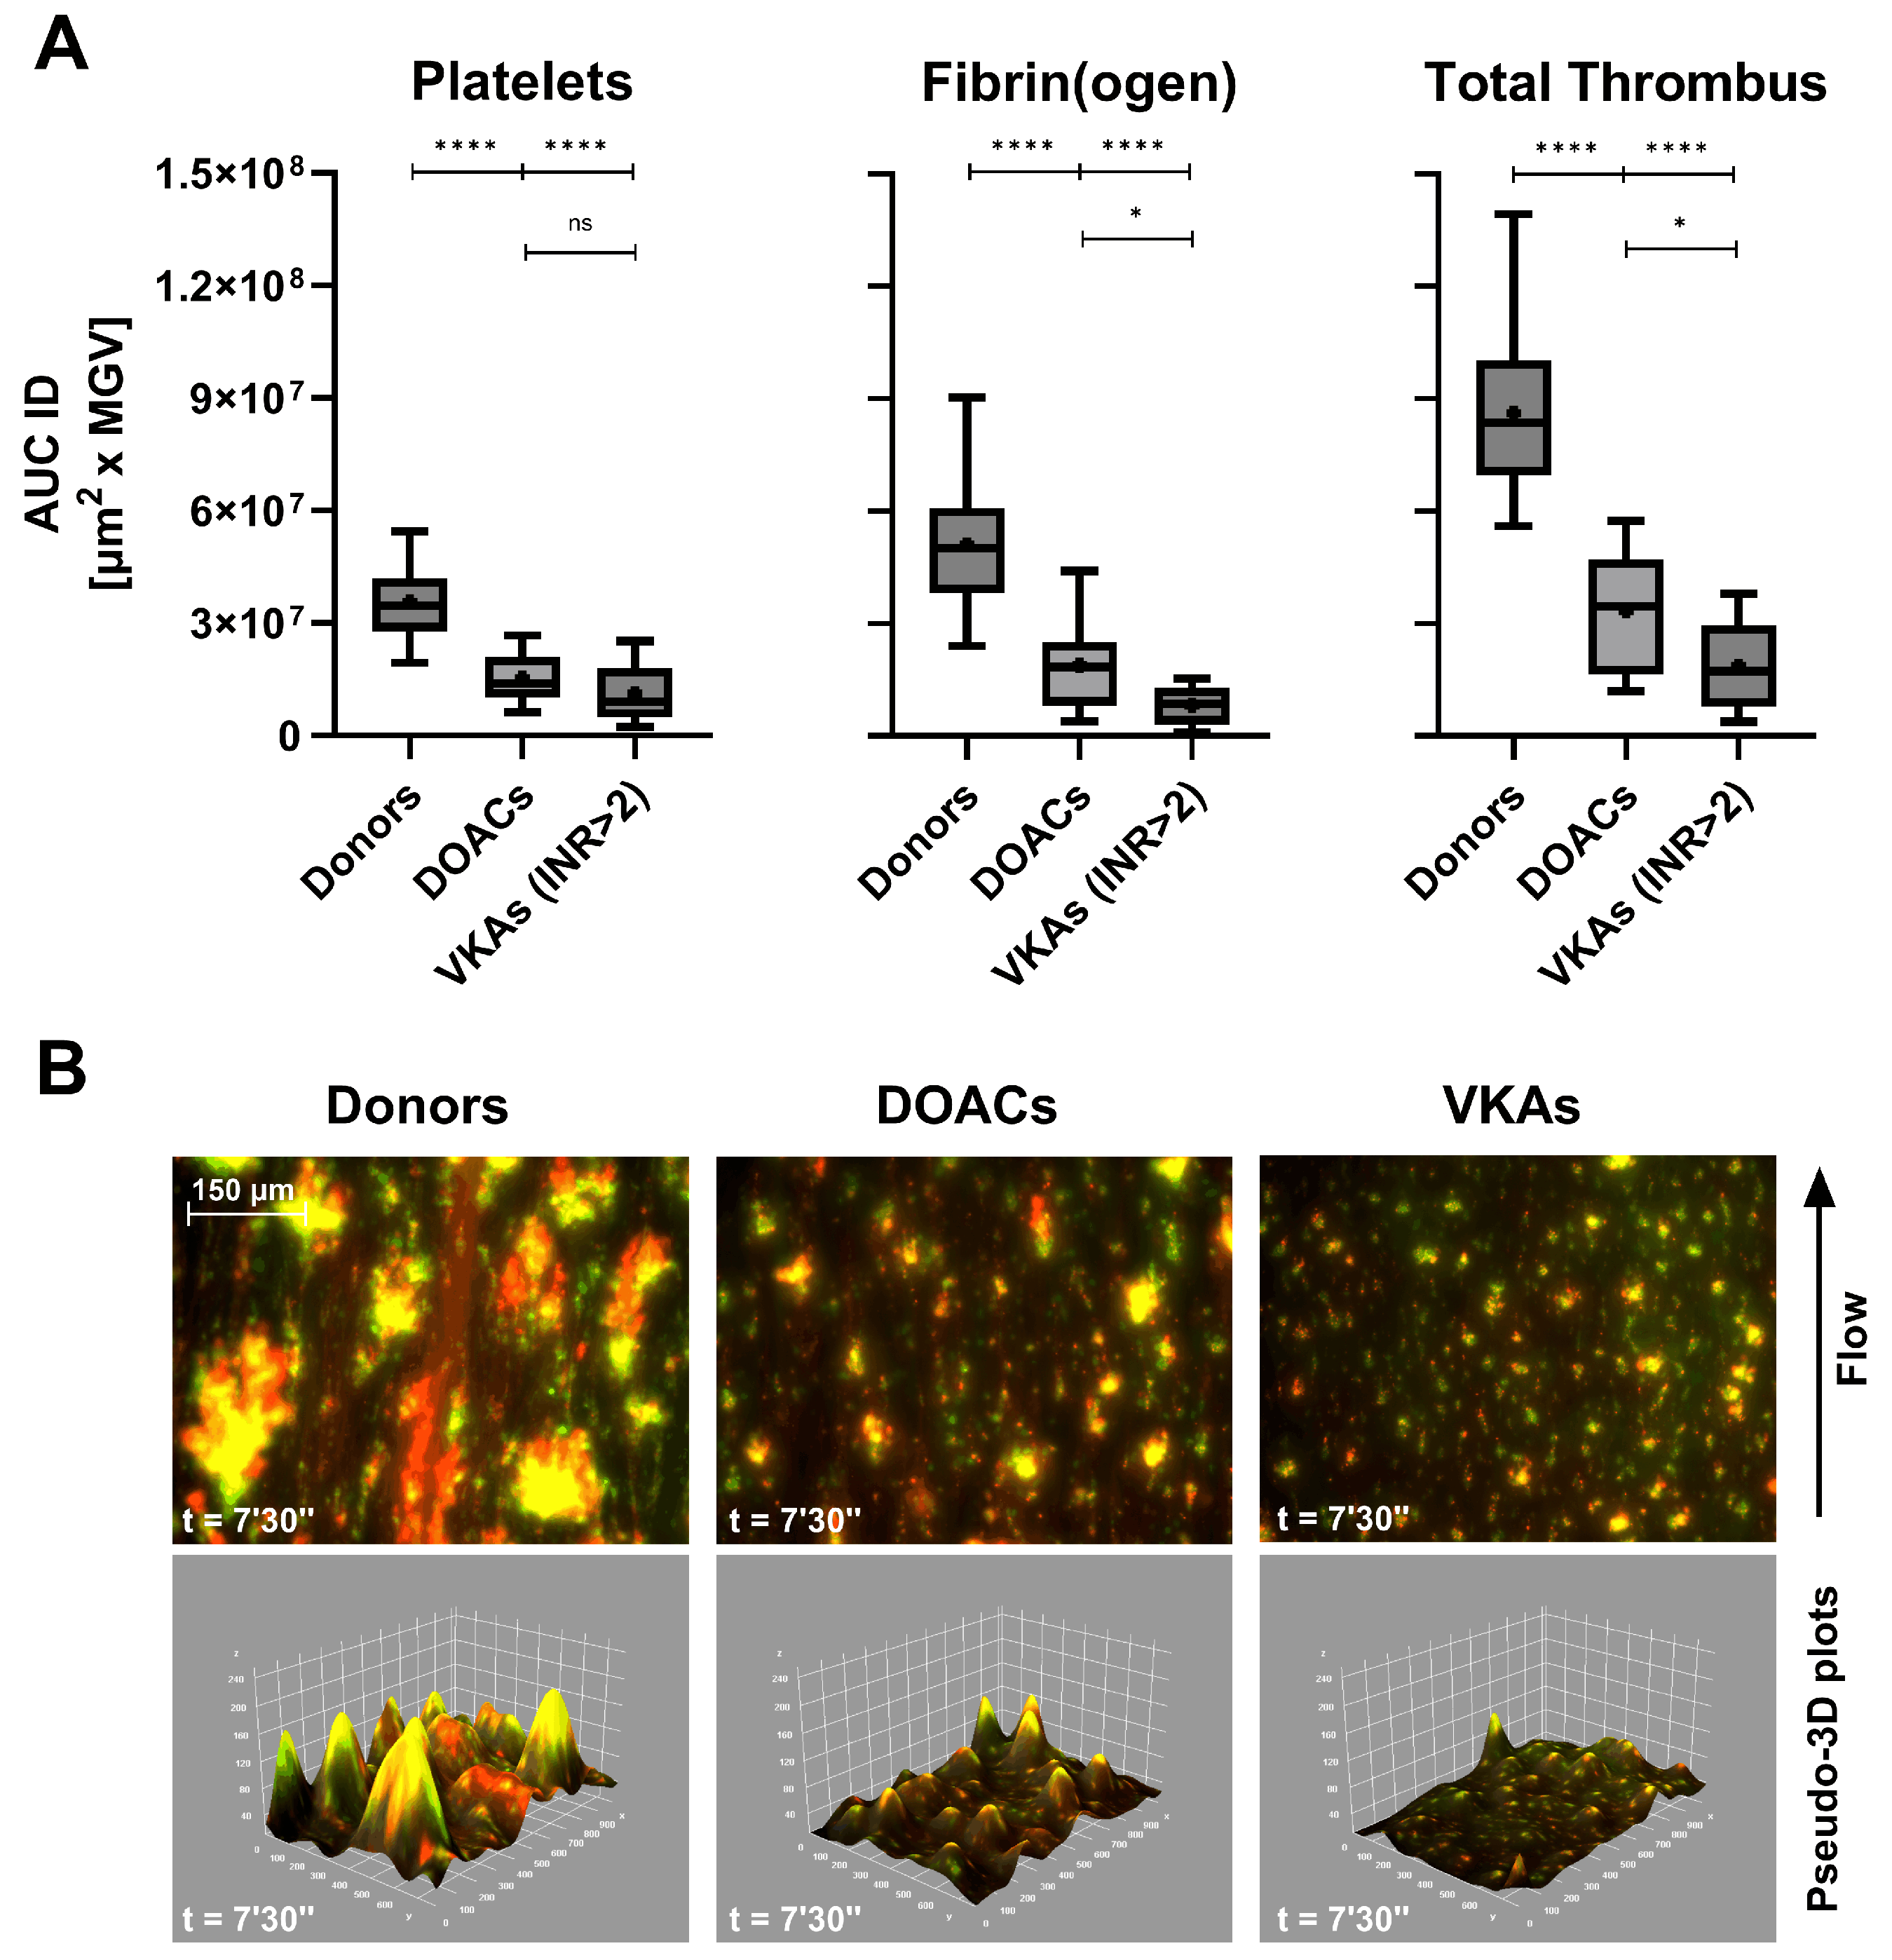
Figure 4.
(A) Box-and-whiskers plots (median, mean, 5th–95th percentiles) of platelets, fibrin(ogen), and total thrombus pseudo-volumes (AUC ID) in healthy donors (n = 62), patients treated with acetylsalicylic acid (ASA, n = 24), clopidogrel (P2Y12 inh, n = 11) and dual antiplatelet therapy (DAPT, ASA + clopidogrel, n = 32). All groups exhibited progressive reductions in thrombus pseudo-volume, with the strongest inhibition under DAPT (p < 0.0001 vs donors). (B) Composite fluorescence images and pseudo-3D renderings of total thrombi (platelets in green, fibrin(ogen) in red, merged in yellow) at 7’30’’ (scale bar = 150 µm). A visual comparative video (Movie S1) illustrates thrombus development in healthy vs DAPT samples. ns: p > 0.05; *: p < 0.05; **: p < 0.01; ****: p < 0.0001.
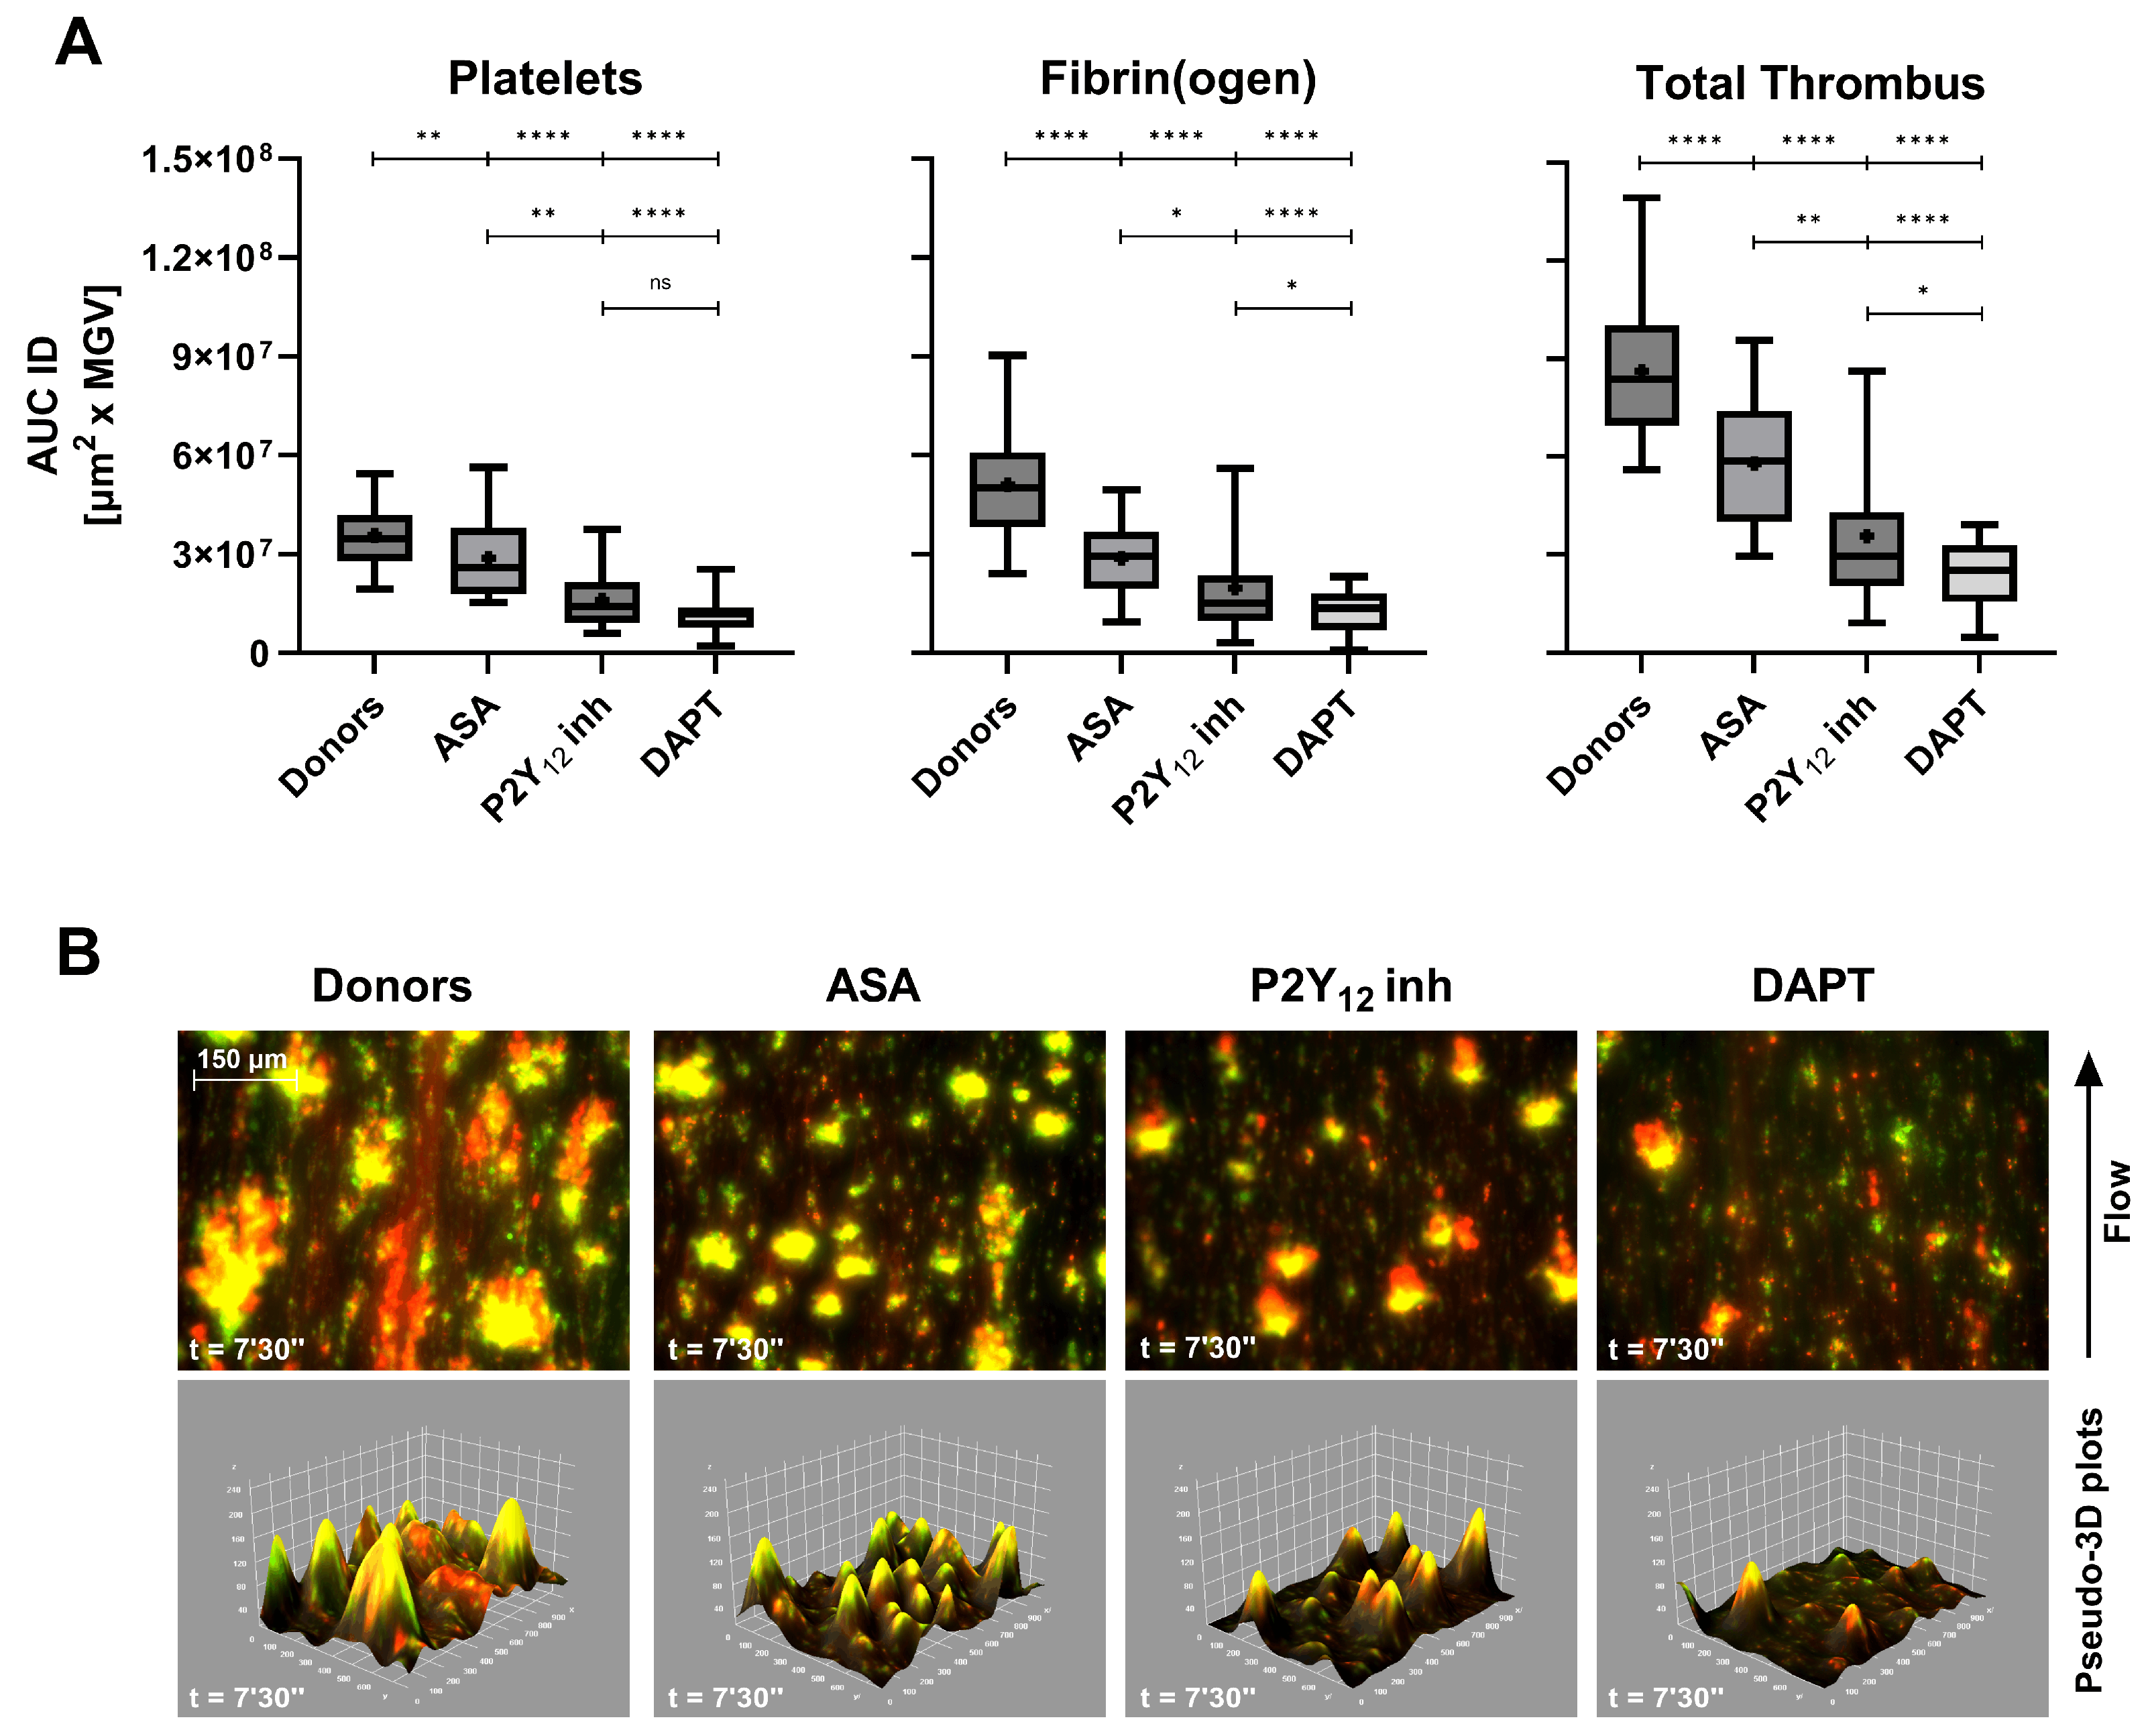
Figure 5.
(A) Box-and-whiskers plots (median, mean, 5th–95th percentiles) of platelets, fibrin(ogen), and total thrombus pseudo-volumes (AUC ID) in healthy donors (n = 62), pre-Extracorporeal Circulation (ECC) patients (n = 22), post-ECC t0 (n = 6, 5–10 min after protamine 300 IU/kg), and post-ECC ICU samples (n = 22, ≈1.5 h after protamine). (B) Composite fluorescence images and pseudo-3D renderings of total thrombi (platelets in green, fibrin(ogen) in red, merged in yellow) at 7’30’’ (scale bar = 150 µm). Corresponding pseudo-3D reconstructions (integrated density) show marked reductions in platelet contribution and overall thrombus volume post-ECC, particularly at ICU admission. Quantitative laboratory parameters are summarized in Table 3. ns: p > 0.05; *: p < 0.05; **: p < 0.01; ****: p < 0.0001.
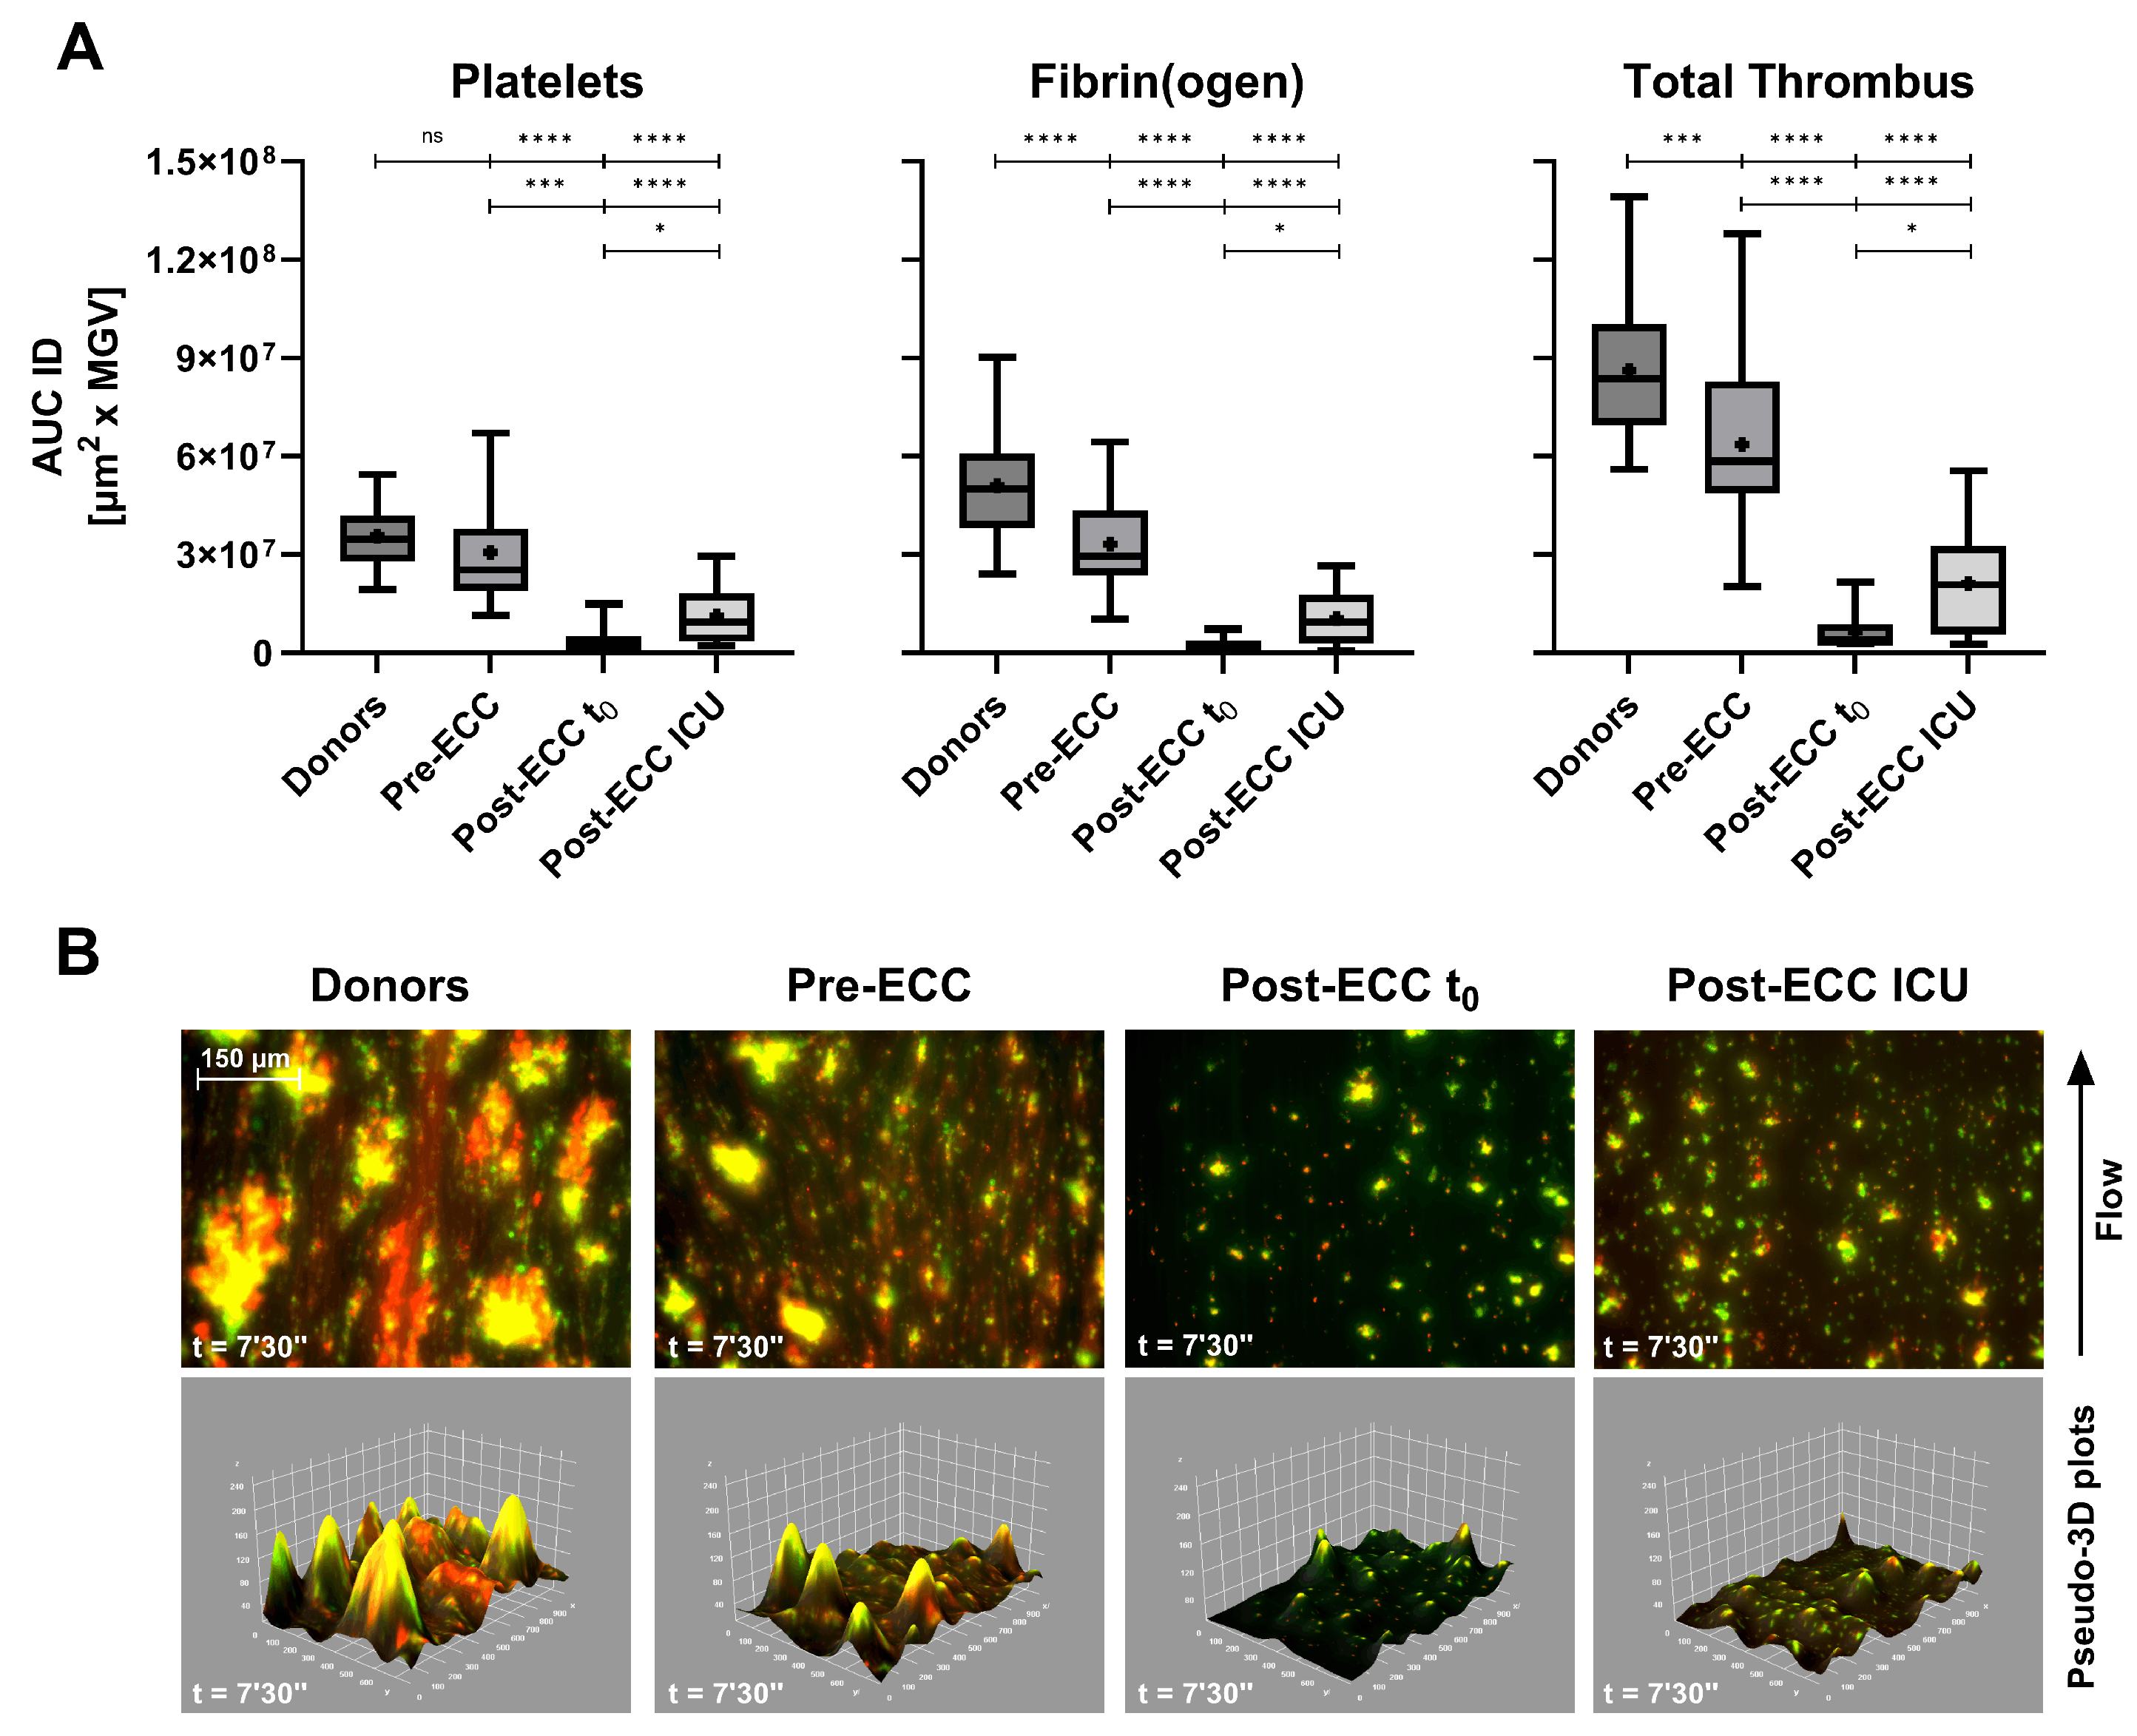

Table 1.
Mean Bias, mean absolute bias, standard deviation (SD), standard error of the mean (SEM, % of mean), and intraclass correlation coefficient (two-way random, single measures, absolute agreement; ICC(2,1)) for platelet, fibrin(ogen), and total thrombus mean area under the first derivative curve (AUC ID) across three analytical classes: high (≈100%), intermediate (≈50%), and low (<30%) relative to normal donor means. Each group comprised 20 whole-blood samples tested in duplicate under identical conditions. ICC(2,1) ≥ 0.8 and SEM ≤ 10% indicate high repeatability.
| Platelets AUC ID | Fibrin(ogen) AUC ID | Total Thrombus AUC ID | |||||||
| ≈100% | ≈50% | <30% | ≈100% | ≈50% | <30% | ≈100% | ≈50% | <30% | |
| Bias | -233.4 | 132.4 | -40.0 | -35.1 | -40.0 | -67.4 | -268.5 | 92.5 | -107.4 |
| |Bias| | 655.9 | 376.1 | 265.7 | 795.7 | 439.6 | 172.8 | 1023.6 | 498.3 | 321.4 |
| Bias SD | 743.3 | 500.5 | 339.1 | 966.2 | 523.7 | 216.3 | 1344.2 | 613.1 | 413.8 |
| SEM (% on mean) | 8.9 | 6.2 | 8.8 | 8.0 | 9.6 | 9.6 | 5.8 | 4.7 | 6.8 |
| ICC(2,1) | 0.9 | 0.8 | 0.9 | 0.7 | 0.8 | 0.9 | 0.8 | 0.8 | 0.9 |
Table 2.
AUC ID [×10⁷] and Lag Time [seconds] parameters in healthy donors. Values shown as mean ± SD, median, 5th–95th percentile, and 95% Confidence Interval (CI). For Lag Time, only mean ± SD is shown. Data derived from 62 donor samples analyzed under identical conditions.
Table 2.
AUC ID [×10⁷] and Lag Time [seconds] parameters in healthy donors. Values shown as mean ± SD, median, 5th–95th percentile, and 95% Confidence Interval (CI). For Lag Time, only mean ± SD is shown. Data derived from 62 donor samples analyzed under identical conditions.
| Parameter | Metric | Platelets | Fibrin(ogen) | Total Thrombus |
| AUC ID [×10⁷] | Mean ± SD | 3.6 ± 1.0 | 5.1 ± 1.8 | 8.6 ± 2.4 |
| Median | 3.5 | 5.0 | 8.4 | |
| 5th–95th | 1.9-5.4 | 2.4-9.0 | 5.6-14.0 | |
| 95% CI | 3.3-3.8 | 4.7-5.5 | 8.0-9.2 | |
| Lag Time [s] | Mean ± SD | NA | 241 ± 39 | NA |
Table 3.
Ranges of INR, aPTT ratio, platelet count and fibrinogen concentration for healthy donors and ECC patient groups (Pre-ECC, Post-ECC t0, Post-ECC ICU). n.a.: data not available by surgical protocol. Platelet and fibrinogen levels showed marked post-ECC decreases consistent with Smart Clot profiles.
| Group | n | INR (range) |
aPTT ratio (range) |
Platelets (x10³/µL, range) |
Fibrinogen (mg/dL, range) |
| Healthy donors | 62 | 0.80–1.20 | 0.80–1.30 | 150–400 | 200–400 |
| Pre-ECC (ASA 75–100 mg/day) |
22 | 1.00–1.41 | 0.80–1.39 | 142–358 | 191–484 |
| Post-ECC t₀ (5–10 min after protamine 300 IU/kg) |
6 | n.a. | n.a. | n.a. | n.a. |
| Post-ECC ICU (~ 1.5 h after protamine) |
22 | 1.03–1.76 | 0.76–1.67 | 72–249 | 106–305 |
Disclaimer/Publisher’s Note: The statements, opinions and data contained in all publications are solely those of the individual author(s) and contributor(s) and not of MDPI and/or the editor(s). MDPI and/or the editor(s) disclaim responsibility for any injury to people or property resulting from any ideas, methods, instructions or products referred to in the content. |
© 2025 by the authors. Licensee MDPI, Basel, Switzerland. This article is an open access article distributed under the terms and conditions of the Creative Commons Attribution (CC BY) license (http://creativecommons.org/licenses/by/4.0/).
Copyright: This open access article is published under a Creative Commons CC BY 4.0 license, which permit the free download, distribution, and reuse, provided that the author and preprint are cited in any reuse.


