

Submitted:
27 December 2025
Posted:
29 December 2025
Read the latest preprint version here
Abstract
Environmental, Social and Governance (ESG) risk is increasingly shaped by relationships among firm operating within global supply chains, rather than by individual corporate practices alone. This study explores whether a firm’s position in supply-chain networks is linked to its ESG risk exposure and whether incorporating network information improves ESG risk prediction compared with firm-level models. The study draws on an international dataset integrating confirmed supplier-buyer links, shipment-level trade data, ESG incident records, and sentiment derived from ESG-related news. A combination of network-based econometric techniques and graph-oriented learning models is applied and evaluated against standard predictive benchmarks. The analysis shows that ESG risk tends to cluster within connected groups of firms, with elevated exposure observed for firms occupying central or intermediary positions in supply networks. Media sentiment related to ESG issues is associated with later ESG incidents, indicating it usefulness as an early signal. Models that account explicitly for network structure exhibit more accurate and better-calibrated predictions than conventional econometric and machine-learning approaches. These findings indicate that incorporating supply-chain network information and ESG-related media signals can strengthen ESG risk monitoring. A network-informed perspective offers added insight for assessing ESG risk in complex international production systems.
Keywords:
ESG risk
; supply-chain networks
; inter-firm dependence
; media sentiment
; graph-based modeling
1. Introduction
ESG risks are progressively understood as outcomes of system-wide interdependencies within global supply chains rather than as isolated firm-level deficiencies. Ecological harm, labour violations, and governance failures often originate outside focal firms and spread through production networks via reputational transmission, regulatory contagion, and operational disruption [1]. As a result, a firm’s ESG exposure depends not only on its internal practices but also on its relational position within networks of suppliers and customers. This perspective challenges conventional ESG assessment approaches that rely on static disclosures, aggregated ratings, and backwards-looking indicators. Such tools provide limited insight into how ESG risks accumulate and propagate across interconnected production systems, constraining their ability to detect emerging vulnerabilities before they materialise into noticeable events [2].
However, this study adopts a network-oriented approach and addresses two main questions. How does a firm’s position within supply-chain networks shape its ESG risk exposure? Does explicitly incorporating inter-firm network structure improve the accuracy and reliability of ESG risk prediction relative to firm-level models? Hence, recent advances in data availability and artificial intelligence enable these questions to be addressed more directly. Detailed supplier–customer connections, shipment-level trade data, and continuously updated news streams allow ESG exposure to be analysed as a dynamic and relational process [3]. At the same time, progress in network analytics, machine learning, and natural language processing strengthens the modelling of nonlinear interactions, inter-firm dependence, and early-stage risk signals [4].
Despite these developments, empirical ESG research remains fragmented, with network structure, ESG metrics, controversy records, and media sentiment typically examined in isolation. This study proposes an AI-network-oriented framework for analysing ESG risk in global supply chains. Thus, by integrating network econometric methods, graph-based learning, and transformer-based sentiment extraction, the framework captures the exposure, diffusion, and forecasting ability of ESG risk.
The study contributes by reframing ESG risk as a network-contingent phenomenon, demonstrating the predictive value of ESG-related media sentiment, and showing that models incorporating inter-firm network structure outperform traditional approaches in forecasting ESG risk. The remainder of the paper is organised as follows. Section 2 reviews the related literature, Section 3 presents the methodological approach, Section 4 discusses the results, Section 5 provides an in-depth discussion and outlines key policy implications, and Section 6 concludes the study.
2. Related Literature
2.1. The Concept of Network Modelling for ESG Risk
This study reviewed several empirical studies that focus on network modelling of ESG risk propagation across global supply chains in production and service systems, as shown in Table 1. The evidence shifts ESG risk from a purely firm-centric singularity to a relational and systemic exposure that can diffuse through inter-firm dependencies. A dominant stream uses industrial network data to model ESG spillovers at scale. Wei et al. [5] studied China’s industrial chain and reported that ESG performance shocks diffuse along supply chain links, with measurable impacts on downstream profitability and value-chain outcomes. Extending this logic, Tan et al. [6] introduce a directed graph neural network (GNN) that distinguishes upstream from downstream flows, demonstrating asymmetric propagation patterns that reveal where vulnerabilities accumulate and how network resilience is shaped by directionality. However, these studies provide strong empirical support for contagion-like ESG dynamics in production networks, illustrating the practical value of network-aware AI in identifying systemic exposure beyond a focal firm’s internal practices.
Bergier [7] reveals that in Brazil’s traceable beef export system, ESG risks such as deforestation can be embedded in indirect suppliers and remain invisible without relational infrastructures that connect ranches, intermediaries, and processors. This evidence supports a key limitation in conventional ESG monitoring. Angioni et al. [8] construct ESG knowledge graphs from news using NLP pipelines and demonstrate how ESG narratives evolve, providing a foundation for reputational monitoring and early warning systems. Brockmann et al. [9] focus on supply-chain link prediction under uncertainty using knowledge graphs extracted from web data, improving visibility across hidden tiers. Their approach is decision-relevant because accurate link inference enables earlier identification of where ESG exposure may reside, especially when supply-chain information is incomplete or noisy. To conclude, Cheng et al. [10] propose a large language model (LLM)-driven framework for schema induction and knowledge-graph construction in EV battery supply chains, illustrating how zero-shot and weakly supervised extraction can support disruption forecasting and ESG oversight in critical mineral contexts where supplier ecosystems are complex and rapidly evolving.
2.2. Hypothesis
2.2.1. ESG Risk as a Networked Phenomenon
Early ESG research conceptualised sustainability risk as an internal firm attribute, with a main focus on disclosure quality, ratings, and financial materiality [11,12]. This perspective underestimates the extent to which ESG risks are shaped by inter-organisational dependencies. Empirical evidence has shown that ESG incidents often originate from business partners and propagate through supply chain relationships [13]. Network-based literature suggests that ESG risk clusters among connected firms and that intermediaries or highly central actors face disproportionate exposure [14]. These findings align with theories of contagion and spillovers in economic networks, in which shocks diffuse along relational ties rather than remaining confined to originating nodes [15]. However, existing literature relies on static network representations or limited institutional settings, leaving open questions regarding temporal dynamics and predictive relevance. Based on the reviewed empirical studies, this study proposes the first hypothesis:
H1.
Firms within supply-chain networks exhibit higher ESG risk exposure than other firms.
2.2.2. AI Network Modelling in ESG Analysis
Artificial intelligence has recently been applied to ESG and supply chain research, particularly for prediction, anomaly detection, and risk classification [16]. Hence, machine learning models capture nonlinear relationships, and graph neural networks explicitly encode relational dependence and multi-hop interactions [17]. Evidence from financial and supply chain networks suggests that network-aware models outperform firm-level approaches when outcomes are shaped by interdependence [18]. However, existing AI-based ESG studies often prioritise classification accuracy without sufficient attention to probability calibration, interpretability, or integration with ESG theory [19]. Moreover, ESG performance indicators, controversy metrics, and network structure is rarely modelled jointly, limiting insights into how relational exposure interacts with firm behaviour. Based on the reviewed research, this study proposes the second hypothesis.
H1.
Firms within supply-chain networks exhibit higher ESG risk exposure than otherfirms.
2.3. Research gap
This study is motivated by gaps in the existing literature. Much of the industrial chain research focuses on a single national context and relatively stable institutional environment, which raises concerns about external validity when applied to global, multi-country supply chains operating under heterogeneous regulatory regimes. Moreover, existing studies often rely on comparatively static network snapshots, which may understate temporal rewiring, supplier substitution, and shock persistence within dynamic production and service ecosystems. In addition, prior literature demonstrates the separate value of network structure, such as directed graph neural networks (GNNs), and text-driven ESG signals, including news-based knowledge graphs and large language model (LLM) extraction. However, few studies explicitly integrate both data types into a unified predictive framework to assess whether combining relational supply chain structure with adverse ESG sentiment yields superior predictive accuracy and reliability. Addressing these limitations, this study builds on the empirical foundations presented in Table 4 to develop and evaluate network-aware AI models that jointly leverage supply-chain topology and ESG news signals to enhance the prediction of ESG risk and its propagation across global supply chains.
3. Research Design
3.1. Multi-Method Research Approach
To address the multifaceted nature of the ESG risk modelling paradigm, this study employs a structured multi-model framework. Traditional econometric specifications, including OLS, Poisson, negative binomial, and PPML, are used to verify the consistency of estimated network effects under different distributional settings and to address overdispersion and zero inflation [20]. Machine learning, such as Random Forest, Gradient Boosting, and XGBoost, is incorporated to improve the detection of relatively rare incidents and to accommodate nonlinear relationships that linear models may fail to capture [21]. Model performance is evaluated using both discrimination and calibration criteria, ensuring that predictive accuracy and probability reliability are jointly assessed. While SHAP analysis supports transparent interpretation of complex models. In addition, logit and survival specifications capture the timing and likelihood of ESG incidents. This design enhances robustness and delivers a balanced evaluation of ESG risk in networked production systems [22].
This study integrate data from different authoritative sources to capture supply-chain structures, cross-border trade activity, and ESG-related dynamics, as shown in Table 2. FactSet Revere provides firm identifiers, industry classifications, and validated supplier-customer relationships obtained through authenticated Application Programming Interface (API) queries. Panjiva (S&P) shipment data provide detailed logistics information, which is analysed using unsupervised anomaly-detected techniques, including autoencoder neural networks and Isolated Forest algorithms, to identify irregular trade patterns. Text-based ESG information is compiled from Global Database of Events, Language, and Tone (GDELT) using Google BigQuery filters, together with RepRisk incident data. These text sources are processed using transformer-based natural language processing models, including FinBERT, RoBERTa, and mBERT, to classify ESG-relevant content and track sentiment shifts. Country-level institutional conditions are captured using the Worldwide Governance Indicators (WGI). The sample periods are selected to ensure consistent reporting coverage and comparability over time.
3.2.. Data Volume
The datasets (Figure 1 and Figure 2) used in this study differ in scale and function, with GDELT and Panjiva serving as the core sources for ESG analysis. The GDELT Event database records tens of millions of news events annually, averaging approximately 63 million observations per year, which enables broad coverage of ESG-related narratives, sentiment, and reported incidents across countries and sectors [22,23]. Panjiva (S&P Global) provides shipment-level trade data at a million-record scale, with an average of roughly 25 million records per year, offering detailed evidence on cross-border trade flows and firm-level supply chain connections [24]. Table A3 in the Appendix presents the country’s most frequently associated with ESG-related events in the study sample, while Table A4 summaries the distribution of events across major media sources, illustrating both the geographical reach and the fragmented nature of global news coverage. The ten most frequently observed media sources account for 7.9% of all recorded events, whereas the remaining 92.1% are distributed across other outlets. GDELT and Panjiva are emphasised because their volume and granularity jointly support the examination of ESG information signals and supply-chain network structure; while the remaining datasets are primarily used for validation, benchmarking, and institutional context.
3.3. Sample Size Selection Procedure
The study sample was derived through a sequential filtering process designed to preserve firm traceability, network connectivity, and longitudinal coverage, which are important for supply-chain-based ESG analysis. The selection process is illustrated in Figure 3. Initially, the study combined 110,100 entity records from FactSet Revere, Panjiva, GDELT, and RepRisk. Due to differences in database structures and reporting units, firm identities were standardised using entity-matching procedures, which eliminated 42,300 duplicated or unresolved records and resulting in 62,500 firms with unique identifiers. Subsequent screening focused on data quality and network relevance.
Firms were removed if they had unstable identifiers (6,200), incomplete firm-level attributes (7,800), or unverifiable supply-chain relationships (7,500). This step yielded 41,000 firms with reliable identifiers and a basic relational structure. To ensure suitability for network-oriented ESG modeling, the study retained only firms with at least one confirmed supply-chain connection, observable ESG-related signals, and sufficient temporal information. This stage excluded 15,500 firms, resulting in a final analytical sample of 25,500 firms. Table 3 highlights the regional scope of the sample, capturing both major economic hubs and emerging markets with diverse regulatory contexts. For the retained firms, transaction-level and event-based observations were collected. Panjiva data produced approximately 2.5 million shipment observations, reflecting repeated supplier-customer interactions, while GDELT, yielded approximately 1.2 million ESG-relevant news events that met relevance and duplication criteria.
3.4. Network-Based ESG Dataset Structure
Table 4 outlines the construction of the network-based ESG dataset. Verified supply-chain relationships are translated into directed, weighted adjacency matrices, where link direction indicates product flows and weights reflect shipment intensity. Hence, all core results are robust to both binary and shipment -weighted adjacency indicators, yielding qualitatively identical coefficients. Graph computations are conducted using NetworkX and related libraries to generate firm-level structural attributes, including degree, betweenness, eigenvector centrality, and clustering measures.
Empirical evidence indicates that degree centrality capture ESG exposure, betweenness centrality identifies firms that transmit risk across supply chains, eigenvector centrality reflects amplified risk arising from influential partners, and clustering coefficients capture local connection of ESG incidents [26]. These indicators differentiate firm by connectivity, brokerages roles, and structural influence within the network. Network matrices are then integrating with yearly ESG incident counts, sentiment measures produced by transformer-based language model, anomaly scores capturing irregular trade behaviour, and country-level institutional indicators from the Worldwide Governance Indicators. Figure 4 shows the study dataset’s network-based patterns, it illustrates an adverse ESG event emerging upstream at and propagating downstream through direct and indirect supply-chain links. donates the firm under analysis, while represents a strategically positioned upstream supplier. Their high betweenness centrality indicates brokerage roles that channel indirect ESG exposure across connected firms and clustered production structures.
3.5. Measurement of Variables
Table 5 outlines the operational definitions and measurement approach for all study variables, which are grouped into dependent, independent, and control categories.
3.6. A Multilayer Network Econometric and AI Framework for ESG Modelling
The study adopts a multilayered analytical framework that combines network econometrics, supervised and unsupervised machine learning, graph-based models, anomaly detection methods, and natural language processing to capture the multifaceted nature of ESG risk in global supply chains. Each analytical layer is anchored in a clear statistical or algorithmic formulation, ensuring interpretability, internal coherence, and methodological rigour.
- 1.
- Network-Based Baseline Model
Equations (1) and (2) specify a baseline model in which firm-level ESG risk is expressed as a function of network exposure , lagged centrality measures , and firm controls , with firm and time fixed effects, capturing structural dependence of ESG risk across supply chain networks [27].
- 2.
- Supervised and Graph-Based Learning
The supervised ESG risk prediction model uses historical firm, network, and news data to predict future ESG outcomes. Graph-based models, particularly graph neural networks, are employed to represent inter-firm dependence and indirect exposure arising from multi-tier supply-chain linkages. Equation (3) estimates ESG event probability () based on = shipment irregularities, sentiment, lagged incidents, network metrics, governance controls, and firm (, and time effects, providing a transparent benchmark for supervised learning [28].
The graph-based model in equation (5) explicitly captures inter-firm dependence by incorporating a shipment-weighted network-lag term . Equations (6)– (8) show Graph Neural Networks (GNNs), which generalise this spatial dependence in a nonlinear and high-dimensional framework. In Graph Attention Networks (GANs), neighbour information is aggregated through attention-weighted mechanisms [29].
- a.
- Attention coefficient (importance of neighbor for ):
- b.
- Attention-based message aggregation:
Here, is an interpretable weight that tells you how strongly supplier ’s characteristics influence firm ’s ESG risk at layer . These attention weights identifying which upstream characteristics exert the strongest influence on downstream risk.
- 3.
- Unsupervised Learning and Anomaly Detection
Equation 9 specifies unsupervised methods that identify latent ESG risk structures and abnormal behavior rather than direct predictions. Firm-time observations are assumed to arise from latent regimes . while defining local density neighborhoods used for unsupervised clustering and anomaly detection [30].
Equation (10) estimate the anomaly detection using an Isolation Forest with random trees. The function denotes the average path length of across trees. Shorter paths lengths and greater isolability reflect more anomalous behaviour. where is the sample size and are the average path length of unsuccessful searches in a binary tree. A High flags shipment or sentiment anomalies as early-warning ESG signals [31].
An autoencoder learns a low-dimensional representation via encoder and decoder , where is the reconstructed observation and denotes the autoencoder-based anomaly score interpreted as an atypical pattern in ESG incidents, shipments, or sentiment [32].
- 4.
- Natural Language Processing
Text-based ESG indicators are integrated into panel regression models to retain interpretability. Topic exposure is derived from Latent Dirichlet Allocation, while reflects adverse sentiment extracted through transformer-based models [33]. These NPL procedures enter the model as stochastic regressors, which allow marginal effects to be quantified from document-level tone scores , aggregated using relevance weights based on factors such as source prominence and content volume [34,35].
3. Results
3.1. Descriptive and Correlation Results
Table 6 shows the statistical results, which reveal substantial heterogeneity across firms’ ESG risk profiles and operational characteristics. Mean environmental, social, and governance scores (2.84, 3.12, and 2.57) indicate moderate ranges, while the upper bounds of 9.40, 10.20, and 8.30 indicate a non-trivial concentration of high-risk entities. This dispersion suggests potential skewness that may influence the model’s sensitivity in subsequent analyses. Operational characteristics show even wider variation. Shipment volume (log), recorded over 2.5 million firm-periods, spans 0.00 to 15.21, which reflects significant differences in operational scale.
Trade dependency of mean = 0.41 and network position mean = 0.28 also display a broad spread, implying uneven integration into supply-chain structures, which is an important consideration for network-based ESG risk transmission. The sentiment measure exhibits pronounced volatility (mean = –5.87; SD = 12.44; range: 90.00 to 85.00), consistent with fluctuating media intensity surrounding ESG topics. Lagged incident counts with mean = 1.72; max = 47.00, which show a heavy-tailed distribution. This result suggests that controversial events cluster among a minority of firms. In conclusion, regional context values (mean = 0.56) indicate meaningful institutional disparities.
Table 7 presents a correlation analysis that reveals a clear pattern of interconnected ESG conditions across firms. ESG risk indicators exhibit significant correlations, with values ranging from 0.482 to 0.623, which implies that pressures in one dimension rarely occur in isolation. The link between prior controversy activity and current risk levels is even stronger (0.577–0.709), suggesting that ESG events tend to recur and that firms with a history of controversies remain persistently vulnerable. Media-related sentiment also aligns positively with ESG risk indicators (0.392–0.507) and with lagged incidents (0.492), indicating that deteriorating news tone typically accompanies firms already facing elevated risk exposure.
Trade dependency and network position demonstrate moderate associations with ESG variables (0.217–0.366), which supporting the idea that firms more deeply embedded within supply chains may be more susceptible to operational or reputational disruptions. However, Shipment volume and regional context show negatively correlations with ESG risks (–0.094 to –0.459), indicating that scale advantages and institutional environments can mitigate risk intensity. Despite several moderately sized relationships, the variance inflation factors (1.36–2.49) remain well below critical thresholds, indicating insignificant multicollinearity.
3.2. Test of Hypotheses
3.2.1. Test of H1: Firms Within Supply-Chain Networks Exhibit Higher ESG Risk Exposure than Other Firms.
The network-augmented regression (NAR) results reported in Table 8 provides evidence on the role of supply-chain structure in shaping firms’ ESG risk exposure. The estimated network-lag coefficient is positive and statistically significant ( = 0.351, = 0.011), indicating that ESG risk is not independent across firms but instead clusters within connected supply-chain networks. This finding supports the hypothesis that ESG risk propagates through inter-firm relationships. Centrality measures exhibit heterogeneous effects. Degree centrality is not statistically significant (= −0.018, = 0.262), suggesting that the sheer number of supply-chain connections does not, by itself, increase ESG exposure.
On the other hand, betweenness centrality (= 0.094, = 0.016) and eigenvector centrality (= 0.157, = 0.011) are both positive and significant, implying that firms occupying brokerage positions or connected to influential partners face elevated ESG risk. Trade dependency is positive but insignificant (= 0.166, = 0.468), indicating that structural position dominates simple exposure measures once controls are included. Among the control variables, shipment volume significantly increases ESG risk, while stronger regional governance is associated with lower risk. Although the model explains a modest proportion of variation ( = 0.189), this result is consistent with ESG outcomes being driven by multiple interacting factors. Diagnostic tests reported in the Appendix (Table A1), including Moran’s I, LM-lag, and Wald tests, confirm the presence of spatial dependence and validate the network specification.
Figure 5 provides predictive evidence relevant to H1, which suggests a relationship between firms’ network positions and ESG risk exposure. Panels A and B show that predicted ESG risk increases monotonically with both the network lag term and eigenvector centrality; firms more strongly exposed to high-risk partners, or connected to influential actors, exhibit higher model-implied ESG risk. The association is smoother for network-lag, while eigenvector centrality exhibits greater dispersion, reflecting heterogeneous influence across supply-chain structures. Panels C and D present marginal effects by decile and reveal a consistent upward pattern, suggesting that network-related exposure intensifies toward higher deciles of connectedness and centrality. The partial dependence and marginal effects jointly support the hypothesis that supply-chain network structure contributes significantly to ESG risk beyond firm-level characteristics.
Table 9 reports robustness checks designed to test the hypothesis that ESG risk is shaped by inter-firm network dependence rather than firm characteristics alone. Three complementary specifications are applied: the Spatial Lag Model, the Spatial Durbin Model, and a panel fixed-effects model. Collectively, they test whether the findings are model-specific or structurally persistent. The term spatial follows the econometric convention and refers to network adjacency rather than physical geography. Across all specifications, the network-lag coefficient remains positive and statistically significant (= 0.314, = 0.271, = 0.284). This pattern indicates that ESG risk clusters systematically among connected firms, consistent with transmission through supply-chain linkages.
The indicates that network effects extend beyond direct partners. Spatial lags of shipment volume (0.083), eigenvector centrality (0.067), and regional context (−0.212) suggest that firm scale, network prominence, and governance environments jointly influence ESG exposure. Thus, centrality effects remain stable across models, reinforcing the conclusion that ties to influential hubs increase risk. Fixed-effects estimates also confirm persistence, with lagged sentiment (0.021) and prior incidents (0.063) remaining significant. No causal interpretation is implied, due to observational design.
Table 10 reports results from graph-theoretic regressions examining whether firms’ positions within supply-chain networks are associated with variation in ESG risk. The findings provide strong empirical support for this hypothesis. Across environmental, social, and governance dimensions, betweenness and eigenvector centrality emerge as the most influential predictors. Firms occupying intermediary positions exhibit significantly higher ESG risk scores (Environmental: 0.472; Social: 0.286; Governance: 0.383), suggesting heightened vulnerability to operational disruptions and reputational spillovers transmitted through the network. Similarly, positive and sizable eigenvector centrality coefficients suggest that ties to influential or highly connected partners amplify ESG exposure. Thus, clustering shows a smaller but statistically significant effect, implying that dense local network structures can foster shared risk environments. In contrast, degree centrality indicates limited explanatory power, suggesting that the number of connections alone is less relevant than their strategic importance. Model fit statistics (R² ranging from 0.522 to 0.578) indicate substantial explanatory power relative to typical ESG applications. However, the results confirm that network position constitutes a significant determinant of ESG risk, beyond firm-level characteristics.
Table 11 shows the standardized coefficients indicate firms are positioned within the network matters more than the sheer number of connections they maintain. Across ESG dimensions, betweenness and eigenvector centrality consistently exhibit the strongest associations with ESG risk. Betweenness centrality shows the largest standardized effect for environmental risk (Std. = 0.524) and a significant effect for governance risk (Std. = 0.388), indicating that firms acting as intermediaries face elevated exposure to spillovers, regulatory attention, and disruption transmission. Eigenvector centrality exhibits its strongest relationship with social risk (Std. = 0.518), suggesting that firms embedded within influential supplier networks experience greater reputational and labour-related pressures. Clustering coefficients contribute more modestly, particularly for governance outcomes, while degree centrality, although statistically significant in some specifications, yields comparatively smaller effects, implying that connection quality outweighs connection quantity. Therefore, the relatively high explanatory power of the models (R² between 0.52 and 0.58) underscores the substantive role of network structure in shaping firm-level ESG risk exposure.
3.2.2. Test of H2: Lagged AI-Extracted ESG News Sentiment has a Statistically Significant Relationship with Subsequent Firm-Level ESG Incident Risk
Table 12 reports a series of robustness checks assessing the association between lagged ESG news sentiment and subsequent ESG incidents. sentiment scores are standardised such that lower values indicate more adverse coverage. Across all model specifications, lagged sentiment enters with a negative and statistically significant coefficient, indicating that more adverse ESG-related media coverage is associated with higher future ESG incident risk. Therefore, negative coefficients imply increased ESG risk. In the fixed-effects OLS model with Driscoll–Kraay standard errors, the coefficient of −0.398 reflects a strong association after controlling for firm and year effects, as well as cross-sectional dependence. Comparable effect sizes are observed in count-based models. In the Poisson fixed-effects specification, the coefficient of −0.211 indicates that a one standard deviation improvement in sentiment corresponds to an approximate reduction in expected incident counts. Estimates from the negative binomial (−0.236) and PPML (−0.224) models are similar, confirming robustness to overdispersion and excess zeros. Temporal analyses indicate attenuation over longer horizons. When sentiment is lagged by two periods, the coefficient declines to −0.173, and in the distributed-lag specification, the short-run effect at (−0.311) exceeds the longer-run impact at (−0.089). Thus, heterogeneity analysis further shows stronger effects for firms occupying central network positions compared to peripheral firms. A placebo test using future sentiment yields no significant association, supporting correct temporal ordering. The results indicate that AI-extracted ESG news sentiment is a stable and informative predictor of future ESG incidents. However, all estimates are associational, and no causal interpretation is implied due to observational design, and unobserved confounding.
Table 13 assesses how extreme negative ESG sentiment in the preceding period relates to subsequent controversy outcomes across several model frameworks. In the logit results, a lagged sentiment shock is associated with a substantially higher probability of an ESG incident, with an estimated coefficient of 2.28 (p < 0.001), an odds ratio of 9.81, and an average marginal effect of +0.20. This indicates a pronounced increase in incident likelihood following highly adverse coverage. The Poisson specification yields comparable evidence, where the coefficient of 0.94 (p < 0.001) corresponding to an incident rate ratio of 2.56, implying a more than twofold increase in expected incident counts. Results from the Cox proportional hazards model further show that firms experiencing negative sentiment shocks enter an ESG controversy state more rapidly, with a hazard ratio of 1.51 (β = 0.41, p < 0.001). Network centrality remains positive and significant across all models, with estimated odds, rate, and hazard ratios of 1.69, 1.19, and 1.42, respectively, indicating elevated exposure for more centrally positioned firms. Firm size exhibits a consistently negative association, with odds ratios near 0.96 and a hazard ratio of 0.93. These findings demonstrate that extreme adverse ESG sentiment serves as a robust indicator of heightened future controversy risk.
Table 14 examines the robustness of ESG news sentiment across alternative NLP architectures in terms of alignment, inference, and prediction. Using FinBERT as a domain-adapted benchmark, cross-model correlations show strong agreement with RoBERTa (Pearson r = 0.84; Spearman ρ = 0.81) and weaker alignment with mBERT (r = 0.72; ρ = 0.69), indicating rising measurement noise with more general models. Despite this, inferential results are stable. Lagged sentiment is negative and significant in all logit models, with coefficients from −0.87 to −0.55 and odds ratios between 0.42 and 0.58; all confidence intervals exclude unity. Predictive tests using Random Forests show consistent gains from adding sentiment, with ΔAUC increases of 0.22 (FinBERT), 0.20 (RoBERTa), and 0.15 (mBERT). Smaller gains align with higher polarity flip rates (3%, 7%, 10%) and greater sentiment variance. Shock analyses confirm robustness, indicating bottom-decile sentiment raises incident odds by 10.3×, 8.9×, and 6.1×, respectively, with strongest effects for ESG-adapted models.
Figure 6 assesses the robustness of ESG sentiment across NLP architectures. Panel A evaluates predictive contribution, showing positive ΔAUC gains (0.22, 0.20, 0.15). Panel B examines inferential association, indicating a higher incident risk under sentiment shocks (OR = 10.3–6.1). Attenuation across models reflects measurement noise rather than structural instability.
Table 15 shows that models using only control variables perform little better than random guessing, with ROC–AUC values around 0.49–0.52 and balanced accuracy near 0.50, indicating that baseline firm characteristics have limited ability to predict ESG incidents. When ESG news sentiment is included, performance improves substantially across all models, with ROC-AUC rising to 0.66–0.79 and AUPRC increasing to 0.44-0.54. Balance accuracy and F1 scores also increase, reaching approximately 0.64–0.68 and 0.62–0.66, respectively, indicating that the improvements reflect genuine classification gains rather than threshold effects. Random Forest and XGBoost achieve the strongest results, with ROC–AUC of 0.79. Overall, ESG sentiment clearly enhances out-of-sample prediction performance without implying causality. Table A2 in the Appendix reports diagnostic tests supporting these findings. Delong statistics indicate significant increases across models (= 5.01–7.55, < 0.001), while McNemar results ( = 18.6–34.1) and strictly positive confidence intervals further corroborate these improvements.
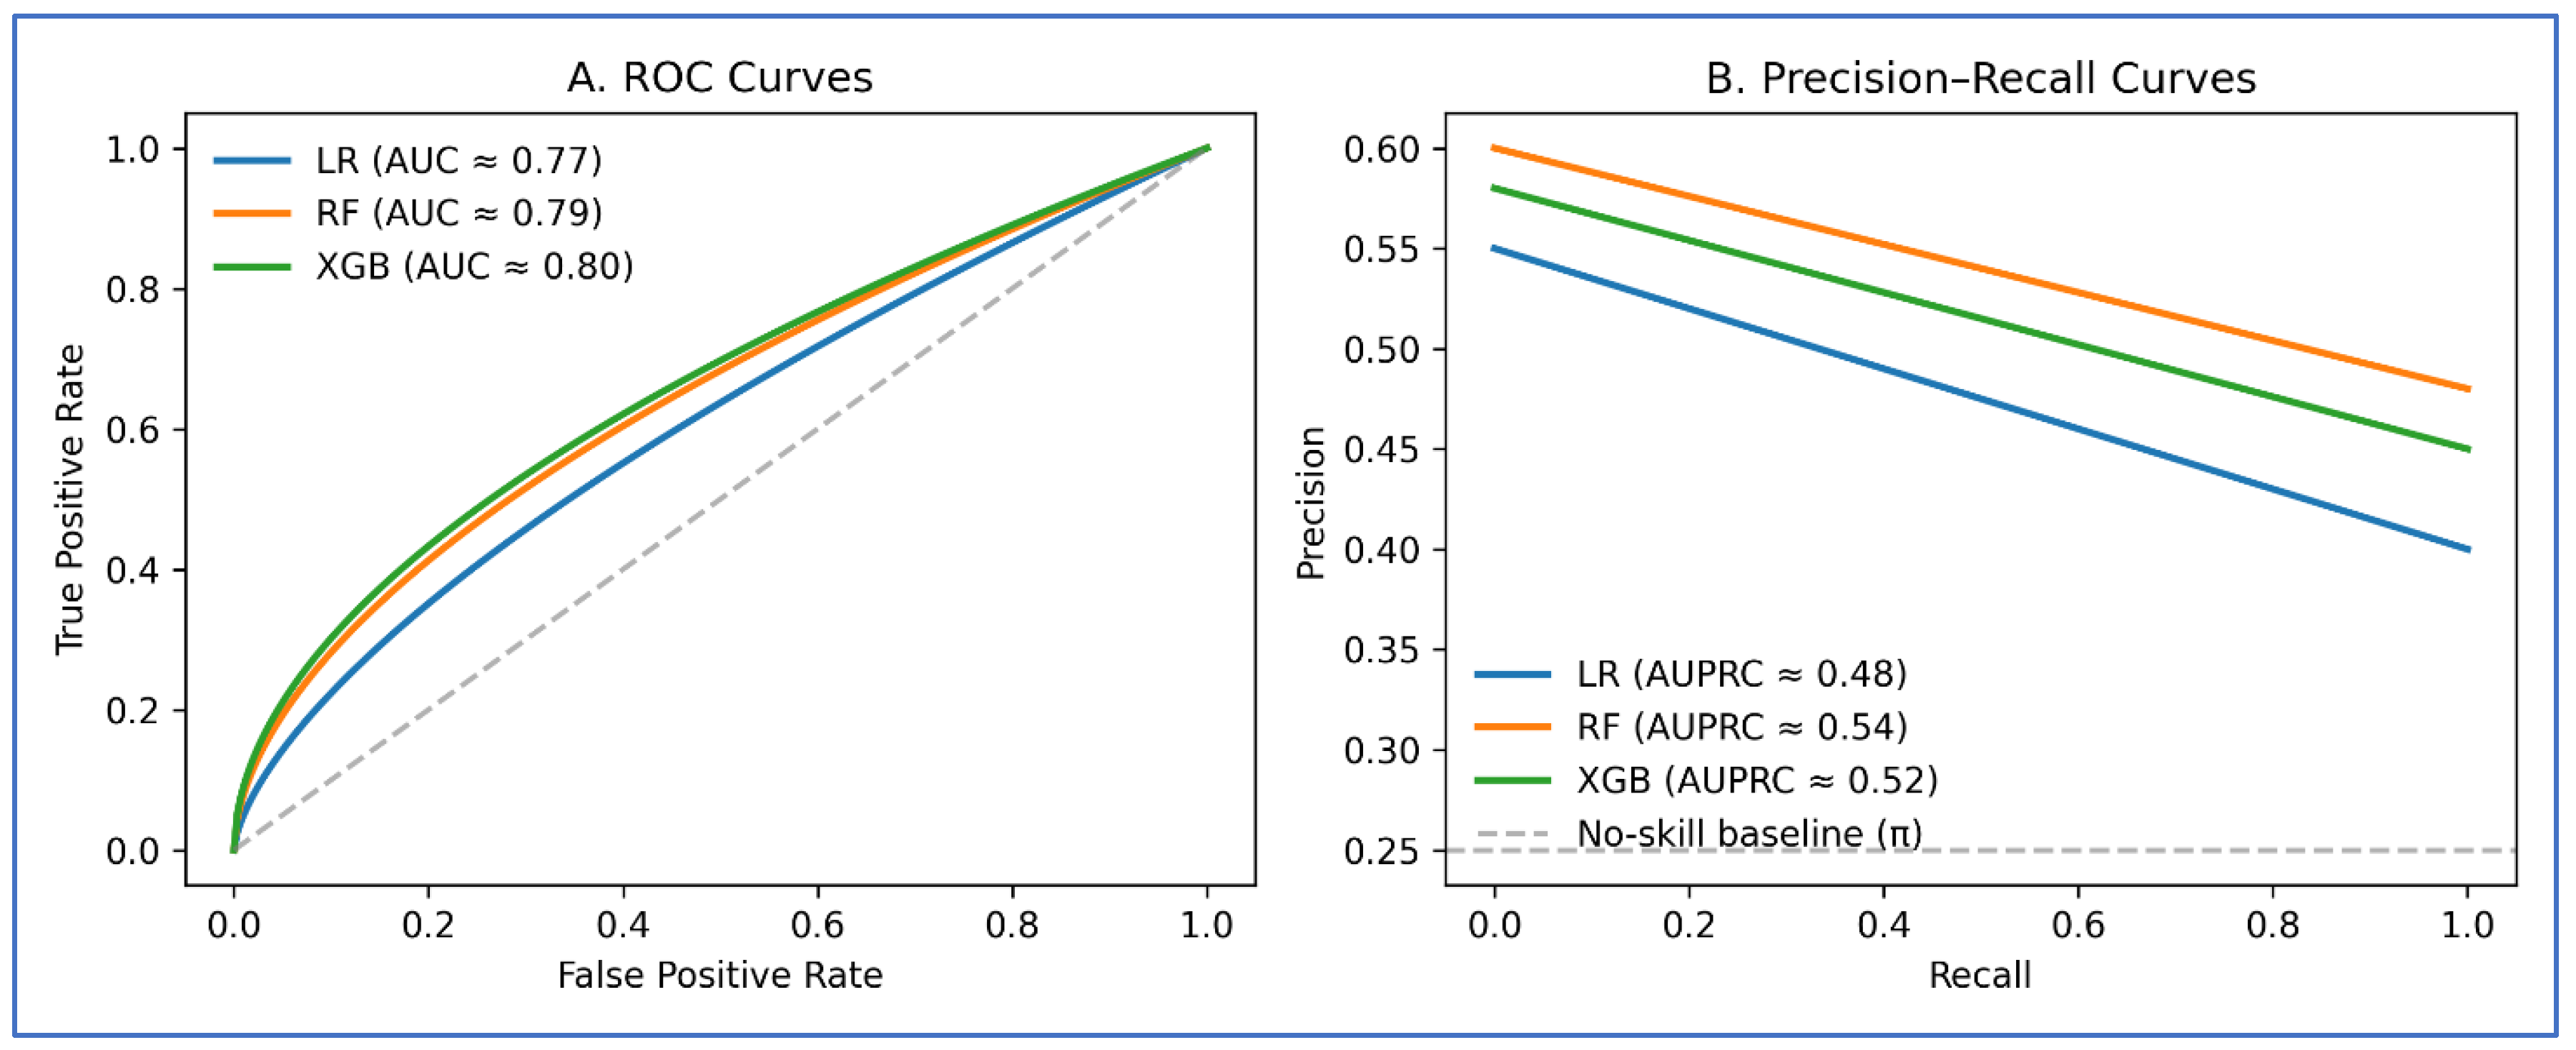
Figure 7.
ROC and prediction-recall curves for predicting future ESG incidents Control +Sentiment Features.
Figure 7.
ROC and prediction-recall curves for predicting future ESG incidents Control +Sentiment Features.
Table 16 shows a clear improvement in predictive performance as models progress from econometric approaches to machine-learning methods and then to graph-based AI. Baseline econometric models perform modestly. Logistic Regression and Poisson GLM record ROC-AUC values of about 0.69–0.71 and Brier scores above 0.21, indicating limited discriminatory power and weak calibration when ESG risk is inferred solely from-level characteristics. Including firm fixed effects improves performance slightly, with ROC-AUC rising to 0.73 and the Brier score falling to 0.207, although substantial variation in risk remains unexplained. Machine learning models provide stronger results. Random Forest and Gradient Boosting raise ROC–AUC to approximately 0.76–0.77 and reduce Brier scores to below 0.19. XGBoost further enhances performance, achieving a ROC–AUC of 0.81 and a Brier score of 0.168. These gains are accompanied by higher recall, increasing from 0.67 in the best econometric model to 0.72, indicating fewer missed ESG incidents rather than superficial accuracy gains. The largest improvements arise from the graph neural network, which attains a ROC–AUC of 0.87, the lowest Brier score at 0.149, and the highest precision and recall. The findings suggest that ESG risk prediction is strengthened by accounting for inter-firm connections. While the analysis is predictive rather than causal, it demonstrates that incorporating network structure yields more informative and reliable risk assessments than models based solely on isolated firm attributes. Figure 8 shows the comparative predictive performance of the models for ESG risk.
Table 17 compares the forecast accuracy and calibration of several machine-learning and graph-based models. The results show a clear performance gradient as models incorporate greater nonlinearity and structural information. Random Forest and Gradient Boosting deliver moderate performance, with Brier scores between 0.184 and 0.189, log-loss values above 0.53, and relatively higher MAE (0.287–0.296) and RMSE (0.417–0.423), indicating less precise probability estimates and larger average prediction errors. More advanced learners, including XGBoost and multilayer perceptions, further reduce forecast error. These models achieve lower Brier scores (0.168 and 0.161), improved log-loss values, and noticeable reductions in MAE (0.271 and 0.263) and RMSE (0.398 and 0.387), reflecting gains in both calibration and overall accuracy. The graph neural network (GNN) exhibits the strongest performance across all metrics. It records the lowest Brier score (0.149), log-loss (0.472), MAE (0.249), and RMSE (0.368), indicating the closest alignment between predicted probabilities and realized ESG outcomes. The narrow confidence interval around the Brier score suggests that these gains are stable rather than driven by sampling variation. The evidence underscores the values of network aware models for ESG risk forecasting, as incorporating inter-firm relationships enhances probability reliability and reduces prediction error.
SHAP (Figure 9) illustrates how individual feature contribute to predicted ESG incident risk across observations. Negative news sentiment in the prior risk period emerges as the most influential factor, with higher negative sentiment consistently pushing predictions toward higher risk. Network position also plays a major role. Firms with greater centrality exhibit positive SHAP values, indicating elevated exposure to ESG incidents through interconnected relationships. Environmental, social and governance risk indicators show similar patterns: higher values in each dimension are associated with increased predicted risk, although their marginal effects are smaller than those of sentiment and network position. Past ESG incidents contribute positively to current risk, conforming persistence in firm-level ESG exposure. Operational scale and context variables, such as shipment volume, regional context, and trade dependency, exert more modest and tightly distributed effects, suggesting that they act as background risk modifiers rather than primary drivers. Colours indicate feature magnitude. The vertical zero-line indicates a neutral effect. Positive SHAP values increase predicted ESG risk, while negative values reduce it.
Table 18 shows a detailed decomposition of classification outcomes on an independent test set, enabling direct comparison of how different models trade off missed ESG incidents against false alerts. Thresholds are selected by maximising the score on the validation set, ensuring that differences in performance reflect model capability rather than arbitrary cut-offs. XGBoost demonstrates a clear improvement, with recall rises to 0.66 and the false-negative rate falling to 0.34, while the false-positive rate declines slightly to 0.09. Gains in precision indicate a more balanced conversion of alerts into true incident detections. The graph neural network performs best overall, achieving the highest recall (0.74) and precision (0.54), along with the lowest false-positive (0.07) and false-negative (0.26) rates. These results suggest that incorporating network information improves the identification of ESG propagation, although false alarms remain present. This analysis enables a transparent assessment of predictive trade-offs in ESG risk monitoring. Figure 10 compares confusion matrices and error decomposition for the most efficient AI models used to predict ESG risk
4. Discussion and Implications
4.1. Discussion
This study confirms that ESG risk cannot be adequately understood as an isolated firm attribute. Instead, it is closely tied to the configuration and intensity of relationships that firms maintain within global supply chains. By applying network econometric techniques, machine learning models, graph neural networks, and NLP-based sentiment extraction, the analysis reveals that ESG vulnerabilities emerge and intensify through relational exposure, particularly for firms embedded in structurally influential positions. This network-based view aligns with recent scholarship emphasising interconnected ESG risk formation in production systems [36]. The persistent significance of network-lag effects and positional indicators, especially betweenness and eigenvector centrality, reveals that firms acting as bridges or connected to influential partners face heightened ESG exposure. These results are consistent with theoretical perspectives on contagion and spillover in complex networks whereby intermediaries transmit shocks more efficiently than peripheral actors [37,38].
These findings reveal that network structure conditions both the likelihood and persistence of ESG risk, even after accounting for firm characteristics, prior incidents, and institutional context. However, media-based ESG sentiment emerges as a significant anticipatory signal. Adverse news sentiment systematically precedes ESG incidents across a wide range of specifications, with diminishing effects over longer horizons and no detectable influence in placebo tests. This pattern supports an interpretation of sentiment as an early-warning mechanism rather than a contemporaneous reflection of realised events, consistent with prior evidence on text-based ESG indicators [39]. Sentiment signals are robust across multiple NLP architectures, and domain-adopted models yield more stable estimates, underscoring the value of contextualised language representations in ESG analytics. From a forecasting standpoint, the analysis highlights substantial gains from explicitly modelling inter-firm dependence. Graph neural networks outperform econometric and machine learning approaches across calibration and error-based metrics, producing probability estimates that more closely track realised outcomes. This is essential in ESG applications, where poorly calibrated predictions can delay intervention or misdirect oversight efforts.
4.2. Implications
The results indicate that firms should move beyond compliance-focused, firm-level ESG assessments toward risk management approaches that explicitly consider supply-chain structure. Firms occupying central or intermediary positions within production networks merit closer attention, as their exposure reflects both internal practices and risks transmitted through connected partners. Integrating real-time ESG news sentiment into monitoring systems can further strengthen early-warning capacity, enabling firms to respond before emerging issues escalate into formal controversies. The improved probability calibration achieved by graph-based models has directly operational relevance. More reliable risk estimates reduce unnecessary alerts while limiting overlooked exposures, allowing firms to allocate sustainability, auditing, and compliance resources more effectively across complex and geographically dispersed supply chains. For regulators and standard setters, the findings emphasized that ESG risk should be viewed as a systemic phenomenon embedded within supply networks. Oversight frameworks focused solely on direct corporate activities may underestimate exposure arising from upstream and downstream linkages. Incorporating network-informed indicators into supervisory and disclosure regimes could improve the identification of systemic ESG vulnerabilities, particularly in sectors characterised by dense cross-border production relationships. From a research perspective, this study demonstrates the value of integrating econometric analysis with AI-based prediction and interpretability tools.
This study is limited by its reliance on observational data, which limits causal interpretation.
Supply-chain relationship may be partially observed or static over time. ESG event records and sentiment indicators can contain measurement noise. Model effectiveness may differ across industries, regions, and alternative data environments.
5. Conclusion
The proposed framework captures how ESG vulnerabilities emerge, diffuse, and persist within interconnected production systems. The evidence shows that firms occupying structurally influential or intermediary positions face disproportionately higher ESG exposure, highlighting the importance of network topology in sustainability risk assessment. The analysis further establishes ESG news sentiment as a forward-looking signal that precedes the realization of ESG controversies. The consistent predictive power of lagged sentiment across multiple model classes and robustness checks supports its use as an early-warning indicator, while differences across NPL architectures emphasise the value of domain-adapted language models for ESG applications. Importantly, these insights remain descriptive and predictive and do not imply causal mechanisms.
From a modelling perspective, the results confirm that explicitly accounting for inter-firm dependence materially improves risk estimation. Graph neural networks deliver superior probability calibration and lower forecast errors than both econometric and convectional machine-learning approaches, which is particularly relevant in ESG contexts where inaccurate risk estimates can delay mitigation or misdirect oversight efforts. This study advances ESG research by reframing sustainability risk as a network-conditioned phenomenon and by demonstrating how AI-based, network-aware methods can enhance ESG monitoring at scale. The framework is designed to be adaptable across industries and regions, providing a foundation for more responsive and system-oriented ESG risk management. Future research can extend this work by incorporating alternative data sources, such as satellite imagery or audit records, and by developing causal designs to isolate specific transmission channels.
Appendix A

Table A1.
Network Dependence Diagnostics.
| Test | Statistic | p-value |
|---|---|---|
| Moran’s I (ESG risk) | 0.218 | 0.000 |
| LM-lag | 31.44 | 0.000 |
| Robust LM-lag | 24.37 | 0.000 |
| LM-error | 18.22 | 0.000 |
| Robust LM-error | 7.11 | 0.008 |
| Wald Test (ρ ≠ 0) | 12.58 | 0.000 |
Table A2.
Statistical validation of predictive improvements from ESG sentiment.
| Model | ΔAUC | DeLong Z | DeLong p-value |
McNemar χ² | McNemar p-value | 95% CI for ΔAUC | Remark |
|---|---|---|---|---|---|---|---|
| Logistic Regression | 0.183 | 6.12 | <0.001 | 21.8 | <0.001 | [0.142, 0.214] | Statistically significant and robust improvement |
| Random Forest | 0.218 | 7.55 | <0.001 | 34.1 | <0.001 | [0.181, 0.253] | Largest and most stable predictive gain |
| Gradient Boosting | 0.164 | 5.01 | <0.001 | 18.6 | <0.001 | [0.129, 0.196] | Consistent and significant uplift |
| XGBoost | 0.184 | 6.44 | <0.001 | 26.4 | <0.001 | [0.144, 0.223] | Strong and robust improvement |
Null hypotheses: (i) ΔAUC = 0 (DeLong, bootstrap). (ii) Sentiment-augmented and baseline models commit equal classification errors (McNemar).
Table A3.
Countries By Share of Recorded ESG-Related Events.
| Rank | Country | Share of Events |
|---|---|---|
| 1 | United States | 26.4% |
| 2 | United Kingdom | 4.7% |
| 3 | Russia | 3.9% |
| 4 | India | 3.5% |
| 5 | China | 3.0% |
| 6 | Israel | 2.5% |
| 7 | Nigeria | 2.0% |
| 8 | France | 2.0% |
| 9 | Canada | 1.9% |
| 10 | Australia | 1.8% |
| Total | 51.7% |
Table A4.
Media Sources by Share of Recorded ESG-Related Events.
| Rank | Media Source | Country | Share of Events |
|---|---|---|---|
| 1 | MSN | United States | 3.1% |
| 2 | Reuters | United Kingdom | 0.9% |
| 3 | Love Radio | United States | 0.9% |
| 4 | Daily Mail | United Kingdom | 0.5% |
| 5 | Yahoo | United States | 0.4% |
| 6 | The Times of India | India | 0.4% |
| 7 | Pan-African Network | South Africa | 0.4% |
| 8 | Houston Chronicle | United States | 0.3% |
| 9 | Washington Times | United States | 0.3% |
| 10 | San Francisco Chronicle | United States | 0.3% |
| Total | 7.9% |
Note. Shares represent the proportion of recorded media events attributed to each country.
References
- Carvalho, V.M.; Nirei, M.; Saito, Y.U.; Tahbaz-Salehi, A. Supply chain disruptions. Quarterly Journal of Economics 2021, 136, 2051–2121. [Google Scholar] [CrossRef]
- Berg, F.; Kölbel, J.F.; Rigobon, R. Aggregate confusion: The divergence of ESG ratings. Review of Finance 2022, 26, 1315–1344. [Google Scholar] [CrossRef]
- Acemoglu, D.; Carvalho, V.M.; Ozdaglar, A.; Tahbaz-Salehi, A. The network origins of aggregate fluctuations. Econometrica 2012, 80, 1977–2016. [Google Scholar] [CrossRef]
- MacCarthy, B.L.; Ahmed, W.A.H.; Demirel, G. Mapping the supply chain: Why, what, and how? International Journal of Production Economics 2022, 250, 108688. [Google Scholar] [CrossRef]
- Wei, X.; Xu, J.; Zeng, C.; Chen, Y.; colleagues. Gone with the chain: The ripple effect of ESG performance in China’s industrial chain. Environmental Impact Assessment Review 2024, 108, 107576. [Google Scholar] [CrossRef]
- Tan, Z.; Liu, S.; Liu, Q.; Hu, M.; Zhang, X.; Wang, W.; Liu, B. Modeling ESG-driven industrial value chain dynamics using directed graph neural networks. Financial Innovation 2025, 11, 83. [Google Scholar] [CrossRef]
- Bergier, I. Relational infrastructures for planetary health: Network governance and inner development in Brazil’s traceable beef export system. Challenges 2025, 16, 48. [Google Scholar] [CrossRef]
- Angioni, S.; Consoli, S.; Dessì, D; Salatino, A.A. Exploring environmental, social, and governance (ESG) discourse in news: An AI-powered investigation through knowledge graph analysis. IEEE Access Advance online publication. 2024. [Google Scholar] [CrossRef]
- Brockmann, N.; Kosasih, E.E.; Brintrup, A. Supply chain link prediction on uncertain knowledge graphs. ACM SIGKDD Explorations Newsletter 2022, 24, 124–130. [Google Scholar] [CrossRef]
- Chen, T.; Guestrin, C. XGBoost: A scalable tree boosting system. In Proceedings of the 22nd ACM SIGKDD International Conference on Knowledge Discovery and Data Mining, 2016; pp. 785–794. [Google Scholar] [CrossRef]
- Khan, M.; Serafeim, G.; Yoon, A. Corporate sustainability: First evidence on materiality. The Accounting Review 2016, 91, 1697–1724. [Google Scholar] [CrossRef]
- Eccles, R.G.; Ioannou, I.; Serafeim, G. The impact of corporate sustainability on organizational processes and performance. Management Science 2014, 60, 2835–2857. [Google Scholar] [CrossRef]
- Guerrero, S.; Viteri, J.P. What do environmental, social, and governance scores measure? The role of outcome and impact indicators in ESG scores. Finance Research Letters 2025, 72, 106529. [Google Scholar] [CrossRef]
- Kinnear, D.; Ogden, J. Network dependence in firm risk. Journal of Economic Dynamics and Control 2021, 125, 104079. [Google Scholar] [CrossRef]
- Jackson, M.O. Social and economic networks; Princeton University Press, 2010. [Google Scholar]
- Buehler, K.; Hunneman, A.; Perakis, S. ESG analytics and explainable AI. McKinsey Quarterly 2022. [Google Scholar]
- Buehler, S.; Schädler, K. Machine learning for ESG risk prediction. Journal of Sustainable Finance & Investment 2022. [Google Scholar]
- Kim, H.; Lee, J. Proposing an integrated approach to analyzing ESG data via machine learning and natural language processing. Sustainability 2022, 14, 4456. [Google Scholar] [CrossRef]
- Ribeiro, M.T.; Singh, S.; Guestrin, C. “Why should I trust you?” Explaining the predictions of any classifier. In Proceedings of the 22nd ACM SIGKDD International Conference on Knowledge Discovery and Data Mining, 2016; pp. 1135–1144. [Google Scholar] [CrossRef]
- Chen, T.; Guestrin, C. XGBoost: A scalable tree boosting system. In Proceedings of the 22nd ACM SIGKDD International Conference on Knowledge Discovery and Data Mining, 2016; pp. 785–794. [Google Scholar] [CrossRef]
- Lundberg, S.M.; Lee, S.-I. A unified approach to interpreting model predictions. In Proceedings of the 31st International Conference on Neural Information Processing Systems, 2017; pp. 4768–4777. [Google Scholar]
- Magaletti, N.; Notarnicola, V.; Di Molfetta, M.; Mariani, S.; Leogrande, A. Logistics performance and the three pillars of ESG. Sustainability 2025, 17, 11370. [Google Scholar] [CrossRef]
- The GDELT Project. GDELT 2.0 event database. 2025. Available online: https://www.gdeltproject.org.
- Leetaru, K.; Schrodt, P. GDELT: Global data on events, language, and tone, 1979–2012. International Studies Association Annual Conference, San Diego, CA, 2013. [Google Scholar]
- S; P Global. Panjiva: Global trade and supply-chain intelligence. 2023. Available online: https://www.spglobal.com/marketintelligence/en/solutions/panjiva.
- Lavin, J.F.; Montecinos-Pearce, A.A. ESG reporting: Empirical analysis of the influence of board heterogeneity from an emerging market. Sustainability 2021, 13, 3090. [Google Scholar] [CrossRef]
- Kipf, T.N.; Welling, M. Semi-supervised classification with graph convolutional networks. In Proceedings of the 5th International Conference on Learning Representations (ICLR), 2017; pp. 1–14. Available online: https://arxiv.org/abs/1609.02907.
- Brockmann, N.; Kosasih, E.E.; Brintrup, A.M. Supply chain link prediction on uncertain knowledge graphs. ACM SIGKDD Explorations Newsletter 2022, 24, 124–130. [Google Scholar] [CrossRef]
- McLachlan, G.J.; Peel, D. Finite mixture models; Wiley, 2000. [Google Scholar] [CrossRef]
- Liu, F.T.; Ting, K.M.; Zhou, Z.-H. Isolation-based anomaly detection. ACM Transactions on Knowledge Discovery from Data 2012, 6, Article 3. [Google Scholar] [CrossRef]
- Hinton, G.E.; Salakhutdinov, R.R. Reducing the dimensionality of data with neural networks. Science 2006, 313, 504–507. [Google Scholar] [CrossRef] [PubMed]
- Blei, D.M.; Ng, A.Y.; Jordan, M.I. Latent Dirichlet allocation. Journal of Machine Learning Research 2003, 3, 993–1022. [Google Scholar]
- Devlin, J.; Chang, M.-W.; Lee, K.; Toutanova, K. BERT: Pre-training of deep bidirectional transformers for language understanding. In Proceedings of the 2019 NAACL-HLT Conference, 2019; pp. 4171–4186. [Google Scholar] [CrossRef]
- Hong, D.; Fu, Z.; Zhang, X.; Pan, Y. Research on the development and application of the GDELT event database. Data 2025, 10, 158. [Google Scholar] [CrossRef]
- Tian, M.; Li, S.; Cao, X.; Wang, G. Network analysis of volatility spillovers between environmental, social, and governance (ESG) rating stocks: Evidence from China. Mathematics 2025, 13, 1586. [Google Scholar] [CrossRef]
- Okamoto, K.; Chen, W.; Li, X.-Y. Ranking of closeness centrality for large-scale social networks. In Frontiers in Algorithmics (FAW 2008); Springer, 2008; pp. 186–195. [Google Scholar] [CrossRef]
- Derrien, F.; Krueger, P.; Landier, A.; Yao, T. ESG news, future cash flows, and firm value. Working paper 2022. [Google Scholar] [CrossRef]
- Hassan Nassar, O.M.; Jafari, F.; Jain, C. From news to knowledge: Leveraging AI and knowledge graphs for real-time ESG insights. Sustainability 2025, 17, 11128. [Google Scholar] [CrossRef]
- Kim, M.; Kang, J.; Jeon, I.; Lee, J.; Park, J.; Youm, S.; Jeong, J.; Woo, J.; Moon, J. Differential impacts of environmental, social, and governance news sentiment on corporate financial performance in the global market. Electronics 2024, 13, 4507. [Google Scholar] [CrossRef]
Figure 1.
Annual GDELT Data Volume.
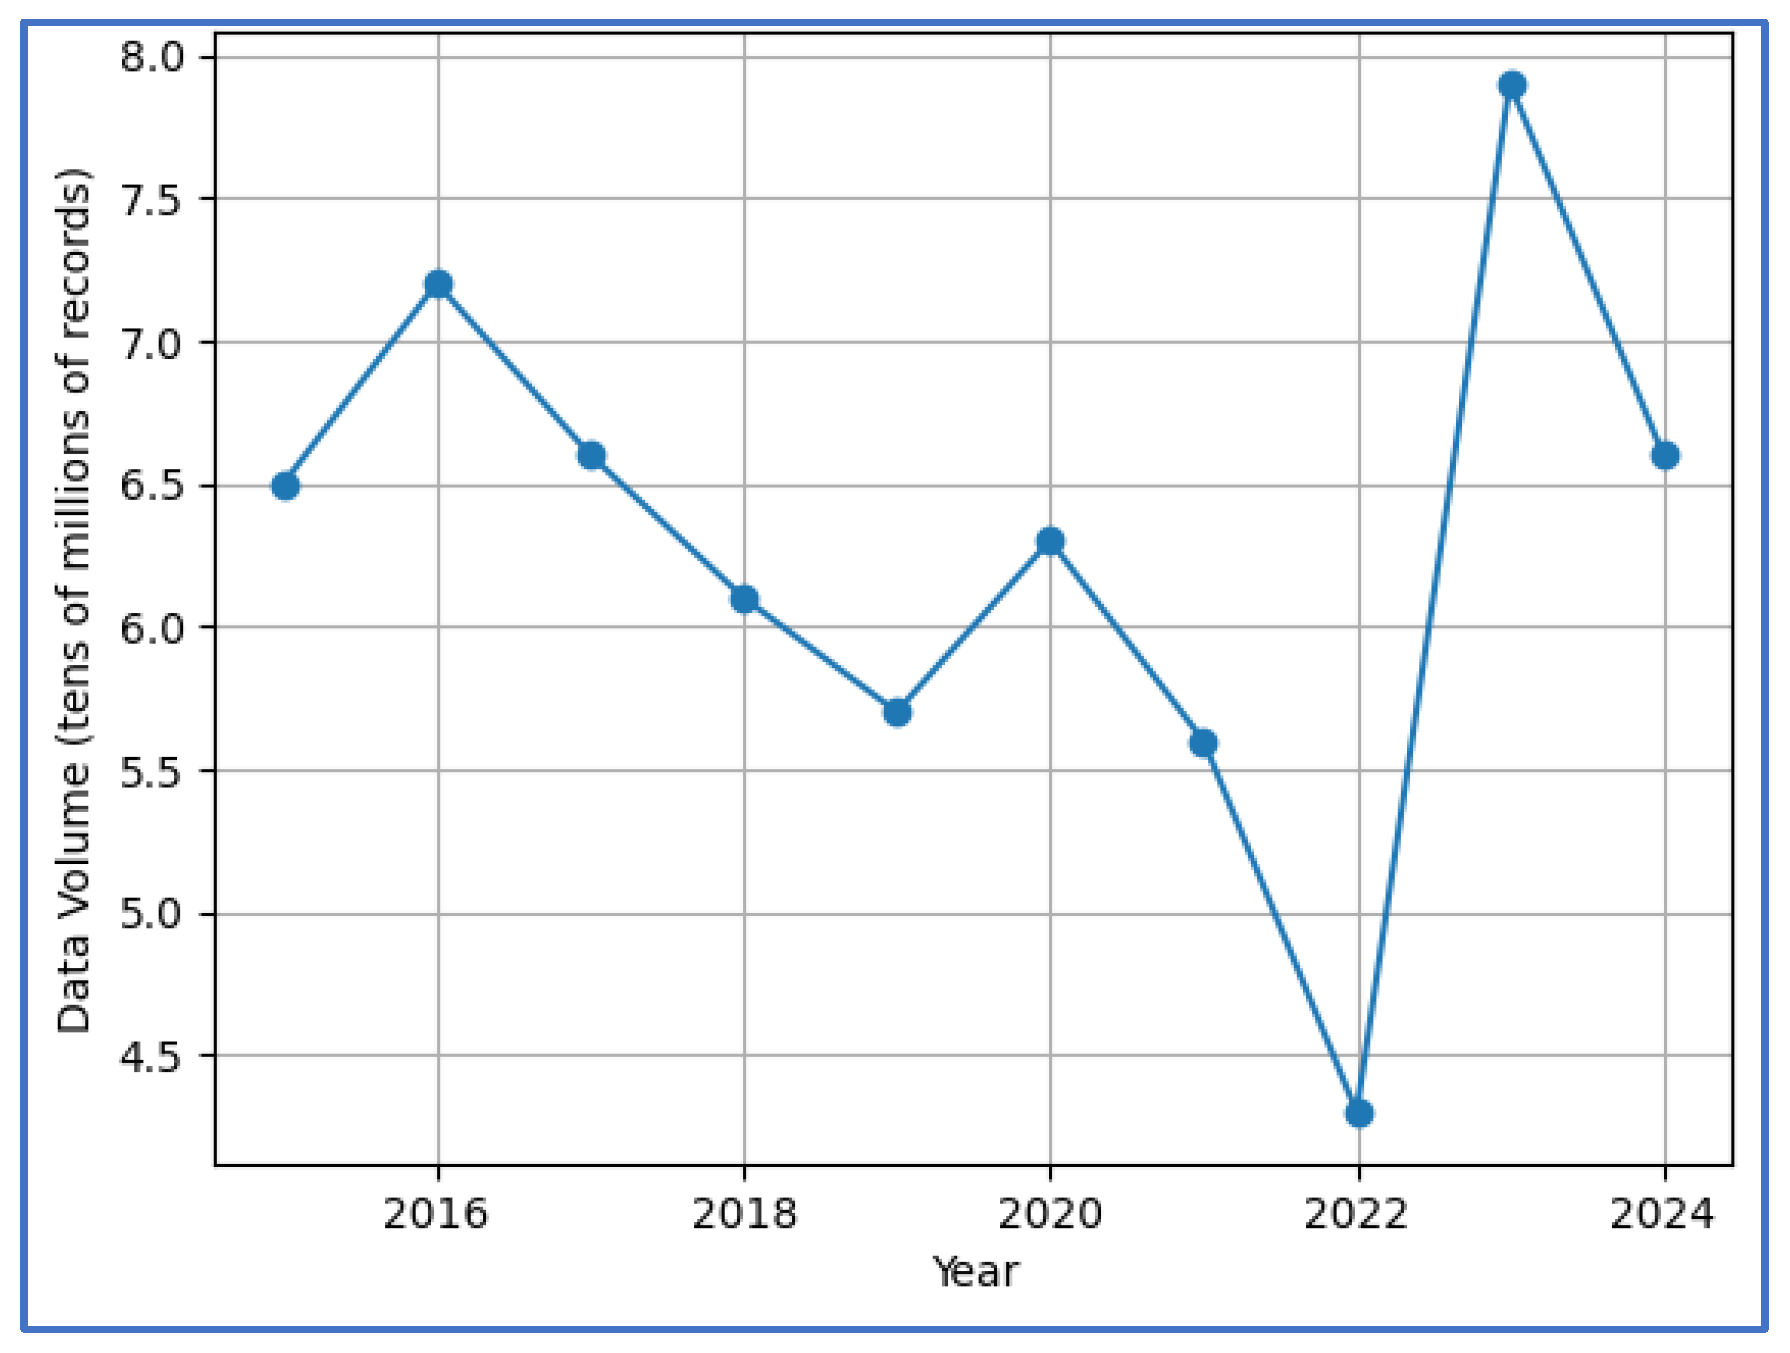
Figure 2.
Annual Panjiva Shipment Records.
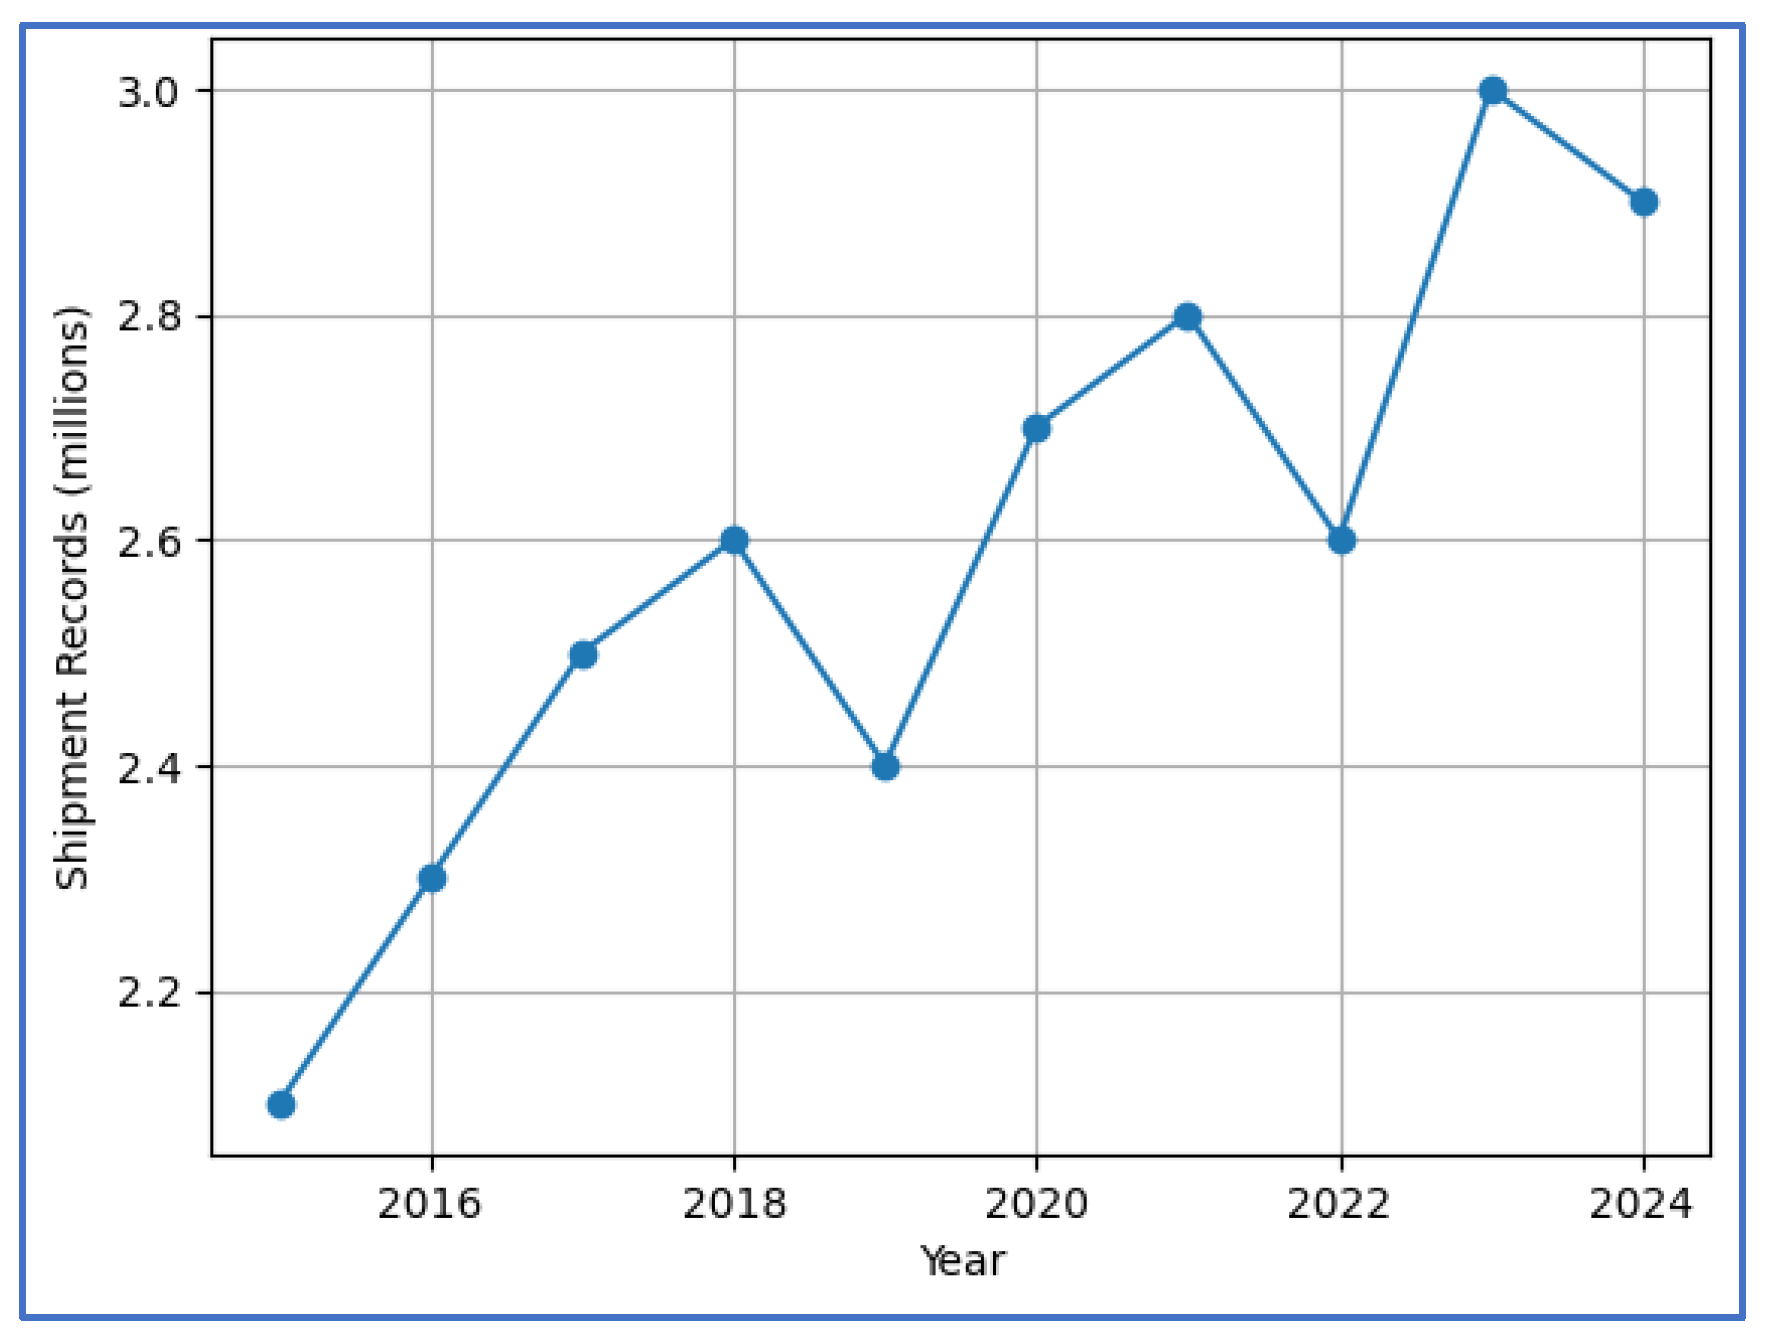
Figure 3.
Sample Filtering Flow Diagram.
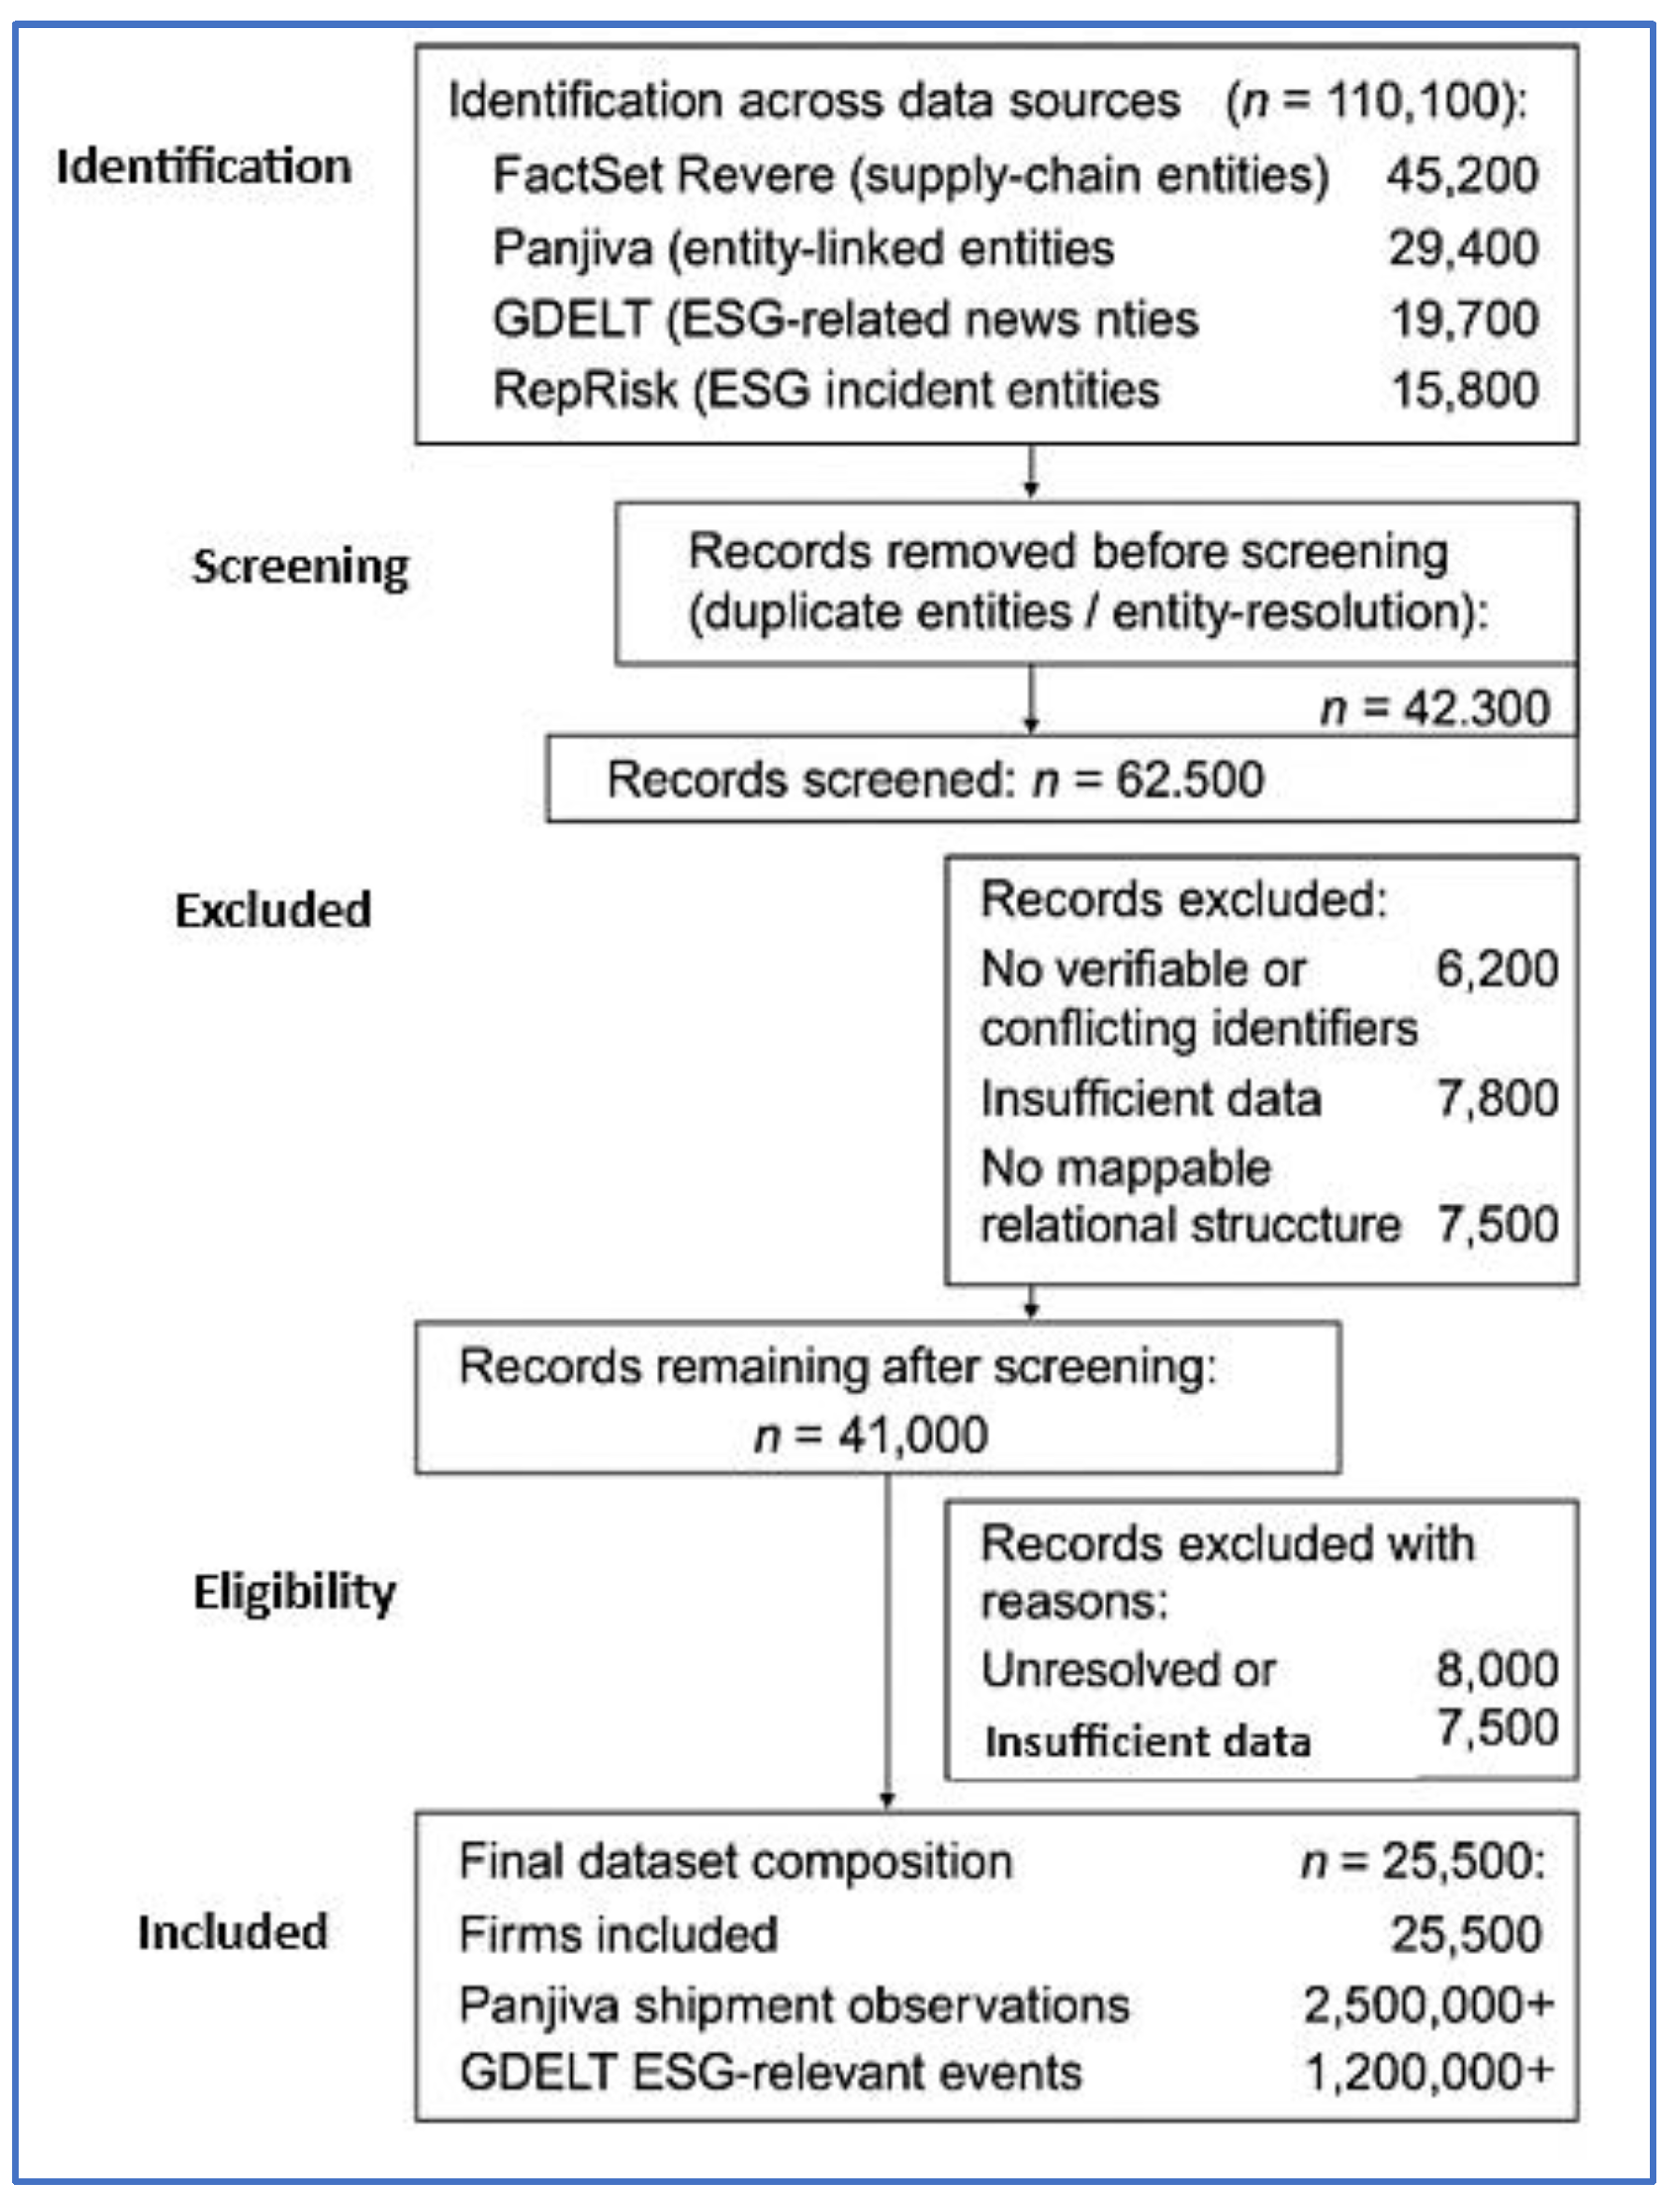
Figure 4.
Network Structure and ESG risk propagation in supply chains.
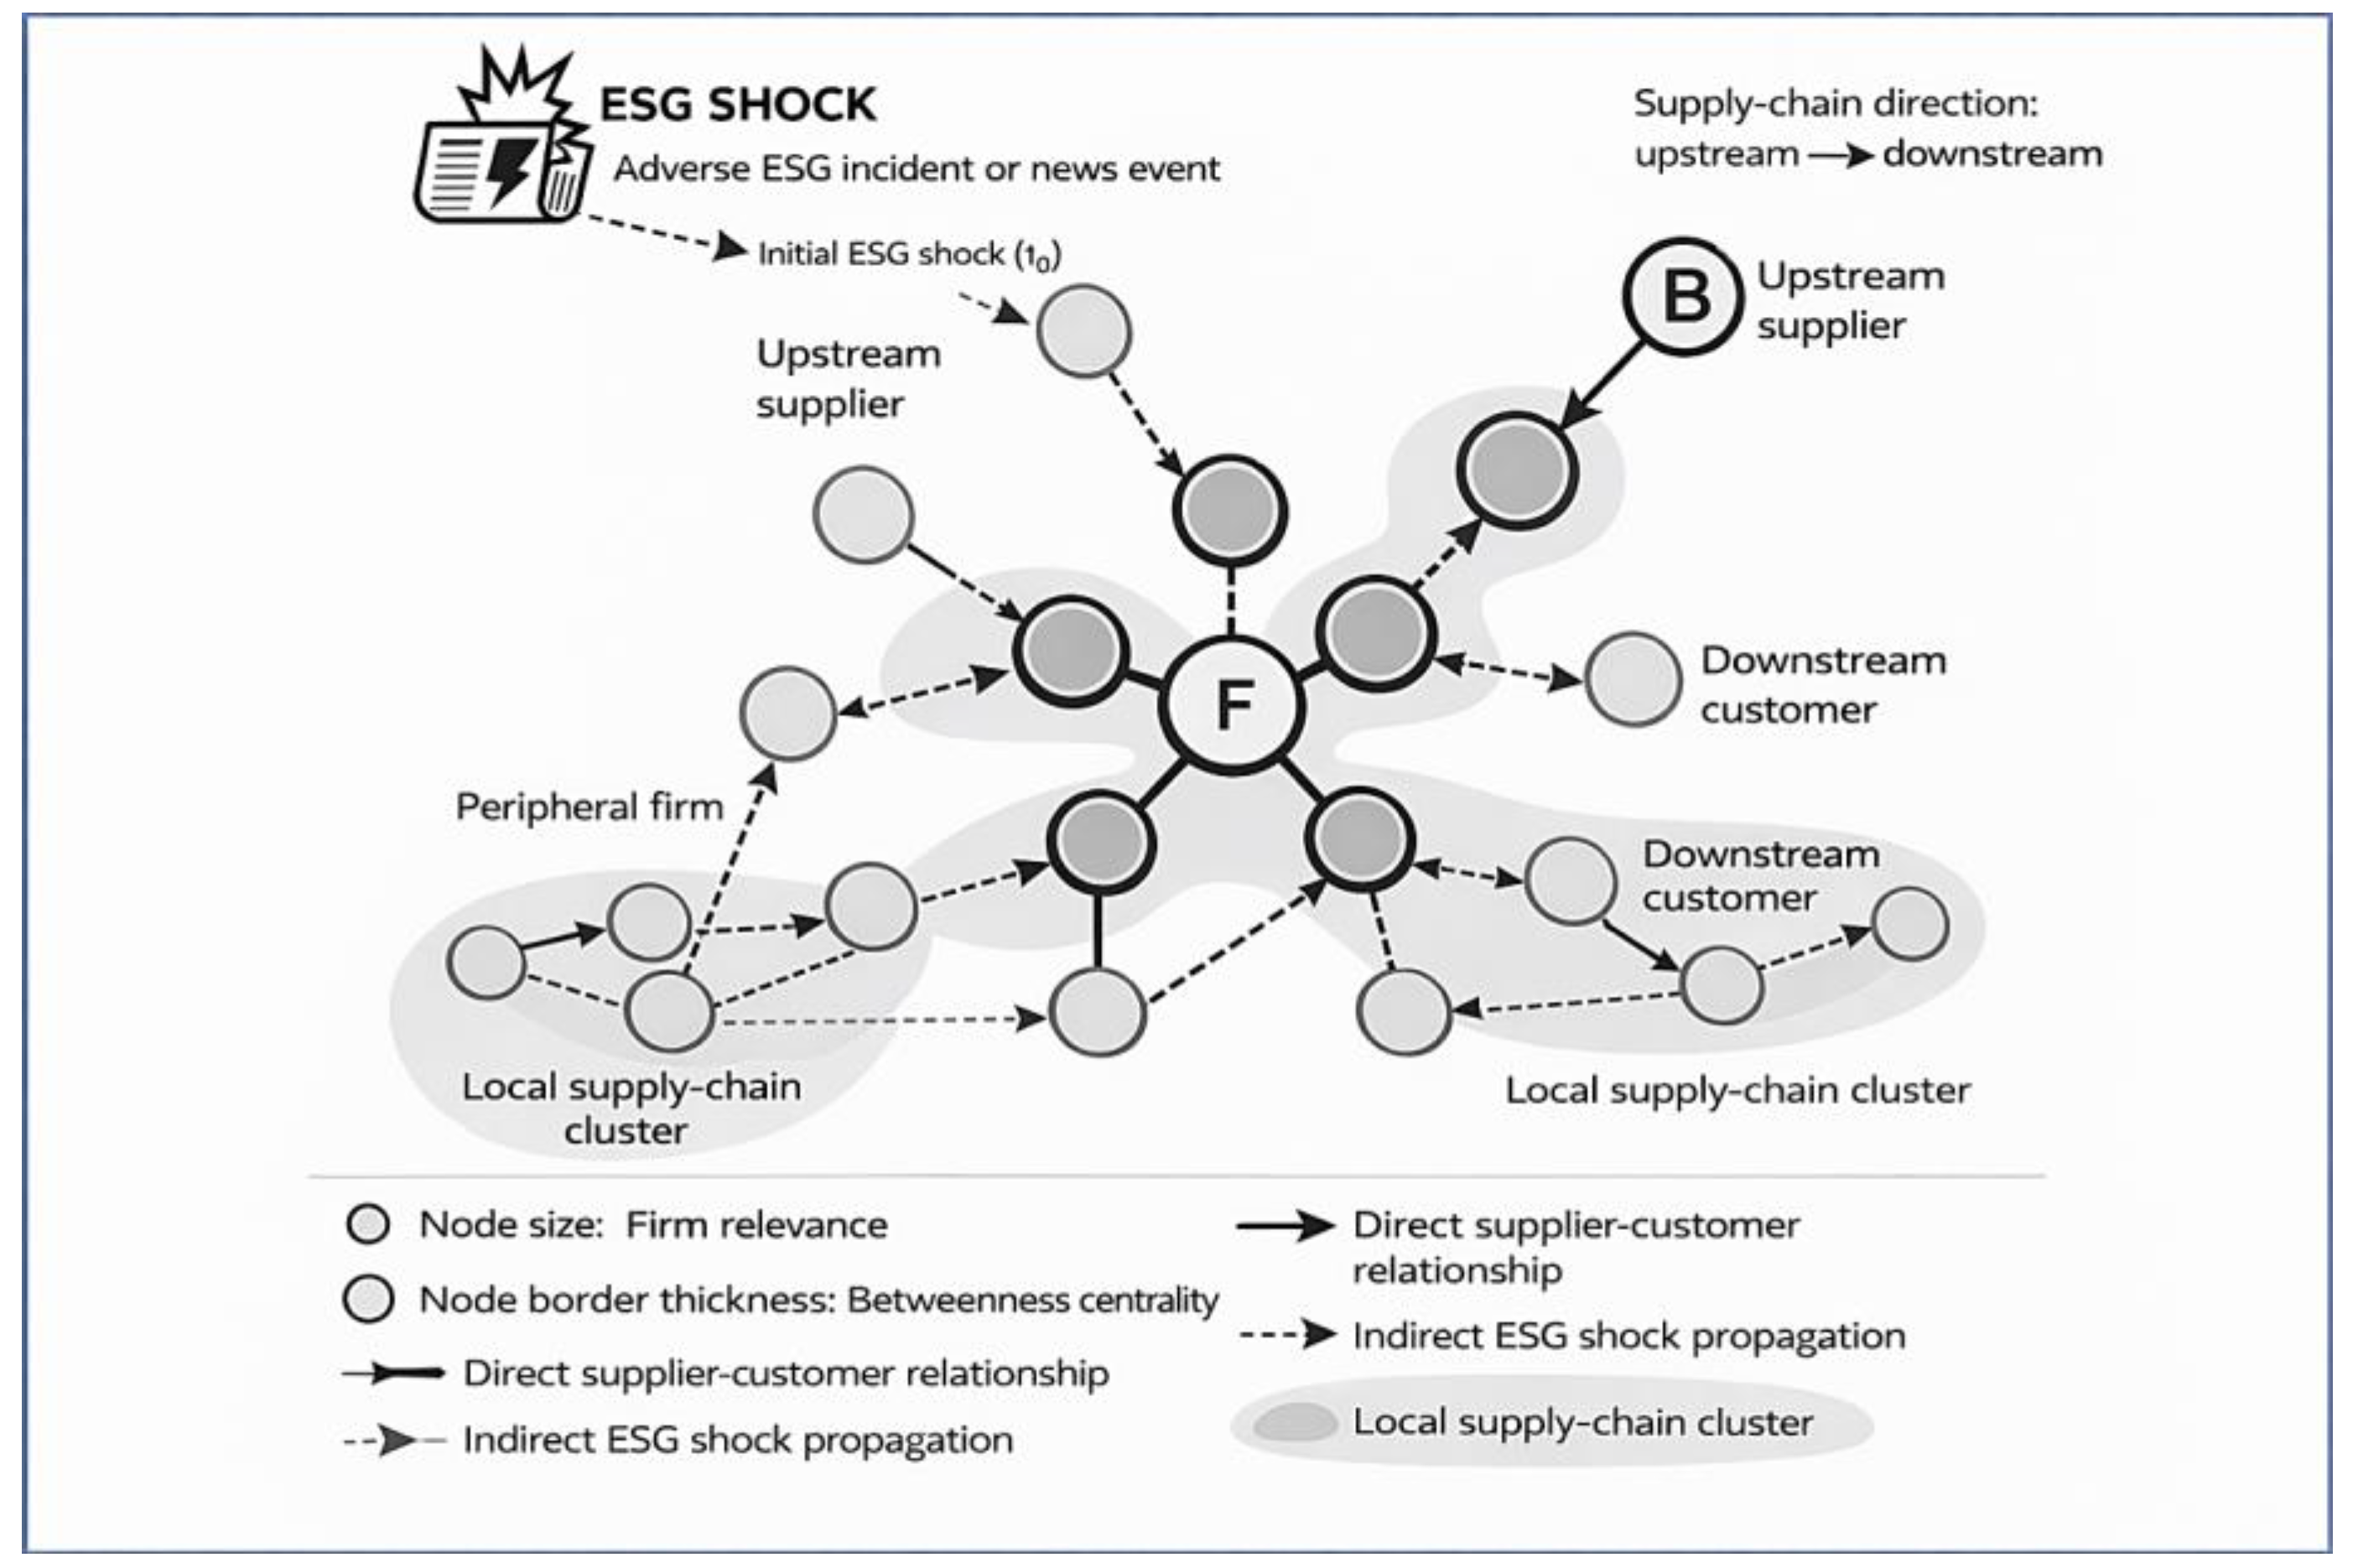
Figure 5.
Network Exposure, Centrality, and Predicted ESG Risk.
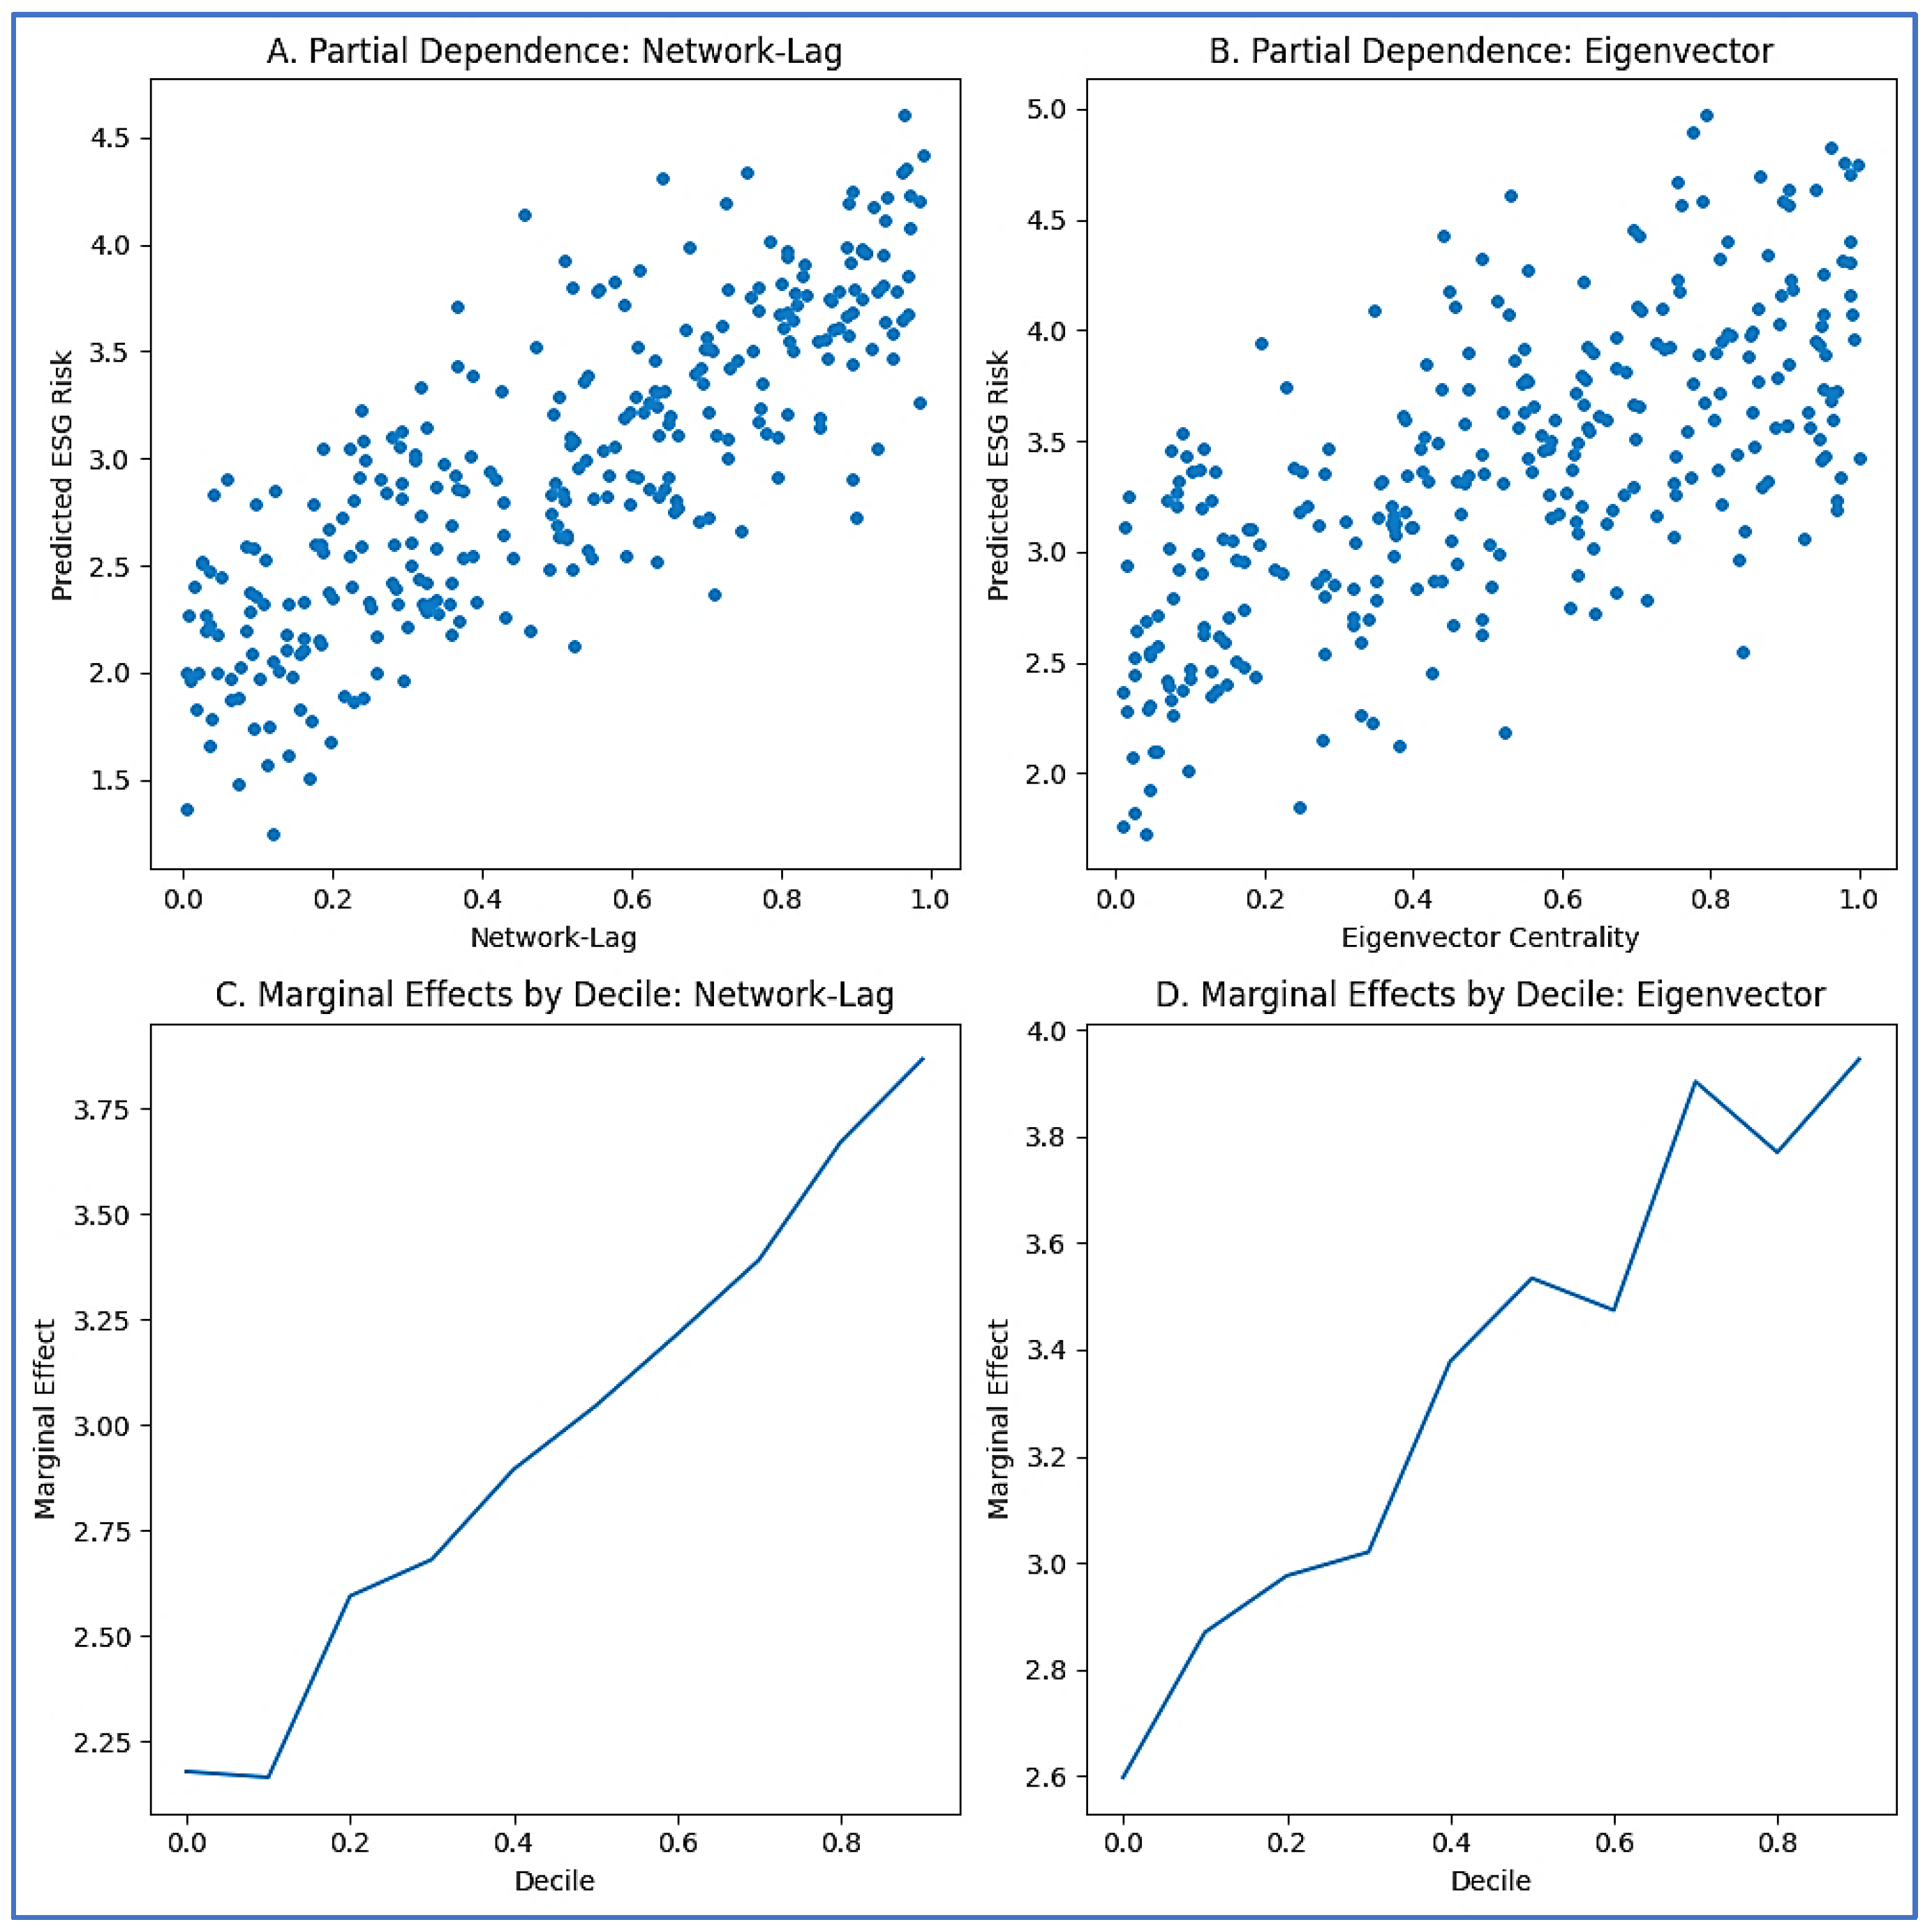
Figure 6.
Robustness of ESG Sentiment Effects Across NLP Architectures.
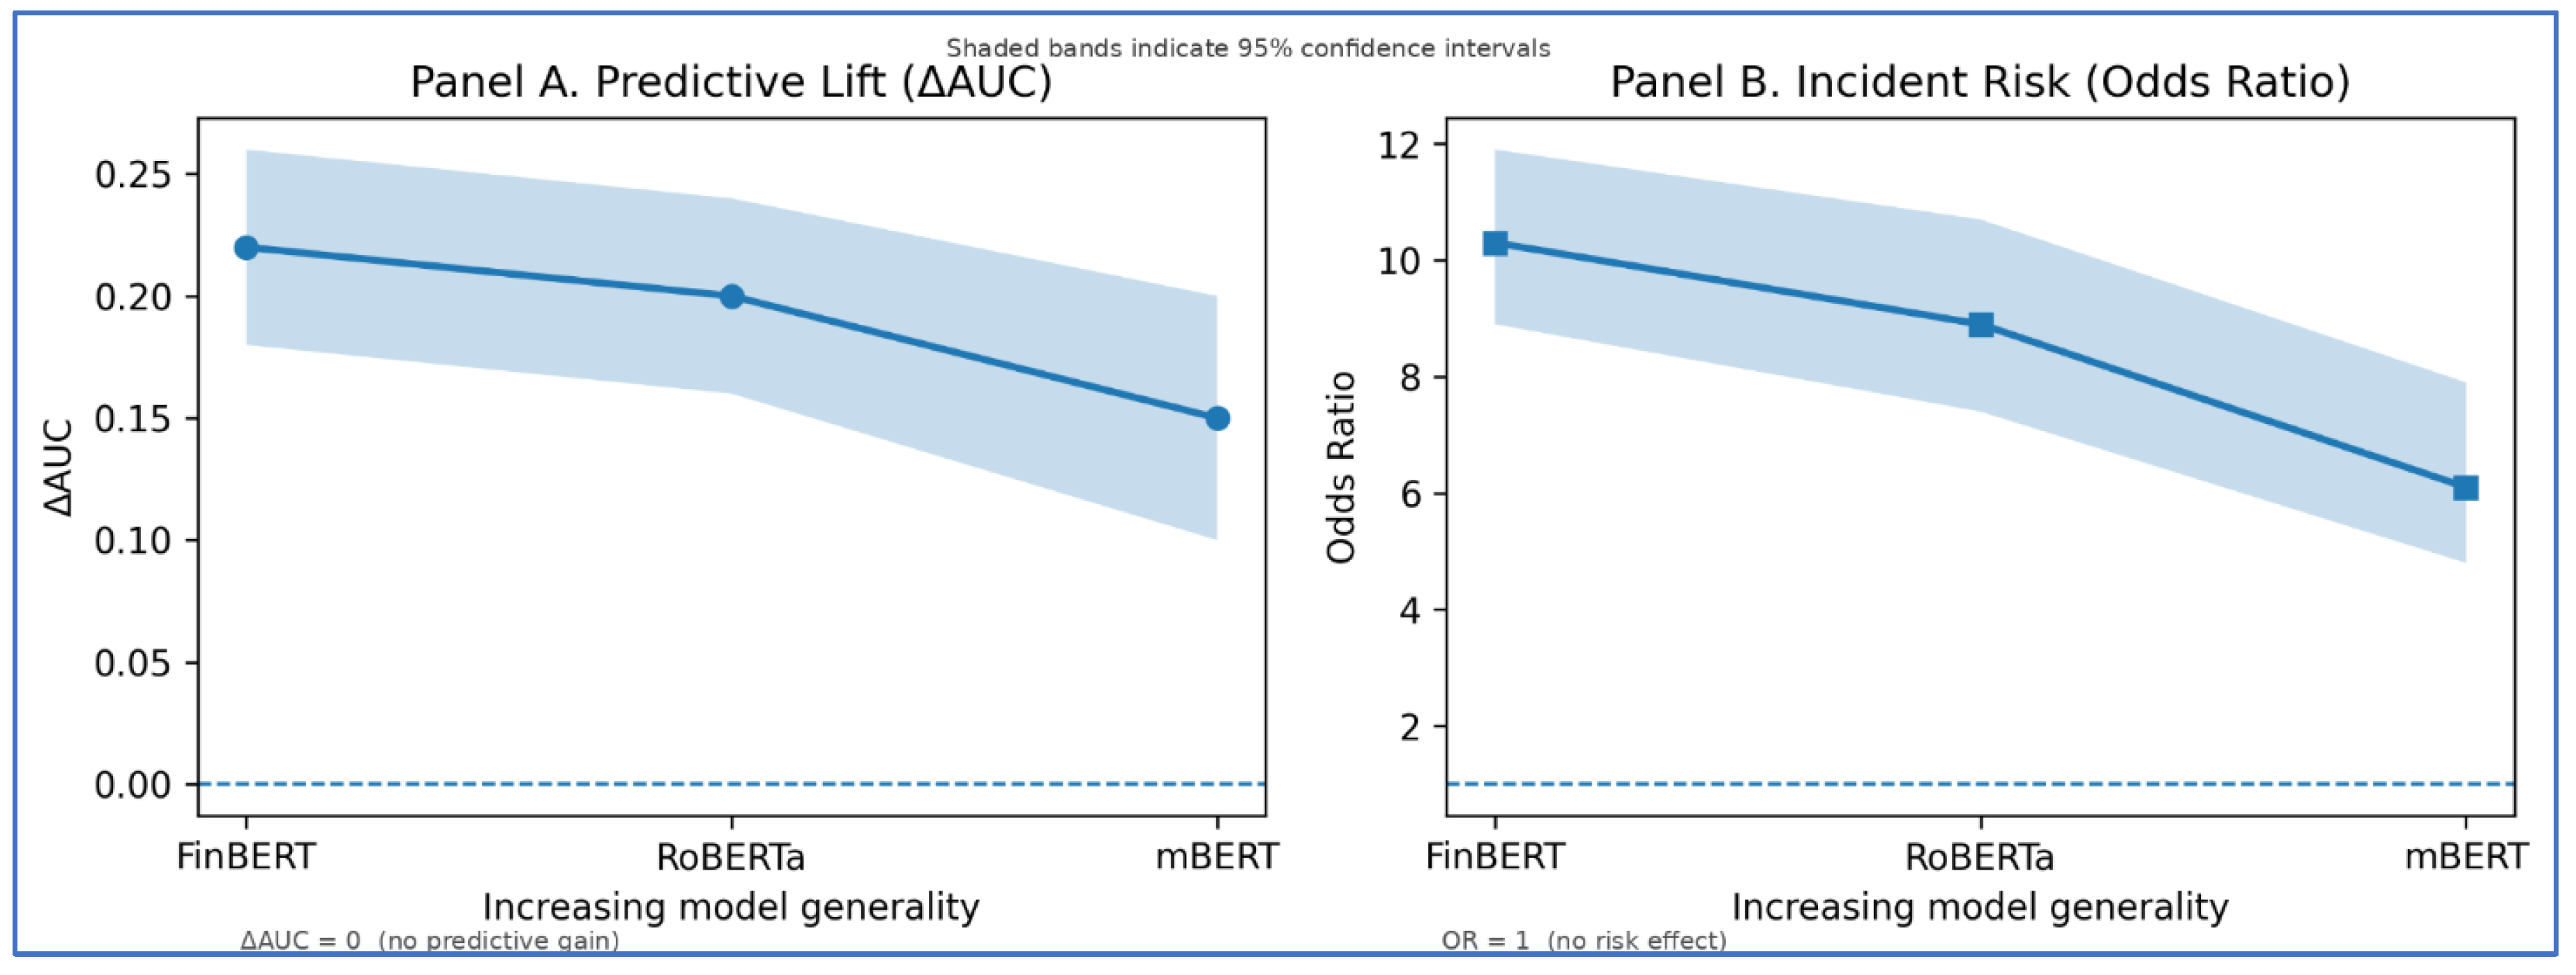
Figure 8.
Comparative Predictive Performance of the Model for ESG Risk.
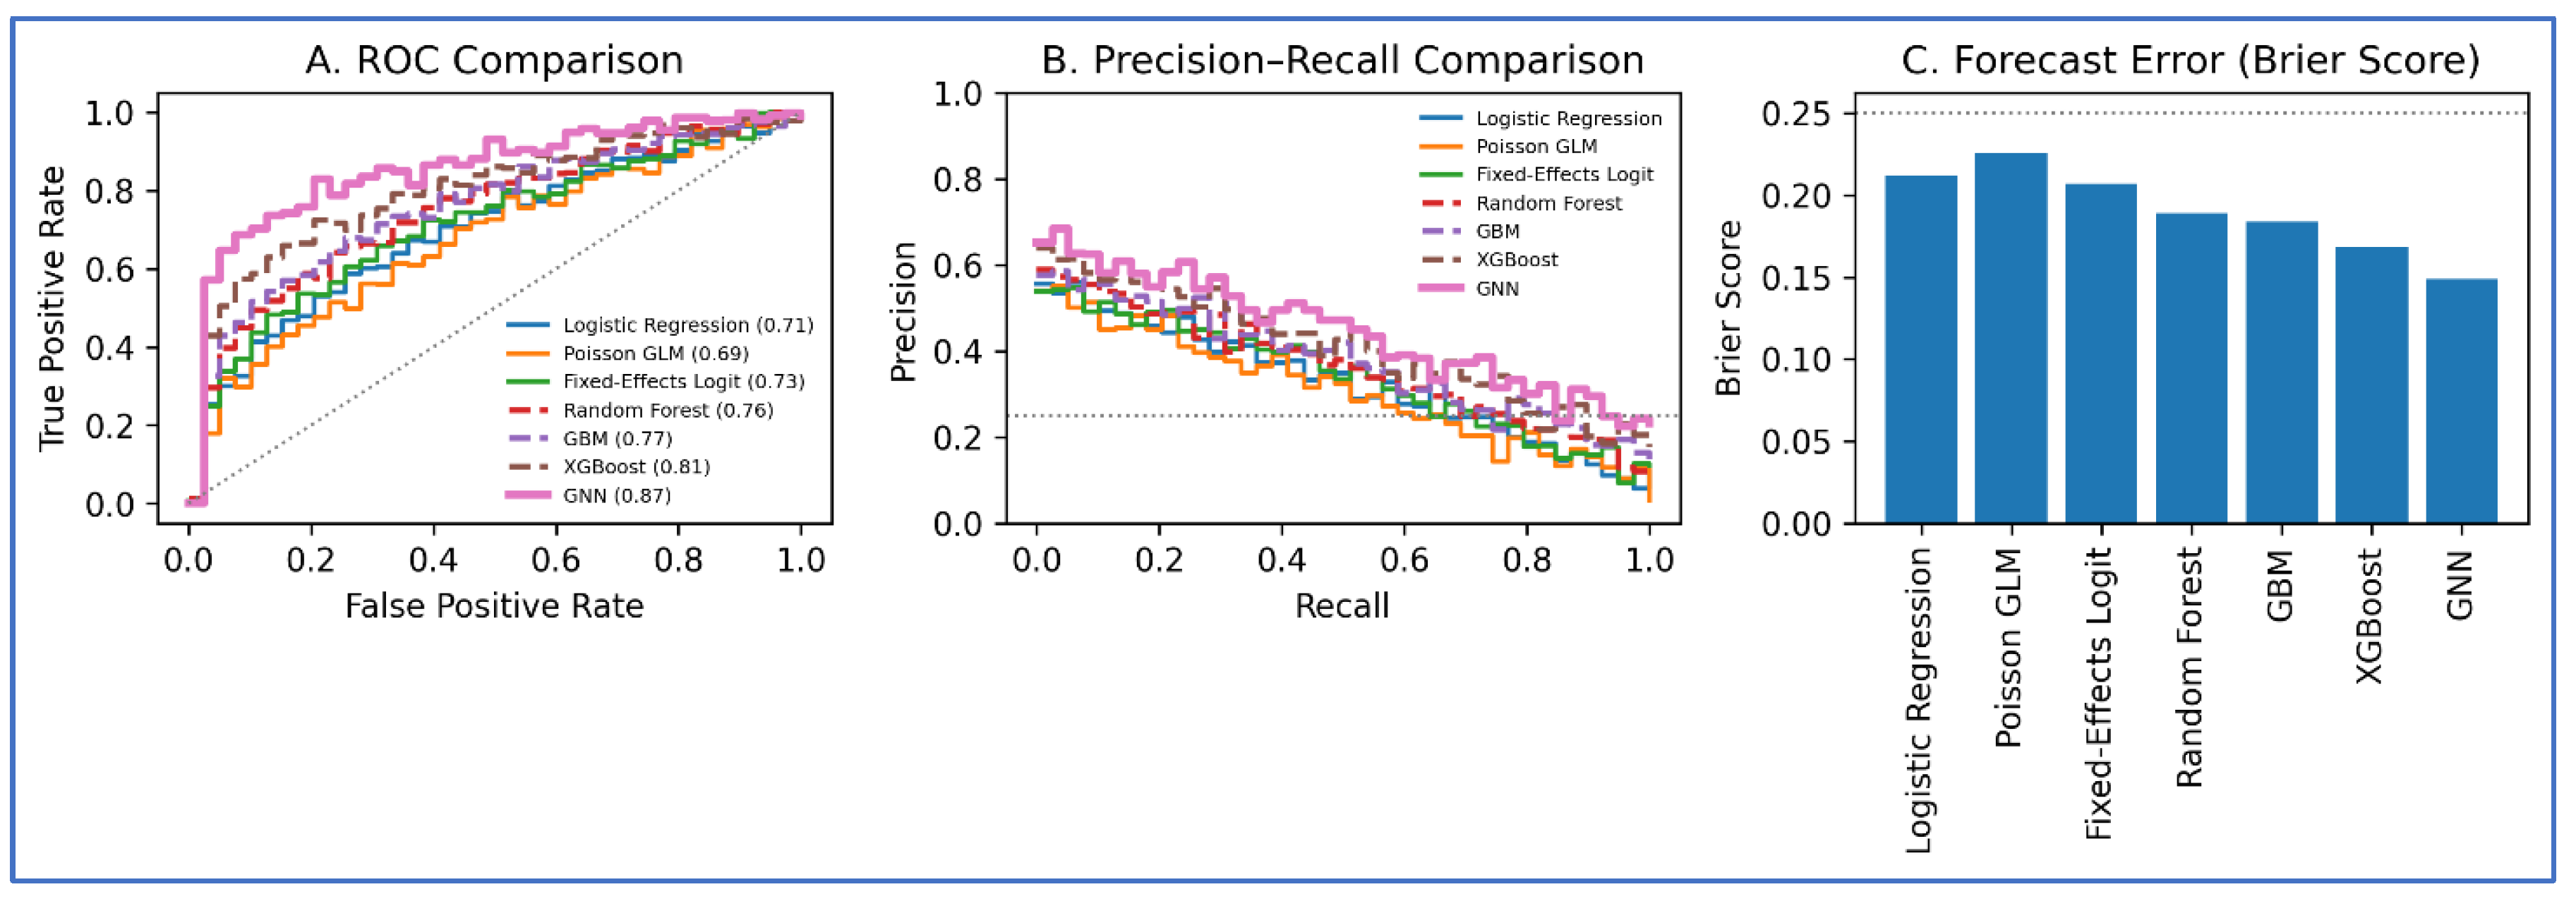
Figure 9.
SHAP (Beeswarm).
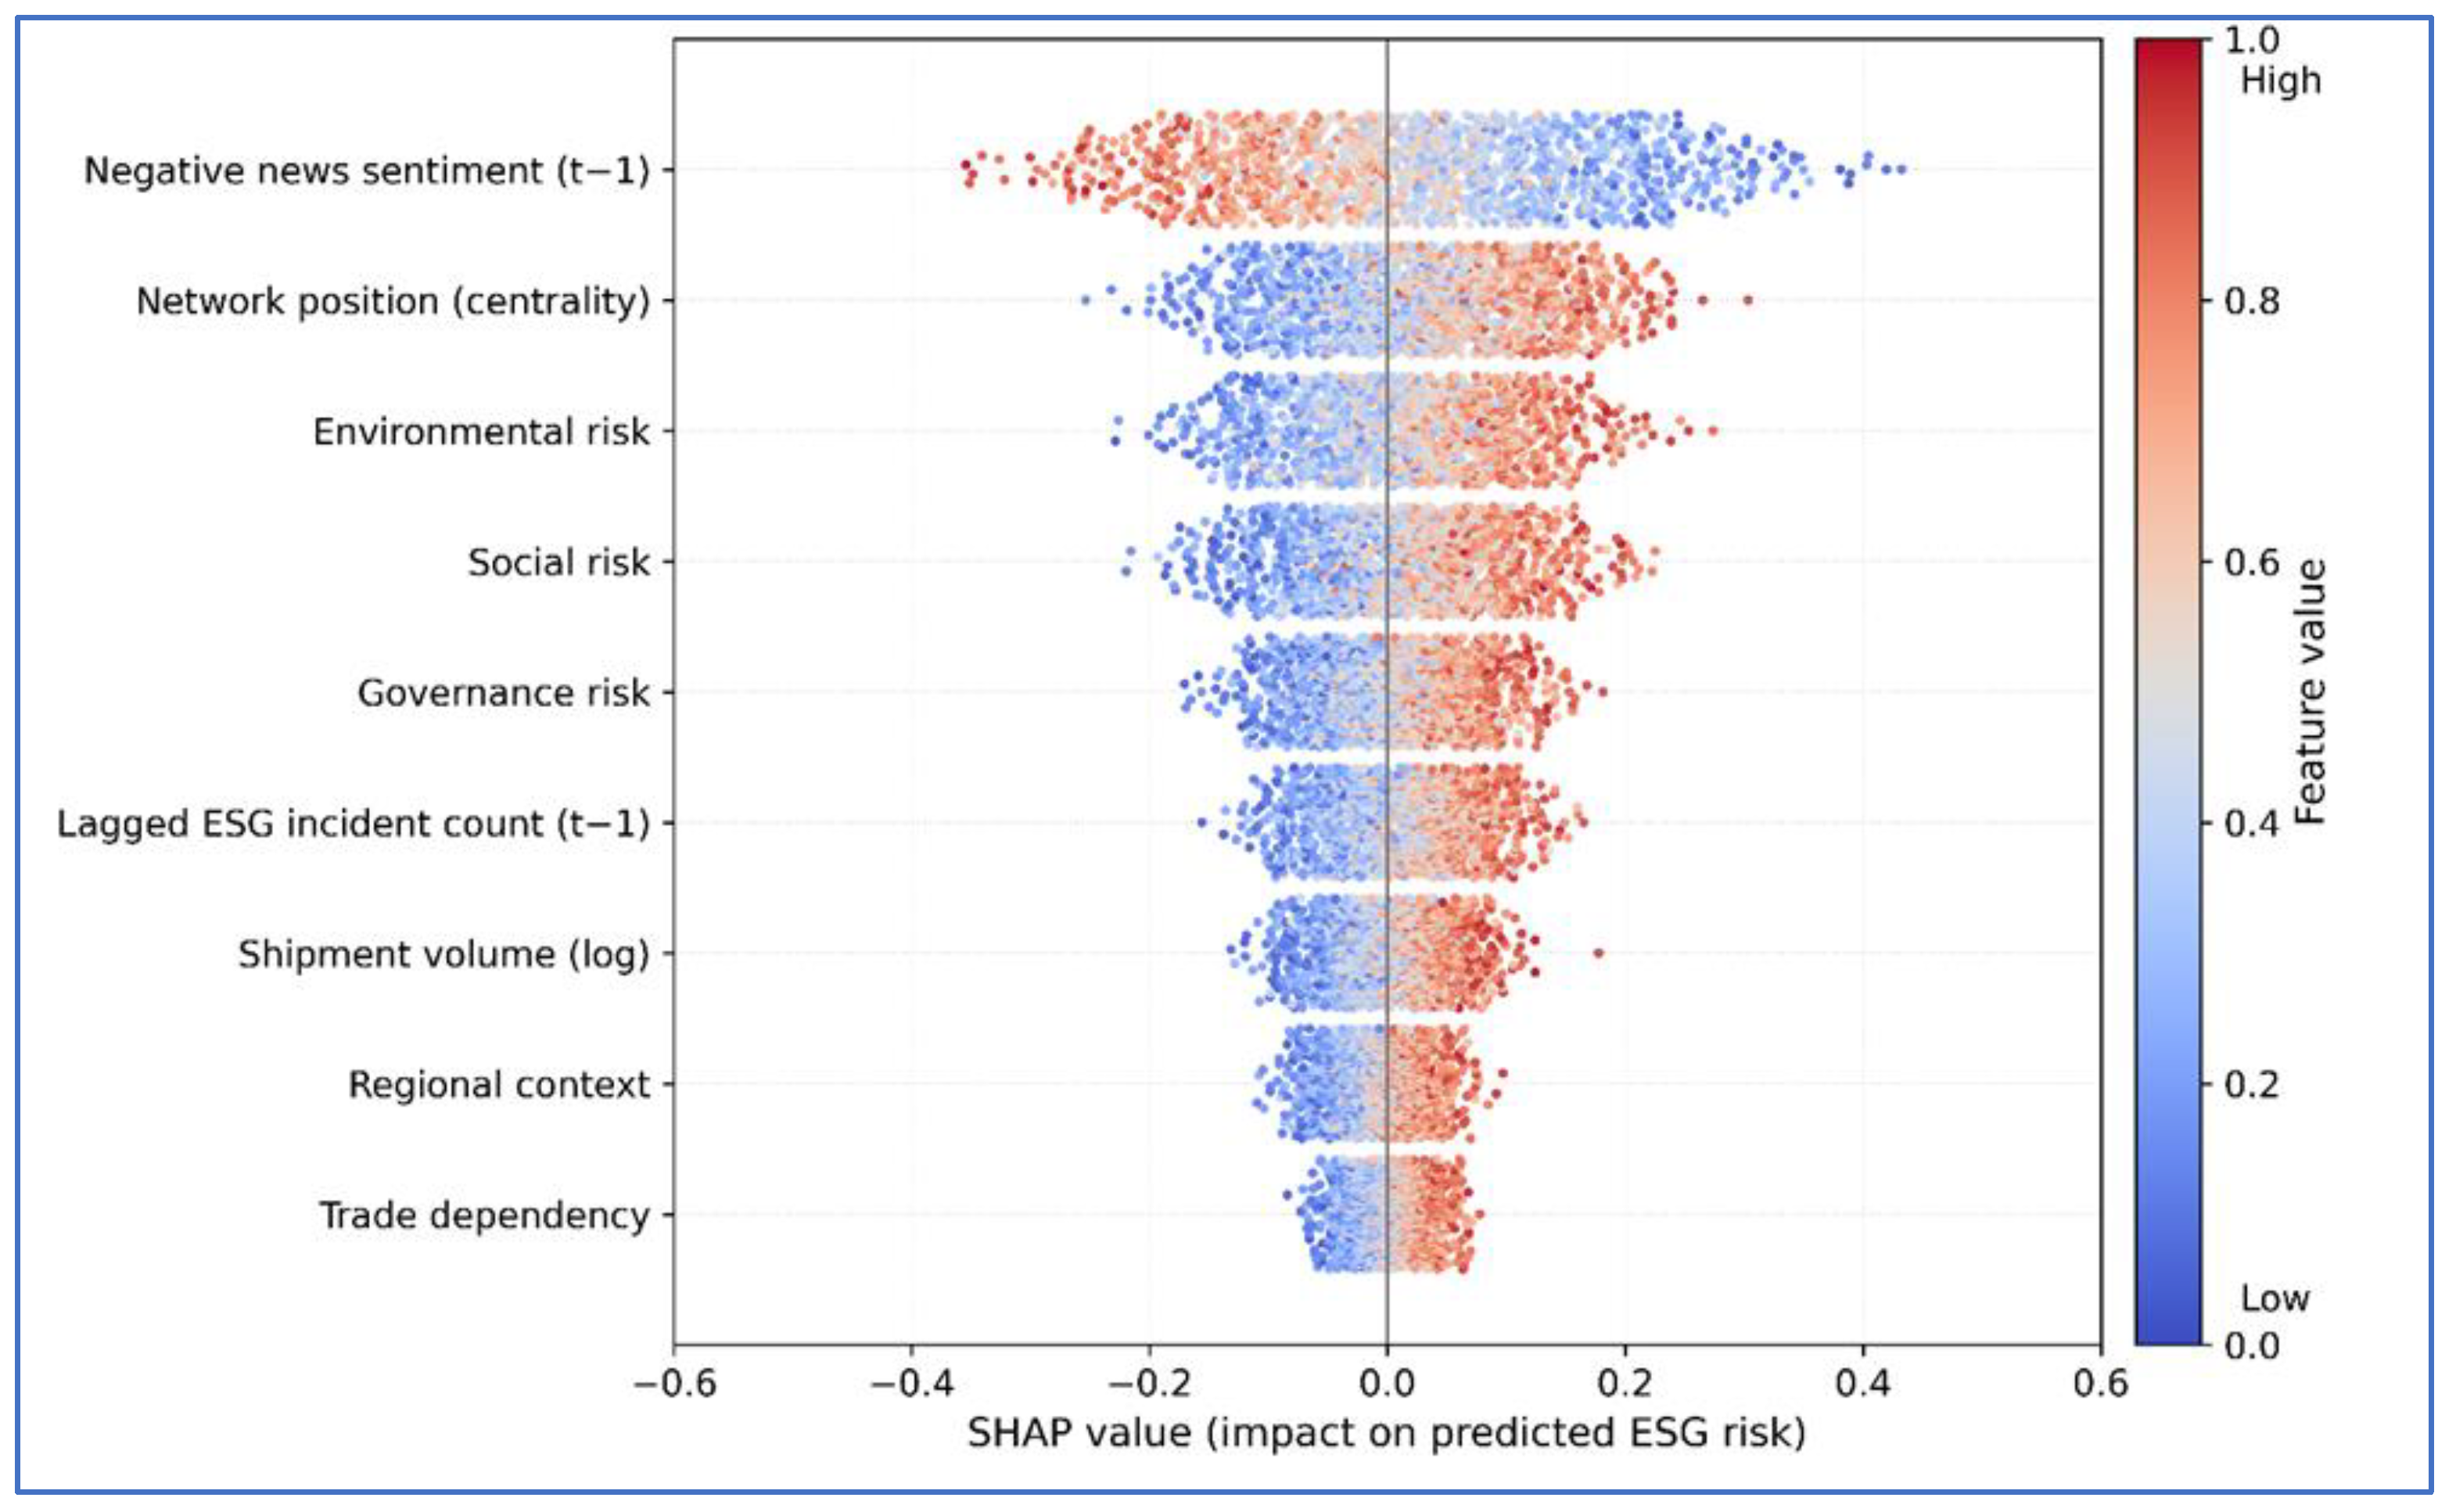
Figure 10.
Normalised Confusion Matrice.
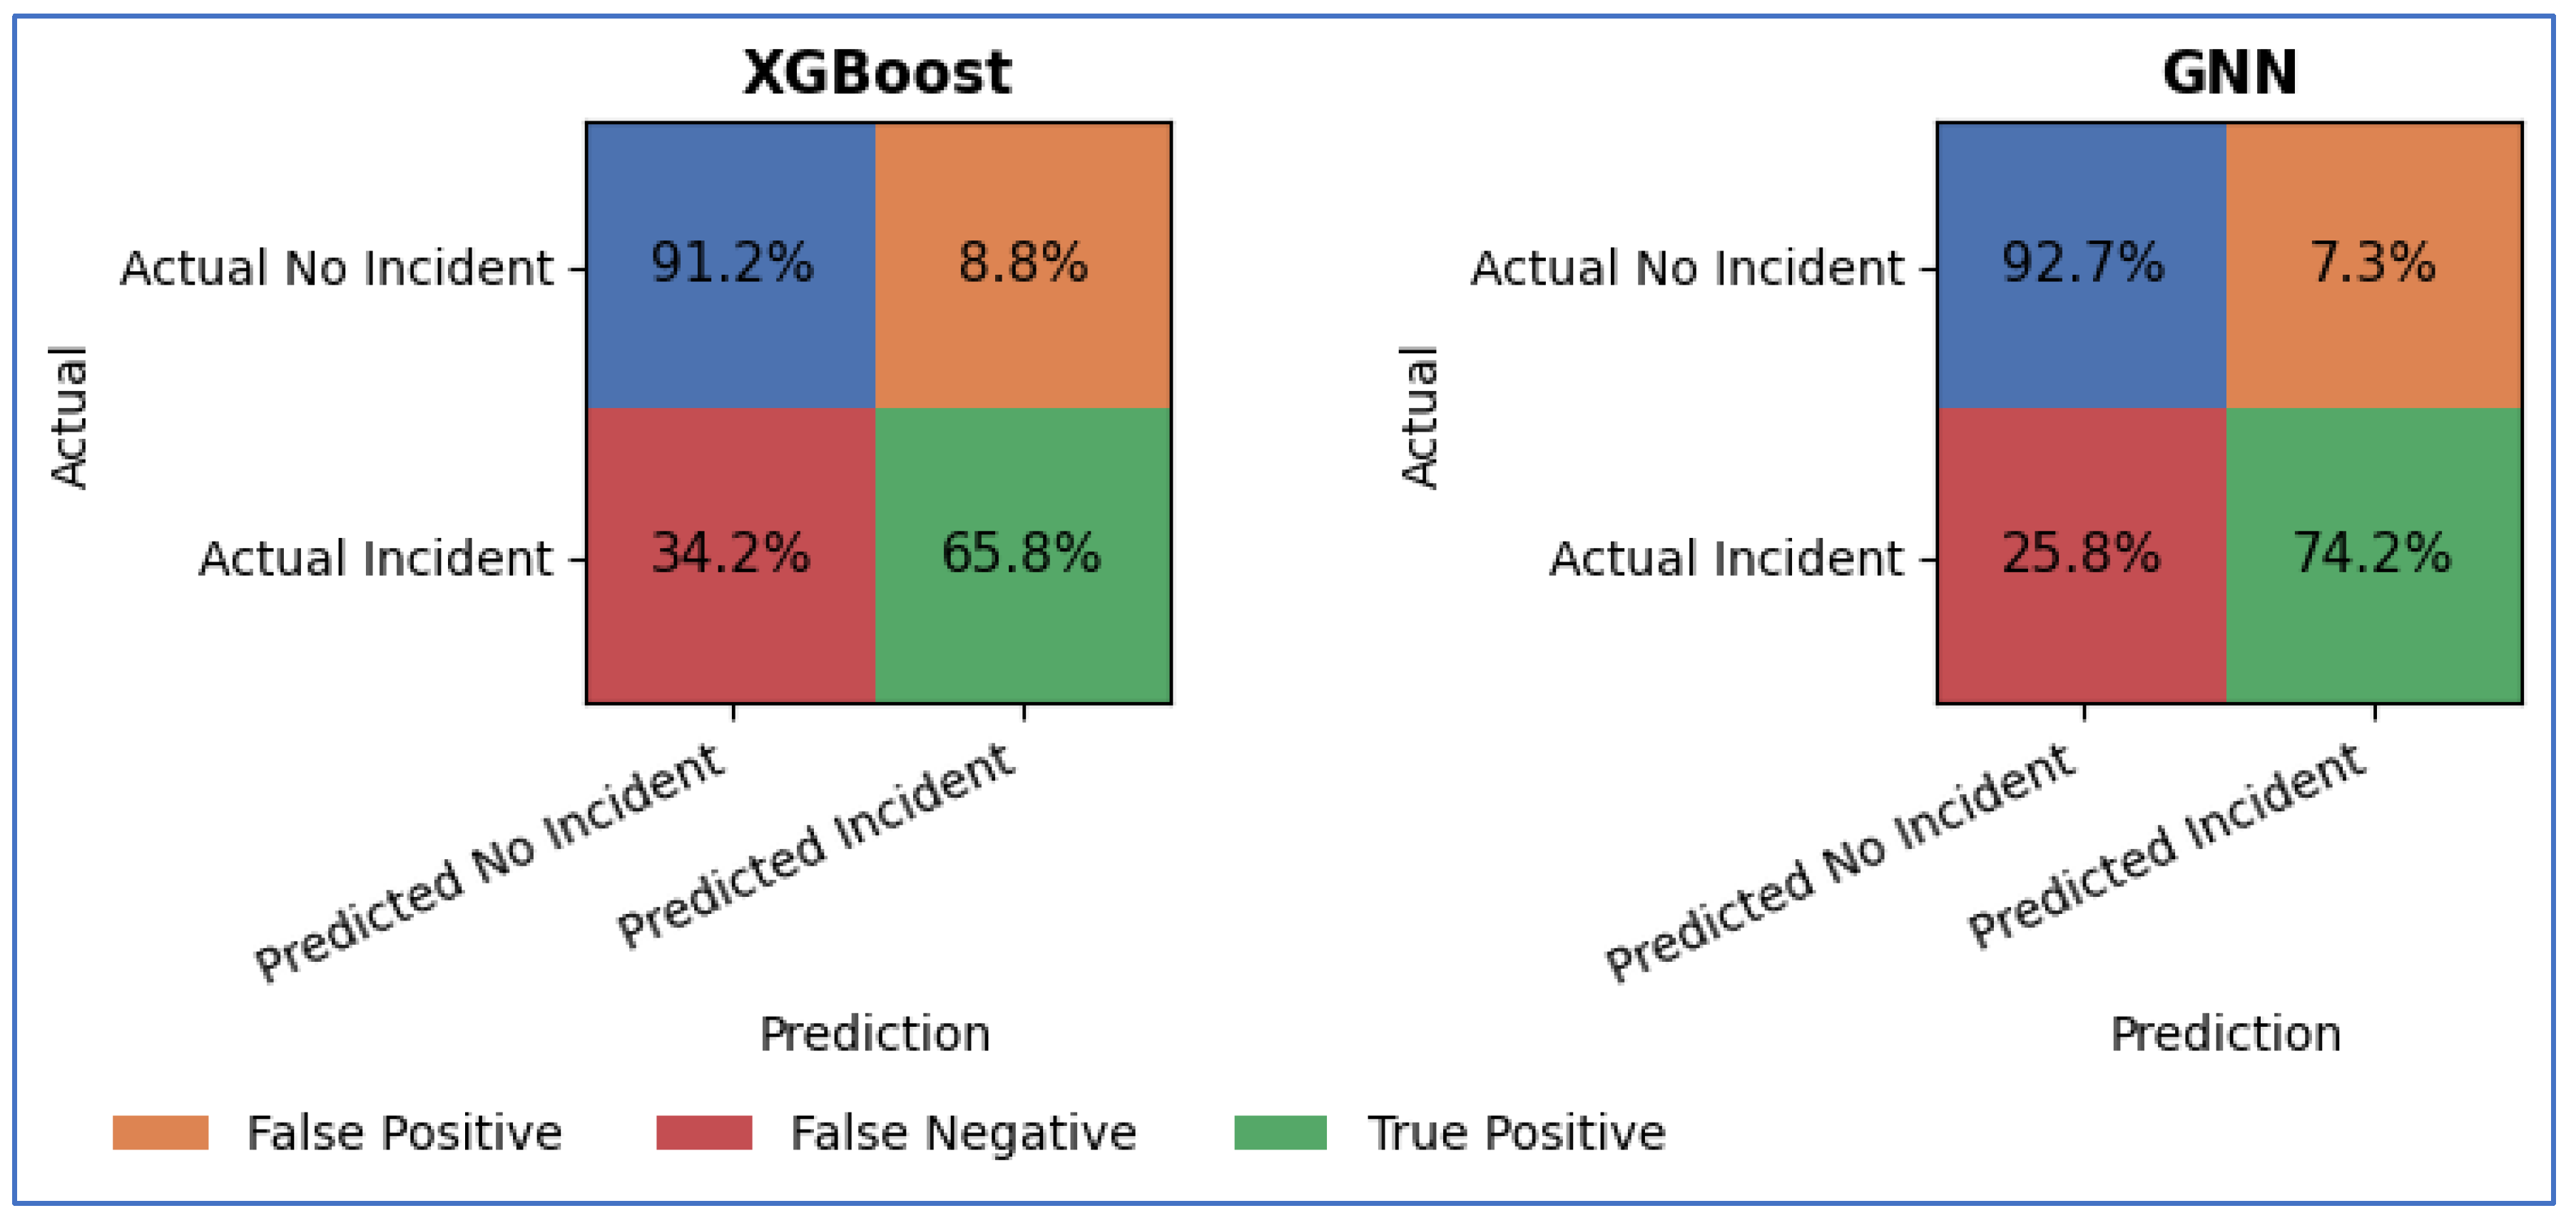
Table 1.
Empirical analysis of AI-Enhanced Network Modeling of ESG Risk in Global Supply Chains.
| Author(s) | Year | Topic | Dataset(s) Used | Decision-Making Relevance | Major Empirical Contributions |
|---|---|---|---|---|---|
| [5] | 2024 | Gone with the Chain: The Ripple Effect of ESG Performance in China’s Industrial Chain | Chinese industrial supply-chain network (1164 industries from ChinaScope, 2018–2020) combined with firm-level ESG ratings (Sino-Securities Index) | Informs firms and investors on how ESG performance shocks propagate through industrial networks and affect downstream performance | Develops a graph neural network with cross-attention to model ESG spillovers; shows ESG performance diffuses through supply-chain links and significantly influences profitability and value-chain outcomes |
| [6] | 2025 | Modeling ESG-Driven Industrial Value Chain Dynamics Using Directed Graph Neural Networks | Chinese industrial value-chain network (ChinaScope) combined with China Securities Index ESG ratings | Supports corporate strategy and policy design by identifying asymmetric upstream and downstream ESG vulnerabilities | Proposes a directed GNN distinguishing inbound and outbound flows; demonstrates that ESG shocks propagate asymmetrically and shape industrial value extension and network resilience |
| [7] | 2025 | Relational Infrastructures for Planetary Health in Brazil’s Traceable Beef Export System | Brazilian beef supply-chain network linking ranches and meatpacking facilities, augmented with transport and traceability data | Enables investors and firms to detect hidden deforestation and ESG risks embedded in indirect suppliers | Uses network analysis to uncover indirect sourcing and governance gaps; highlights how relational infrastructure conditions ESG risk and traceability in agricultural supply chains |
| [8] | 2024 | ESG Discourse in News: An AI-Powered Knowledge Graph Analysis | Dow Jones News Article dataset processed using NLP and knowledge-graph construction | Supports real-time reputational and ESG risk monitoring for firms and regulators | Constructs ESG knowledge graphs from news using transformer models; demonstrates how ESG narratives evolve and signal emerging risks |
| [9] | 2022 | Supply Chain Link Prediction on Uncertain Knowledge Graphs | Multi-tier supply-chain knowledge graph extracted from web data using NLP (VersedAI) | Enhances ESG compliance and supply-chain risk management by improving visibility across hidden tiers | Combines NLP-extracted graphs with GNN-based link prediction under uncertainty; advances multi-tier supply-chain mapping for proactive risk mitigation |
| [10] | 2024 | SHIELD: LLM-Driven Schema Induction for EV Battery Supply-Chain Disruptions | Open-source textual data on EV battery supply chains, mined using zero-shot large language models | Supports strategic sourcing and ESG risk oversight in critical-mineral and EV supply chains | Proposes an LLM-based framework for schema induction and knowledge-graph construction; enables early detection of disruption and ESG risk in multi-tier supply chains |
Table 2.
Data Sources for the study.
| Data Source | Data Type | Period Covered |
|---|---|---|
| FactSet Revere | Supplier–customer relationships; industry classifications | 2003–2024 |
| Panjiva (S&P Global) | Shipment-level import/export transactions | 2007–2024 |
| GDELT Global Knowledge Graph | ESG-related news events; sentiment metadata | 2015–2024 |
| RepRisk ESG Incident Database | Environmental, social and governance controversy records | 2007–2024 |
| Worldwide Governance Indicators (WGI) | Country-level institutional governance measures | 2003–2024 |
Table 3.
Regional and Industry Distribution of Firms.
| Industry / Region | Asia-Pacific | Europe | North America | Latin America | Africa | Middle East | Total |
|---|---|---|---|---|---|---|---|
| Manufacturing | 3,030 | 1,700 | 1,450 | 500 | 250 | 750 | 7,680 |
| Tech & Electronics | 1,770 | 950 | 820 | 190 | 130 | 380 | 4,240 |
| Transport & Logistics | 630 | 560 | 500 | 190 | 130 | 250 | 2,260 |
| Agriculture & Commodities | 540 | 320 | 290 | 350 | 290 | 260 | 2,050 |
| Energy & Extractives | 440 | 220 | 190 | 220 | 220 | 220 | 1,510 |
| Retail & Consumer Goods | 630 | 500 | 560 | 220 | 160 | 130 | 2,200 |
| Pharma & Chemicals | 440 | 380 | 380 | 130 | 60 | 130 | 1,520 |
| Financial & Business Services | 250 | 440 | 280 | 100 | 30 | 160 | 1,260 |
| Construction & Engineering | 220 | 220 | 160 | 60 | 30 | 190 | 880 |
| Automotive & Mobility | 440 | 630 | 530 | 130 | 30 | 130 | 1,890 |
| Total | 8,390 | 5,220 | 5,160 | 2,190 | 1,330 | 2,600 | 25,500 |
Table 4.
Details of Network-Based Analytical Dataset.
| Component | Description | Source / Method | Unit / Notes |
|---|---|---|---|
| Adjacency Matrix | Directed network built from verified supplier–buyer links. Shipment data used only to strengthen tie weights when available. | FactSet Revere (relationship direction); Panjiva (trade volumes used as optional weights) | Firm/firm edges; weight = 1 for FactSet-only ties, or shipment-based weight when available |
| Degree Centrality | Number of direct incoming and outgoing ties a firm holds | Computed from adjacency matrix | Firm-year |
| Betweenness Centrality | Extent to which a firm sits on shortest paths linking other firms | Graph-theoretic calculation | Firm-year |
| Eigenvector Centrality | Measures influence based on connection to well-positioned firms | Graph-theoretic calculation | Firm-year |
| Clustering Coefficient | Proportion of a firm’s neighbours that are connected to one another | Graph algorithm | Firm-year |
| ESG Event Count | Annual count of ESG-related news events linked to each firm | GDELT event extraction | Aggregated by firm-year |
| Sentiment Index | Average tone of ESG-related coverage | Transformer-based NLP analysis | Yearly mean sentiment score per firm |
| ESG Incident Severity | Weighted score reflecting intensity of documented ESG controversies | RepRisk incident database | Firm-year severity index |
| Shipment Anomaly Score | Annual measure of irregular trade behaviour | Autoencoder + Isolation Forest models | Mapped to firms based on shipment ownership |
| Governance Context (WGI) | Country-level institutional quality matched to each firm’s headquarters | World Governance Indicators | Year matched to nearest available WGI release |
| Final Analytical Structure | Combined panel dataset integrating network, ESG and governance variables | Harmonised across all systems | Panel: firm × year (2003–2024) |
Table 5.
Operational Definition of Study Variables.
| Variable | Symbol | Type | Data Source(s) | Operational Definition |
|---|---|---|---|---|
| Environmental Risk | Dependent | RepRisk; GDELT (environment topics) | Annual index combining the frequency and severity of environmental controversies, with supplementary signals from GDELT event themes. | |
| Social Risk | Dependent | RepRisk; GDELT (labour & social themes) | Measure of exposure to labour, community and human-rights issues, based on severity-weighted incidents and news-event counts. | |
| Governance Risk | Dependent | RepRisk; WGI | Score derived from governance-related incidents (fraud, corruption) adjusted by country-level governance indicators. | |
| Shipment Volume | Independent | Panjiva (S&P Global) | Log-transformed count of inbound and outbound shipments for firm i in year t. | |
| Trade Dependency | Independent | FactSet Revere; Panjiva | Index reflecting reliance on cross-border suppliers and customers, constructed from supplier concentration ratios and the share of foreign trade partners. | |
| Negative News Sentiment | Independent | GDELT | Average annual sentiment score of ESG-related coverage, weighted by firm-specific event volume. | |
| Network Position | Moderator | Graph metrics; GNN embeddings | Composite structural indicator capturing influence, brokerage and local connectivity based on centrality metrics and learned embeddings. | |
| Lagged ESG Incident Count | Independent (lagged) | RepRisk | Number of ESG incidents recorded for firm i in the prior year. | |
| Regional Context | Control | WGI; HDI; regulatory indices | Normalised index summarising governance quality, regulatory strength and socio-economic conditions in the firm’s home country. |
Table 6.
Descriptive Statistics.
| Variable | Symbol | Observations | Mean | Std. Dev. | Min | Max |
|---|---|---|---|---|---|---|
| Environmental Risk | 25,000 | 2.84 | 1.21 | 0.00 | 9.40 | |
| Social Risk | 25,000 | 3.12 | 1.44 | 0.00 | 10.20 | |
| Governance Risk | 25,000 | 2.57 | 1.18 | 0.00 | 8.30 | |
| Shipment Volume (log) | 2,500,000 | 7.89 | 1.96 | 0.00 | 15.21 | |
| Trade Dependency | 25,000 | 0.41 | 0.22 | 0.05 | 0.98 | |
| Negative News Sentiment | 1,200,000 | –5.87 | 12.44 | –90.00 | 85.00 | |
| Network Position | 25,000 | 0.28 | 0.15 | 0.01 | 0.89 | |
| ESG Incident Count (Lagged) | 25,000 | 1.72 | 3.64 | 0.00 | 47.00 | |
| Regional Context | 25,000 | 0.56 | 0.18 | 0.13 | 0.91 |
Table 7.
Pearson Coefficients Correlation.
| S/N | Variable | VIF | (1) | (2) | (3) | (4) | (5) | (6) | (7) | (8) | (9) |
|---|---|---|---|---|---|---|---|---|---|---|---|
| (1) | 2.41 | 1.000 | |||||||||
| (2) | 2.18 | 0.623 | 1.000 | ||||||||
| (3) | 2.07 | 0.482 | 0.552 | 1.000 | |||||||
| (4) | 1.36 | –0.118 | –0.094 | –0.153 | 1.000 | ||||||
| (5) | 1.52 | 0.217 | 0.182 | 0.143 | 0.308 | 1.000 | |||||
| (6) | 2.33 | 0.458 | 0.507 | 0.392 | –0.062 | 0.114 | 1.000 | ||||
| (7) | 1.71 | 0.281 | 0.309 | 0.263 | 0.218 | 0.366 | 0.187 | 1.000 | |||
| (9) | 2.49 | 0.709 | 0.643 | 0.577 | –0.041 | 0.169 | 0.492 | 0.324 | 1.000 | ||
| (9) | 1.88 | –0.327 | –0.405 | –0.459 | 0.082 | –0.124 | –0.269 | –0.157 | –0.386 | 1.000 |
Note: Standardized to three decimals; all coefficients significant at p < 0.01.
Table 8.
Network-Augmented ESG Risk Model with Multiple Centrality Measures. Dependent variable: firm-level ESG risk score
Table 8.
Network-Augmented ESG Risk Model with Multiple Centrality Measures. Dependent variable: firm-level ESG risk score
| Regressor | Coefficient | Std. Error | t-value | p-value |
|---|---|---|---|---|
| Constant | 5.982 | 1.642 | 3.644 | 0.000 |
| Network Variables | ||||
| Network-lag ESG risk ( ) | 0.351 | 0.137 | 2.563 | 0.011 |
| Degree centrality ( ) | –0.018 | 0.016 | –1.123 | 0.262 |
| Betweenness centrality ( ) | 0.094 | 0.039 | 2.410 | 0.016 |
| Eigenvector centrality ( ) | 0.157 | 0.061 | 2.573 | 0.011 |
| Firm-Level Controls | ||||
| Shipment Volume (log) ( ) | 0.129 | 0.027 | 4.778 | 0.000 |
| Trade Dependency ( ) | 0.166 | 0.228 | 0.728 | 0.468 |
| Contextual Controls | ||||
| Regional Context ( ) | –0.881 | 0.219 | –4.024 | 0.000 |
| Model Fit Statistics | ||||
| R² | 0.189 | |||
| Adjusted R² | 0.188 | |||
| F-statistic | 54.62 | 0.000 | ||
| Observations | 200,000 |
Table 9.
Robustness Analysis of Network-Based ESG Risk Models. Dependent Variable: ESG Risk.
| Regressor | SLM Coef. (SE) |
SDM Coef. (SE) |
Panel FE Model Coef. (SE) |
|---|---|---|---|
| Network Effects | |||
| Network-lag ESG risk ₜ) | 0.314* (0.098) | 0.271 (0.104) | 0.284* (0.072) |
| Spatial lag of Shipment Volume ( | 0.083 (0.034) | ||
| Spatial lag of Eigenvector | 0.067 (0.031) | ||
| Spatial lag of Regional Context | –0.212* (0.081) | ||
| Centrality Measures | |||
| Eigenvector centrality | 0.141* (0.053) | 0.128 (0.051) | 0.097 (0.038) |
| Firm-Level ESG Predictors | |||
| Negative Sentiment | 0.021* (0.006) | ||
| ESG Incident Count | 0.063* (0.014) | ||
| Shipment Volume (log) | 0.112* (0.025) | 0.097* (0.026) | 0.052 (0.019) |
| Trade Dependency | 0.129 (0.191) | ||
| Contextual Controls | |||
| Regional Context | –0.764* (0.203) | –0.689* (0.214) | |
| Model Features & Fit | |||
| Firm FE | Included | ||
| Year FE | Included | ||
| Spatial parameter ρ | 0.233* | 0.217* | |
| Pseudo- / Within | 0.21 | 0.27 | 0.23 |
| Observations | 25,000 firms | 25,000 firms | 200,000 firm-years (25,000 × 8 years) |
Table 10.
Graph-Theoretic Regressions: Centrality Metrics of ESG Risk Dimensions.
| Regressor | Environmental Coef. (SE) |
Social Coef. (SE) |
Governance Coef. (SE) |
|---|---|---|---|
| Degree centrality | 0.207* (0.067) | 0.370* (0.067) | 0.139 (0.068) |
| Betweenness centrality | 0.472* (0.062) | 0.286* (0.062) | 0.383* (0.062) |
| Eigenvector centrality | 0.373* (0.064) | 0.474* (0.064) | 0.276* (0.065) |
| Clustering coefficient | 0.212* (0.058) | 0.096* (0.058) | 0.295* (0.059) |
| Constant | 0.025 (0.057) | 0.018 (0.057) | 0.021 (0.058) |
| Model Fit | |||
| R² | 0.578 | 0.567 | 0.522 |
| Observations | 200,000 | 200,000 | 200,000 |
Notes: *p < 0.01, p < 0.05, p < 0.10.
Table 11.
Robustness Analysis: Standardized Coefficients and Average Marginal Effects.
| Regressor | Environmental Risk Std. β (AME) |
Social Risk Std. β (AME) |
Governance Risk Std. β (AME) |
|---|---|---|---|
| Dependent Variables: ESG Risk | |||
| Degree centrality | 0.241* (0.052) | 0.389* (0.071) | 0.118 (0.031) |
| Betweenness centrality | 0.524* (0.118) | 0.312* (0.059) | 0.388* (0.082) |
| Eigenvector centrality | 0.417* (0.094) | 0.518* (0.102) | 0.289* (0.066) |
| Clustering coefficient | 0.233* (0.047) | 0.095* (0.018) | 0.315* (0.056) |
| Constant | 0.025 | 0.018 | 0.021 |
| Model Fit | |||
| R² | 0.578 | 0.567 | 0.522 |
| Observations | 200,000 | 200,000 | 200,000 |
Notes: *p < 0.01, p < 0.05, p < 0.10.
Table 12.
Robustness Analysis of Lagged ESG News Sentiment and Future ESG Incident Counts.
| Model / Specification | β (Sentimentₜ₋₁) | SE | p-value |
|---|---|---|---|
| Dependent Variable: ESG Incident Count | |||
| (1) FE-OLS + Driscoll–Kraay SE (continuous incidents) | −0.398*** | 0.052 | <0.001 |
| (2) Poisson FE (count outcome) | −0.211*** | 0.031 | <0.001 |
| (3) Negative Binomial FE (over dispersed counts) | −0.236*** | 0.039 | <0.001 |
| (4) PPML FE (robust to zeros and heteroskedasticity) | −0.224*** | 0.034 | <0.001 |
| (5) FE-OLS DK with Sentiment | −0.173** | 0.069 | 0.013 |
| (6a) FE-OLS DK with Sentiment | −0.311*** | 0.060 | <0.001 |
| (6b) FE-OLS DK with Sentiment | −0.089* | 0.048 | 0.067 |
| (7) FE-OLS DK, sentiment deciles (Bottom | −0.452*** | 0.083 | <0.001 |
| (8) FE-OLS DK, high-centrality subsample | −0.427*** | 0.071 | <0.001 |
| (9) FE-OLS DK, low-centrality subsample | −0.213** | 0.093 | 0.024 |
| (10) Placebo: Sentimentₜ₊₁ → Incidents | −0.021 | 0.047 | 0.658 |
Notes: 200,000 observations in all models. Firm and year fixed effects are included. Driscoll–Kraay standard errors are used for OLS, while cluster-robust errors are applied in counts models. Sentiment is standardized, with lower values indicating more negative coverage. Counts-model coefficients are semi-elasticities. Significance levels: *** p < 0.001, ** p < 0.05, * p < 0.10.
Table 13.
Effects of Lagged Negative ESG News Sentiment on Firm-Level ESG Controversies.
| Variable | Logit: Incident Occurrence (t) |
AME (Logit) |
Poisson: Incident Count (t) |
Cox PH: Time to First Incident |
|---|---|---|---|---|
| Sentiment Shock (t–1) | β = 2.28*** (0.03) OR = 9.81 |
+0.20* | β = 0.94*** (0.01) IRR = 2.56 |
β = 0.41*** (0.07) HR = 1.51 |
| log (Size) | β = −0.04** (0.02) OR = 0.96 |
−0.01** | β = −0.03*** (0.01) IRR = 0.97 |
β = −0.07** (0.03) HR = 0.93 |
| Network Centrality | β = 0.53*** (0.05) OR = 1.69 |
+0.06*** | β = 0.17*** (0.02) IRR = 1.19 |
β = 0.35*** (0.04) HR = 1.42 |
| Model diagnostics | Within R² = 0.64 | Pseudo-R² = 0.34 | PH assumption not rejected |
Note: Sentiment Shock (t-1) equal 1 if lagged ESG news sentiment falls within the bottom decile of its empirical distribution.
Table 14.
Robustness of ESG Sentiment Effects across NPL Architectures.
| Robustness Dimension | Metric | FinBERT | RoBERTa | mBERT |
|---|---|---|---|---|
| A. Cross-Model Alignment | Pearson correlation (vs. FinBERT) | 1.00 | 0.84 | 0.72 |
| Spearman rank correlation (vs. FinBERT) | 1.00 | 0.81 | 0.69 | |
| B. Inferential Stability (Logit) | Lagged sentiment coefficient (β) | −0.87*** | −0.76*** | −0.55** |
| Odds ratio | 0.42 | 0.47 | 0.58 | |
| 95% CI for odds ratio | [0.38, 0.46] | [0.43, 0.52] | [0.41, 0.82] | |
| C. Predictive Contribution (Random Forest) | AUC, controls only | 0.51 | 0.51 | 0.51 |
| AUC, controls + sentiment | 0.73 | 0.71 | 0.66 | |
| ΔAUC | +0.22 | +0.20 | +0.15 | |
| 95% CI for ΔAUC | [0.18, 0.26] | [0.16, 0.24] | [0.10, 0.20] | |
| D. Classification Reliability | Polarity flip rate | 3% | 7% | 10% |
| Sentiment variance | Low | Moderate | High | |
| E. Extreme Shock Sensitivity | Incident odds ratio (bottom-decile sentiment) |
10.3× | 8.9× | 6.1× |
| 95% CI for shock odds ratio | [8.9, 11.9] | [7.4, 10.7] | [4.8, 7.9] |
Notes: FinBERT is used as the reference architecture due to ESG-specific domain adaptation. Significance levels: *** p < 0.001, ** p < 0.05.
Table 15.
Evaluation of out-of-sample prediction with and without ESG sentiment.
| Model | Feature Set | ROC–AUC | AUPRC | Balanced Accuracy | F1 Score |
|---|---|---|---|---|---|
| Dependent variable: Incident_any | |||||
| Logistic Regression | Controls only | 0.51 | 0.29 | 0.50 | 0.50 |
| Controls + sentiment | 0.77 | 0.48 | 0.65 | 0.62 | |
| Random Forest | Controls only | 0.51 | 0.30 | 0.50 | 0.52 |
| Controls + sentiment | 0.79 | 0.54 | 0.68 | 0.66 | |
| Gradient Boosting | Controls only | 0.49 | 0.28 | 0.50 | 0.51 |
| Controls + sentiment | 0.66 | 0.44 | 0.64 | 0.63 | |
| XGBoost | Controls only | 0.52 | 0.31 | 0.51 | 0.52 |
| Controls + sentiment | 0.79 | 0.52 | 0.66 | 0.64 |
Note: indcident_any equals one for ESG incidents in period t. Results use 25,000 observations, identical splits, test-set evaluation, and reflect non-causal out-of-sample prediction.
Table 16.
Comparative predictive performance of AI models for ESG risk.
| Model Category | Model | ROC–AUC | Precision | Recall | F1 Score | Accuracy | Brier Score |
|---|---|---|---|---|---|---|---|
| Econometric models | Logistic Regression | 0.71 | 0.63 | 0.66 | 0.64 | 0.65 | 0.212 |
| Poisson GLM | 0.69 | 0.60 | 0.62 | 0.61 | 0.63 | 0.226 | |
| Fixed-Effects Logit | 0.73 | 0.64 | 0.67 | 0.65 | 0.66 | 0.207 | |
| Machine-learning models | Random Forest | 0.76 | 0.66 | 0.69 | 0.67 | 0.68 | 0.189 |
| Gradient Boosting (GBM) | 0.77 | 0.67 | 0.70 | 0.68 | 0.69 | 0.184 | |
| XGBoost | 0.81 | 0.69 | 0.72 | 0.70 | 0.72 | 0.168 | |
| Graph-based AI | GNN (GraphSAGE / GAT) | 0.87 | 0.74 | 0.76 | 0.75 | 0.76 | 0.149 |
Note: Evaluation based on a consistent 70/30 train-test split; all models trained on the same ESG-sentiment network dataset.
Table 17.
Forecast accuracy and calibration across AI models.
| Model Category | Model | Brier Score | Log-Loss | MAE | RMSE |
|---|---|---|---|---|---|
| Machine-learning models | Random Forest | 0.189 [0.182, 0.196] | 0.544 [0.530, 0.558] | 0.296 | 0.423 |
| Gradient Boosting | 0.184 [0.177, 0.191] | 0.538 [0.524, 0.552] | 0.287 | 0.417 | |
| XGBoost | 0.168 [0.161, 0.175] | 0.511 [0.497, 0.525] | 0.271 | 0.398 | |
| MLP Neural Network | 0.161 [0.155, 0.167] | 0.499 [0.486, 0.512] | 0.263 | 0.387 | |
| Graph-based AI | Graph Neural Network (GNN) | 0.149 [0.143, 0.155] | 0.472 [0.459, 0.485] | 0.249 | 0.368 |
Note: Metrics computed on a held-out test set using a consistent 70/30 train–test split.
Table 18.
Confusion matrix and error decomposition on the held-out test set.
| Model | Threshold | TP | FP | FN | TN | Precision | Recall | FPR | FNR |
|---|---|---|---|---|---|---|---|---|---|
| XGBoost | 0.42 | 1,710 | 1,980 | 890 | 20,420 | 0.46 | 0.66 | 0.09 | 0.34 |
| Graph Neural Network (GNN) | 0.39 | 1,930 | 1,640 | 670 | 20,760 | 0.54 | 0.74 | 0.07 | 0.26 |
Note: Classification thresholds are selected to maximize the F1 score on the validation set. TP (True Positives); FP (False Positives); FN (False Negatives); and TN (True Negatives).
Disclaimer/Publisher’s Note: The statements, opinions and data contained in all publications are solely those of the individual author(s) and contributor(s) and not of MDPI and/or the editor(s). MDPI and/or the editor(s) disclaim responsibility for any injury to people or property resulting from any ideas, methods, instructions or products referred to in the content. |
© 2025 by the authors. Licensee MDPI, Basel, Switzerland. This article is an open access article distributed under the terms and conditions of the Creative Commons Attribution (CC BY) license (http://creativecommons.org/licenses/by/4.0/).
Copyright: This open access article is published under a Creative Commons CC BY 4.0 license, which permit the free download, distribution, and reuse, provided that the author and preprint are cited in any reuse.