
Submitted:
29 December 2025
Posted:
29 December 2025
You are already at the latest version
Abstract
Background: The Patient-Reported Outcomes in Parkinson’s Disease (PRO-PD) scale is a 35-item visual analog measure designed to quantify symptom severity across motor and non-motor domains. Developed as a continuous, patient-centered outcome, PRO-PD captures patient-perceived change over time and is suitable for remote longitudinal assessment. This study evaluated the psychometric properties of PRO-PD across two independent datasets, in-cluding reliability, validity, factor structure, and minimal clinically important change (MCIC), and assessed its relevance to nutrition- and lifestyle-focused research. Methods: Convergent validity was evaluated in a cross-sectional clinical dataset (n = 46) using established clinician-rated and patient-reported instruments, including Hoehn and Yahr, Unified Parkinson’s Disease Rating Scale (UPDRS), Parkinson’s Disease Questionnaire-39 (PDQ-39), Montreal Cognitive Assessment (MoCA), and PROMIS measures. Internal con-sistency, temporal stability, factor structure, and known-groups validity were assessed in a large remote-monitoring cohort (n = 2,612). MCID thresholds were estimated in a longitudinal sub-sample (n = 390) using anchor-based methods, multinomial regression, and receiver operating characteristic analyses. Joint modeling (two-stage procedure) approach was applied to model the sensitivity of PRO-PD change in time to the binary diet factors evolution in time. Results: PRO-PD demonstrated strong convergent validity with established clinical measures, excellent internal consistency (Cronbach’s α = 0.93–0.95), and good test–retest reliability (ICC = 0.78 overall; 0.89 at 6 months). Confirmatory testing of a previously proposed eight-factor structure showed suboptimal fit, leading to a parsimonious four-factor solution (Cognitive, Autonomic, Motor, Psycho-Emotional) explaining 47.6% of variance. PRO-PD scores increased significantly with advancing disease duration and stage. MCID thresholds were +53.5 points for worsening and −78.5 points for improvement (AUC = 0.63–0.71), with greater sensitivity for detecting deterioration than improvement. Joint modeling further demonstrated sensitivity of PRO-PD to baseline dietary behaviors and dietary change over time. Conclusions: These findings support PRO-PD as a psychometrically robust, low-burden out-come measure suitable for remote monitoring and for use across nutrition, nutraceutical, and pharmacologic intervention studies, including in early PD where traditional scales may lack sensitivity.
Keywords:
remote patient monitoring
; disease-modification
; neuroprotection
; rating scales
; quality of life (3-10)
1. Introduction
Parkinson’s disease (PD) is the fastest-growing neurological disorder worldwide, with recent estimates predicting 25 million people will be living with PD by 2050.[1] Despite extensive research efforts, no established therapies have been shown to slow, halt, or reverse disease progression.[2] One contributing factor is the limited availability of outcome measures capable of capturing early-stage disease burden [3] and subtle changes in symptom severity, particularly those driven by non-motor symptoms and patient-perceived experience, such as anxiety, fatigue, and muscle pain, for which objective measure are lacking.
Traditional PD severity scales, including clinician-rated motor assessments and stage-based classifications, rely heavily on observable motor features that emerge later in the disease course. The Movement Disorders Society- Unified Parkinson’s Disease Rating Scale (MDS-UPDRS) [4] is the current gold standard in clinical trials [5,6,7], Currently employed instruments have been shown to have a floor effect, resulting in diminished sensitivity early in PD.[3] Recent expert and stakeholder work has concluded that traditional clinical outcome assessments, including the MDS-UPDRS, are not adequately sensitive to the earliest clinical changes and day-to-day symptom burden.[8] While psychometrically robust, it does not offer a global subjective severity rating and may inadequately capture symptom domains that people with PD report as bothersome.[9,10]
Nutrition, dietary patterns, and nutraceutical interventions are widely used by people with PD. However, the study of these exposures has been constrained by outcome measures that are insufficiently sensitive to patient-perceived change, slow to respond, or poorly suited to remote and longitudinal data collection. Regulatory agencies have increasingly emphasized the importance of patient-reported outcomes (PROs) to address these limitations and to better capture treatment effects meaningful to patients.[11]
The Patient-Reported Outcomes in Parkinson’s Disease (PRO-PD) scale was developed as a patient-centered, continuous outcome measure designed to quantify both motor and non-motor symptom severity without reliance on in-clinic assessments. The scale was explicitly designed to be sensitive early in disease, stable across daily fluctuations, and capable of detecting gradual change over time. Importantly, the PRO-PD has been used in prior observational analyses to evaluate associations between PD symptom severity and modifiable exposures, including diet,[12,13,14] nutraceutical use,[15] physical activity,[16] sleep,[17] and psychosocial factors.[18]
The scale was introduced in 2017 [19], and translated and formally validated in Swedish in 2022 [20]. Despite its increasing use as an app and an outcome measure in PD, formal validation of the original English PRO-PD scale has not been completed. The primary aim of this study was therefore to evaluate the psychometric properties of the PRO-PD, including validity, reliability, and responsiveness. A secondary aim was to assess its suitability as an outcome measure for nutrition- and nutraceutical-focused PD research.
2. Materials and Methods
Big Data (n=2,612): Parkinsonism (MVP) study, an internet-based longitudinal cohort designed to examine lifestyle, dietary, environmental, and psychosocial factors associated with PD outcomes.[12,13,14,15,16,17] The MVP study collects self-reported data biannually, with optional more frequent symptom tracking via the PRO-PD platform. Longitudinal data with 35 PRO-PD items (including ‘restless legs’) collected at multiple time points. This sample was used for internal consistency, temporal stability (ICC), factor structure analyses, and known-groups validity. A subset of 390 patients who completed the 6-month follow-up with anchor assessment (35 Improved, 213 Stable, 142 Worsened) was used for minimal clinically important difference (MCID) determination.
Small Dataset (n=46): Baseline data were available from individuals previously enrolled in a clinical trial that used PRO-PD as a secondary outcome measure.[21] Cross-sectional data with 34 PRO-PD items (excluding Restless Legs) collected alongside other validated scales including Hoehn & Yahr (H&Y), Montreal Cognitive Assessment (MoCA), Non-Motor Symptoms Questionnaire (NMSQ), Parkinson’s Disease Questionnaire-39 (PDQ-39), Unified Parkinson’s Disease Rating Scale (UPDRS), and PROMIS Global Health. This sample was used for convergent validity analyses.
PRO-PD Scale: The PRO-PD is a patient-reported outcome measure assessing 35 Parkinson’s disease symptoms using visual analog scales (0-100), with higher scores indicating greater symptom severity. Total PRO-PD score is calculated as the sum of all item scores.
Statistical Analysis All analyses were performed using R version ver. 4.2.1 and R Studio ver. 2025.09.1. The significance level α = 0.05 was used throughout. Data are presented as median and interquartile range (IQR) or mean and standard deviation (SD) as appropriate.
Descriptive Statistics and Item Analysis For both data sets, individual items were assessed for central tendency (mean), standard deviation, skewness, and proportion of minimum (floor) and maximum (ceiling) values. Ceiling effects were defined as > 15% responses with maximum values. Corrected item-total correlations were calculated for each item.
Internal Consistency Internal consistency was evaluated using Cronbach’s α at baseline for both Small Data (34 items) and Big Data (35 items), with values > 0.90 indicating excellent internal consistency.
Temporal Stability (Test-Retest Reliability) Temporal stability was assessed using intraclass correlation coefficients (ICC) calculated from mixed-effects models with random intercepts for participants (Big Data only). ICC was computed for each PRO-PD item and the total score across all available time points and separately for the baseline-to-6-month period. ICC values were interpreted as: < 0.50 (poor), 0.50–0.75 (moderate), 0.75–0.90 (good), and > 0.90 (excellent) temporal stability
Factor Structure Confirmatory factor analysis (CFA) was performed on Big Data to test the Swedish 8-factor model structure. Model fit was evaluated using: Comparative Fit Index (CFI; acceptable > 0.90, good > 0.95), Tucker-Lewis Index (TLI; acceptable > 0.90, good > 0.95), Root Mean Square Error of Approximation (RMSEA; acceptable < 0.08, good < 0.06), and Standardized Root Mean Square Residual (SRMR; acceptable < 0.08, good < 0.05). When the Swedish 8-factor model showed inadequate fit, exploratory factor analysis (EFA) with varimax rotation was conducted to identify the optimal factor structure. Factor solutions with 4-7 factors were examined, and the 4-factor solution was selected based on interpretability and variance explained.
Factor analysis was not performed on Small Data due to insufficient sample size.
Convergent Validity Convergent validity was assessed using Pearson’s correlations between PRO-PD total score and established scales (H&Y, MoCA, NMSQ, PDQ-39, UPDRS, PROMIS) in Small Data. Correlation coefficients were interpreted as: weak (0.10–0.39), moderate (0.40–0.69), strong (0.70–0.89), or very strong (0.90–1.00).
Known-Groups Validity Known-groups validity was evaluated by comparing PRO-PD scores across clinically relevant subgroups using Kruskal-Wallis tests with post-hoc pairwise Wilcoxon tests (Holm adjustment). Comparisons included: Disease duration groups (0-2, 3-4, 5+ years since diagnosis), Disease severity by estimated H&Y stage (Mild ≤2, Moderate =3, Severe ≥4) (Small Data), Gender. Relationships between PRO-PD and continuous variables (age, years since diagnosis) were assessed using Pearson’s correlation.
Minimal Clinically Important Difference (MCID) MCID was determined using an anchor-based approach in the subset of Big Data patients (n=390) who completed baseline, 6-month follow-up, and anchor assessment. At 6 months, patients rated their overall symptom progression compared to baseline using a 3-category scale: Improved, Stable, or Worsened. PRO-PD change scores (6-month minus baseline) were compared across anchor groups using: Kruskal-Wallis test with post-hoc pairwise Wilcoxon tests (Holm adjustment), Multinomial logistic regression with anchor status as outcome and PRO-PD change as predictor. Receiver operating characteristic (ROC) analysis was used to determine optimal PRO-PD change thresholds using Youden’s index (sensitivity + specificity – 1). ROC analyses were conducted for: Worsened vs Stable, Improved vs Stable, Improved vs Worsened, Worsened vs Not Worsened (combined Improved/Stable). Area under the curve (AUC), optimal threshold, sensitivity, specificity, and accuracy were reported for each comparison.
Sensitivity to Diet (Joint Models) A two-stage approach was used to jointly model PRO-PD and binary diet predictors. In the first stage, generalized mixed models with spline terms were fitted separately for each dietary item and PRO-PD score. In the second stage, subject-specific random effects were extracted from each model, and correlations between random effects were computed for each PRO-PD-diet item pair to quantify associations between the two longitudinal responses. Both dietary items and PRO-PD trajectories were modeled using splines and adjusted for baseline age, gender, and years since diagnosis.
Cross-Validation Cross-validation (CV) was performed to assess the stability of random-effects correlations from the joint models. Correlations were evaluated between random intercepts and slope of PRO-PD trajectories and the corresponding intercepts and slopes of each dietary item, as well as within-diet random-effects matrices. CV was conducted using 100 random subsamples, each compromising 50% of the data. Associations were summarized according to reliability across CV samples, with high reliability defined as significance in >80% of samples, moderate reliability as >50%, and low reliability as <50%.
3. Results
Available demographic data on study participants is presented in Table 1. Using the PRO-PD scores that had a corresponding in-person clinical evaluation related to a PD research study (n=45), correlation coefficients between PRO-PD and historically used scaled were calculated. (Figure 1a-f) Not only did PRO-PD correlate with standard ‘motor’ assessments (HY: r=0.4862, p=7e-04; UPDRS: r= 0.4676, p=0.0012) it was also correlated with quality of life (PROMIS: r= -0.2631, p= 0.0808; PDQ-39: r=0.7335, p=0), non-motor symptoms (NMSS, r=7837, p=0), and cognitive function (MoCA: r= -0.3358, p=0.0259).
Descriptive statistics and item-level psychometric characteristics for both datasets are presented in Table 1. Across the large remote-monitoring cohort (n = 2,612), item distributions demonstrated minimal ceiling effects and generally acceptable skewness, with floor effects exceeding 15% primarily for hallucinations/delusions (37.1%) and nausea (30.6%). Corrected item–total correlations were ≥0.30 for most items, with lower correlations observed for tremor and sense of smell. This pattern closely mirrors findings from the Swedish PRO-PD validation study[20], which similarly reported the lowest item–total correlations for tremor (0.19) and olfaction (0.22), as well as the highest floor effects for hallucinations and nausea. The smaller in-person dataset (n = 46) demonstrated comparable item-level patterns, with greater variability attributable to sample size. Overall, consistency in item performance across datasets and concordance with prior validation findings support the stability of the PRO-PD item structure across populations and modes of administration.
Internal Consistency
Internal consistency was high for both small (Cronbach’s Alpha =0.929, 95% CI: 0.896, 0..955) and big data (Cronbach’s Alpha = 0.947, 95% CI: 0.947, 0.951).
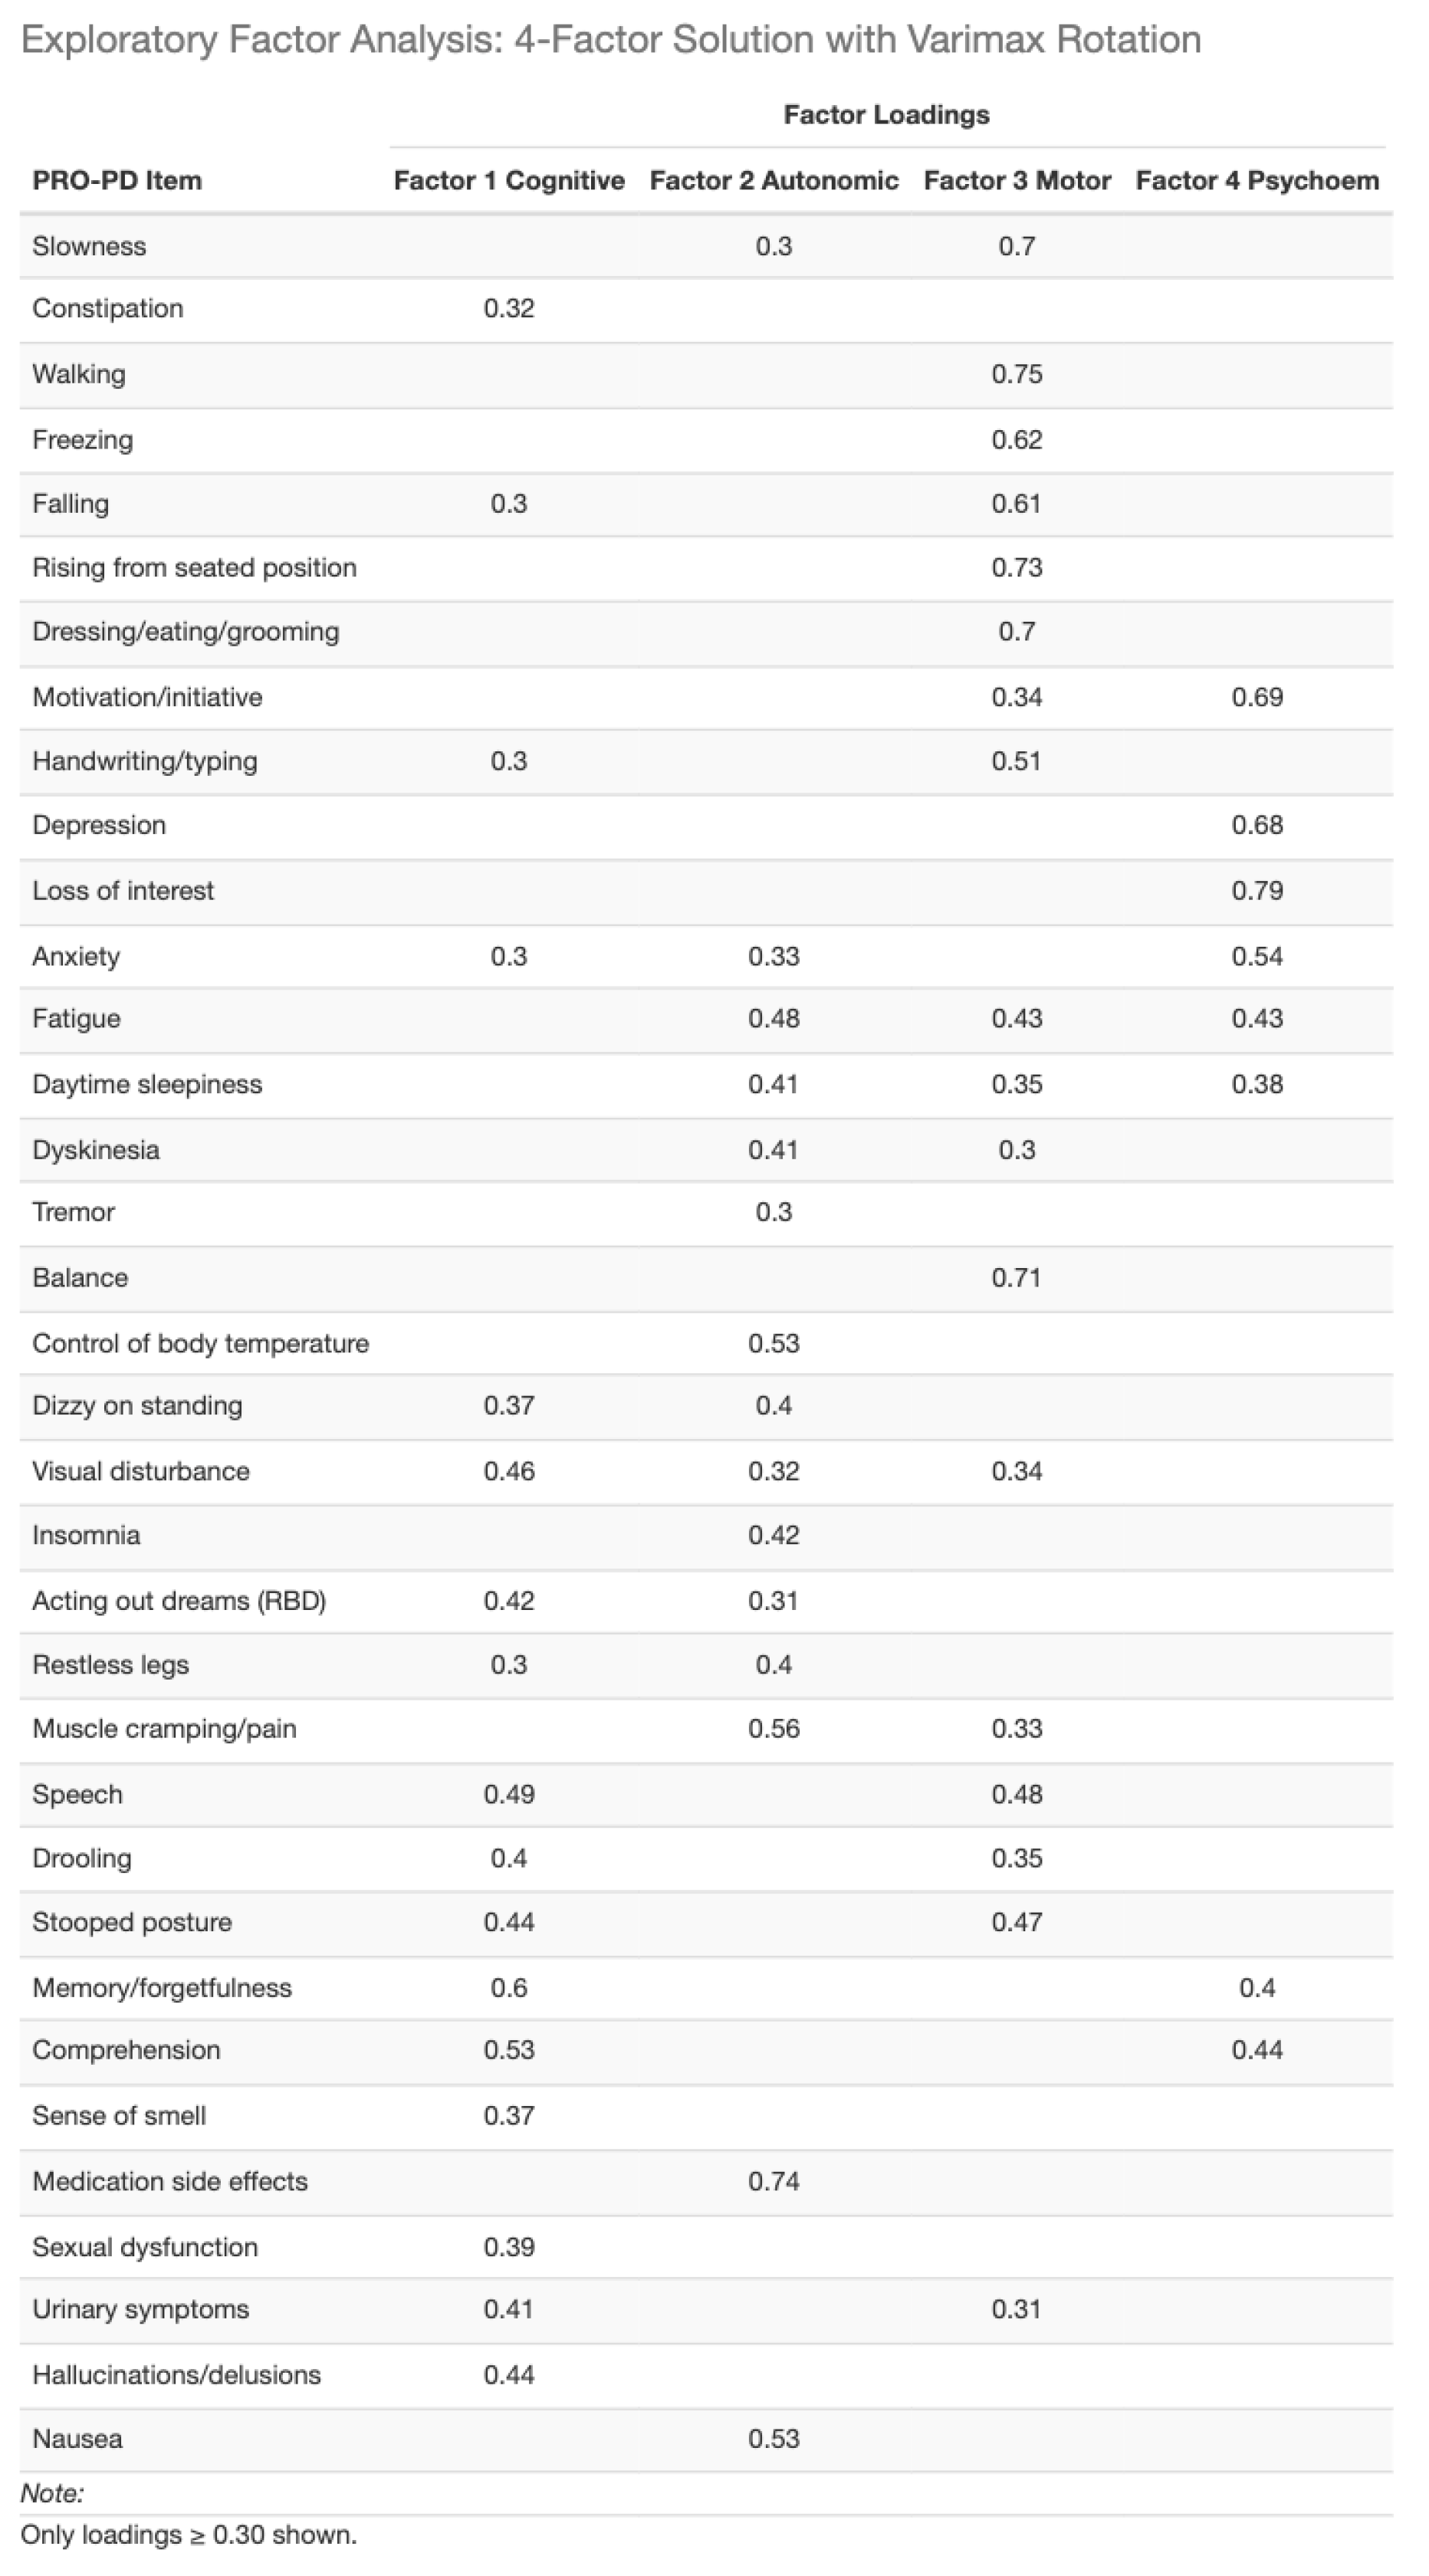
Factor analysis: To facilitate comparison with the Swedish validation study, a confirmatory factor analysis (CFA) was first conducted using the previously identified eight-factor structure. Model fit indices indicated suboptimal fit (CFI and TLI < 0.90). (Table 2) Consequently, exploratory factor analyses were performed evaluating solutions with four to seven factors. Based on overall model fit, interpretability, and parsimony, a four-factor solution was selected as the best representation of the data. (Table 3)
Although the 4-factor solution explained a lower proportion (47.6%) of total variance than the previously 8-factor structure (61%), variance explained alone is not a sufficient criterion for model adequacy. The Swedish 8-factor solution was derived using exploratory methods and maximized variance by subdividing correlated symptom domains, whereas confirmatory testing in the present dataset demonstrated suboptimal model fit. The 4-factor solution represents a more parsimonious and interpretable structure, prioritizing latent construct validity and overall model fit over variance maximization. This approach aligns with contemporary psychometric standards for patient-reported outcome validation.

Table 4.
Final big data 4-factor analysis.
 |
PRO-PD in Relation to Demographic and Clinical Characteristics: Baseline PRO-PD scores were examined across disease duration groups (0–2 years, 3–4 years, and ≥5 years since diagnosis). In the smaller in-person dataset, no significant differences in total PRO-PD scores were observed across duration groups (Kruskal–Wallis χ² = 2.29, df = 2, p = 0.318). In contrast, in the large remote-monitoring dataset, PRO-PD scores differed significantly by disease duration (Kruskal–Wallis χ² = 251.87, df = 2, p < 2.2 × 10⁻¹⁶). Pairwise comparisons using Wilcoxon rank-sum tests with Holm adjustment confirmed significant differences between all duration groups, with higher PRO-PD scores observed in individuals with longer disease duration. Specifically, comparisons between the ≥5-year group and both the 3–4-year and 0–2-year groups were highly significant (both p < 2 × 10⁻¹⁶), as was the comparison between the 3–4-year and 0–2-year groups (p = 0.0037). These differences are illustrated in Figure 2a-b, which shows a stepwise increase in baseline PRO-PD scores with increasing years since diagnosis.
Only the large data demonstrated a significant correlation between PRO-PD and years since diagnosis (r=0.328, p=0) and age (r=0.0557, p=0.0076). (Figure 3a-b) The correlation with years since diagnosis was also observed in Swedish study, where similar results were obtained.
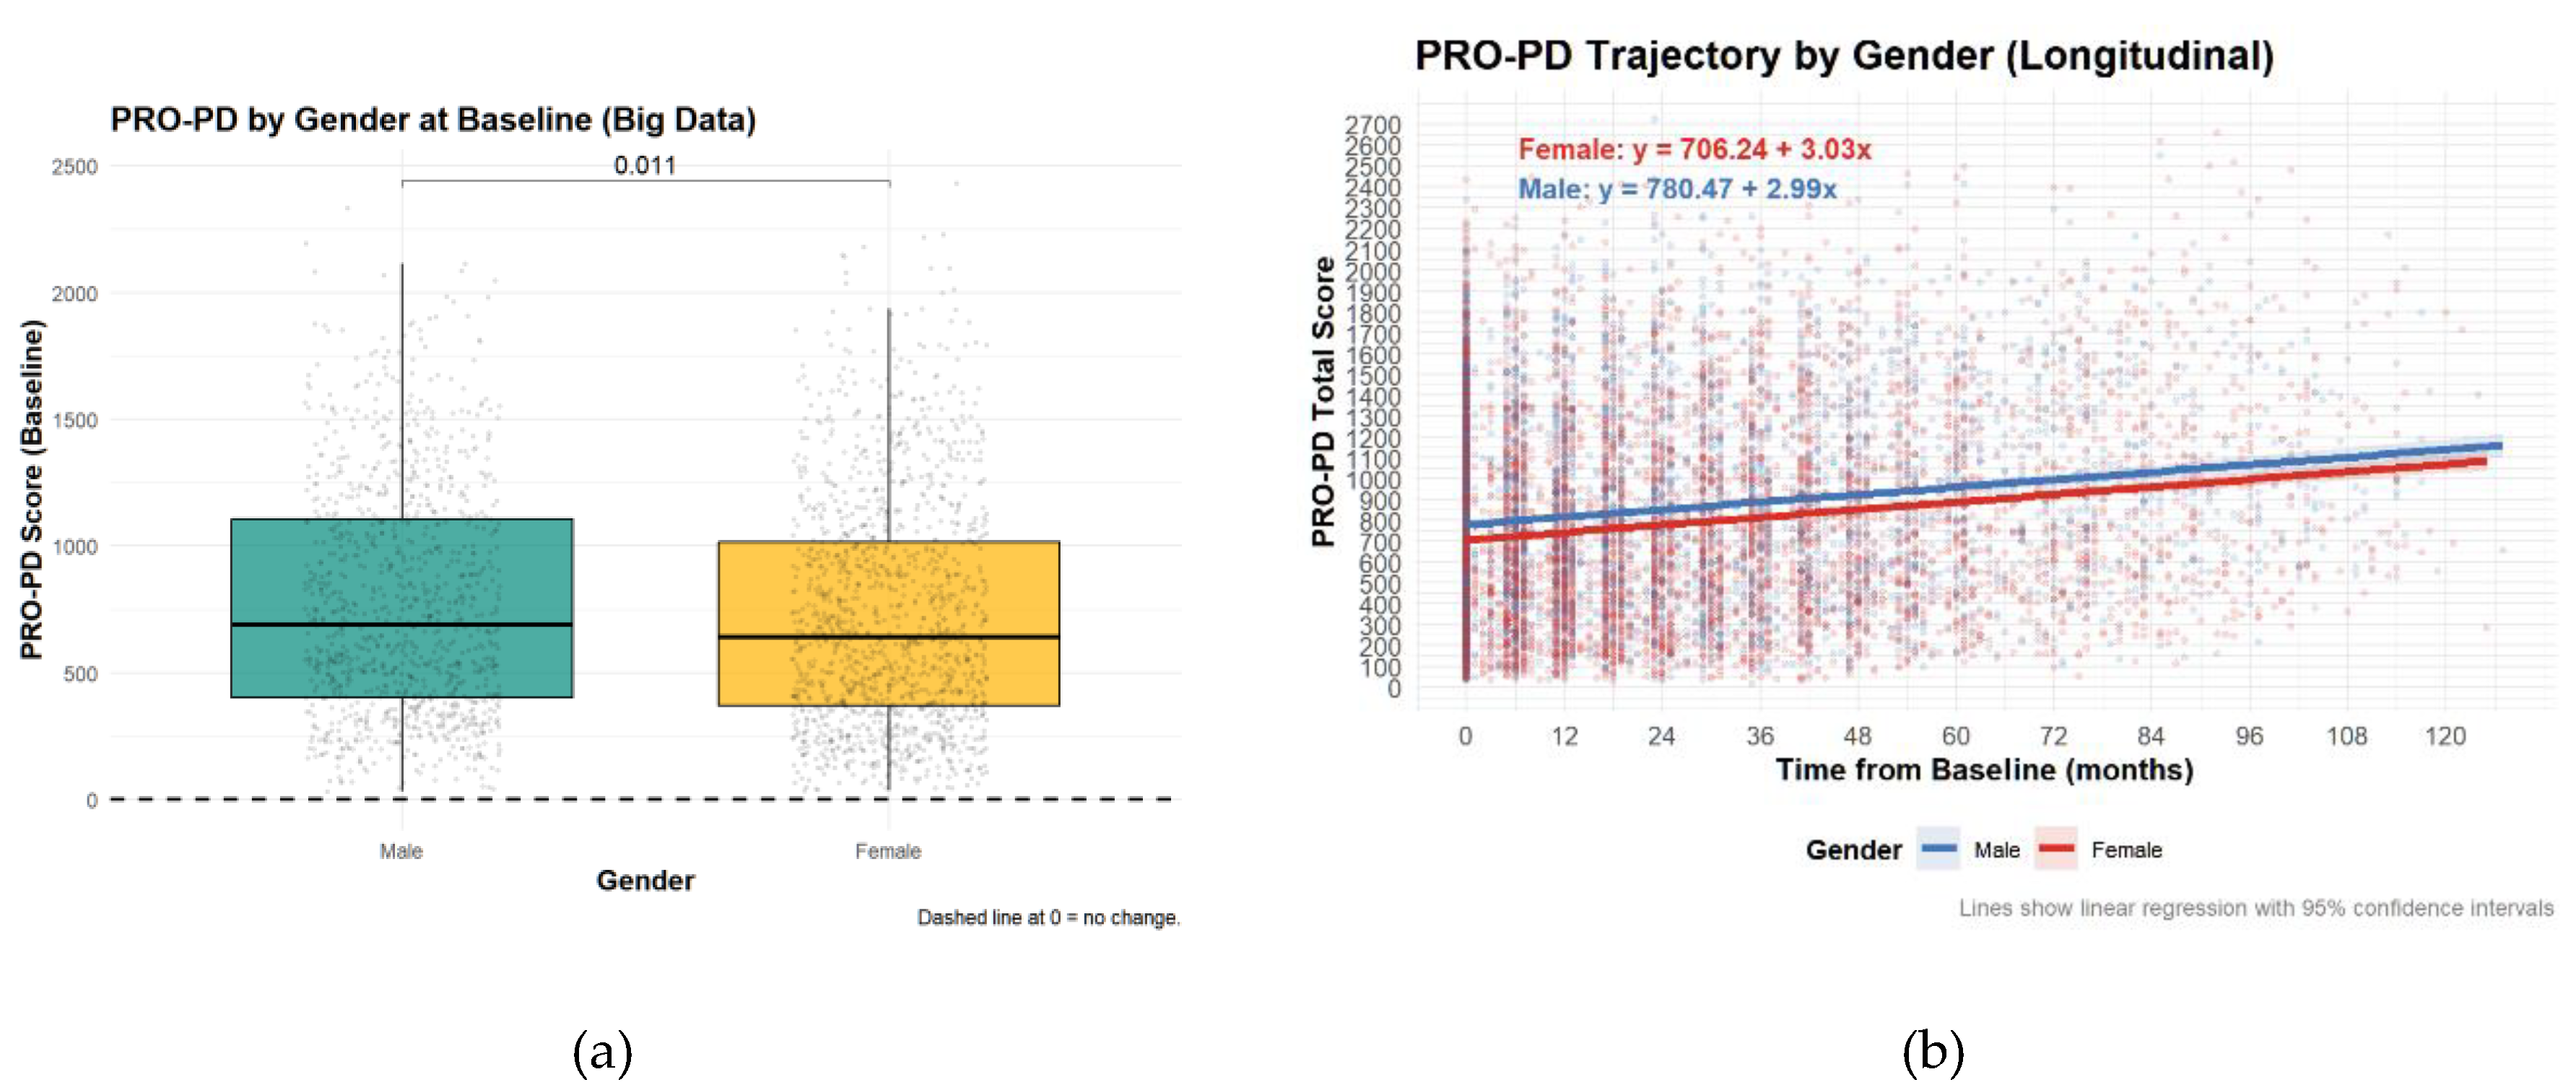
PRO-PD by Gender at BaselineContrary to the Swedish study, there was a significant difference in PRO-PD scores between sexes, although the difference was not clinically relevant.
Figure 4.
Patient-Reported Outcomes in Parkinson’s Disease (PRO-PD) scores by sex. High PRO-PD scores represent greater symptom severity. (a) Symptom severity of sexes at baseline (b) Symptom severity of sexes over time.
Figure 4.
Patient-Reported Outcomes in Parkinson’s Disease (PRO-PD) scores by sex. High PRO-PD scores represent greater symptom severity. (a) Symptom severity of sexes at baseline (b) Symptom severity of sexes over time.
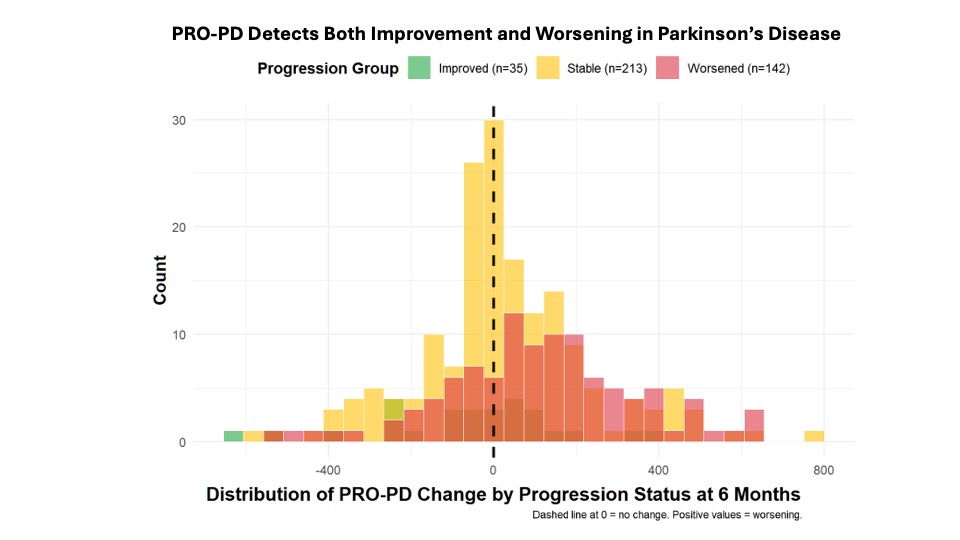
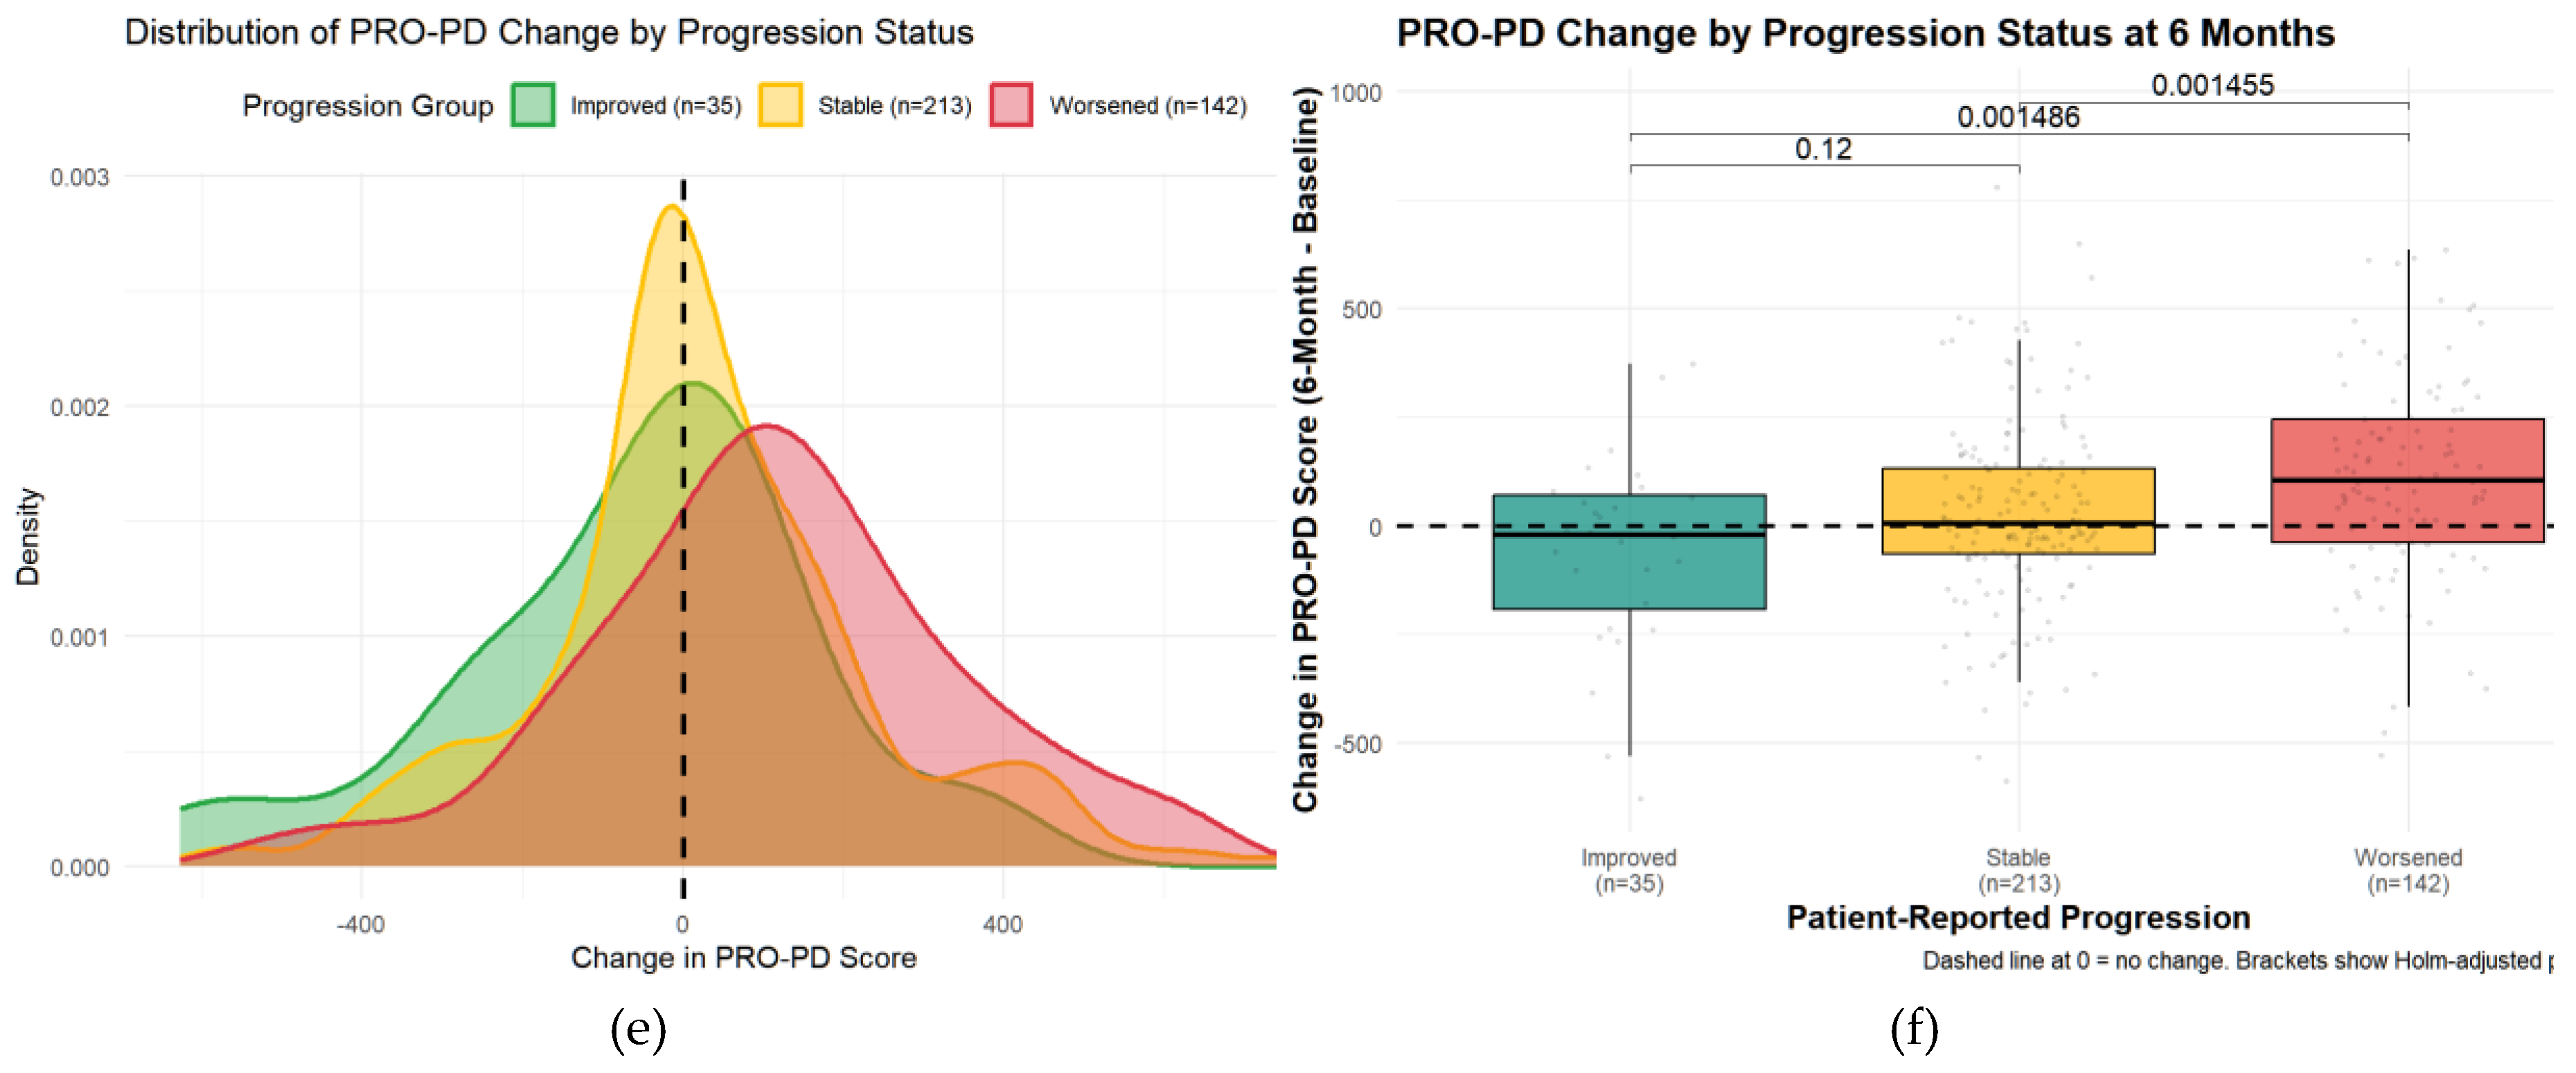
Minimally Clinically Important Change (MCIC)Minimal clinically important change (MCID) was evaluated using an anchor question administered at six months. Of 390 participants, 35 (9%) reported improvement, 142 (36%) reported worsening, and 213 (55%) reported no change. Median PRO-PD change was 7 in the stable group, −20 in the improved group, and +106.5 in the worsened group. Kruskal–Wallis testing demonstrated significant differences between the worsened group and both the stable and improved groups (both p = 0.0015), with no significant difference between stable and improved participants. These findings were confirmed using a multinomial regression approach.
Figure 5.
Distribution of Change in PRO-PD Scores by Self-Reported Progression Status at 6 Months. (a) Kernel density distributions of PRO-PD change for participants reporting improvement, stability, or worsening. (b) Box-and-whisker plots of PRO-PD change with individual observations and Holm-adjusted pairwise comparisons.
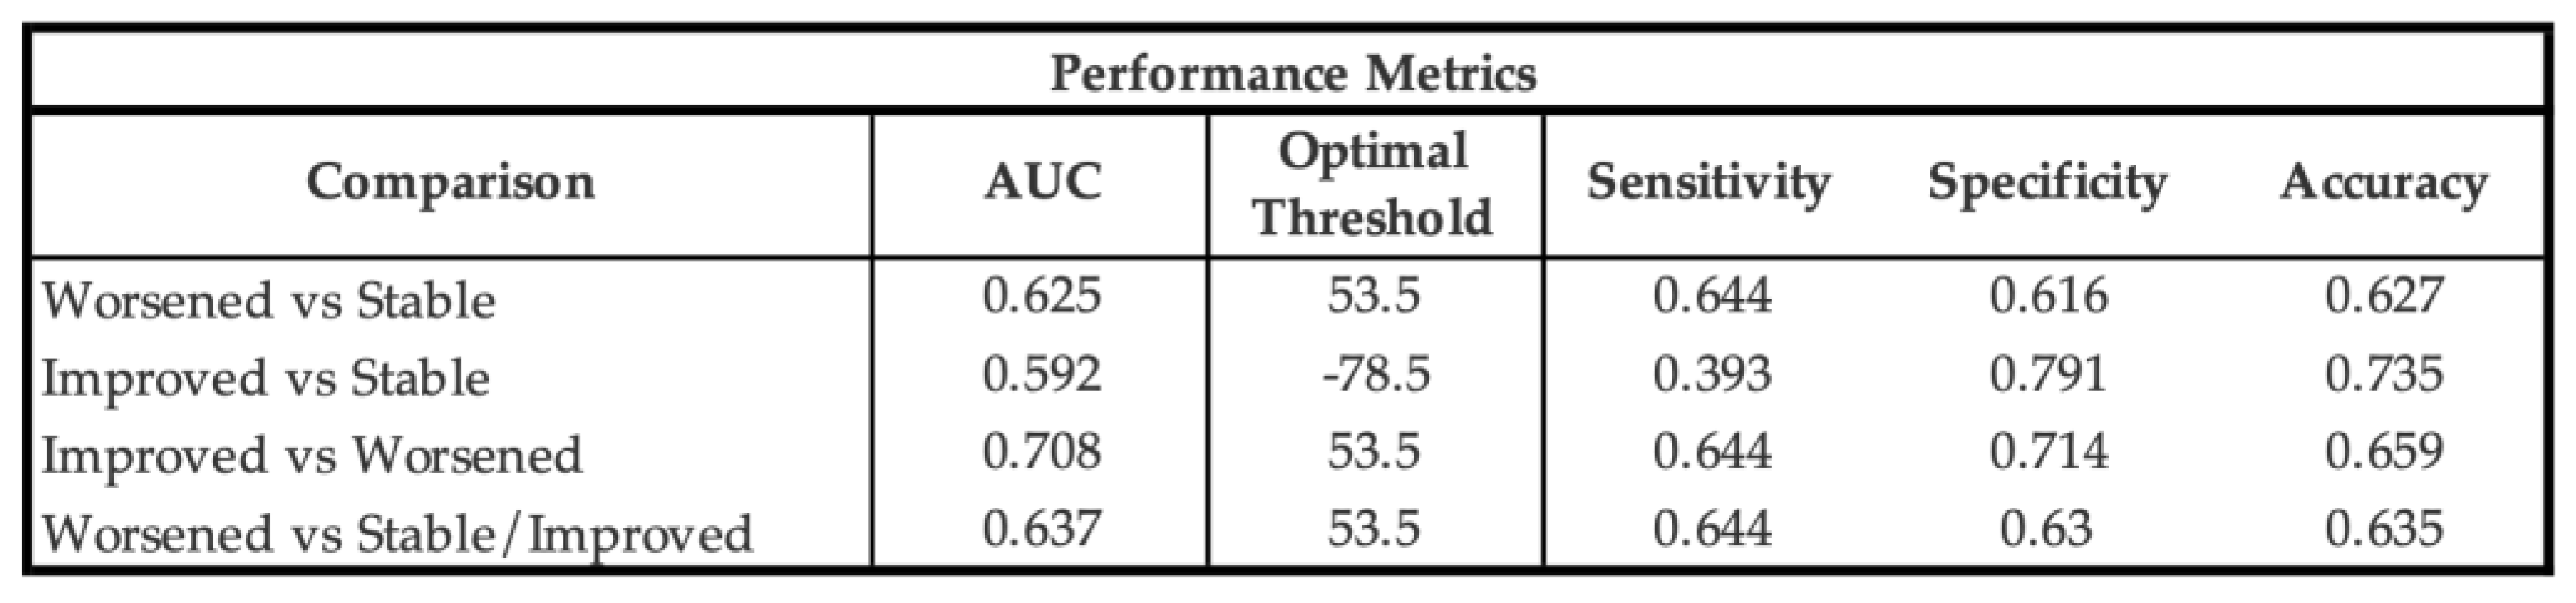
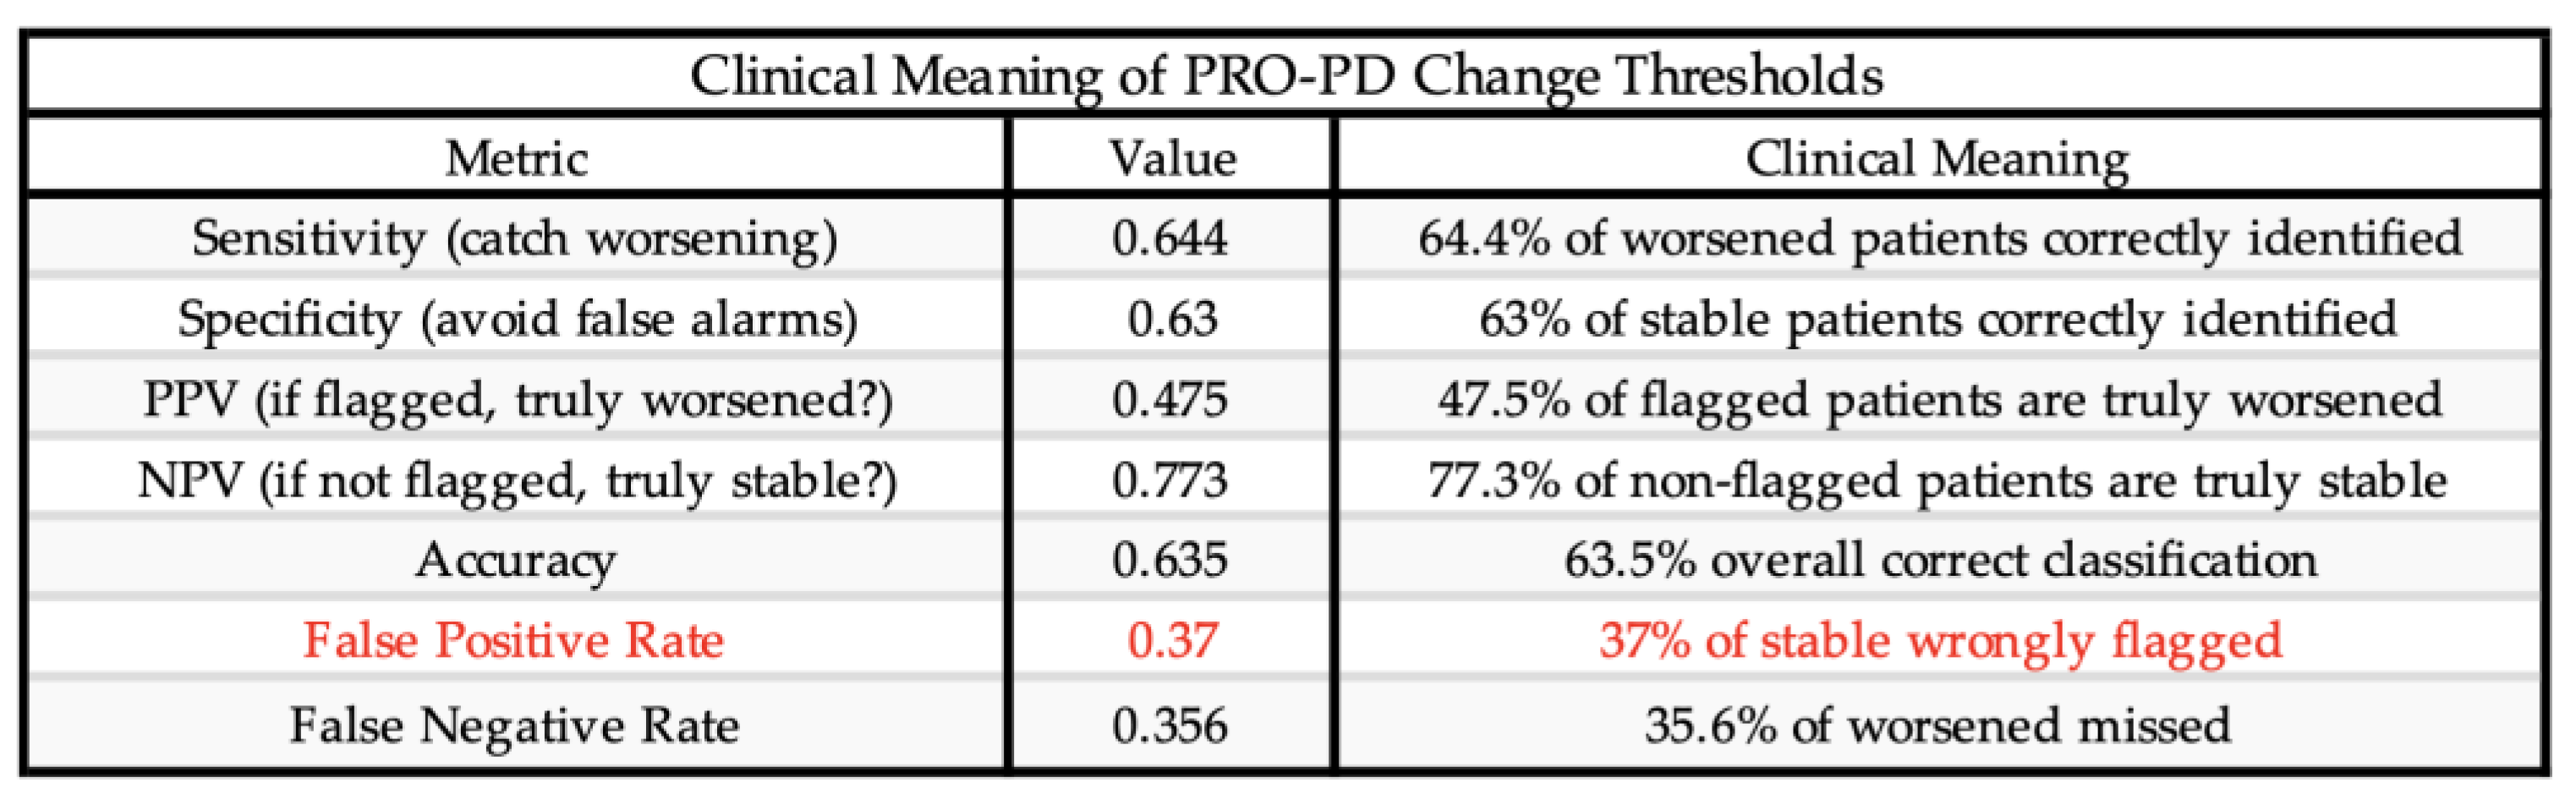
Receiver operating characteristic (ROC) analyses identified a PRO-PD change threshold of +53.5 points distinguishing worsened from stable participants, which was identical for worsened versus not worsened (stable/improved) classifications. This threshold corresponds closely to the Swedish validation study, which reported a cutoff of 119 points over a longer follow-up interval, suggesting approximately linear symptom progression over shorter time frames. The MCID for improvement was −78.5 points, indicating a larger magnitude of change required to detect improvement compared with deterioration. Discrimination was modest for improved versus stable participants (AUC = 0.592) and acceptable for improved versus worsened participants (AUC = 0.708). Classification of worsened versus not worsened yielded an AUC of 0.637, with sensitivity of 0.644 and specificity of 0.630, closely matching prior findings.
Figure 6.
Receiver Operating Characteristic (ROC) curves for change in PRO-PD scores at 6 months. ROC analyses evaluated the ability of change in PRO-PD to discriminate between self-reported progression groups. Panels show (a) worsened versus stable, (b) improved versus stable, (c) improve versus worsened, and (d) worsened versus not worsened (stable/improved). Area under the curve (AUC) values are shown within each panel. Diagonal reference lines indicate no discrimination (AUC = 0.5).
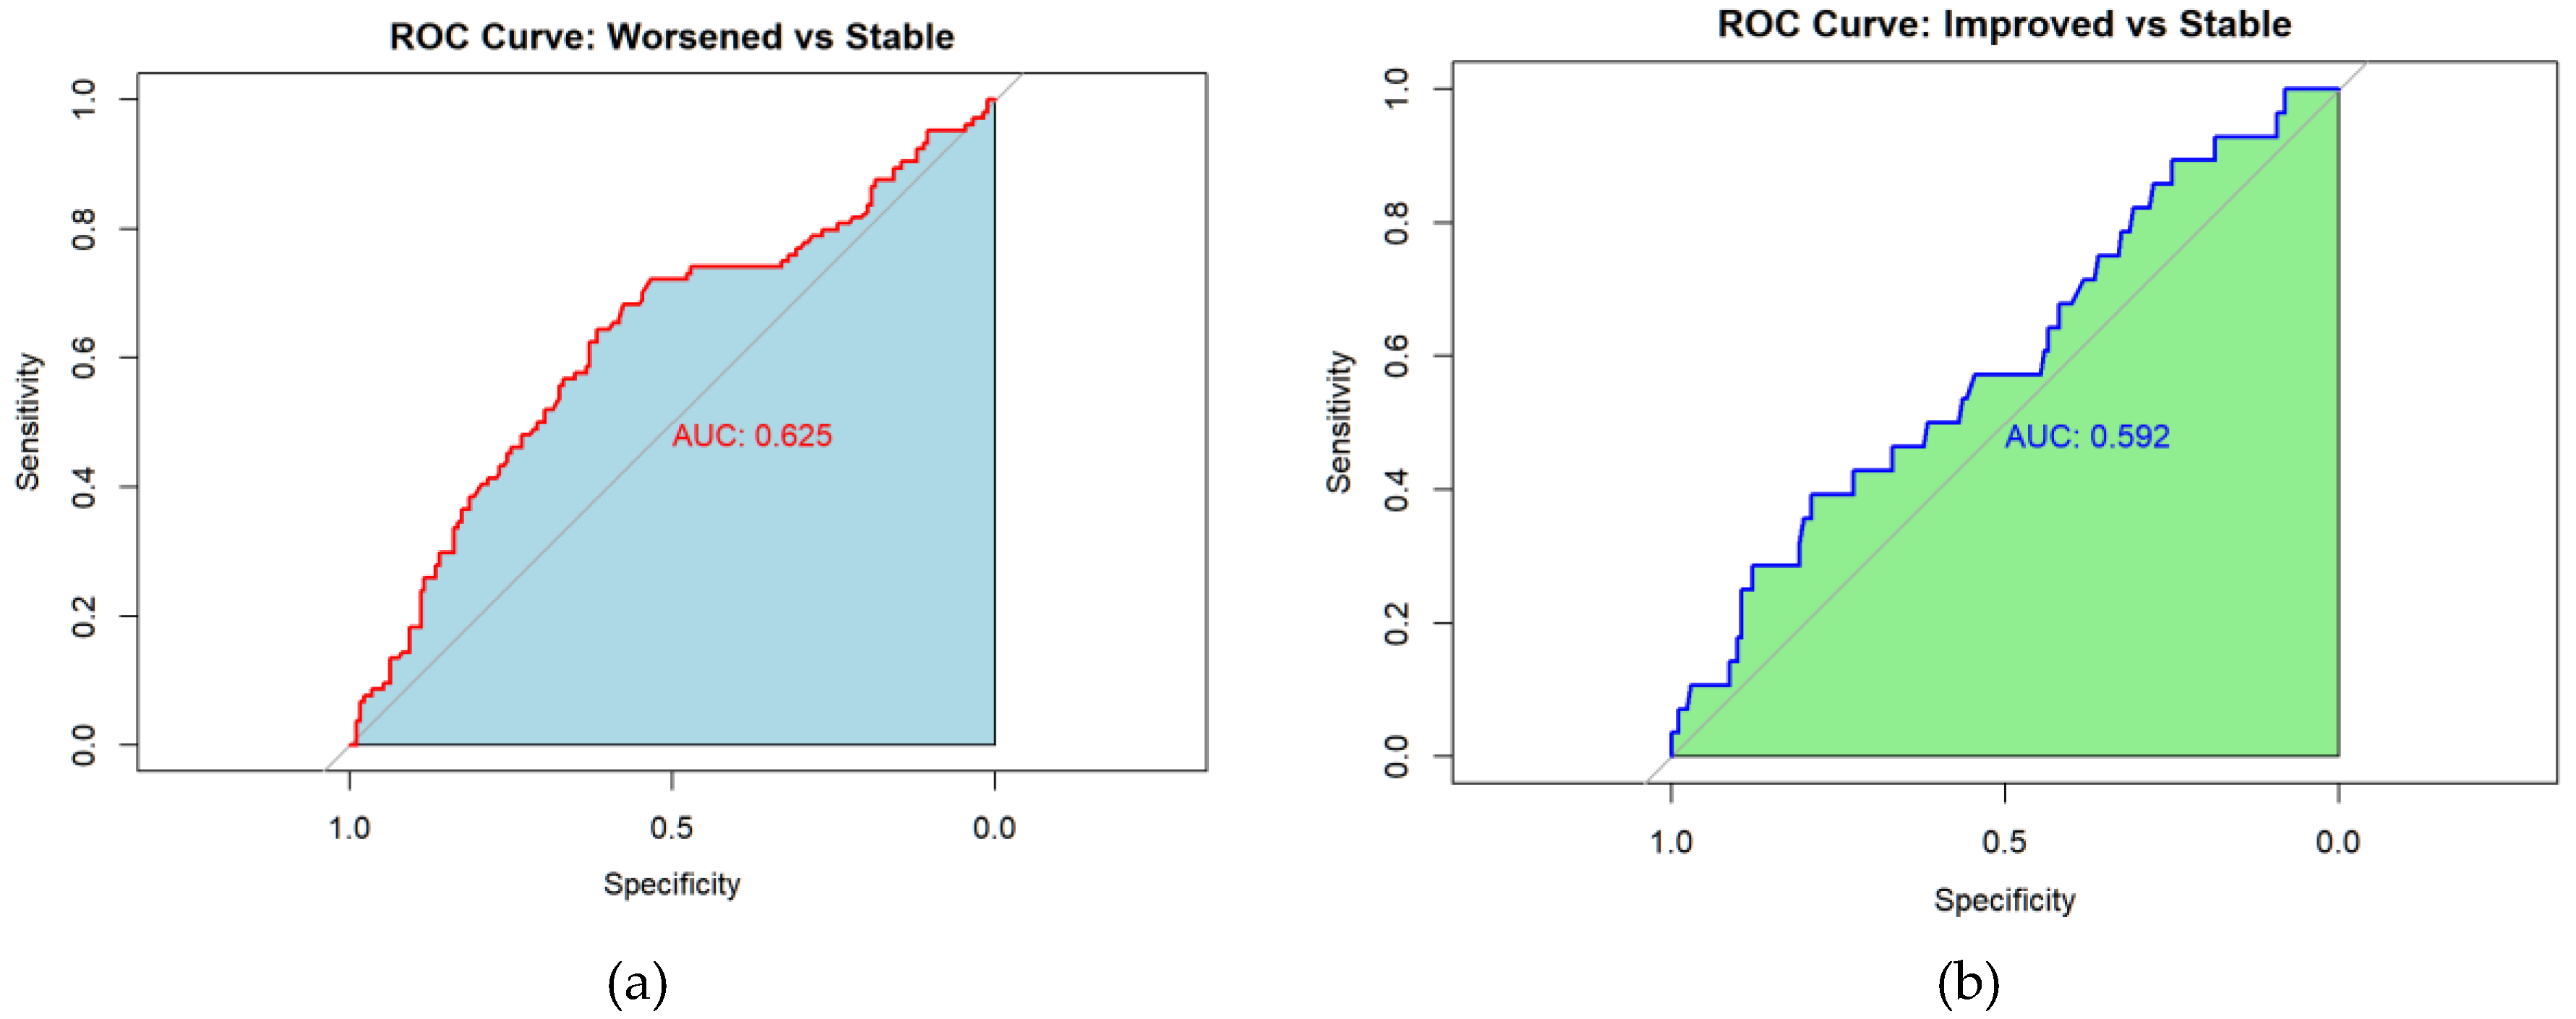
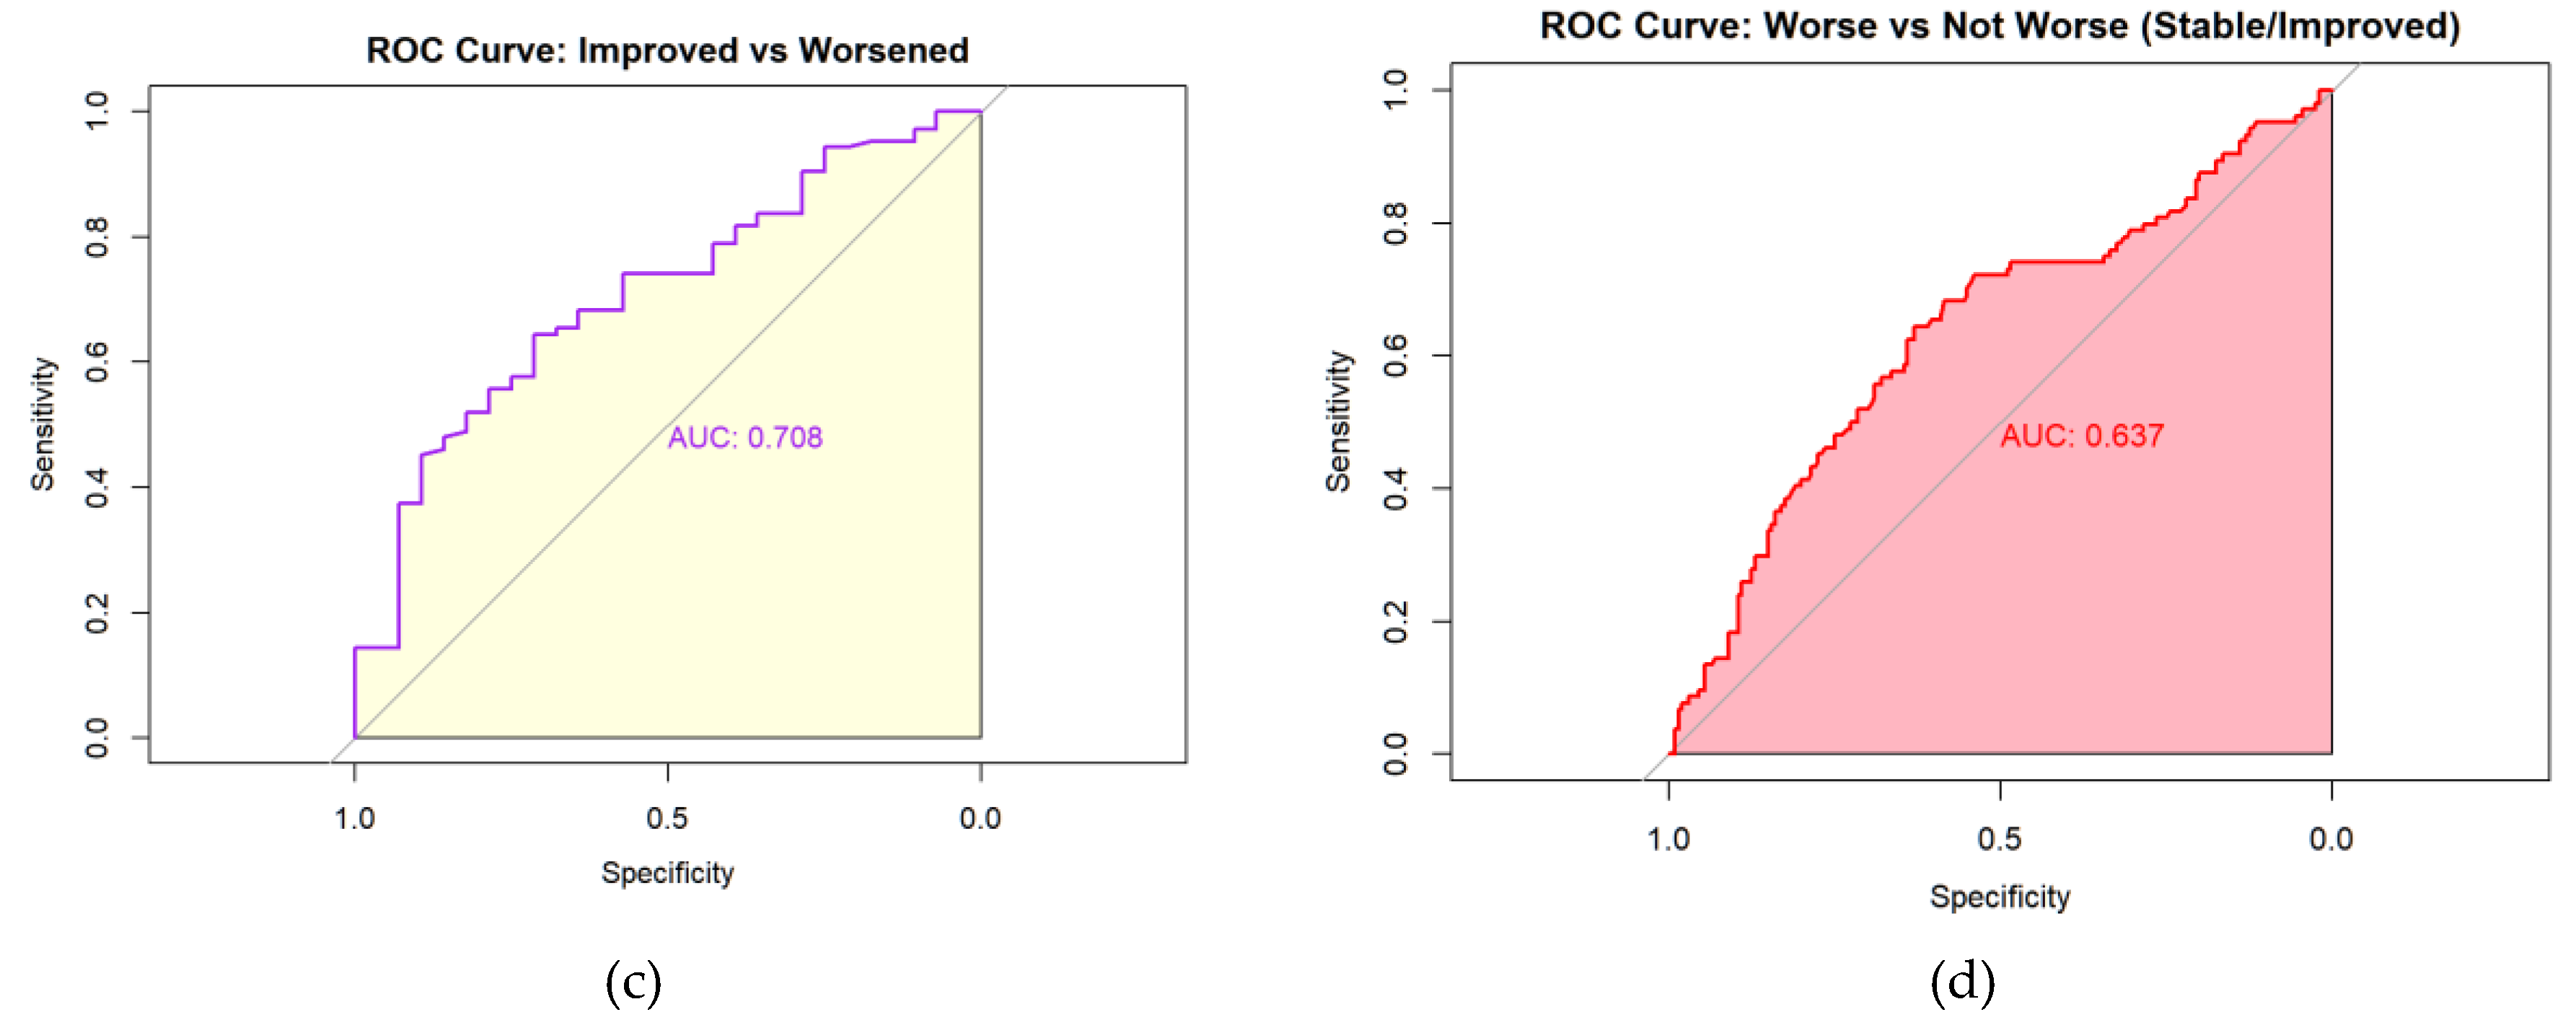
Table 5.
Receiver Operating Characteristic (ROC) Performance Metrics PRO-PD change score classification performance. AUC: Area Under the Curve, Optimal threshold based on Youden’s index. Higher PRO-PD change scores indicate worsening.
Table 5.
Receiver Operating Characteristic (ROC) Performance Metrics PRO-PD change score classification performance. AUC: Area Under the Curve, Optimal threshold based on Youden’s index. Higher PRO-PD change scores indicate worsening.
 |
A substantial proportion of participants reporting stable status demonstrated large PRO-PD changes, suggesting potential recall bias or response shift in anchor-based self-assessment. Accordingly, some misclassification may reflect limitations of patient-reported anchors rather than scale performance. Future studies should further refine MCID thresholds using objective clinical anchors. (Table 6)
Over a six-month period, 213 (__%) reported remaining stable (mean change 7 [IQR -65, 133]), 35 (__%) reported improvement (mean change -20.0, [IQR: -192.8, 70], and 142 (__%) worsened (mean change: 106.5, [IQR: -38, 246]. (Figure 7)
To further evaluate whether change in PRO-PD score discriminated among self-reported progression categories, a multinomial logistic regression model was fit with progression status (improved, stable, worsened) as the outcome and 6-month change in PRO-PD as the predictor, using the stable group as the reference. Greater increases in PRO-PD score were significantly associated with higher odds of being classified as worsened versus stable (OR = 1.002 per unit increase; p = 0.0028). In contrast, increasing PRO-PD change scores were associated with lower odds of being classified as improved versus stable, although this association did not reach conventional statistical significance (OR = 0.998; p = 0.055). These findings were concordant with non-parametric analyses, in which overall group differences were significant (Kruskal–Wallis p < 0.001), and pairwise comparisons demonstrated significant separation between stable and worsened groups (Holm-adjusted p = 0.0015), but weaker discrimination between improved and stable participants. Consistency across analytical approaches supports the construct validity of PRO-PD change scores for differentiating patient-perceived worsening, with more modest sensitivity for detecting improvement over a 6-month interval.
Table 7.
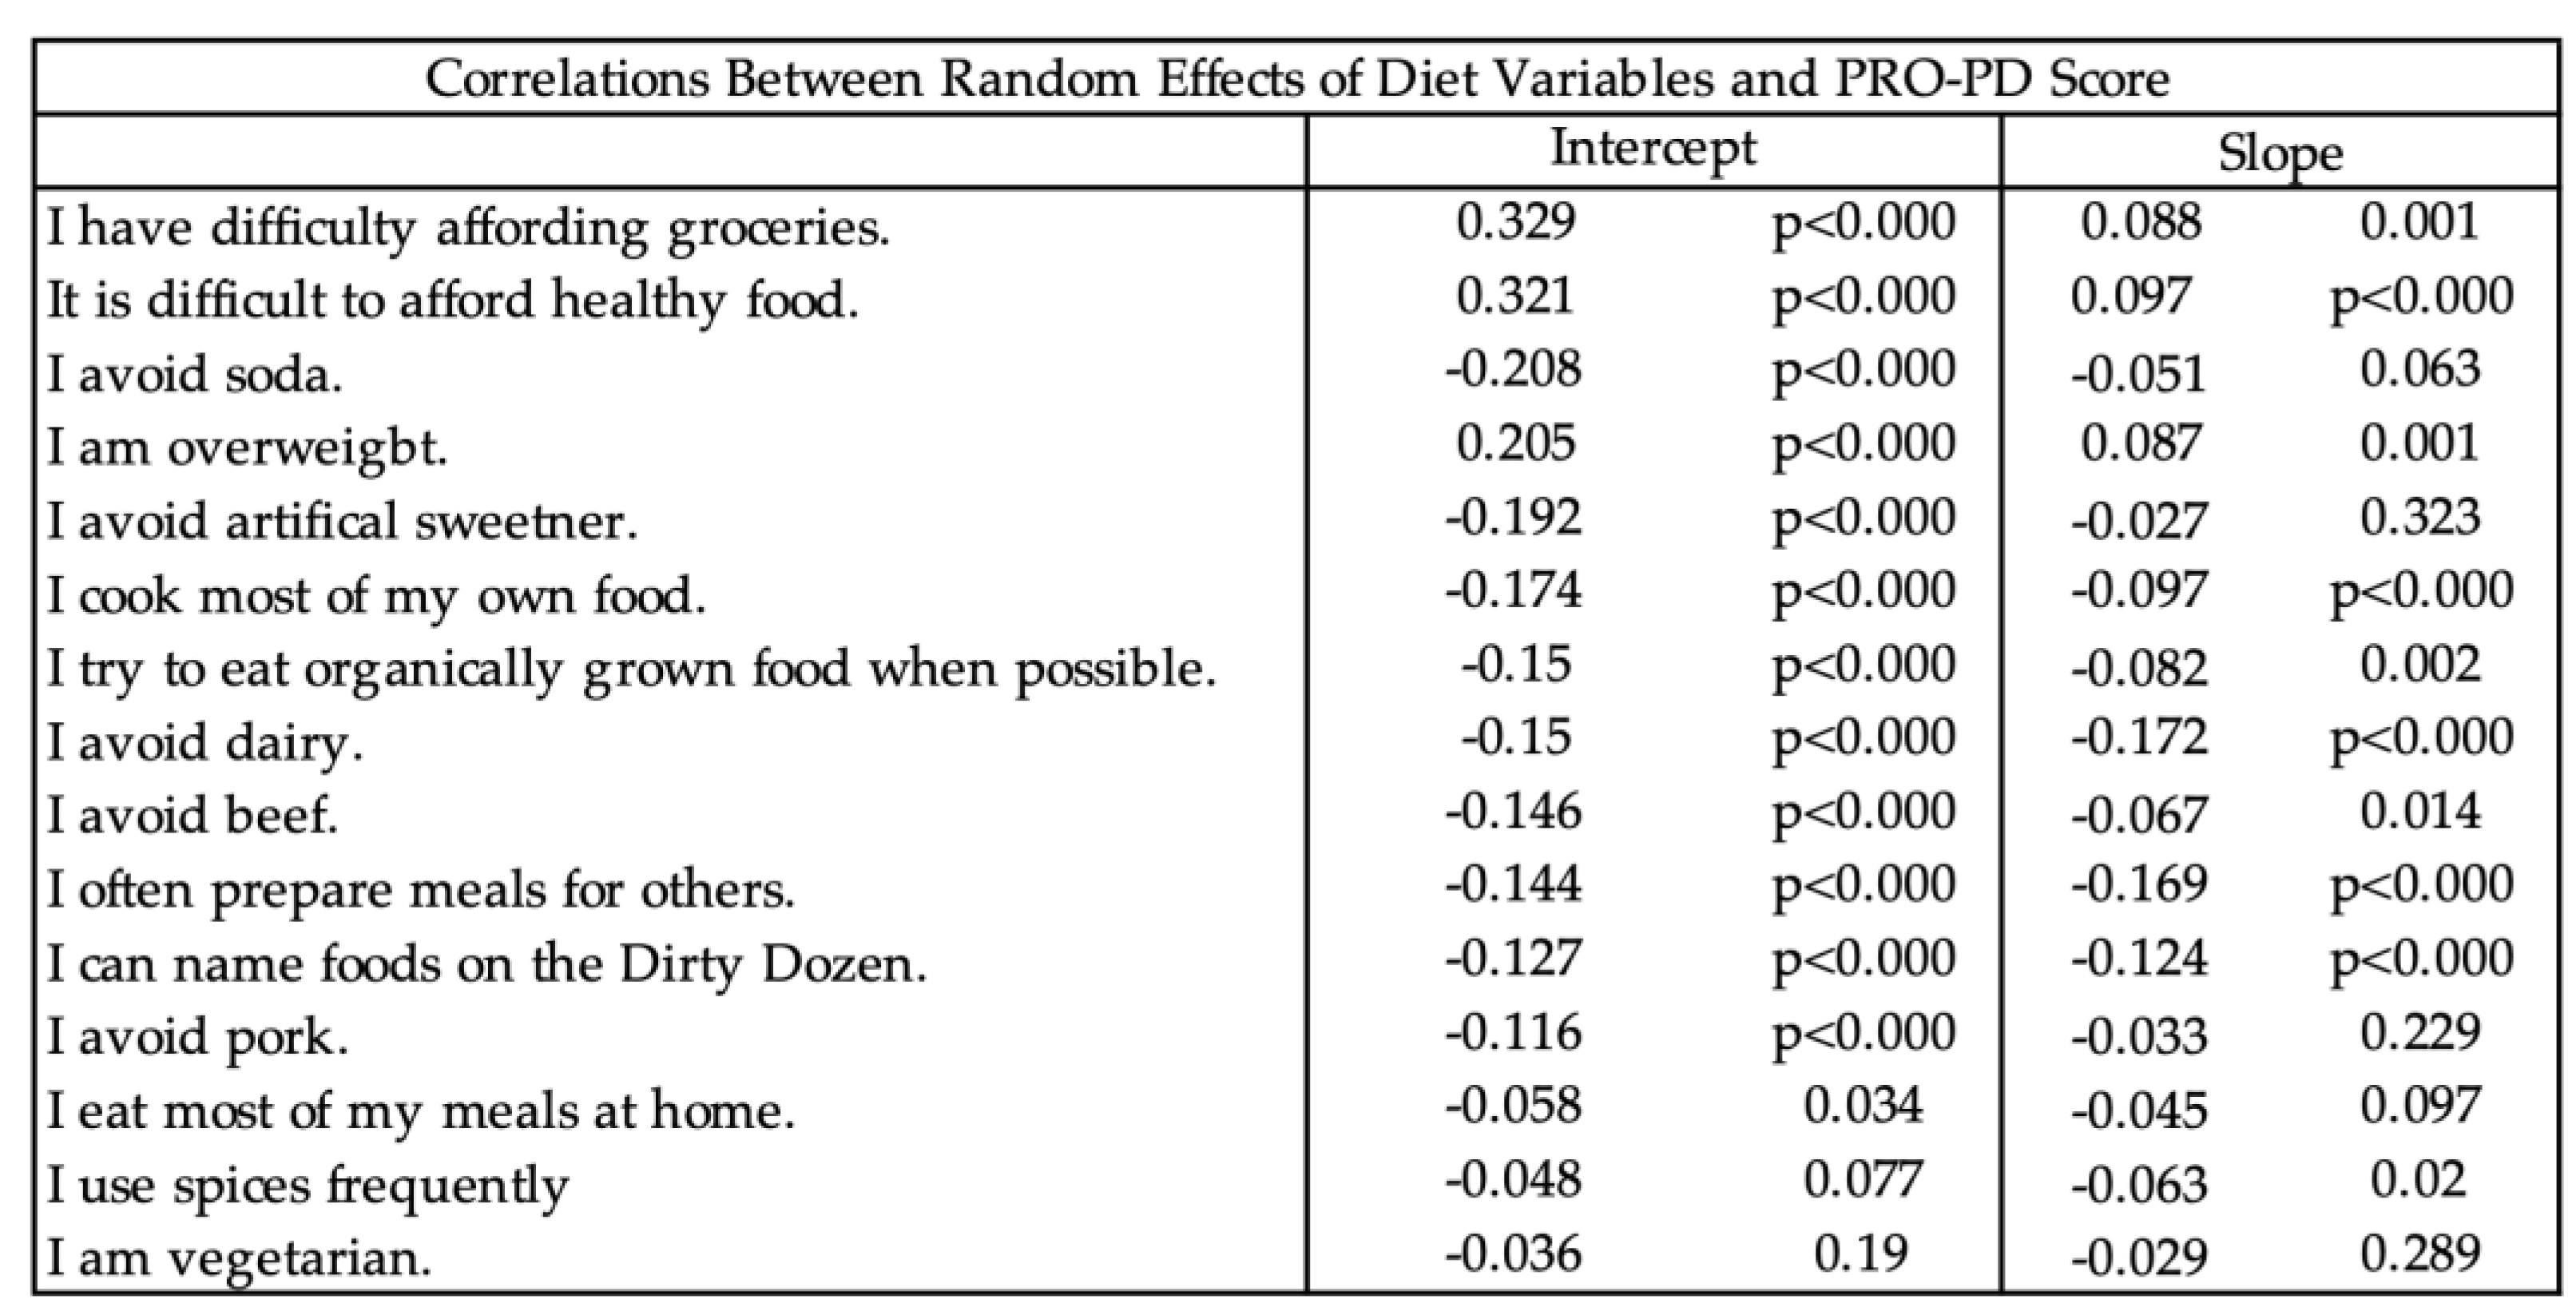
Correlations between random effects of diet and PRO-PD scores.
 |
PRO-PD is Sensitive to Diet As described in the Methods, the correlation between the PRO-PD in time and binary diet predictors was examined.
Joint modeling analyses revealed consistent associations between dietary behaviors and PRO-PD symptom burden across cross-sectional and longitudinal domains (Figure 8). Panel (8a) shows that baseline dietary behaviors were strongly associated with baseline PRO-PD intercepts, with food insecurity, grocery affordability constraints, and overweight status correlating with greater symptom severity, while cooking, meal preparation, organic food consumption, and avoidance of soda, sweeteners, dairy, and red meat were associated with lower baseline PRO-PD scores. Panel (8b) demonstrates that longitudinal changes in dietary behaviors tracked with PRO-PD slopes over time, such that worsening food access and affordability were associated with faster symptom progression, whereas increased engagement in health-promoting dietary behaviors was associated with slower progression. Panels (8c) and (8d) further support temporal coupling, showing that baseline dietary behaviors were associated with subsequent PRO-PD slopes and that changes in diet were linked to later symptom levels, respectively. Across all panels, effect directions were highly consistent and aligned with nutritional plausibility, with stronger and more reliable associations observed for behaviors related to food access and meal preparation. Together, these findings indicate that PRO-PD is sensitive to both nutritional status and dietary change over time, supporting its utility as an outcome measure for diet-focused Parkinson’s disease research.
Figure 8.
Cross-validation between PRO-PD intercepts and diet items. (a) Baseline Diet and Baseline PRO-PD Severity (PRO-PD Intercept ~ Diet Intercept), (b) Change in Diet and PRO-PD Progression Rate (PRO-PD Slope ~ Diet Slope), (c) Baseline Diet and Subsequent PRO-PD Progression (PRO-PD Slope ~ Diet Intercept), (d) Baseline PRO-PD Severity and Subsequent Dietary Change (PRO-PD Intercept ~ Diet Slope). The high reliability (HighPos/HighNeg) is the reliability >80% meaning the significant correlation for more than 80% CV samples. Moderate reliability (ModeratePos/ModerateNeg) is reliability>50% and low below 50%.
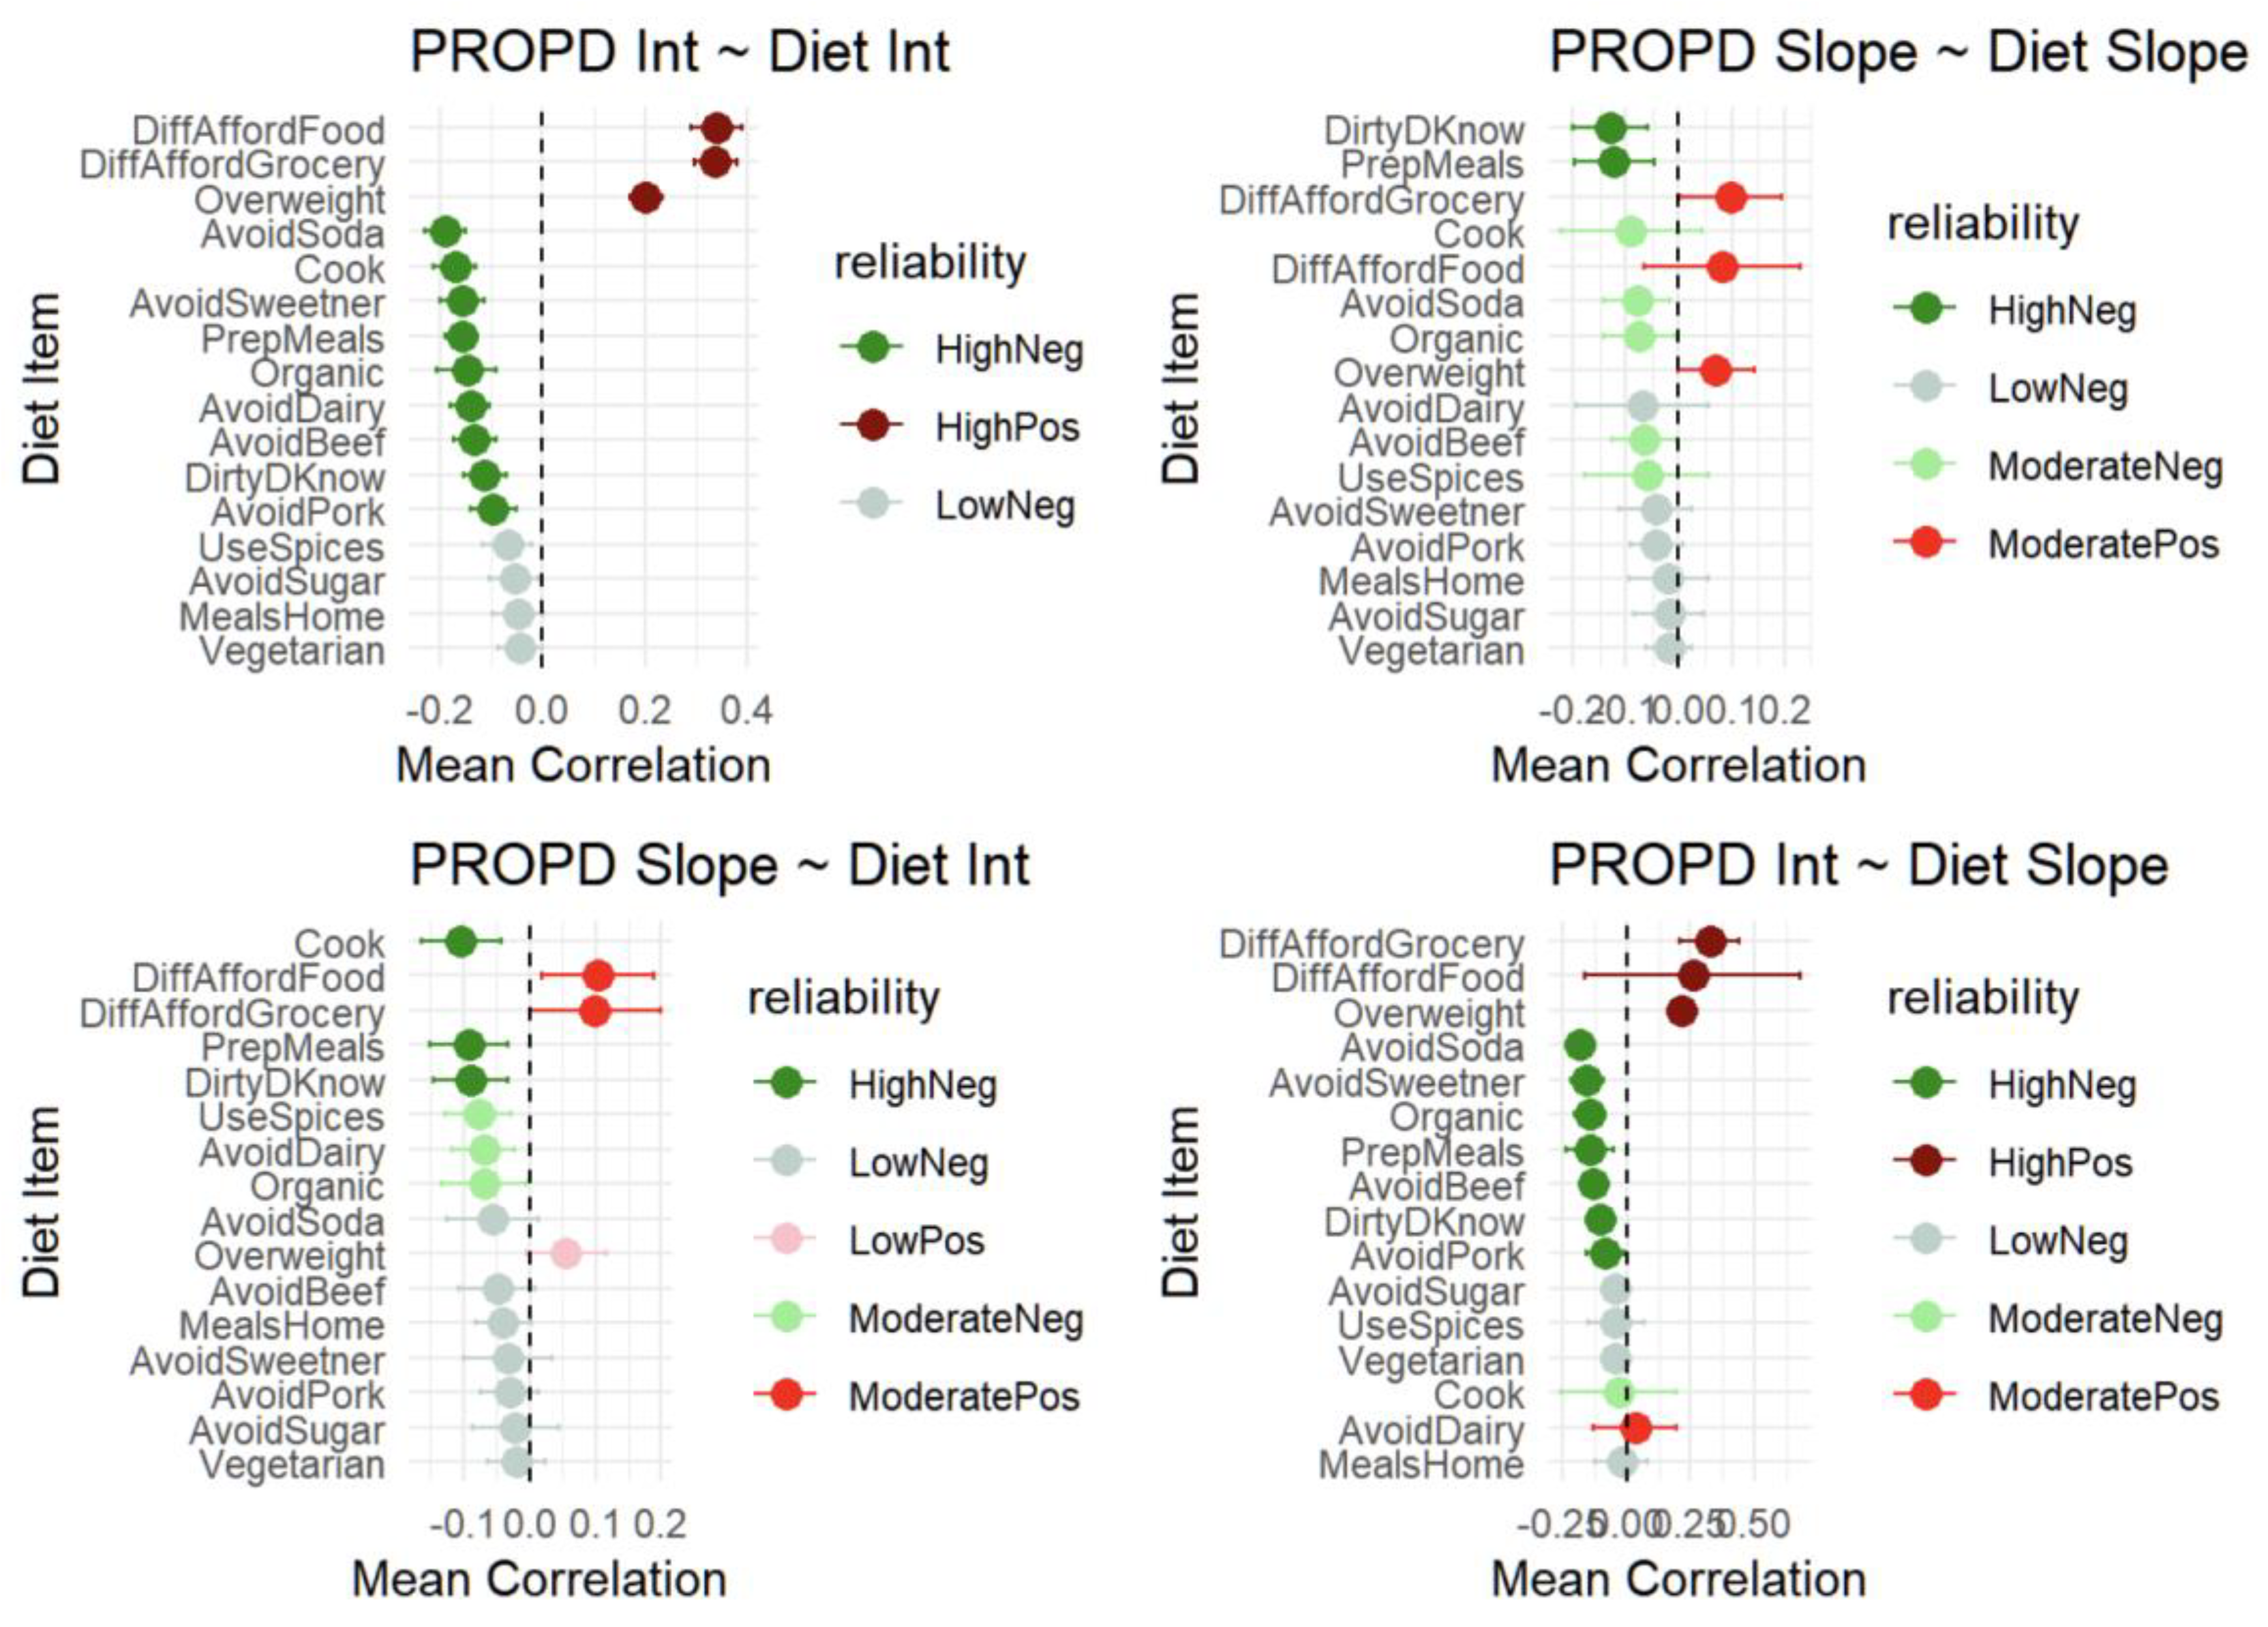
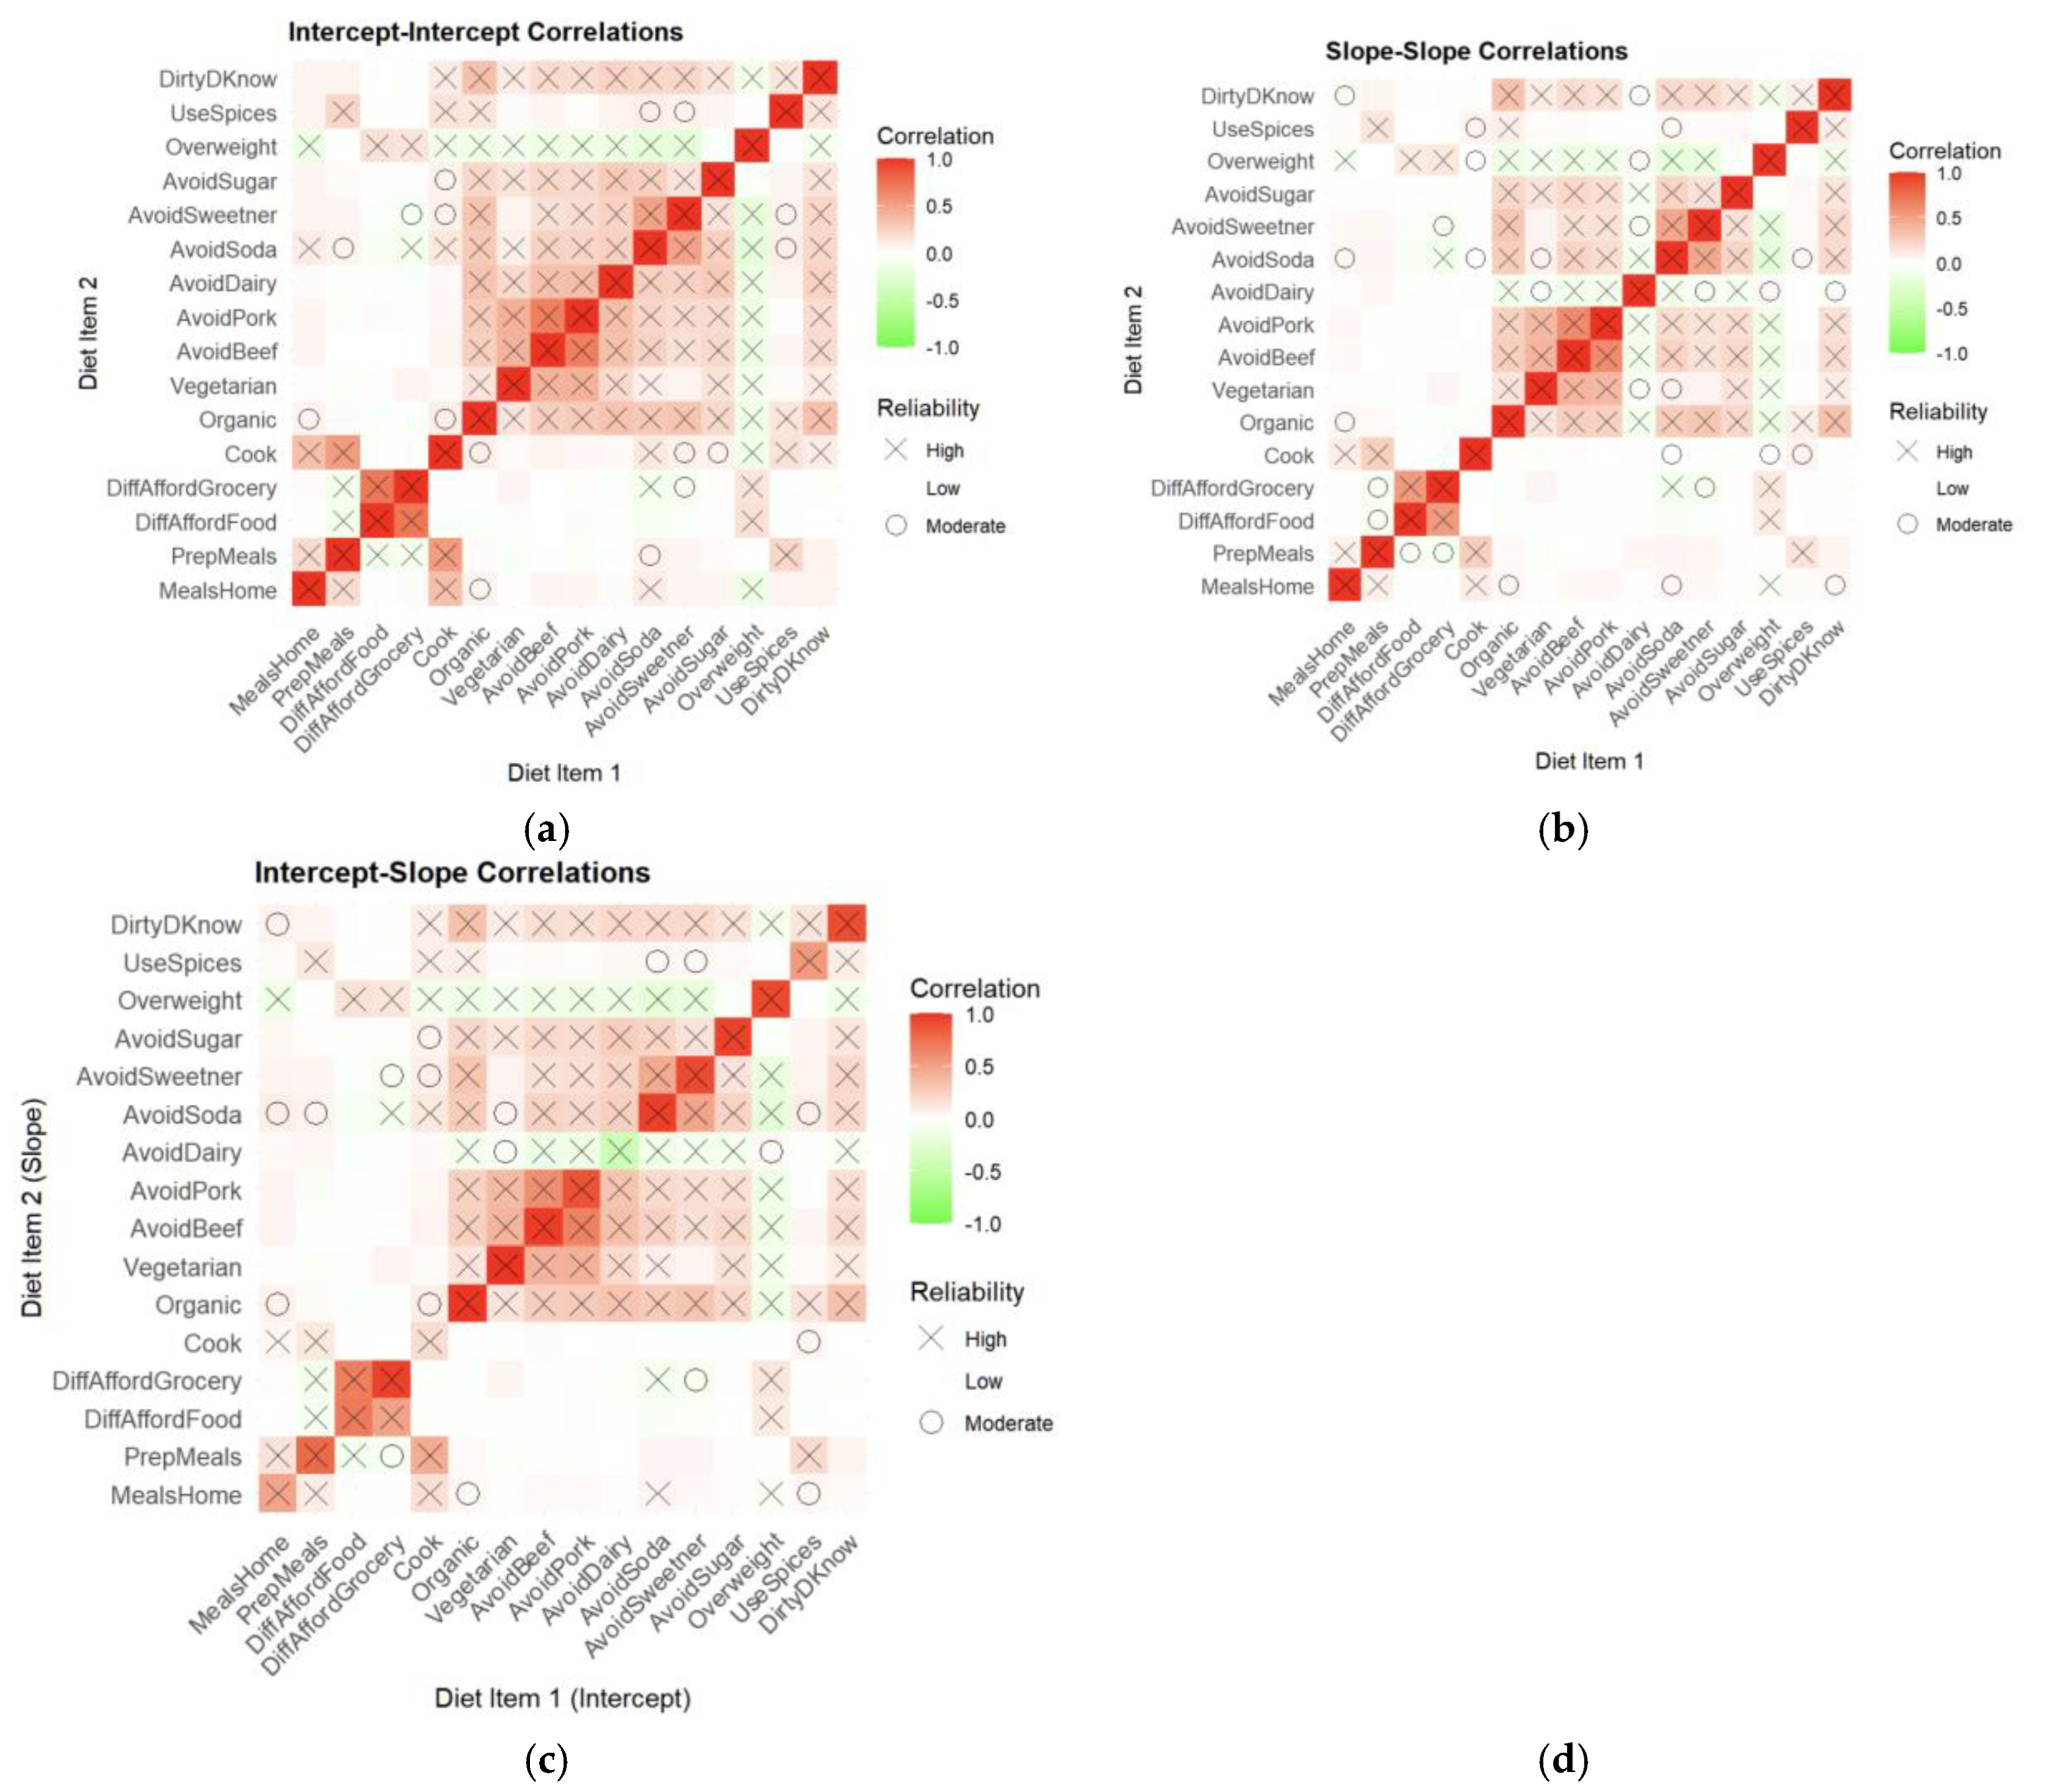
Figure 9.
Correlations between dietary behaviors and PRO-PD intercepts and slopes derived from joint modeling. (a) Intercept–intercept correlations illustrating associations between baseline dietary behaviors and baseline PRO-PD symptom severity, (b) Slope–slope correlations illustrating concurrent associations between changes in dietary behaviors and changes in PRO-PD over time, reflecting coordinated longitudinal trajectories, (c) Intercept–slope correlations illustrating associations between baseline dietary behaviors and subsequent PRO-PD progression, consistent with baseline diet predicting later symptom change. Color intensity reflects correlation magnitude, and symbols indicate reliability across cross-validation folds.
4. Conclusions
This study provides the first comprehensive psychometric validation of the PRO-PD as a patient-reported outcome measure capable of detecting clinically meaningful change in PD, with particular relevance to nutrition- and lifestyle-based research. Across two independent datasets, the PRO-PD demonstrated excellent internal consistency, good temporal stability, strong convergent validity with established clinical scales, and robust known-groups validity. Importantly, the scale captured symptom burden across motor and non-motor domains, aligning with contemporary views of PD as a multisystem condition and addressing key limitations of motor-centric outcome measures.
Factor analytic findings support a parsimonious four-domain structure encompassing cognitive, autonomic, motor, and psycho-emotional symptoms. Although this structure explained less variance than the previously proposed eight-factor model, it demonstrated superior interpretability and construct validity under confirmatory testing. This trade-off reflects a well-recognized psychometric principle: variance maximization alone does not ensure meaningful latent structure. The resulting domains map closely to symptom clusters commonly targeted by dietary patterns, nutritional status, and nutraceutical exposures, reinforcing the relevance of PRO-PD for nutrition-focused investigations.
Anchor-based analyses established asymmetric MCIC thresholds, with smaller changes required to detect worsening than improvement, a pattern consistent with prior PD studies and patient-reported outcome research more broadly. The moderate discrimination observed for improvement likely reflects both biological asymmetry and limitations of global recall anchors, rather than inadequate scale sensitivity. The strong concordance between non-parametric, multinomial, and ROC-based methods supports the robustness of the identified thresholds and provides practical benchmarks for interpreting longitudinal change in interventional studies.
Crucially, joint modeling analyses demonstrated that PRO-PD is sensitive to both baseline dietary behaviors and dietary change over time, with consistent and nutritionally plausible associations observed across intercept–intercept, slope–slope, and cross-lagged relationships. Indicators of food insecurity and affordability were associated with higher symptom burden and faster progression, whereas preparing meals for others, cooking at home, and preferential consumption of organic food tracked with lower severity and slower progression. Avoidance of beef, pork, and dairy showed modest associations with symptom burden, but these effects were smaller and less consistent than those related to food security, pesticide avoidance, preparation, and engagement. Together, these findings position the PRO-PD as a uniquely suited outcome measure for diet, nutrition and nutraceutical research in Parkinson’s disease, capable of capturing patient-perceived effects of dietary exposures that are unlikely to be detected by traditional clinical scales.
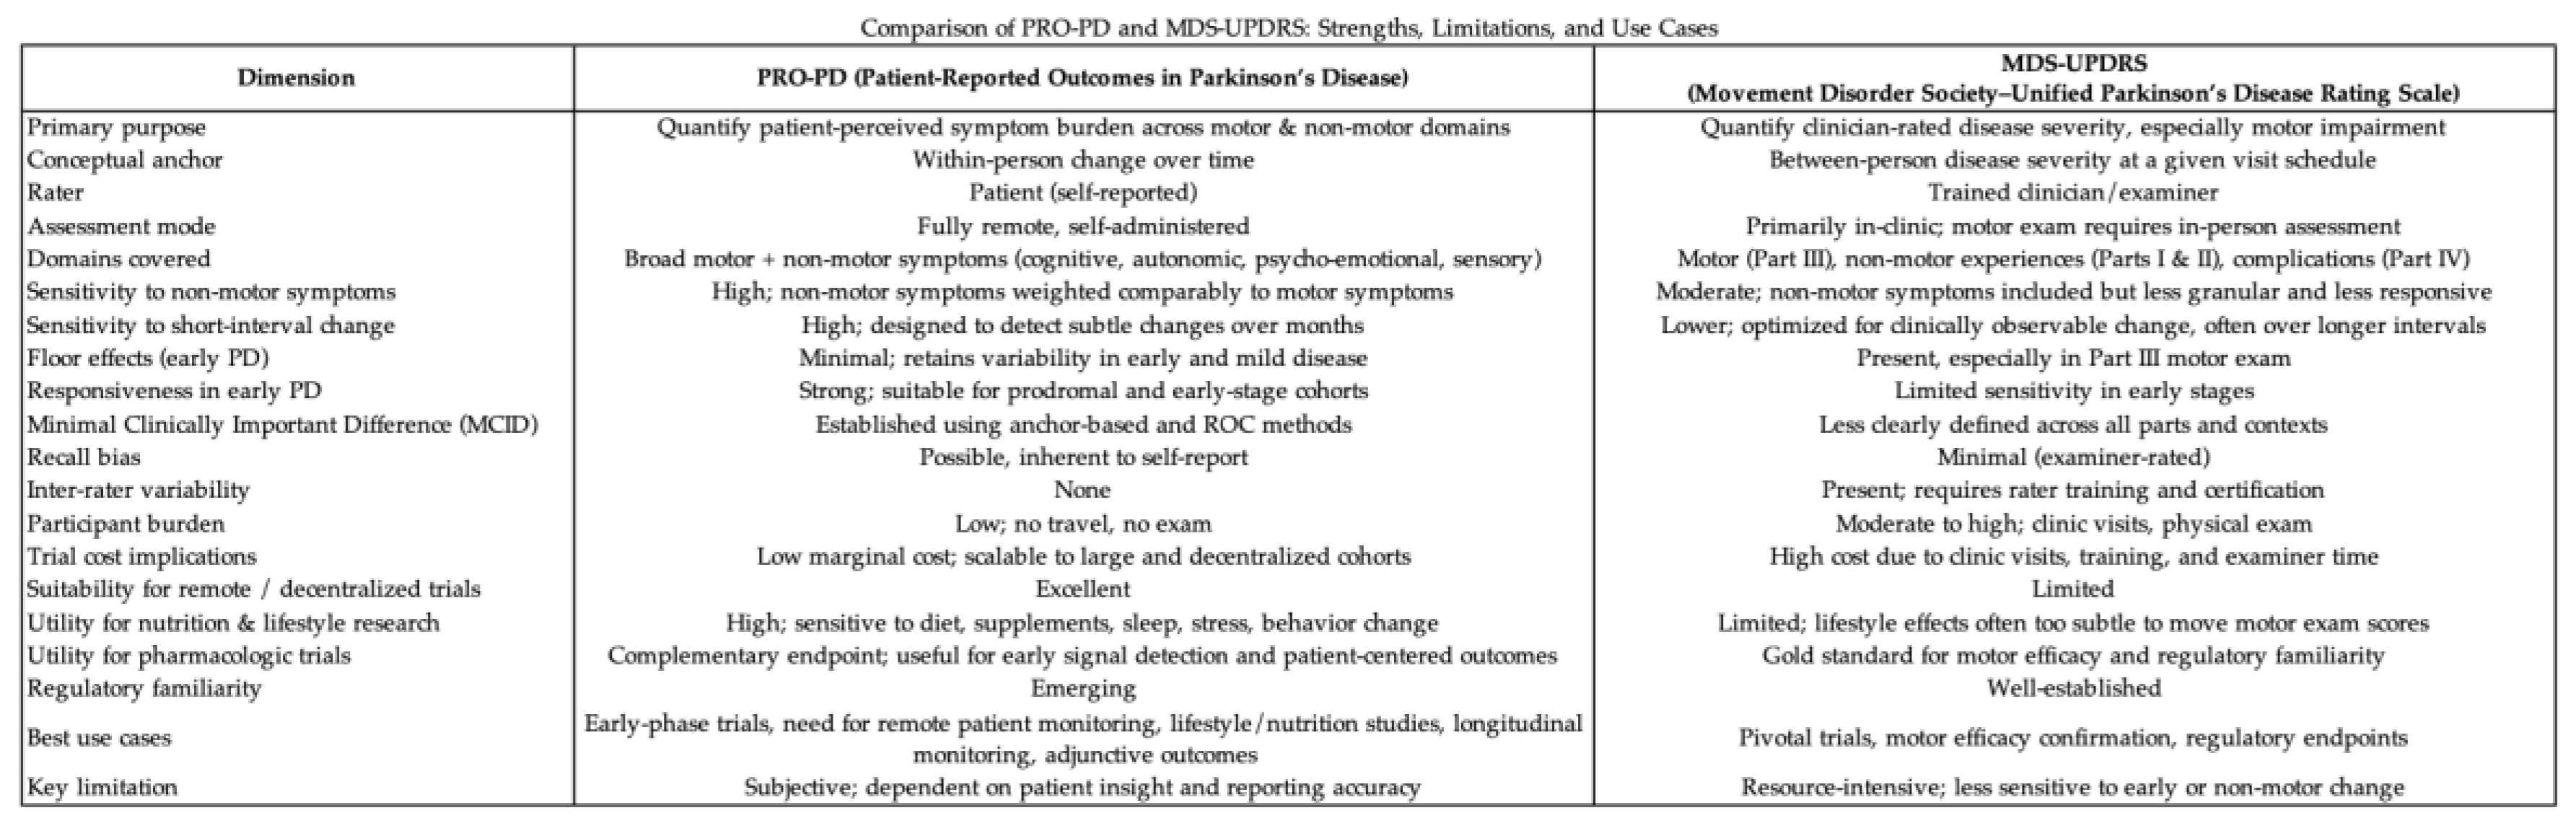
A comparison of strengths, limitations, and recommended use cases for PRO-PD, compared to the current gold standard, MDS-UPDRS.
Table 8.
Strengths and limitations of PRO-PD compared to gold standard.
 |
The PRO-PD demonstrates strong psychometric performance and sensitivity to clinically meaningful change in PD. Its responsiveness to dietary and nutritional exposures, feasibility for remote patient monitoring, and absence of pronounced floor effects support its utility as a patient-centered outcome measure across the disease spectrum, including early PD. These properties position PRO-PD as a tool for nutrition, nutraceutical, and pharmacologic intervention studies, where scalable, low-burden measures may enhance signal detection and reduce reliance on frequent in-clinic assessments.
5. Intellectual Property
LK Mischley owns the copyright of the Patient-Reported Outcomes in Parkinson’s Disease (PRO-PD) scale, which was made freely available for these research projects.
Author Contributions
“Conceptualization, L.K.M.; methodology, M.M.; software, M.M.; validation, M.M; formal analysis, M.M.; investigation, L.K.M. and M.M..; resources, L.K.M.; data curation, L.K.M.; writing—original draft preparation, L.K.M.; writing—review and editing, M.M.; visualization, M.M; supervision, L.K.M..; project administration, L.K.M..; funding acquisition, L.K.M. All authors have read and agreed to the published version of the manuscript.
Funding
This research was funded by the generous donations from individuals and families impacted by Parkinson’s disease.
Institutional Review Board Statement
The study was conducted in accordance with the Declaration of Helsinki and approved by Bastyr University Institutional Review Board (IRB #11A-1301). The protocol was registered at ClinicalTrials.gov (NCT02194816), and a waiver of documentation of informed consent was approved for this project.
Informed Consent Statement
Informed consent was obtained from all subjects involved in the study prior to enrollment.
Data Availability Statement
Data will be made available to qualified researchers upon request, with approval of the University.
Acknowledgments
During the preparation of this manuscript/study, the authors used ChatGPT, (version 5.2) to assist with text clarity and conciseness. The authors have reviewed and edited the output and take full responsibility for the content of this publication.
Conflicts of Interest
LK Mischley owns the copyright of the PRO-PD, the scale has been used freely. The authors declare no other conflicts of interest.
References
- Su, D. Projections for prevalence of Parkinson’s disease and its driving factors in 195 countries and territories to 2050: modelling study of Global Burden of Disease Study 2021. BMJ 2025, 388, e080952. [Google Scholar] [CrossRef] [PubMed]
- Tanner, C.M. J.L. Ostrem, Parkinson’s Disease. N Engl J Med 2024, 391(5), 442–452. [Google Scholar] [CrossRef] [PubMed]
- Regnault, A. Does the MDS-UPDRS provide the precision to assess progression in early Parkinson’s disease? Learnings from the Parkinson’s progression marker initiative cohort. J Neurol 2019, 266(8), 1927–1936. [Google Scholar] [CrossRef] [PubMed]
- Goetz, C.G. Movement Disorder Society-sponsored revision of the Unified Parkinson’s Disease Rating Scale (MDS-UPDRS): scale presentation and clinimetric testing results. Mov Disord 2008, 23(15), 2129–70. [Google Scholar] [CrossRef] [PubMed]
- Colucci, F. Opicapone in Parkinson’s Disease on Levodopa-Carbidopa Intestinal Gel Treatment: A Pilot, Randomized Study. Mov Disord Clin Pract 2025, 12(11), 2034–2042. [Google Scholar] [CrossRef] [PubMed]
- Wyman, B.T. A double-blind, controlled trial of circadian effective light therapy in patients with Parkinson’s disease. Neurotherapeutics 2025, 22(6), p. e00728. [Google Scholar] [CrossRef] [PubMed]
- Chang, J.W. Phase 1/2a clinical trial of hESC-derived dopamine progenitors in Parkinson’s disease. Cell 2025, 188(25), 7036–7048 e11. [Google Scholar] [CrossRef] [PubMed]
- Mestre, T.A. Patient-centered development of clinical outcome assessments in early Parkinson disease: key priorities and advances. NPJ Parkinsons Dis 2024, 10(1), p. 101. [Google Scholar] [CrossRef] [PubMed]
- Lim, S.Y.; Tan, A.H. Historical perspective: The pros and cons of conventional outcome measures in Parkinson’s disease. Parkinsonism Relat Disord 2018, 46 Suppl 1, S47–S52. [Google Scholar] [CrossRef] [PubMed]
- AlMahadin, G. Parkinson’s disease: current assessment methods and wearable devices for evaluation of movement disorder motor symptoms - a patient and healthcare professional perspective. BMC Neurol 2020, 20(1), 419. [Google Scholar] [CrossRef] [PubMed]
- Administration. Guidance for industry: patient reported outcome measures: use in medical product development to support label claims. 2009 19 Dec 2025. Available online: https://www.fda.gov/media/77832/download.
- Mischley, L.K.; Lau, R.C.; Bennett, R.D. Role of Diet and Nutritional Supplements in Parkinson’s Disease Progression. Oxid Med Cell Longev 2017, 6405278. [Google Scholar] [CrossRef] [PubMed]
- Mischley, L.K.; Murawska, M. Beyond MIND and Mediterranean Diets: Designing a Diet to Optimize Parkinson’s Disease Outcomes. Nutrients 2025, 17(14). [Google Scholar] [CrossRef] [PubMed]
- Fox, D.J.; Park, S.J.; Mischley, L.K. Comparison of Associations between MIND and Mediterranean Diet Scores with Patient-Reported Outcomes in Parkinson’s Disease. Nutrients 2022, 14(23). [Google Scholar] [CrossRef] [PubMed]
- Mischley, L.K. Parkinson Symptom Severity and Use of Nutraceuticals. Nutrients 2023, 15(4). [Google Scholar] [CrossRef] [PubMed]
- Morley, J.F. Physical Activity, Patient-Reported Outcomes, and Quality of Life in Parkinson’s Disease. J Geriatr Psychiatry Neurol 2026, 39(1), 14–23. [Google Scholar] [CrossRef] [PubMed]
- Grover, S. Characterizing sleep-related phenotypes with patient-reported outcomes in Parkinson’s disease. Front Aging Neurosci 2025, 17, 1630150. [Google Scholar] [CrossRef]
- Subramanian, I.; Farahnik, J.; Mischley, L.K. Synergy of pandemics-social isolation is associated with worsened Parkinson severity and quality of life. NPJ Parkinsons Dis 2020, 28. [Google Scholar] [CrossRef] [PubMed]
- Mischley, L.K.; Lau, R.C.; Weiss, N.S. Use of a self-rating scale of the nature and severity of symptoms in Parkinson’s Disease (PRO-PD): Correlation with quality of life and existing scales of disease severity. NPJ Parkinsons Dis 2017, 20. [Google Scholar] [CrossRef] [PubMed]
- von Below, D.; Wallerstedt, S.M.; Bergquist, F. Validation of the Swedish Patient-Reported Outcomes in Parkinson’s Disease Scale in Outpatients. Mov Disord 2023, 38(9), 1668–1678. [Google Scholar] [CrossRef] [PubMed]
- Mischley, L.K. Phase IIb Study of Intranasal Glutathione in Parkinson’s Disease. J Parkinsons Dis 2017, 7(2), 289–299. [Google Scholar] [CrossRef] [PubMed]
Figure 1.
Correlations with Other Scales The 34-item small dataset was used was used to evaluate convergent validity, which was missing ‘restless legs’ variable. These figures show the correlation between PRO-PD scores and (a) Hoehn & Yahr (b) UPDRS total, (c) PROMIS Global quality of life, (d) Nonmotor Symptom Scale, (e) PDQ-39, and (f) MoCA.
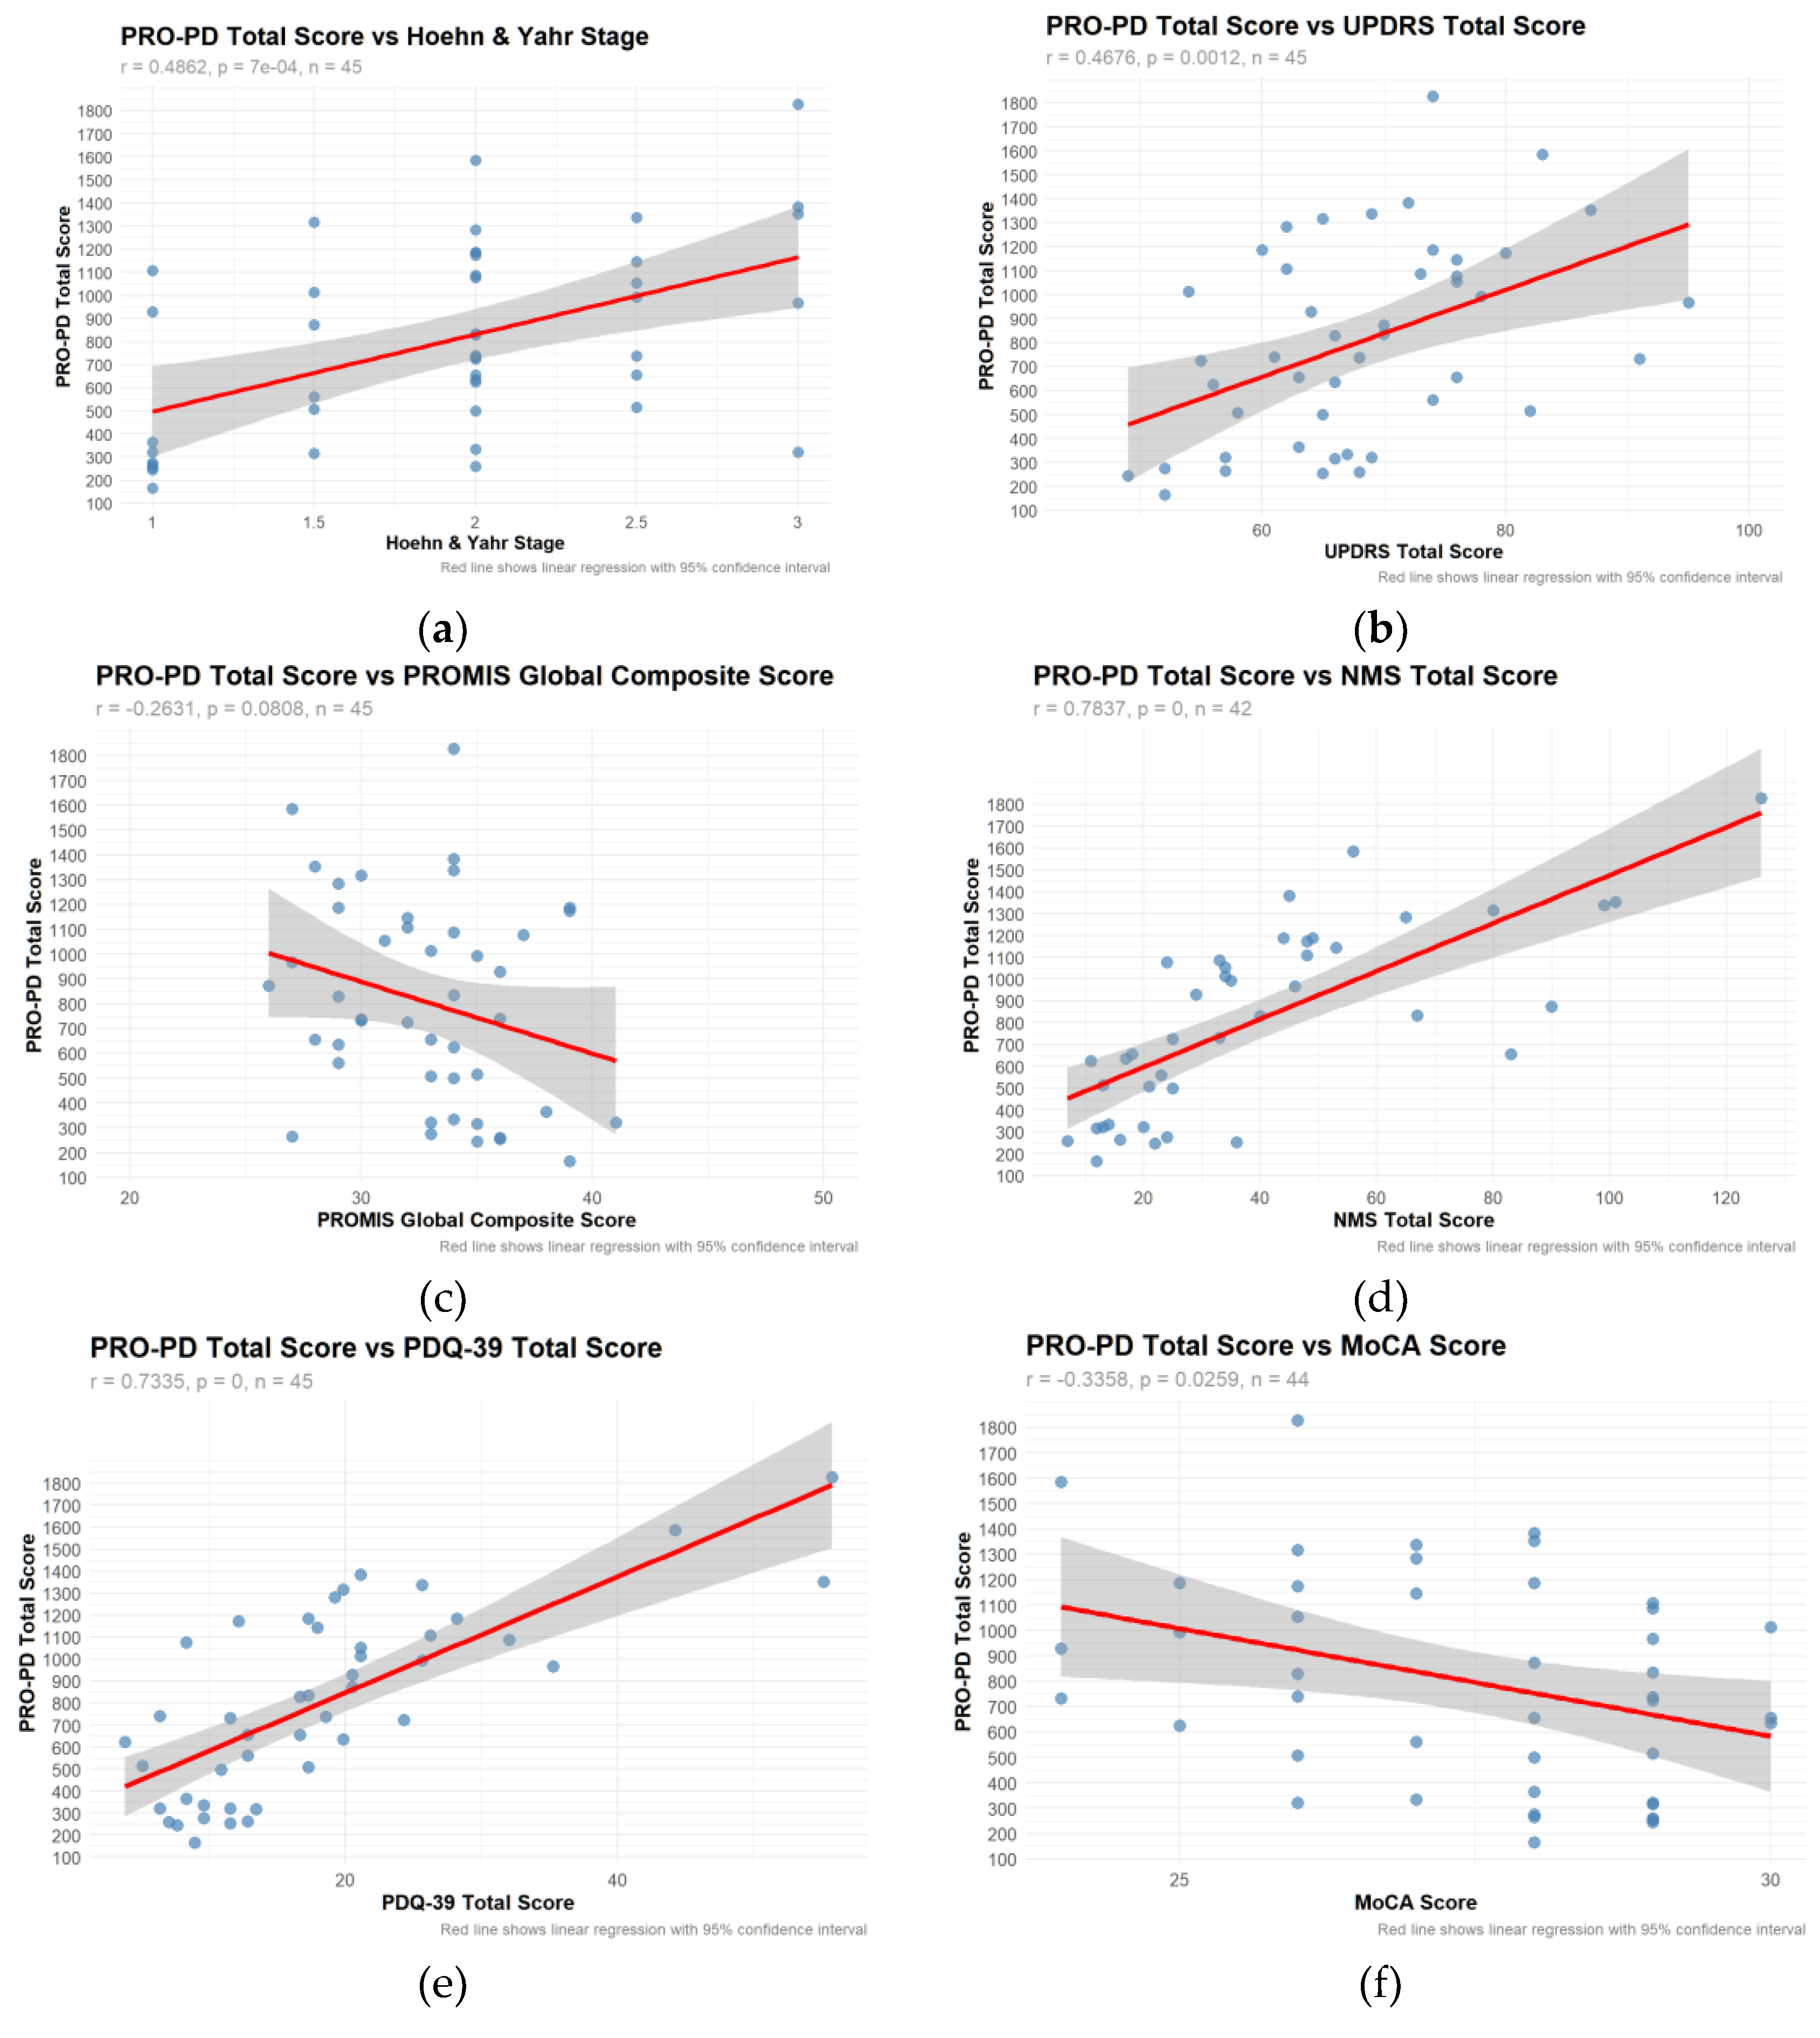
Figure 2.
PRO-PD scores with increasing disease duration. (a) Large dataset: n=26; remote patient monitoring, (b) Small data: n=45; In-person Parkinson specific evaluation.
Figure 2.
PRO-PD scores with increasing disease duration. (a) Large dataset: n=26; remote patient monitoring, (b) Small data: n=45; In-person Parkinson specific evaluation.
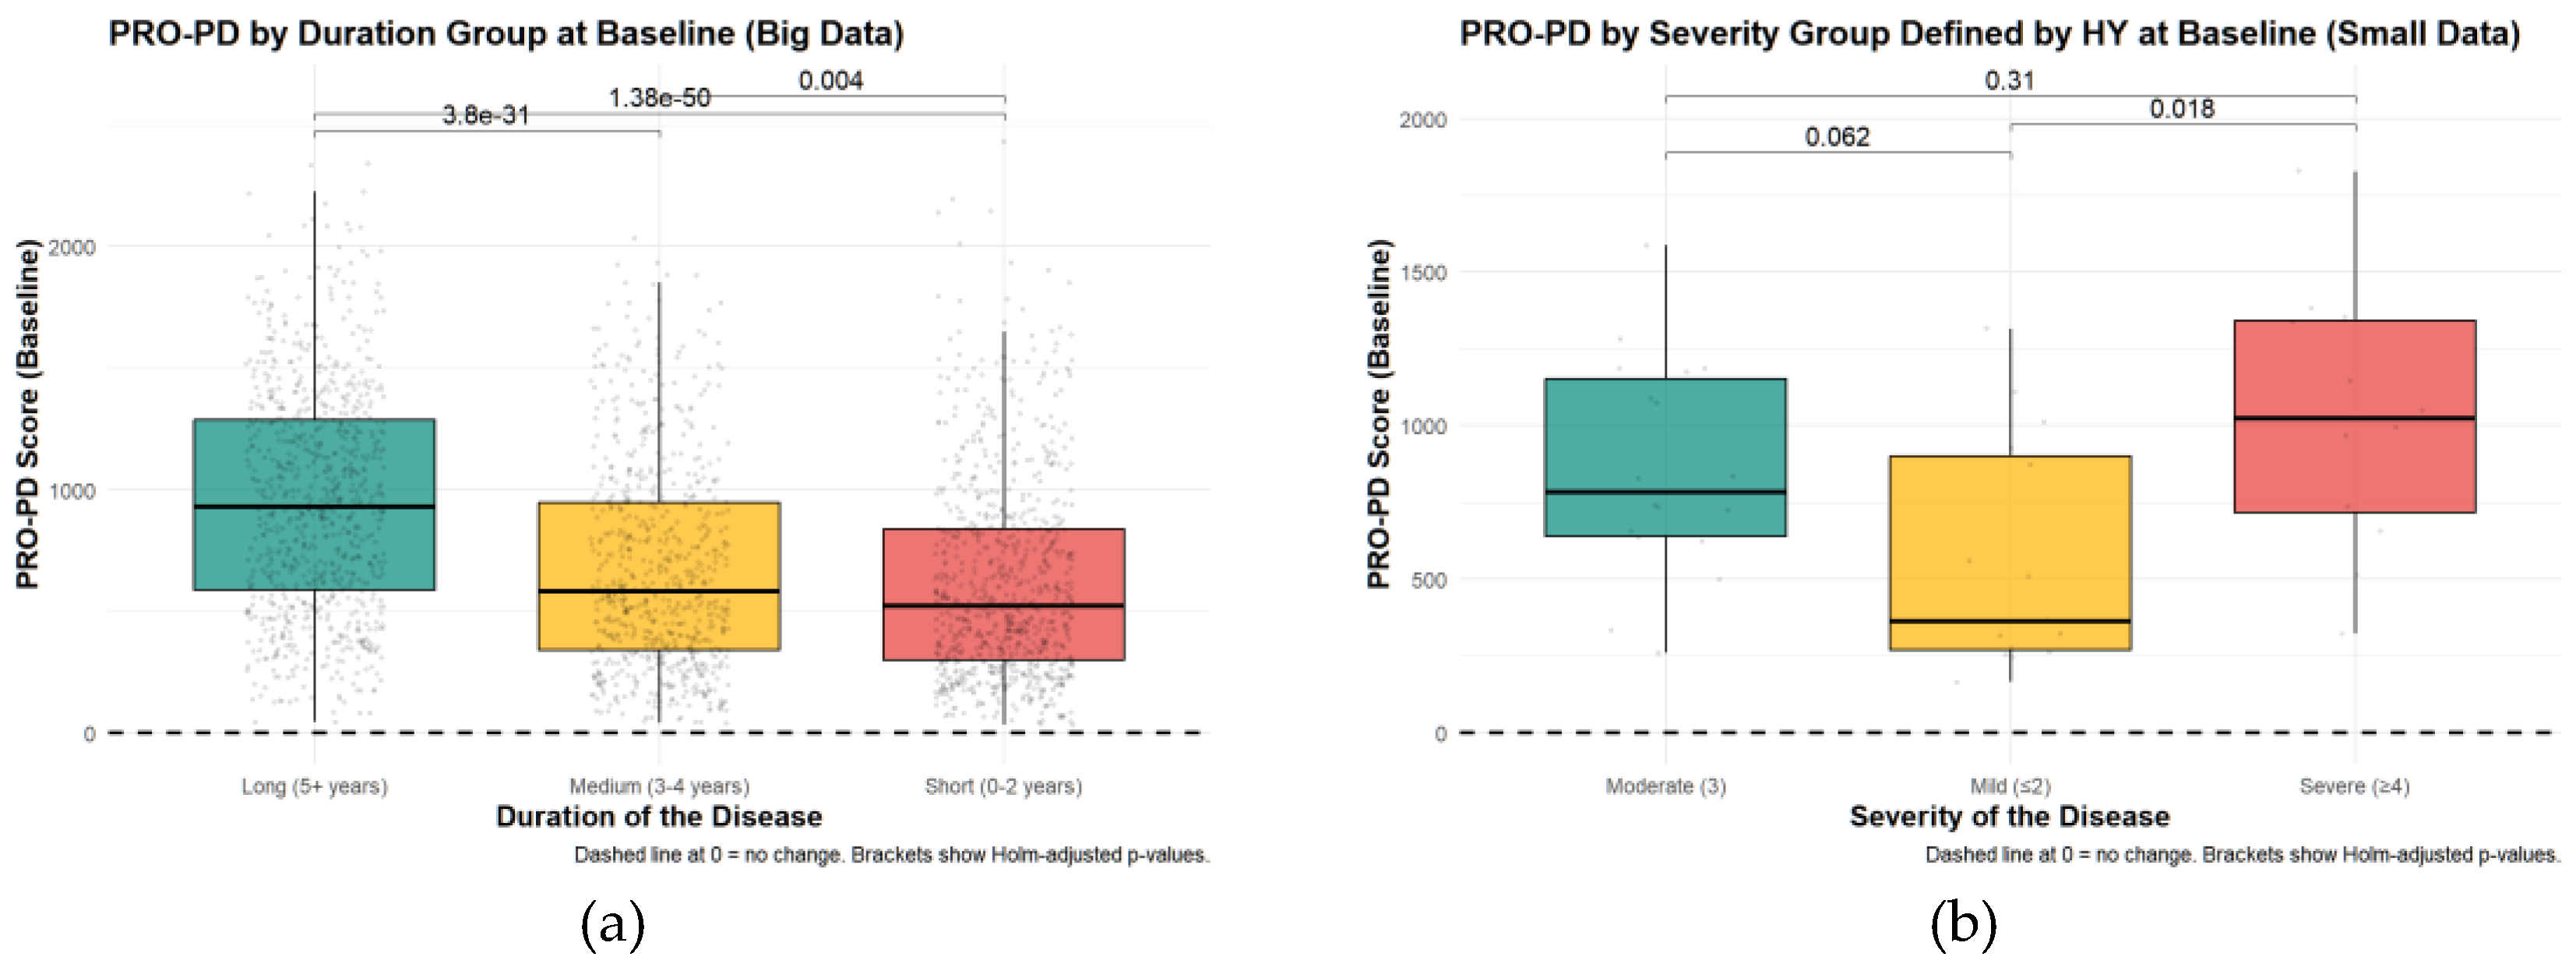
Figure 3.
Patient-Reported Outcomes in Parkinson’s Disease (PRO-PD) scores with increasing disease duration and age. High PRO-PD scores represent greater symptom severity. Disease severity increased with (a) years since diagnosis, and less so with (b) age. .
Figure 3.
Patient-Reported Outcomes in Parkinson’s Disease (PRO-PD) scores with increasing disease duration and age. High PRO-PD scores represent greater symptom severity. Disease severity increased with (a) years since diagnosis, and less so with (b) age. .
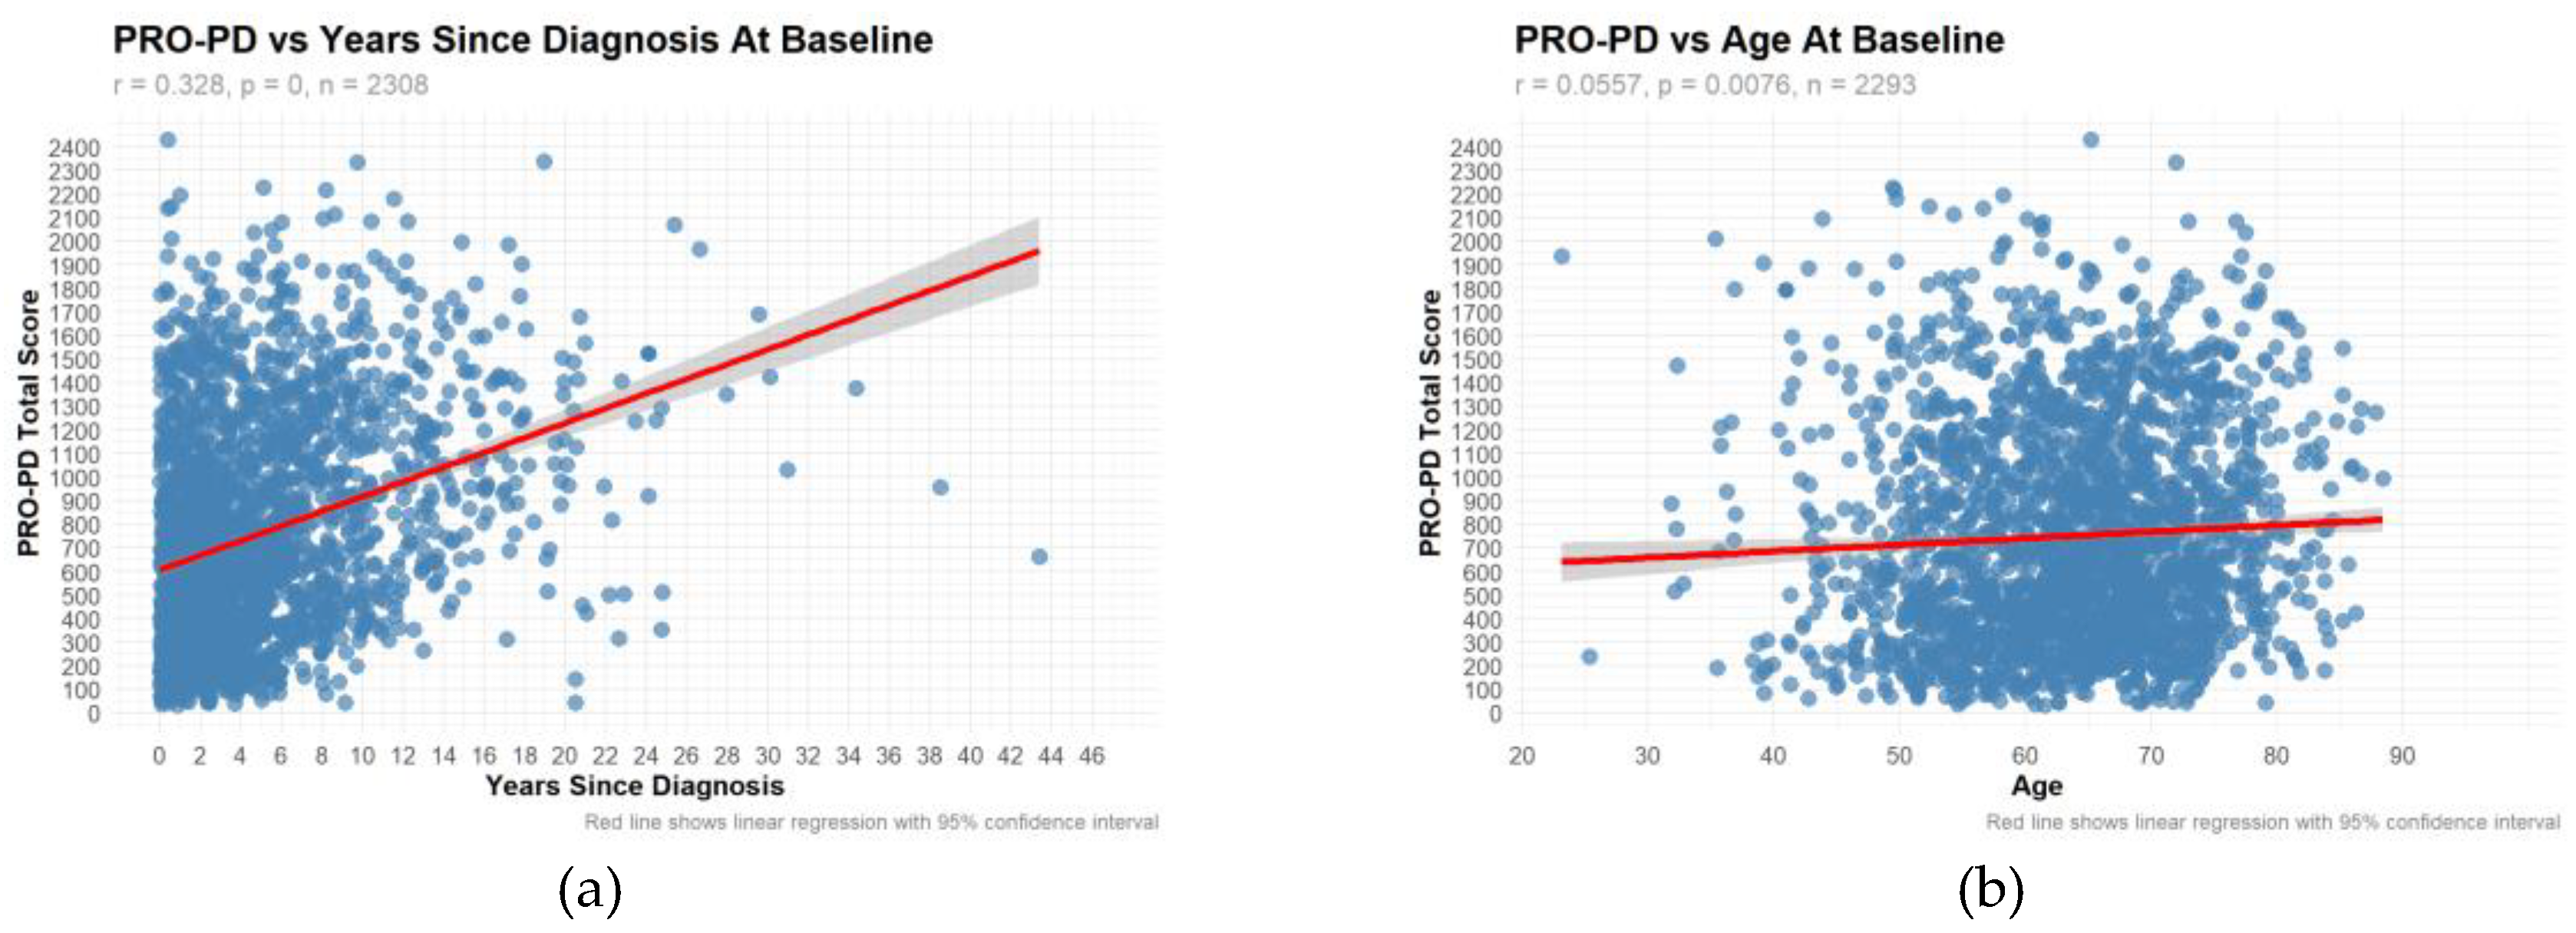
Figure 7.
Histogram of differences in PRO-PD at six months from baseline.
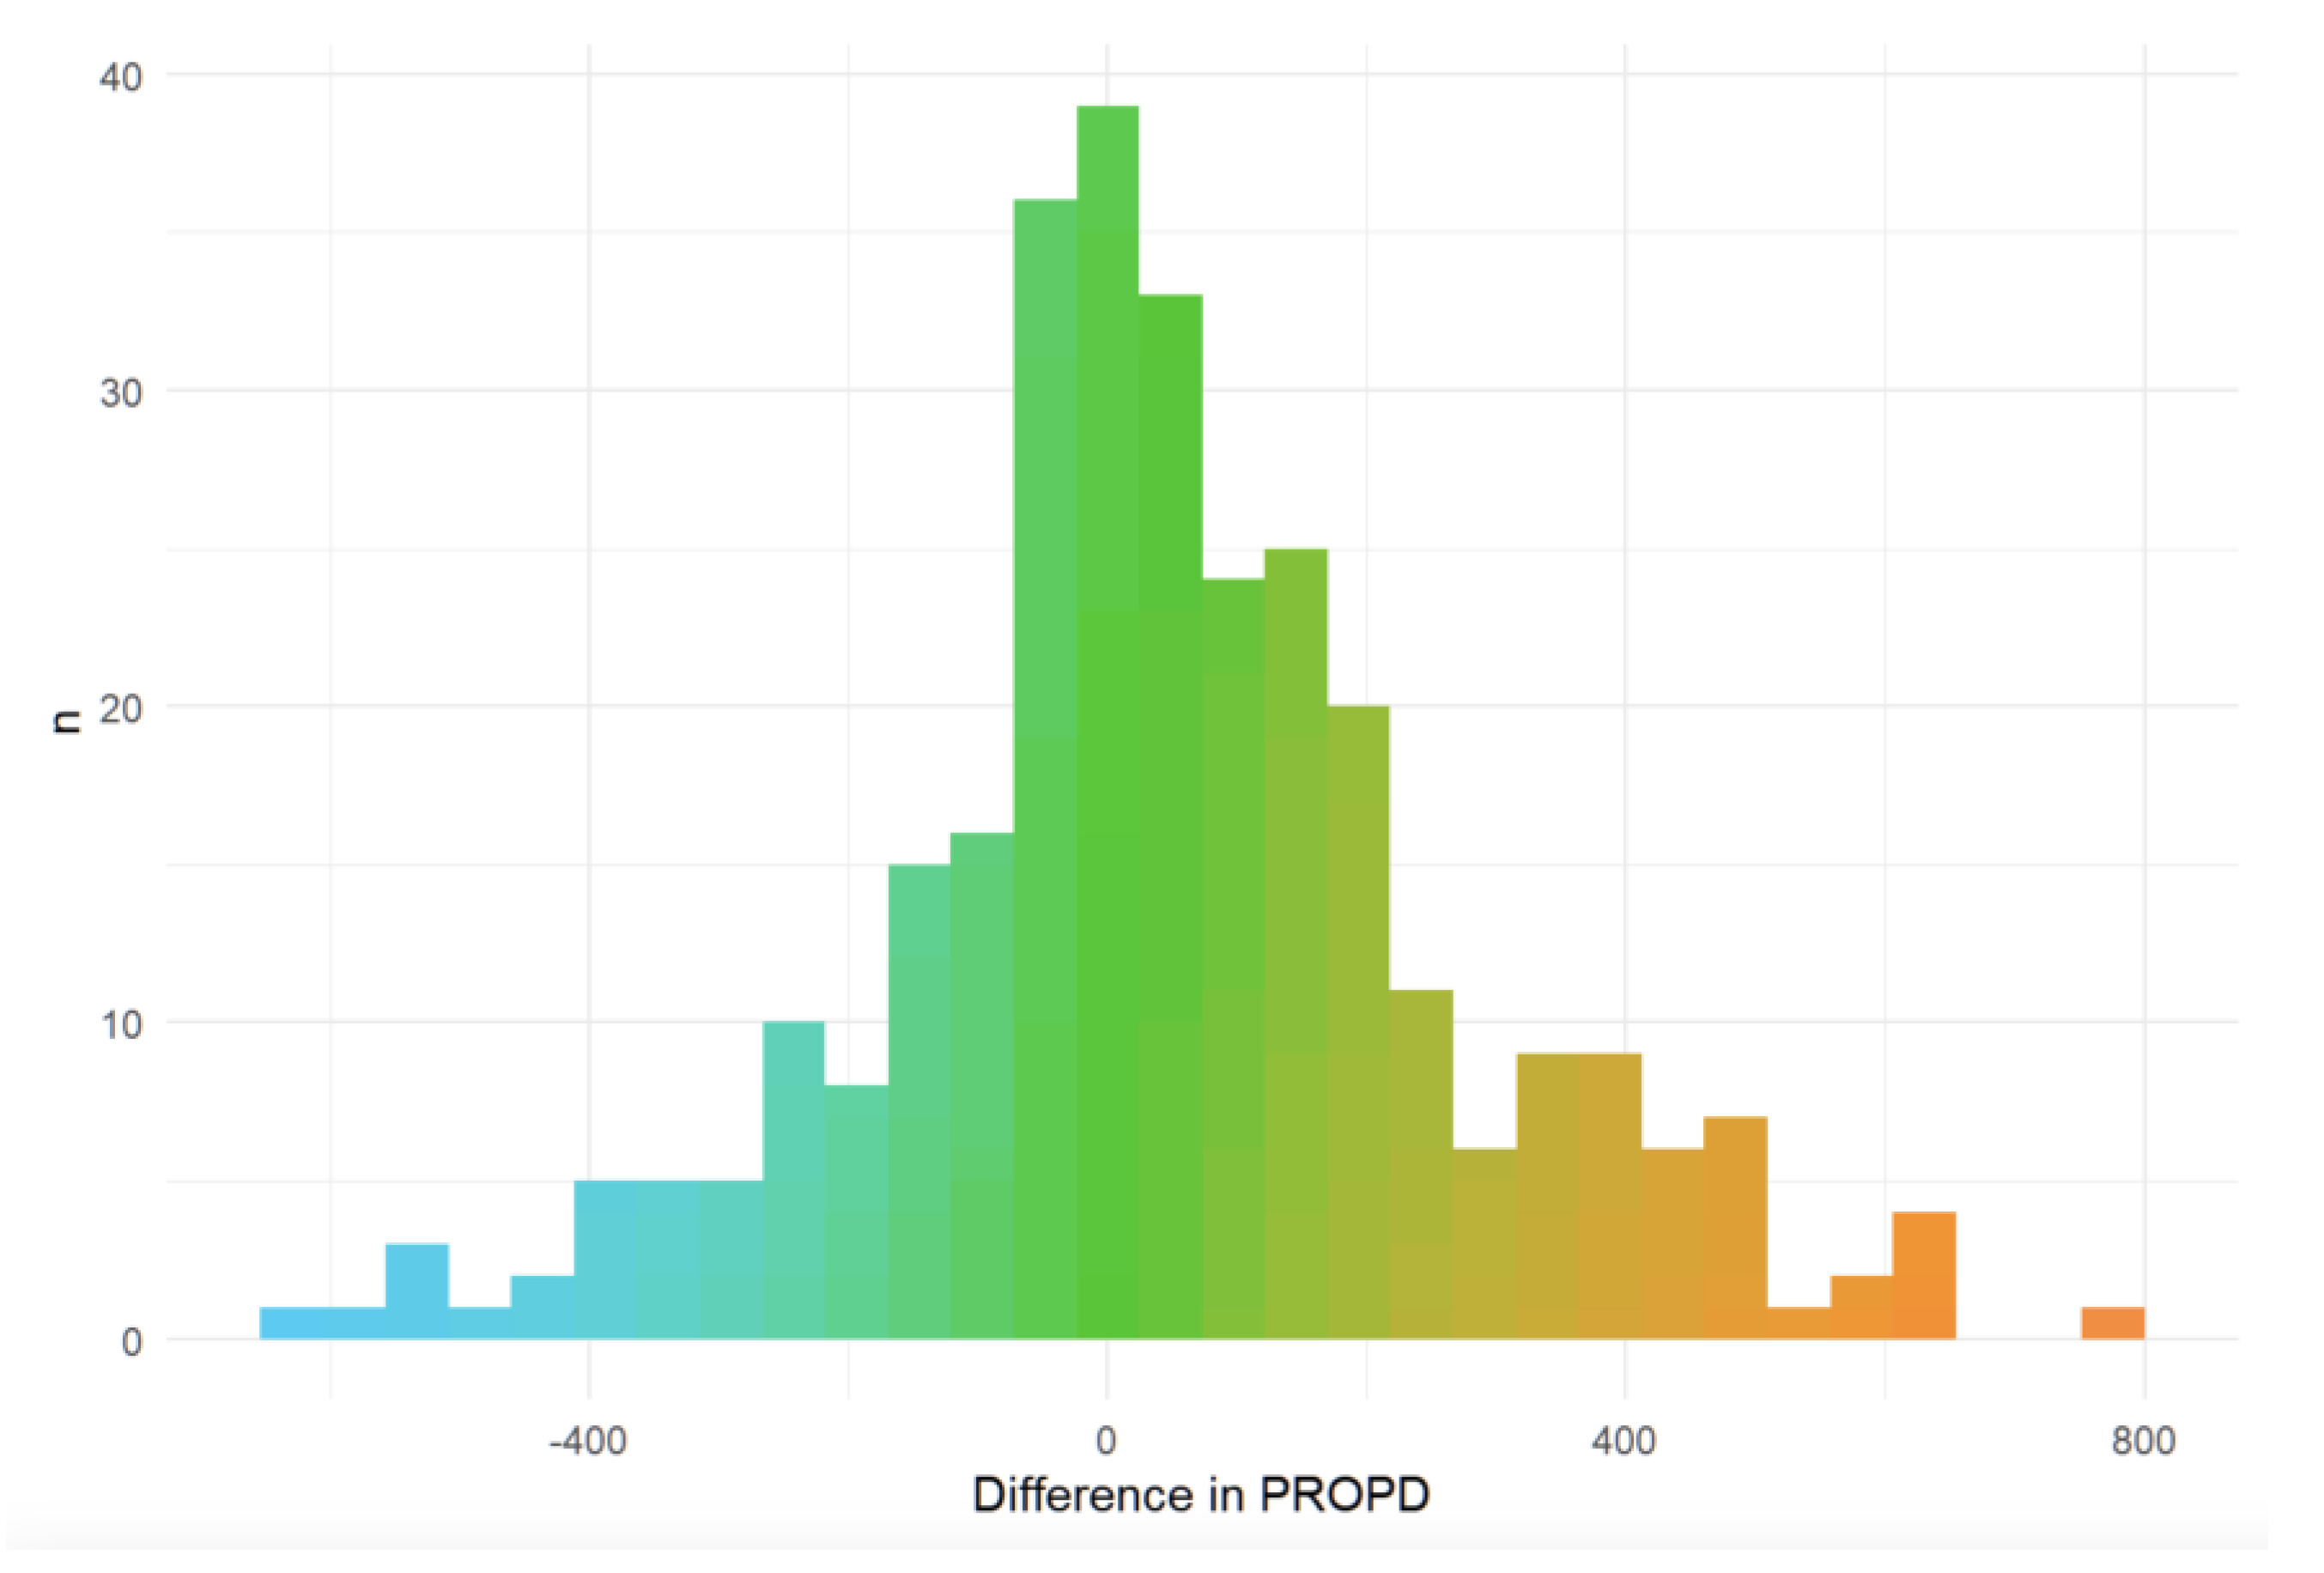
Table 1.
Participant characteristics. Small data were obtained from baseline values from a clinical trial, large dataset was obtained from an observational study entirely employing remote patient monitoring.
Table 1.
Participant characteristics. Small data were obtained from baseline values from a clinical trial, large dataset was obtained from an observational study entirely employing remote patient monitoring.
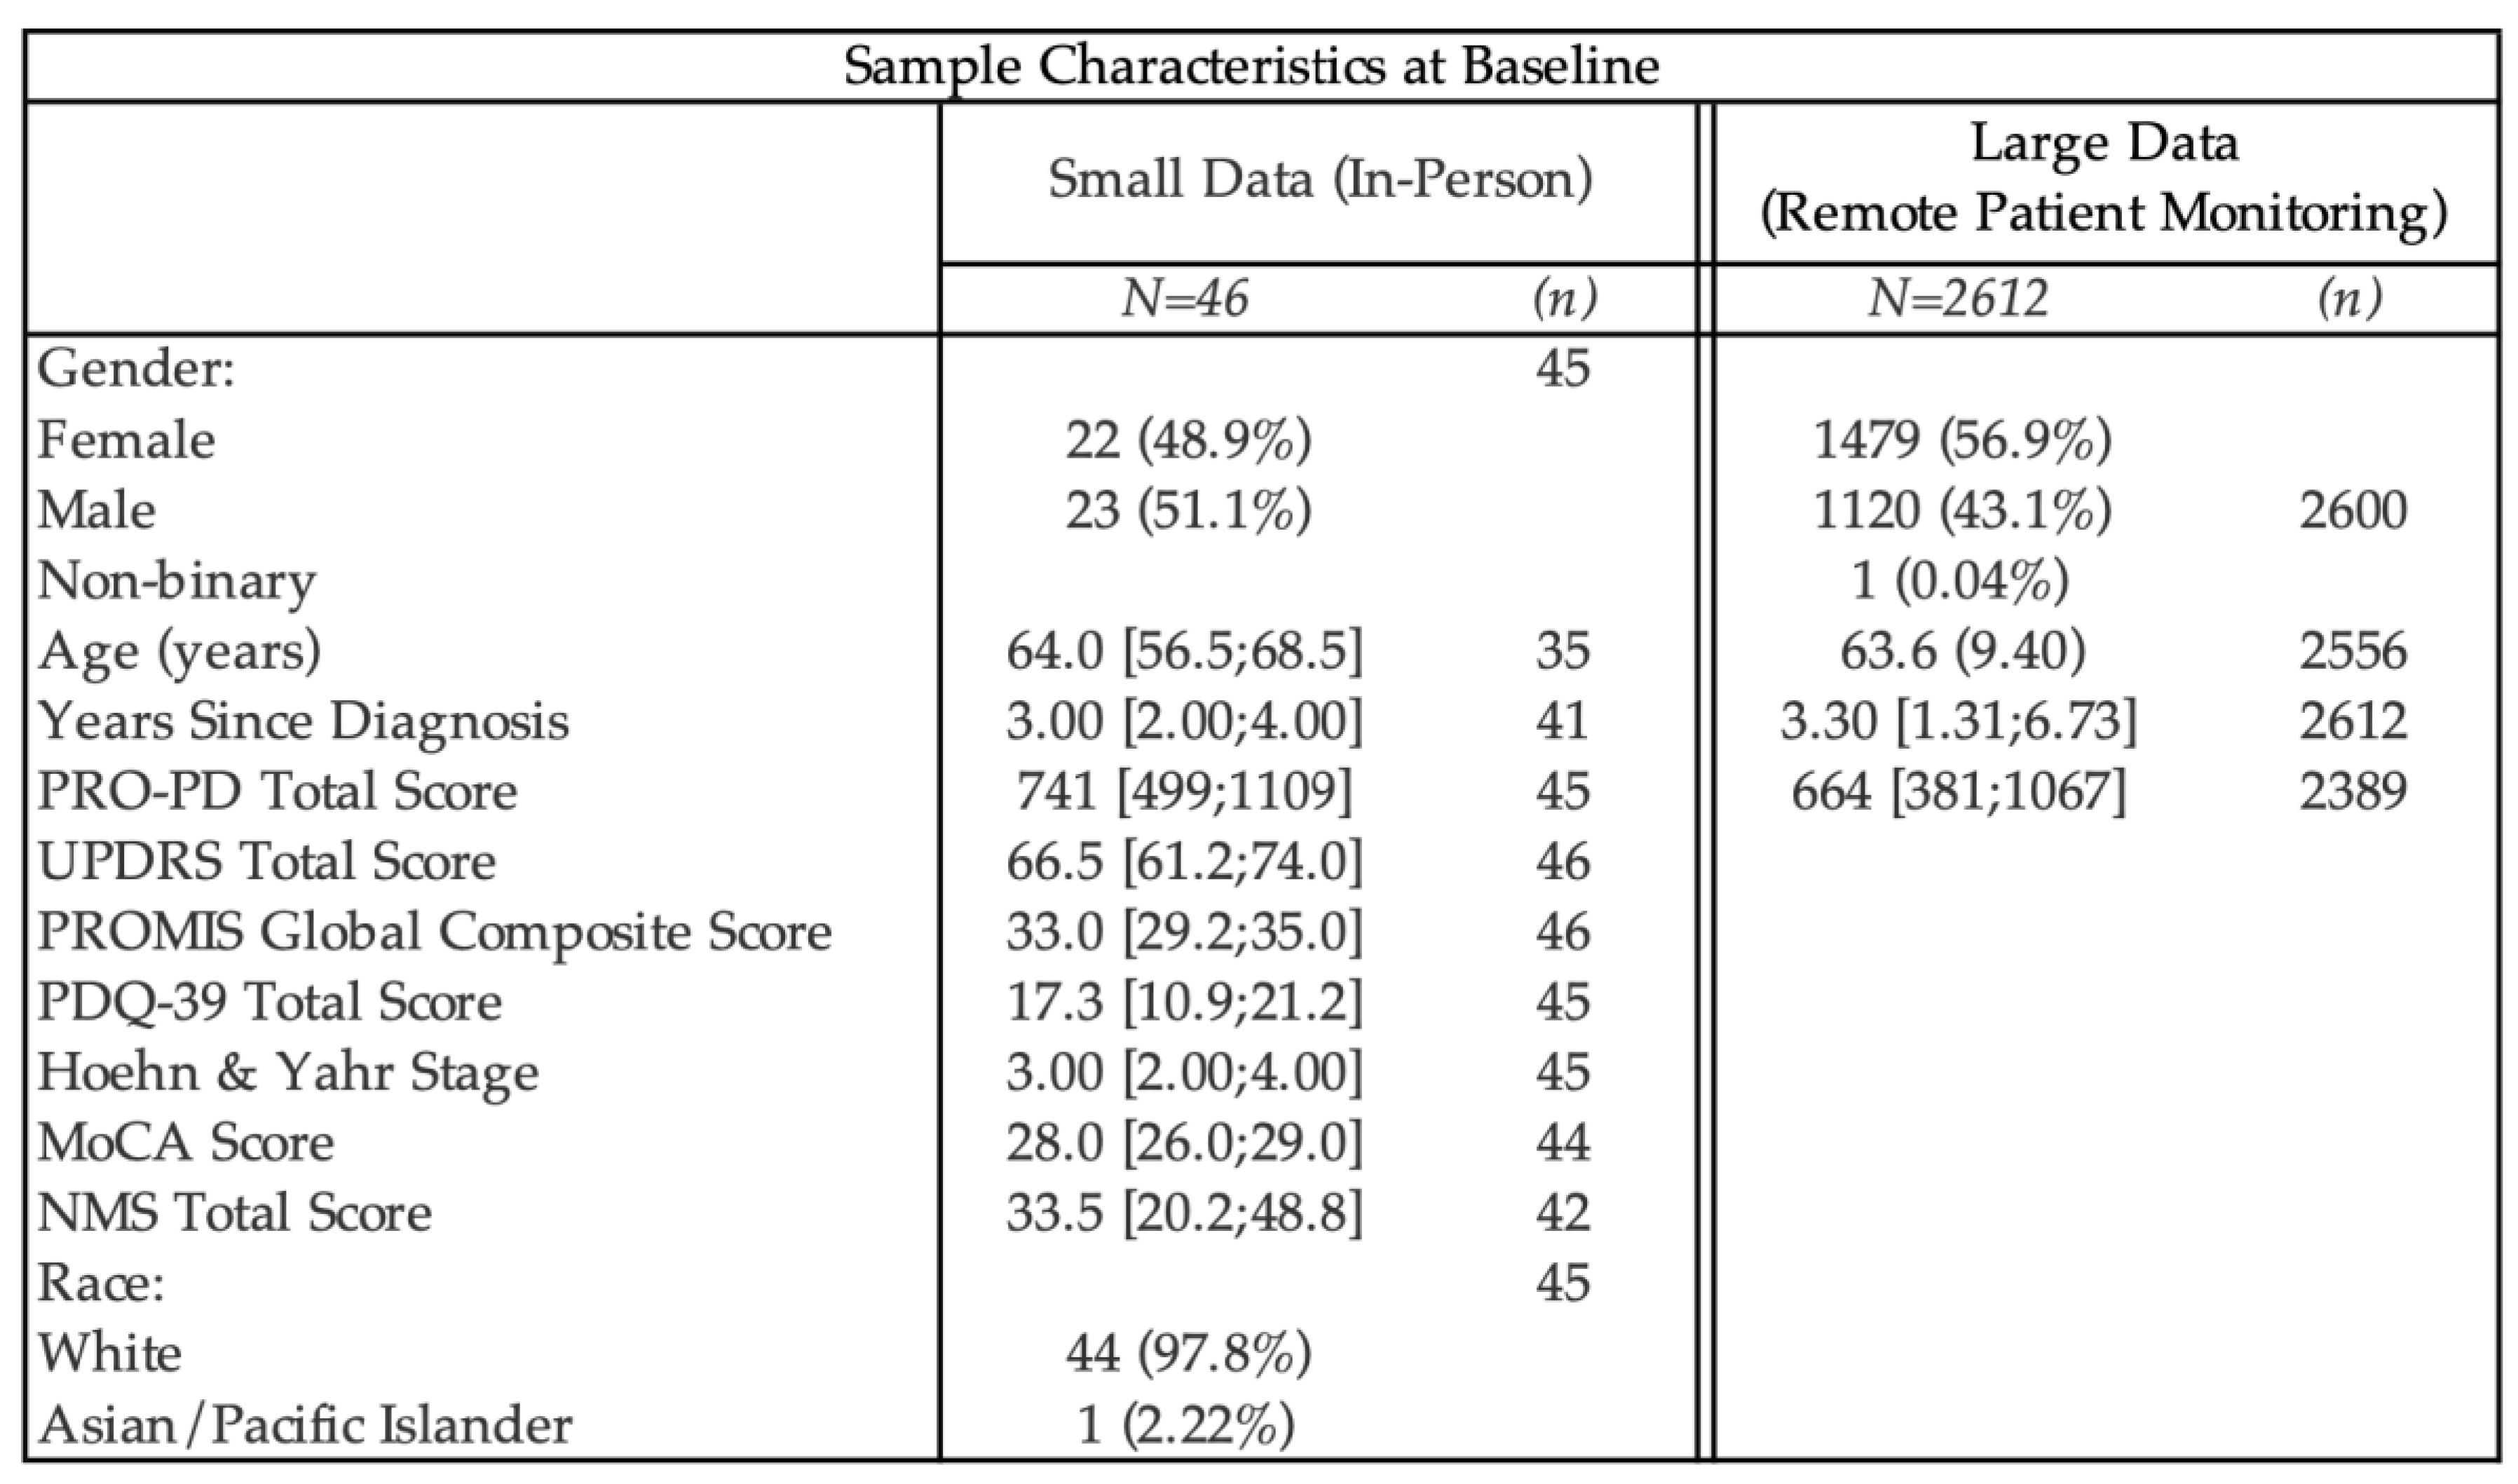 |
Table 2.
Descriptive statistics and item analysis.
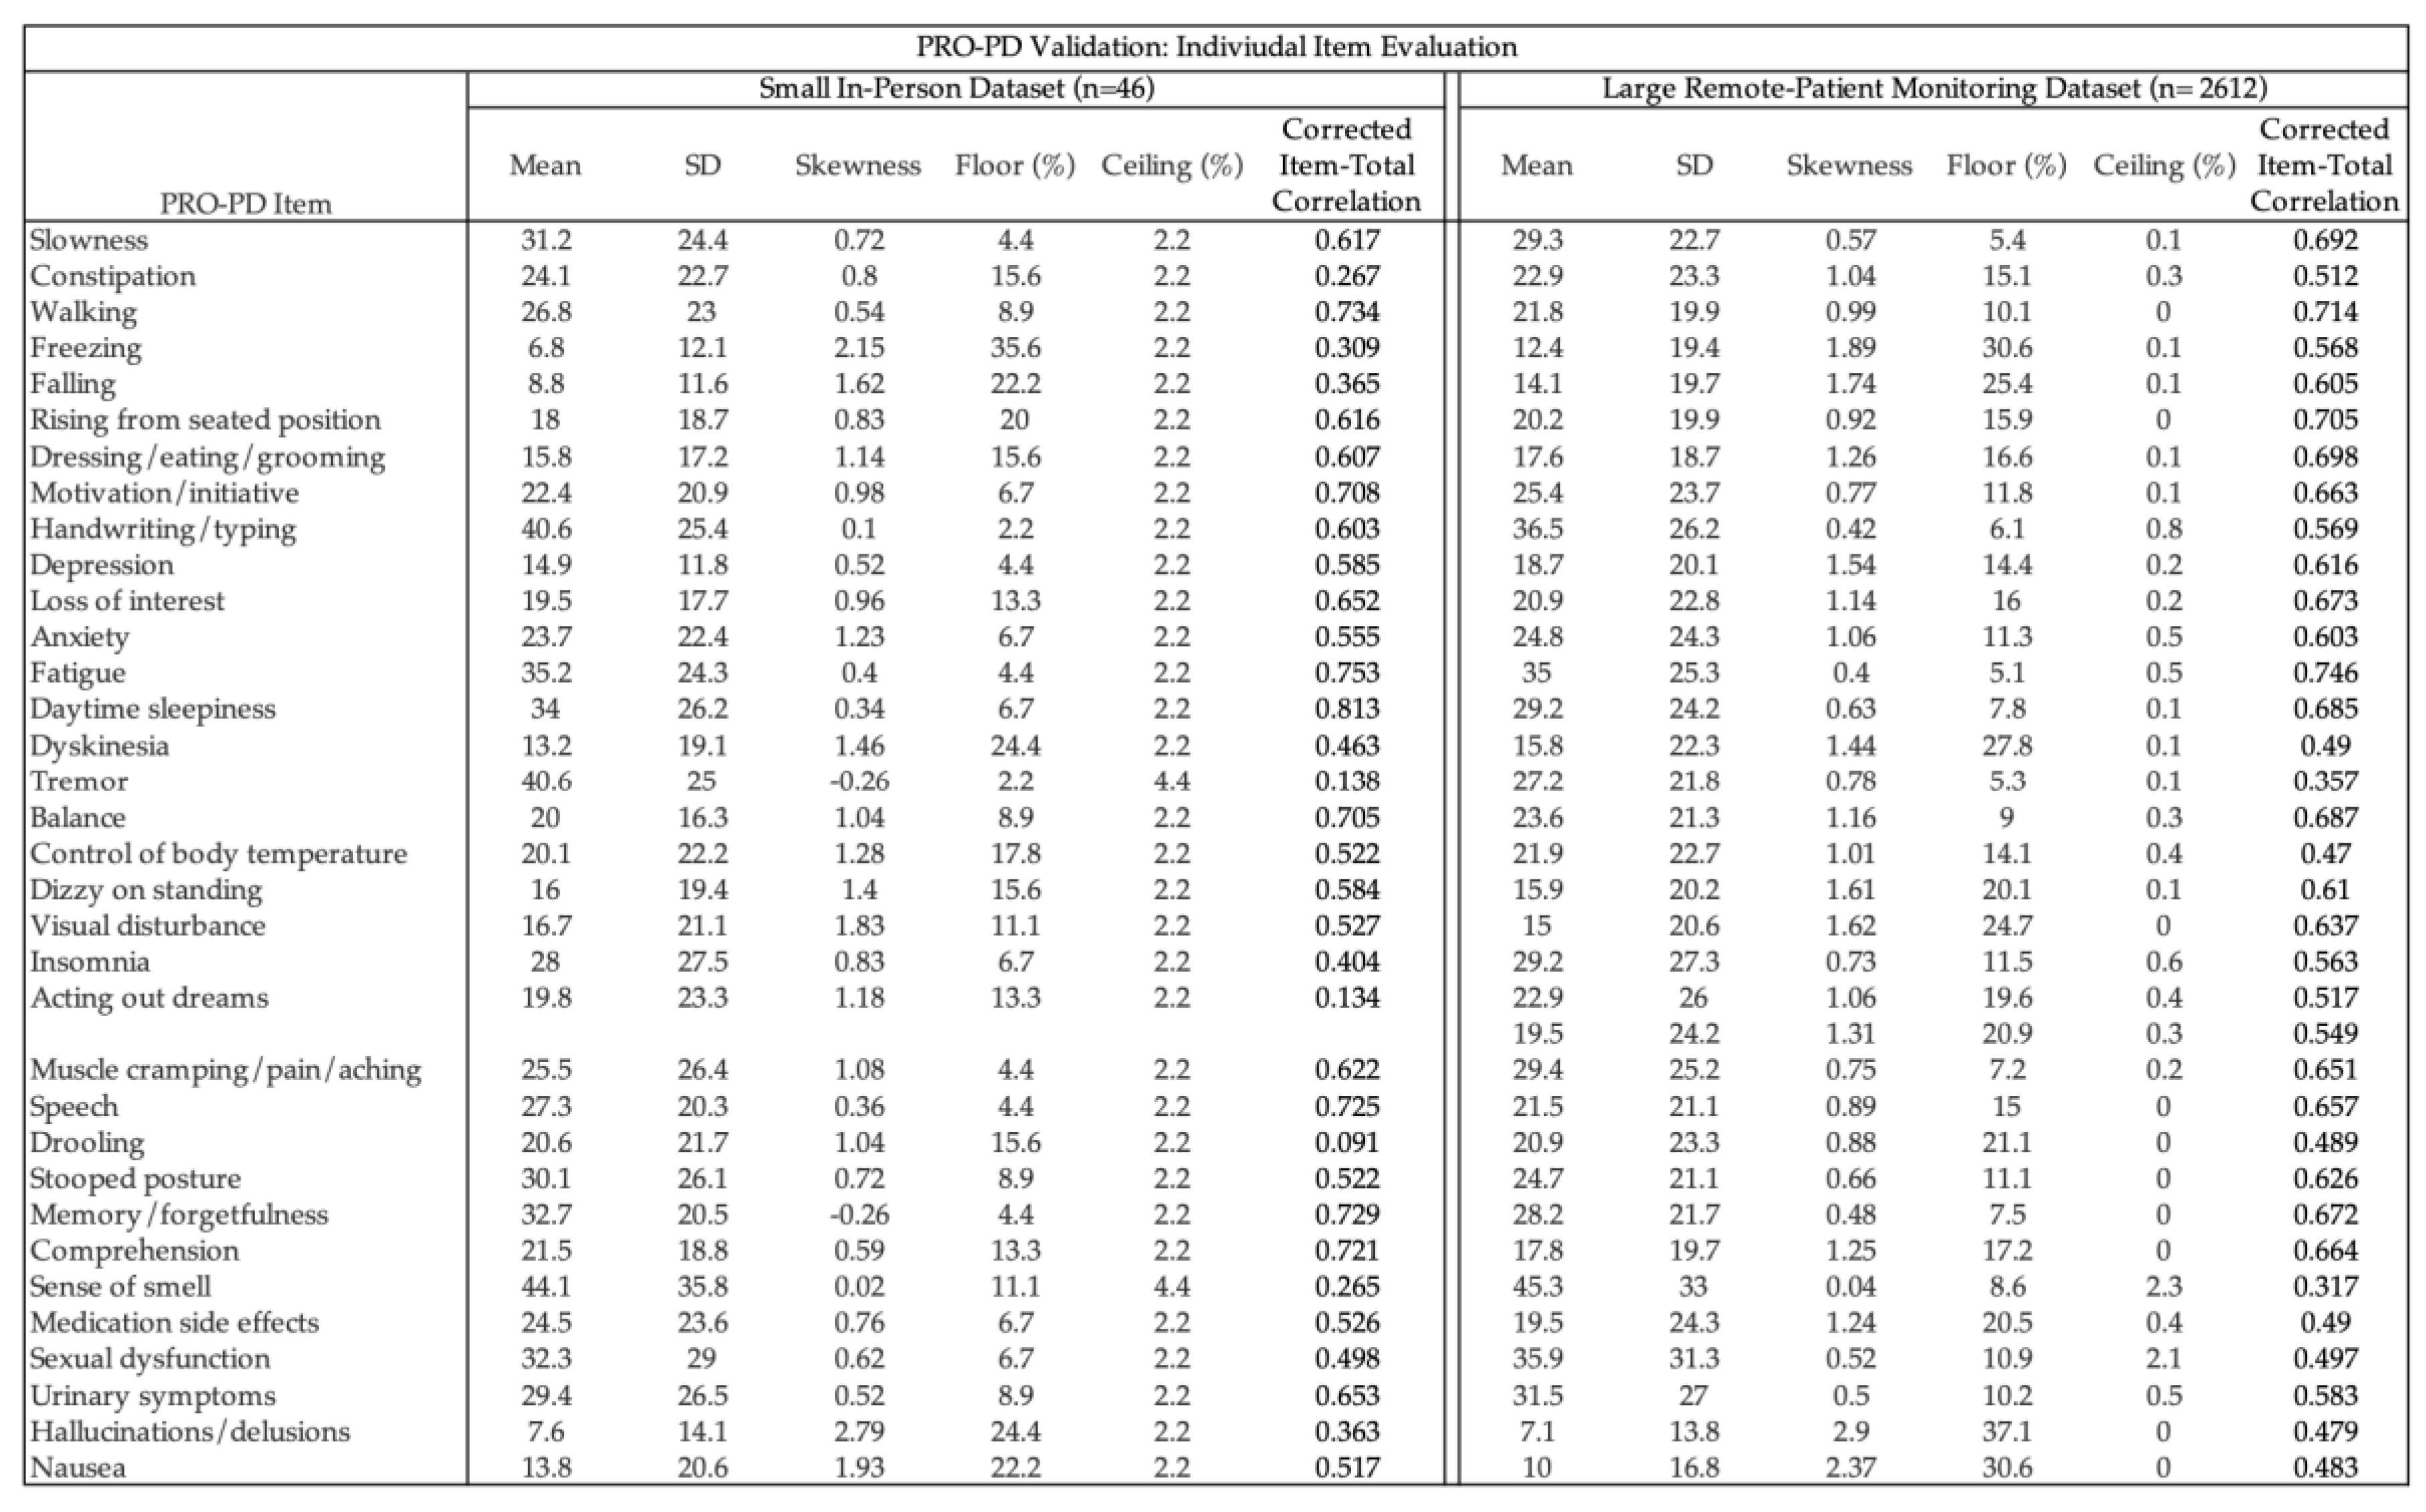 |
PRO-PD: Patient-Reported Outcomes in Parkinson’s Disease; SD: Standard deviation.
Table 3.
Application of Swedish eight-factor model to the English dataset.
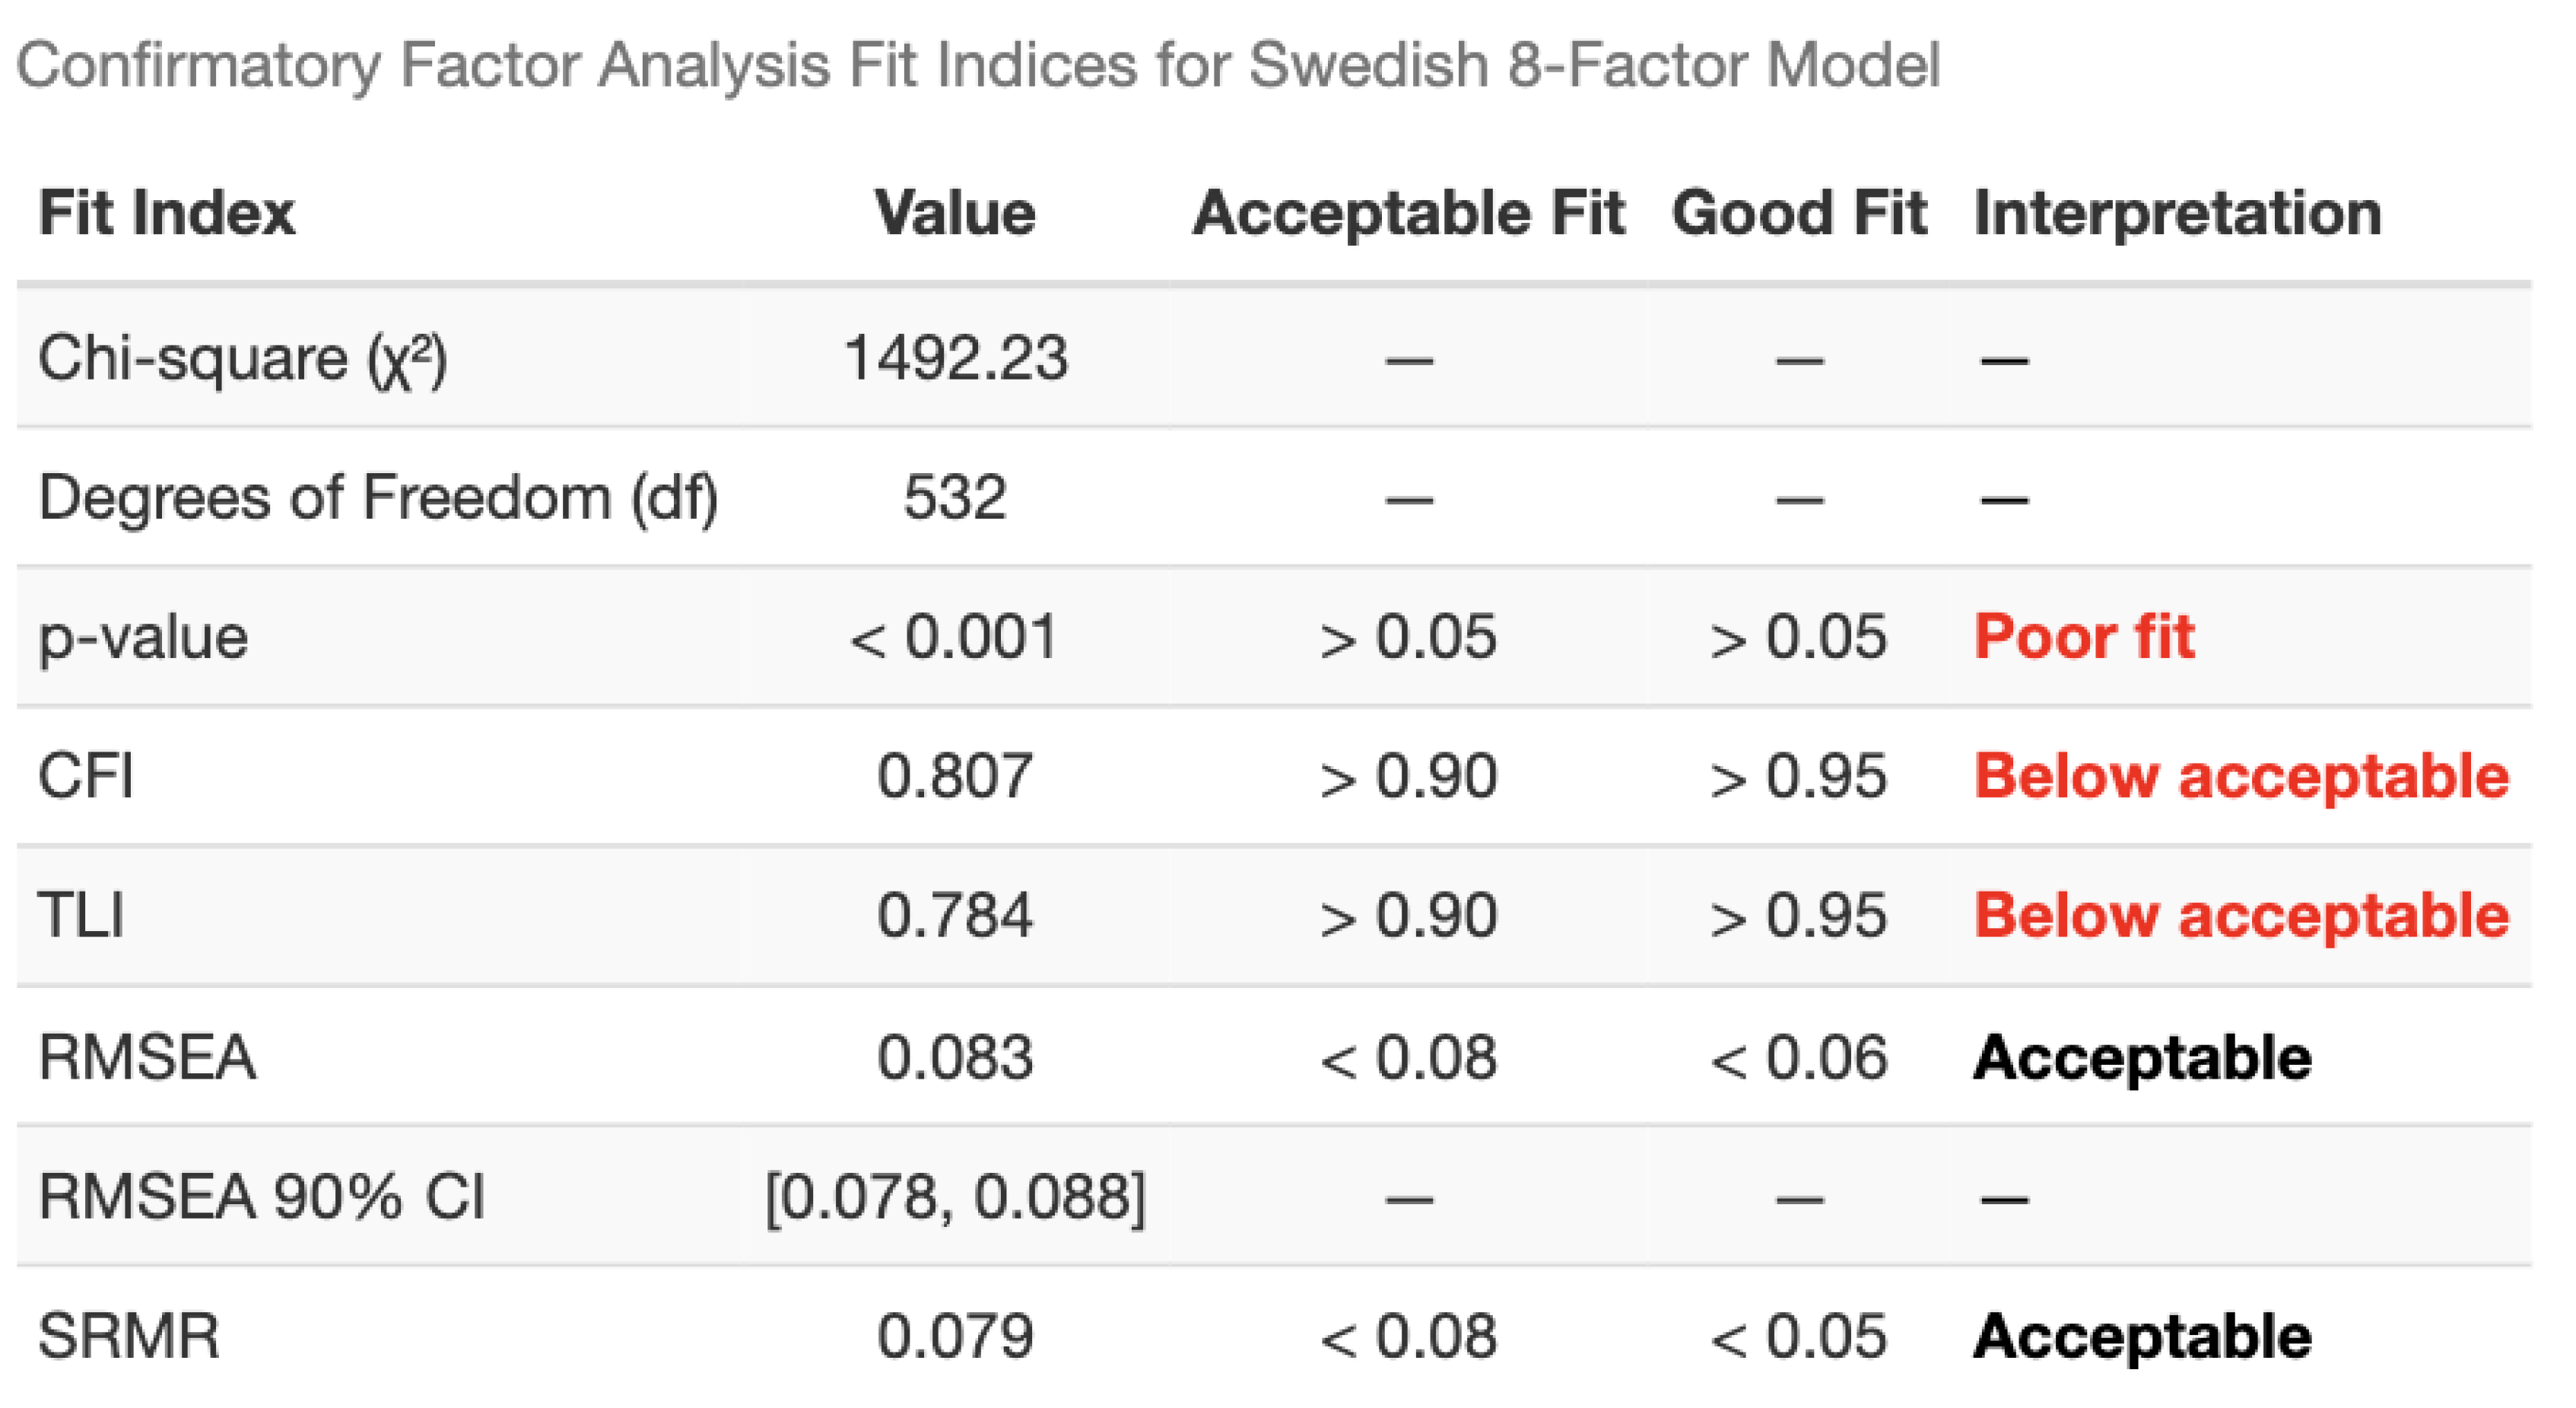 |
1 CFI: Comparative Fit Index, TLI: Tucker-Lewis Index, RMSEA: Root Man Square Error of Approximation, SRMR: Standardized Root Mean Square Residual.
Table 6.
Clinical interpretation of PRO-PD change threshold for detecting symptom worsening.
 |
Disclaimer/Publisher’s Note: The statements, opinions and data contained in all publications are solely those of the individual author(s) and contributor(s) and not of MDPI and/or the editor(s). MDPI and/or the editor(s) disclaim responsibility for any injury to people or property resulting from any ideas, methods, instructions or products referred to in the content. |
© 2025 by the authors. Licensee MDPI, Basel, Switzerland. This article is an open access article distributed under the terms and conditions of the Creative Commons Attribution (CC BY) license (http://creativecommons.org/licenses/by/4.0/).
Copyright: This open access article is published under a Creative Commons CC BY 4.0 license, which permit the free download, distribution, and reuse, provided that the author and preprint are cited in any reuse.


