Submitted:
26 December 2025
Posted:
29 December 2025
You are already at the latest version
Abstract
To address the critical demand for real-time dynamic tracking of personnel in complex buildings during emergency rescue operations, an indoor locating and motionless alarm system has been proposed, integrating BP (Back Propagation) neural networks with DS-TWR (Double-Sided Two-Way Ranging) technology. The system was composed of hardware and software. The hardware included positioning base stations (arranged in advance within the target area), positioning tags (with personnel), POE switches, routers and a computer. The software was developed based on the LabVIEW platform that coupled the BP neural network with the DS-TWR ranging technology to identify and locate the position of personnel more accurately. Thresholds of time period and movement distance were set to determine whether the occupant was trapped. System testing results showed that the system had good stability and high positioning accuracy, up to the order for centimeter level. Furthermore, the system could re-al-time monitor and display the movement trajectory of each person, and automatically alarm when anyone was trapped in a fire scene. Hence, once someone is trapped or in danger, rescue measures can be taken timely ac-cording to the alarm information provided by the system, effectively ensuring the safety of personnel and improving the efficiency of fire rescue work.
Keywords:
precise locating
; motionless alarm
; BP neural network
; DS-TWR
1. Introduction
Large scale fires in different buildings are currently occurring at higher rate globally. In large public spaces such as shopping malls, museums, hospitals, and convention centers, fires pose significant challenges due to their expansive layouts, limited exits, and narrow passageways. These structural characteristics hinder fire-fighters from identifying the real-time status and locations of trapped individuals [1], while victims them-selves often struggle to perceive their surroundings, severely complicating rescue efforts. When individuals are rendered unconscious due to smoke inhalation or structural collapse, their lives are threatened as they cannot be detected and treated in a timely manner [2]. In 2024, China reported 2,001 fire-related fatalities. The fire in a Commercial and residential building n Xinyu City, Jiangxi Province, resulted in 39 deaths and 9 injuries. The fire occurred in the elderly apartment in Chengde City, Hebei Province resulted in 20 deaths. And the fire broke out at Jiuding Shopping Plaza Zigong City, Sichuan Province, resulting in 16 deaths and 39 injuries.
In the field of emergency rescue, current traditional technologies for monitoring personnel status inside buildings primarily include infrared, ultrasonic, and computer vision technologies [3,4,5]. These methods require high environmental lighting and monitoring angles, and their effectiveness in personnel detection is constrained by distance, light conditions, and building interior structures, making large-scale search and rescue operations challenging. Moreover, these technologies mainly identify the static state through physiological signals such as human body heat radiation, respiration, and heartbeat, which have a certain lag and can easily delay the critical rescue opportunity. In addition, vari-ous positioning technologies have been proposed in terms of personnel positioning, including geomagnetic positioning, ultrasound-based methods, inertial sensors, visual-based positioning, and approaches utilizing Radio Frequency Identification (RFID), WiFi, Bluetooth, Ultra-Wide Band (UWB), Zigbee, and cellular mobile networks [6,7,8,9,10,11]. The geomagnetic positioning exhibits significant errors due to interference from metal struc-tures and electrical equipment. Inertial sensors, ultra-sonic systems, and vision-based localization face challenges in practical indoor positioning due to their high cost and the difficulty of deploying necessary infra-structure. RFID has a short operating range and cannot support continuous mobile positioning. The positioning accuracy of WiFi and Bluetooth is relatively low, at the meter level, and the signal is easily affected by object obstruction and environmental interference. Cellular networks suffer from severe signal attenuation in indoor environments, significantly degrading positioning ac-curacy. Zigbee technology exhibits limitations including poor positioning precision (3-5 meters), short transmission range (<20 meters), and poor real-time performance. In contrast, Ultra-Wide Band (UWB) technology, a low-power radio solution, is widely adopted, especially in high-risk production sites such as mines and chemical plants, due to its exceptional characteristics of high communication bandwidth, high security, high time resolution, and strong penetration.
However, due to the effects of multipath and non-line-of-sight(NLOS)propagation, UWB ranging results may still have deviations [12]. Based on the existing positioning technology, this paper proposes a building occupant locating and motionless alarm system that utilizes BP (Back Propagation) neural network and UWB-based DS-TWR (Double-Sided Two-Way Ranging) ranging technology. By introducing BP neural networks and utilizing machine learning algorithms from artificial intelligence, this system overcomes the positioning deviations caused by multipath effects and NLOS propagation during the DS-TWR ranging process, achieving centimeter-level positioning accuracy. Moreover, developed on the LabVIEW software plat-form, the system features a visual interface for real-time monitoring of occupants’ trajectories and current positions. It calculates movement distances travelled by any occupant within specified timeframes to assess motion status and immediately issue an automatic alarm message when the occupant is identified to be stationary for a long time. thereby shortening the search and rescue time and avoiding missing the golden rescue period. This indoor occupant locating and motionless alarm system can be integrated into the fire command center, combined with existing fire detection systems, to provide intelligent services for emergency rescue in complex environments of large public places.
2. Positioning Algorithm Based on BP Neural Network and DS-TWR Technology
2.1. DS-TWR Ranging Technology
UWB (Ultra-Wideband) utilizes information ex-change between pre-arranged positioning base stations and internal personnel tags to calculate the current location of personnel. The calculation UWB positioning algorithm is mainly divided into two types. One is to use the time difference of signal transmission between tags and base stations for positioning, such as Time of Arrival (TOA) positioning algorithm and Time Difference of Arrival (TDOA) positioning algorithm [13]. Usually, these algorithms require strict clock synchronization. Meanwhile, another approach is to measure the distance between the tag and the base stations, and then calculate the tag position using methods such as trilateration. The advantage of this method is that it can overcome errors caused by time asynchrony between tags and base stations. The selection of UWB ranging method directly impacts the UWB system's localization accuracy.
The ranging approaches mainly include Received Signal Strength Indicator (RSSI) distance measurement and Time of Flight (TOF) distance measurement. RSSI-based ranging method exhibits significant deviations between measured and actual distances because the signal strength can be easily affected by multipath interference. TOF ranging employs bidirectional communication, with variants such as Single-sided Two-way Ranging (SS-TWR) and Double-sided Two-way Ranging (DS-TWR). DS-TWR adds an additional communication round on the basis of SS-TWR ranging, utilizing two signal exchanges to offset clock skew. This ensures minimal error even under conditions of prolonged response times or low clock precision. Consequently, the personnel positioning-motion detection-static alarming system designed for buildings adopts DS-TWR for its ranging implementation.
After measuring the distance between the tag and each base station, the trilateral measurement method was usually adopted to calculate the tag’s position in previous research. Due to the multipath effect of radio transmission, the influence of signal strength and clock accuracy, there will often be deviations in the DS-TWR ranging results. If the ranging data is directly substituted into the trilateral measurement to perform simple for-mula calculation, this deviation will inevitably be brought into the positioning results.
2.2. BP Neural Network
Meanwhile, BP neural network, as an intelligent information processing system, is a multilayer feed-forward network trained on error back propagation. The BP neural network exhibits strong capability for non-linear mapping and self-learning [14], which can eliminate the influence of ranging error and effectively im-prove the positioning accuracy. Therefore, the BP neural network is integrated to calculate the coordinate of personnel.
A BP neural network consists of an input layer, hidden layers (one or multiple), and an output layer [15], as shown in Figure 1. Signals enter the network through neurons in the input layer, are processed by activation functions in the hidden layer, then transmitted to the output layer where they undergo another activation function before final output [16]. In BP neural network, neurons in each layer are fully connected to all neurons in adjacent layers through weighted connections. And the output of each layer node only affects the input of the next layer node. Neurons on the same layer are in-dependent of each other.
Taking a node in the latter layer of any two adjacent layers as an example, the neuron model in a BP neural network was illustrated, as shown in Figure 2, where xi represents the input term of the function, wij denotes the weight between nodes, j indicates the j-th node, θj represents the threshold of the j-th node, and fj is the activation function of this model. The activation function in BP neural networks is typically the sigmoid function. The activation function [17] is expressed as:
The training process of the BP neural network algorithm is mainly divided into two stages: forward propagation of signals and backpropagation of errors, as illustrated in the flowchart in Figure 3.
2.3. BP Neural Network Training to Enhance Positioning Accuracy
Using the BP neural network algorithm for learning and training, the functional relationship between input and output data can be found, and then according to the functional relationship, the desired results can be obtained by inputting relevant data again for calculation [18].
2.3.1. Determine the Parameters for BP Neural Network
The number of samples needed for BP neural net-work learning and training is typically required to be greater than 10. A larger number of samples results in a stronger learning ability of the BP neural network and a more accurate model being generated. However, the more samples there are, the longer it will take to train the model. Therefore, an appropriate number of samples should be selected.
The training sample data in this study were sourced from experimental results of a personnel positioning and static alarming system based on BP neural networks and DS-TWR technology, deployed in a university laboratory. The experimental scene covered a 7×5 meter rectangular area. At the initial stage of the experiment, a local coordinate system was established using a total station, and the actual coordinates of all positioning base station antennas were accurately measured. In order to ensure the accuracy and efficiency of BP neural net-work training, 400 sample points were selected for training, as shown in Figure 4. Four base stations were set up at the four corners of the region, and the tags were placed at the 400 positioning points to measure the distance between the tags and the base stations.
The 400 groups of data were divided into a training set and a test set by random sampling. According to the ratio of training set : testing set = 8:2, 320 groups of data were selected as the training set and 80- groups of samples as the test set.
Network parameters were continuously adjusted and optimized to enhance generalization and convergence capabilities. The final parameter settings for BP neural network were shown in Table 1.
2.3.2. Determine the Number of Hidden Nodes
BP network adds several layers (one or more) of neurons between the input and output layers. These neurons have no direct connection with the outside world, but changes in their state can affect the relationship between input and output. Each layer can have several nodes. The number of intermediate layers and nodes in each layer of the network can be arbitrarily set according to specific situations.
Our positioning system aims to obtain position information of each tag from distances between tag and base stations. The operation of this system is not complicated. Therefore, the BP neural network with single hidden layer is selected to process the data. The number of nodes in the hidden layer will affect the performance of BP neural network. For example, if the value is too large, it will lead to long learning time and weak generalization ability. If the value is too small, it will lead to a decrease in fault tolerance [19].
The number of hidden layer nodes in this paper is determined according to the empirical formula 1 and 2. The empirical formula is [20,21]:
Where: l is the number of nodes in hidden layer; m is the number of nodes in input layer; n is the number of nodes in output layer; α is a constant between 1-10; i is a constant between 0-m; k is the number of samples.
There are four positioning base stations in this system, resulting in four sets of TWR ranging data between the base stations and the tag. These four sets of data serve as the four nodes of the input layer, i.e., m=4. The output layer outputs the current position coordinates x and y corresponding to the tag, so there are two nodes in the output layer, i.e., n=2. According to selected sample size of 2400, the number range of hidden layer nodes calculated by Formula 1 and Formula 2 is 6-13. The trial-and-error method was adopted to train the network with the hidden layer set to values within this range, and the results are shown in Table 2. When the number of hidden layer nodes was 13, the network achieved the optimal training performance, with the minimum maximum error, minimum error, and root mean square error (RMSE). Therefore, the network topology was determined as 4-13-2.
2.3.3. BP Neural Network Training
Taking the positioning area of 7m by 5m as an example, 320 positioning points were selected as the sample points of BP neural network learning and testing. As shown in Figure 6, four base stations were set up at the four corners of the region, and the tags were placed at the 320 positioning points to measure the distance between the tags and the base stations.
A coordinate system was established with the position of base station 1 as the coordinate origin, the direction of the base station 2 as the positive direction of the x axis, and the direction of the base station 4 as the positive direction of the y axis. Since the system was based on DS-TWR ranging technology, it was necessary to take the Distance values measured by DS-TWR between the tags at 320 positioning points and each base station as the input data. The actual position coordinates of the 320 positioning points were used as output data for training in the BP neural network. After the training was completed, the generated mathematical function model was saved. The data for BP neural network learning is shown in Table 3.
2.3.4. Verify the Training Results of BP Neural Network
The generated mathematical function model should be validated using distance measurement data excluding these 320 points. Therefore, another 80 positioning points were re-measured. Their coordinates were recorded as (x, y). The DS-TWR ranging information of the 80 points was input into the newly saved function model, and the coordinates obtained through neural network calculation were denoted as (x1, y1).
The generated coordinate data (x1, y1) were compared with the real coordinate values (x, y), as shown in Figure 5(a). The traditional DS-TWR ranging technology adopts the trilateration method to calculate the tag position. To further verify the effectiveness of the BP neural network method, the prediction results of the BP neural network are compared with those of the trilateration method, and the results are shown in Figure 5(b).
To evaluate the prediction results of the two models more intuitively, three evaluation metrics—Root Mean Square Error (RMSE), Mean Absolute Percentage Error (MAPE), and Mean Absolute Error (MAE)—were selected to test the prediction errors of the models. The MAE and RMSE metrics reflect the gap between predicted values and true values, with a value range of [0, +∞); the closer the value is to 0, the more accurate the model is. MAPE is a percentage value representing the average percentage of relative errors between predicted values and actual values, with a value range of [0, +∞); the closer the value is to 0, the more accurate the model is. The prediction error evaluation metric data for the two models are shown in Table 4.
In summary, the BP model’s predicted values outperform those of the trilateration method, with a 65.60% lower Root Mean Square Error (RMSE), a 51.72% lower Mean Absolute Percentage Error (MAPE), and a 56.53% lower Mean Absolute Error (MAE). These results demonstrate that the BP model can effectively enhance positioning accuracy.
3. Design of the System
The construction of this positioning and motionless alarm system mainly includes two parts: the hardware equipment required for locating and the software programming to perform calculation for various functions.
3.1. Overview of System Functions
Based on LabVIEW software programming platform, BP neural network and UWB indoor positioning technology, the system realizes the accurate positioning of personnel in fire environment. On terminals such as computers, not only can command and control information be displayed, it can also display the real-time position, walking track and automatic alarm information.
(1) Based on UWB positioning technology to locate the position of personnel, and through the BP neural network to eliminate the error generated in UWB locating technology, to achieve high-precision positioning of personnel in the fire.
(2) Personnel locating function. The system uses LabVIEW virtual instrument platform, which is a graphical programming language widely used in data collection, testing and measurement, and instrument control. The hardware information of the locating system is collected by LabVIEW, and the real-time position is carried out by the locating algorithm. At the same time, the current position and walking trajectory of the personnel in the fire field can be recorded. Different command buttons are designed to determine whether to display the position or trajectory as needed.
(3) Automatic alarm system for the static personnel. The system can determine whether the person has the ability to move according to the configured alarm conditions, and trigger the warning information to the command center in time. The command center can issue rescue instructions for the certain person.
3.2. Hardware Equipment
The hardware equipment includes UWB positioning base stations, positioning tags, POE switches, routers and a computer, as shown in Figure 6. The base stations provide position parameters for the positioning system, and are placed at certain intervals within the positioning area. The positioning tags, worn by personnel in the building aera, provide real-time position information of personnel. POE switches are responsible for data transmission in the system and power supply to base stations. Routers connect all the base stations in the system to the same local network, and assign IP addresses to the base stations. The computer processes the collected information, calculates and displays the specific position of each person on the terminal. The POE switches, routers and computer are all placed in the Building Fire Protection Command and Control Center.
For the person in fire scene where the locating and static alarming system was installed, information is exchange between the tag and the base stations through the wireless signal. The base stations collect distance data between each tag and base station, and transmit it to the computer through POE switches and routers. The computer processes the data using the BP neural network algorithm to calculate the real-time position of the person, and finally feed back to the system interface to realize the locating- monitoring-static alarming system functions.
3.3. Software Programming
The system utilized the LabVIEW platform to collect the hardware information of the positioning system, imported the DS-TWR ranging data into the BP neural network to calculate the position information of personnel in the fire scene, and displayed it in the front-end system interface in real time. A trajectory display model was designed to draw a real-time trajectory map. And an alarm function was also designed which can trigger alarm according to the movement status of personnel. The relevant programming diagrams were attached in Appendix A.
Figure 7(a) shows the interactive interface of the system, with the white area displaying the layout of the positioning area. In the area numbered 1, the operations and parameter settings can be performed, including starting record, refreshing record, current position dis-play, trajectory display and alarm display. The trajectory color of different populations can be set in the area numbered 2.
When the button ' parameter setting ' is clicked, the lower part of the interface is shown in Figure 7(b). The initial parameters can be set, such as loading a back-ground, setting the base station parameters, defining the name of the person, setting the alarm thresholds of time period and movement range. The file types that can be imported include image formats such as JPG, PNG, and BMP. Taking PNG image format as an example, after selecting the image, the system extracts its metadata, outputs the image data to generate a flattened pixel map, and imports the map into an XY plot as a background layer.
4. Functional Test
A laboratory in a certain college was selected as the test site for the system. The laboratory was 15 meters long and 10 meters wide. The locating-motion monitoring-static alarming system was built in the laboratory, as shown in Figure 8. After the completion of the construction, the relevant parameters of the positioning base station were input into the system for testing and verification.
Personnel in a fire scene are usually in motion. Therefore, when they remain stationary for a long time, we can consider that the personnel may have fallen into a coma or been trapped. The alarm range was set to 0.2 meters, and the alarm time period was set as 30 seconds, which is consistent with the commonly used firefighter pagers. That is to say, when the distance traveled by personnel in fire scene within 30 seconds does not exceed 20cm, the system will display an alarm message. The threshold value of movement range and alarm time period can be changed according to different situations.
4.1. Comparison of Positioning Accuracy Between BP Neural Network and Trilateration Method
In order to test the positioning precision of the system trained through BP neural network, a comparative experiment was conducted in the laboratory. The tester carried a tag to walk along a straight line. The coordinate points of the current position were recorded at regular intervals, with a total of 31 coordinate points recorded along the walking route.
In current research using UWB positioning technology, the trilateral measurement method is the most commonly used method for calculating coordinate information. In this experimental test, the coordinates of each trajectory point were calculated through trilateral measurement method and BP neural network respectively. As shown in Figure 9, the walking route is shown as the black line, the green dots represent the coordinates calculated using the trilateral measurement method; while the red square points indicate the coordinates calculated through BP neural network. Obviously, the trajectory points calculated by the BP neural network is more closely to the walking path.
Figure 10 displays the calculated root mean square error of the two algorithms. The maximum value of the trilateral measurement method reached 0.23 m, whereas the maximum of the BP neural network was only 0.057m.
In summary, the generated mathematical model through BP network corrects the error that arise from directly using DS-TWR ranging for positioning calculation, enabling the positioning system to overcome the influence of ranging error and achieve more accurate positioning results. Therefore, the system developed in this paper adopts a combination of DS-TWR ranging and BP neural network for positioning calculation.
4.2. Static Positioning Accuracy and Stability Test
To verify the positioning accuracy and stability of the system under static conditions, a tag was placed at the coordinate position (1.00,1.20), and the position data sampling interval was set to 2 seconds. The coordinate data of the tag was recorded every 2 seconds within 20 minutes, resulting a total of 600 data points, as shown in Figure 11.
The results indicate that in the stationary state, the positioning error range of the system is approximately 0.015 m. Specifically, the overall X-coordinate fluctuates within ±0.03 m, while the Y-coordinate fluctuates within ±0.04 m, confirming the system’s favorable static positioning accuracy.
Furthermore, 95% of the coordinate data collected over 20 minutes is concentrated within a ±0.02 m range relative to the true coordinates, which verifies the system’s stability.
4.3. Motion Trajectory Monitoring Accuracy Test
It is very necessary to test the accuracy of the system in detecting the trajectory of personnel during their movement. Therefore, a route was randomly preset in the laboratory, and a person with a tag was assigned to walk strictly along the preset route from the starting point to the end point. The trajectory recorded by the system during this process was compared with the actual walking trajectory of the person, as shown in Figure 12. The black line in the figure represented the trajectory recorded by the system, and the red line represented the actual walking trajectory.
It can be seen from Figure.12 that the trajectory recorded by the system is basically consistent with the actual walking trajectory. There are very few coordinate points with significant errors, which mainly concentrate at the corners, and the maximum deviation error is only 8cm. Therefore, the system also exhibits excellent positioning accuracy under dynamic conditions. And the trajectory display results of the system can reflect the real walking path.
4.4. Real-Time Position and Trajectory Display Function Test
In order to test the real-time position and trajectory display function, two individuals were asked to carry positioning tags and walk in any direction in the laboratory. To distinguish between the individuals, one was referred to as Zhang San, and the other was referred to as Li Si.
When it was required to view the walking trajectory of all individuals in the area, the mode 'Show all trajectories' should be chosen, as shown in Figure 13(a), and then the walking trajectory routes of both Zhang San and Li Si would be shown simultaneously. If it was required to only view the trajectory of someone (such as Zhang San), the mode ' Show Zhang San’s Trajectory ' should be chosen, as shown in Figure 13(b), which will only display the walking trajectory of the designated person Zhang San, while the walking trajectories of the others will be hidden.
When the 'Show current position' mode was selected, the current position of all individuals could be automatically displayed in the interface, as shown in Figure 14(a). When it was necessary to display the position of only a certain person (such as Zhang San), the button of 'display Zhang San’s position' on the basis of this mode should be clicked, and then the current position of the specified individual could be shown in the interface, as shown in Figure 14(b).
The test results showed that the real-time position and trajectory display function runs well and meets the design requirements.
4.5. Alarm Display Function Test
The alarm indication light was set to trigger an alarm based on the following criterion: if the tag moved less than 0.2m within 30 seconds, the corresponding individual would be judged to be in danger, the indicator light would turn red, and the name of the individual would be shown in the name display box of the alarm personnel.
The test procedure and results was set as follows:
(1) Two participants (Zhang San and Li Si) with positioning tags respectively began to walk and kept walking for 5 minutes.
The alarm indicator light did not change, as shown in Figure 15(a).
(2) After 5 minutes, Li Si became stationary, while Zhang San continued to walk.
At this time the alarm indicator light turned red after about 2 seconds, and the name display box of alarm personnel showed ' Li Si alarm ', as shown in Figure 15(b).
(3) Then, after 3 minutes, Zhang San stopped walking. Both participants remained stationary for 2 minutes.
At this moment the name display box of the alarm personnel showed ' Zhang San alarm; Li Si alarm'. At last, during the 2 minutes the two participants kept stationary state, the alarm indicator light remained red, and the name display box of the alarm personnel continued to show ' Zhang San alarm; Li Si alarm ', as shown in Figure 15(c).
Based on the comprehensive test results, it has been proven that the system can issue an alarm once someone becomes motionless. The name display function can correctly display the names of alarm personnel. Although the alarm indicator light has a delay of two seconds, it does not affect the timely rescue.
5. Discussion
The Table 5 summarizes several studies on indoor positioning systems, which basically cover the current common positioning technologies and system functions.
5.1. Technology
At present, the indoor positioning technology for emergency rescue mainly includes UWB positioning technology, ZigBee, RFID technology, Inertial navigation technology, etc. Among the above positioning methods, UWB positioning technology is the most widely used due to advantages of fast signal transmission, low production cost and high positioning accuracy [34].
Meanwhile, the use of UWB technology for ranging can also result in data bias due to the influence of multipath effect and non-line-of-sight propagation. Usually, UWB positioning technology is used to measure the distance between tags and stations, and the distance information is then substituted into the calculation formula of the trilateral measurement method to obtain the position information. If the ranging data is incorrect, the results obtained by the trilateral measurement method will result in significant errors. To avoid larger errors caused by directly inputting ranging information into positioning calculations, BP neural network is introduced in this paper.
BP neural network is an artificial intelligence algorithm for deep learning with the advantages of fast operation speed, strong self-learning ability and strong fault tolerance. In the operation process, after training, BP neural network will directly establish a nonlinear function model according to the relationship between the inputting data and target variables, and use the function model to replace the calculation process. It can effectively reduce the error of positioning information.
In section 4, a comparison was conducted between the positioning accuracy of BP neural network training and trilateration method.
5.2. Accuracy
As shown in Table 5, the positioning accuracy of the current related research is between 0.36-10m.The positioning accuracy of our research is much higher, can reach 0.05m.
The system using inertial navigation technology has the worst positioning accuracy, with an error of more than 1m [24,30]. Therefore, this technology is more suitable for outdoor large-scale scene localization.
In order to achieve higher positioning accuracy, relevant researchers have combined several different technologies to improve accuracy. It can be observed from Table 5 that it is effective to improve the positioning accuracy with two or more technologies. For example, the positioning system developed by [32] using UWB, altimeter and radio have an accuracy of 0.36m.
In this paper, BP neural network is integrated with UWB technology to further reduce the error to 0.05m. The positioning accuracy is increased by one order of magnitude.
5.3. Function
Firstly, the system achieves personnel detection and localization within buildings. During emergencies such as fires or earthquakes, the critical prerequisite for search and rescue operations is rapidly determining occupants' positions and current statuses. For ordinary individuals, once trapped in disaster scenarios, it is difficult to obtain precise location information. The system studied in this article is placed in the fire control center. Rescue commanders can instantly visualize the number and distribution of personnel on site, and can dispatch more rescue forces to densely populated areas to improve rescue efficiency.
Secondly, the trajectory display function of this system can view the walking path of each person separately. Therefore, the headquarters can better command the firefighter 's rescue, evacuation, and prevent getting lost.
Additionally, this paper focuses on the personal safety and rescue. It often occurs in a fire scene that individuals fall into a coma due to smoke poisoning or sudden collapse of building structures, and cannot move or evacuate independently. In order to better protect the personal safety of individuals, this paper adds an automatic alarm function. According to table 5, this rarely occurs in other related researches. Personnel are generally in a state of motion while escaping from a fire scene. Therefore, the system will automatically issue an alarm information when anyone is judged as stationary. This system determines whether individuals are in a stationary state by setting a very small movement distance within a specified time period. The alarm information includes the name and location of the alarm personnel which can help him to be found and rescued timely.
6. Conclusion
For personnel trapped in a fire, early detection can significantly increase their chances of survival.
(1) The personnel locating-and static alarming system utilizes LabVIEW to integrate UWB ranging technology with BP neural network algorithms to accurately locate personnel, monitor their motion trajectories in real time, and achieve an automatic alarm function for static person in danger.
(2) The positioning accuracy, trajectory display function and automatic static alarm function of the system were tested. The test results showed that the positioning error range of the positioning system was about 0.02 m in a static state and about 0.08m in a moving state. The system exhibited good positioning accuracy and stability. And the trajectory display function can display the real-time position and movement trajectory of personnel in fire scene. Furthermore, the automatic static alarm function can timely alarm and correctly display the basic information of trapped personnel.
(3) The system can effectively assist the command center to locate the personnel in the fire scene, and display their tracking path in real time. Once a person encounter danger and unable to move, an alarm signal can be automatically triggered and dispatched to the command center, so as to ensure the trapped individual will be rescued promptly.
7. Future Work
In this paper, a locating-motionless alarm system is designed. On the basis of accurate positioning, trapped personnel can be promptly identified and located. It should be noted that the system, including hardware and software, should be installed and debugged in advance. Many electronic manufacturers such as Apple and Xiaomi have integrated UWB chips into their own mobile phones. In the future, mobile phones can replace UWB positioning tags, which can reduce the deployment cost of indoor positioning infrastructure and improve the operability of the system. It is very important to train the BP neural network according to the actual situation. Besides, the conditions under which the system issues an alarm are also worth further investigation.
Author Contributions
Conceptualization, Li Wang. and Xinhe Meng.; methodology, Li Wang and Wentao Chen; software, Zhe Wang.; validation, Zhe Wang. and Aijun Sun.; formal analysis, Xinhe Meng.; data curation, X.M; writing—original draft preparation, Zhe Wang.; writing—review and editing, Li Wang.; visualization, Zhe Wang; supervision, Li Wang.; project administration, Li Wang.; funding acquisition, Li Wang. All authors have read and agreed to the published version of the manuscript.
Funding
This research was funded by National Natural Science Foundation of China, grant number 52074192 and Tianjin Municipal Science and Technology Bureau, grant number 24YDTPJC00110.
Data Availability Statement
Dataset available on request from the authors.
Conflicts of Interest
The authors declare no conflicts of interest.
Appendix A
Figure A.
Loading background.
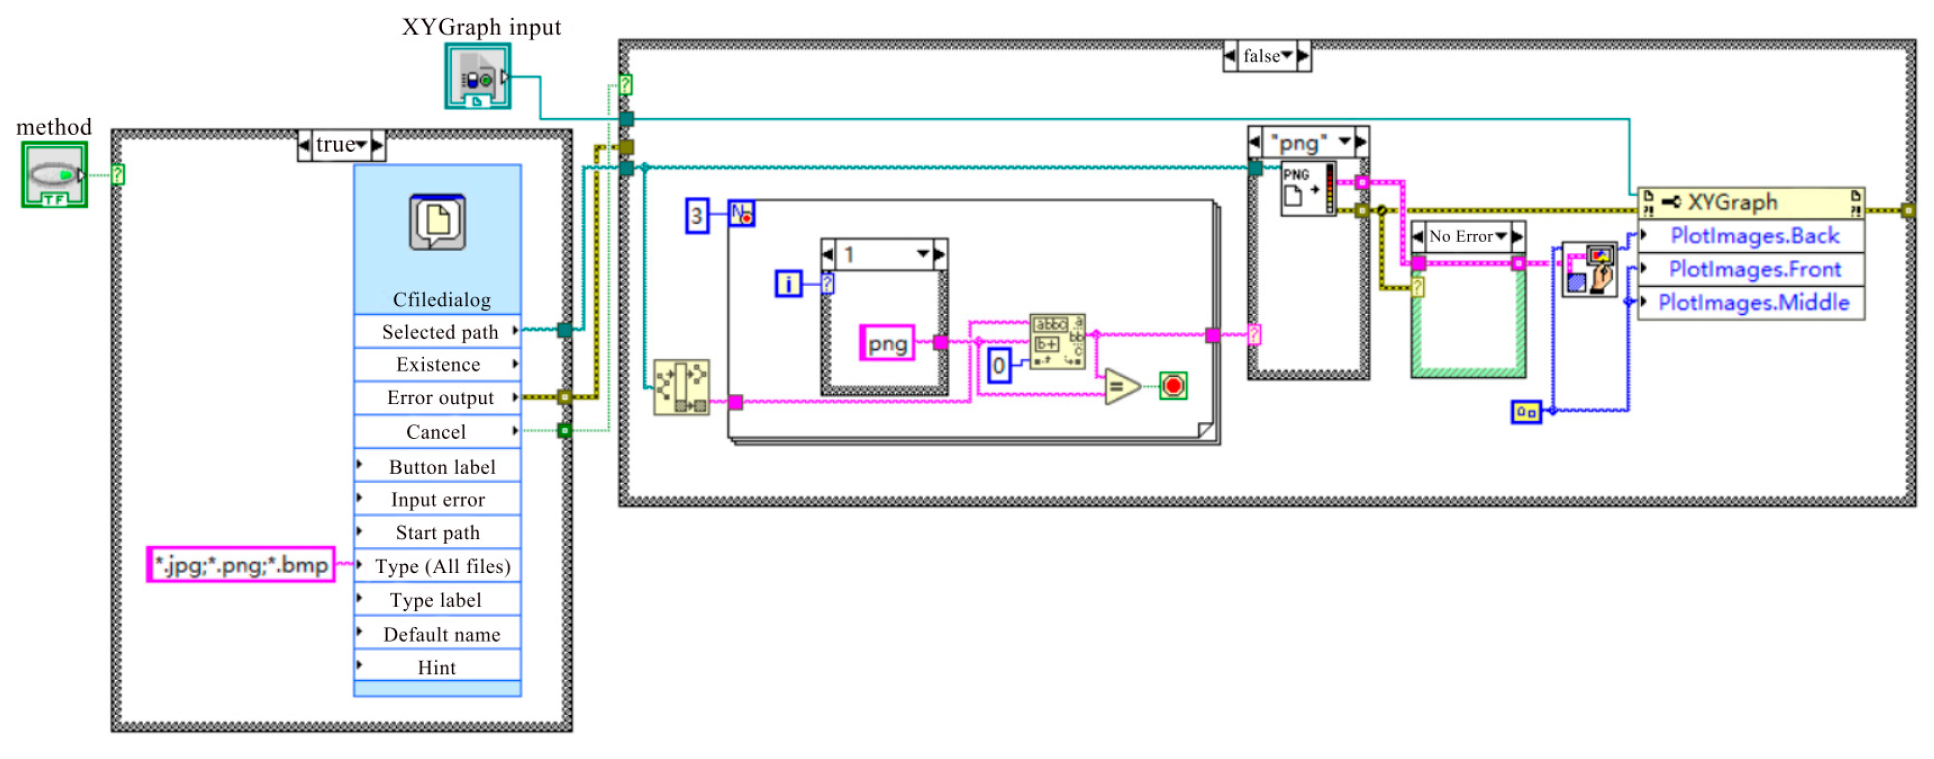
Figure B.
Recording motion track coordinate data.
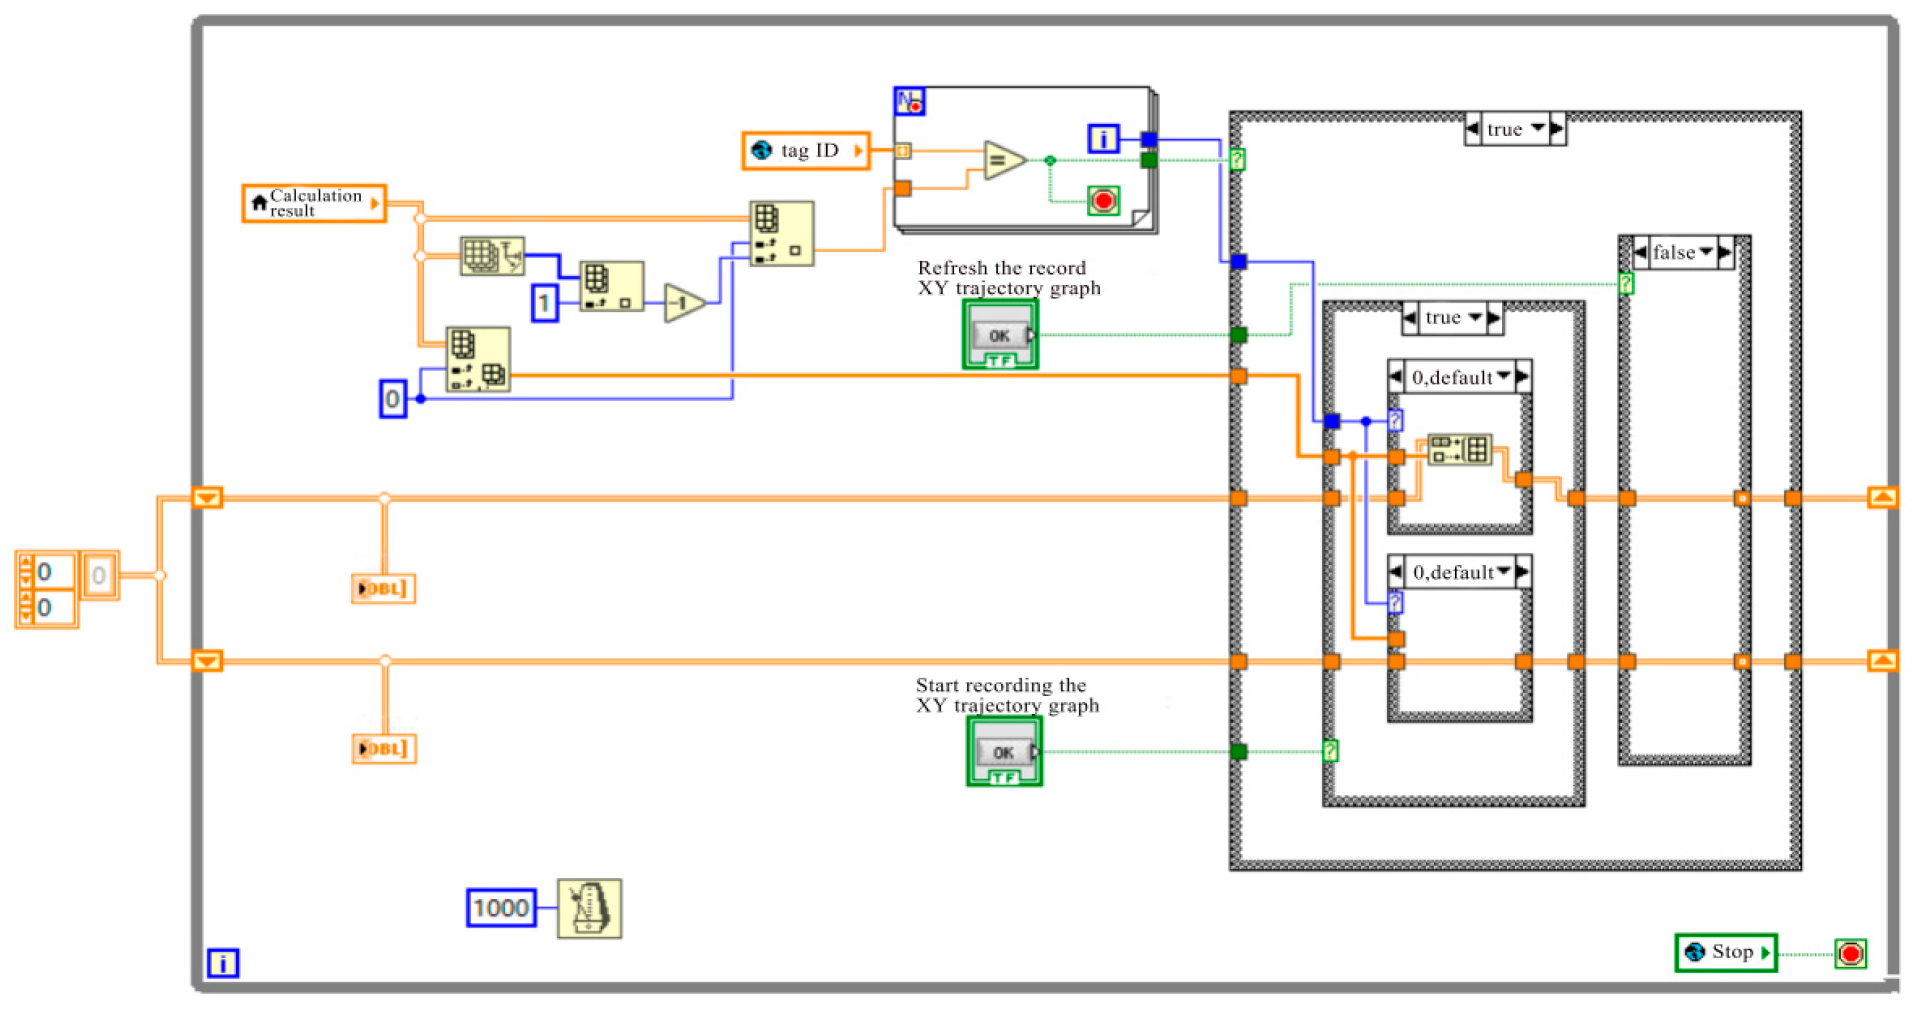
Figure C.
Motion trajectory display.
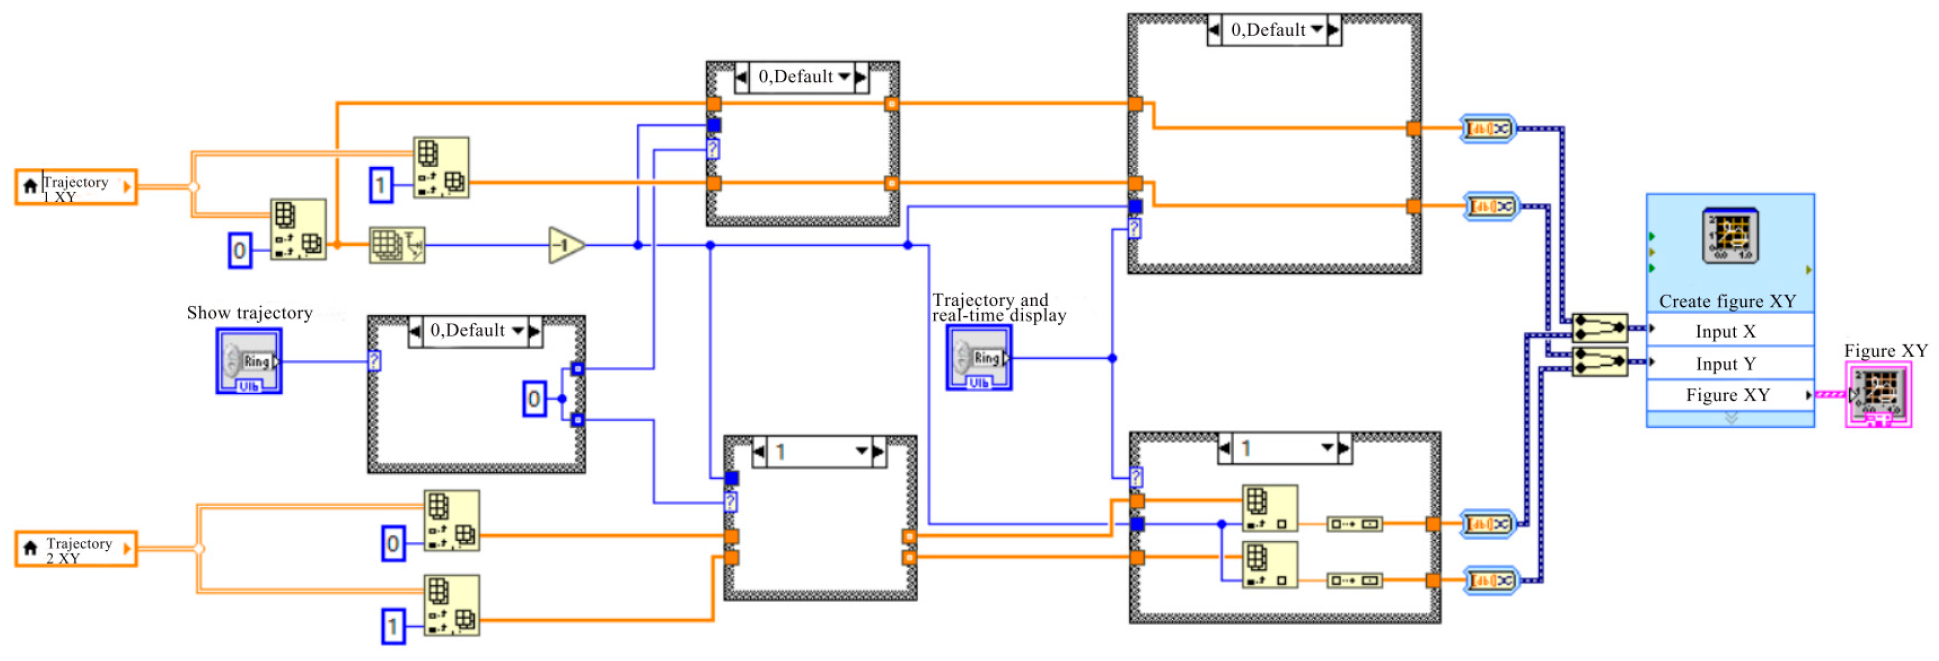
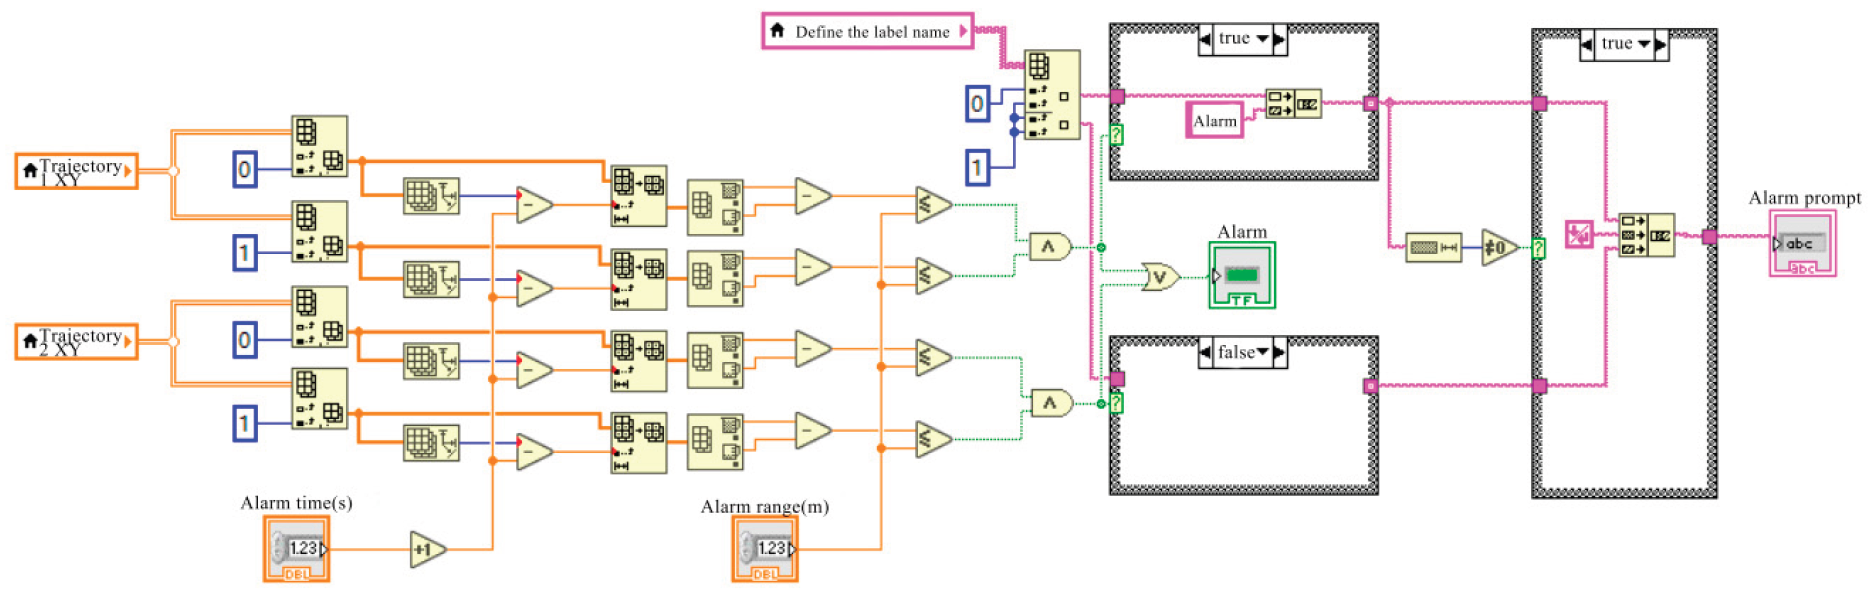
Figure D.
Motionless alarm display.
References
- Aatif Ali Khan, Mustesin Ali Khan, Kamtak Leung, et al., A review of critical fire event library for buildings and safety framework for smart firefighting, Int. J. Disaster Risk Reduct., 2022, vol.83. [CrossRef]
- Yuankai Qi, Zizheng Pan, Yicong Hong, et al., The Road to Know-Where: An Object-and-Room Informed Sequential BERT for Indoor Vision-Language Navigation, arXiv Is Hiring a DevOps Engineer, 2021. Available online: https://arxiv.org/abs/2104.04167.
- Aliakbar Eslami Baladeh, Sharareh Taghipour, A hierarchical k-out-of-n optimization model for enhancing reliability of fire alarm systems, Process Saf. Environ. Prot., 2024, vol. 191, Part A, No. 401-416. [CrossRef]
- Gomes Eduardo Luis, Fonseca Mauro, Lazzaretti André Eugenio, et al., Clustering and Hierarchical Classification for High-Precision RFID Indoor Location Systems, IEEE Sens. J., 2022, vol.22, no.6, pp. 5141-5149. [CrossRef]
- Xu Jingao, Yang Zheng, Chen Hengjie, et al., Embracing Spatial Awareness for Reliable WiFi-Based Indoor Location Systems, 2018 IEEE 15th International Conference on Mobile Ad Hoc and Sensor Systems (MASS), Chengdu, China, 2018, pp.281-289. [CrossRef]
- Terán Marco, Aranda Juan, Carrillo Henry, et al., IoT-based system for indoor location using bluetooth low energy, 2017 IEEE Colombian Conference on Communications and Computing (COLCOM), Cartagena, Colombia, 2017, pp. 1-6. [CrossRef]
- Großwindhager, Bernhard Stocker, Michael Rath, et al., SnapLoc: An Ultra-Fast UWB-Based Indoor Localization System for an Unlimited Number of Tags, 18th ACM/IEEE International Conference on Information Processing in Sensor Networks, Montreal, Quebec, Canada, 2019.4.16-18, pp.61-72.
- Yang Sheng, Liu Jingbin, Gong Xiaodong, et al., A Robust Heading Estimation Solution for Smartphone Multisensor-Integrated Indoor Positioning, IEEE Internet Things J., 2021, vol.8, no.23, pp.17186-17198. [CrossRef]
- Hang Zhou, Haiyong Cong, Yuanyuan Wang, et al., A computer-vision-based deep learning model of smoke diffusion, Process Saf. Environ. Prot., 2024, Vol.187, pp. 721-735. [CrossRef]
- Julian Weidinger, What is known and what remains unexplored: A review of the firefighter information technologies literature, Int. J. Disaster Risk Reduct., 2022, Vol.78. [CrossRef]
- Yu, Y., Zhao, K. S., & Shen, J. Application, research and outlook for indoor localization, Telecommun. Netw. Technol., 2014, no.5, pp.46-49.
- Li Xingguo, Wang Junfeng, Traffic detection of transmission of botnet threat using BP neural network, Neural Netw. World 2018, vol.28, pp.511-521. [CrossRef]
- Liu Congfeng, Yun Jinwei. A Joint TDOA/FDOA Localization Algorithm Using Bi-iterative Method with Optimal Step Length[J]. Chin. J. Electron., 2021, 30(1): 119-126. [CrossRef]
- Chen Xiaohui, Mengjiao Zhang, Ruan Kai et al., A Ranging Model Based on BP Neural Network, Intell. Autom. Soft Comput., 2015, vol.22, pp.1-5. [CrossRef]
- Yang Zhijun, Mao Lei, GAN Jianhou, DING Hongwei. Performance Analysis and Prediction of Double-Server Polling System Based on BP Neural Network[J]. Chin. J. Electron., 2020, 29(6): 1046-1053. [CrossRef]
- Liu Fang., Xu Long, Ma Xiaoxun, Development of BP neural network and its application in chemistry and chemical engineering, Chem. Ind. Eng. Prog., 2019, Vol.38, pp.2559-2573. [CrossRef]
- Li Zhao, Yi Ren, Qi Wang, et al., “Visible Light Indoor Positioning System Based on Pisarenko Harmonic Decomposition and Neural Network,” Chin. J. Electron.,, 2024, vol. 33, no. 1, pp. 195–203. [CrossRef]
- Jixiang Xu, Jincheng Zhao, Wanzhen Wang et al., Prediction of temperature of tubular truss under fire using artificial neural networks, Fire Saf. J., 2013, Vol.56, pp.74-80. [CrossRef]
- Yifan Li, Cunliang Liu, Xianlong Meng, et al., Background radiation compensation calibration method for film cooling infrared temperature measurement based on BP neural network, Int. Commun. Heat Mass Transf. 2024, Vol.159, Part A, pp.107998. [CrossRef]
- Xu Ying, Wang Kun, Jiang Changhui et al., Motion-Constrained GNSS/INS Integrated Navigation Method Based on BP Neural Network, Remote Sens., 2023, vol.15, no.1. [CrossRef]
- Wenfeng Hao, Yingqi Huang, Guoqi Zhao, Acoustic sources localization for composite pate using arrival time and BP neural network, Polym. Test., Vol 115, 2022. [CrossRef]
- Chong Yang, Xiangbo Xu, Ningyan Guoet et al., Cooperative Localization of Firefighters Based on Relative Ranging Constraints of UWB and Autonomous Navigation, Electronics, 2023, no. 5. [CrossRef]
- Will Heiko, Hillebrandt Thomas, Kyas Marcel, Wireless sensor networks in emergency scenarios: the Feuer Where deployment, Association for Computing Machinery, 2012, pp.9–14. [CrossRef]
- Han, R. Q, Application of inertial navigation high precision positioning system based on SVM optimization, Syst. Soft Comput. 2024, 6, 2772-9419. [CrossRef]
- Yang Gang, Zhu Shiling, Li Qiang et al., UWB/INS Based Indoor Positioning and NLOS Detection Algorithm for Firefighters, 2020 IEEE 22nd International Conference on High Performance Computing and Communications; IEEE 18th International Conference on Smart City; IEEE 6th International Conference on Data Science and Systems (HPCC/SmartCity/DSS), 2020, pp.909-916. [CrossRef]
- Li Jinyang, Xie Zhiheng, Sun Xiaoshan et al., An Automatic and Accurate Localization System for Firefighters, 2018 IEEE/ACM Third International Conference on Internet-of-Things Design and Implementation (IoTDI), Nanyang Technological University , Singapore,2018, pp.13-24. [CrossRef]
- Li Tingting Wang Qi, Xu Yongjun, et al., Design and Implementation of Autonomous Navigation and Search and Rescue System for Firefighters Based on Cloud Platform, J. Command Control, 2023, vol.9, no.3, pp.303. [CrossRef]
- Gandhi Siddhesh Rajan, Ganz Aura, Mullett G, FIREGUIDE: Firefighter guide and tracker, 2010 Annual International Conference of the IEEE Engineering in Medicine and Biology, 2010, pp.2037-2040. [CrossRef]
- F. Pascucci, R. Setola, An Indoor localization Framework for Hybrid Rescue Teams, IFAC Proceedings Volumes, 2011, vol 44, pp.4765-4770. [CrossRef]
- Minja Aleksandar, Šenk, Vojin, Indoor navigation system for firefighters, 2011 19thTelecommunications Forum (TELFOR) Proceedings of Papers, 2011, pp.1324-1327. [CrossRef]
- Berrahal Sarra, Boudriga N., Chammem Mhamed, Wban-Assisted Navigation for Firefighters in Indoor Environments, Ad Hoc Sens. Wirel. Networks, 2016, vol.33, pp.81-119.
- Vey Cassandre, Spies François, Pestourie Baptiste, et al., POUCET: A Multi-Technology Indoor Positioning Solution for Firefighters and Soldiers, 2021. [CrossRef]
- John-Olof Nilsson, Dave Zachariah, Isaac Skog, et al., Cooperative localization by dual foot-mounted inertial sensors and inter-agent ranging, EURASIP J. Adv. Signal Process., 2013. [CrossRef]
- Jiménez Ruiz Antonio Ramón, Seco Granja, Fernando, Comparing Ubisense, BeSpoon, and DecaWave UWB Location Systems: Indoor Performance Analysis, IEEE Trans. Instrum. Meas. 2017, vol.66, no.8, pp. 2106-2117. [CrossRef]
Figure 1.
Structure diagram of BP neural network model.
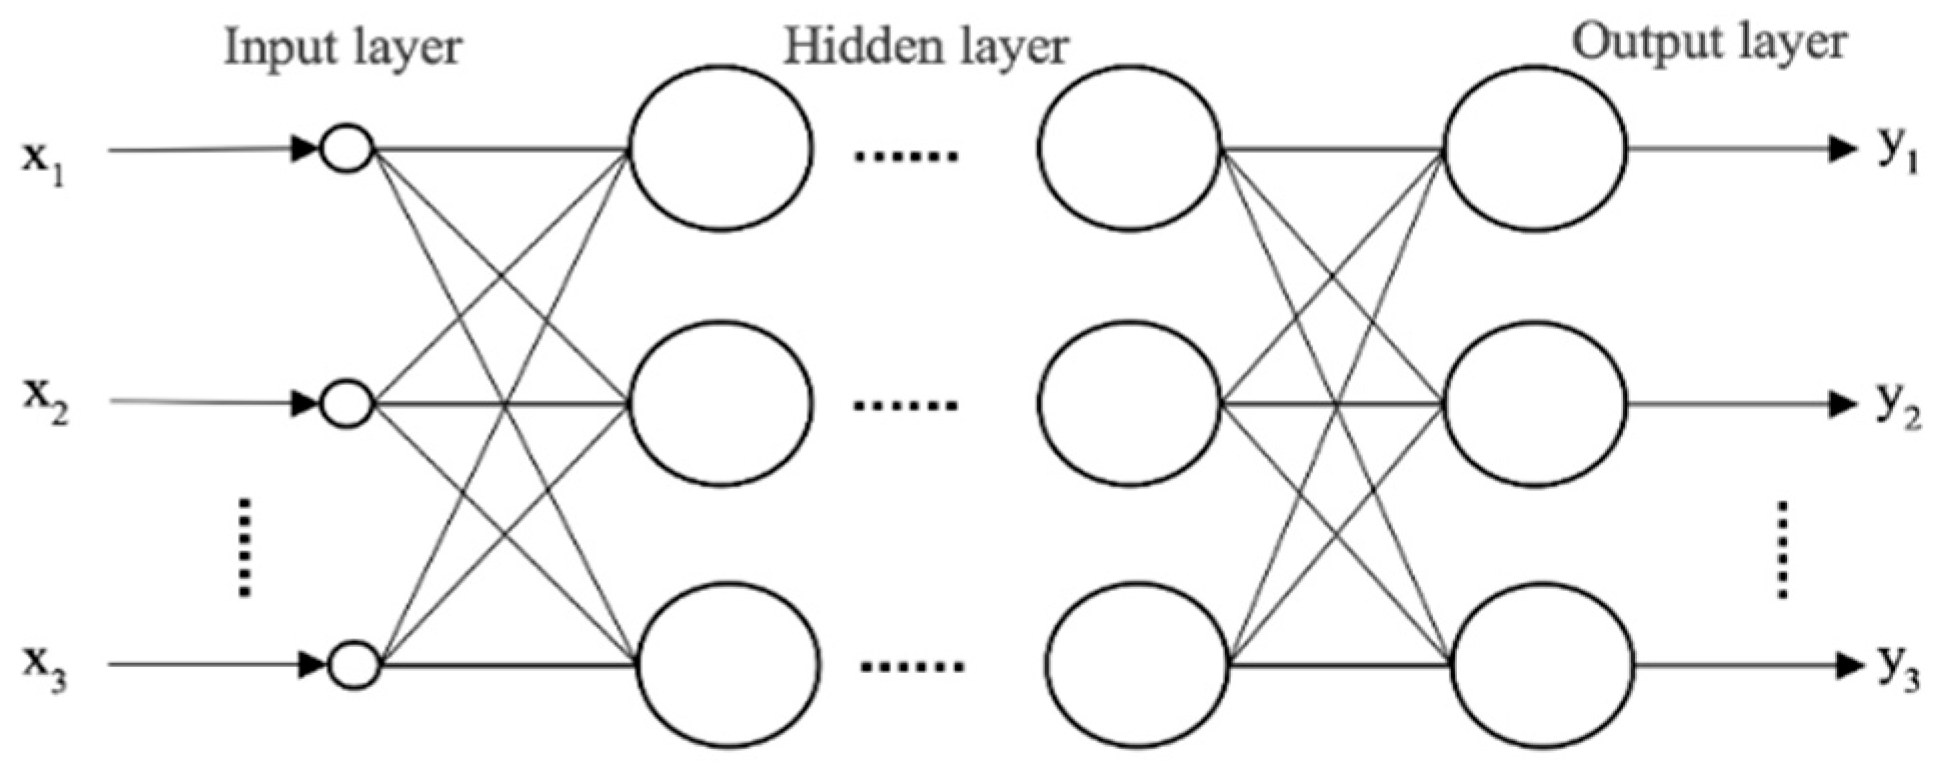
Figure 2.
Neuron model diagram.
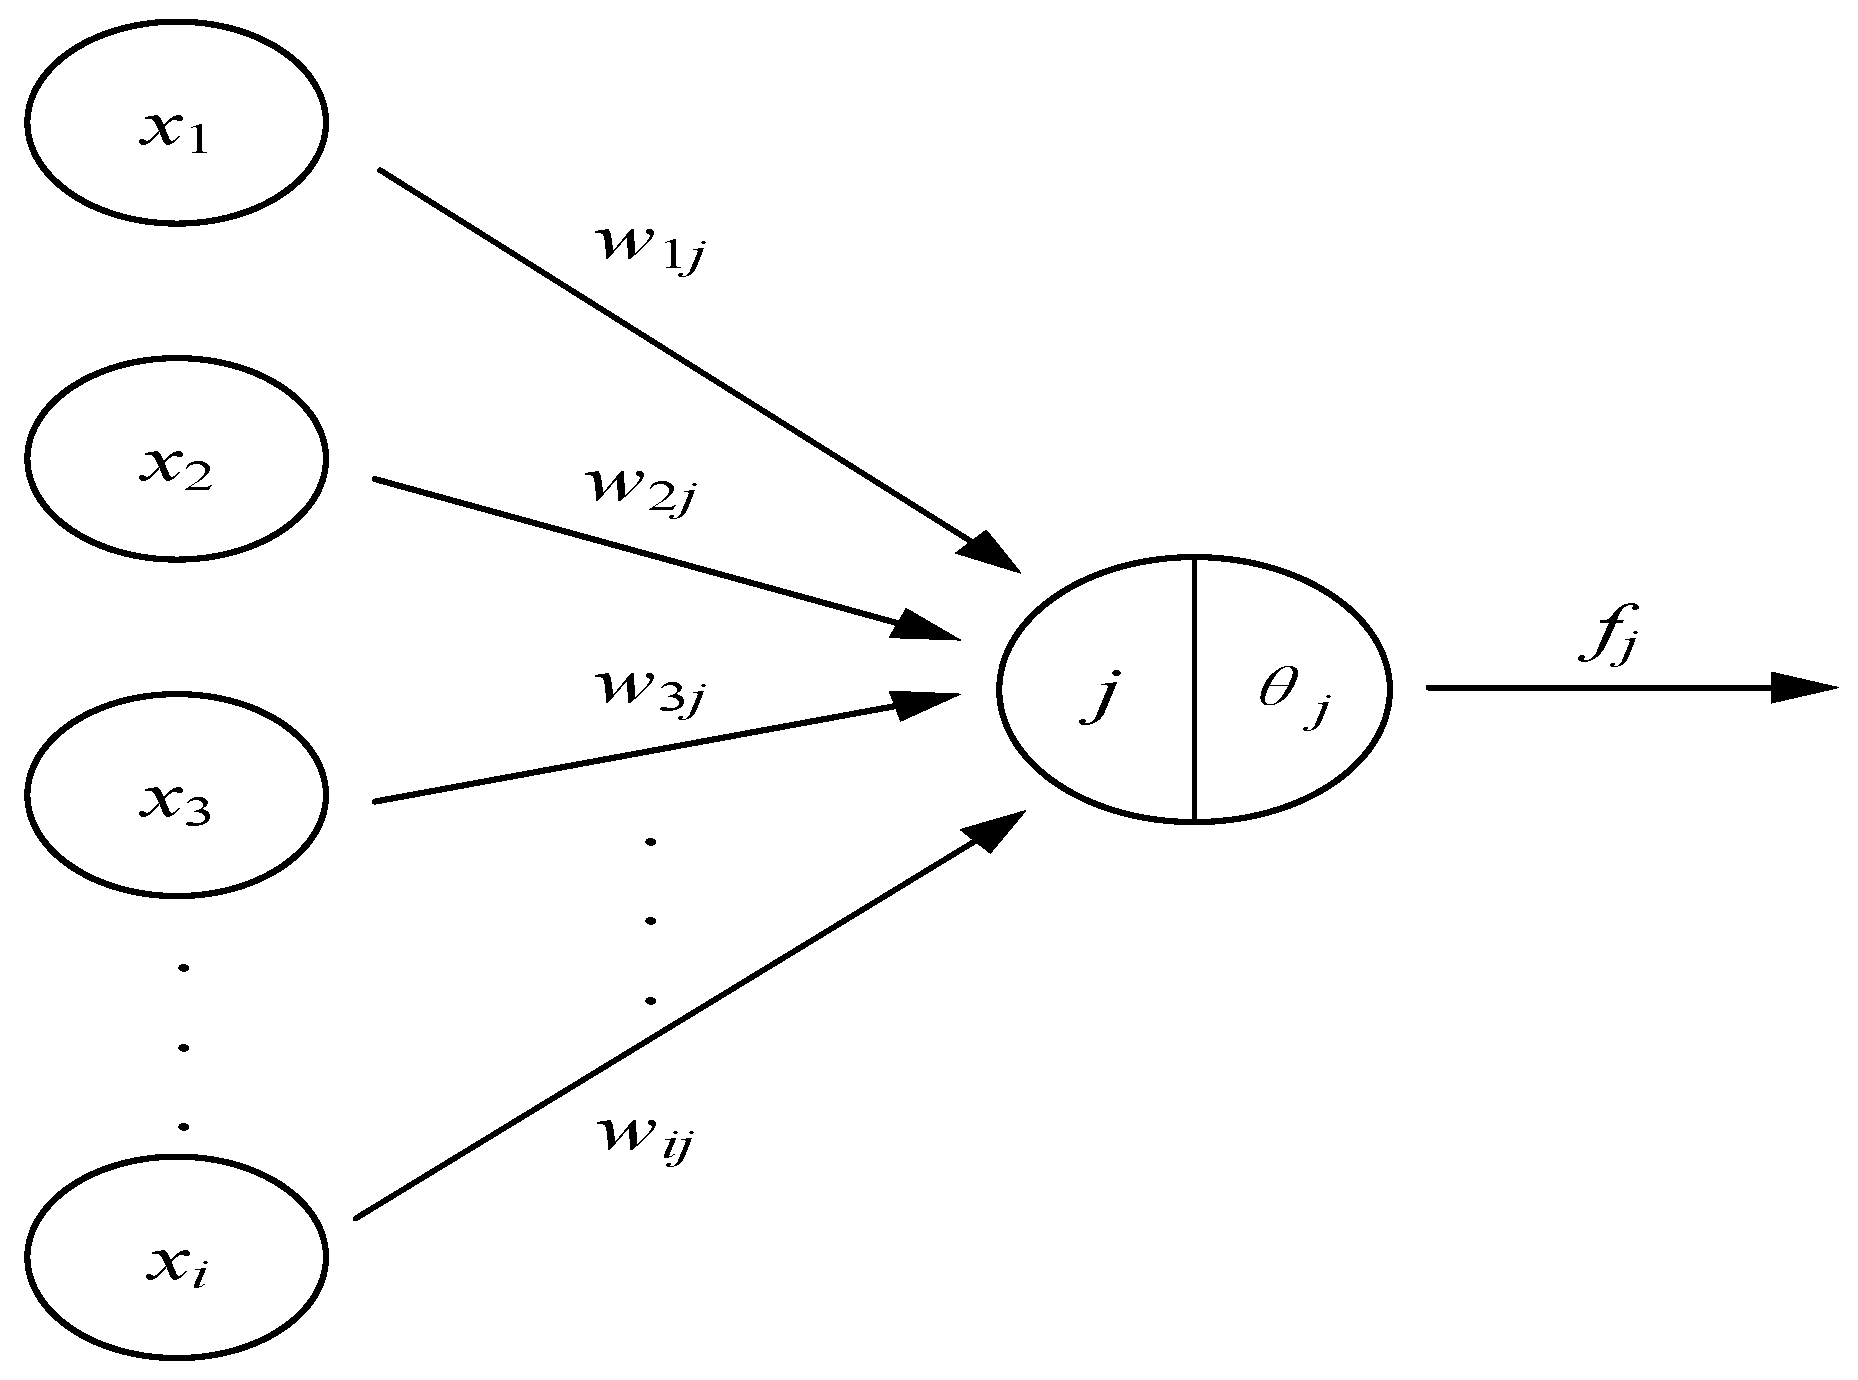
Figure 3.
BP neural network algorithm flowchart.
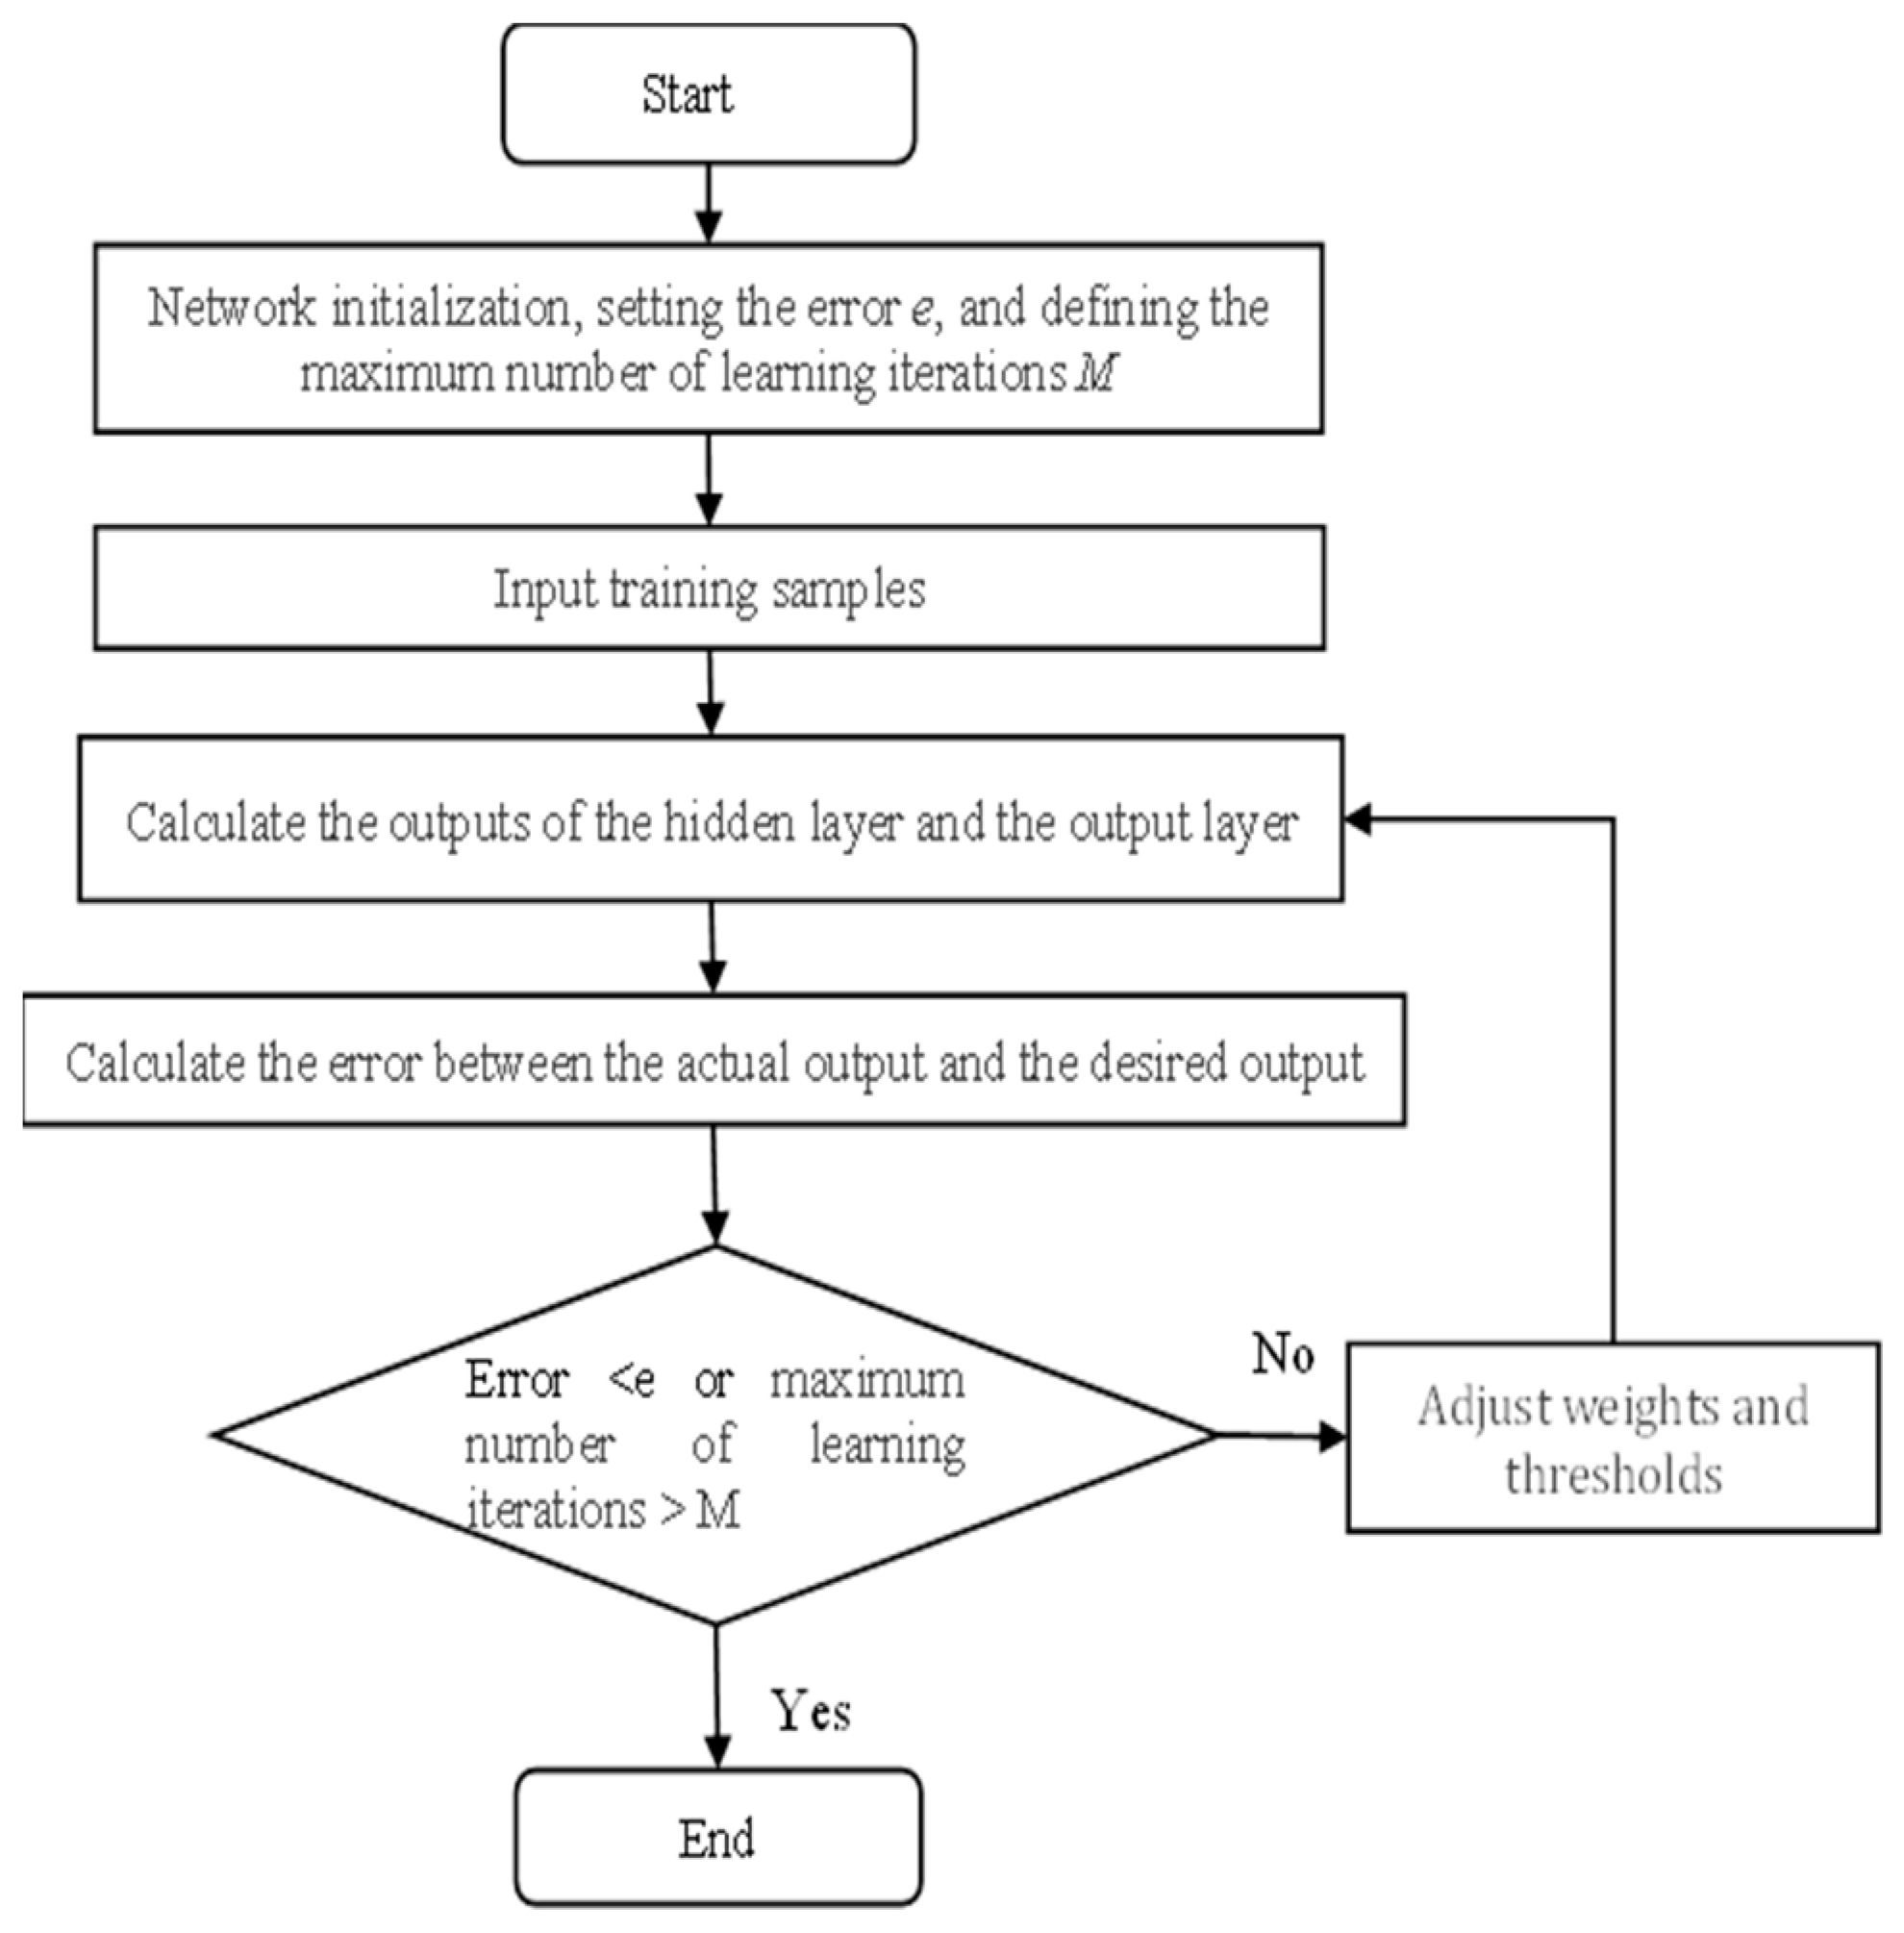
Figure 4.
400 positioning points for BP neural network training and testing.
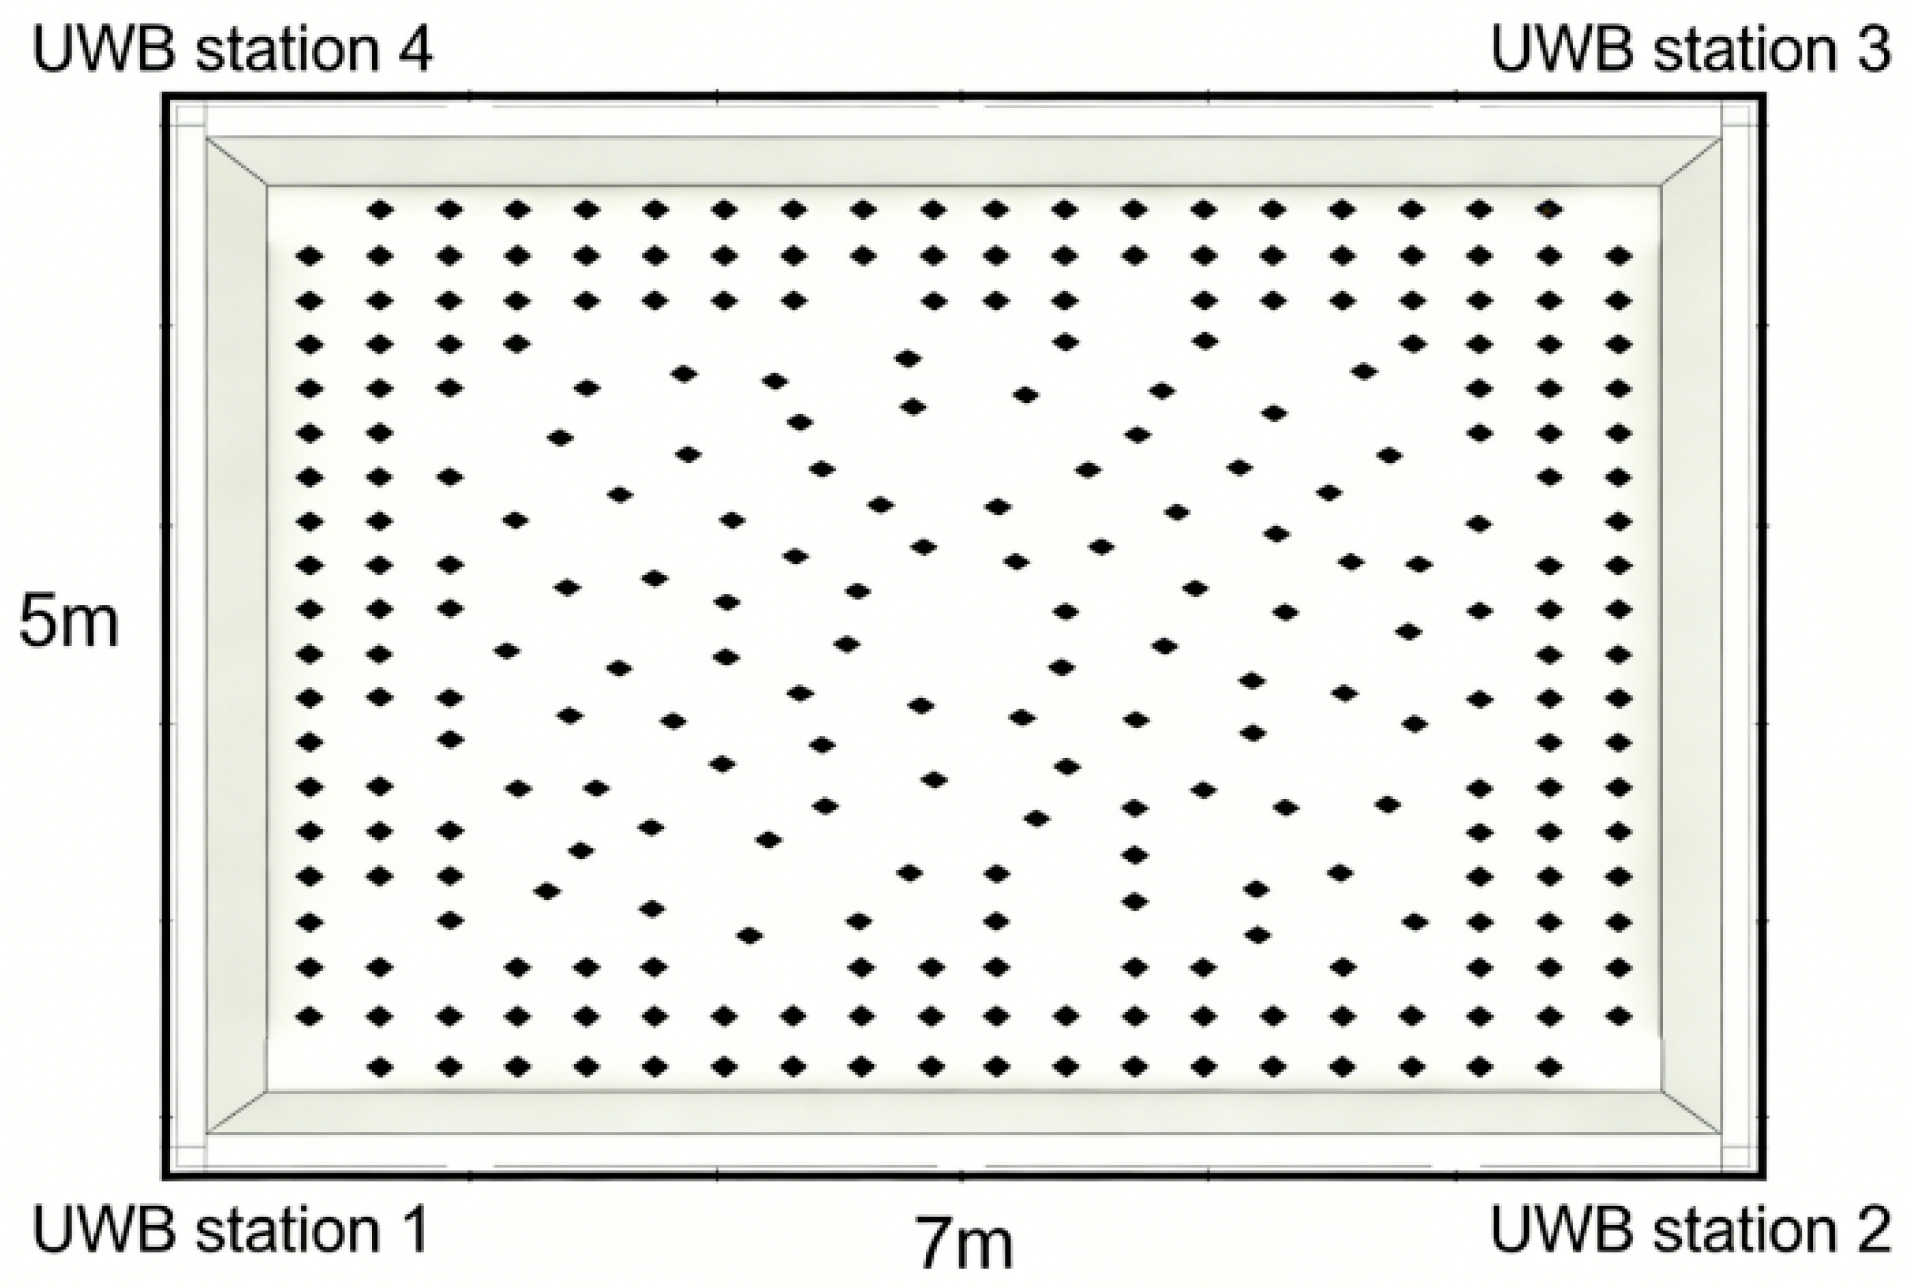
Figure 5.
Comparison among the predicted positions and the real positions.
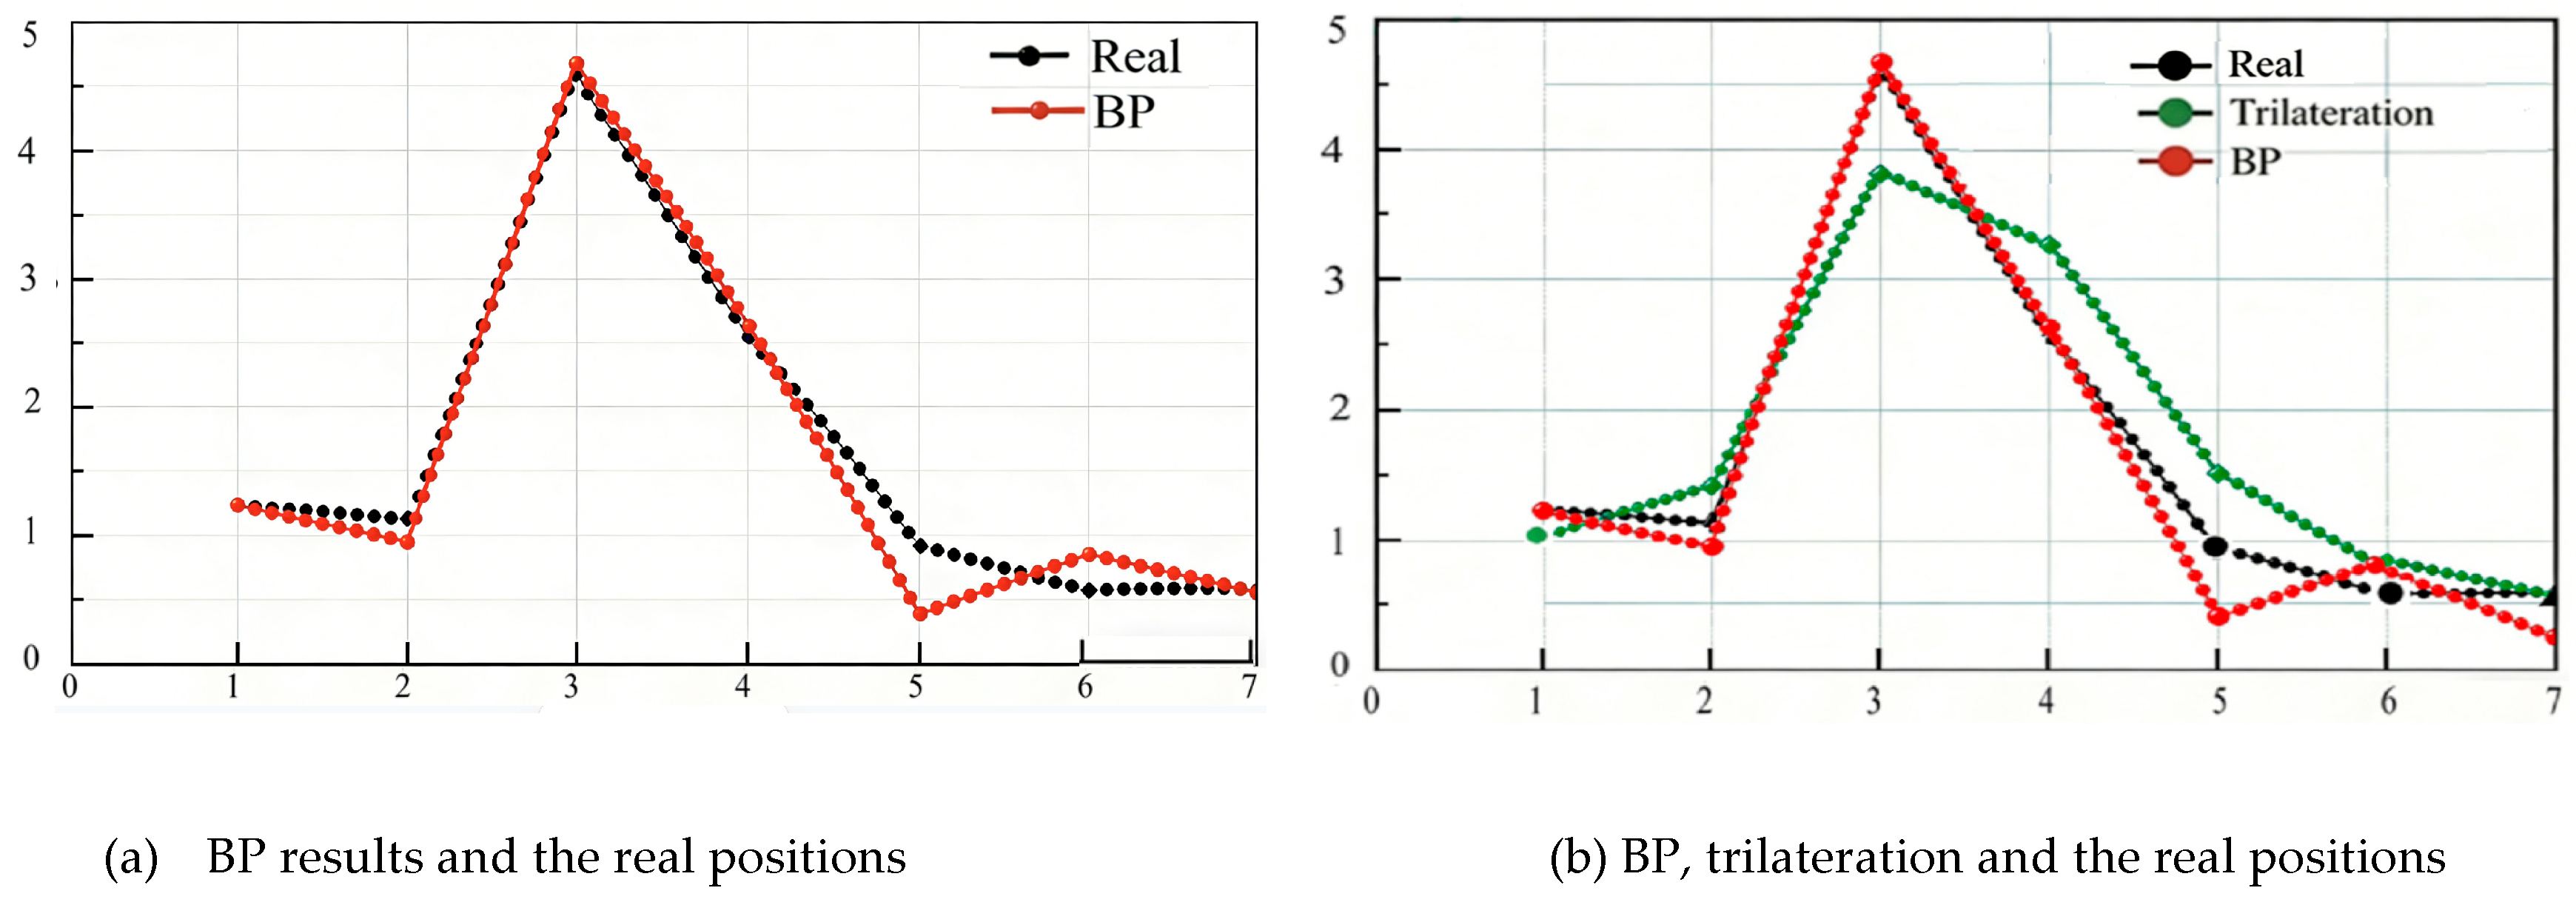
Figure 6.
Structural framework of the system.
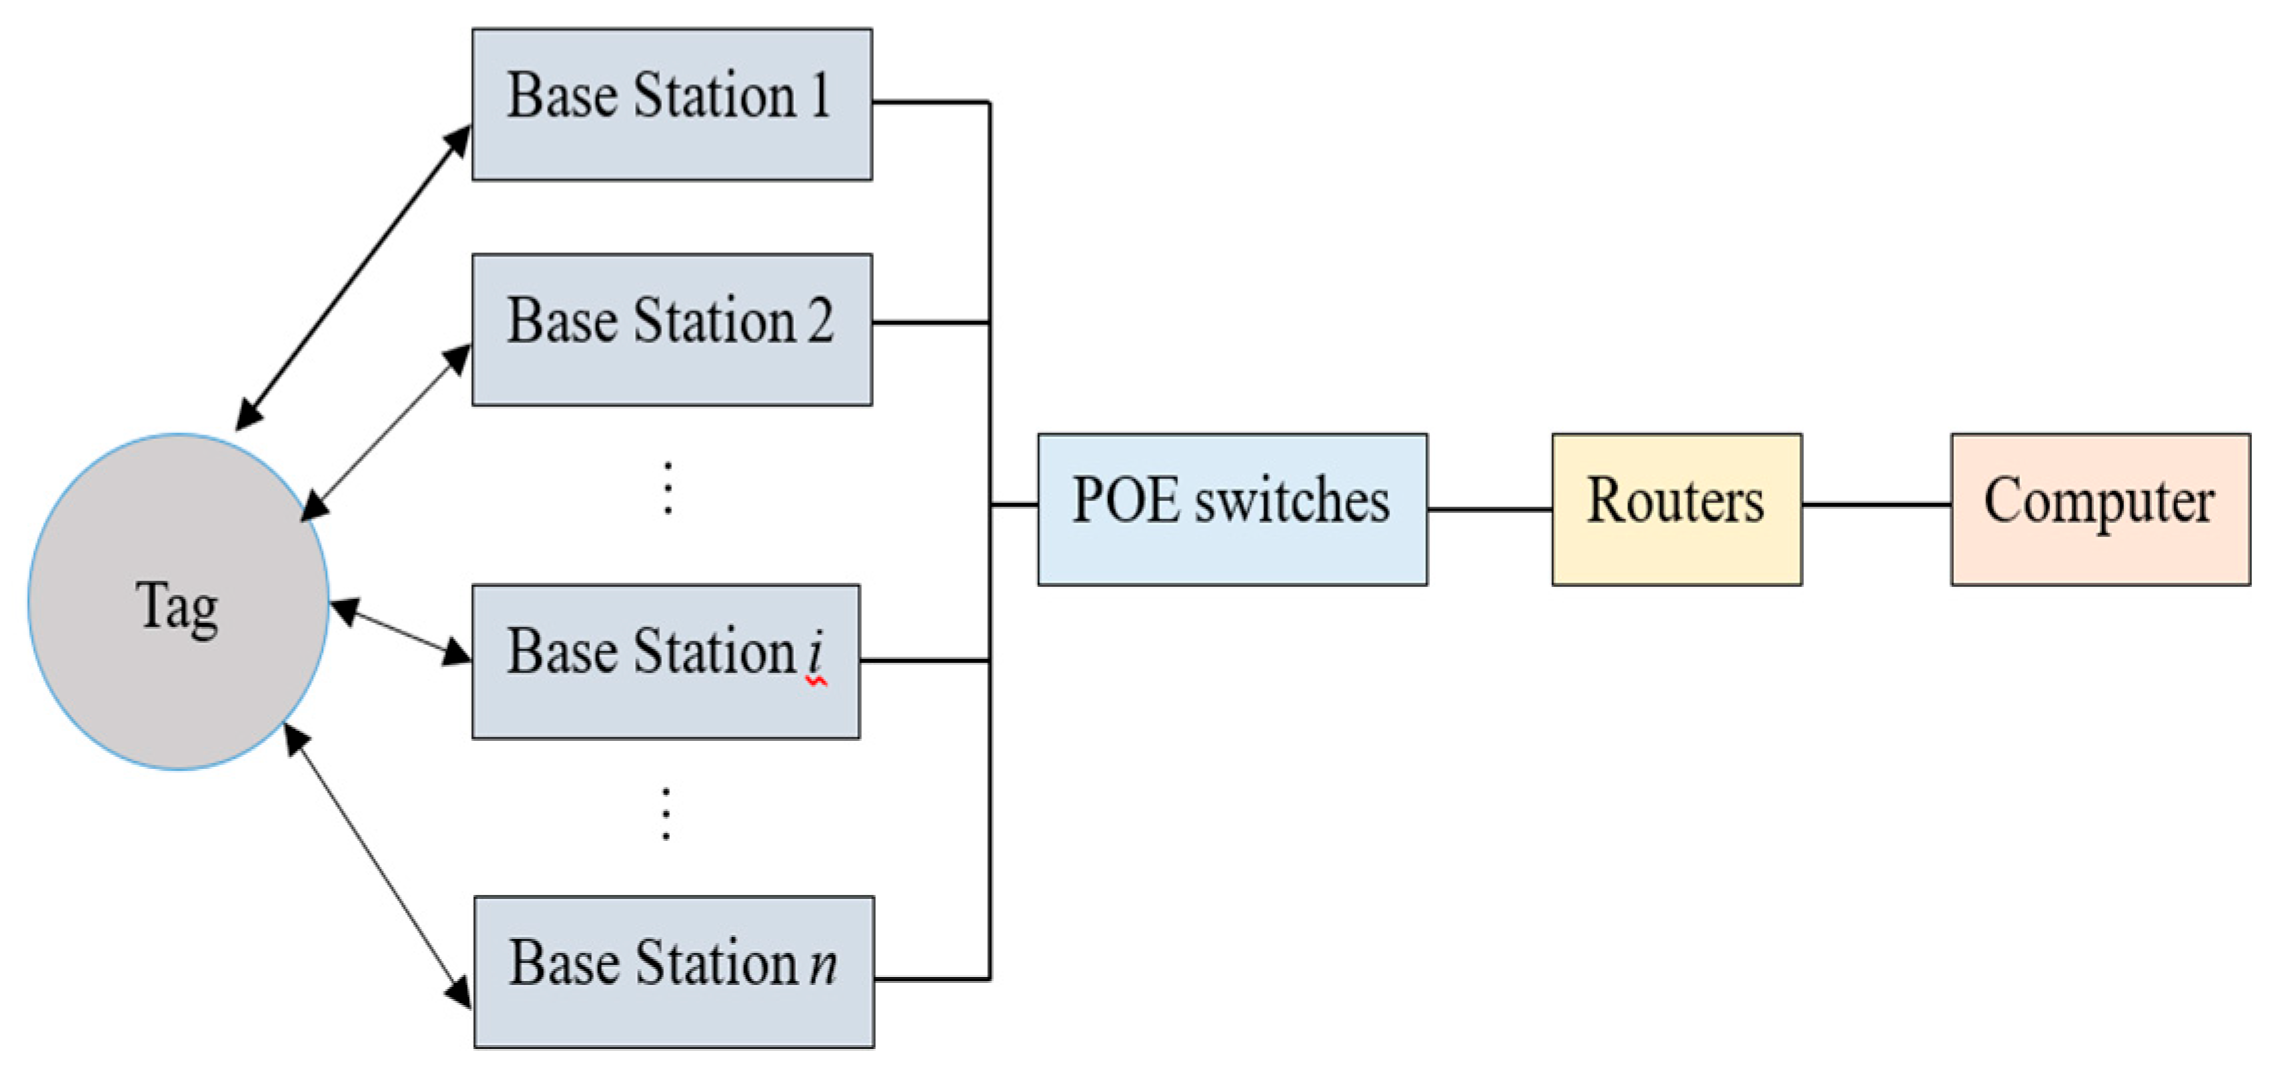
Figure 7.
Display interface of the system.
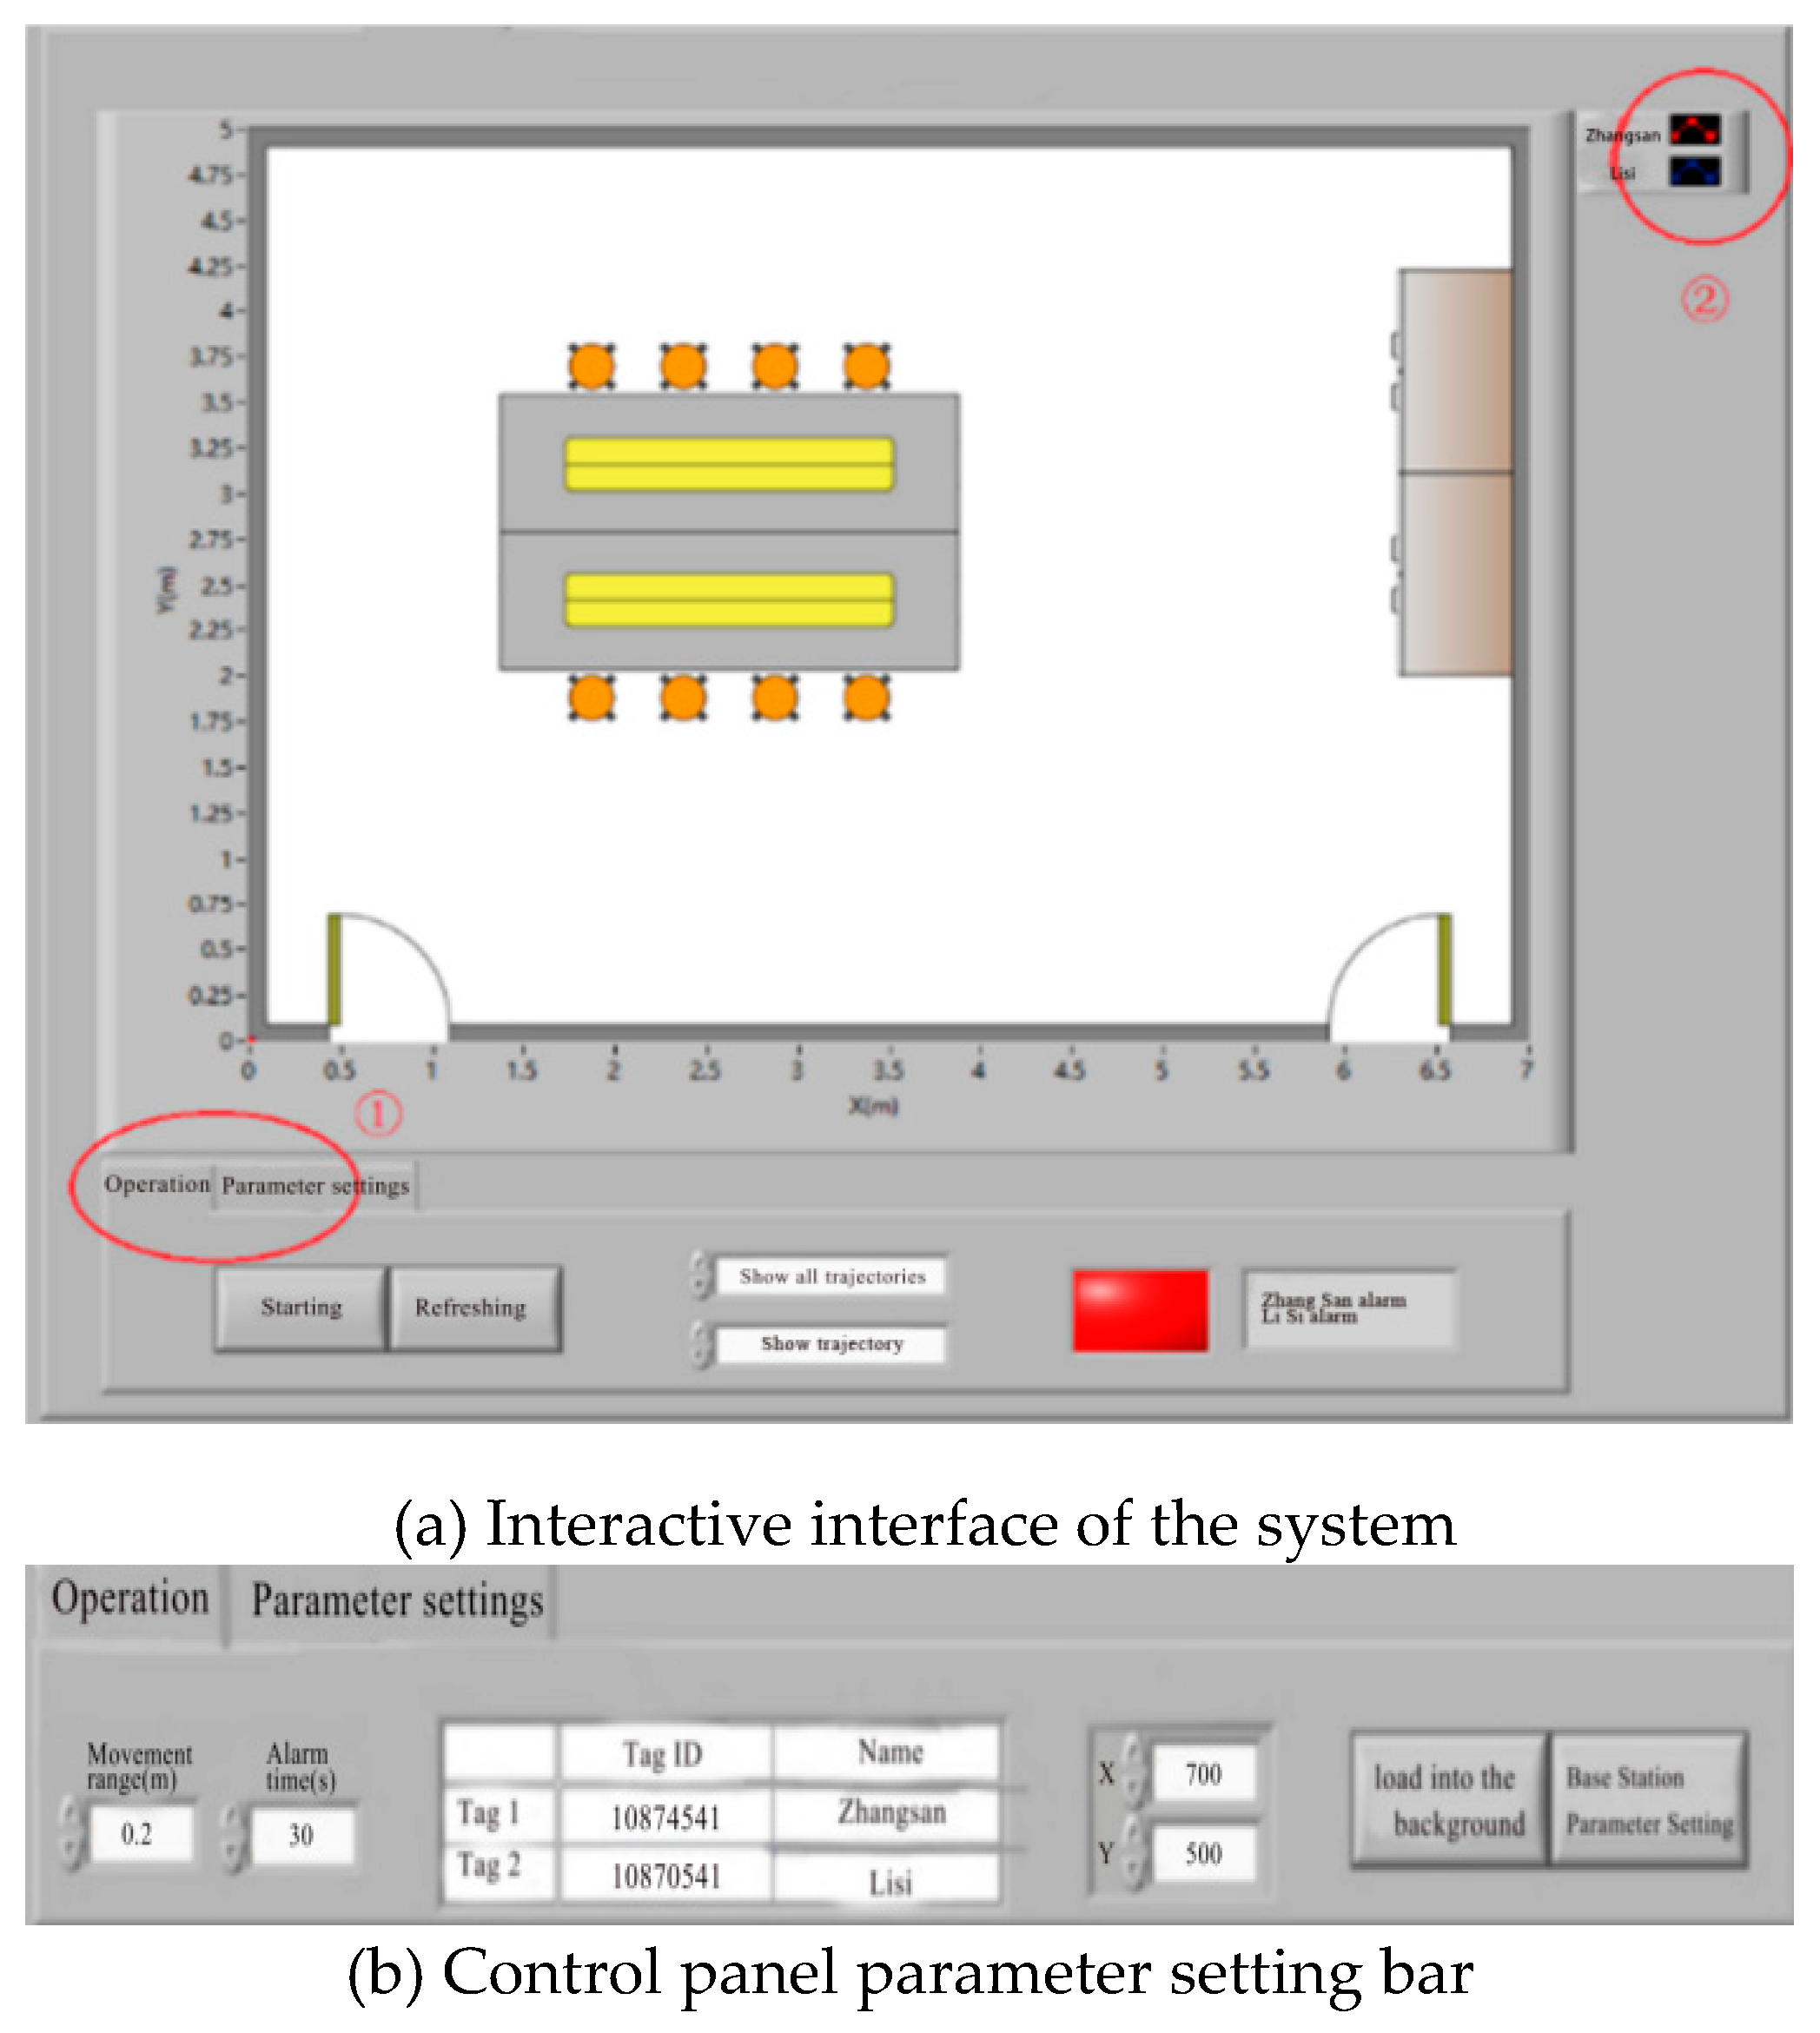
Figure 8.
Physical image of positioning system constructed.
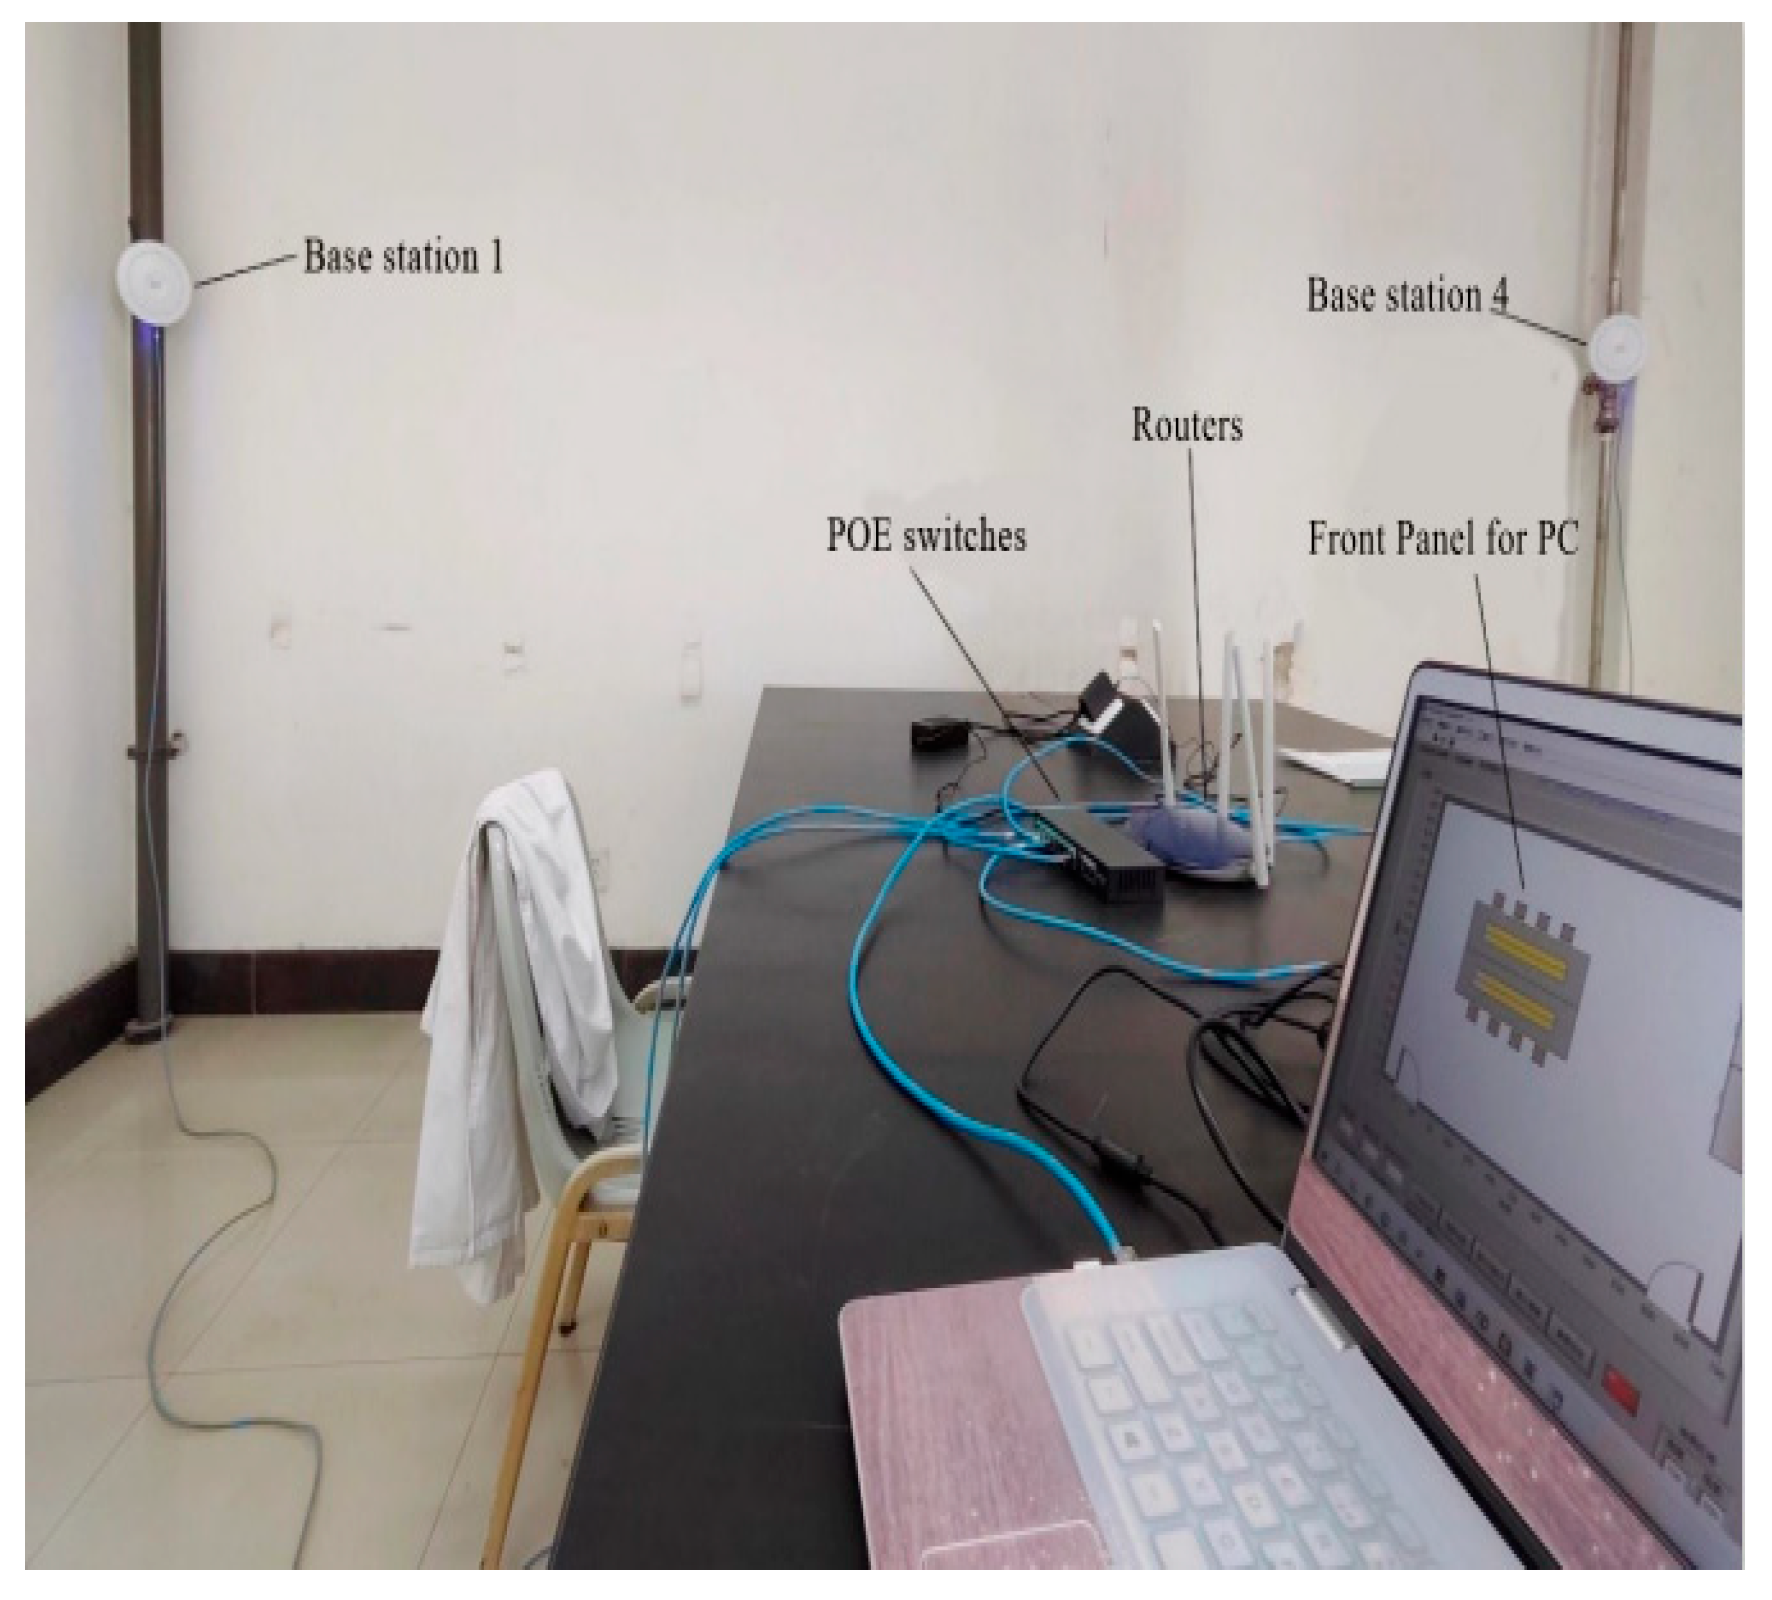
Figure 9.
Comparison between the calculation results of trilateration and BP neural network.
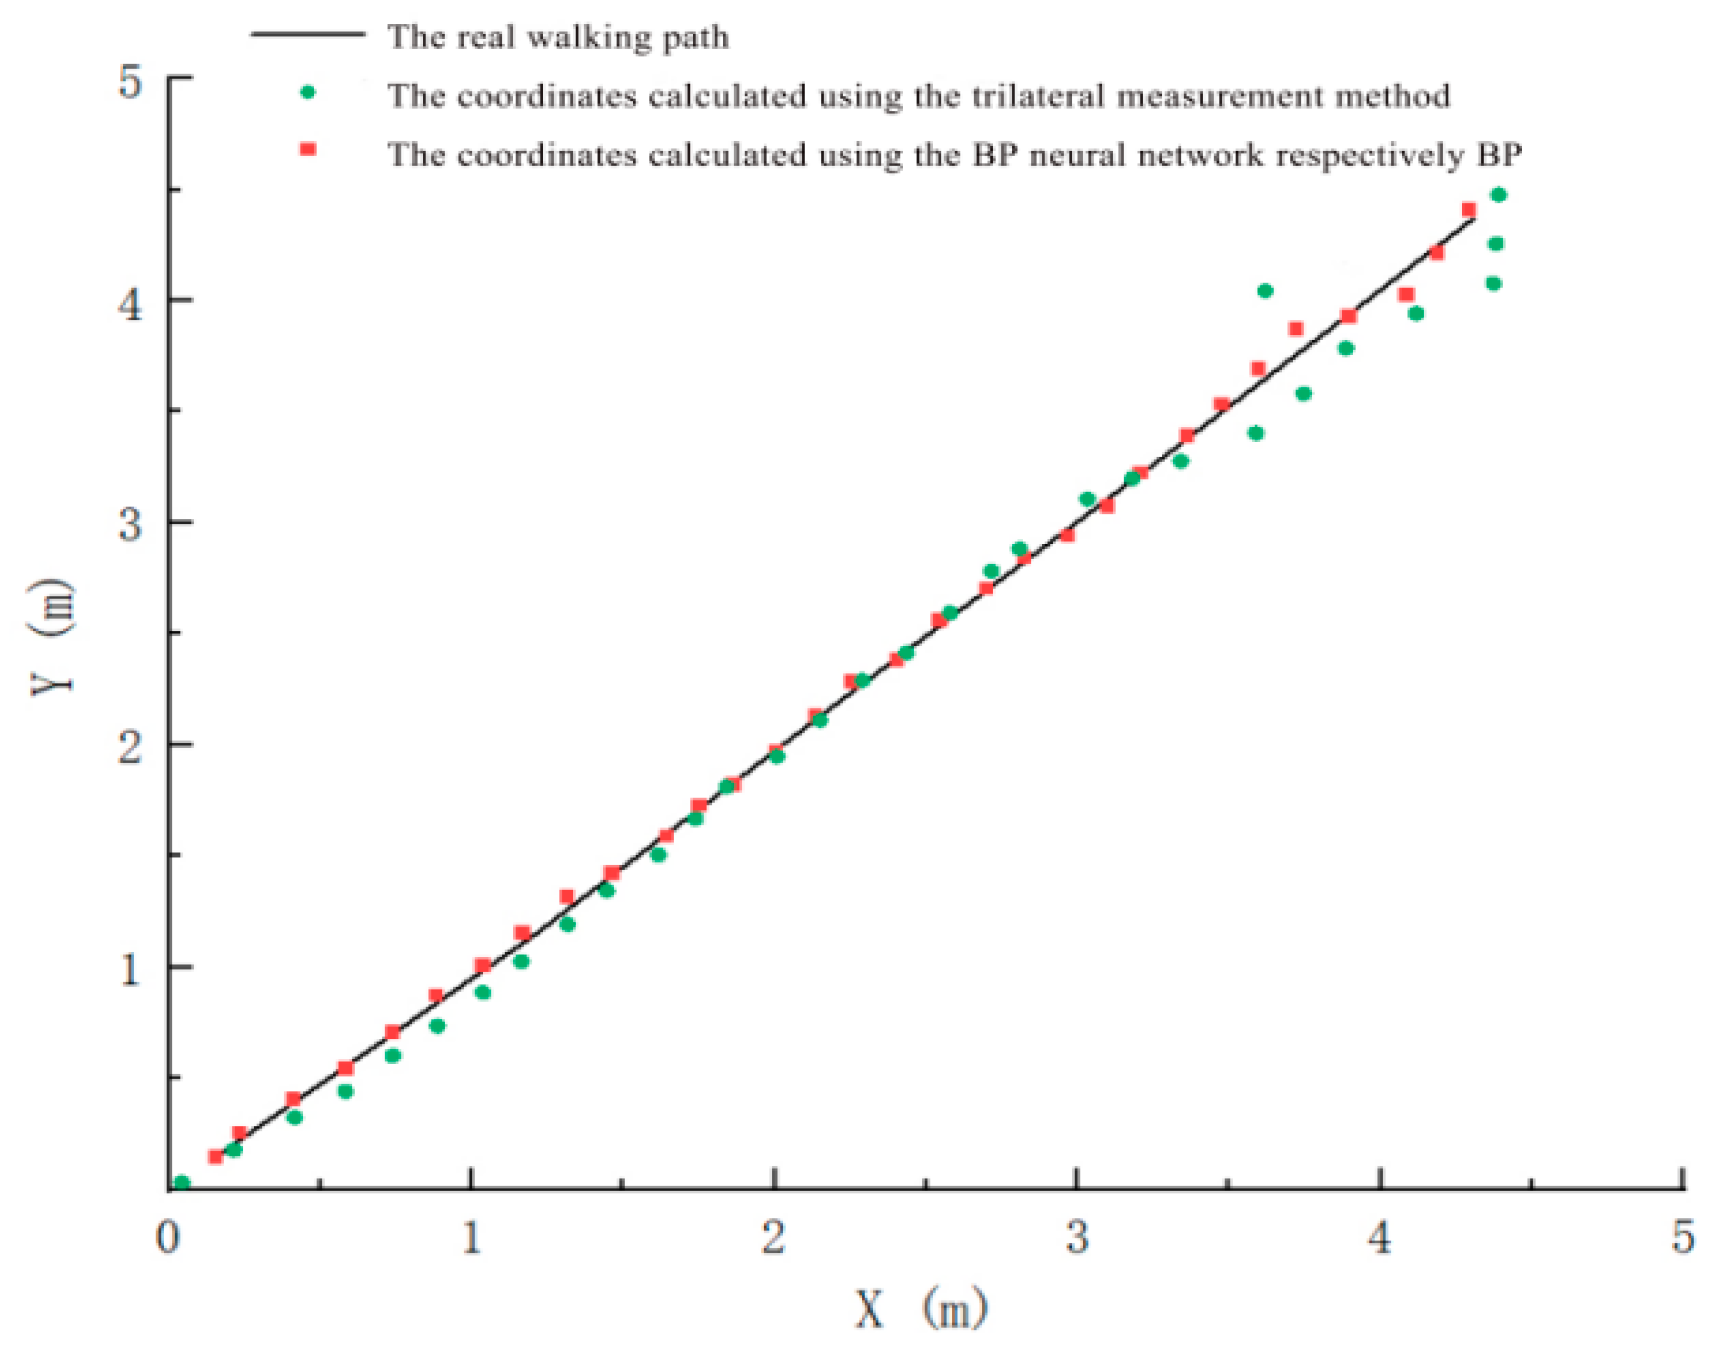
Figure 10.
Comparison of RMSE between trilateration method and BP neural network.
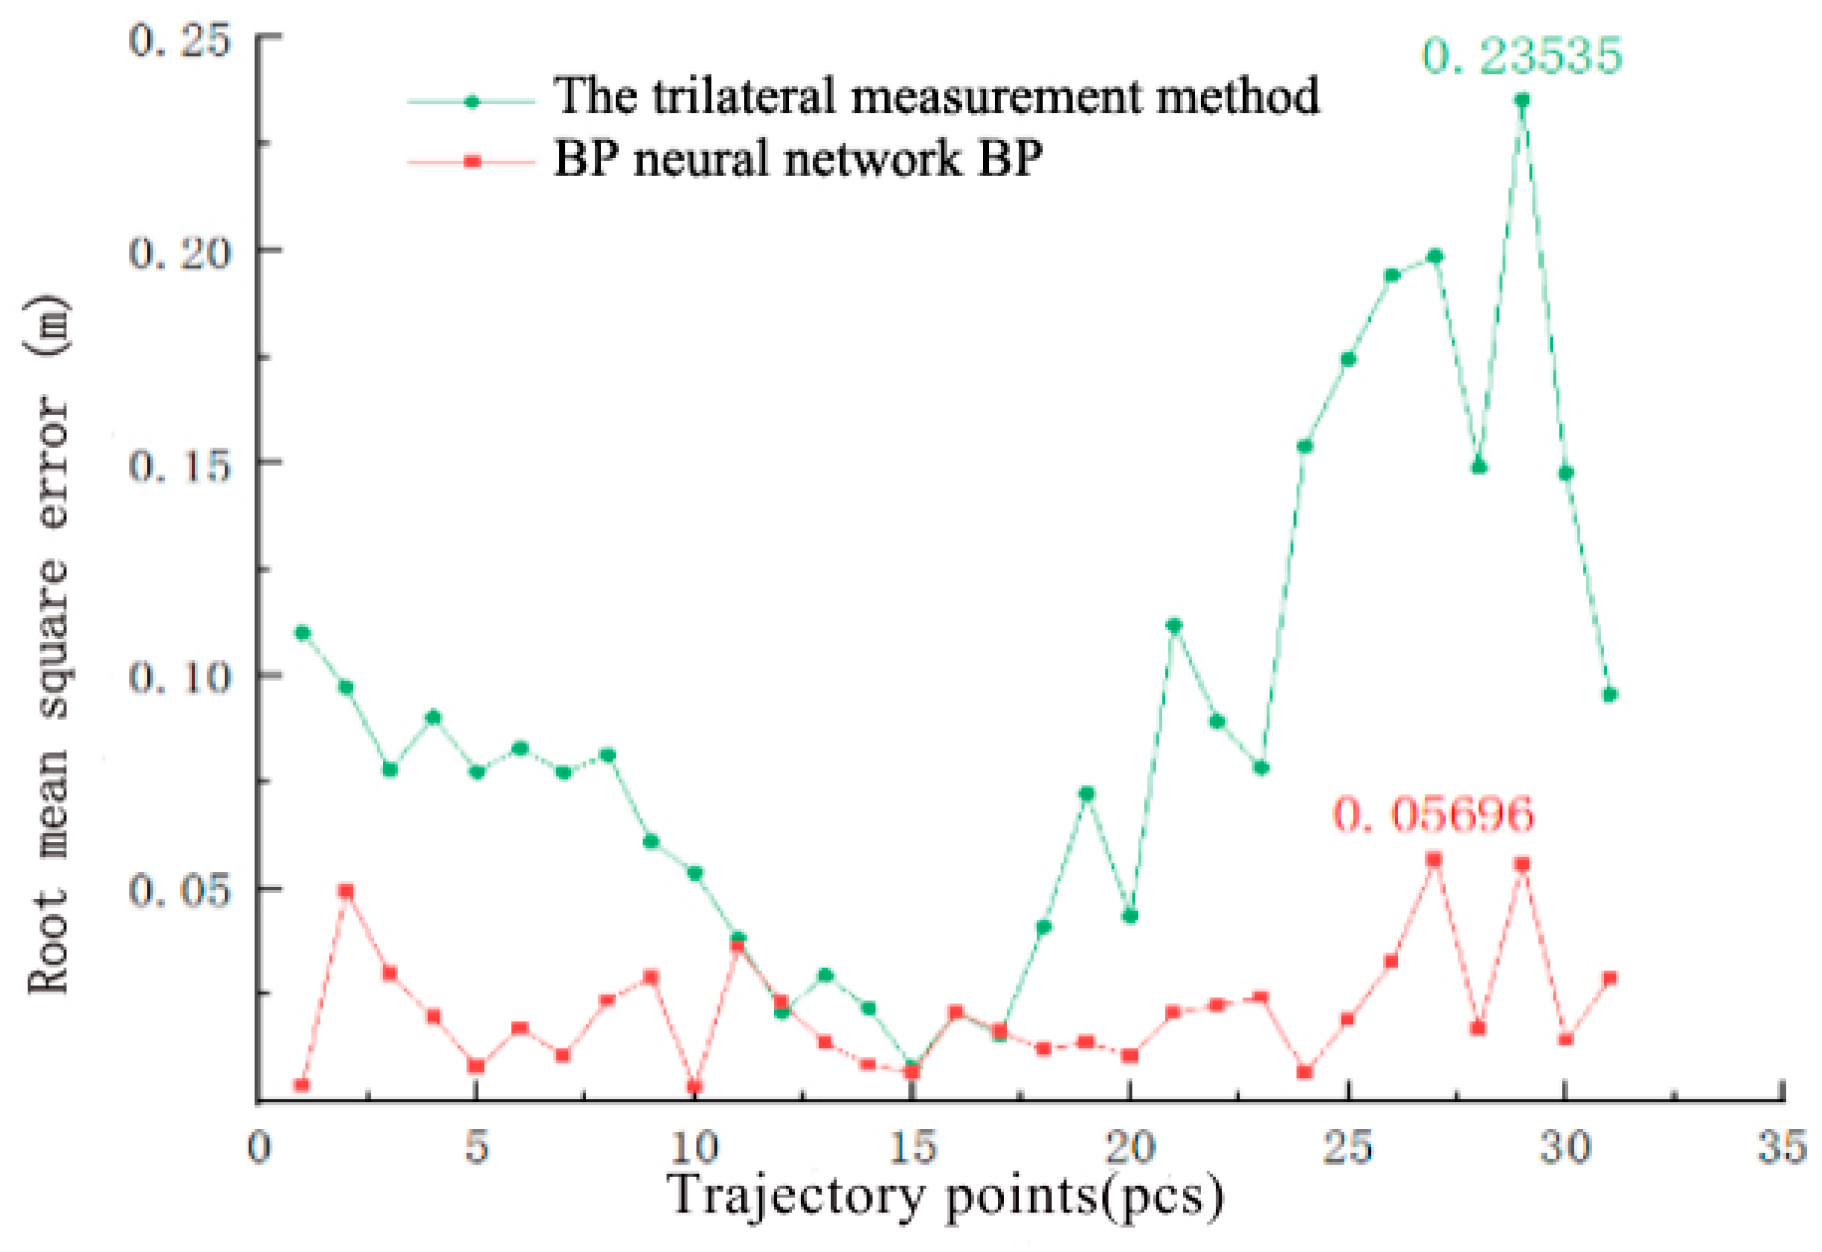
Figure 11.
Coordinate data recorded under static state.
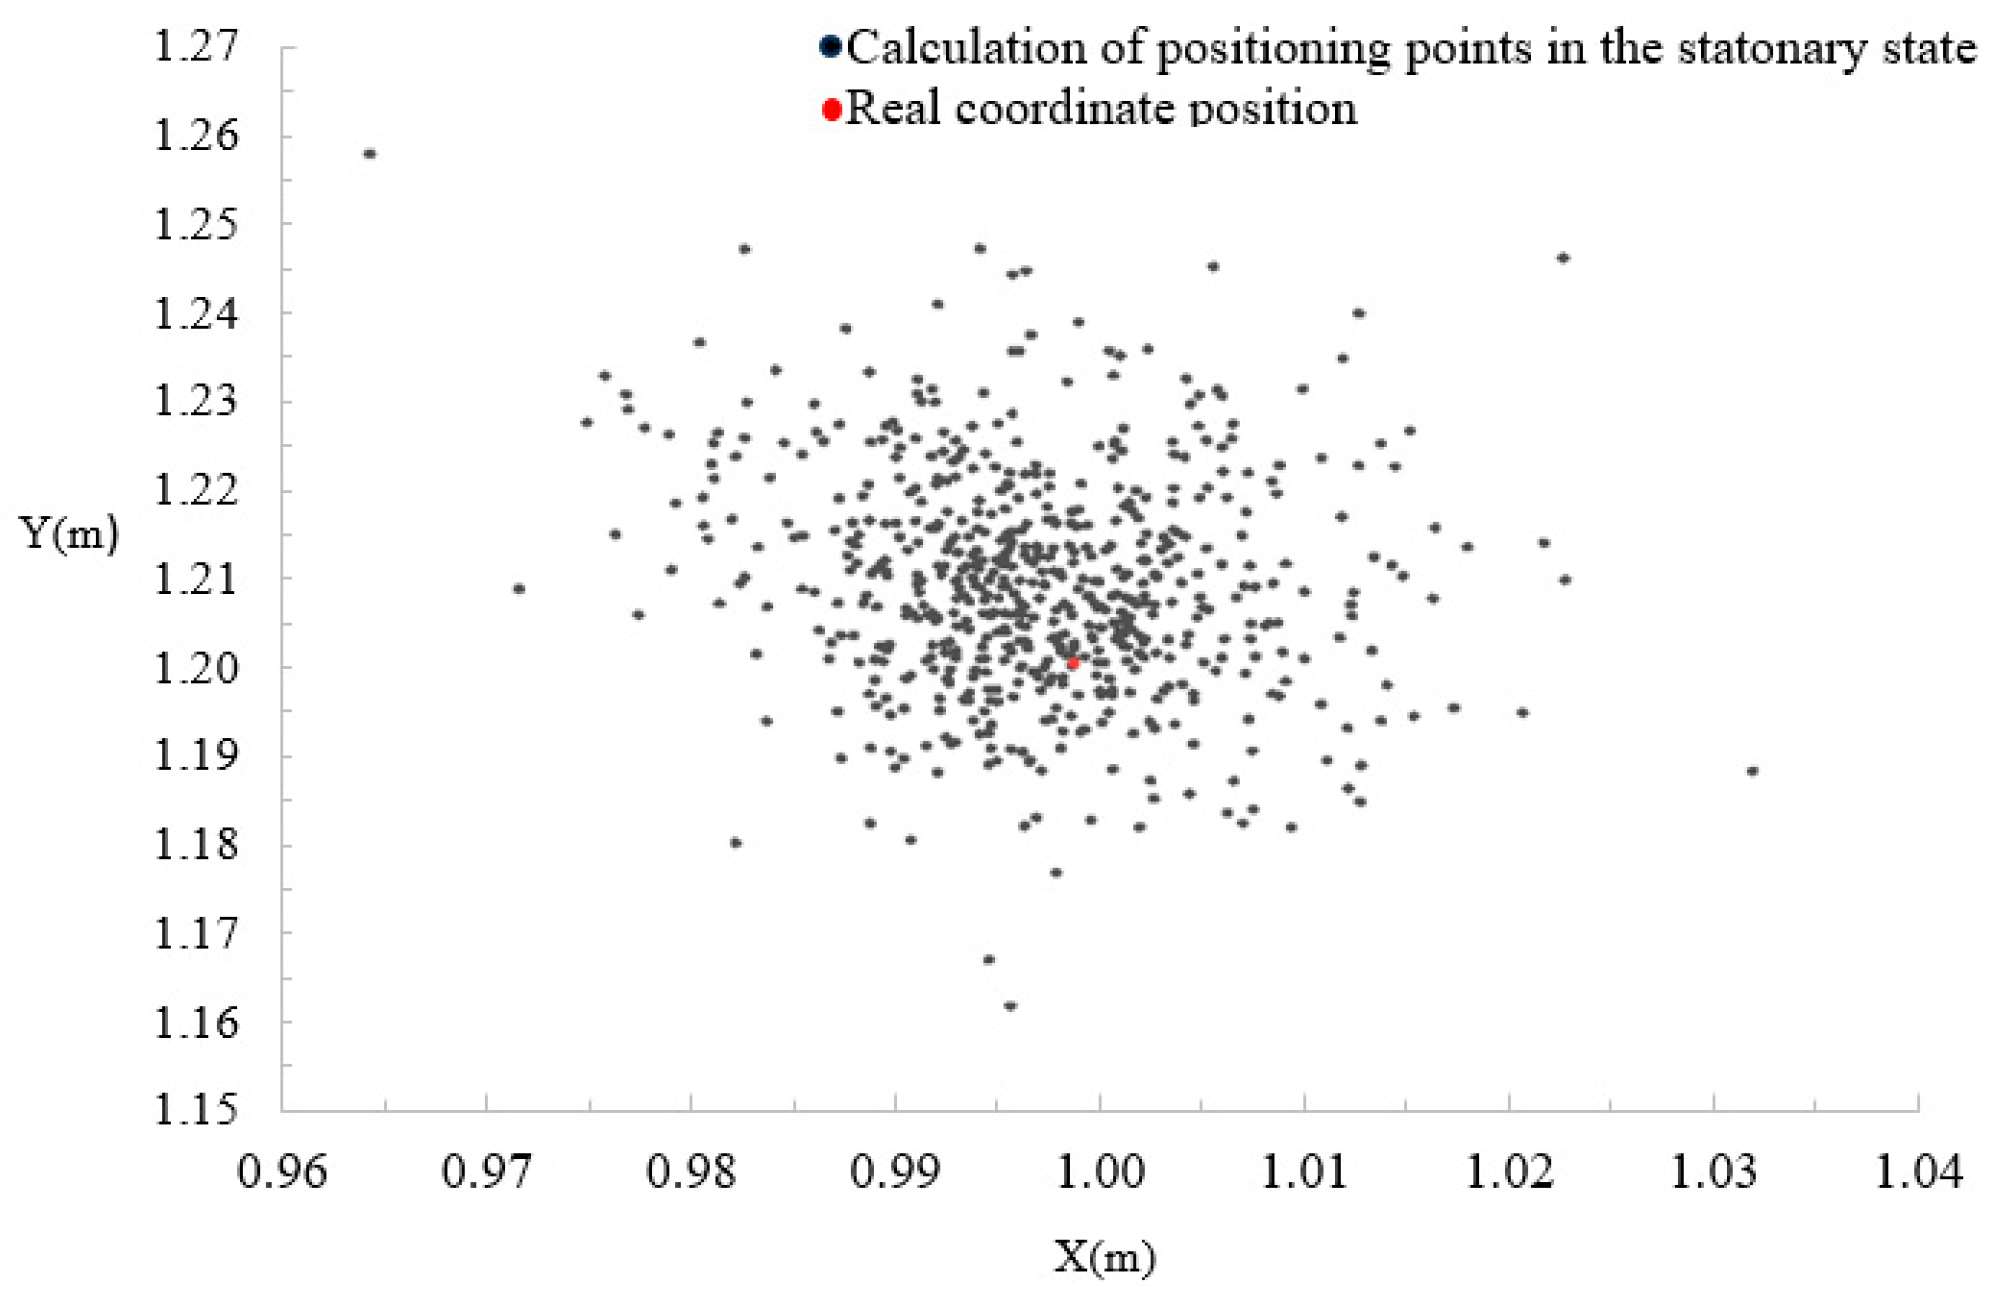
Figure 12.
Comparison of recorded trajectory and actual walking path.
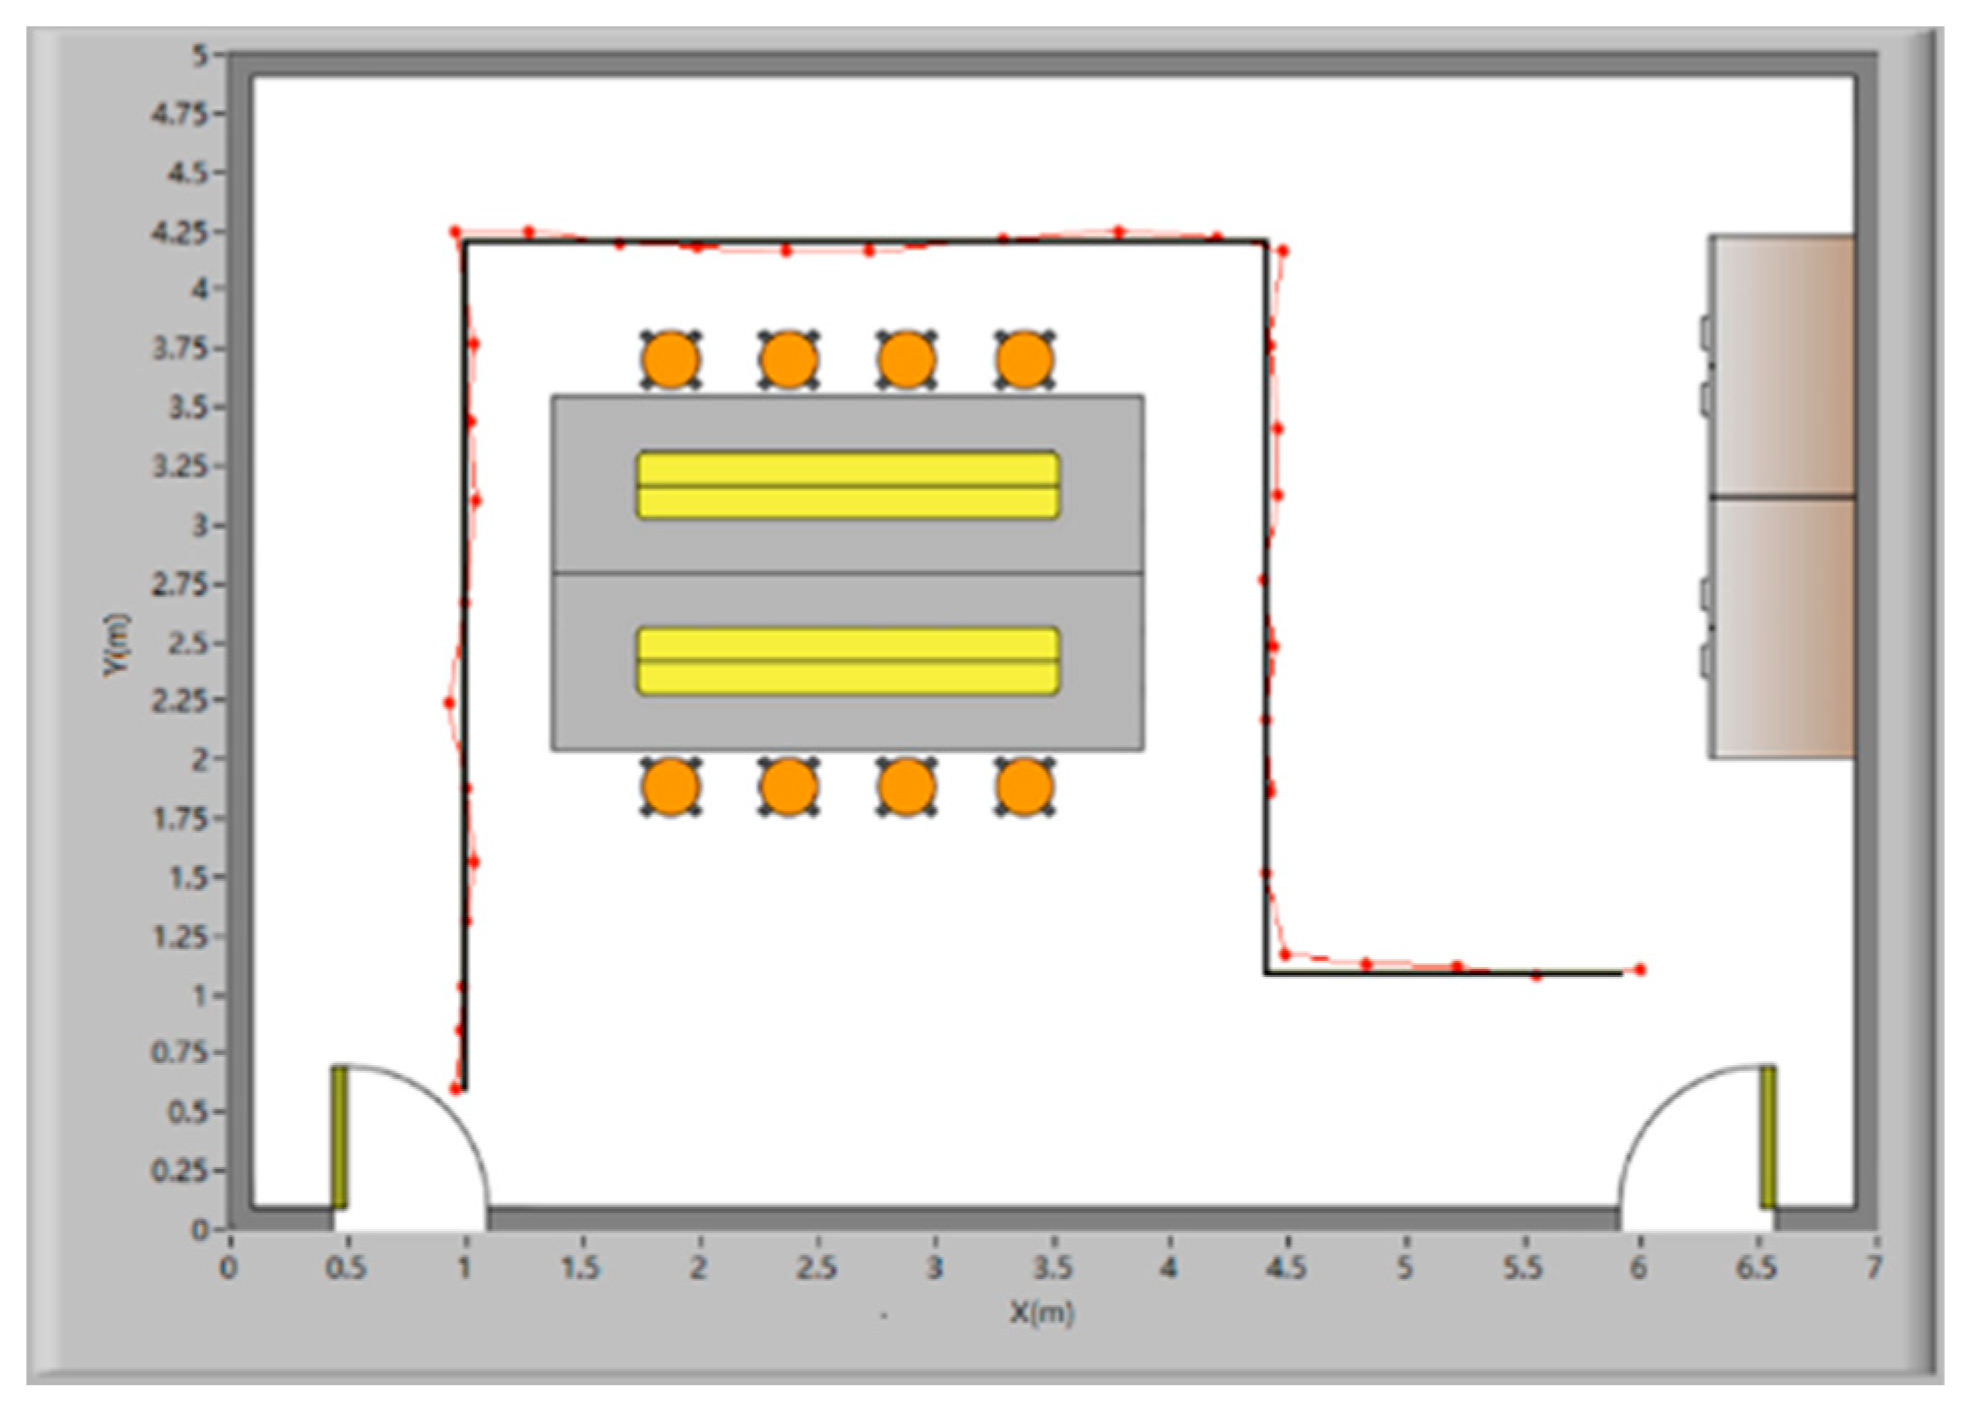
Figure 13.
Display of the walking trajectories.
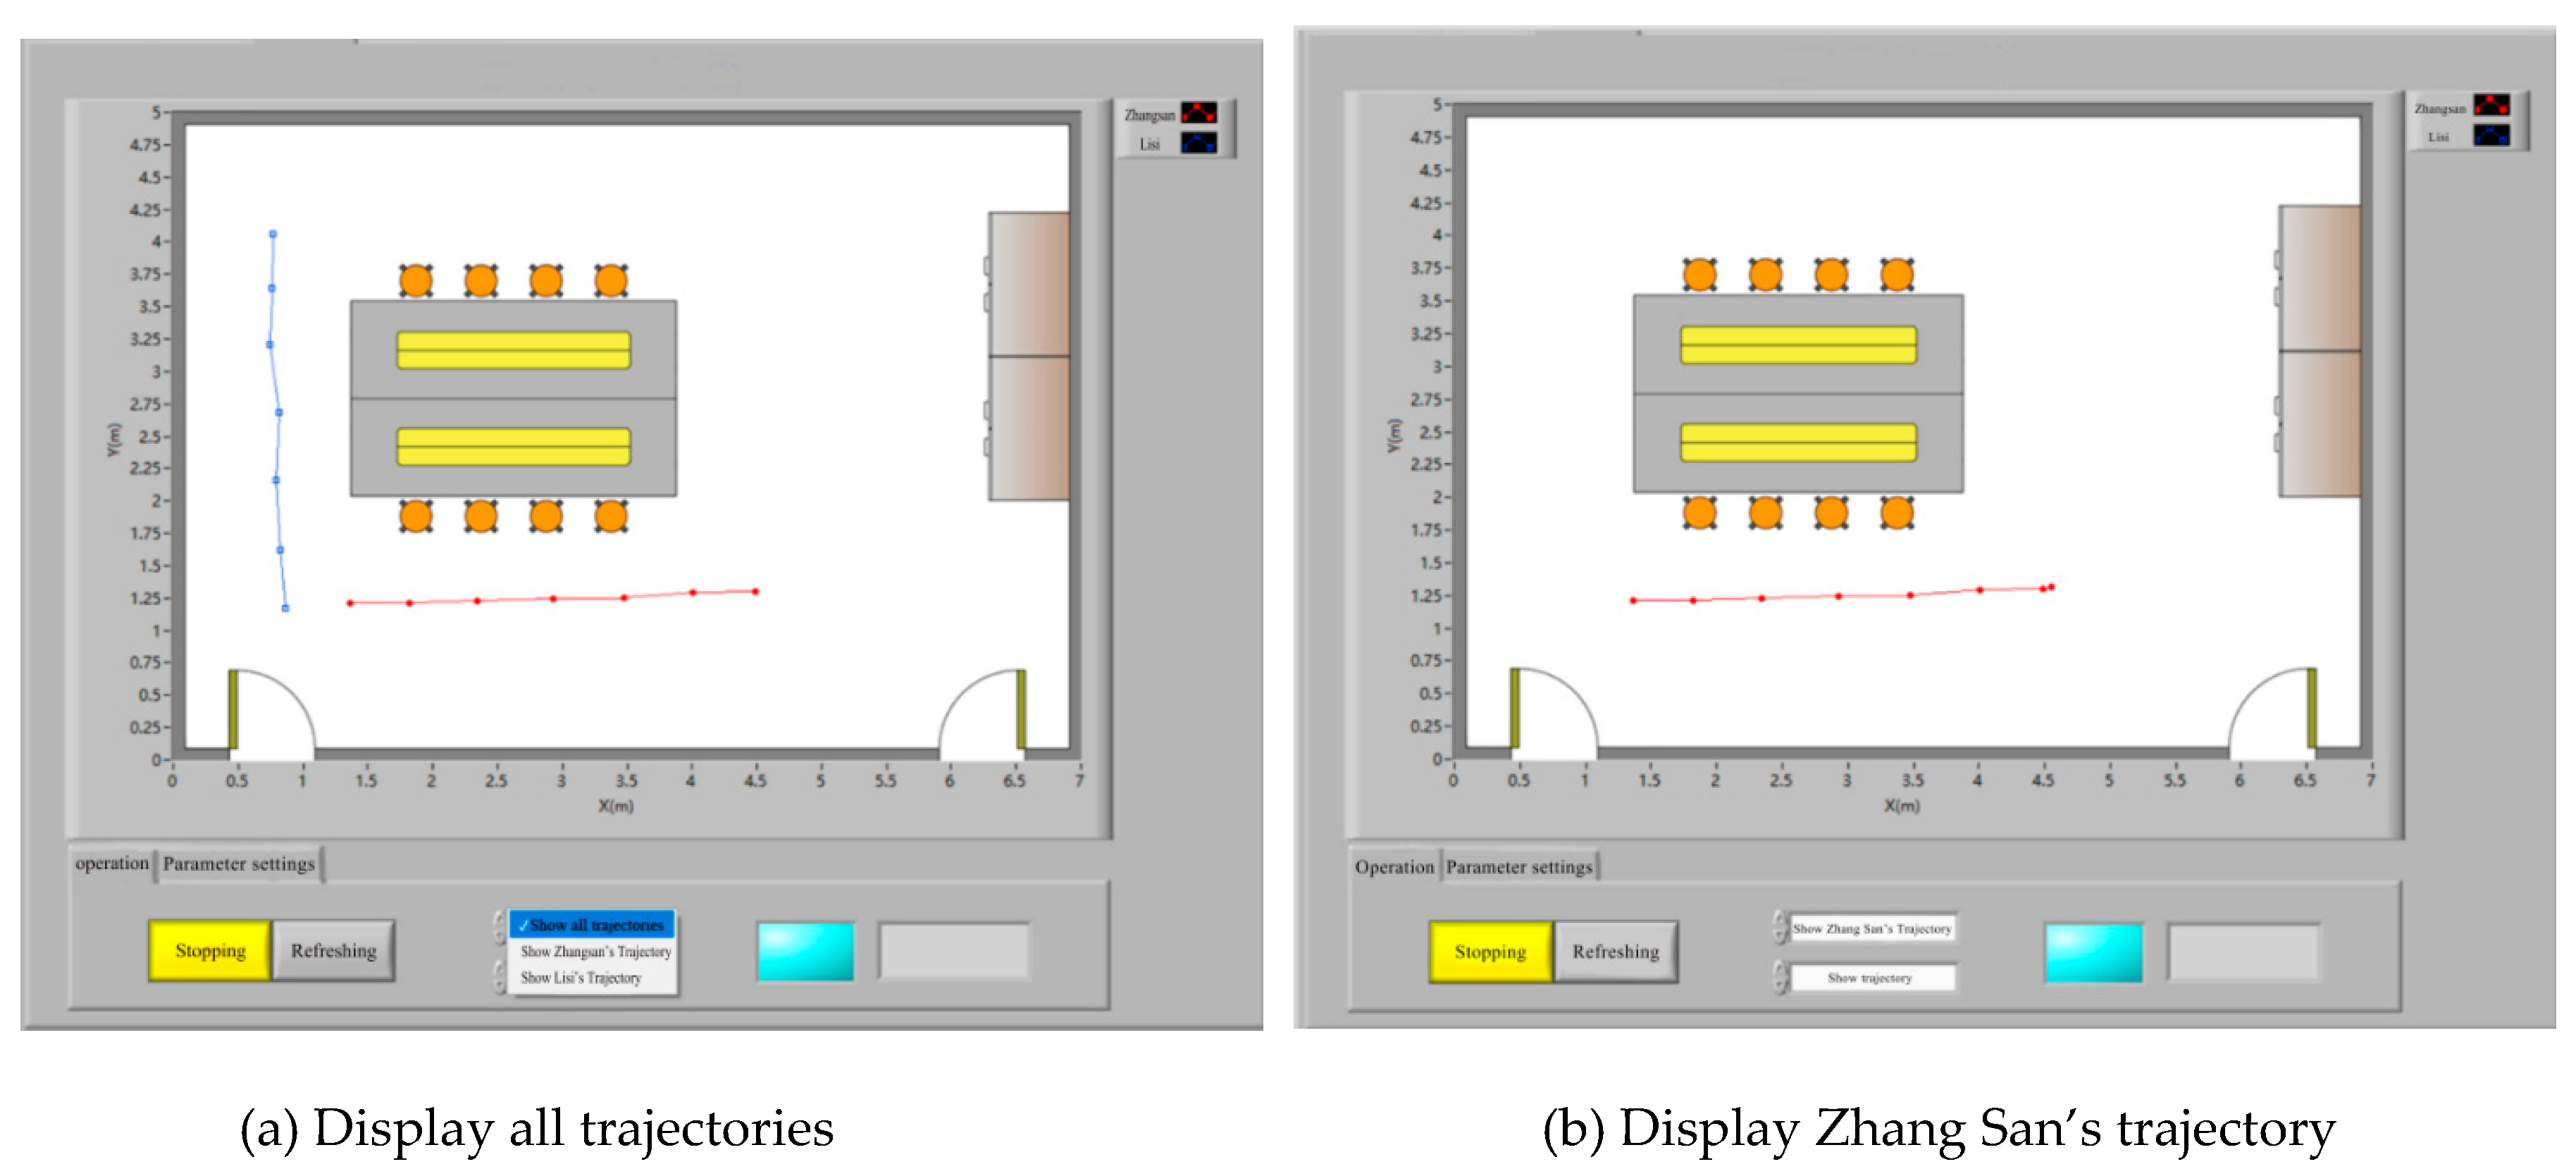
Figure 14.
Real-time position display.
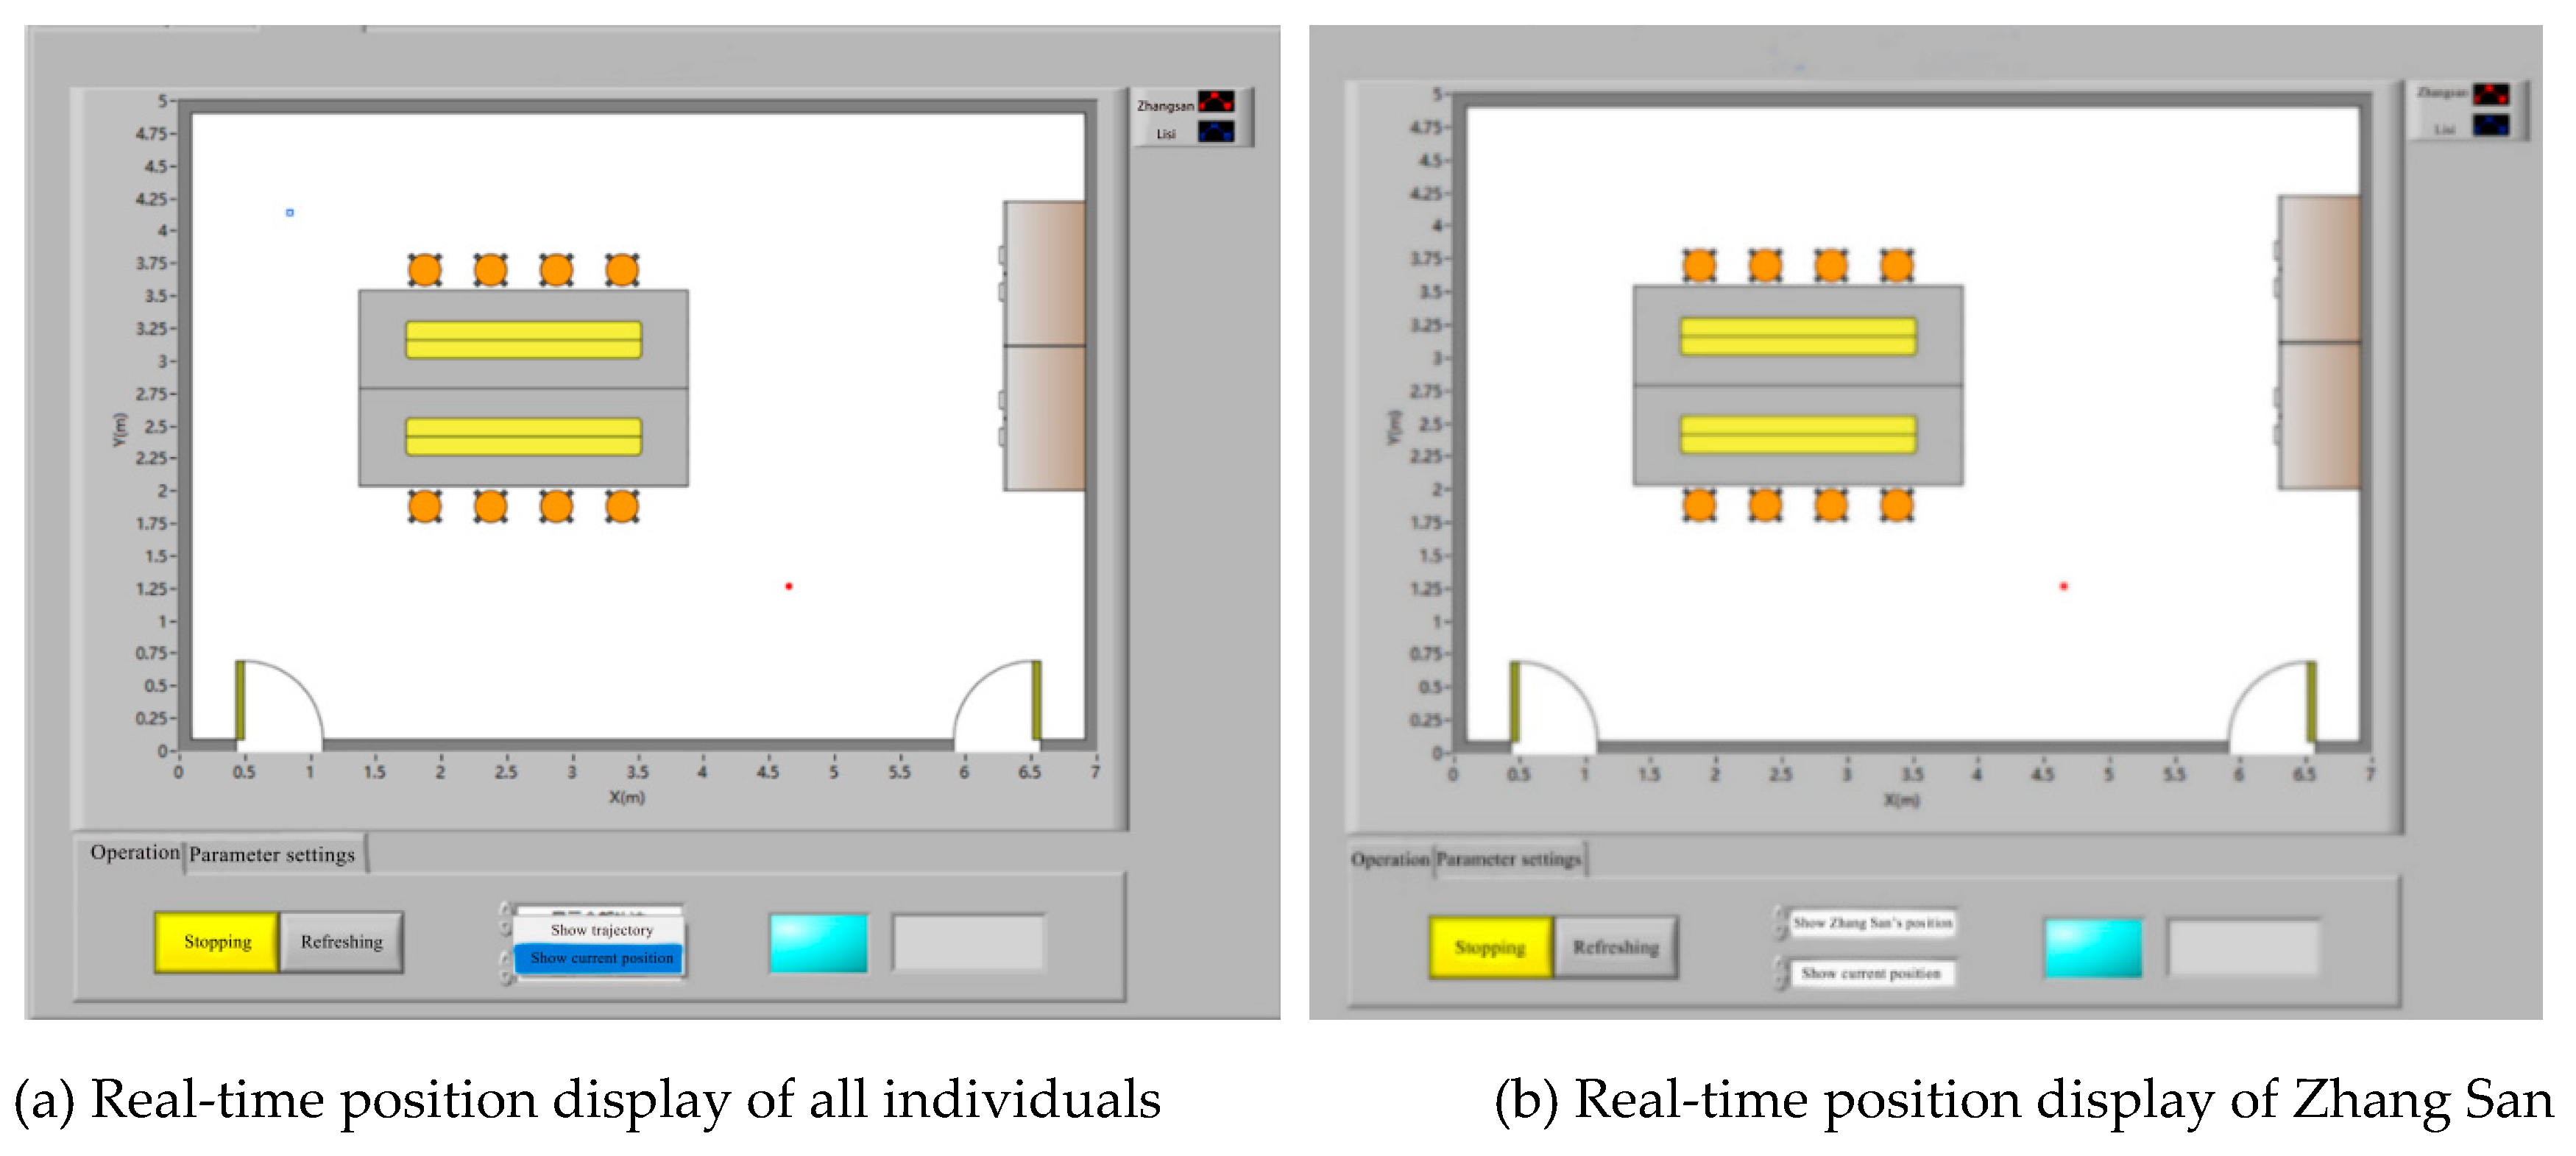
Figure 15.
Display interface of alarm function.
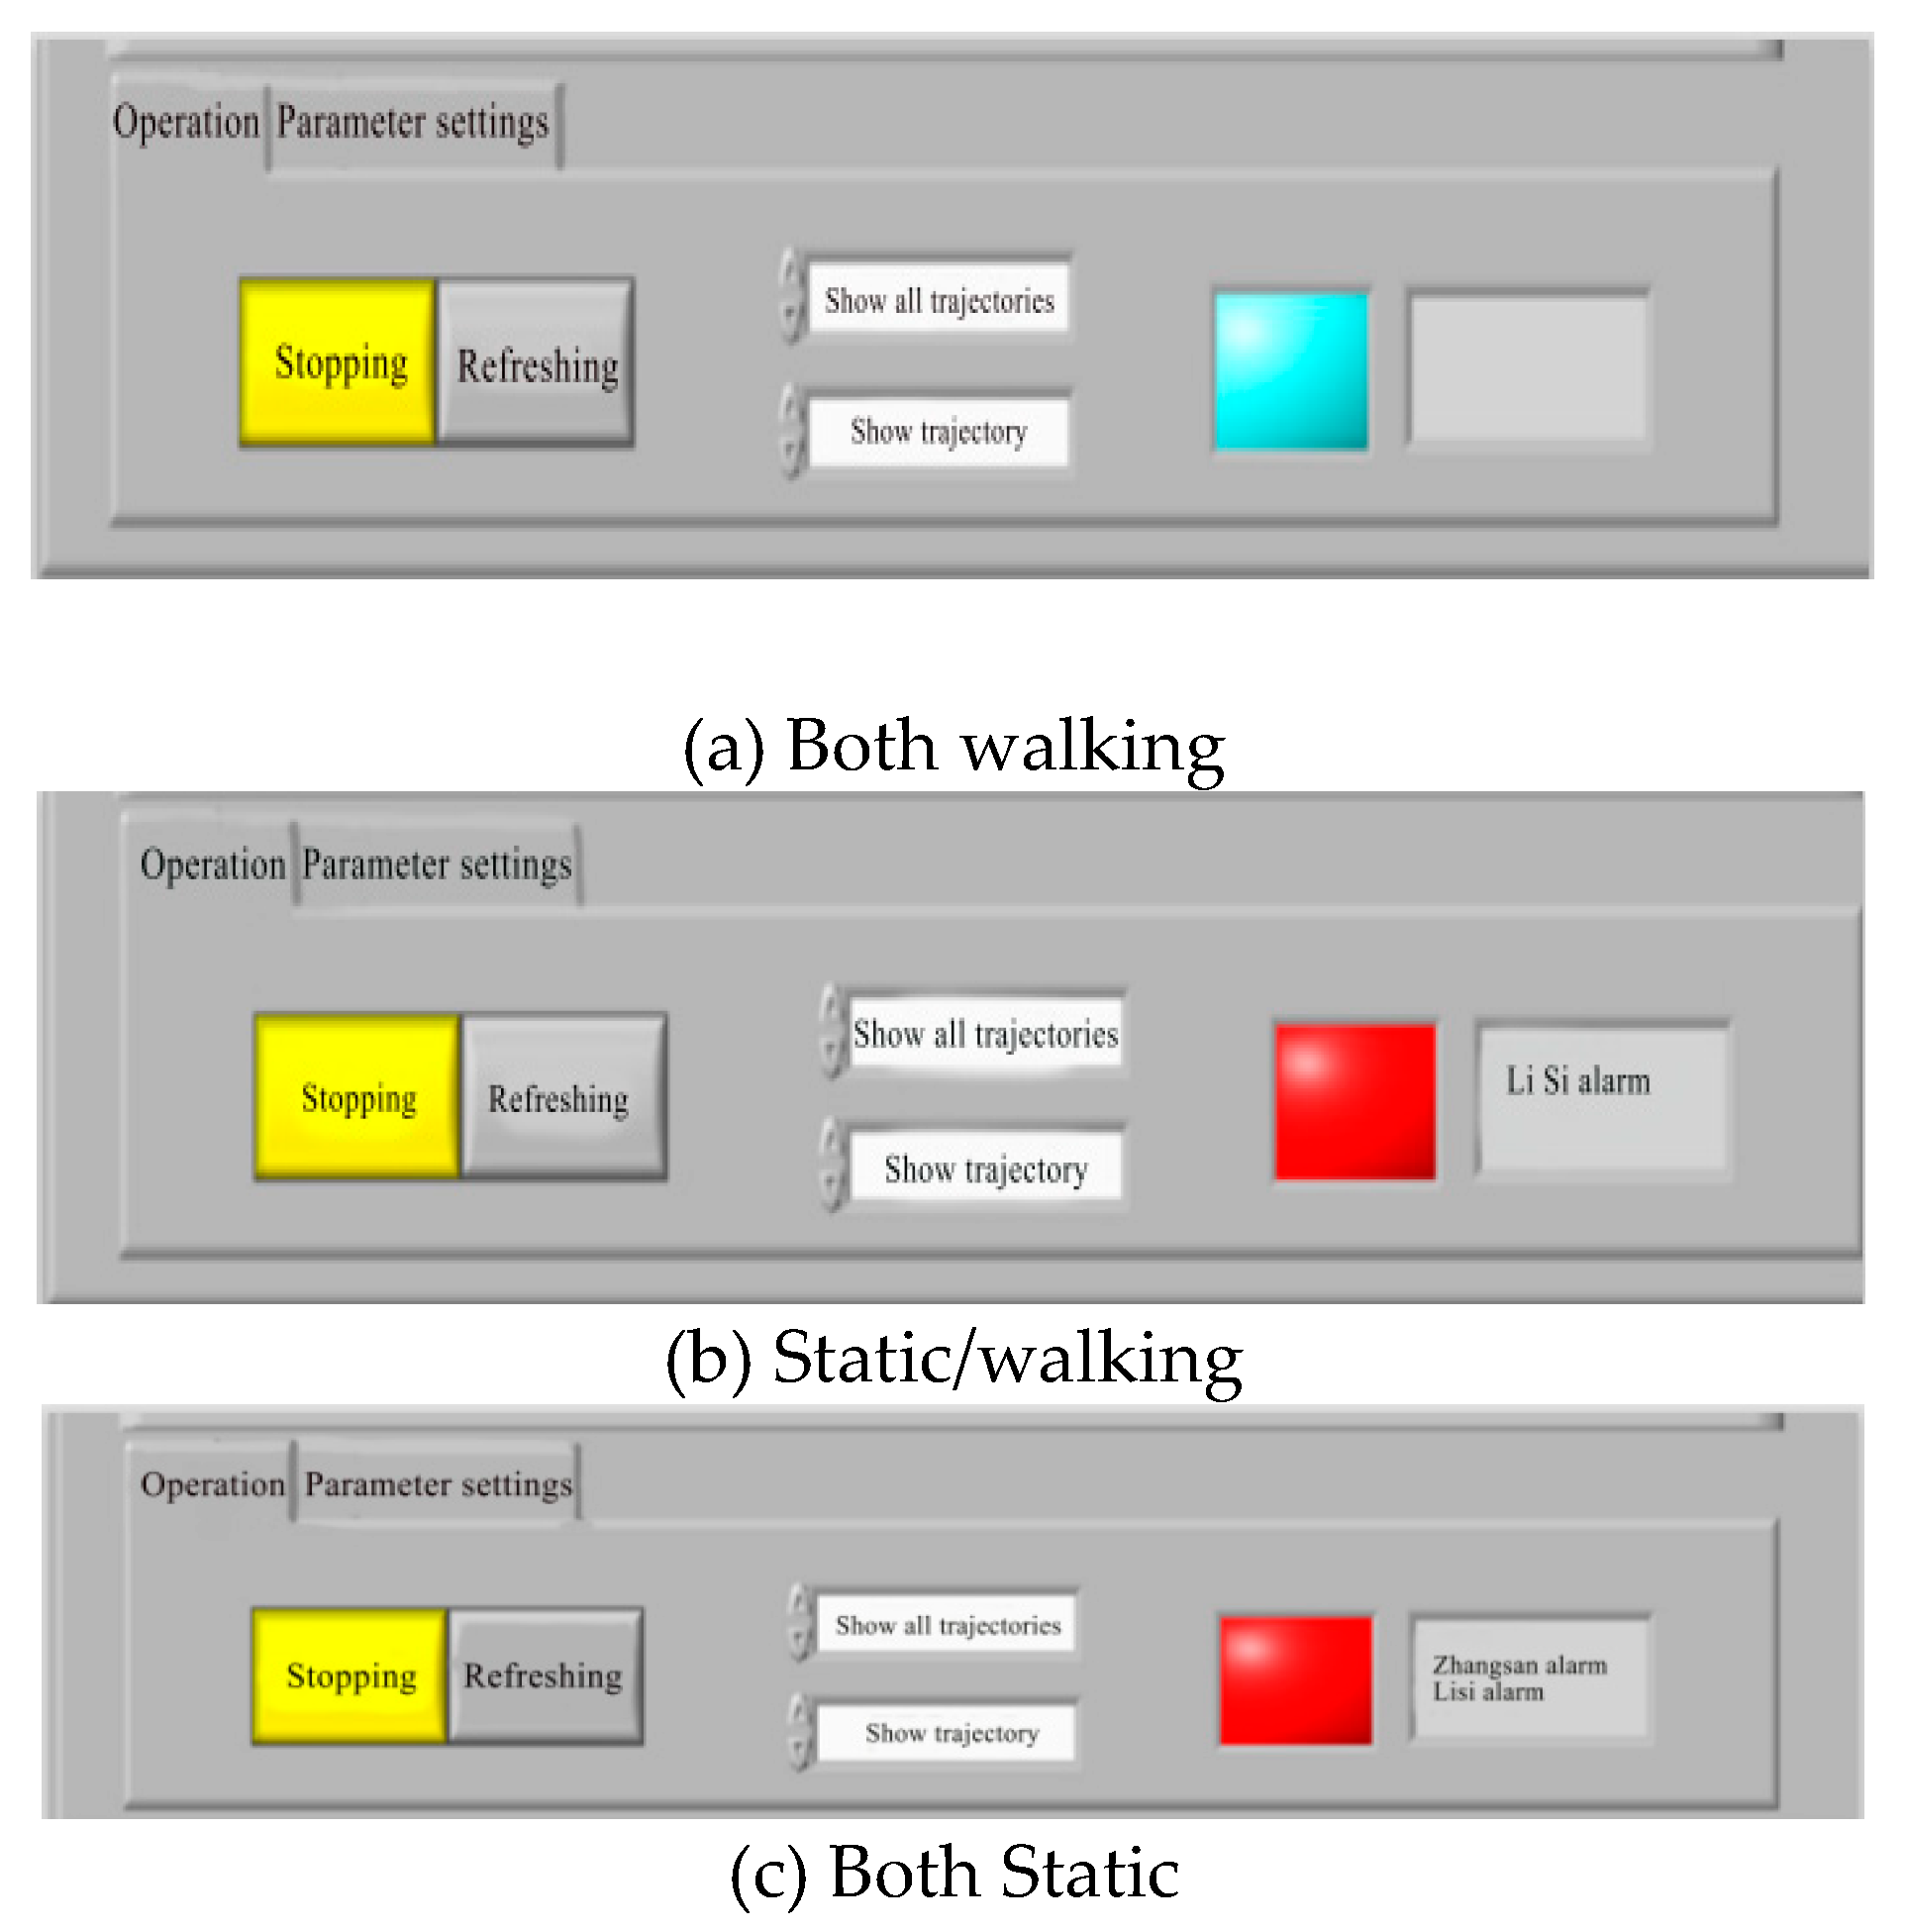

Table 1.
Input parameters for BP neural network.
| Iterations | Learning rate | Training Target minimum error | Minimum performace gradient |
|---|---|---|---|
| 1000 | 0.01 | 1e-5 | 1e-6 |
Table 2.
Test errors for different numbers of hidden layer nodes.
| Number of hidden layer nodes | Maximum error (m) | Minimum error (m) | Mean Squared Error (MSE) (m) |
| 6 | 0.007350 | 0.00013 | 0.003195 |
| 7 | 0.007975 | 0.00113 | 0.003976 |
| 8 | 0.007375 | 0.00075 | 0.003023 |
| 9 | 0.006750 | 0.00225 | 0.003251 |
| 10 | 0.007875 | 0.00125 | 0.003063 |
| 11 | 0.008575 | 0.00050 | 0.003871 |
| 12 | 0.006650 | 0.000525 | 0.002756 |
| 13 | 0.004050 | 0.00050 | 0.002047 |
Table 3.
Sample points for BP neural network learning.
| Number | The distance between the tags and the base stations (m) | Real coordinates of locating tag (m) | ||||
| Base station 1 | Base station 2 | Base station 3 | Base station 4 | x | y | |
| 1 | 4.08 | 5.66 | 3.97 | 0.94 | 0.598 | 3.948 |
| 2 | 3.53 | 5.27 | 4.10 | 1.36 | 0.598 | 3.386 |
| 3 | 2.97 | 4.87 | 4.32 | 1.90 | 0.598 | 2.824 |
| …… | …… | …… | …… | …… | …… | …… |
| 320 | 4.05 | 0.74 | 4.07 | 5.70 | 3.904 | 0.5675 |
Table 4.
Prediction Errors between the Two Models.
| Model | RMSE | MAPE(%) | MAE |
| BP | 0.049052 | 17.28 | 0.087619 |
| Trilateration | 0.267567 | 35.79 | 0.201598 |
Table 5.
Summary of relevant literatures.
| Number | References | Technology | Deviation/m | Function |
| 1 | Chong et al. [22] | UWB, Autonomous Navigation | 3 | Location; Navigation |
| 2 | Will et al.[23] | WSN | \ | Location |
| 3 | Han[24] | Inertial navigation | 1.4 | Location |
| 4 | Yang et al.[25] | UWB/INS | 0.7 | Location |
| 5 | Li et al.[26] | PDR breadcrumb system | 5-10 | Location |
| 6 | Li et al.[27] | Cloud platform ( Inertial navigation, Visual, GPS, UWB, Laser ) | 0.64 | Location; Motion analysis; State detection; Navigation; |
| 7 | Gandhi et al.[28] | Bluetooth,Wi-Fi,RFID | \ | Location; Navigation |
| 8 | Pascucci and Setola[29] | RFID,rescue robot | 0.1-0.7 | Location; Trajectory display; Communication |
| 9 | Minja and Šenk[30] | Inertial navigation | 1-6 | Location; navigation |
| 10 | Berrahal et al.[31] | WBAN | \ | Location; Navigation; Communication, |
| 11 | Vey et al.[32] | UWB, Altimeter, radio | 0.36 | Location |
| 12 | Nilsson et al.[33] | Double foot inertial navigation, UWB | 7 | Location |
Disclaimer/Publisher’s Note: The statements, opinions and data contained in all publications are solely those of the individual author(s) and contributor(s) and not of MDPI and/or the editor(s). MDPI and/or the editor(s) disclaim responsibility for any injury to people or property resulting from any ideas, methods, instructions or products referred to in the content. |
© 2025 by the authors. Licensee MDPI, Basel, Switzerland. This article is an open access article distributed under the terms and conditions of the Creative Commons Attribution (CC BY) license (http://creativecommons.org/licenses/by/4.0/).
Copyright: This open access article is published under a Creative Commons CC BY 4.0 license, which permit the free download, distribution, and reuse, provided that the author and preprint are cited in any reuse.


