
Submitted:
23 December 2025
Posted:
24 December 2025
You are already at the latest version
Abstract
The Pacific sleeper shark (Somniosus pacificus, PSS) is a long-lived, deep-water and sub-polar species that exhibits flexible foraging strategies, likely combining scavenging with active predation on a broad range of prey, yet their role in marine food chains and impact on commercial species remain undetermined. Tracking the location of PSS in Alaskan coastal waters is extremely challenging given the predominantly aphotic depths that these sharks occupy, often in spatially constrained and critically under-sampled regions: deep, steep-flanked, convoluted fjords of Prince William Sound (PWS). From the first ever, year-long depth and temperature records recovered from archiving pop-up satellite-linked transmitters (n=7), we characterized the residence distributions, depth, and thermal habitat for sharks within the PWS fjords and identified seasonal and temporal variation in habitat use. Depths recorded from the seven sharks ranged from 3-572m, and pop-up tag locations suggested a high degree intra-annual residency within western PWS. Ambient water temperatures ranged from 2.65 to 11.1⁰C, with little deviation from the median of 5.9⁰C. Seasonal patterns emerged within and across individuals relative to the variation in vertical movements, ambient temperatures, and horizontal movements that could reflect resource-oriented strategies. The high degree of residency combined with extensive use of the water column facilitates the use of physically recoverable, high-resolution behavioral and environmental samplers on PSS. This adaptive sampling using PSS as platforms of opportunity may in turn enable the use of PSS as climate and ecosystem sentinels.
Keywords:
elasmobranch
; Somniosus
; HMM
; behavioral ecology
; polar
; sharks
1. Introduction
World-wide, sharks are positioned at or near the apex of the trophic structures that support them, and as a result may function as keystone species, central to dynamics of marine food webs [1]. Their distributions globally, and at finer spatial scales, are driven by a combination of abiotic and biotic factors. Amongst these, temperature has been well-established for many sharks as a driver of distribution and behavioral patterns [2,3,4] by influencing movement, foraging efficiency [5,6] and reproduction [7]. Considerable emphasis has been placed investigating the drivers of fine spatial and temporal variability in habitat use and behavior for shallow-water, tropical species of sharks [8,9], yet similar information for high-latitude shark species is extremely limited [10].
The Pacific sleeper shark (Somniosus pacificus) is a large, subpolar and deep-water species distributed across the Pacific [11,12,13,14]. Reliable estimates from underwater photographs suggest Pacific sleeper sharks may reach up to 6.6 m total length, with regional variability [14]. In the Gulf of Alaska, estimates of population abundance and distributions have largely been derived from fisheries surveys and bycatch data [15,16]. Between 1989 and 2003, sablefish longline surveys suggested an increase in Pacific sleeper shark bycatch rates [15] but recent reports suggest a decline in relative abundance since 2013 [16]. It is unclear what mechanism is associated with the observed decline in Pacific sleeper shark abundance estimates, but the pattern aligns temporally with an extreme marine heatwave in the Gulf of Alaska [17]. During this environmental perturbation, ecosystem-level responses were observed across all trophic levels, including species distribution shifts and significant die-offs [18,19,20]. Establishing baselines for Pacific sleeper shark behavior, habitat use, and movement is critical for determining the role of abiotic and biotic factors, including fisheries bycatch, in sleeper shark population dynamics and for assessing shark’s vulnerability to future environmental shifts predicted to increase in frequency and intensity [2].
Extant, published knowledge of Pacific sleeper shark movement and behavior comes from a study of 24 immature sharks (TL: 1.5-2.5 m) in the Gulf of Alaska, using satellite-linked pop-up and archival tags [21]. Broadly, sharks moved continuously through the water column, commonly ascending above 100m but spending most time between 150-450 m depths, and appeared stenothermic, with over 90% of the ambient water temperatures within a narrow range of 5.5-8.2 °C [21]. The duration and resolution of the data varied across individuals due to tag attachment and data transmission failures, but there were no consistent seasonal patterns related to depth ranges, and only some individuals exhibited diel vertical migrations during a portion of their records [21].
Most sharks in the Hulbert et al. [21] study were tagged near Steller sea lion (Eumetopias jubatus) rookeries, but six individuals tagged with satellite depth recording tags, and one individual with a pop-up archival transmitting tag had end-point locations within Prince William Sound. Though often considered part of the Gulf of Alaska, Prince William Sound is a semi-enclosed deep-water marine basin, with depths ranging up to 750m [22], that is surrounded by many glaciated fjords and inlets. Fjords are seasonally important habitat for the closely related Greenland shark (Somniosus microcephalus) in the north Atlantic, particularly for the juvenile age-class [10,23]. Fjords have also been hypothesized as potentially important nursery habitat for Pacific sleeper sharks [14], yet there is limited information on Pacific sleeper shark behaviors within fjord habitats, or at fine temporal scales. This study expands upon the broadscale work of Hulbert et al. [21] by examining behavior and movement of Pacific sleeper sharks specifically within the glaciated fjords and inlets of PWS. Our objectives were to (1) characterize the residence distributions, depth, and thermal habitat for sharks within the PWS fjords, and (2) identify seasonal and temporal variation in habitat use.
2. Materials and Methods
Study Location and Sampling Operations
Pacific sleeper sharks were caught in the northwest fjords of PWS (Figure 1), between June and August 2022 using a modified version of the approach described in Smith et al. [24]. Briefly, we used 4 sets of capture gear, where an individual set consists of two, three or four 16-20 gauge circle hooks individually connected via 1-1.5m gangions and longline clips to a vertical line leading to a surface buoy, and positioned approximately 5-10m from the bottom anchor. The hooks were baited with salmon and sets were placed at depths between 150 and 350 m for 2-6 hour duration daytime soaks. In the present study, sharks were handled at the surface alongside a 14ft aluminum chambered research skiff, while secured in a rectangular floating stretcher. Morphometric measurements were taken, and all sharks then received one or more electronic tags, or numbered markers. Following all sampling and tag attachments, sharks were released in situ. Handling times from reaching the surface to release were, on average, 29 ± 7.3 min S.D. All animal captures, restraint, sampling, tagging, release and tracking was conducted under ADF&G Aquatic Resources Permit CF-22-069, and under Animal Use Protocols issued by the IACUC of UAF (1700224-3/4).
Satellite Transmitter Deployments
Across 30 catch effort days, we caught 16 sharks (Table 1), of which 15 were released with a combination of one or more transmitters. External transmitters were secured to the sharks via short tethers connected to subdermal titanium anchors. MiniPAT-348 archiving pop-up satellite transmitters (Wildlife Computers, Redmond, WA, USA) were deployed on 14 sharks. The MiniPAT tags (length 124 mm, width 38 mm, weight in air 60 g) recorded information on depth (0 – 1700 m, resolution 0.5 m), temperature (-40 °C – 60 °C, resolution 0.05 °C), tri-axial acceleration (-2 – 2 g, resolution 0.05 g), and light levels (5 × 10-12W.cm-2 – 5 × 10⁻²W.cm-2) at 5 sec intervals. MiniPAT tags were programmed to detach from the shark (or “pop up”) after 365 days (n=13) or 730 days (n = 1) and transmit recorded data in summarized form as depth and temperature ranges and histograms. All tags except one (SP22-07) reported via the Argos satellite system upon release, and 10 MiniPAT tags were physically recovered at sea. The entire archival data set can be downloaded as originally recorded from physically recovered tags, including all depth, temperature, light level and accelerometer values. The Argos system provides location estimates calculated from multiple sequential post-emergence transmissions received during a single pass by one of a constellation of polar orbiting low-earth orbit satellites and is assigned a location classification based on estimate uncertainty [25,26].
Of the 15 tagged animals, 12 sharks received an additional two separate Wildlife Computers mr-PAT-376 mark-report pop-up transmitters, with programmed detachment set for 120 and 240 days, respectively. Coded 69k Hz acoustic transmitters (models V16-4x or V16-6x, Vemco/Innovasea, Nova Scotia, Canada) were also attached to 11 of the sharks, either externally or internally (Table 1). This approach of using sequential releases of multiple PATs per shark has been used for studying the movement and migration of Greenland sharks [27].
Data Analysis
To address questions of fine-scale temporal variation in fjord habitat use, the depth and temperature data from seven full-year, complete data sets downloaded from physically recovered MiniPAT tags were used in this study (Table 1). After visual inspection of the sleeper shark depth profiles, irregular and shallow dive behaviors or a prolonged descent to depth were observed during the first 6-24hrs post-release (Supp Figure 1), followed by regular vertical movements. As many fish and sharks exhibit post-handling recovery periods [3,28], prior to analysis we removed the first 24hrs of data for each shark.
Horizontal Displacement
The first Argos pop-up location estimate with a precision of 500 m or better (location class 2 or 3) was used as the end-point locations for transmitting satellite tags. Seasonal net horizontal displacements (distance between mrPAT/miniPAT release and the previous known location), as well as full year displacement (distance between miniPAT release and pop-up) were calculated using great circle distance. Spearman Rank correlation tests were used to examine whether horizontal displacement varied by size (TL, cm).
Pathways (daily location estimates) between release and pop-up locations were reconstructed using a hidden Markov model (HMM) developed for demersal fish based on maximum daily depth and known locations. The HMM used in this study was originally developed to reconstruct movement paths of Atlantic cod in the North Sea [29,30] and has been adapted to demersal fishes in the North Pacific Ocean [31]. The model is discrete in space and time and consists of coupled movement and data likelihood models that ultimately generate location probability surfaces for each day of the trajectory. The movement model is isometric diffusion. The data likelihood model, which links tag data to likely locations in the study area, is a key feature of the HMM and should be customized for different species, study areas, and tag types [32]. Light-based geolocation is extremely challenging for Pacific Sleeper Sharks given the depths that the sharks occupy as well as study area conditions. Geolocation for most pelagic fishes can utilize light-based latitude and longitude estimates obtained from light intensity records; however, for demersal fish, longitude estimates are more robust and are available for fish that occupy depths less than about 150 m and do not change depth in response to sunrise and sunset [29,33]. In the data sets we obtained for this study, very few light-based longitude observations were present even when sharks occupied depths that were shallow enough to collect them. In the fjord systems, glacial sediment may have affected the quality of light data and thus adversely affected light-based geolocation. Therefore, the data likelihood model we have implemented for sleeper sharks in PWS is based on maximum daily depth [31] and known locations including release, locations at 4 and 8 months from mrPAT satellite tags, and pop-up locations for MiniPAT satellite tags after 1 year (See: Supplemental Information for more details).
MrPAT locations were first used to assess model performance with different data likelihood models, values of diffusion, and spatial extents, and then were included in the data likelihood model for the final model run. Residence distributions that summarize location probability [34] for all sharks combined were produced for all sharks that most likely resided in the study area continuously throughout the duration of the study. Residence distributions were produced for two-month periods in summer 2022, fall/winter 2022, spring 2023, and summer 2023 that coincided with the availability of known locations from mrPATs.
Diel Variation in Depth and Temperature
Archived temperature and depth data subsampled at 1 minute intervals were assigned to two diel periods based on the given location (PWS: 60.8° N, 148° W) and time using the suncalc package in R v.4.5.2. “Day” was defined as the period from sunrise to sunset (evening civil twilight starts), and “Night” was defined as the period from when evening civil twilight ends until dawn (morning civil twilight starts). Summary statistics for each diel period, including mean, median, and interquartile range were calculated for all sharks combined, and by individual. Spearman Rank correlation tests were used to examine whether diel depth or temperature patterns varied by size (TL, cm). To examine diel variation in the proportion of time spent at depth, and time at temperature, we aggregated data into 50m and 1 °C bins respectively [35], and across all individuals combined, calculated the proportion of the total observations in each bin.
Seasonal Variation in Depth and Temperature
A clustering analysis was used to group days of the year based on the observed habitat variables: depth range, maximum temperature, and mean depth. This approach was selected as it allowed for flexibility in identifying patterns of intra-annual variation in habitat use patterns, as opposed to using pre-defined temporal windows (e.g., calendar month, or summer vs. winter). All variables were calculated by Night and Day and then normalized and scaled for equal variance. We selected to use a K-means cluster analysis as it is a relatively simple unsupervised classification approach that has been used for grouping animal behaviors and individual location observations [36,37]. The optimal number of clusters was defined using the silhouette method, wherein larger silhouette index values indicate better clustering quality and that the within-cluster dissimilarity is less than the between-cluster dissimilarity [38]. Cluster assignment and visualization was done for all sharks combined [R package factoextra; [39]].
3. Results
3.1. Horizontal Movement
Satellite tag pop-up locations obtained over the course of the year from all sharks (n=37) suggest that horizontal movement was limited, with most pop-up locations occurring in Port Wells where the tagged sharks were released (Figure 1). The mean net horizontal displacement from the release location after one year (i.e., distance between the release and miniPAT pop-up locations) was 18.65 km (s.d. 14.2 km, range 7.4-47.5 km, n = 7) and had no significant association with total length of the animals (p < 0.05). The quarterly net displacement did vary seasonally, ranging from a mean of 18.4 km to 24.5 km (Table 2).
Geolocation results obtained from satellite tag pop-up locations suggest that 6 of the 7 tagged sharks with detailed data sets likely remained entirely within Port Wells over the course of the year (Figure 2). One of the 7 sharks (SP22-12) likely left Port Wells from mid-June to mid-July 2023, as it recorded greater depths than were available in Port Wells during this time. However, both the 4- and 8-month mrPAT and the 12-month miniPAT pop-up locations for SP22-12 were within Port Wells, and patterns in temperature and depth were similar to the other 6 geolocated sharks. Seasonal trends were observed for geolocated sharks that remained in Port Wells based on reconstructed movement paths using the HMM. In July/August 2022, the distribution was close to release locations (Figure 2A). By November/December 2022, the distribution had expanded northward into Port Wells (Figure 2B). During the spring (March/April 2023), most of the tagged sharks occupied shallower areas adjacent to active glaciers such as College Fjord (Figure 2C). By the following summer, the distribution had shifted south again into deeper waters (Figure 2D).
3.2. Diel Variation in Depth and Temperature
Across the seven year-long deployments, recorded depths ranged from 3-572 m. At Night, sharks used a median depth of 313.5 m (±173 IQR) with 84.5% of their time spent between 150-450 m and 7% of their time in shallow waters (0-100m). During the Day, sharks exhibited a median depth of 285.5 m (±146 IQR) with 88.2% of their time spent between 150-450 m, and 3% of their time in shallow waters (Figure 3a). Ambient water temperatures ranged from 2.65-11.1 °C. While ambient temperature varied very little from the median of 5.9 °C (±0.1 IQR), sharks in PWS exhibited diel variation, with waters warmer than 7 °C only used at Night (Figure 3b). Daytime Depth Range (m) exhibited a significant positive correlation with TL (Pearson cor = 0.926, t=5.5, p = 0.003), but TL was not associated with any other individual diel depth and temperature metrics.
3.3. Seasonal Variation in Depth and Temperature
K-means clustering for all sharks combined identified four clusters (Table 3, Figure 4 and Figure 5) based on dive and thermal metrics (BSS/TSS ratio = 62.6%). Cluster 1 included days when sharks exhibited reduced diurnal variation and depth ranges and used very deep waters (300-400 m) with cold ambient temperatures (Figure 5a-f). This pattern was exhibited mostly in the fall-winter (Sept-April; Figure 4). Cluster 2 was temporally constrained to days between October and January (Figure 4) and consisted of strong diurnal variation. Specifically, these sharks exhibited greater depth ranges at Night, moving into shallow waters where they encountered elevated ambient temperatures, routinely exceeding 7 °C (Figure 5). Clusters 3 and 4 overlapped temporally in the spring and summer (March-Aug, Figure 4). Cluster 3 included days where individuals used shallow depths (50-250 m) with reduced depth ranges and slightly elevated daytime ambient temperatures, whereas Cluster 4 days consisted of sharks using intermediate depths in the water column (100-300 m) and exhibiting greater depth ranges than Cluster 1 (Figure 5).
4. Discussion
Sleeper sharks remain an understudied species with little knowledge about their role in Alaskan coastal marine ecosystems, especially in a spatially constrained region which remains critically under sampled – such as glacial fjord ecosystems. Tracking the location of these sharks is extremely challenging given the predominantly aphotic depths that the sharks occupy as well as study area conditions, in deep, steep-flanked, convoluted fjords with often particularly turbid water. Little tracking infrastructure in the form of moored or mobile acoustic tracking receivers exists. Pop-up archiving satellite transmitters can provide summarized depth and ambient temperature distributions, as well as end-of-deployment location estimates, but commonly applied geolocation by light levels proved impracticable for sleeper sharks. Instead, we used sequential releases of multiple PATs per-shark to provide additional mid-deployment locations, as pioneered by Hussey et al. [27] on Greenland sharks. Furthermore, the semi-enclosed nature of the Prince William Sound study area combined with the high residency of tagged sharks facilitated the physical recovery of many MiniPATs. In this study, the first ever year-long continuous, higher-resolution archived data sets obtained from physically recovered tags enabled high-resolution quantification of previously undetected seasonal variability in individual residency distributions and habitat profiles for immature individual Pacific sleeper sharks in the Gulf of Alaska region. This expands on prior research [14,21] and identifies several new areas of future inquiry.
Although our study is limited by a small sample size, a high degree of intra-annual residency was observed for geolocated Pacific sleeper sharks in Prince William Sound. Tagged sleeper sharks tended to occupy the deep basin in Port Wells for much of the year, with average 1-year net displacements of 18 km from release location. We did not observe any clear patterns between displacement and size. Previous research on the movement of Pacific sleeper sharks in Glacier Bay National Park, Alaska, had revealed limited range of movements in glacial fjords, but observations were restricted to during summer [40]. In contrast, only 36% of the final locations for Pacific sleeper sharks tagged in the open Gulf of Alaska by Hulbert et al. [21] were within 0-25 km of their starting location, and several sharks in that study exhibited long-distance, directional movements of > 100km. Coastal habitats have been shown to be ontogenetically favored for juveniles across a range of shark species, providing thermally optimal environments, reduced competition to prey, and reduced risk from predators [41,42,43]. PWS nearshore and offshore waters consist of diverse fish assemblages [44], including pink salmon and pacific cod which have been identified in Pacific sleeper shark stomach contents [45]. Additionally, observations and tagging locations from Eastern North Pacific offshore killer whales (Orcinus orca), the main predator of Pacific sleeper sharks, are also rare in the fjords of Prince William Sound [46,47]. At present, it is unclear if the risk of predation, resource availability, or abiotic factors (or a combination thereof) are driving the variation in sleeper shark residency observed across tagging locations. However, this high residency pattern may facilitate novel studies addressing these hypotheses that would not be feasible in areas with reduced shark residencies or lower tag recovery likelihoods. For example, the high archival recording device recovery probability could enable deployment of acoustic monitoring stations for predators to identify potential interaction rates.
The ranges of depths and temperatures observed in our study, and the broad diel patterns of vertical movements are consistent with prior studies of Pacific sleeper sharks and Greenland sharks [21,48,49]. At a finer-temporal scale, in the northwest fjords of Prince William Sound, seasonal patterns emerged within and across-individuals relative to the variation in vertical movements, ambient temperatures, and horizontal movements that were not previously detected in Alaskan studies [21]. Cluster analysis provided a way to integrate across several metrics and identify periods of time that shared consistent patterns.
In the fall following their release, sharks were aggregated in the main channel of Port Wells and displayed pronounced diel vertical displacements moving into warm and shallow waters at night. The ambient water temperature for sharks over the whole year varied very little from the mean of 5.9 °C, but during the period from October to January, nighttime ambient temperatures routinely exceeded 8 °C. This matches the temporal establishment of thermoclines in Prince William Sound, which form in the spring with solar heating and reach their peak in late autumn [50]. The active excursions of sharks into warmer waters, and the consistent return to deeper, colder waters during the day suggest sharks may be foraging in the upper water column on a specific resource aggregated by/around a thermocline. This has been observed in other benthic sharks like the spiny dogfish (Scyliorhinus canicula), which moves into warmer waters only to obtain food and then retreats to cooler waters to potentially enhance digestive assimilation between foraging bouts [5,51].
During the period following the fall active period, from Jan – Feb, all sharks’ days were assigned to Cluster 1: dates with the deepest, cold waters and limited vertical movement during the day and night. Cluster 1 designations also occurred at other times of the year, but the prolonged and inter-individual consistent identification during the winter could suggest a strategy of partitioning foraging and resting activity temporally, or seasonal shifts in prey selection from pelagic to benthic scavenging. Data from energetics studies show Pacific sleeper shark metabolic rates are comparable to other non-endothermic sharks, when scaled to temperature [24,52], suggesting a potential caloric intake requirement of one adult sockeye salmon every 2.5-3 days for the average sized shark this study but as facultative scavengers, Pacific sleeper sharks also likely consume discarded bycatch in addition to natural carrion. Most of the diet information for Pacific sleeper sharks is temporally constrained to summer months [45], therefore the fall and winter behaviors observed here suggest the importance of conducting diet studies for Pacific sleeper sharks outside of the summer period.
In the spring (Feb-Jul), most animals appeared to move from the deep open channel of the fjord into the shallow bathymetry glacial areas and the cluster analysis conducted across all individuals combined revealed two distinct behavioral groups during this time (Cluster 3 and 4). When looking at which individuals whose mrPAT tags were observed near the glacier in spring (SP22-13, 14, 15, 16), the same individuals’ dates were primarily assigned to Cluster 3, confirming the spatial and behavioral patterns were associated. Similar seasonal variation in habitat use has been observed across a range of sharks and rays, often driven by temperate or prey dynamics [2,8,9,10]. In Baffin Bay, Greenland shark presence in coastal fjords and offshore waters followed patterns of sea-ice formation and retreat, with fjords only being used during ice-free periods in the summer [10]. Prince William Sound and the Gulf of Alaska do not form sea-ice, but many pagophilic fish, birds, and mammals rely on ice input from tidewater glaciers into the marine environment for critical reproductive and energetically costly periods of their life histories [53,54,55], or as refuge habitats during adverse conditions [56]. Rapid acceleration and thinning of tidewater glaciers has been observed across Arctic coastal fjord regions, including Greenland [57] and Alaska [58].
High-resolution sampling of in situ abiotic and biotic environmental characteristics by animal-borne tags is considered adaptive sampling, since animals often seek areas of physical and biological interest [59]. Adaptive sampling is essential not only for understanding behaviors and food web interactions of keystone and critical species, but it may also functionally enable the use of marine top predators such as sharks as climate and ecosystem sentinels [60,61,62]. Focusing on this period of shallow tidewater glacier habitat use in the future may assist in assessments of how adaptive Pacific sleeper sharks are to shifts in their prey availability or changes in thermal profiles such as those observed during the Pacific marine heat wave [18,19,20]. The high degree of residency among individuals observed in this study also suggests that physically recoverable, high-resolution behavioral and environmental samplers could be deployed on PSS as platforms of opportunity in this region, in turn enabling the use of PSS as climate and ecosystem sentinels.
Supplementary Materials
The following supporting information can be downloaded at the website of this paper posted on Preprints.org.
Author Contributions
Conceptualization, MH, AMB, JN.; Investigation, MH, AMB, JN; Methodology, MH, AMB, JN; Data curation, MH, AMB; Formal analysis, AMB, JN; Software, JN; Writing—original draft preparation, AMB; Writing—review and editing, AMB, MH, JN; Project administration, MH; Funding acquisition, MH, AMB, JN; Resources, MH, AMB. All authors have read and agreed to the published version of the manuscript.
Funding
This research was funded by the North Pacific Research Board Core Program (Award #2010).
Institutional Review Board Statement
The animal study protocol was approved by the Institutional Review Board (or Ethics Committee) of University of Alaska Fairbanks (1700224-3/4). All animal captures, restraint, sampling, tagging, release and tracking was conducted under ADF&G Aquatic Resources Permit CF-22-069.
Data Availability Statement
All shark telemetry data used in the analyses presented here can be obtained from the authors upon reasonable request.
Acknowledgments
We thank many volunteers and field team members that made our field work for this project possible: N. Barcelona, J. Prewitt, T. Farrugia, A. Havens, B. Long, K. Holland, E. Kunisch, S. Rheinsmith, S. Ryan, R. Sattler, M. St. Martin, J. Skinner, H. Dewar, and B. Horning. Field efforts were supported by an Alaska Ocean Observing System internship to N. Barcelona via the Alaska Native Science and Engineering program at the University of Alaska Anchorage.
Conflicts of Interest
The authors declare no conflicts of interest.
Abbreviations
The following abbreviations are used in this manuscript:
| PSS | Pacific sleeper shark |
| PWS | Prince William Sound |
| HMM | Hidden Markov model |
References
- Myers, R. A.; Baum, J. K.; Shepherd, T. D.; Powers, S. P.; Peterson, C. H. Cascading effects of the loss of apex predatory sharks from a coastal ocean. Science 2007, 315, 1846–1850. [Google Scholar] [CrossRef] [PubMed]
- Schlaff, A. M.; Heupel, M. R.; Simpfendorfer, C. A. Influence of environmental factors on shark and ray movement, behaviour and habitat use: a review. Reviews in fish biology and fisheries 2014, 24, 1089–1103. [Google Scholar] [CrossRef]
- Comfort, C. M.; Weng, K. C. Vertical habitat and behaviour of the bluntnose sixgill shark in Hawaii. Deep Sea Research Part II: Topical Studies in Oceanography 2015, 115, 116–126. [Google Scholar] [CrossRef]
- Nay, T. J.; Longbottom, R. J.; Gervais, C. R.; Johansen, J. L.; Steffensen, J. F.; Rummer, J. L.; Hoey, A. S. Regulate or tolerate: Thermal strategy of a coral reef flat resident, the epaulette shark, Hemiscyllium ocellatum. Journal of Fish Biology 2021, 98, 723–732. [Google Scholar] [CrossRef]
- Sims, D. W.; Wearmouth, V. J.; Southall, E. J.; Hill, J. M.; Moore, P.; Rawlinson, K.; Morritt, D. Hunt warm, rest cool: bioenergetic strategy underlying diel vertical migration of a benthic shark. Journal of Animal Ecology 2006, 75, 176–190. [Google Scholar] [CrossRef]
- Braun, C. D.; Arostegui, M. C.; Thorrold, S. R.; Papastamatiou, Y. P.; Gaube, P.; Fontes, J.; Afonso, P. The functional and ecological significance of deep diving by large marine predators. Annual Review of Marine Science 2022, 14, 129–159. [Google Scholar] [CrossRef] [PubMed]
- Hight, B. V.; Lowe, C. G. Elevated body temperatures of adult female leopard sharks, Triakis semifasciata, while aggregating in shallow nearshore embayments: evidence for behavioral thermoregulation? Journal of Experimental Marine Biology and Ecology 2007, 352, 114–128. [Google Scholar] [CrossRef]
- Francis, M. P. Distribution, habitat and movement of juvenile smooth hammerhead sharks (Sphyrna zygaena) in northern New Zealand. New Zealand Journal of Marine and Freshwater Research 2016, 50, 506–525. [Google Scholar] [CrossRef]
- Logan, R. K.; Vaudo, J. J.; Sousa, L. L.; Sampson, M.; Wetherbee, B. M.; Shivji, M. S. Seasonal movements and habitat use of juvenile smooth hammerhead sharks in the western North Atlantic Ocean and significance for management. Frontiers in Marine Science 2020, 7, 566364. [Google Scholar] [CrossRef]
- Edwards, J. E.; Hedges, K. J.; Kessel, S. T.; Hussey, N. E. Multi-year acoustic tracking reveals transient movements, recurring hotspots, and apparent seasonality in the coastal-offshore presence of Greenland sharks (Somniosus microcephalus). Frontiers in Marine Science 2022, 9, 902854. [Google Scholar] [CrossRef]
- Fujiwara, Y.; Matsumoto, Y.; Sato, T.; Kawato, M.; Tsuchida, S. First record of swimming speed of the Pacific sleeper shark Somniosus pacificus using a baited camera array. Journal of the Marine Biological Association of the United Kingdom 2021, 101, 457–464. [Google Scholar] [CrossRef]
- Claassens, L.; Phillips, B.; Ebert, D. A.; Delaney, D.; Henning, B.; Nestor, V.; Giddens, J. First records of the Pacific sleeper shark Somniosus cf. pacificus in the western tropical Pacific. Journal of Fish Biology 2023, 103, 1214–1220. [Google Scholar] [CrossRef]
- Tian, H.; Zhong, J.; Chen, J.; Jiang, Y.; Zhang, J.; Xie, W.; Yin, K. Southwestward expansion of the Pacific sleeper shark’s (Somniosus pacificus) known distribution into the South China Sea. Animals 2024, 14, 2162. [Google Scholar] [CrossRef]
- Matta, M. E.; Tribuzio, C. A.; Davidson, L. N.; Fuller, K. R.; Dunne, G. C.; Andrews, A. H. A review of the Pacific sleeper shark Somniosus pacificus: biology and fishery interactions. Polar Biology 2024, 47, 433–458. [Google Scholar] [CrossRef]
- Courtney, D. L.; Sigler, M. F. Trends in area-weighted CPUE of Pacific sleeper sharks Somniosus pacificus in the northeast Pacific Ocean determined from sablefish longline surveys. Alaska Fishery Research Bulletin 2007, 12, 292316. [Google Scholar]
- Tribuzio, C.A.; Matta, M.E.; Echave, K.; Rodgveller, C. Assessment of the Shark stock complex in the Gulf of Alaska; North Pacific Fishery Management Council: Anchorage, AK, 2022. [Google Scholar]
- Di Lorenzo, E.; Mantua, N. Multi-year persistence of the 2014/15 North Pacific marine heatwave. Nature Climate Change 2016, 6, 1042–1047. [Google Scholar] [CrossRef]
- Barbeaux, S. J.; Holsman, K.; Zador, S. Marine heatwave stress test of ecosystem-based fisheries management in the Gulf of Alaska Pacific cod fishery. Frontiers in Marine Science 2020, 7, 703. [Google Scholar] [CrossRef]
- Piatt, J. F.; Parrish, J. K.; Renner, H. M.; Schoen, S. K.; Jones, T. T.; Arimitsu, M. L.; Sydeman, W. J. Extreme mortality and reproductive failure of common murres resulting from the northeast Pacific marine heatwave of 2014-2016. PloS one 2020, 15, e0226087. [Google Scholar] [CrossRef]
- Renner, H. M.; Piatt, J. F.; Renner, M.; Drummond, B. A.; Laufenberg, J. S.; Parrish, J. K. Catastrophic and persistent loss of common murres after a marine heatwave. Science 2024, 386, 1272–1276. [Google Scholar] [CrossRef]
- Hulbert, L. B.; Sigler, M. F.; Lunsford, C. R. Depth and movement behaviour of the Pacific sleeper shark in the north-east Pacific Ocean. Journal of fish biology 2006, 69, 406–425. [Google Scholar] [CrossRef]
- Halverson, M. J.; Bélanger, C.; Gay, S. M., III. Seasonal transport variations in the straits connecting Prince William Sound to the Gulf of Alaska. Continental Shelf Research 2013, 63, S63–S78. [Google Scholar] [CrossRef]
- Hussey, N. E.; Cosandey-Godin, A.; Walter, R. P.; Hedges, K. J.; VanGerwen-Toyne, M.; Barkley, A. N.; Fisk, A. T. Juvenile Greenland sharks Somniosus microcephalus (Bloch & Schneider, 1801) in the canadian arctic. Polar biology 2015, 38, 493–504. [Google Scholar]
- Smith, T. R.; Bishop, A.; Guthridge, J.; Hocking, R.; Horning, M.; Lowe, C. G. Capture, husbandry, and oxygen consumption rate of juvenile Pacific sleeper sharks (Somniosus pacificus). Environmental Biology of Fishes 2022, 105, 1519–1534. [Google Scholar] [CrossRef]
- Nicholls, D. G.; Robertson, C. J. R.; Murray, M. D. Validating locations from CLS: Argos satellite telemetry. Notornis 2007, 54, 121–136. [Google Scholar] [CrossRef]
- Costa, D. P.; Robinson, P. W.; Arnould, J. P.; Harrison, A. L.; Simmons, S. E.; Hassrick, J. L.; Crocker, D. E. Accuracy of ARGOS locations of pinnipeds at-sea estimated using Fastloc GPS. PloS one 2010, 5, e8677. [Google Scholar] [CrossRef]
- Hussey, N. E.; Orr, J.; Fisk, A. T.; Hedges, K. J.; Ferguson, S. H.; Barkley, A. N. Mark report satellite tags (mrPATs) to detail large-scale horizontal movements of deep water species: First results for the Greenland shark (Somniosus microcephalus). Deep Sea Research Part I: Oceanographic Research Papers 2018, 134, 32–40. [Google Scholar] [CrossRef]
- Hoolihan, J. P.; Luo, J.; Abascal, F. J.; Campana, S. E.; De Metrio, G.; Dewar, H.; Rooker, J. R. Evaluating post-release behaviour modification in large pelagic fish deployed with pop-up satellite archival tags. ICES Journal of Marine Science 2011, 68, 880–889. [Google Scholar] [CrossRef]
- Pedersen, M. W.; Righton, D.; Thygesen, U. H.; Andersen, K. H.; Madsen, H. Geolocation of North Sea cod (Gadus morhua) using hidden Markov models and behavioural switching. Canadian Journal of Fisheries and Aquatic Sciences 2008, 65, 2367–2377. [Google Scholar] [CrossRef]
- Thygesen, U. H.; Pedersen, M. W.; Madsen, H. Geolocating fish using hidden Markov models and data storage tags. In Tagging and tracking of marine animals with electronic devices; Springer Netherlands: Dordrecht, 2009; pp. 277–293. [Google Scholar]
- Nielsen, J. K.; Bryan, D. R.; Rand, K. M.; Arostegui, M. C.; Braun, C. D.; Galuardi, B.; McDermott, S. F. Geolocation of a demersal fish (Pacific cod) in a high-latitude island chain (Aleutian Islands, Alaska). Animal Biotelemetry 2023, 11, 29. [Google Scholar] [CrossRef]
- Nielsen, J. K.; Tribuzio, C. A. Development and parameterization of a data likelihood model for geolocation of a bentho-pelagic fish in the North Pacific Ocean. Ecological Modelling 2023, 478, 110282. [Google Scholar] [CrossRef]
- Seitz, A. C.; Norcross, B. L.; Wilson, D.; Nielsen, J. L. Evaluating light-based geolocation for estimating demersal fish movements in high latitudes. Fishery Bulletin 2006, 104, 571–579. [Google Scholar]
- Nielsen, J.K.; McDermott, S.; Rand, K.; Dawson, L.; Bryan, D.R.; Britt, L.; Kotwicki, S.; Nichol, D. Insights into the northward shift of Pacific cod in warming Bering Sea waters from pop-up satellite archival tags. Canadian Journal of Fisheries & Aquatic Sciences 2025. [Google Scholar] [CrossRef]
- Musyl, M. K.; Brill, R.; Curran, D. S.; Fragoso, N. M.; McNaughton, L.; Nielsen, A.; Moyes, C. D. Postrelease survival, vertical and horizontal movements, and thermal habitats of five species of pelagic sharks in the central Pacific Ocean. Fishery Bulletin 2011, 109, 341. [Google Scholar]
- Zhang, J.; O’Reilly, K. M.; Perry, G. L.; Taylor, G. A.; Dennis, T. E. Extending the functionality of behavioural change-point analysis with k-means clustering: a case study with the little penguin (Eudyptula minor). PloS one 2015, 10, e0122811. [Google Scholar]
- Kinney, M. J.; Carvalho, F.; Kai, M.; Semba, Y.; Liu, K. M.; Tsai, W. P.; Teo, S. L. H. Cluster analysis used to re-examine fleet definitions of North Pacific fisheries with spatiotemporal consideration of blue shark size and sex data. PIFSC Working Paper 2022, WP-22-001. [Google Scholar] [CrossRef]
- Rousseeuw, P. J. Silhouettes: a graphical aid to the interpretation and validation of cluster analysis. Journal of computational and applied mathematics 1987, 20, 53–65. [Google Scholar] [CrossRef]
- Kassambara, A.; Mundt, F. Factoextra: extract and visualize the results of multivariate data analyses, R package version 1.0. 7. 2021. [Google Scholar]
- Taggart, Jim; Philip Hooge; National Park Service. unpublished data.
- Carlson, J. K.; Heupel, M. R.; Bethea, D. M.; Hollensead, L. D. Coastal habitat use and residency of juvenile Atlantic sharpnose sharks (Rhizoprionodon terraenovae). Estuaries and Coasts 2008, 31, 931–940. [Google Scholar] [CrossRef]
- White, C. F.; Lyons, K.; Jorgensen, S. J.; O’Sullivan, J.; Winkler, C.; Weng, K. C.; Lowe, C. G. Quantifying habitat selection and variability in habitat suitability for juvenile white sharks. PloS one 2019, 14, e0214642. [Google Scholar] [CrossRef] [PubMed]
- Edwards, J. E.; Hedges, K. J.; Hussey, N. E. Seasonal residency, activity space, and use of deep-water channels by Greenland sharks (Somniosus microcephalus) in an Arctic fjord system. Canadian Journal of Fisheries and Aquatic Sciences 2022, 79, 314–330. [Google Scholar] [CrossRef]
- Johnson, S. W.; Thedinga, J. F.; Neff, A. D.; Harris, P. M.; Lindeberg, M. R.; Maselko, J. M.; Rice, S. D. Fish assemblages in nearshore habitats of Prince William Sound, Alaska. Northwest Science 2010, 84, 266–280. [Google Scholar] [CrossRef]
- Sigler, M. F.; Hulbert, L. B.; Lunsford, C. R.; Thompson, N. H.; Burek, K.; O’Corry-Crowe, G.; Hirons, A. C. Diet of Pacific sleeper shark, a potential Steller sea lion predator, in the north-east Pacific Ocean. Journal of Fish Biology 2006, 69, 392–405. [Google Scholar] [CrossRef]
- Dahlheim, M.; Schulman-Janiger, A.; Black, N.; Ternullo, R.; Ellifrit, D.; Balcomb, K., III. Eastern temperate North Pacific offshore killer whales (Orcinus orca): Occurrence, movements, and insights into feeding ecology. Marine Mammal Science 2008, 24, 719–729. [Google Scholar] [CrossRef]
- Schorr, G. S.; Hanson, M. B.; Falcone, E. A.; Emmons, C. K.; Jarvis, S. M.; Andrews, R. D.; Keen, E. M. Movements and diving behavior of the Eastern North Pacific offshore killer whale (Orcinus orca). Frontiers in Marine Science 2022, 9, 854893. [Google Scholar] [CrossRef]
- Fisk, A. T.; Lydersen, C.; Kovacs, K. M. Archival pop-off tag tracking of Greenland sharks Somniosus microcephalus in the High Arctic waters of Svalbard, Norway. Marine Ecology Progress Series 2012, 468, 255–265. [Google Scholar] [CrossRef]
- Campana, S. E.; Fisk, A. T.; Klimley, A. P. Movements of Arctic and northwest Atlantic Greenland sharks (Somniosus microcephalus) monitored with archival satellite pop-up tags suggest long-range migrations. Deep Sea Research Part II: Topical Studies in Oceanography 2015, 115, 109–115. [Google Scholar] [CrossRef]
- Jin, M.; Wang, J. Interannual variability and sensitivity study of the ocean circulation and thermohaline structure in Prince William Sound, Alaska. Continental Shelf Research 2004, 24, 393–411. [Google Scholar] [CrossRef]
- Di Santo, V.; Bennett, W. A. Is post-feeding thermotaxis advantageous in elasmobranch fishes? Journal of Fish Biology 2011, 78, 195–207. [Google Scholar] [CrossRef]
- Ste-Marie, E.; Watanabe, Y. Y.; Semmens, J. M.; Marcoux, M.; Hussey, N. E. A first look at the metabolic rate of Greenland sharks (Somniosus microcephalus) in the Canadian Arctic. Scientific reports 2020, 10, 19297. [Google Scholar] [CrossRef]
- Arimitsu, M. L.; Piatt, J. F.; Madison, E. N.; Conaway, J. S.; Hillgruber, N. Oceanographic gradients and seabird prey community dynamics in glacial fjords. Fisheries Oceanography 2012, 21, 148–169. [Google Scholar] [CrossRef]
- Womble, J. N.; Gende, S. M. Post-breeding season migrations of a top predator, the harbor seal (Phoca vitulina richardii), from a marine protected area in Alaska. PloS one 2013, 8, e55386. [Google Scholar] [CrossRef]
- Lydersen, C.; Assmy, P.; Falk-Petersen, S.; Kohler, J.; Kovacs, K. M.; Reigstad, M.; Zajaczkowski, M. The importance of tidewater glaciers for marine mammals and seabirds in Svalbard, Norway. Journal of Marine Systems 2014, 129, 452–471. [Google Scholar] [CrossRef]
- Hop, H.; Wold, A.; Vihtakari, M.; Assmy, P.; Kuklinski, P.; Kwasniewski, S.; Steen, H. Tidewater glaciers as “climate refugia” for zooplankton-dependent food web in Kongsfjorden, Svalbard. Frontiers in Marine Science 2023, 10, 1161912. [Google Scholar] [CrossRef]
- Straneo, F.; Heimbach, P. North Atlantic warming and the retreat of Greenland’s outlet glaciers. Nature 2013, 504, 36–43. [Google Scholar] [CrossRef] [PubMed]
- McNabb, R. W.; Hock, R. Alaska tidewater glacier terminus positions, 1948–2012. Journal of Geophysical Research: Earth Surface 2014, 119, 153–167. [Google Scholar] [CrossRef]
- Nachtsheim, D. A.; Ryan, S.; Schröder, M.; Jensen, L.; Oosthuizen, W. C.; Bester, M. N.; Bornemann, H. Foraging behaviour of Weddell seals (Leptonychotes weddellii) in connection to oceanographic conditions in the southern Weddell Sea. Progress in Oceanography 2019, 173, 165–179. [Google Scholar] [CrossRef]
- Hazen, E. L.; Abrahms, B.; Brodie, S.; Carroll, G.; Jacox, M. G.; Savoca, M. S.; Bograd, S. J. Marine top predators as climate and ecosystem sentinels. Frontiers in Ecology and the Environment 2019, 17, 565–574. [Google Scholar] [CrossRef]
- Bestley, S.; Ropert-Coudert, Y.; Bengtson Nash, S.; Brooks, C. M.; Cotté, C.; Dewar, M.; Wienecke, B. Marine ecosystem assessment for the Southern Ocean: birds and marine mammals in a changing climate. Frontiers in Ecology and Evolution 2020, 8, 566936. [Google Scholar] [CrossRef]
- McMahon, C. R.; Roquet, F.; Baudel, S.; Belbeoch, M.; Bestley, S.; Blight, C.; Woodward, B. Animal borne ocean sensors–AniBOS–An essential component of the global ocean observing system. Frontiers in Marine Science 2021, 8, 751840. [Google Scholar] [CrossRef]
Figure 1.
Pacific sleeper shark satellite tag release and pop-up locations in Prince William Sound (PWS). Pop-up locations for mrPAT tags (4-month and 8-month programmed durations) and miniPAT tags (365 day programmed durations).
Figure 1.
Pacific sleeper shark satellite tag release and pop-up locations in Prince William Sound (PWS). Pop-up locations for mrPAT tags (4-month and 8-month programmed durations) and miniPAT tags (365 day programmed durations).
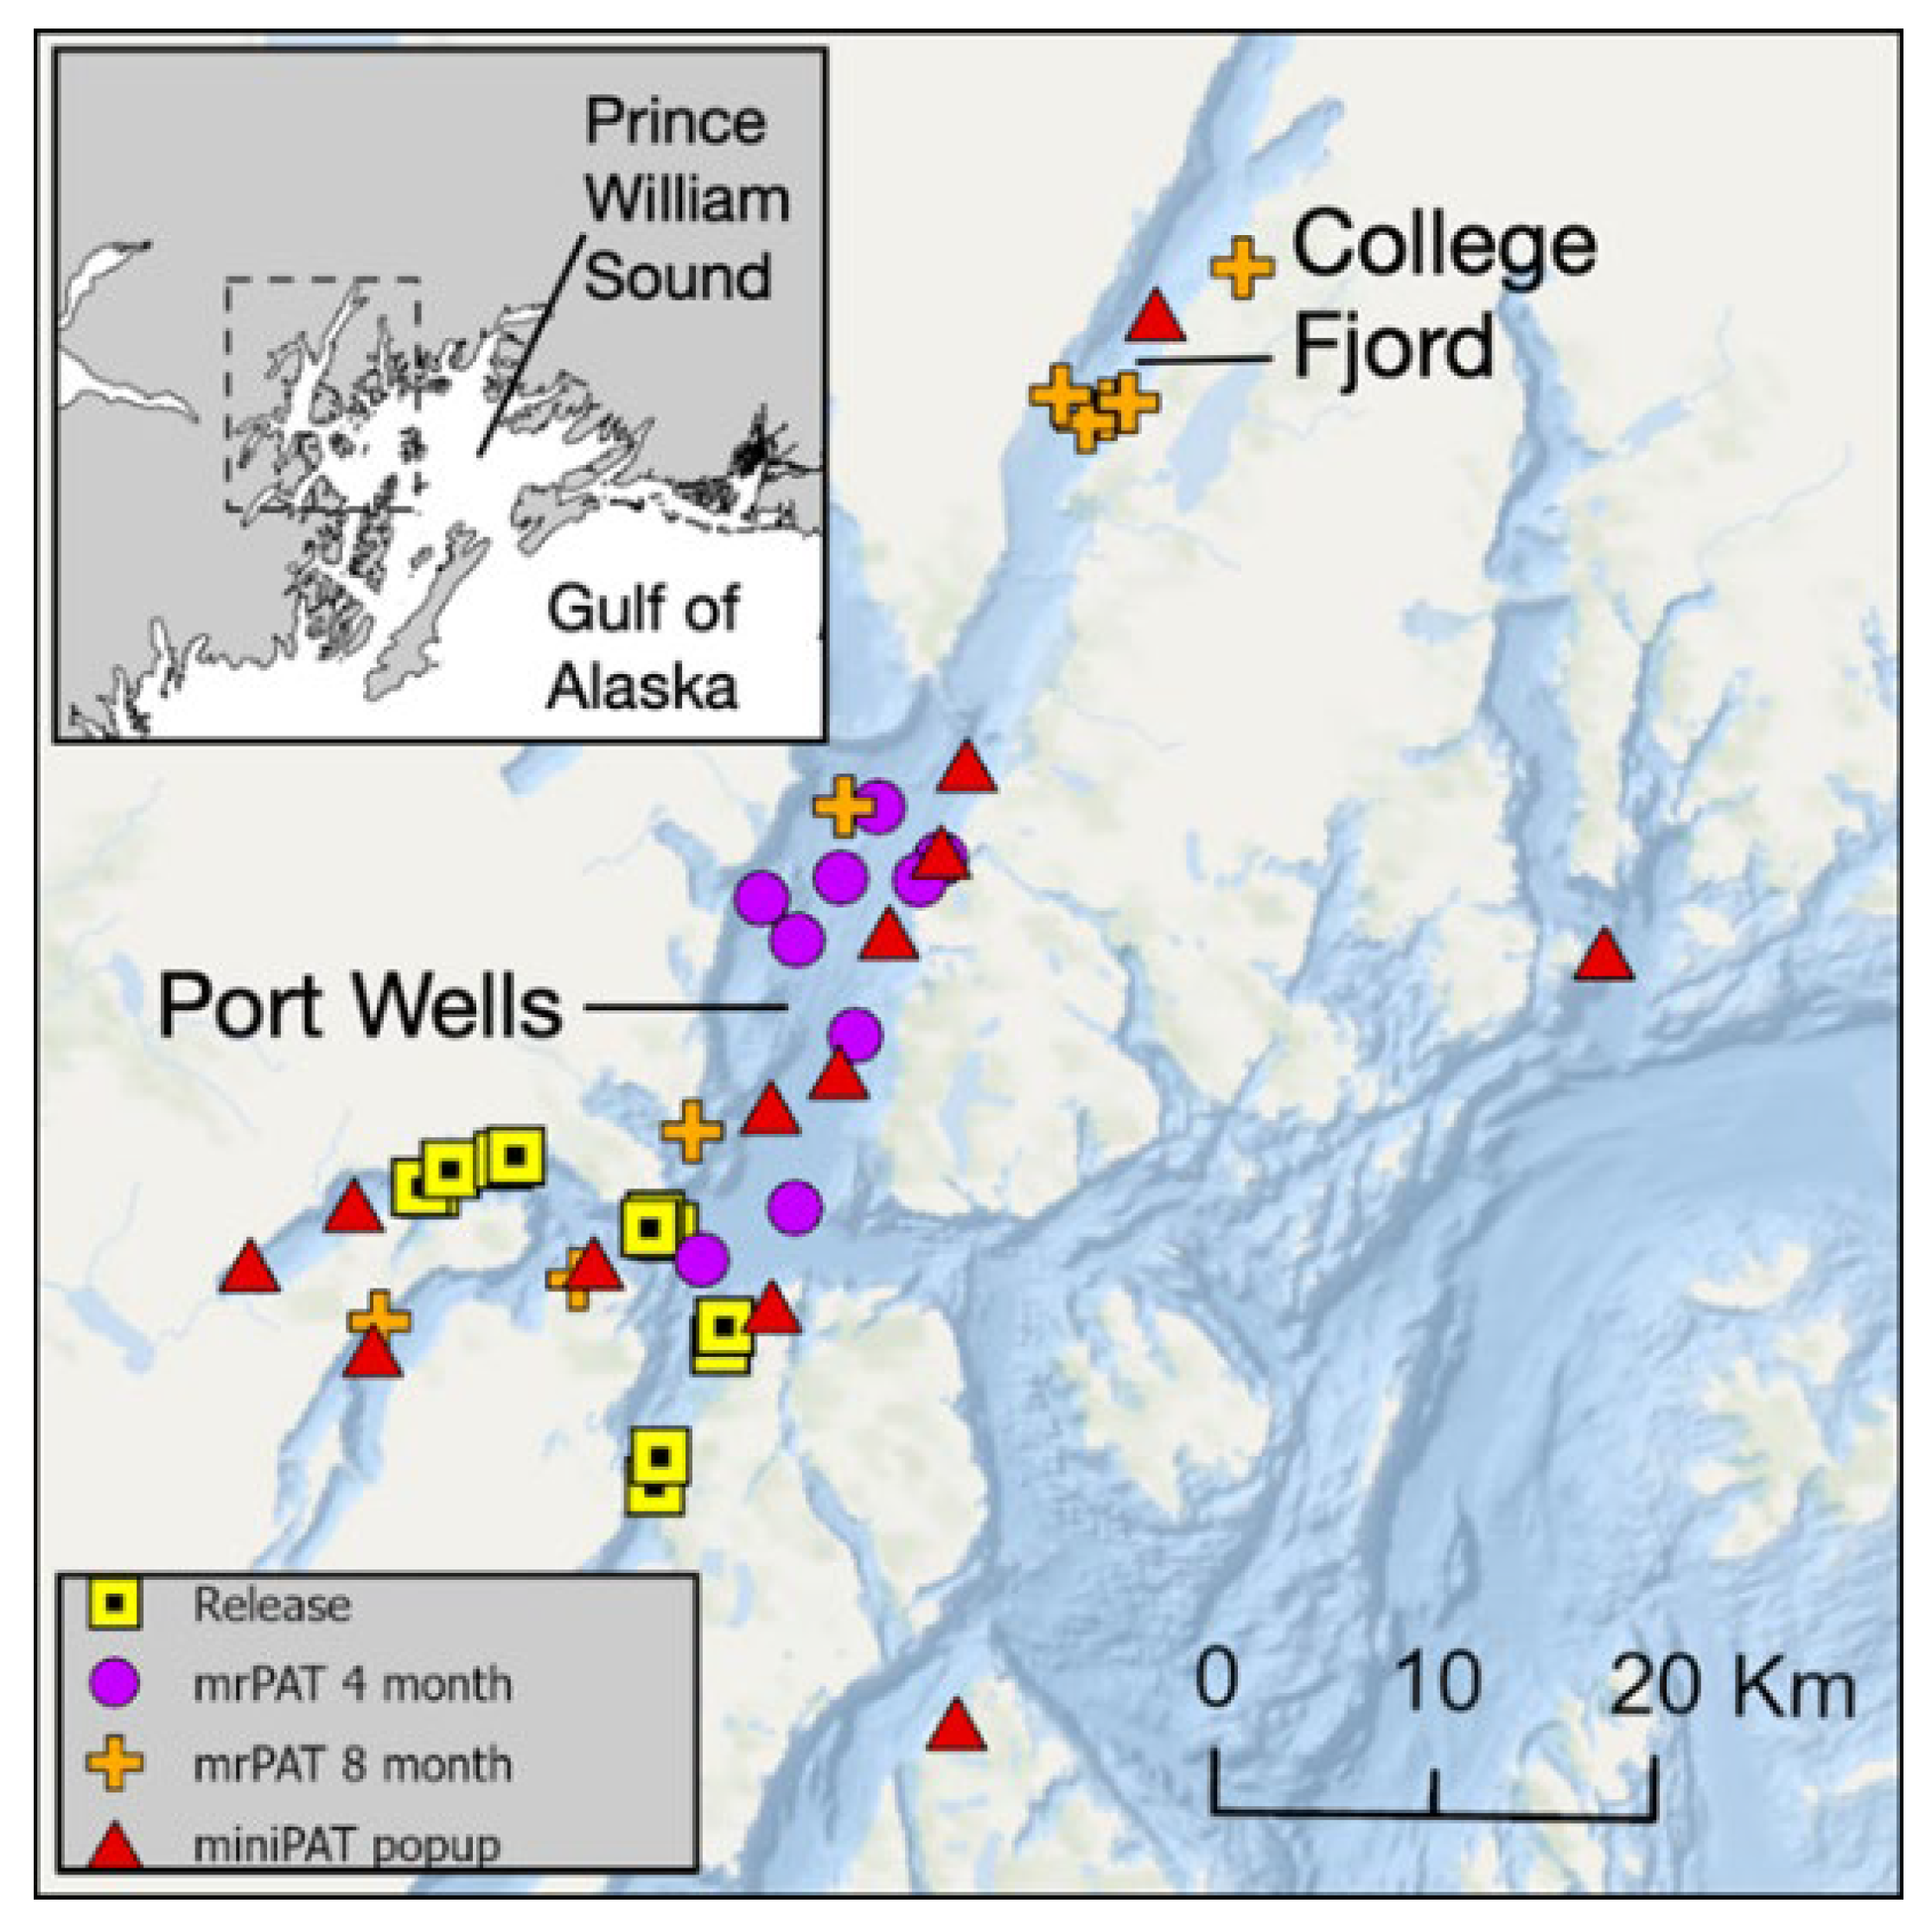
Figure 2.
Seasonal composite location probabilities for 6 sharks with detailed data sets and known locations from release, 4-month mrPAT, 8-month mrPAT, and 12-month miniPAT tags within Port Wells, Prince William Sound (PWS).
Figure 2.
Seasonal composite location probabilities for 6 sharks with detailed data sets and known locations from release, 4-month mrPAT, 8-month mrPAT, and 12-month miniPAT tags within Port Wells, Prince William Sound (PWS).
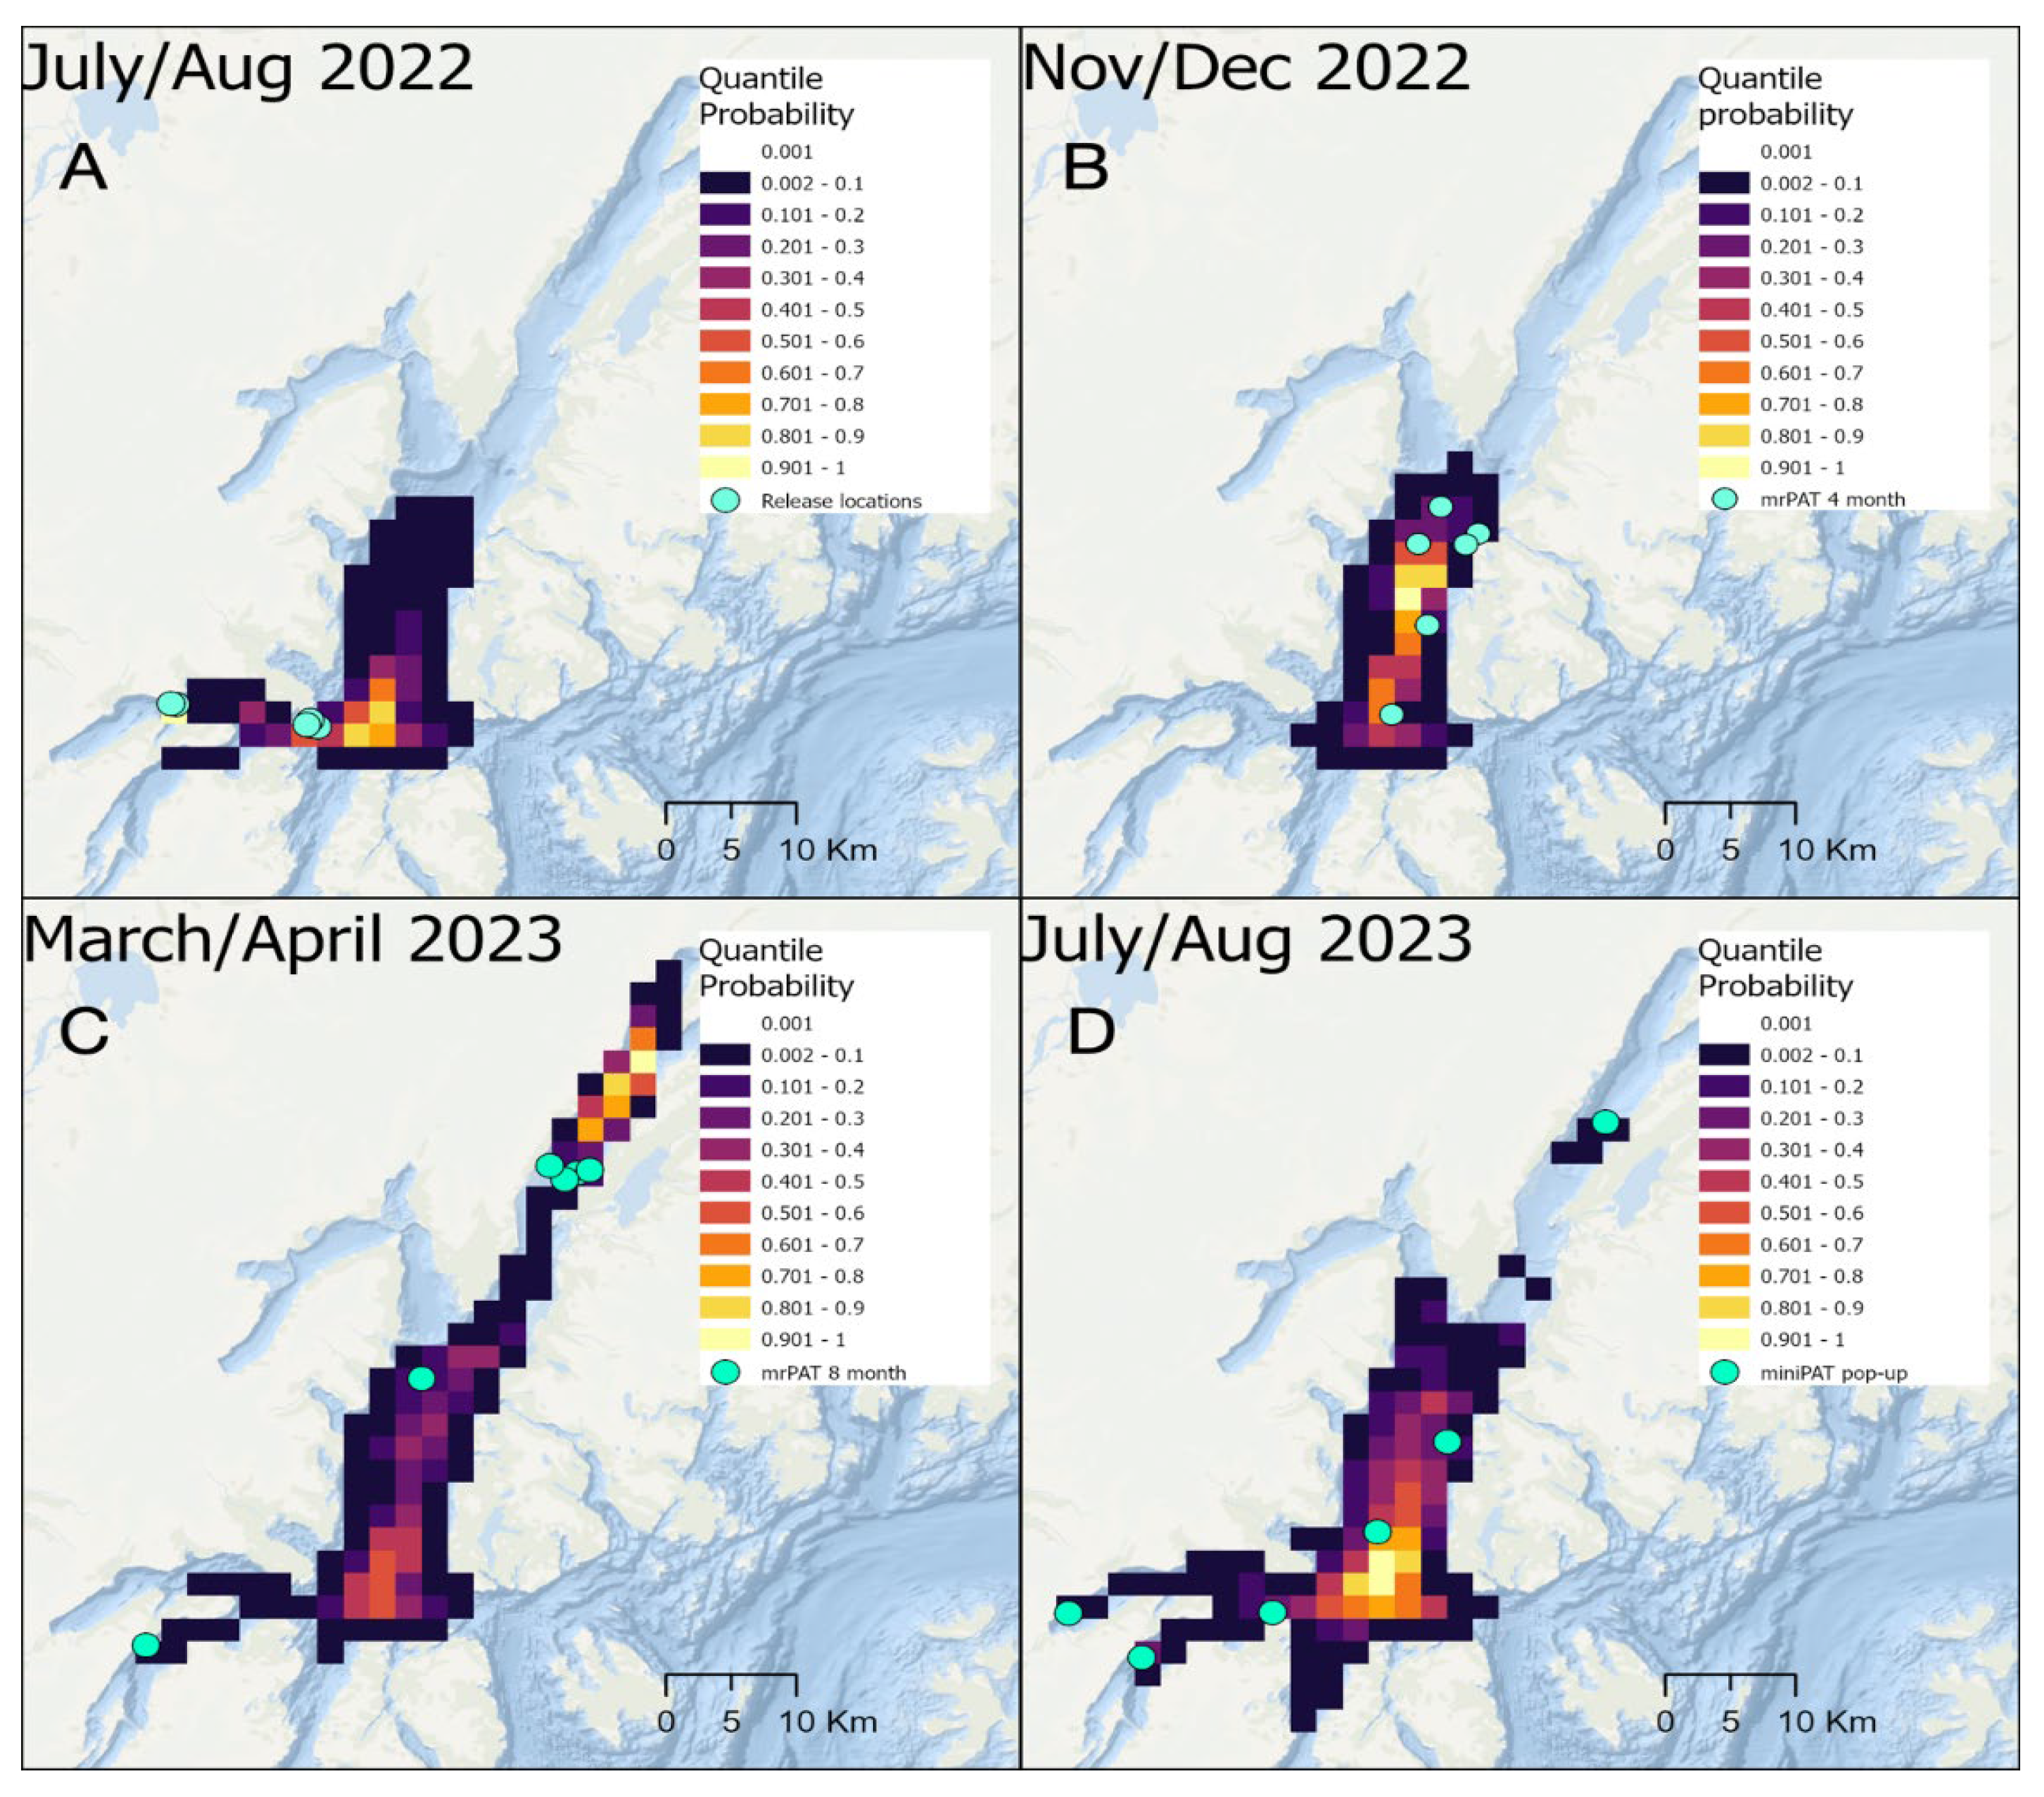
Figure 3.
Diurnal patterns of the percentage of time at depth (A) and temperature (B) for all sharks and seasons combined (n=7).
Figure 3.
Diurnal patterns of the percentage of time at depth (A) and temperature (B) for all sharks and seasons combined (n=7).
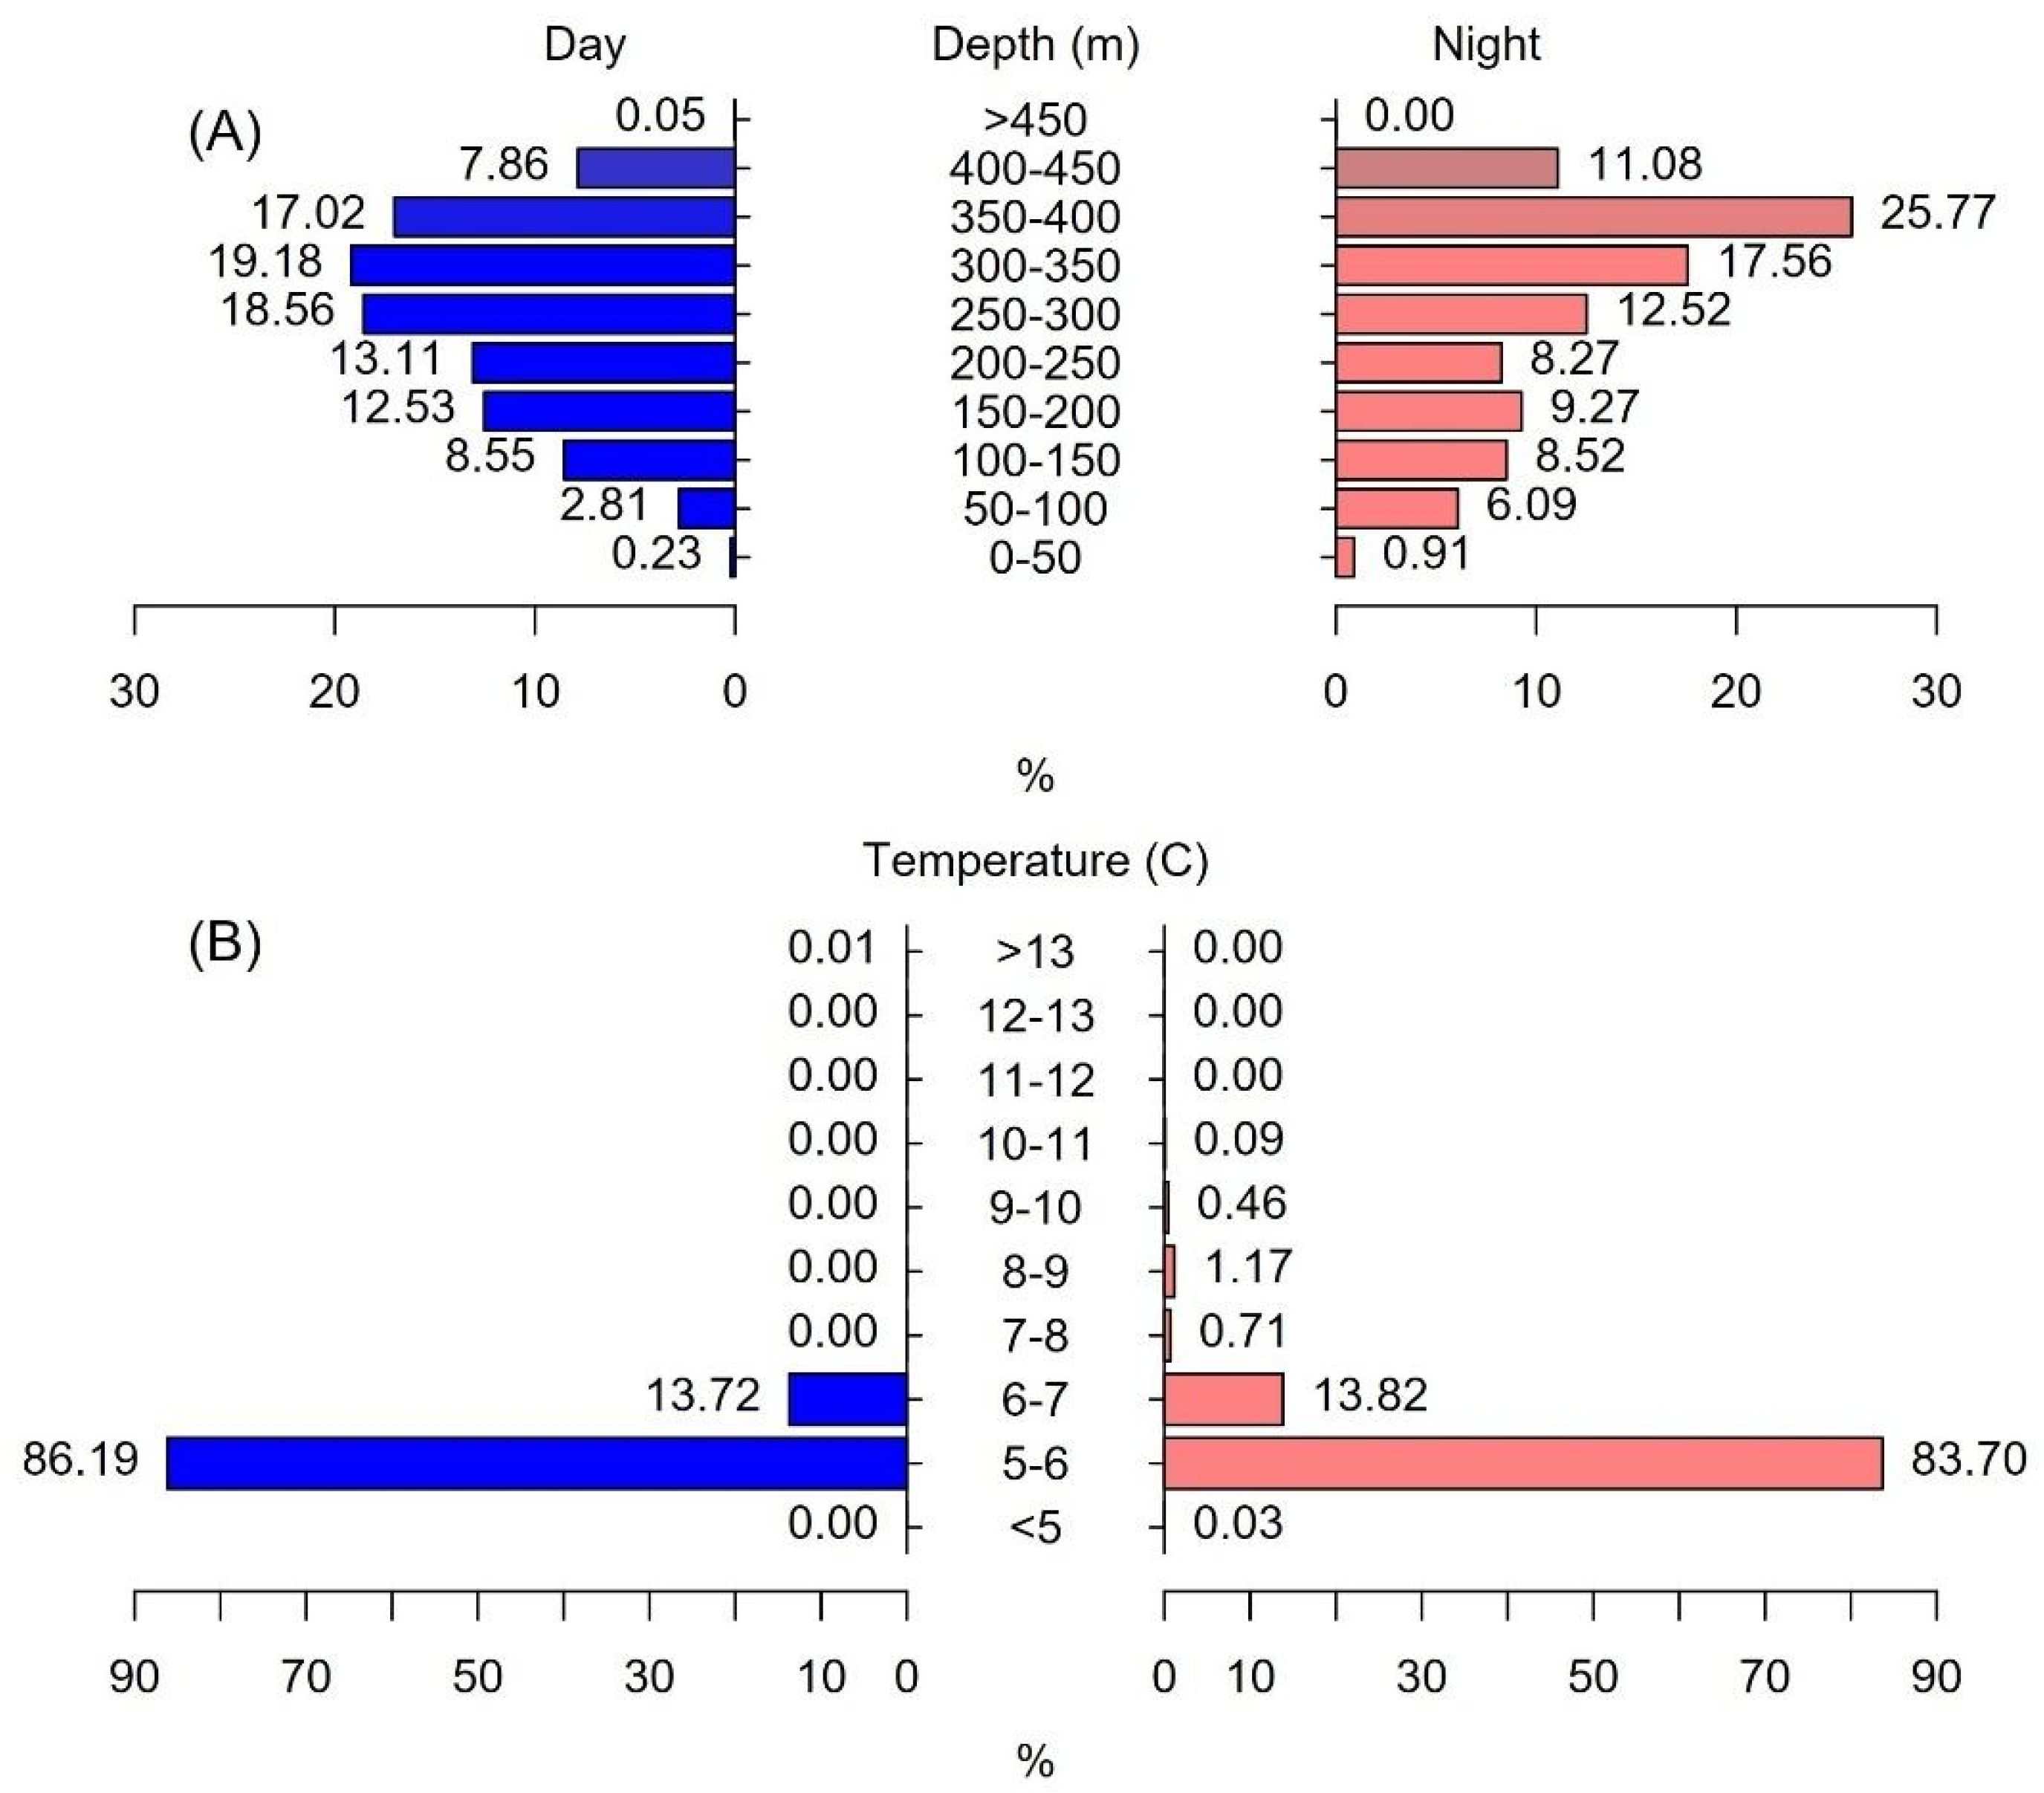
Figure 4.
Temporal distribution of cluster assignments based on shark diel depth and temperature data. Each point represents a day of the year for an individual shark (e.g., 7 points per day) with color and shape representing what cluster it was assigned to. Clusters 1 and 2 were common in the winter and early spring, while Clusters 3 and 4 were most common in spring and summer.
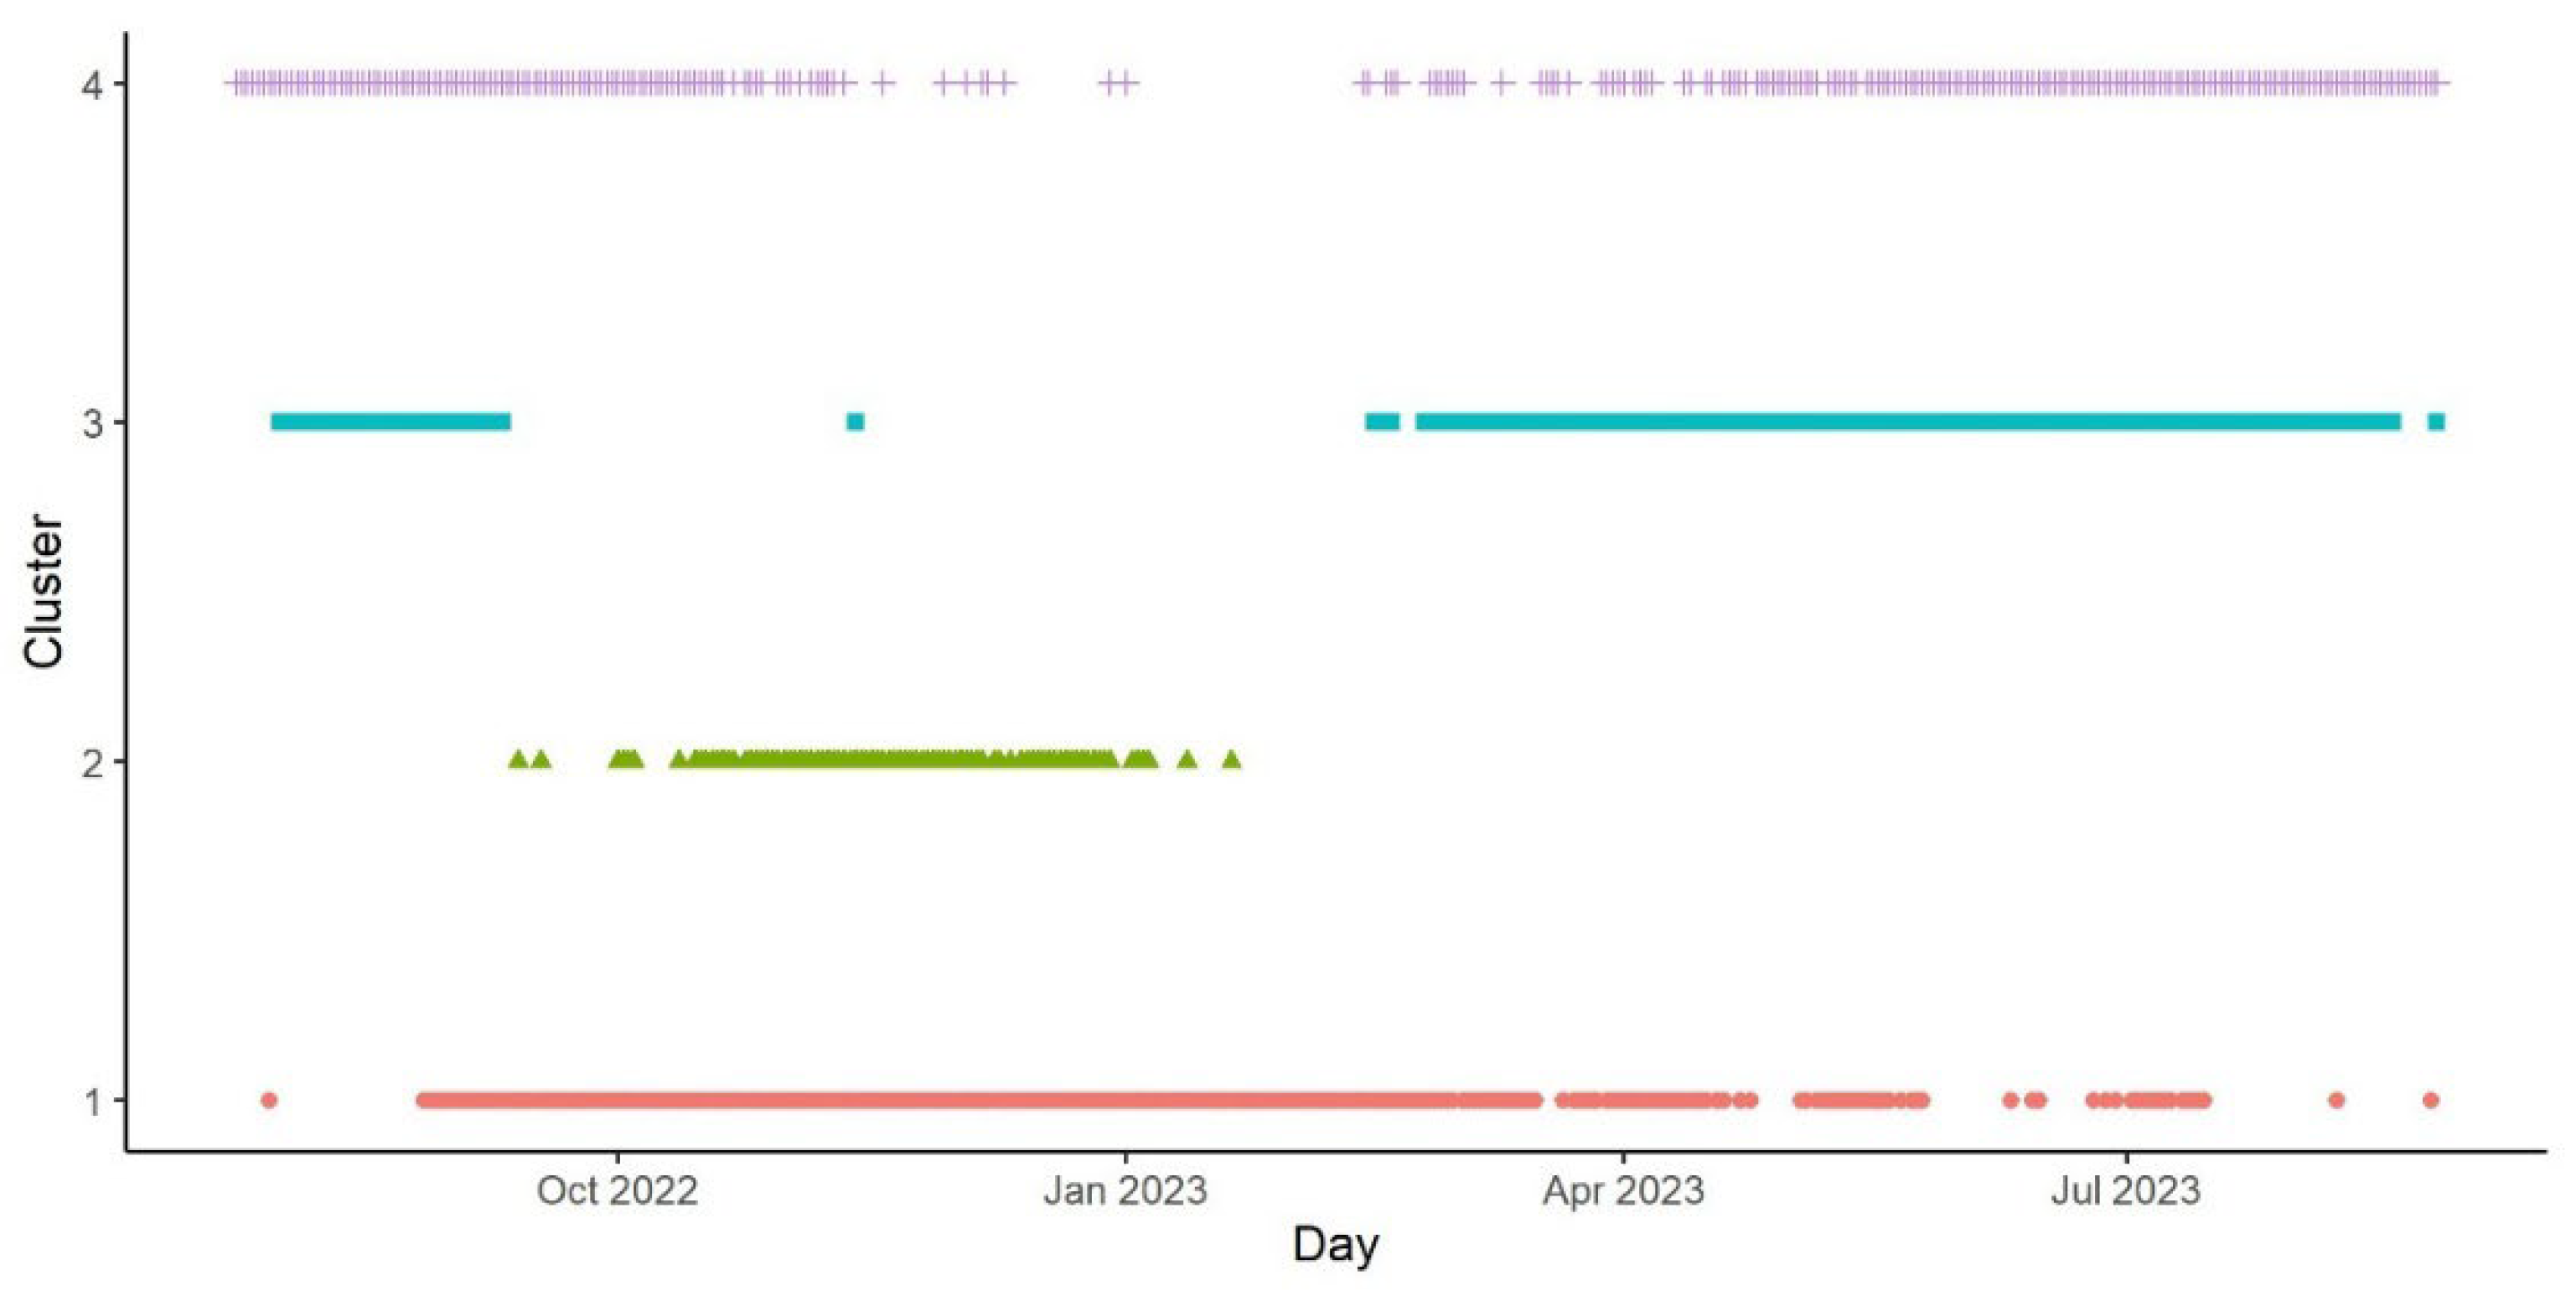
Figure 5.
Daily values of depth range (m), mean depth (m), and maximum temperature (°C), during the daylight (left) and night (right). Each point represents a day of the year for an individual shark (i.e., 7 points per day), with color and shape representing what cluster it was assigned to.
Figure 5.
Daily values of depth range (m), mean depth (m), and maximum temperature (°C), during the daylight (left) and night (right). Each point represents a day of the year for an individual shark (i.e., 7 points per day), with color and shape representing what cluster it was assigned to.
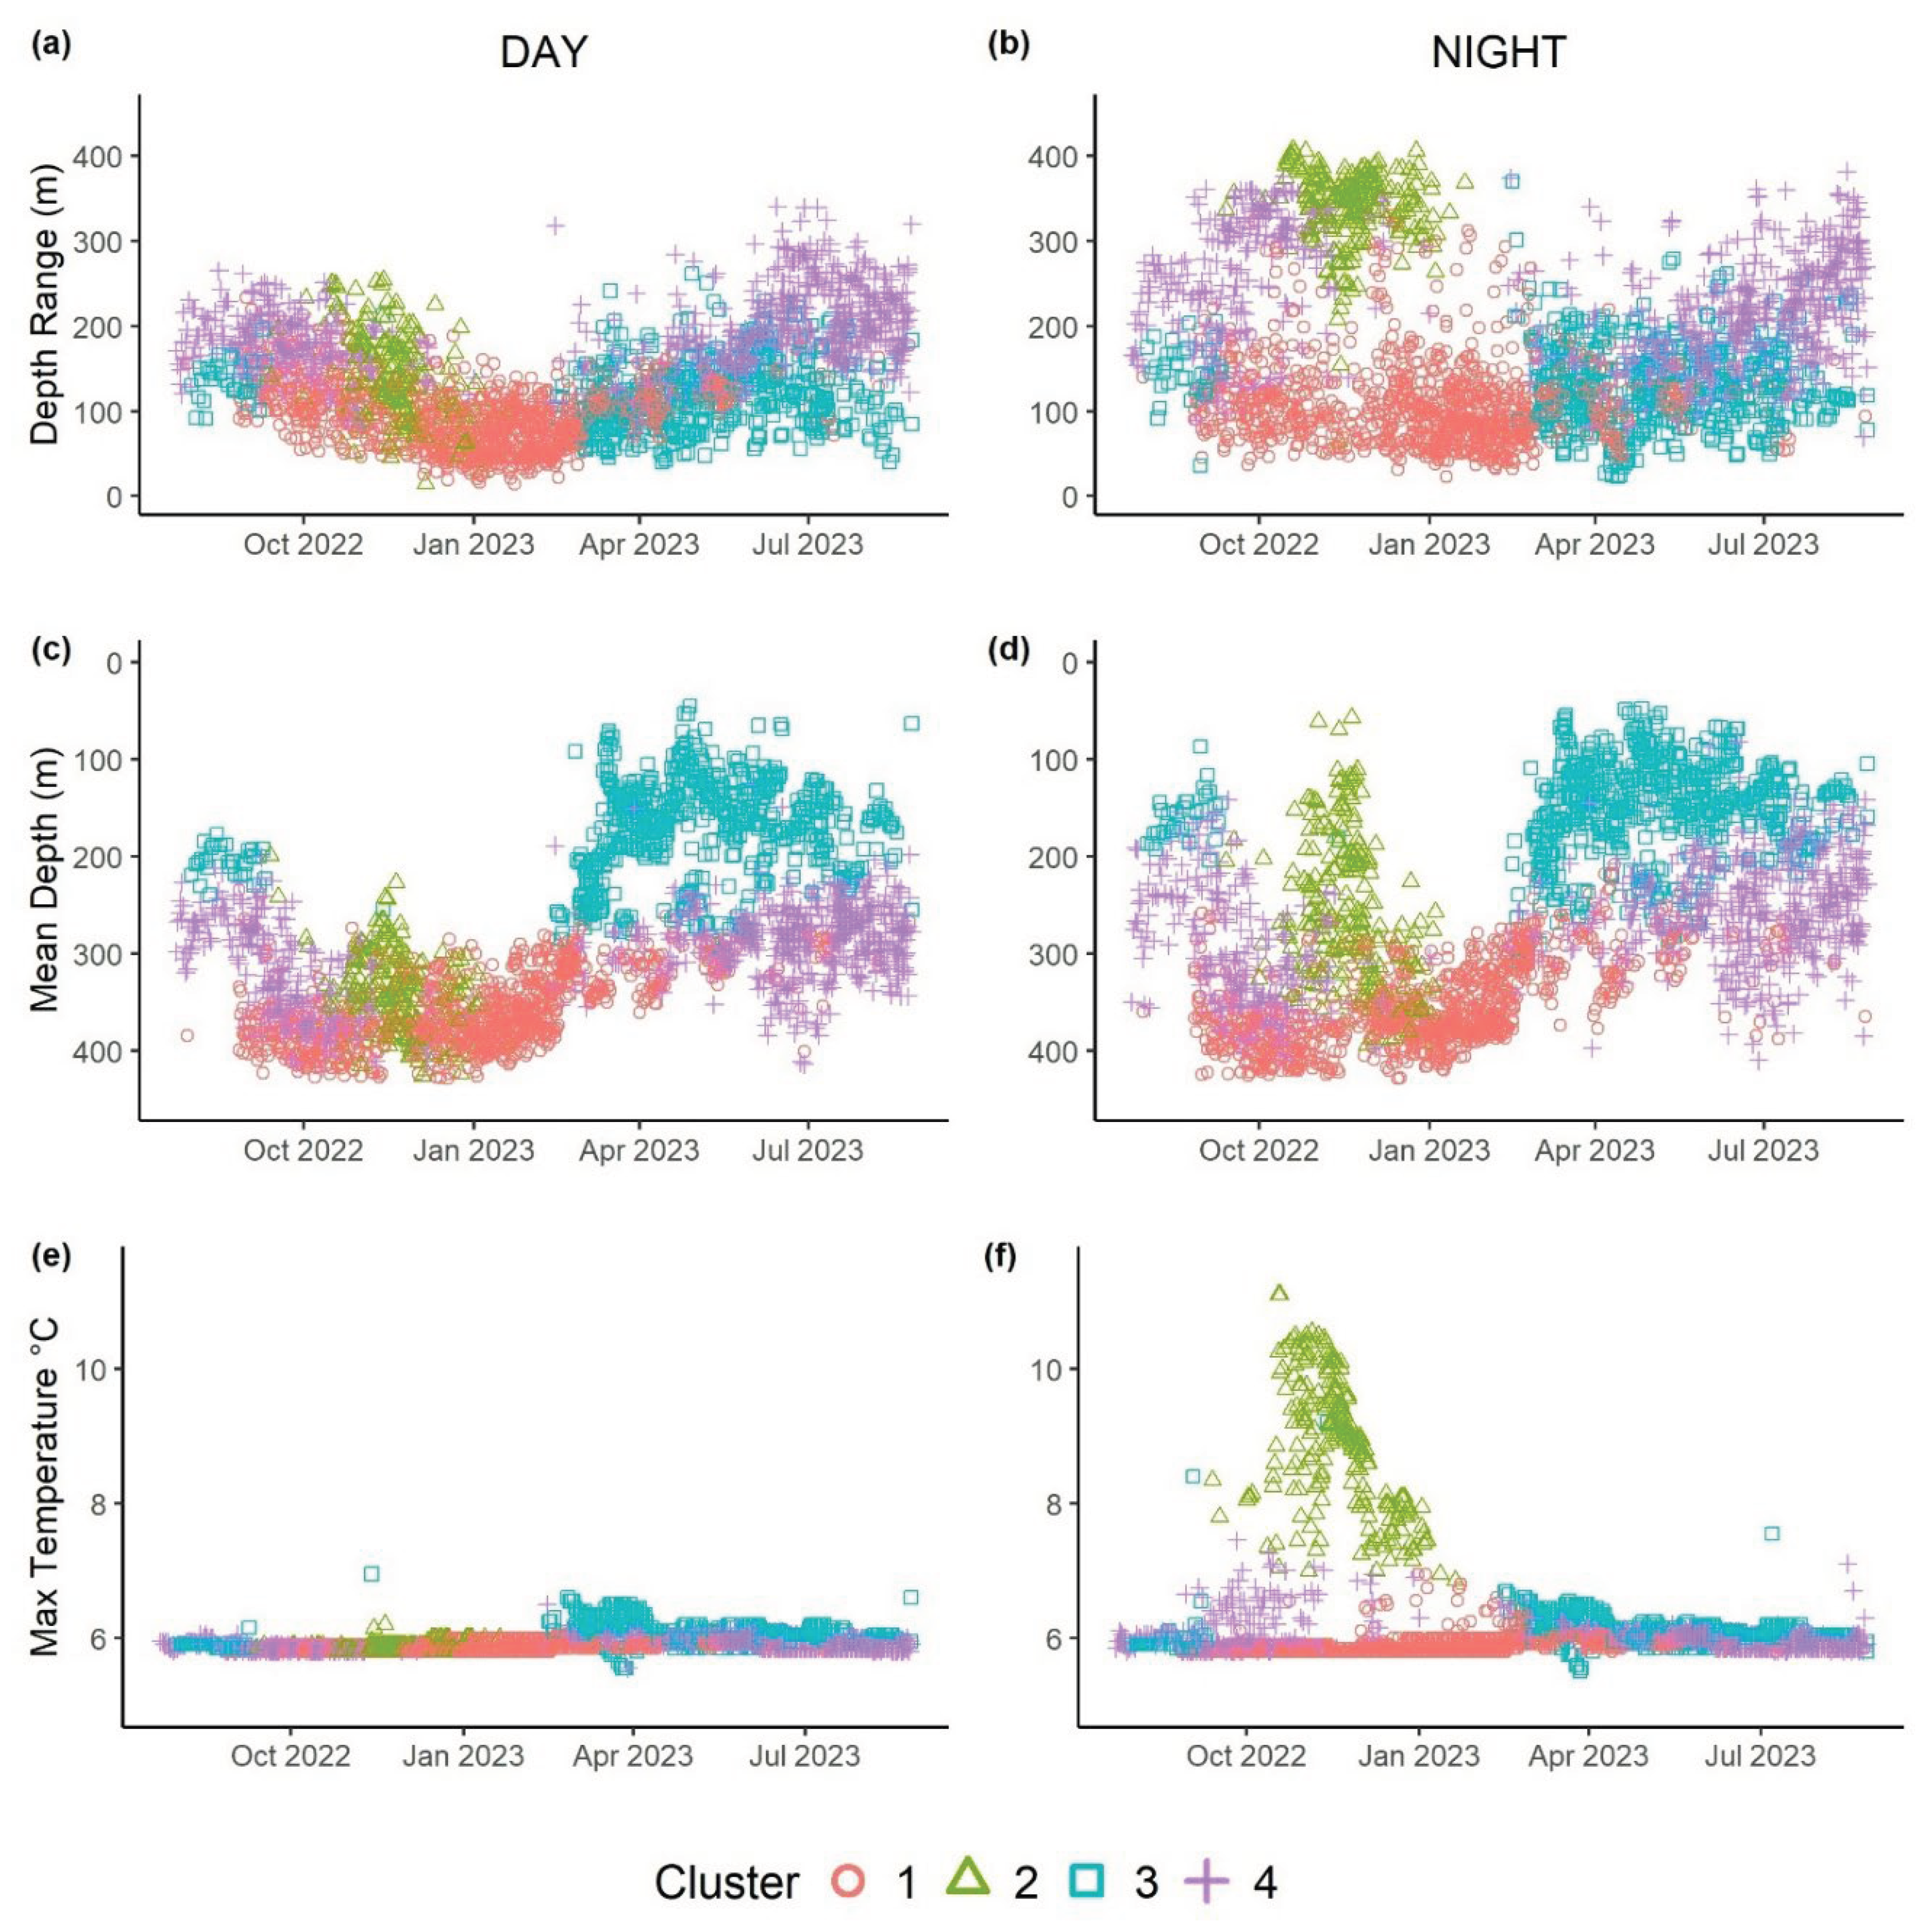

Table 1.
Pacific sleeper sharks (Somniosus pacificus) caught in 2022 in western Prince William Sound (n=16, bold indicates data used in this study). Time at liberty indicates when tags either prematurely detached and transmitted or as scheduled after 365 days. Recovery indicates whether the MiniPAT tag transmitted data only via satellite and how many valid messages were received via the Argos system (n = 3) and/or if all collected data was downloaded from a physically recovered tag (REC n=10). In addition to MiniPAT tags, some sharks received one or more mrPAT tags, which were set to release and transmit after 120 or 240 days, respectively. Actual release time is indicated in days for each mrPAT tag. Some sharks were also tagged with an acoustic tracking transmitter (Innovasea, Nova Scotia, Canada) externally (E) or internally (I).
| Shark ID | Release Date | Sex | TL (cm) | Time at liberty (Days) | MiniPAT Recovery | mrPAT 120d | mrPAT 240d | Acoustic tag |
|---|---|---|---|---|---|---|---|---|
| SP22-01 | 6/24/22 | M | 229 | 17 | REC | 120 | 241 | E |
| SP22-02 | 6/24/22 | F | 284 | 31 | REC | 32 | 26 | E |
| SP22-03 | 7/12/22 | M | 241 | 357 | Argos-172 | 120 | 148 | E |
| SP22-04 | 7/13/22 | F | 305 | 86 | REC | 89 | 83 | E |
| SP22-05 | 7/22/22 | F | 248 | 365 | REC | 121 | 241 | - |
| SP22-06 | 7/22/22 | F | >300* | - | - | - | - | - |
| SP22-07 | 7/24/22 | F | 244 | - | - | - | - | - |
| SP22-08 | 7/24/22 | F | 230 | 365 | REC | 121 | 191 | - |
| SP22-09 | 8/11/22 | F | 175¥ | - | - | - | - | E |
| SP22-10 | 8/12/22 | M | 343 | 365 | Argos-440 | 120 | 241 | E |
| SP22-11 | 8/14/22 | F | 262 | 46 | Argos-892 | - | - | - |
| SP22-12 | 8/25/22 | F | 321 | 365 | REC | 121 | 241 | E |
| SP22-13 | 8/25/22 | M | 280 | 365 | REC | 121 | 241 | E |
| SP22-14 | 8/25/22 | M | 273 | 365 | REC | 121 | 241 | I |
| SP22-15 | 8/27/22 | F | 253 | 365 | REC | 121 | 241 | E |
| SP22-16 | 8/27/22 | F | 271 | 365 | REC | 121 | 241 | I |
*captured but broke free before measuring or sampling (SP22-06). ¥ was released due to size with only an acoustic pinger (SP22-09).
Table 2.
Quarterly net horizontal displacement (great circle distance, km) between pairs of known locations from satellite tags, as well as over 1yr between release and pop-up of miniPAT tag. *8mo mrPAT for SP22-08 popped-up early so displacement was not calculated.
Table 2.
Quarterly net horizontal displacement (great circle distance, km) between pairs of known locations from satellite tags, as well as over 1yr between release and pop-up of miniPAT tag. *8mo mrPAT for SP22-08 popped-up early so displacement was not calculated.
| Shark ID | Release -4mo mrPAT (120d) | 4mo mrPAT-8mo mrPAT (120d) | 8mo mrPAT-miniPAT PopUp (120d) | Release -miniPAT PopUp (367 d) |
|---|---|---|---|---|
| SP22_05 | 20.6 | 25.3 | 1.1 | 7.6 |
| SP22_08 | 23.7 | * | * | 8.5 |
| SP22_12 | 16.1 | 18.3 | 25.6 | 23.9 |
| SP22_13 | 6.3 | 38.8 | 54.9 | 18.7 |
| SP22_14 | 20.9 | 22.3 | 26.2 | 17.0 |
| SP22_15 | 19.8 | 22.1 | 30.0 | 7.5 |
| SP22_16 | 21.7 | 20.4 | 5.8 | 47.5 |
| Mean | 18.4 | 24.5 | 23.9 | 18.7 |
| S.d. | 5.8 | 7.4 | 17.6 | 14.2 |
Table 3.
K-means cluster outputs for all sharks combined; means are presented based on the scaled-normalized predictor variables (e.g., negative mean depths indicate the sharks were in relatively shallow waters; negative max temperatures indicate the sharks were in colder ambient waters).
Table 3.
K-means cluster outputs for all sharks combined; means are presented based on the scaled-normalized predictor variables (e.g., negative mean depths indicate the sharks were in relatively shallow waters; negative max temperatures indicate the sharks were in colder ambient waters).
| Day | Night | ||||||
|---|---|---|---|---|---|---|---|
| Cluster | n | Depth Range (m) | Mean Depth (m) | Max Temp (°C) | Depth Range (m) | Mean Depth (m) | Max Temp (°C) |
| 1 | 980 | -0.643 | 0.743 | -0.461 | -0.634 | 0.866 | -0.400 |
| 2 | 240 | 0.075 | 0.587 | -0.452 | 1.873 | -0.052 | 2.838 |
| 3 | 363 | -0.216 | -1.404 | 0.977 | -0.428 | -1.257 | -0.167 |
| 4 | 686 | 1.093 | 0.034 | -0.089 | 0.646 | -0.054 | -0.267 |
Disclaimer/Publisher’s Note: The statements, opinions and data contained in all publications are solely those of the individual author(s) and contributor(s) and not of MDPI and/or the editor(s). MDPI and/or the editor(s) disclaim responsibility for any injury to people or property resulting from any ideas, methods, instructions or products referred to in the content. |
© 2025 by the authors. Licensee MDPI, Basel, Switzerland. This article is an open access article distributed under the terms and conditions of the Creative Commons Attribution (CC BY) license (http://creativecommons.org/licenses/by/4.0/).
Copyright: This open access article is published under a Creative Commons CC BY 4.0 license, which permit the free download, distribution, and reuse, provided that the author and preprint are cited in any reuse.


