
Submitted:
23 December 2025
Posted:
24 December 2025
You are already at the latest version
Abstract
Growing global awareness of climate change and environmental protection has fueled the rapid expansion of the green bond market. Building upon a theoretical framework that links green bond issuance to corporate governance and green innovation effects, this study employs a sample of Chinese A-share listed firms from 2014 to 2022 and applies a staggered difference-in-differences (DID) approach to empirically examine the impact of green bond issuance on corporate risk-taking and the underlying mechanisms. The results indicate that green bond issuance significantly reduces firms’ risk-taking levels. This effect operates primarily through three channels: increasing agency costs, enhancing information transparency, and exacerbating structural imbalances in green innovation. Furthermore, the risk-mitigating effect of green bonds is more pronounced in state-owned enterprises, firms with low audit quality, and firms operating in heavily polluting industries. These findings offer important implications for accelerating the diversification of China’s green financial system, improving firms’ risk management capabilities, and fostering the development of green productivity.
Keywords:
green bonds
; risk-taking
; staggered DID
; corporate governance
; green innovation structure
MSC: 62P20
1. Introduction
Growing global awareness of climate change and environmental protection has fueled the rapid expansion of the green bond market. According to data from the Climate Bonds Initiative (CBI), the issuance of green bonds in China expanded from RMB 201.8 billion in 2016 to RMB 844.8 billion in 2023, representing an average annual growth rate of 22.7%. China has thereby become the world’s largest green bond market, with green bonds—together with green credit—forming the core channels of its green financial system. As an innovative financing instrument, green bonds direct capital toward environmentally oriented investment projects, provide firms with stable funding for green governance and innovation[1], and strengthen incentives for green value creation through enhanced information disclosure and price signaling[2], ultimately contributing to high-quality corporate development[3].
Against the backdrop of a complex global and domestic environment, improving China’s high-quality economic development requires reinforcing competitiveness, innovation capacity, and resilience to risk. Understanding whether and how green bond issuance influences corporate risk-taking is therefore of substantial policy and academic significance. A clearer understanding of this relationship can aid in the refinement of China’s multi-tiered green financial system and enhance the role of green bonds in promoting firms’ green transformation and the development of new-quality productive forces.
Corporate risk-taking lies at the heart of strategic decision-making and reflects both a firm's current operating status and its exposure to future uncertainties[4]. However, the question of how green bond issuance affects firms’ risk-taking willingness and capacity remains insufficiently studied. Existing evidence is fragmented. Some studies suggest that green bonds may alleviate maturity mismatch in corporate financing[5], yet the financial returns from environmental practices often fall short of their social benefits. Consequently, green bond premiums may fail to enhance financial performance and may even elevate short-term credit risk[6]. Conversely, other scholars argue that issuing green bonds may reduce overall credit risk[7]. Research in the banking sector shows that green bond business can contribute to income diversification and reduce banks’ risk-taking[8]. Additional evidence indicates that strengthened incentives for substantive green innovation constitute an important channel through which green credit affects risk-taking among environmentally oriented firms[9]. Meanwhile, greater policy uncertainty and regulatory pressure may induce firms to delay investments and acquisitions[10], thereby suppressing corporate risk-taking through financing constraints and investment-penalty mechanisms[11].
Although green bonds and corporate risk-taking have each attracted substantial scholarly attention, the literature has yet to establish a unified analytical framework linking the two. To fill this gap, this study uses panel data on non-financial A-share listed firms from 2014 to 2022 and treats firms’ first green bond issuance as a quasi-natural experiment. From the perspectives of corporate governance and green innovation, we develop a theoretical framework and empirically examine the impact of green bond issuance on corporate risk-taking, the mechanisms through which the effect operates, and the heterogeneity across firm types. This study enriches the literature on green bond effects, advances the theoretical understanding of corporate governance and risk management, and offers meaningful insights for promoting green transformation, fostering new-quality productive forces, and improving the construction of China’s green financial system.
2. Theoretical Framework
2.1. The Impact of Green Bond Issuance on Corporate Risk-Taking
Green bonds refer to securities issued in accordance with legal procedures whose proceeds are allocated exclusively to eligible green industries, green projects, or environmentally sustainable economic activities. On the one hand, as a market-oriented direct financing instrument supported by complementary government policies, green bonds allow firms to avoid the high transaction costs associated with bank credit and other indirect financing channels, thereby reducing financing costs[12]. This helps improve firms’ financial and operational performance, ease financing constraints, and broaden access to capital, while channeling substantial social resources toward environmental governance. As a result, green bonds serve as an important complement to China’s predominantly green-credit-based financial system. On the other hand, green bonds impose more stringent information disclosure requirements than conventional bonds. In addition to standard financial and credit information, issuers must clearly detail the use of proceeds and comprehensively evaluate specific green projects. During the bond’s duration, issuers are also required to regularly disclose the actual use of funds and report the environmental benefits achieved, such as energy savings and emissions reductions. Moreover, third-party rating agencies conduct credit assessments of both the green bonds and their issuers[12], thereby constraining firms’ ability to rely on selective disclosure of positive environmental information to obscure their true environmental performance.
According to the pecking order theory, firms that choose debt financing to invest in green bond–related projects must consider potential liquidity risk, credit risk, and interest rate risk—factors that pose significant challenges to corporate governance and green innovation. First, risk-taking reflects a firm’s willingness and propensity to allocate resources to projects with substantial risk in pursuit of higher expected returns. It embodies the firm’s strategic investment orientation and risk preference, and managerial decisions ultimately reveal the level of risk-taking undertaken by the firm[13]. Given the long-term and uncertain payoffs associated with environmental projects, managers often adopt more cautious risk attitudes and conservative investment strategies, seeking to reduce uncertainty in decision-making. As a result, they tend to avoid high-risk, high-return projects, thereby suppressing the firm’s overall risk-taking level[14]. Second, strong investor protection can mitigate managerial opportunism, expand the scale of efficient investment, and enhance corporate risk-taking[15]. External governance mechanisms—such as analyst coverage, institutional ownership, and audits conducted by Big Four accounting firms—also provide effective oversight of corporate risk-taking behavior[4]. Green bonds enhance third-party monitoring and improve corporate transparency, thereby protecting investor interests and alleviating information asymmetry[16]. Reduced information deviation may also increase institutional investors’ willingness to hold shares[17], thus imposing additional constraints on excessive corporate risk-taking.
Furthermore, resource-based theory posits that rational firms are more likely to undertake positive-NPV, high-risk projects when they need technological innovation to create or sustain competitive advantages[18]. However, the “greenwashing” risks embedded in green bond issuance and use[19] may weaken this mechanism. Instead of substantially strengthening their green technological innovation capacity, firms may engage in strategic, symbolic green innovation—evidenced by a higher proportion of non-invention patent applications, lower green patent authorization rates, and stagnant citation frequency of green patents[20]. Consequently, the technological innovation channel through which green bonds could stimulate greater risk-taking fails to deliver the expected incentive effects. Based on the above analysis, the following hypothesis is proposed:
H1: The issuance of green bonds significantly reduces corporate risk-taking.
2.2. The Mechanisms Through Which Green Bond Issuance Influences Corporate Risk-Taking
- Increased Agency Costs
From the perspective of managerial decision-making, green bond issuance can influence managers’ risk attitudes and strategic choices. According to agency theory, managers tend to prefer low-risk, stable-return projects to safeguard their compensation and job security, thereby avoiding high-return projects that may entail substantial risk[14]. This risk-averse behavior aligns with personal utility maximization but may conflict with the firm’s value-maximization goals and owners’ preference for long-term sustainable and socially responsible investments[15]. On the one hand, normal operation and profitability of green projects require managerial oversight. Firms face high initial investment, long construction periods, and delayed returns, while also navigating industry regulation changes and policy adjustments, which impose additional operational costs. On the other hand, managerial opportunism may prompt short-termist behavior in fulfilling social responsibilities. While corporate governance mechanisms and clear delineation of authority can align management with firm interests and improve capital allocation efficiency[21], resource scarcity may force managers to prioritize green bond projects to maintain reputational and financing advantages, crowding out other business activities and temporarily reducing overall risk-taking[4]. Modern corporate governance theory suggests that higher governance quality entails better investor protection and lower agency costs, whereas elevated agency costs are associated with lower levels of corporate risk-taking[22].
2. Enhanced Information Transparency
From the perspective of stakeholder oversight, green bond issuance mitigates information asymmetry between the firm and external parties. Reputation theory posits that issuing green bonds signals a strong environmental commitment to the market, enhancing corporate reputation through sustained short-term positive actions[23]. Green bonds’ strict disclosure requirements compel firms to provide detailed information on project progress and social responsibility performance, attracting monitoring from media and institutional investors[17]. Insufficient disclosure, in contrast, exacerbates information asymmetry, reduces bond credit spreads, and may trigger “greenwashing” penalties, increasing credit risk[19]. To protect and cultivate their reputation, firms are incentivized to limit managers’ concealment of negative information[10], improving decision-making transparency and facilitating stakeholder monitoring of both financial performance and environmental outcomes. According to signaling theory, green bond issuance attracts heightened market attention, bringing in professional investors and analysts who enhance governance and information interpretation, reduce information hiding, and activate external regulatory forces[2].
- 2.
- Aggravation of Green Innovation Structural Imbalance
From the perspective of green technological innovation, green bond issuance can enhance firms’ environmental performance and governance behaviors. According to the bond innovation effect hypothesis, green bonds, as dedicated green financing instruments, can alleviate financing constraints and increase R&D investment[24], accelerating the translation of green innovation into tangible outcomes[25]. However, green innovation is inherently long-term, high-cost, and high-risk, and can be classified into exploratory green innovation and exploitative green innovation—the composition of which defines the green innovation structure. Exploratory green innovation reflects a firm’s deep expansion capability in green R&D and aims to develop novel green products to meet market demand, whereas exploitative green innovation relies on existing resources to optimize current green products for short-term benefits[26]. Given the high technological threshold of exploratory innovation, substantial investment in equipment, capital, and human resources represents a sunk cost, increasing regulatory risk and uncertainty. Exploitative innovation, in contrast, is more cost-effective. Although green bonds positively impact firms’ green innovation levels through resource and supervisory effects, firms tend to prioritize lower-threshold, practical green innovations over inventive technological advancements[27,28]. Based on the above analysis, we propose the following hypotheses:
H2a: Green bond issuance reduces corporate risk-taking by increasing agency costs.
H2b: Green bond issuance reduces corporate risk-taking by enhancing information transparency.
H2c: Green bond issuance reduces corporate risk-taking by aggravating the structural imbalance in green innovation.
2.3. The Heterogeneous Effects of Green Bond Issuance on Corporate Risk-Taking
- Ownership Structure
China’s green bond market follows a top-down, government-led model. State-owned enterprises (SOEs) generally bear strategic and social policy responsibilities, facing greater pressure for energy conservation, emissions reduction, and green transformation[29]. Consequently, they exhibit stronger incentives for green innovation[10]. Owing to their inherent credit advantages and government backing, green bonds’ supervisory effect may be more pronounced for SOEs, further motivating them to enhance technological competitiveness[25]. At the same time, SOEs enjoy financing conveniences unavailable to private firms, resulting in higher green bond issuance propensity. However, to ensure the smooth implementation of green projects, increased operating costs and environmental governance investments may crowd out other productive investments. Managers may forgo certain positive-NPV, high-risk projects, expanding the firm’s exposure to uncertainty and affecting risk perception. As funding gaps widen, the long-term and uncertain returns of green bond projects constrain firm development, reduce the potential for generating excess profits through green technological innovation, and increase the probability of risk events, keeping corporate risk-taking at a relatively low level.
- 2.
- Audit Quality
Firms with higher information transparency can use green bond issuance to more effectively reduce debt default risk[7]. In contrast, managers of firms with low transparency may be more inclined to undertake additional risk for personal benefit[4]. Independent auditing is an important external governance mechanism: high-quality third-party auditors not only enhance stakeholder attention to financial information and oversight of managerial decisions, restraining short-termist tendencies, but also help management fully grasp project details and potential risks, preventing earnings management resulting from investment failures. Firms audited by Big Four accounting firms generally exhibit higher information transparency. For these firms, the marginal contribution of green bonds’ incremental disclosure requirements is expected to be weaker. Conversely, for firms with low prior transparency, strict green bond disclosure requirements increase the uncertainty of stakeholder expectations regarding risk-taking. Whether through formal institutional constraints or informal supervision from institutional investors and media, green bonds may induce low-audit-quality firms to adopt more conservative investment strategies, reducing project, managerial, and financial risks.
- 3.
- Industry Pollution Intensity
Compared with low-pollution industries, heavily polluting firms are more likely to issue green bonds to finance the greening of traditional projects and technological upgrades[5]. Third-party certified green bonds can significantly improve environmental performance, though some low-performing firms may use issuance to enhance their image without substantive improvements[30]. Because green bond issuance is not selective with respect to the pollution characteristics of issuers, highly polluting firms face stricter credit and financing constraints, and the market expects greater governance benefits from their green bonds. On one hand, stricter environmental regulation increases the urgency of green technological innovation for heavily polluting industries. However, short-term exploratory green innovation may not be cost-effective, leading firms to prioritize adaptive green innovation—mainly replacing polluting equipment or managing waste—resulting in limited incentives for substantive green innovation and structural imbalance in green innovation[27]. On the other hand, investors pay more attention to the green transformation of heavily polluting firms; absent evidence of substantive environmental action, green bond issuance may be perceived as a tool for managerial reputation enhancement or private gain, further reducing firms’ willingness to undertake risk. Based on the above analysis, we propose the following hypotheses:
H3a: The risk-reducing effect of green bond issuance is more pronounced for state-owned enterprises.
H3b: The risk-reducing effect of green bond issuance is more pronounced for firms with low audit quality.
H3c: The risk-reducing effect of green bond issuance is more pronounced for heavily polluting firms.
3. Data and Methodology
3.1. Sample Selection and Data Sources
This study selects data from Chinese A-share listed companies between 2014 and 2022 as the research sample, constructing a staggered difference-in-differences (DID) model to examine the impact of green bond issuance on corporate risk-taking. During the sample period, a total of 95 listed companies issued green bonds. The sample was processed according to the following criteria: (1) exclusion of all financial firms and companies designated as ST, *ST, or PT during the sample period; (2) removal of observations with missing values for the dependent variable; (3) winsorization of all continuous variables at the 1% level at both tails to mitigate the influence of extreme values. After applying the above filters, the final sample consists of 1,033 firms with 8,510 firm-year observations.
Data on green bond issuance, corporate financials, and governance were primarily obtained from the CSMAR (China Stock Market & Accounting Research) database, supplemented by the WIND database. Data on corporate green patents were sourced from the China National Research Data Service Platform (CNRDS), while some variables were calculated using specific methods or manually collected.
3.2. Variable definitions
3.2.1. Dependent variable
Corporate risk-taking is closely linked to the firm’s future cash flows, as higher risk-taking typically entails greater uncertainty in profitability. Prior studies have shown that green bond issuance significantly affects firm value and performance. Compared with the volatility of stock markets, earnings variability provides a more representative measure of corporate risk exposure. Accordingly, this study measures corporate risk-taking using earnings volatility adjusted by annual industry means[31]. Specifically, the ratio of earnings before interest and taxes (EBIT) to total assets at the end of the year (ASSETS) is first calculated, and then the corresponding industry-year mean is subtracted. A rolling standard deviation over three years (from t–2 to t) is computed to capture the variability. Higher earnings volatility indicates a higher level of corporate risk-taking. The calculation is formally expressed as follows:
where and t denote the firm and year, respectively; N represents the number of firms within the industry, and T indicates the different observation periods.
3.2.2. Key Explanatory Variable
To avoid multicollinearity, this study uses only the interaction term between and as the key explanatory variable. Specifically, is a firm-level dummy variable that equals 1 if the listed company is a green bond issuer (i.e., belongs to the treatment group), and 0 if the firm issues conventional bonds (i.e., belongs to the control group). The time dummy variable takes a value of 1 for periods after a firm’s first green bond issuance and 0 for periods prior to the first issuance.
3.2.3. Control Variables
Following mainstream studies[2,9], this study includes a set of financial and corporate governance control variables. Financial variables comprise firm size (Size), leverage ratio (Lev), return on assets (ROA), cash flow ratio (Cashflow), and revenue growth rate (Growth). Governance variables include board size (Board), CEO-Chair duality (Dual), ownership concentration (Top1), shareholder fund occupation (Occupy), and firm age since listing (ListAge).
3.3. Model Specification
Following existing studies on the staggered difference-in-differences (DID) approach[32,33], this paper treats each firm’s first green bond issuance as a quasi-natural experiment to examine the effect of green bond issuance on corporate risk-taking. The baseline regression model is specified as follows:
where represents the level of corporate risk-taking for firm in year ; the key explanatory variable captures green bond issuance. A significantly negative coefficient indicates that green bond issuance reduces corporate risk-taking. denotes the set of control variables potentially affecting risk-taking; and represent firm and year fixed effects, respectively; and is the error term.
4. Empirical Results and Analysis
4.1. Baseline Regression
The baseline regression results are presented in Table 1. Column (1) reports the estimates without any control variables, Columns (2) and (3) include financial and governance controls, respectively, while Column (4) incorporates all control variables. All regression coefficients are significant at the 1% level. Holding other variables constant, the coefficient of the key explanatory variable is significantly negative, indicating that green bond issuance by listed companies substantially reduces corporate risk-taking, thereby supporting Hypothesis H1.
Regarding the control variables, firm size (Size), return on assets (ROA), and ownership concentration (Top1) have significantly negative coefficients, suggesting that larger firms, more profitable firms, and firms with higher ownership concentration exhibit lower levels of risk-taking. Conversely, leverage (Lev), cash flow ratio (Cashflow), revenue growth (Growth), shareholder fund occupation (Occupy), and firm age since listing (ListAge) have significantly positive coefficients, implying that firms with higher leverage, cash flow, revenue growth, shareholder fund occupation, or longer listing history tend to take on higher levels of risk. Board size (Board) and CEO-Chair duality (Dual) are not statistically significant.
4.2. Robustness Tests
4.2.1. Parallel Trend Test
Following mainstream literature[9], this study adopts the year prior to a firm’s first green bond issuance as the baseline and uses the coefficients of in the pre-issuance years to conduct a parallel trends test via an event study approach. As shown in Figure 1, no significant differences are observed between the treatment and control groups before green bond issuance. After the treatment group issues green bonds, the coefficient of the key explanatory variable becomes significantly negative, satisfying the parallel trends assumption.
Moreover, the effect of green bond issuance on corporate risk-taking exhibits a dynamic pattern. The estimated coefficients gradually increase over the two years following issuance, indicating a growing impact, and slightly decrease in the third year.
4.2.2. Placebo Test
The firms issuing green bonds were randomly assigned into groups based on issuance timing, and the staggered difference-in-differences regression was re-estimated. This procedure was repeated 500 times. As shown in Figure 2, the randomly estimated coefficients are concentrated around zero, far from the actual estimate of -0.0071, and the majority of p-values exceed 0.05 (i.e., not significant at the 1% level). These results indicate that the baseline regression findings are unlikely to be driven by chance, thereby providing additional support for the robustness of the main results.
4.2.3. Alternative Dependent Variable
We altered the observation window by calculating earnings volatility over three-year ()[17] and five-year () [14] periods, using the rolling standard deviation of industry-adjusted . As shown in Columns (1) and (2) of Table 2, the coefficient of the key explanatory variable remains significantly negative at the 1% level under both alternative measures, consistent with the baseline regression results.
4.2.4. Controlling for Industry- and Region-Specific Trends
To account for potential heterogeneous effects of green bond issuance across industries and regions over time, we included interaction terms of two-digit and , and re-estimated the regressions. As shown in Columns (3) and (4) of Table 2, after controlling for industry-year and region-year fixed effects, the coefficient of the key explanatory variable remains significantly negative at the 10% and 1% levels, respectively, consistent with the baseline regression results.
4.2.5. Controlling for Firm-Level Robust Standard Errors
When adjusting standard errors using clustering, it is assumed that observations within the same firm over time are correlated, while observations across different firms are independent. As shown in Column (5) of Table 2, after relaxing the assumption of independently and identically distributed error terms, the coefficient of the key explanatory variable remains significantly negative at the 1% level, consistent with the baseline regression results.
4.2.6. Controlling for Potential Effects of Firm- and Local-Level Environmental Governance
Based on the disclosures in annual financial reports, expenditures related to pollution prevention, pollution control, and ecological restoration during the production and construction processes were considered as total corporate environmental investment. Government environmental subsidies received each year were manually compiled using keywords such as “green”, “environmental protection subsidy”, “environment”, “sustainable development”, “clean”, and “energy-saving”. Both corporate environmental investment (EPI) and government environmental subsidies (GS) were measured as percentages of total assets. As shown in Column (6) of Table 2, after controlling for potential effects of other firm- and local-level environmental governance activities, the coefficient of the key explanatory variable remains significantly negative at the 1% level, consistent with the baseline regression results.
4.2.7. Propensity Score Matching–Staggered Difference-in-Differences Test
To mitigate potential estimation bias caused by sample self-selection, we further employ the propensity score matching–staggered difference-in-differences (PSM-DID) approach to enhance the quasi-experimental nature of the empirical design. Following prior studies [2], firm characteristics including firm size (Size), leverage (Lev), cash flow ratio (Cashflow), book-to-market ratio (BM), board size (Board), ownership concentration (Top1), and firm age (ListAge) are selected as covariates. Propensity scores are estimated annually using a Probit model, and nearest-neighbor matching at a 1:4 ratio is applied to pair treated and control firms, thereby reducing systematic differences. As shown in Column (7) of Table 2, after excluding unmatched observations, the staggered DID model is re-estimated, and the coefficient of the key explanatory variable remains significantly negative at the 1% level, consistent with the baseline regression results.
4.3. Mechanism Analysis
4.3.1. Agency Costs
Under an ownership structure characterized by separation of ownership and control, the day-to-day management of a firm is primarily conducted by professional managers, while shareholders do not directly participate. Any managerial decision that deviates from the goal of maximizing shareholder value generates costs associated with agency conflicts. A well-designed incentive system can reduce agency costs through an “alignment of interests” effect and improve corporate governance. Accordingly, we select management expense ratio (Mfee), managerial shareholding ratio (Mshare), and the proportion of total compensation allocated to the top three executives (Msalary) as mediating variables representing agency costs.
As shown in Columns (1) to (3) of Table 3, green bond issuance significantly increases management expenses and reduces managerial shareholding, while its effect on executive compensation incentives is not significant, indicating an exacerbation of the principal–agent conflict between shareholders and managers. Firms with lower governance levels naturally bear higher agency costs, and after green bond issuance, the marginal effect on risk-averse tendencies and moral hazard behaviors is correspondingly greater. Further subsample analyses based on managerial shareholding and governance levels, presented in Columns (4) and (5) of Table 3, reveal that the coefficient of is only significantly negative in the low equity-incentive group. This indicates that green bonds exert a stronger inhibitory effect on risk-taking for firms with higher agency costs.
In summary, green bond issuance amplifies conflicts of interest between managers and shareholders by increasing Type I agency costs and reducing managerial equity incentives, thereby affecting internal governance and ultimately lowering corporate risk-taking, confirming Hypothesis H2a.
4.3.2. Information Transparency
Compared with ordinary investors, professional institutional investors face lower information barriers and, leveraging their industry expertise and investment experience, are able to assess firms’ green governance practices with a forward-looking and rational perspective. They also continuously monitor stock performance following green bond issuance, thereby enhancing the efficiency of corporate–market communication. Accordingly, we select the proportion of institutional shareholding (INSH), the number of securities analysts following the firm (AnA), and corporate transparency (Opacity) as mediating variables representing information transparency.
As shown in Columns (1) to (3) of Table 4, green bond issuance does not significantly increase analyst attention, but it does attract more institutional investors, thereby enhancing corporate information transparency. This suggests that green bonds, by strengthening disclosure and investor supervision mechanisms, encourage firms to release more detailed corporate social responsibility information, reduce the likelihood of concealing negative information, and increase pressure from both formal institutional and informal social monitoring.
Further subsample analyses based on corporate transparency, presented in Columns (4) and (5) of Table 4, reveal that the coefficient of is only significantly negative in firms with lower transparency, indicating that green bonds have a stronger inhibitory effect on risk-taking for these firms. In summary, green bond issuance alleviates information asymmetry between firms and other market stakeholders, increases external monitoring pressure through higher institutional shareholding and improved transparency, and ultimately reduces corporate risk-taking, confirming Hypothesis H2b.
4.3.3. Green Innovation Structure
Green innovation is a long-term, high-cost, and high-risk strategic investment. If green bond issuance can effectively improve the structure of corporate green innovation, its incentive effect on firms with relatively weak technological foundations will be more pronounced, which is simultaneously reflected in the market’s enhanced confidence in the firm’s risk-taking capacity. Accordingly, this study selects the number of green invention patent applications (Ginv), the number of green utility model patent applications (Guma), and the green innovation structure index (Gis) as mediating variables for the green innovation structure.
As shown in Table 5, Columns (1)–(3), green bond issuance significantly increases the output of corporate green innovation but reduces the ratio of green invention patents to green utility model patents, indicating that firms tend to prioritize exploitative green innovation over exploratory green innovation. Compared with exploitative green innovation, exploratory innovation demands stricter inputs in technology, equipment, talent, and capital, has stronger spillover effects, and involves higher uncertainty and potential risks during the R&D process.
Further subgroup analysis based on the green innovation structure divides firms with existing green innovation outcomes into exploratory-oriented and exploitative-oriented groups. As shown in Table 5, Columns (4)–(5), the coefficient of is significantly negative only in the exploratory-oriented group, suggesting that green bond issuance has a stronger inhibitory effect on risk-taking when firms engage in exploratory green innovation.
In summary, green bond issuance promotes both green innovation exploration and governance behavior but does not provide substantial incentives for transformative green innovation. By exacerbating the imbalance in green innovation structure and increasing the sunk costs of exploratory green innovation, green bonds ultimately reduce corporate risk-taking, thereby supporting Hypothesis H2c.
4.4. Heterogeneity Analysis
To investigate the heterogeneous effects of green bond issuance, the sample is divided according to firm ownership, audit quality, and industry pollution characteristics.
First, based on ownership type, the sample is split into state-owned enterprises (SOEs) and non-state-owned enterprises (non-SOEs). Columns (1)–(2) of Table 6 show that green bond issuance significantly reduces risk-taking for SOEs at the 1% significance level, whereas the effect on non-SOEs is not significant, confirming Hypothesis H3a.
Second, based on audit quality, the sample is grouped according to whether the auditor is from one of the Big Four accounting firms. Columns (3)–(4) of Table 6 indicate that green bond issuance significantly lowers risk-taking for firms with lower audit quality at the 1% significance level, while its effect is not significant for firms with high audit quality, supporting Hypothesis H3b.
Third, based on industry pollution characteristics, the sample is divided into heavily polluting industries and non-heavily polluting industries according to the “Classification Directory for Environmental Verification of Listed Companies.” Columns (5)–(6) of Table 6 reveal that green bond issuance has a significantly negative effect on risk-taking in heavily polluting industries at the 1% significance level, with a coefficient slightly larger than that of the baseline regression, indicating a stronger risk-reducing effect. In contrast, the effect is not significant in non-heavily polluting industries, validating Hypothesis H3c.
5. Conclusion
This study utilizes data from non-financial A-share listed companies in China over the period 2014–2022 and adopts a staggered difference-in-differences (DID) framework to examine the policy effects of green bond issuance on corporate risk-taking, with a dual perspective of corporate governance and green innovation. The baseline regression results indicate that green bond issuance significantly reduces corporate risk-taking. These findings remain robust under a series of tests, including parallel trend, placebo, alternative dependent variable, additional control variables, and propensity score matching combined with DID (PSM-DID).Mechanism analysis reveals that green bonds affect corporate risk-taking through three channels. First, they increase first-type agency costs and reduce managerial equity incentives, thereby influencing internal decision-making behavior. Second, they enhance institutional investor shareholding and corporate transparency, improving the external information environment and stakeholder oversight. Third, green bonds suppress substantive incentives for exploratory green innovation, exacerbating the imbalance in the green innovation structure, which in turn constrains corporate risk-taking. Heterogeneity analysis shows that the risk-mitigating effect of green bonds varies across firm characteristics: it is stronger for state-owned enterprises, firms with lower audit quality, and heavily polluting industries.
Based on the above findings, this study proposes several policy recommendations aimed at promoting the diversification of China’s green financial system and enhancing corporate risk management.
First, the approval and certification process for green bond issuers should be accelerated to guide firms in strengthening internal governance. Currently, China’s green bond market remains relatively concentrated, primarily comprising green corporate bonds, green enterprise bonds, and green financial bonds. Promoting innovation in green financial products and expanding the diversity of investors can encourage firms to actively fulfill social and environmental responsibilities while mitigating potential liquidity and credit risks. The involvement of independent and impartial third-party certification agencies can reinforce internal supervision and checks and balances, curb managerial short-term opportunism, reduce agency costs, and thereby support more prudent risk assessment and investment decisions in financial markets.
Second, a comprehensive green governance evaluation system should be established to optimize the external information environment. Detailed mechanisms for assessing green governance performance and disclosure, covering green governance inputs, green innovation outputs, and environmental benefits, can prevent greenwashing and ensure the efficient allocation of financial resources. By improving the transparency of environmental investments, technological outputs, and social contributions, information asymmetries between governments, firms, and investors can be reduced, and external oversight by institutional investors and media can be strengthened.
Third, firms should be encouraged to optimize their green innovation structure and enhance incentives for substantive green innovation. Government support, such as tax incentives, preferential credit, and priority market access, should be directed to firms with notable achievements in green technology development, energy efficiency, emission reduction, and renewable energy deployment. Particular attention should be given to state-owned and heavily polluting enterprises that face higher green innovation pressures. Collaborative initiatives among firms, universities, and research institutions can cultivate green innovation talent, optimize the allocation of innovative resources, facilitate the commercialization of technological achievements, mitigate the strong externalities of exploratory green innovation, and enhance the returns from substantive innovation, thereby accelerating the formation of new productive capabilities.
Funding
This research was funded by Shandong Provincial Natural Science Foundation, grant number “ZR2022MG026”, and Jiangsu Provincial Postgraduate Research & Practice Innovation Program , grant number “KYCX24_2461”.
References
- Xiao, D.; Yu, M. Green Bond Issuance and Green Innovation: Evidence from China’s Energy Industry. Int. Rev. Financ. Anal. 2024, 94, 103281. [Google Scholar]
- Fan, H.; Peng, Y.; Wang, H.; Xu, Z. Greening through Finance? J. Dev. Econ. 2021, 152, 102683. [Google Scholar] [CrossRef]
- Liu, S.; Li, S. Corporate green bond issuance and high-quality corporate development. Financ. Res. Lett. 2024, 61, 104880. [Google Scholar] [CrossRef]
- He, F.; Ding, C.; Yue, W.; et al. ESG performance and corporate risk-taking: Evidence from China. Int. Rev. Financ. Anal. 2023, 87, 102959. [Google Scholar] [CrossRef]
- Wen, F.; Li, C.; Sha, H.; Shao, L. How Does Economic Policy Uncertainty Affect Corporate Risk-Taking? Evidence from China. Financ. Res. Lett. 2021, 41, 101840. [Google Scholar] [CrossRef]
- Zerbib, O.D. The Effect of Pro-Environmental Preferences on Bond Prices: Evidence from Green Bonds. J. Bank. Financ. 2019, 98, 39–60. [Google Scholar] [CrossRef]
- Stucki, T.; Woerter, M.; Arvanitis, S.; Peneder, M.; Rammer, C. How Different Policy Instruments Affect Green Product Innovation: A Differentiated Perspective. Energy Policy 2018, 114, 245–261. [Google Scholar] [CrossRef]
- Flammer, C. Green Bonds: Effectiveness and Implications for Public Policy. NBER Work. Pap. 2019, No. 25950. [Google Scholar]
- Zhou, G.; Liu, C.; Luo, S. Resource Allocation Effect of Green Credit Policy: Based on DID Model. Mathematics 2021, 9, 159. [Google Scholar] [CrossRef]
- Fan, H.; Peng, Y.; Wang, H.; Xu, Z. Greening through Finance? J. Dev. Econ. 2021, 152, 102683. [Google Scholar] [CrossRef]
- Lin, B.Q.; Wu, N. Will the China’s Carbon Emissions Market Increase the Risk-Taking of Its Enterprises? Int. Rev. Econ. Financ. 2022, 77, 413–434. [Google Scholar] [CrossRef]
- Hu, X.; Zhu, B.; Lin, R.; Li, X.; Zeng, L.; Zhou, S. How Does Greenness Translate into Greenium? Evidence from China’s Green Bonds. Energy Econ. 2024, 133, 107511. [Google Scholar] [CrossRef]
- Boubakri, N.; Cosset, J.; Saffar, W. The role of state and foreign owners in corporate risk-taking: Evidence from privatization. J. Financ. Econ. 2013, 108, 641–658. [Google Scholar] [CrossRef]
- Koirala, S.; Marshall, A.; Neupane, S.; Thapa, C. Corporate Governance Reform and Risk-Taking: Evidence from a Quasi-Natural Experiment in an Emerging Market. J. Corp. Financ. 2020, 61, 101396. [Google Scholar] [CrossRef]
- John, K.; Litov, L.; Yeung, B. Corporate governance and risk-taking. J. Financ. 2008, 63, 1679–1728. [Google Scholar] [CrossRef]
- Hu, X.; Zhu, B.; Lin, R.; et al. How does greenness translate into greenium? Evidence from China’s green bonds. Energy Econ. 2024, 133, 107511. [Google Scholar] [CrossRef]
- Tang, D.; Zhang, Y. Do shareholders benefit from green bonds? J. Corp. Financ. 2020, 61, 101427. [Google Scholar] [CrossRef]
- Barney, J. Firm resources and sustained competitive advantage. J. Manag. 1991, 17, 99–120. [Google Scholar] [CrossRef]
- Ge, P.; Liu, Y.; Tang, C.; et al. Green bonds and corporate Environmental social and governance performance: Innovative approaches to identifying greenwashing in green bond markets. Corp. Soc. Responsib. Environ. Manag. 2024, early view. [Google Scholar] [CrossRef]
- Shi, X.; Ma, J.; Jiang, A.; et al. Green bonds: Green investments or greenwashing? Int. Rev. Financ. Anal. 2023, 90, 102869. [Google Scholar] [CrossRef]
- Liu, S.; Li, S. Corporate Green Bond Issuance and High-Quality Corporate Development. Financ. Res. Lett. 2024, 61, 104880. [Google Scholar] [CrossRef]
- Jiraporn, P.; Chatjuthamard, P.; Tong, S.; et al. Does corporate governance influence corporate risk-taking? Evidence from the Institutional Shareholders Services (ISS). Financ. Res. Lett. 2015, 13, 105–112. [Google Scholar] [CrossRef]
- Ordonez-Borrallo, R.; Ortiz-de-Mandojana, N.; Delgado-Ceballos, J. Green Bonds and Environmental Performance: The Effect of Management Attention. Corp. Soc. Responsib. Environ. Manag. 2024, 31, 5311–5326. [Google Scholar] [CrossRef]
- Dong, H.; Zhang, L.; Zheng, H. Green bonds: Fueling green innovation or just a fad? Energy Econ. 2024, 135, 107660. [Google Scholar] [CrossRef]
- Tan, X.; Dong, H.; Liu, Y.; Su, X.; Li, Z. Green Bonds and Corporate Performance: A Potential Way to Achieve Green Recovery. Renew. Energy 2022, 200, 59–68. [Google Scholar] [CrossRef]
- Fang, C.; Lee, J.; Schilling, M.A. Balancing Exploration and Exploitation Through Structural Design: The Isolation of Subgroups and Organizational Learning. Organ. Sci. 2010, 21, 625–642. [Google Scholar] [CrossRef]
- Dong, X.; Yu, M. Green bond issuance and green innovation: Evidence from China’s energy industry. Int. Rev. Financ. Anal. 2024, 94, 103281. [Google Scholar] [CrossRef]
- Shi, X.; Ma, J.; Jiang, A.; Wei, S.; Yue, L. Green Bonds: Green Investments or Greenwashing? Int. Rev. Financ. Anal. 2023, 90, 102850. [Google Scholar] [CrossRef]
- Wu, R.; Qin, Z. Asymmetric Volatility Spillovers among New Energy, ESG, Green Bond and Carbon Markets. Energy 2024, 292, 130504. [Google Scholar] [CrossRef]
- García, C.J.; Herrero, B.; Miralles-Quirós, J.L.; et al. Exploring the Determinants of Corporate Green Bond Issuance and Its Environmental Implication: The Role of Corporate Board. Technol. Forecast. Soc. Change 2023, 189, 122379. [Google Scholar] [CrossRef]
- Deng, H.; Li, Y.; Lin, Y. Green financial policy and corporate risk-taking: Evidence from China. Financ. Res. Lett. 2023, 58, 104476. [Google Scholar] [CrossRef]
- Flammer, C. Corporate green bonds. J. Financ. Econ. 2021, 142, 499–516. [Google Scholar] [CrossRef]
- Larcker, D.; Watts, E. Where’s the greenium? J. Account. Econ. 2020, 69, 101312. [Google Scholar] [CrossRef]
Figure 1.
Parallel trend test.
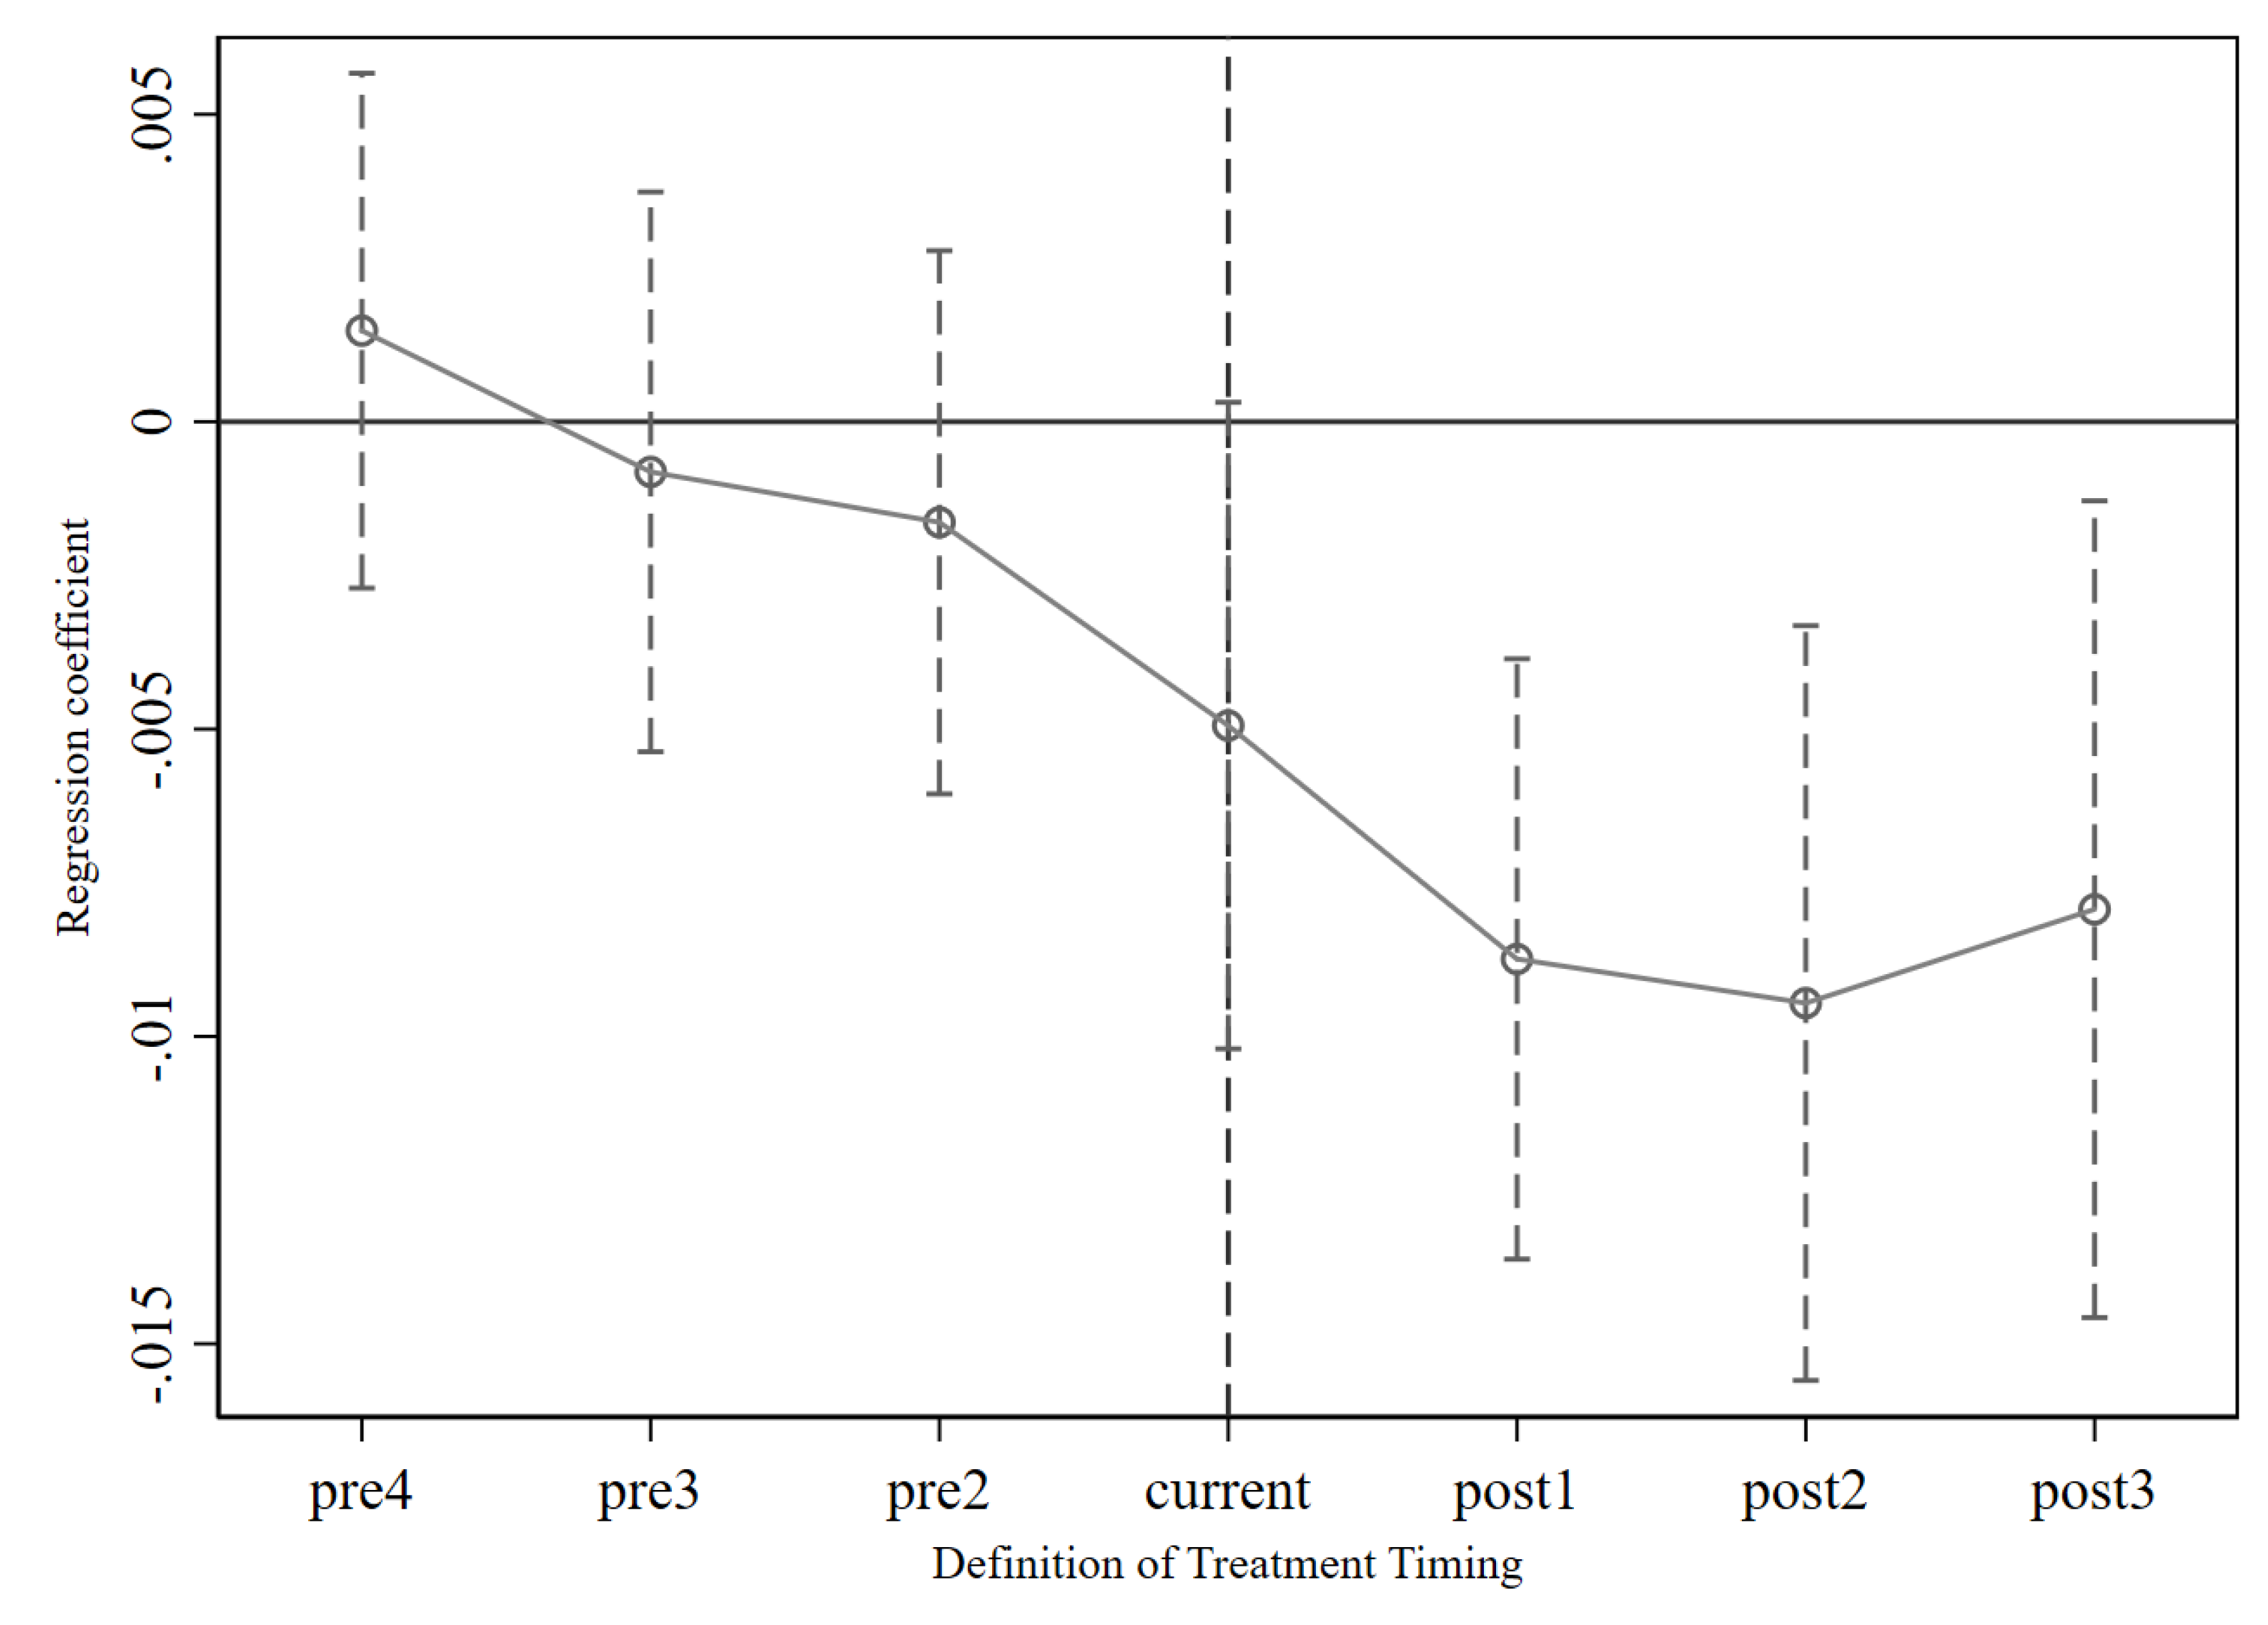
Figure 2.
Placebo Test.
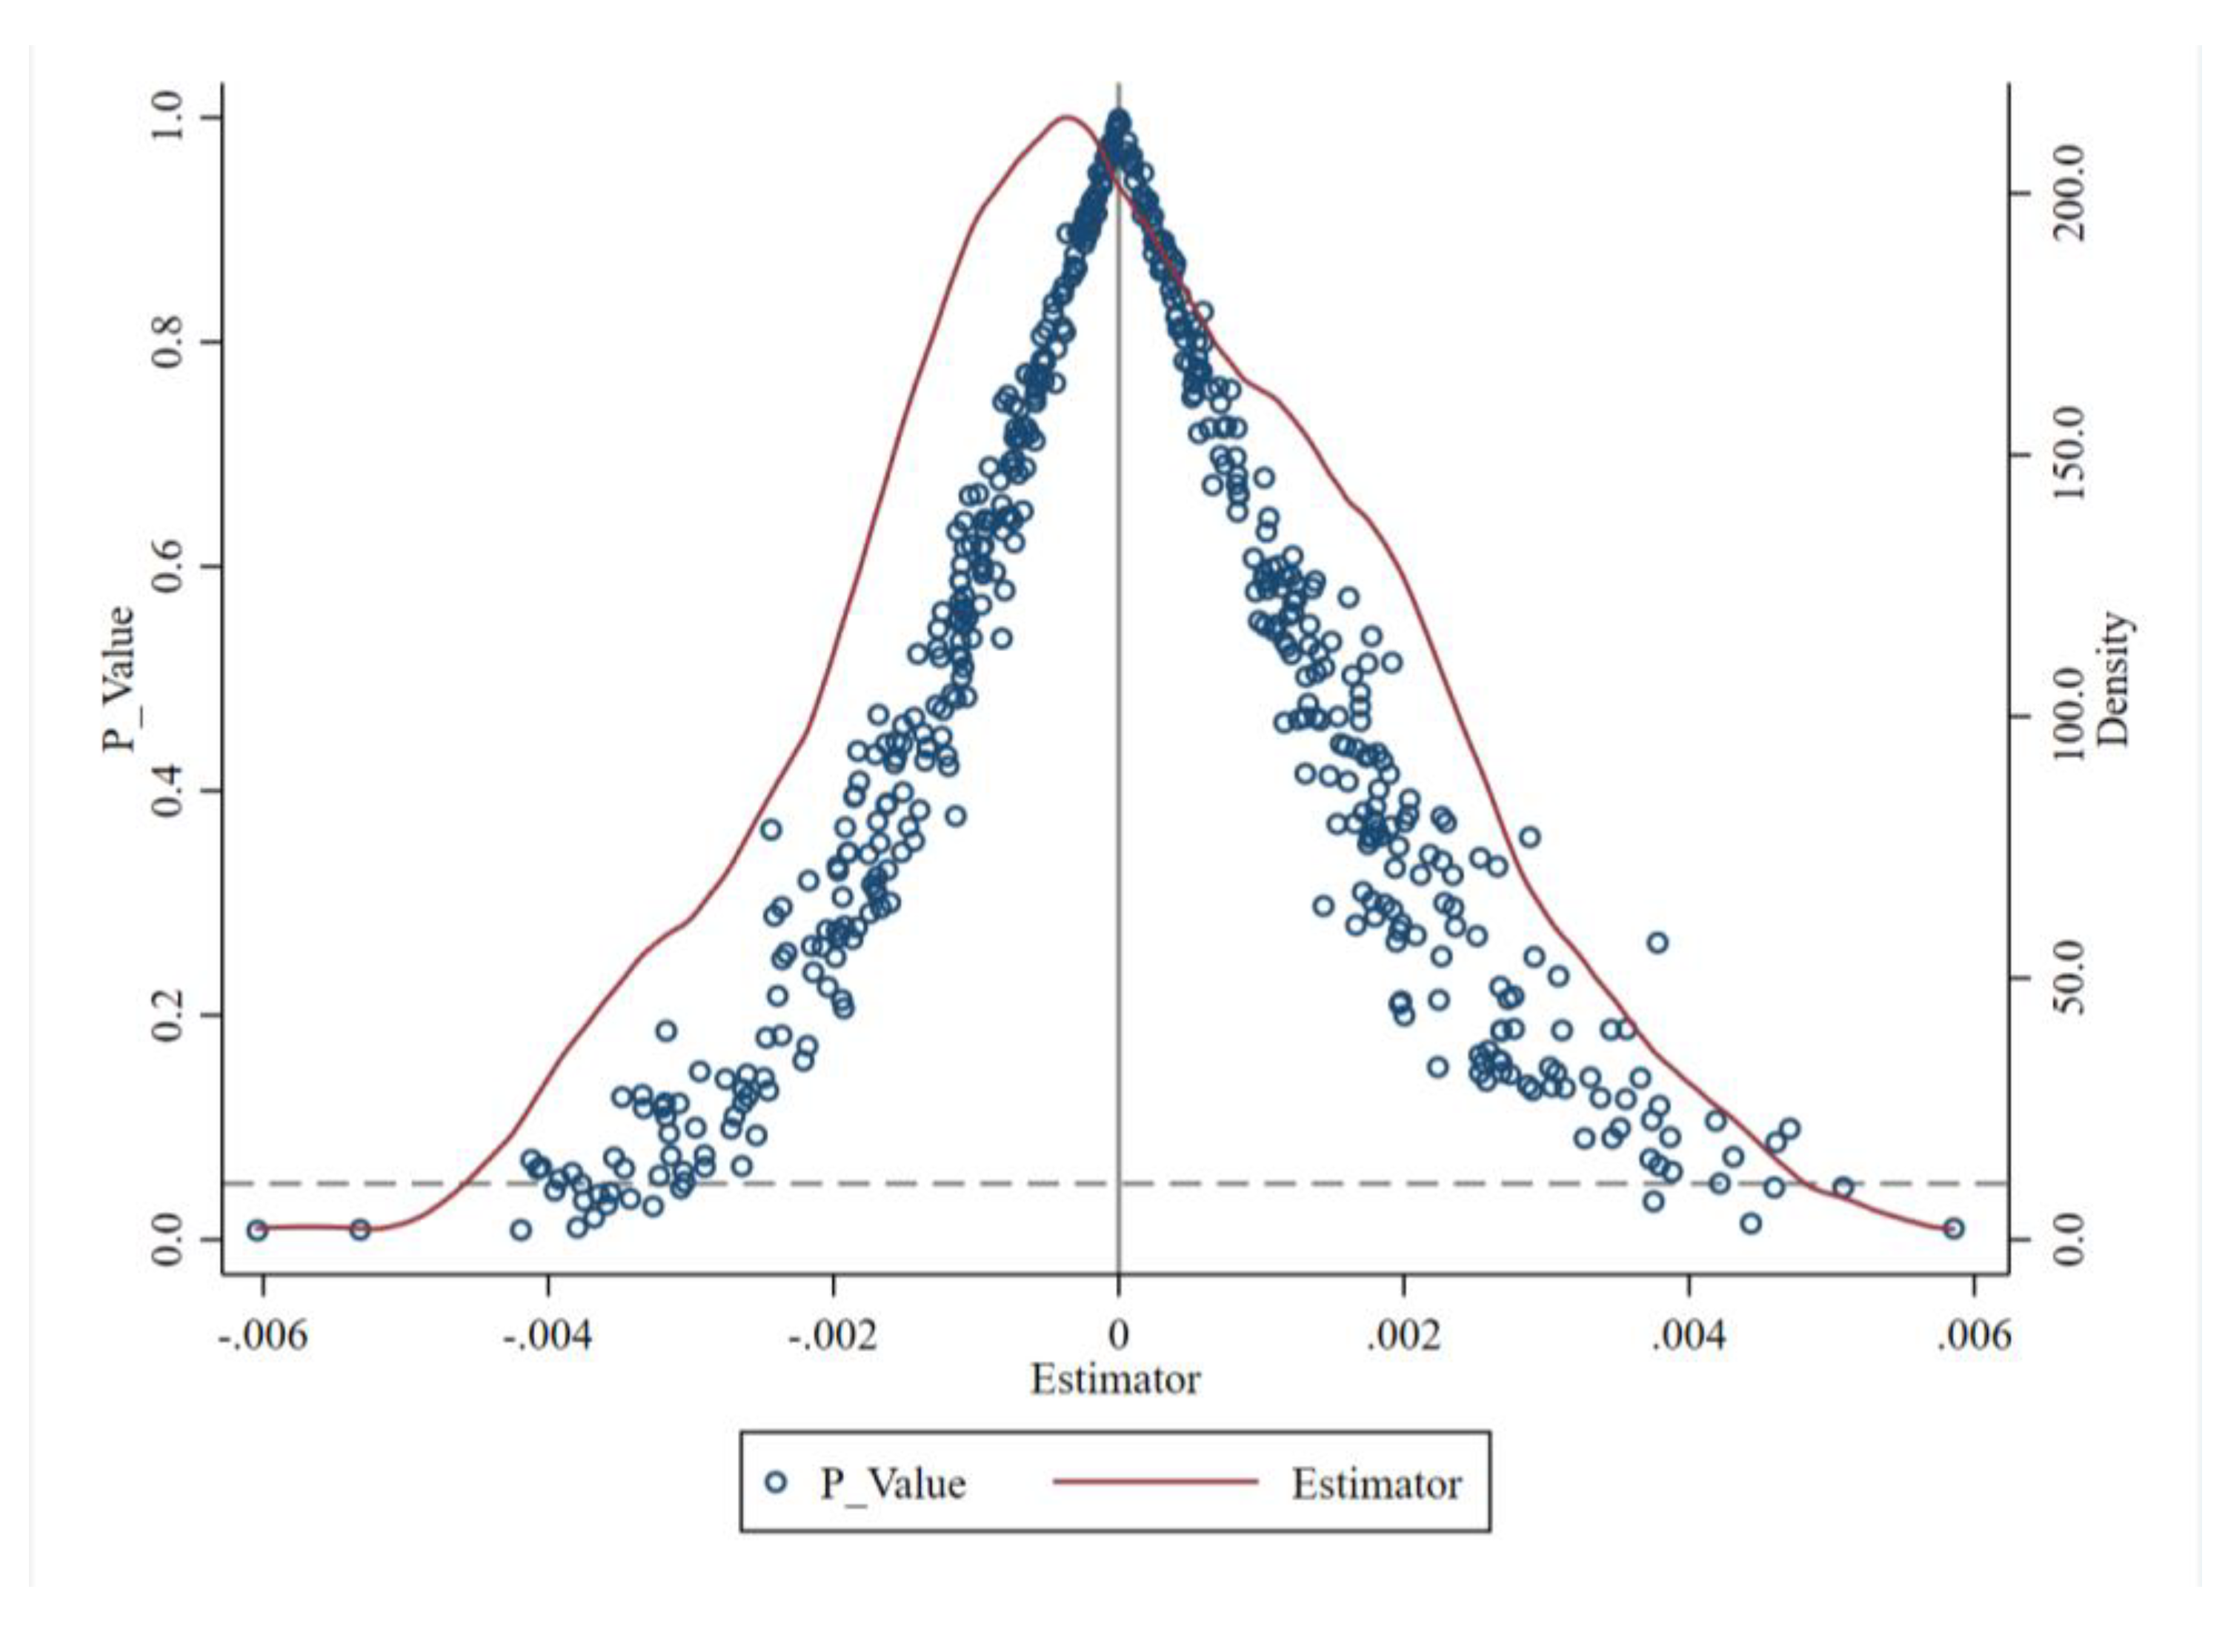

Table 1.
Baseline Regression.
| Variable | (1) | (2) | (3) | (4) | |||
|---|---|---|---|---|---|---|---|
| Risk | Risk | Risk | Risk | ||||
| Treat×Post | -0.0086*** | -0.0067*** | -0.0089*** | -0.0069*** | |||
| (-5.28) | (-3.69) | (-5.46) | (-3.84) | ||||
| Size | -0.0156*** | -0.0156*** | |||||
| (-7.65) | (-7.66) | ||||||
| Lev | 0.0273*** | 0.0228*** | |||||
| (3.08) | (2.61) | ||||||
| ROA | -0.2381*** | -0.2303*** | |||||
| (-11.32) | (-10.99) | ||||||
| Cashflow | 0.0393*** | 0.0373*** | |||||
| (4.59) | (4.41) | ||||||
| Growth | 0.0021 | 0.0026** | |||||
| (1.62) | (2.05) | ||||||
| Board | -0.0087* | -0.0025 | |||||
| (-1.91) | (-0.59) | ||||||
| Dual | 0.0004 | 0.0009 | |||||
| (0.23) | (0.63) | ||||||
| Top1 | -0.0328*** | -0.0156** | |||||
| (-4.49) | (-2.25) | ||||||
| Occupy | 0.1955*** | 0.1179*** | |||||
| (6.07) | (4.62) | ||||||
| ListAge | 0.0308*** | 0.0224*** | |||||
| (7.43) | (5.94) | ||||||
| Constant | 0.0285*** | 0.3824*** | -0.0269* | 0.3350*** | |||
| (77.73) | (8.53) | (-1.68) | (7.39) | ||||
| Fixed individual | YES | YES | YES | YES | |||
| Fixed time | YES | YES | YES | YES | |||
| N | 8,503 | 8,503 | 8,502 | 8,502 | |||
| R2 | 0.414 | 0.514 | 0.423 | 0.517 | |||
Note: The values in parentheses are t-values, with *, **, *** indicating significance at the 10%,5%, and 1% levels, respectively.
Table 2.
Robustness Tests.
| Variable | (1) | (2) | (3) | (4) | (5) | (6) | (7) |
|---|---|---|---|---|---|---|---|
| Risk(t-1,t+1) | Risk(t-2,t+2) | Industry × Year Fixed Effects | Province × year fixed effect | Standard error of the firm's robustness | Other environmental governance actions | PSM-DID | |
| Treat×Post | -0.0063*** | -0.0090*** | -0.0033* | -0.0070*** | -0.0069*** | -0.0069*** | -0.0054*** |
| (-3.27) | (-3.93) | (-1.68) | (-3.68) | (-3.03) | (-3.83) | (-2.96) | |
| EPI | 4.8695 | ||||||
| (0.18) | |||||||
| GS | 0.0014 | ||||||
| (0.14) | |||||||
| Controlled variable | Yes | Yes | Yes | Yes | Yes | Yes | Yes |
| Fixed individual | Yes | Yes | Yes | Yes | Yes | Yes | Yes |
| Fixed time | Yes | Yes | Yes | Yes | Yes | Yes | Yes |
| Industry year fixed | No | No | No | Yes | No | No | No |
| Province × Year Fixed | No | No | No | No | Yes | No | No |
| N | 7,434 | 6,374 | 8,501 | 8,493 | 8,502 | 8,502 | 2,406 |
| R2 | 0.501 | 0.649 | 0.547 | 0.537 | 0.520 | 0.520 | 0.551 |
Table 3.
Mechanism Test: Agency Costs.
| variable | All samples | Lower agency costs | High agency costs | ||
|---|---|---|---|---|---|
| (1) | (2) | (3) | (4) | (5) | |
| Mfee | Mshare | Msalary | Risk | Risk | |
| Treat×Post | 0.0060*** | -0.0092* | -0.0078 | -0.0058 | -0.0046*** |
| (3.51) | (-1.69) | (-0.94) | (-1.49) | (-2.70) | |
| Controlled variable | Yes | Yes | Yes | Yes | Yes |
| Fixed individual | Yes | Yes | Yes | Yes | Yes |
| Fixed time | Yes | Yes | Yes | Yes | Yes |
| N | 8,502 | 8,155 | 8,491 | 4,368 | 4,018 |
| R2 | 0.750 | 0.882 | 0.696 | 0.577 | 0.549 |
Table 4.
Mechanism Test: Information Transparency.
| Variable | All samples | High information transparency | Low information transparency | ||
| (1) | (2) | (3) | (4) | (5) | |
| INST | AnA | Opacity | Risk | Risk | |
| Treat×Post | 0.0290*** | 0.0808 | 0.0823* | -0.0012 | -0.0092*** |
| (3.11) | (1.43) | (1.81) | (-0.54) | (-3.33) | |
| Controlled variable | Yes | Yes | Yes | Yes | Yes |
| Fixed individual | Yes | Yes | Yes | Yes | Yes |
| Fixed time | Yes | Yes | Yes | Yes | Yes |
| N | 8,502 | 6,272 | 6,734 | 3,433 | 4,926 |
| R2 | 0.847 | 0.704 | 0.599 | 0.567 | 0.579 |
Table 5.
Mechanism Test: Green Innovation Structure.
| Variable | Full sample | Bias Exploration Structure | Biasing structure | |||
|---|---|---|---|---|---|---|
| (1) | (2) | (3) | (4) | (5) | ||
| Ginv | Guma | Gis | Risk | Risk | ||
| Treat×Post | 2.4672** | 2.9396*** | -0.3298** | -0.0050** | -0.0050 | |
| (2.02) | (3.49) | (-2.30) | (-2.33) | (-1.43) | ||
| controlled variable | Yes | Yes | Yes | Yes | Yes | |
| Fixed individual | Yes | Yes | Yes | Yes | Yes | |
| Fixed time | Yes | Yes | Yes | Yes | Yes | |
| N | 8,502 | 8,502 | 4,193 | 2,765 | 1,953 | |
| R2 | 0.744 | 0.758 | 0.419 | 0.574 | 0.697 | |
Table 6.
Heterogeneity Analysis.
| Variable | (1) | (2) | (3) | (4) | (5) | (6) |
|---|---|---|---|---|---|---|
| state-owned enterprises | Non-state-owned | High audit quality | Low audit quality | Heavy pollution industries | Non-polluting industries | |
| Treat×Post | -0.0042*** | -0.0068 | -0.0042 | -0.0071*** | -0.0087*** | -0.0045 |
| (-2.74) | (-1.32) | (-1.55) | (-3.31) | (-3.66) | (-1.45) | |
| Controlled variable | Yes | Yes | Yes | Yes | Yes | Yes |
| Fixed individual | Yes | Yes | Yes | Yes | Yes | Yes |
| Fixed time | Yes | Yes | Yes | Yes | Yes | Yes |
| N | 4,252 | 4,235 | 958 | 7,517 | 2,664 | 5,830 |
| R2 | 0.520 | 0.524 | 0.490 | 0.528 | 0.436 | 0.583 |
Disclaimer/Publisher’s Note: The statements, opinions and data contained in all publications are solely those of the individual author(s) and contributor(s) and not of MDPI and/or the editor(s). MDPI and/or the editor(s) disclaim responsibility for any injury to people or property resulting from any ideas, methods, instructions or products referred to in the content. |
© 2025 by the authors. Licensee MDPI, Basel, Switzerland. This article is an open access article distributed under the terms and conditions of the Creative Commons Attribution (CC BY) license.
Copyright: This open access article is published under a Creative Commons CC BY 4.0 license, which permit the free download, distribution, and reuse, provided that the author and preprint are cited in any reuse.


