
Submitted:
22 December 2025
Posted:
24 December 2025
You are already at the latest version
Abstract
Glide-snow avalanches pose a major challenge for operational forecasting and local avalanche authorities. Although their key prerequisite, namely a moist interface between the snowpack and smooth ground, is well established, predicting the timing of glide-snow release remains difficult.
To identify conditions that favour glide-snow avalanches, we analysed five seasons of meteorological and optical monitoring data documenting avalanche activity in the Planneralm area of Styria, Austria, at high temporal resolution. Avalanche activity in the study area follows typical temporal patterns, with the highest release probability in the early afternoon and peak activity from mid-March to mid-April.
We trained a machine-learning decision-tree model using meteorological variables to distinguish between avalanche and non-avalanche days. Two highly significant predictors emerged: (1) air temperature, confirming previous findings that moderately warm conditions favour glide-snow activity, and (2) decrease in snow height during warm periods, a variable that substantially improves predictive accuracy by reducing false classifications of avalanche days.
Models of this type could support operational glide-snow avalanche forecasting by identifying days with elevated glide-snow potential that warrant increased attention and may require warnings or temporary closures by local authorities.
Keywords:
glide-snow avalanche
; avalanche monitoring
; avalanche forecasting
1. Introduction
Glide-snow avalanches (Figure 1) appear to be occurring more frequently and across a wider range of locations in recent years. For example, 59% of the avalanche forecasts in the Swiss Alps during winter 2017/18 referred to glide-snow avalanches [1]. Since these avalanches cannot be released artificially and their timing is difficult to predict, they often lead to considerable costs through long-term preventive closures of roads, railway lines or ski runs. Despite recent advances, forecasting the release of glide-snow avalanches remains a major challenge for both researchers and warning services. In some winters, glide-snow avalanches pose a particularly severe problem for local authorities and forecast centres e.g. [2]. Reliable and easily accessible tools for assessing days with possible avalanche occurrence would therefore be of substantial practical value.
The conditions required for snow gliding are well established: (i) a smooth snow–soil interface with minimal roughness, such as grass or exposed rock; (ii) a snow temperature of 0∘ at the snow–soil boundary, enabling the presence of liquid water; and (iii) a slope angle exceeding 15∘ e.g. [3,4]. [5] and [6] further identify a deep snowpack without a distinct weak layer as an additional prerequisite. The liquid water required at the snowpack base can originate from three processes: (i) heat stored in the ground during a warm autumn, which melts the lowermost snow layer after the first substantial snowfall; (ii) melt-water or rain percolating from the snow surface down to the snow–soil interface; and (iii) water generated by melting due to solar radiation (e.g., on exposed rocks) or supplied by natural springs flowing along the snow–soil boundary e.g. [3]. These prerequisites highlight that, in addition to meteorological conditions, soil characteristics also exert a strong influence on snow gliding. However, soil properties such as moisture are difficult to measure, or even estimate, during winter as they require in-situ measurements. In contrast, meteorological data are usually more accessible and therefore more practical for use in predictive tools.
Glide cracks frequently develop prior to the release of a glide-snow avalanche. However, while some glide-snow avalanches release immediately after the opening of a glide-crack, some glide-cracks do not produce any glide-snow avalanches at all [7]. Consequently, predicting the exact timing of release from the occurrence of glide-cracks remains highly challenging.
[8] examined the influence of meteorological conditions on glide-snow avalanche activity on the Dorfberg above Davos, Switzerland.[8] differentiated between cold and warm temperature glide-snow avalanche events. Cold-temperature events are defined as glide-snow avalanches that occur when air temperatures are below freezing and no form of liquid precipitation has occurred [10]. These two types of glide-snow avalanches are driven by different sources of liquid water – with the latter receiving liquid water from the ground, independent of weather and meteorological conditions. In the Dorfberg area, a significant amount of cold glide-snow avalanches was observed [7,8,9]. [8] showed that under cold conditions, the primary drivers were minimum air temperature and the amount of new snow prior to release. In contrast, during warm events, air temperature, snow surface temperature (estimated from outgoing long-wave radiation), and a reduction in snow height emerged as the most influential factors.
While many studies e.g. [7,8,9] concentrate on the well-equipped and well-monitored Dorfberg above Davos, an area very prone to glide-snow avalanche release, comparatively fewer investigations have been conducted in other regions. One other study site is located in Glacier National Park in Montana [11,12]. [11] studied terrain components and developed a spacial model for identifying areas prone for glide-snow avalanche release. In their study, glide factor (an index of ground class or surface roughness combined with aspect) was the most important terrain variable influencing glide snow avalanche release. The other variables of importance in their study were maximum slope and seasonal sum of solar radiation. Moreover, in Aosta Valley in Italy, [13] analysed the soil conditions to find driving factors for glide-snow avalanche release. They found significant exponential relationship of snow-glide rate with the soil volumetric liquid-water content. Although recent studies have advanced physical understanding of glide-snow processes, they tend to rely on complex variables or data that are difficult to obtain in operational settings. As a result, their practical applicability for real-time avalanche forecasting remains limited.
In the present study we study glide-snow avalanche occurrence at our research site in Planneralm, Styria, Austria [14]. The aim was to assess the local occurrence of glide-snow avalanches, link them to meteorological conditions, and compare our results also to results from other sites. The occurrence of cold versus warm glide-snow avalanches as well as a potential diurnal distribution of glide-snow avalanche occurrence are of importance to local avalanche warning authorities as well as to back-country travellers and recreationists for their risk management. The seasonal distribution of glide-snow avalanche occurrence, on the other hand, might be of interest to future generations to assess a possible shift here due to climate change.
We therefore focused on three main research questions: (1) What are the temporal patterns of glide-snow avalanche occurrence, including diurnal and seasonal variability? (2) How do these patterns compare with observations from other sites, and to what extent are they general or site-specific? (3) Can data from nearby weather stations support a simple machine-learning model capable of predicting glide-snow avalanche occurrence? Moreover, we want to provide the basis for developing a local, operationally practical prediction tool, which would provide substantial value to avalanche commissions and warning services
2. Materials and Methods
Our study area is located in the Planneralm ski resort in central-western Styria, Austria, at coordinates 47.4040774∘N and 14.1996136∘E. An overview map of central Europe with the location of the Plannerlam indicated as well as a detailed map of the study area are included in Figure 2. The Planneralm belongs to the Niedere Tauern mountain range, with elevations ranging from 1600 to 2100 m a.s.l. The observed avalanche slopes (Figure 2) are characterized by alpine meadows (soil type: non-calcareous brown earth on unconsolidated sediments, [15]) used for summer grazing, interspersed with mountain pines and groups of spruce. Toward the peaks, steeper rocky areas expose mica schist bedrock. Frequent winter avalanches contribute to severe erosion on some slopes, visible in summer as brownish meadow patches.
A panoramic camera, operated by Geosphere Austria, capable of rotating 360∘, was used to monitor avalanche-prone slopes and terrain features across multiple winter seasons. The panoramic camera enabled long-term monitoring glide-snow avalanche activity with a measurement resolution of 30 min.
All images were screened manually, and both the occurrence and release time of glide-snow avalanches were recorded. Days with at least one documented glide-snow avalanche were classified as avalanche days (AD), whereas days without any recorded glide-snow avalanches were classified as non-avalanche days (NAD).
In the close surroundings of the observed slope, meteorological and snow data from several automated stations were used for the analysis (Figure 2). The stations are operated by the Province of Styria and GeoSphere Austria, respectively, and the observed variables vary between stations. For the first two winter seasons we used data from station 100, which is further away from the slope, and automated snow height measurements next to the university sports centre. Beginning in winter season 2015/16 we used temperature data from the newly erected station 110, directly above the monitored slope, and automated snow height measurements from station 101. Statistical analysis of the data from the different weather stations showed that the data is comparable [16]. An overview which data was used when, including the meta-data from the stations, is given in Table 1. From the temperature and snow-height data we extracted parameters which have proven to be of importance in avalanche forecasting e.g. [8,17,18], namely maximum daily air temperature, mean daily air temperature, minimum daily air temperature, 24 h-difference in snow height, five-day new snow sum, and snow height.
We analysed the data first visually and then also calculated point-biserial correlations between glide-snow avalanche occurrence and meteorological parameters. The point-biserial correlation is a special case of the Pearson correlation coefficient used when one variable is binary (e.g., avalanche day vs. non-avalanche day) and the other is continuous (e.g., temperature). It measures the strength and direction of the linear relationship between the binary and continuous variables, with values ranging from –1 (perfect negative relationship) to +1 (perfect positive relationship). The associated p-value tests the null hypothesis that there is no relationship between the variables. Furthermore we looked at both the diurnal and the seasonal distribution of glide-snow avalanche release at Planneralm.
Moreover, we implemented a decision tree in Python to classify glide-snow avalanche days (i.e., days when at least one glide-snow avalanche was observed, AD) versus non-avalanche days (NAD) based on meteorological data. Decision trees are transparent, “white-box”, machine-learning models, allowing straightforward interpretation through visualizations of the tree structure and metrics of feature importance [19]. The transparency and interpretability make them particularly well-suited for our study, as they enable a clear understanding of how the meteorological variables influence glide-snow avalanche occurrence at our specific site.
Decision trees iteratively split the dataset: at each node, the feature and threshold that best separate the classes are selected according to a criterion such as Gini impurity, which quantifies how mixed the classes are within a node. Ideally, this process continues until the terminal nodes (leaves) contain only avalanche or only non-avalanche days. To prevent over-fitting, tree growth was constrained by limiting the maximum depth and requiring a minimum improvement in impurity at each split. Because our primary aim is to identify avalanche days, we overbalanced the model by assigning them a higher weight (weight = 10) to ensure the classifier prioritizes correctly detecting these relatively rare events.
The dataset was evaluated using five-fold stratified cross-validation, ensuring that each fold preserved the original class distribution. In each iteration, four folds were used for training the decision tree, and the remaining fold was used for testing, with the process repeated so that every sample was used once for validation.
3. Results
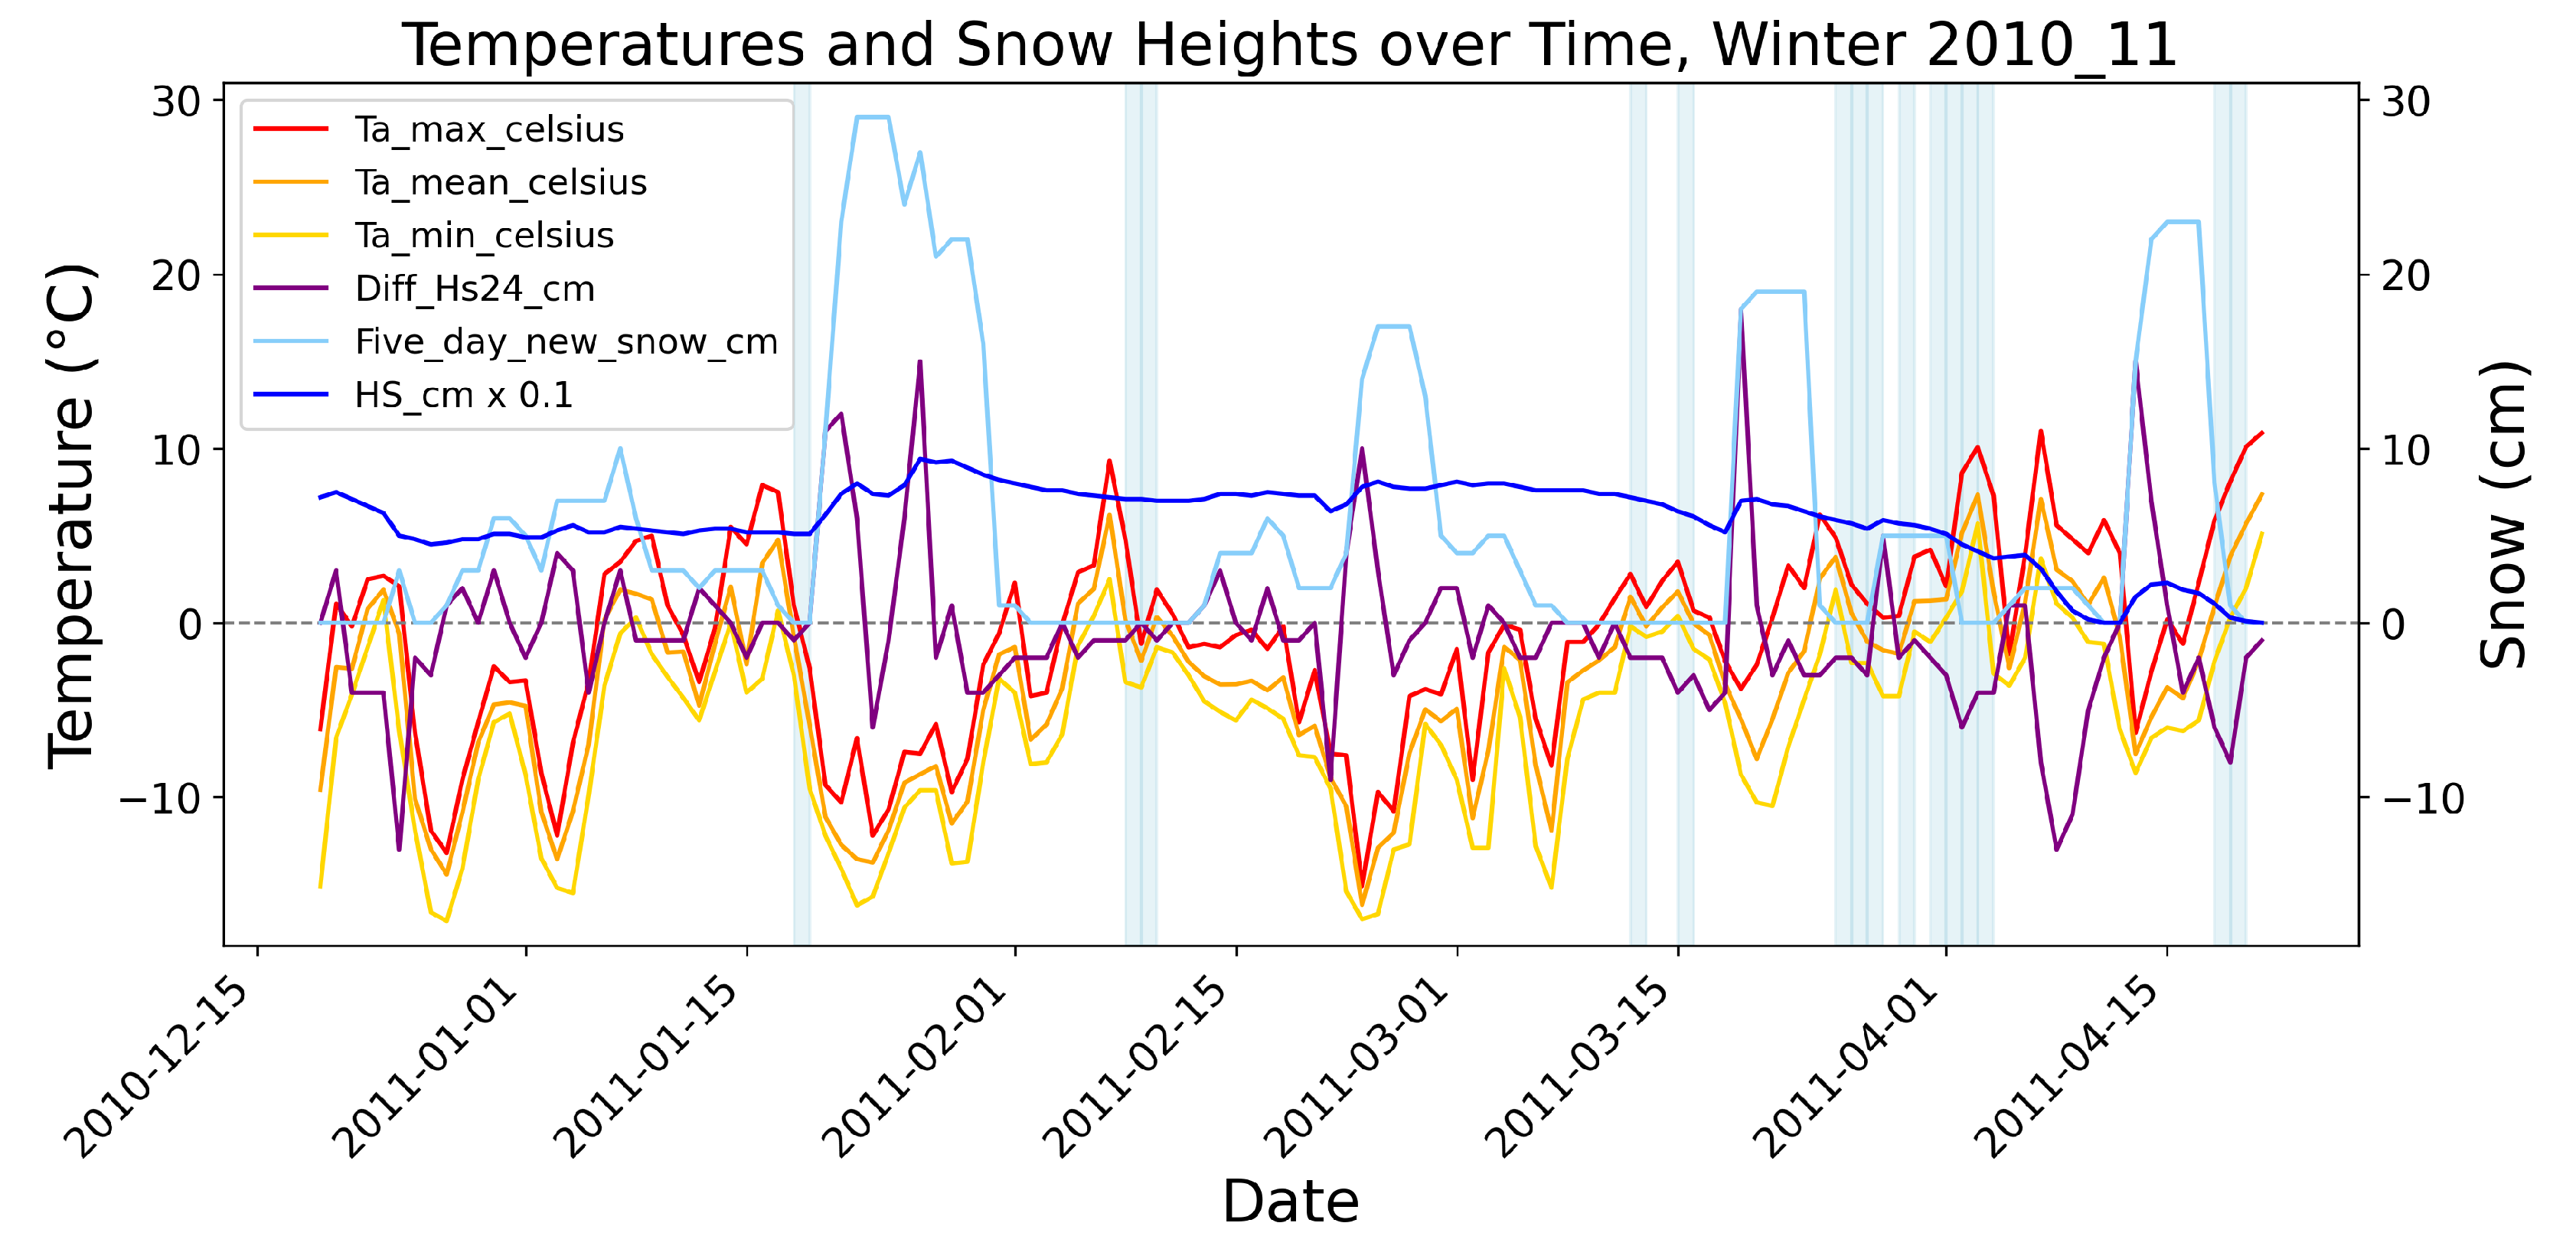
The temporal progression of the winter season 2009/10 with glide-snow avalanche days as well as the meteorological parameters maximum daily air temperature, mean daily air temperature, minimum daily air temperature, 24 h-difference in snow height, five-day new snow sum, and snow height (× 0.1 for better visibility) is shown in Figure 3. The respective graphs from the winter seasons of 2010/11, 2015/16, 2026/17, and 2017/18 are depicted in the appendix (Figure A1). It can be seen that the Planneralm is quite an active area with respect to glide-snow activity, with the main season for glide-snow avalanche activity roughly being mid of March to mid of April. There is a significant moderate positive correlation between glide-snow avalanche day and all air temperatures (point-biserial correlation AD and Ta_min_celsius: 0.36, p-value: 4e-17; AD and Ta_max_celsius: 0.36, p-value: 1e-16; AD and Ta_mean_celsius: 0.37, p-value: 2e-17).
A key observation of our monitoring campaign was the release time of each event. Figure 4 presents the daytime distribution of the 92 glide-snow avalanche events recorded over five winter seasons. Events occurring after nightfall are classified as "night". The majority (67%) of all observed glide-snow avalanche events released in the afternoon between 13:00 and 17:00, and an even greater majority (83%) of all glide-snow avalanche events released between 11:00 and 17:00.
The seasonal distribution of all glide-snow avalanche events is shown in Figure 5. We find that a majority (72%) of the observed glide snow-avalanches released between the 12th of March and the middle of April.
In the five winters 54 avalanche days with a total number of 92 glide-snow avalanches were observed. We observed 90 warm-temperature glide-snow avalanche events and two cold-temperature glide-snow avalanche events. The two cold glide-snow avalanche events which we observed in during the five monitoring winters both releases early in the morning at 7:00. As we only observed two cold glide-snow avalanche events, our classification tree and variable importance analysis was restricted to warm-temperature glide-snow avalanches (by counting an "cold AD" as "NAD" for the classification tree and variable importance analysis).
The decision tree for classifying avalanche days (AD) and non-avalanche days (NAD) is depicted in Figure 6. It is limited to a (theoretical) depth of three and a minimum Gini impurity decrease of 0.02 to avoid over-classification. Reading it starts at the top node, which first splits on maximum daily air temperature: if Ta_max_celsius , the branch goes left and most samples are classified as NAD. If Ta_max_celsius , the branch goes right and the next split is based on decrease of snow height: if Diff_Hs24_cm cm, the majority of samples are classified as AD, while if Diff_Hs24_cm cm, the majority are classified as NAD. Each node displays the Gini index (class impurity), the number of samples, the value (distribution of NAD and AD), and the predicted class. In this tree, avalanche days are mainly identified when daily maximum air temperatures are warmer than and the snow height decreases by more than -0.9 cm in 24 hours.
The confusion matrix, where the rows represent the true classes NAD and AD (ground truth) and the columns represent the predicted classes by the model (NAD and AD predicted), is shown in Figure 6, right side in the middle. The confusion matrix shows 307 true negatives (non-avalanche days correctly classified as non-avalanche), 142 false alarms (non-avalanche days classified as avalanche days), 11 false negatives (avalanche days classified as non-avalanche days), and 43 true positives (avalanche days correctly classified as avalanche days).
4. Discussion
Our results show that glide-snow avalanche release is strongly linked to warm conditions and exhibits pronounced temporal clustering. The majority of events occurred during the early afternoon, closely following peak energy input, indicating a short response time of glide-snow avalanches to meteorological forcing. Seasonally, most avalanches were released between mid-March and mid-April, when snowmelt is possible while a continuous snow cover still exists.
Statistical analysis confirmed a significant relationship between avalanche occurrence and air temperature. Avalanche days were moderately but significantly correlated with daily minimum, mean, and maximum air temperatures, consistent with previous studies. However, high temperatures also frequently occurred on non-avalanche days, demonstrating that one temperature value alone is insufficient for reliable operational forecasting. By incorporating a second variable such as snow height decrease as a proxy for snowmelt, predictive performance improved substantially.
Our decision tree (Figure 6, left side) identifies two main predictors for glide-snow avalanche days at Planneralm: daily maximum air temperature and decrease in snow height. In our dataset glide-snow avalanche days mainly occurred when daily maximum air temperatures exceeded and snow height decreased by more than 0.9 cm in 24 hours. Also the feature importance analysis (Figure 6, right side) showed that minimum daily air temperature (Ta_max_celsius) was the dominant predictor (87%), followed by 24-hour snow depth difference (Diff_Hs24_cm, 13.0%), while the other meteorological and snowpack variables contributed negligibly.
Model evaluation (Figure 6, right side) on the test set yielded an overall accuracy of 0.70, with high recall for both classes (NAD: 0.68; AD: 0.80), indicating that most glide-snow avalanche days were correctly identified. However, the precision for AD was low (0.23), reflecting a a relatively high false-alarm rate. The macro averaged precision, recall, and F1-scores were 0.60, 0.74, and 0.58, respectively, and the weighted averages were 0.89, 0.70, and 0.75. The confusion matrix shows that the decision tree correctly identified 307 non-avalanche days and 43 avalanche days, misclassified 142 non-avalanche days as avalanche days, and missed 11 avalanche days. This indicates that the model achieves high detection rate (recall) for avalanche days (80 %), at the expense of a moderate false alarm rate (32 %), reflecting a tendency to over-predict avalanche occurrences.
Mean daily temperature, minimum daily temperature, maximum daily temperature, and snow-height decrease (at warm temperatures) are inherently correlated. In-depth model analysis showed that while a single predictor was insufficient for reliable glide-snow avalanche forecasting, a combination of one temperature predictor and a second predictor such as decrease in snow height or also a second temperature variable substantially improved model performance. This improvement arises because two variables capture the variability of the temperature evolution, which cannot be represented by a single variable alone. Physically, glide-snow release requires temperatures that are sufficiently high to induce melting and also remain high enough to prevent thorough refreezing. Decrease in snow height at warm temperatures is also a good indicator for snow settling and melting, whereas snow height decrease at low temperature merely is an indication of snow settling, the latter not being particularly relevant for glide-snow avalanche release. For our specific dataset at Planneralm, maximum air temperature as a first predictor and decrease in snow height produced the model with the best predictive performance.
Our results show, in line with [8], that the air temperature on avalanche days is higher than on non-avalanche days. But both findings also show that high temperatures often also occur on non-avalanche days. This means that using only one air temperature as a predictor for avalanche triggering would lead to many false alarms and is therefore not sufficient for operational purposes. Adding the decrease in snow height, which on warm days we assume to be a proxy for snow-melt, can decrease the false alarm rate substantially. We therefore conclude that a site-specific decision tree can give a valuable basis for determining high-probability non-avalanche days with respect to glide-snow avalanches.
Comparing our results to the results of [8], who studied glide-snow avalanche release on the Dorfberg above Davos, we found quite similar conditions for warm glide-snow avalanche occurrence. There was one striking difference, however. While [8] found almost twice as many cold glide-snow avalanche as than warm glide-snow avalanche events (32 cold events compared to 17 warm glide-snow avalanche events), almost all of our glide-snow avalanche events were warm events (two cold events and 90 warm events). [7], in contrast, who also studied glide-snow avalanches on Dorfberg, detected 947 glide-snow events (650 surface [warm] events/297 interface [cold] events). [13], who studied glide-snow avalanche release with a focus on soil properties in Aosta Valley in the northwestern Italian Alps, also found more warm glide-snow avalanche events with, however, a relatively low number of glide-snow avalanches in total (two cold versus seven warm glide-snow avalanche events). These differences suggest that the occurrence of cold glide-snow avalanches is highly site-specific and may depend strongly on local factors such as conditions for melt-water flow and groundwater availability.
Another notable difference compared to the glide-snow avalanche data presented in [7] is the diurnal distribution of glide-snow avalanche occurrence. While both datasets show a clear peak of glide-snow avalanche activity in the early afternoon, the data distribution even for warm glide-snow avalanches in [7] appears broader, with a less pronounced peak in the early afternoon. Moreover, [7] found that 18 % of even their surface [warm] glide-snow avalanche events occurred during the night, and 14 % of their interface [cold] glide-snow avalanche events occurred during the night. In contrast, night-time occurrence of glide-snow avalanches only happened for 4 % of our warm glide-snow avalanche events (four out of 90) and 100 % of our cold glide-snow avalanche events (two out of two).
Compared to previous studies on glide-snow avalanches, we found many similarities and a few slight differences, as discussed above. Note that most previous studies on glide-snow avalanche occurrence were carried out on the Dorfberg above Davos [e.g. 7,8,9]. The Dorfberg area is presumably the best-equipped and best-studied glide-snow avalanche release area in the world, with thoroughly measured and carefully analysed data. Our study is, to our knowledge, the first to demonstrate the level of spatial transferability of the Dorfberg results, and additionally indicates some limitations of spatial transferability. This adds confidence for applicability of our model also in other regions.
5. Conclusions and Outlook
We observed glide-snow avalanche activity in our study area Planneralm, Styria in Austria for five winter seasons. We found that in our study region the vast majority (98%) of all glide-snow avalanches were warm glide-snow avalanches, and most (83%) of the glide-snow avalanches released during the warm hours of the day, namely between 11:00 and 17:00. Also, most glide-snow avalanches released in spring, namely between the middle of March and the middle of April. Moreover we used the obtained data to train a decision tree for discriminating between avalanche and non-avalanche days. We found that a relatively simple tree using maximum air temperature and decrease of snow height gives a fair indication for potential avalanche days, catching 80% of all glide-snow avalanche days, with a moderate rate (32%) of false alarms. This indicates a high potential of such simple, statistical models in operational glide-snow avalanche prediction, e.g., as support for local decision making about temporal protection measures. The precondition for such a model is, however, a site-specific avalanche observation dataset and meteorological observations over several seasons to enable the training of the model. Since this is a severe restriction in practical application, further research is needed to investigate the transferability of such models to other locations.
Author Contributions
Conceptualization, I.R., A.E., and A.G.; methodology, I.R., A.E., and A.G.; software, I.R. and E.K.; validation, I.R., A.E., E.K., and A.G.; formal analysis, I.R., A.E., E.K., and A.G.; investigation, I.R., A.E., E.K., and A.G.; resources, I.R. and A.G.; data curation, I.R., A.E., E.K., and A.G.; writing—original draft preparation, I.R., A.E., and A.G.; writing—review and editing, I.R., A.E., E.K., and A.G.; visualization, I.R., A.E., E.K., and A.G.; supervision, I.R. and A.G.; project administration, I.R..; funding acquisition, - . All authors have read and agreed to the published version of the manuscript.
Funding
This research received no external funding.
Institutional Review Board Statement
Not applicable.
Informed Consent Statement
Not applicable.
Data Availability Statement
The data presented in this study are available on request from the corresponding author.
Conflicts of Interest
The authors declare no conflicts of interest.
Appendix A
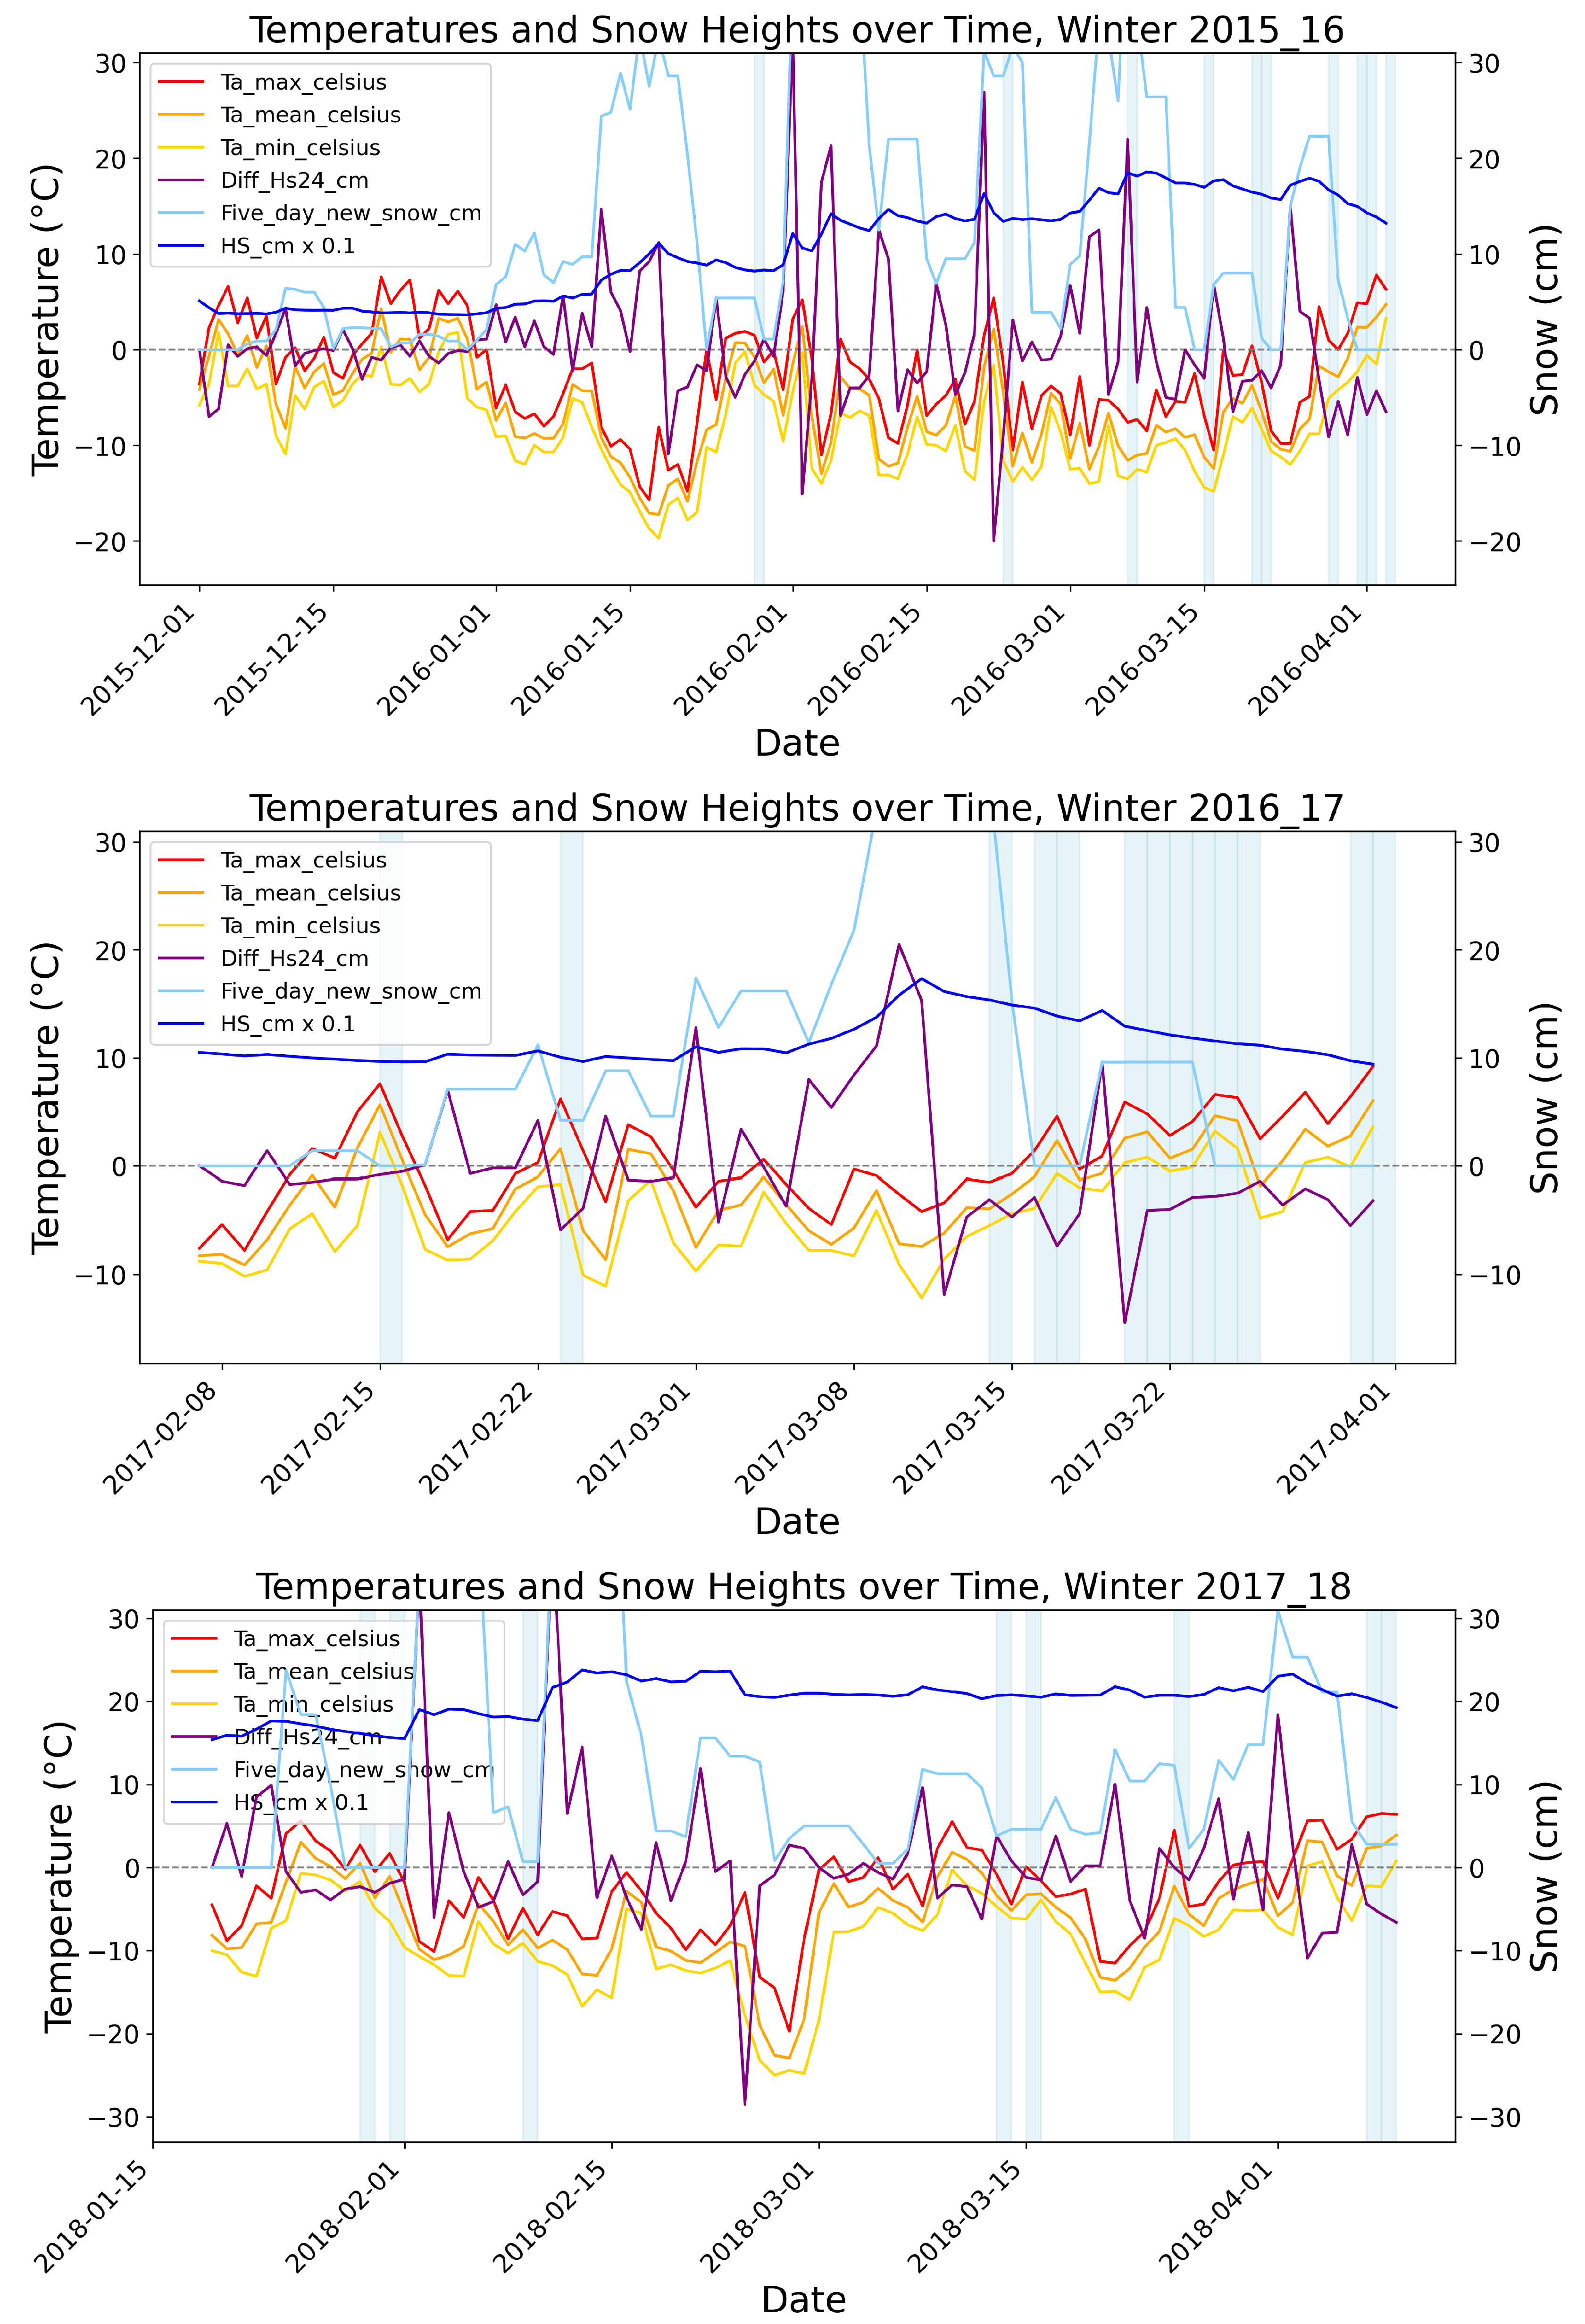
Figure A1.
Observed glide-snow avalanche events and recorded meteorological data for the winters 2010/11, 2015/16, 2016/17, and 2017/18. Days with glide-snow avalanche events. Number of glide-snow events (light-blue vertical bars), maximum daily temperature (∘, red), mean daily temperature (∘, orange), minimum daily temperature (∘, yellow), 24 h-difference in snow height (cm, purple), five-day new snow sum (light-blue), and 0.1 × snow height (cm, blue).
References
- Winkler, K.; Zweifel, B.; Marty, C. Schnee und Lawinen in den Schweizer Alpen. Hydrologisches Jahr 2017/18.; Vol. 77, WSL Institute for Snow and Avalanche Research SLF, 2019; p. 46.
- Simenhois, R.; Birkeland, K. Meteorological and environmental observations from three glide avalanche cycles and the resulting hazard management technique. In Proceedings of the Proceedings International Snow Science Workshop ISSW 2010; Schweizer, J.; van Herwijnen, A., Eds., Lake Tahoe CA, U.S.A., 17-22 October 2010, 2010; pp. 846–853.
- McClung, D.; Clarke, G. The effects of free water on snow gliding. Journal of Geophysical Research 1987, 92, 6301–6309.
- Mitterer, C.; Schweizer, J. Towards a better understanding of glide-snow avalanche formation. In Proceedings of the Proceedings International Snow Science Workshop, Anchorage, AK, USA, 2012; pp. 619–616.
- Lackinger, B. Mechanics of snow slab failure from a geotechnical perspective. In Proceedings of the Symposium at Davos 1986 – Avalanche Formation, Movement and Effects; Salm, B.; Gubler, H., Eds., IAHS Publication, 1987; Vol. 162, pp. 229–241.
- Höller, P. Snow gliding on a south-facing slope covered with larch trees. Annals of Forest Science 2013, 71, 81–89.
- Fees, A.; van Herwijnen, A.; Altenbach, M.; Lombardo, M.; Schweizer, J. Glide-snow avalanche characteristics at different timescales extracted from time-lapse photography. Annals of Glaciology 2024, 65, e3. [CrossRef]
- Dreier, L.; Harvey, S.; van Herwijnen, A.; Mitterer, C. Relating meteorological parameters to glide-snow ava-lanche activity. Cold regions science and technology 2016, 128, 57–68.
- Fees, A.; Lombardo, M.; van Herwijnen, A.; Lehmann, P.; Schweizer, J. The source, quantity, and spatial distribution of interfacial water during glide-snow avalanche release: experimental evidence from field monitoring. The Cryosphere 2025, 19, 1453–1468. [CrossRef]
- Clarke, J.; McClung, D. Full-depth avalanche occurrences caused by snow gliding, Coquihalla, British Columbia, Canada. Journal of Glaciology 1999, 45, 539–546. [CrossRef]
- Peitzsch, E.H.; Hendrikx, J.; Fagre, D.B. Terrain parameters of glide snow avalanches and a simple spatial glide snow avalanche model. Cold Regions Science and Technology 2015, 120, 237–250. [CrossRef]
- Resch, F.; Bair, E.; Peitzsch, E.; Miller, Z.; Fees, A.; van Herwijnen, A.; Reiweger, I. Comparison of the glide activity at two distinct regions using Swiss and U.S. datasets. In Proceedings of the Proceedings International Snow Science Workshop ISSW 2023, Bend, Oregon, U.S.A., 8-13 October 2023, 2023; pp. 144–149.
- Maggioni, M.; Godone, D.; Frigo, B.; Freppaz, M. Snow gliding and glide-snow avalanches: recent outcomes from two experimental test sites in Aosta Valley (northwestern Italian Alps). Natural Hazards and Earth System Sciences 2019, 19, 2667–2676. [CrossRef]
- Eberl, A.; Gobiet, A.; Studeregger, A.; Reiweger, I. Investigations on glide-snow avalanches. In Proceedings of the Proceedings International Snow Science Workshop ISSW 2018, Innsbruck, Austria, 7-12 October 2018, 2018; pp. 920–924.
- BFW Bundesforschungszentrum für Wald. eBOD Digitale Bodenkarte Österreich. https://bodenkarte.at, 2025. accessed 2025-12-02.
- Kindermann, E. Identifying meteorological release factors of glide avalanches with multivariate statistical analysis. Master’s thesis, Ludwig-Maximilians-Universität München, Munich, Germany, 2019.
- Mitterer, C.; Schweizer, J. Analysis of the snow-atmosphere energy balance during wet-snow instabilities and implications for avalanche prediction. The Cryosphere 2013, 7, 205–216. [CrossRef]
- Schweizer, J.; Jamieson, J.B.; Schneebeli, M. Snow avalanche formation. Reviews of Geophysics 2003, 41, 1016.
- Pedregosa, F.; Varoquaux, G.; Gramfort, A.; Michel, V.; Thirion, B.; Grisel, O.; Blondel, M.; Müller, A.; Nothman, J.; Louppe, G.; et al. Scikit-learn: Machine Learning in Python, 2018, [arXiv:cs.LG/1201.0490].
Figure 1.
Glide-snow avalanches within the test area Planneralm. Photos: A. Gobiet and A. Riegler, 2017, GeoSphere Austria.
Figure 1.
Glide-snow avalanches within the test area Planneralm. Photos: A. Gobiet and A. Riegler, 2017, GeoSphere Austria.
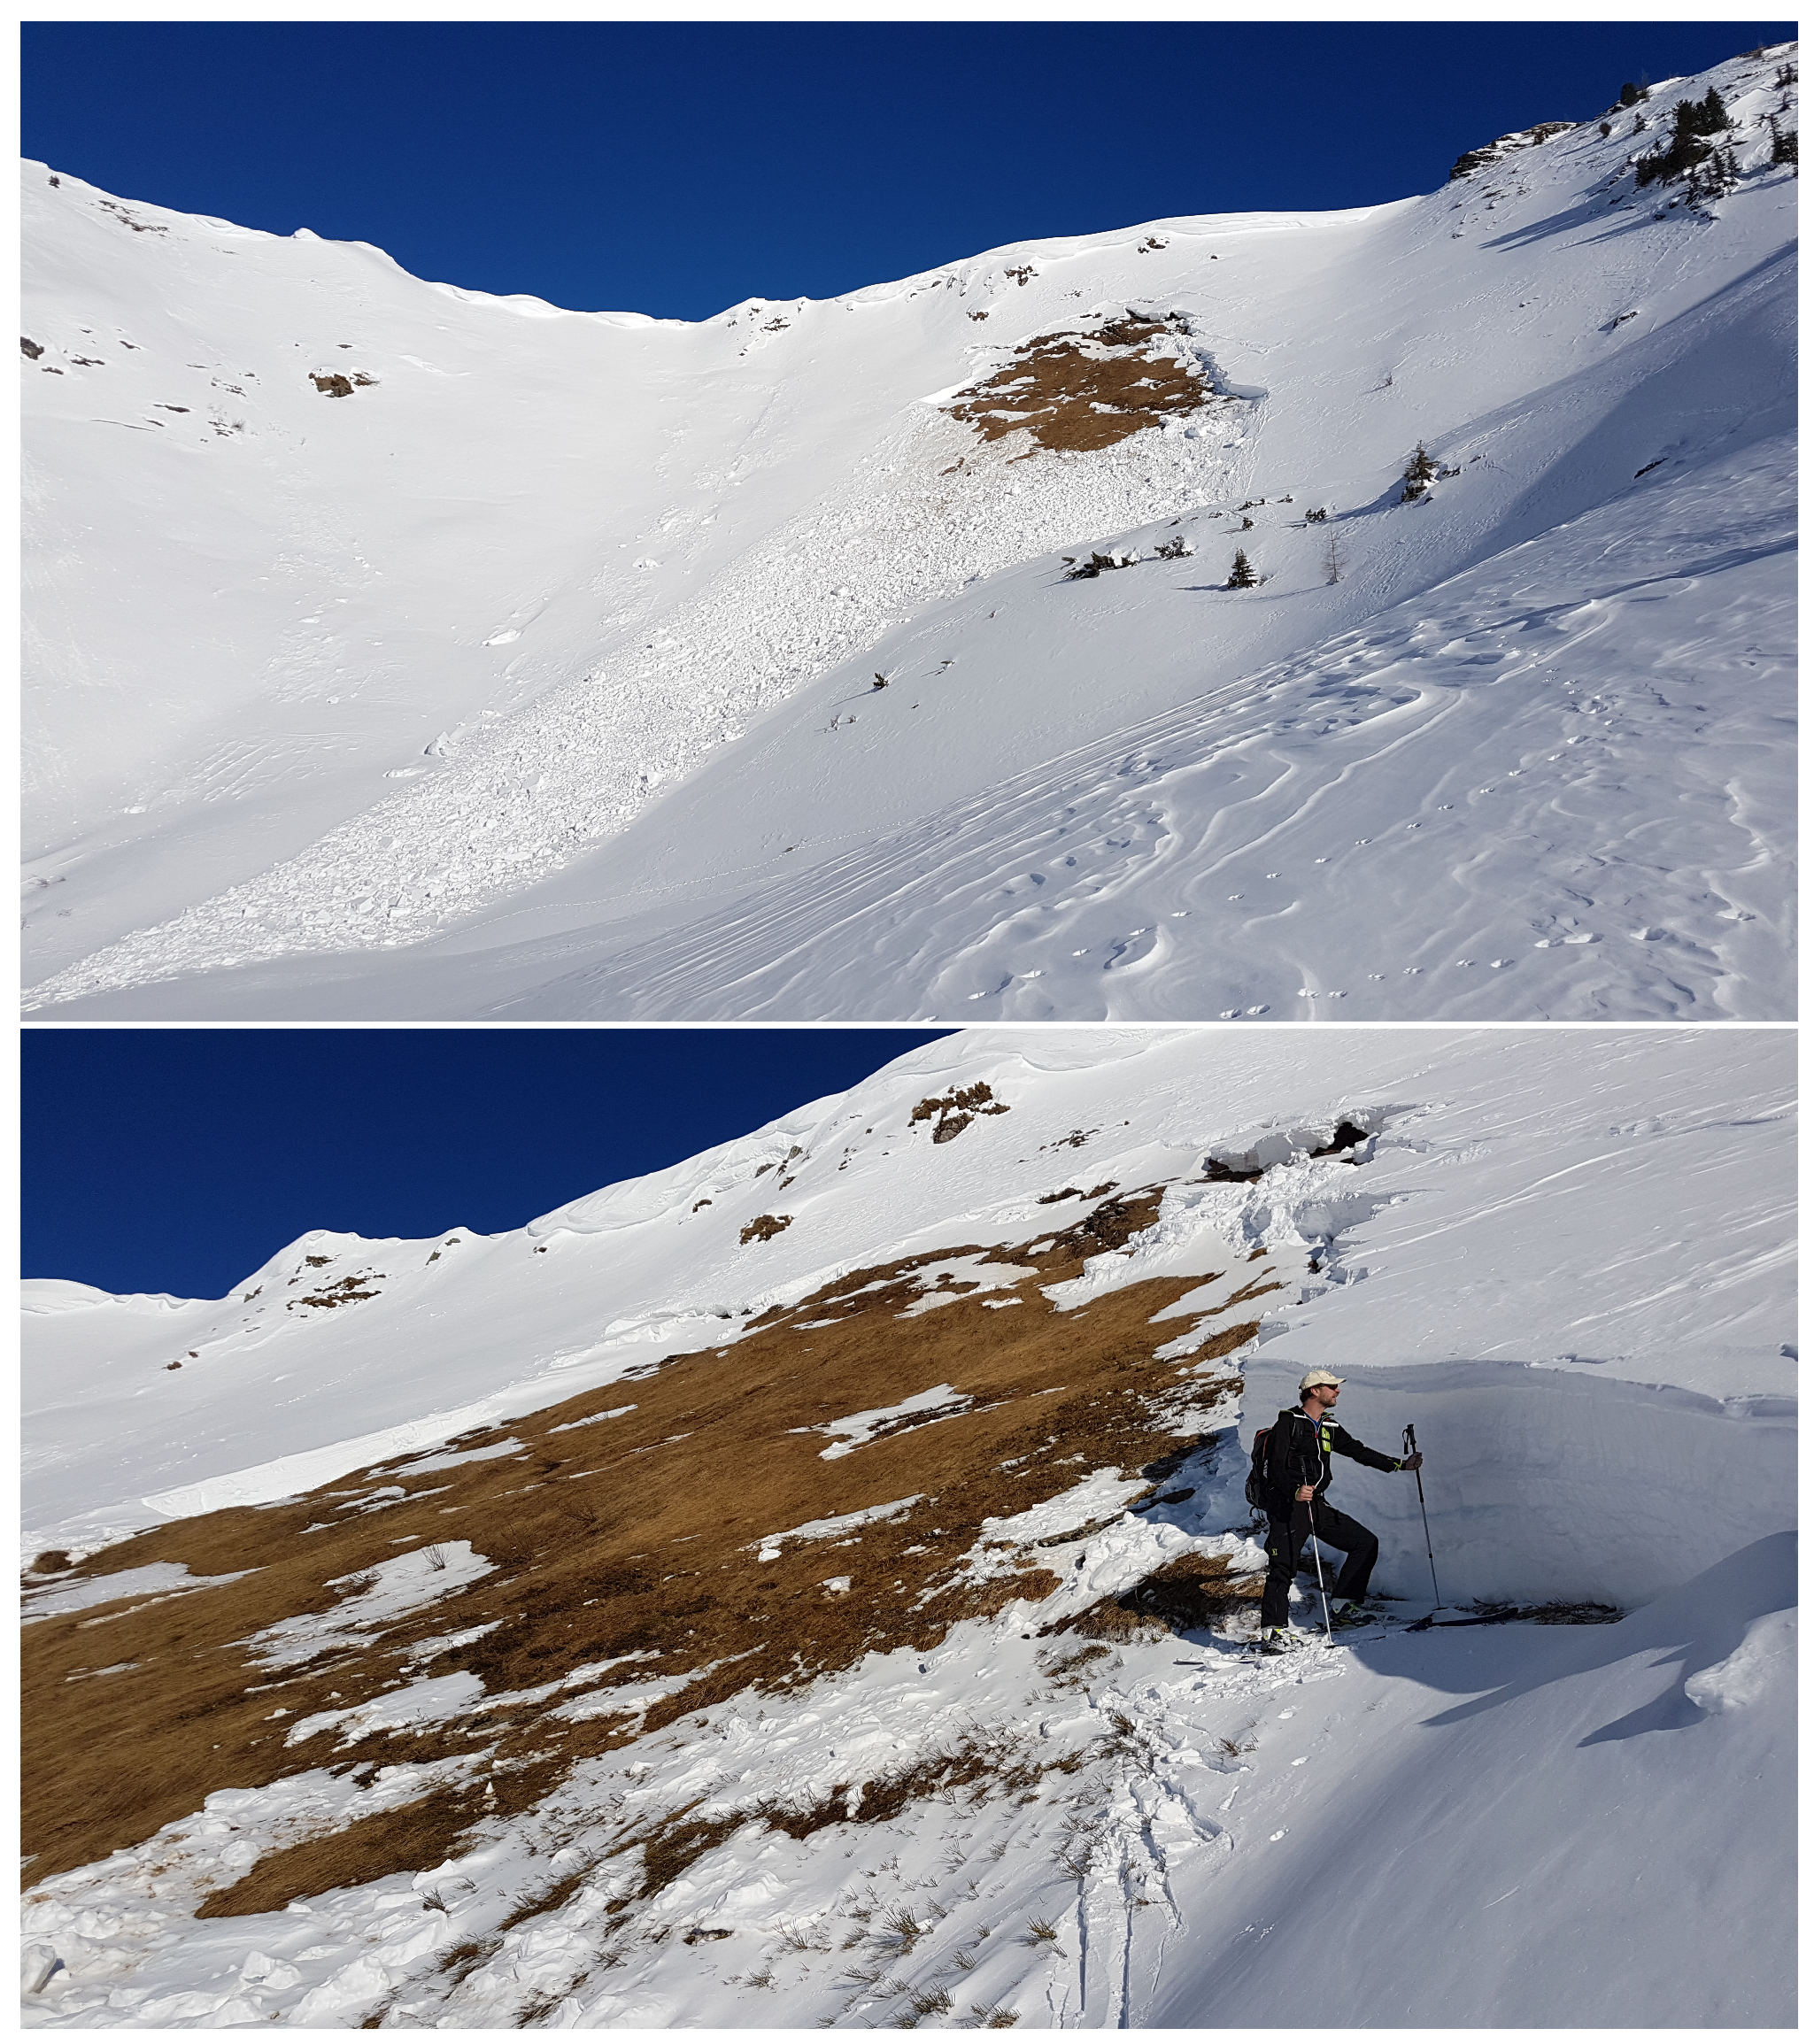
Figure 2.
Study area Planneralm in Styria, Austria. Sources: © OpenStreetMap contributors; BEV – Bundesamt für Eich- und Vermessungswesen, Austrian Map, CC BY 4.0
Figure 2.
Study area Planneralm in Styria, Austria. Sources: © OpenStreetMap contributors; BEV – Bundesamt für Eich- und Vermessungswesen, Austrian Map, CC BY 4.0
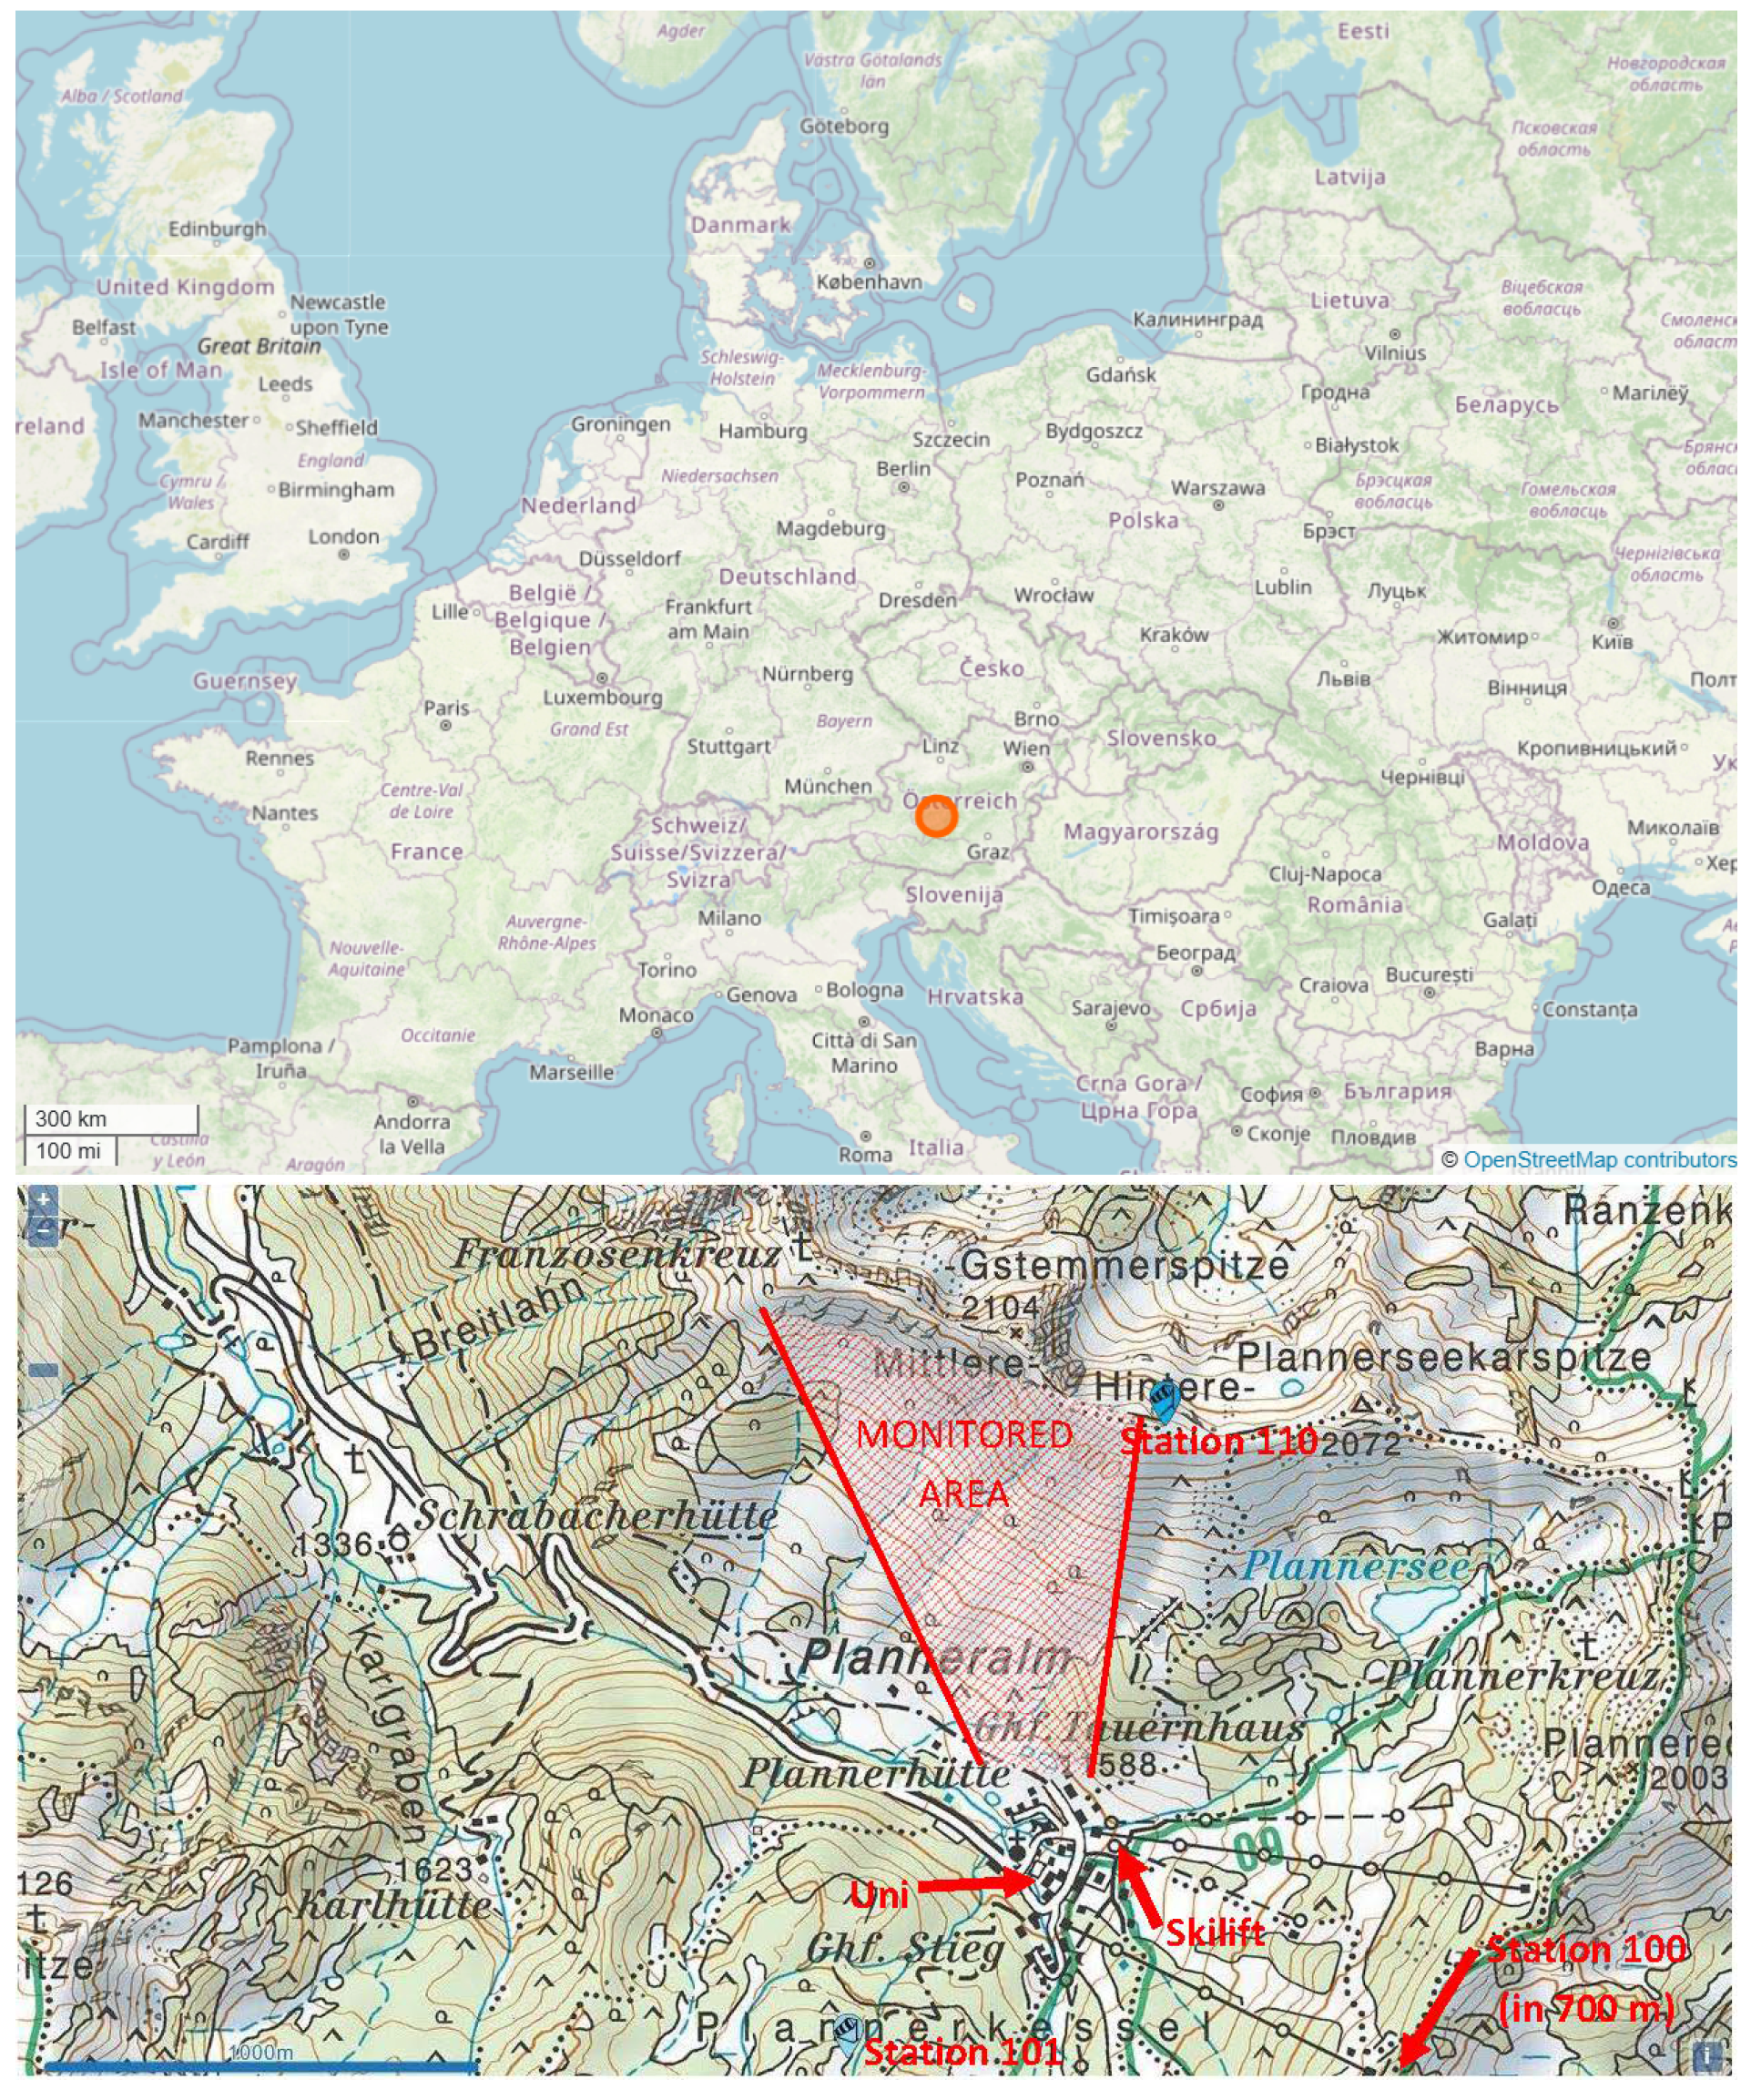
Figure 3.
Observed glide-snow avalanche events and recorded meteorological data for the winter 2009/10. Glide-snow avalanche days (light-blue vertical bars), maximum daily air temperature (∘, red), mean daily air temperature (∘, orange), minimum daily air temperature (∘, yellow), 24 h-difference in snow height (cm, purple), five-day new snow sum (light-blue), and 0.1 × snow height (cm, blue).
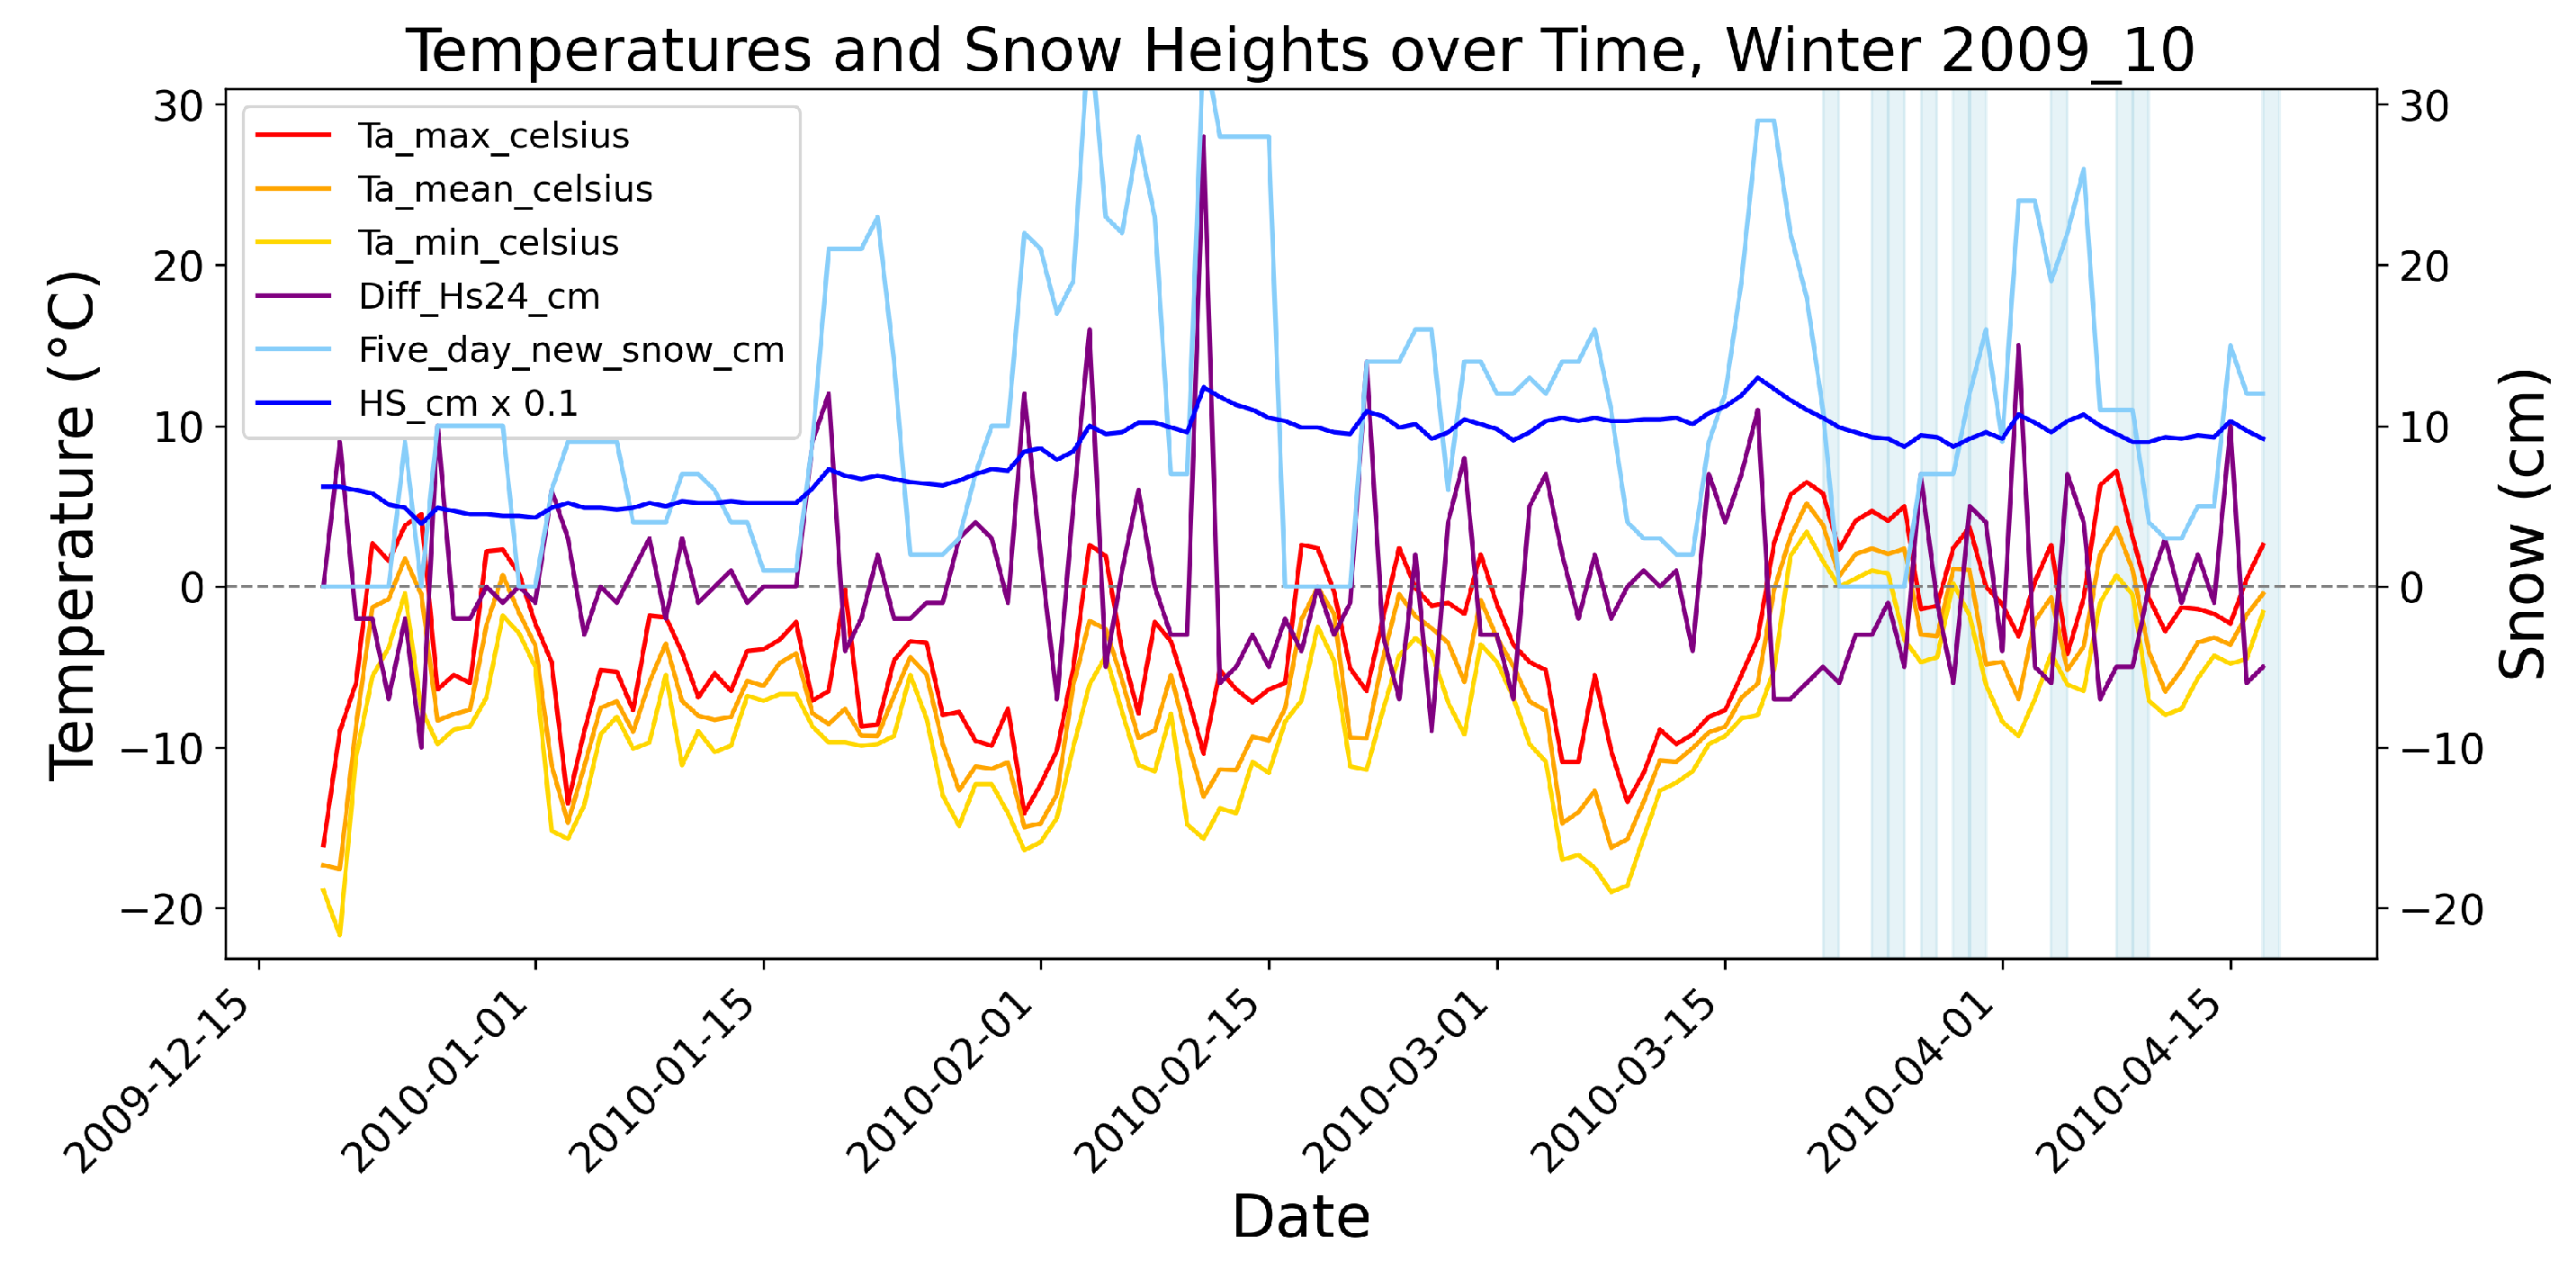
Figure 4.
Diurnal distribution of glide-snow avalanche releases.
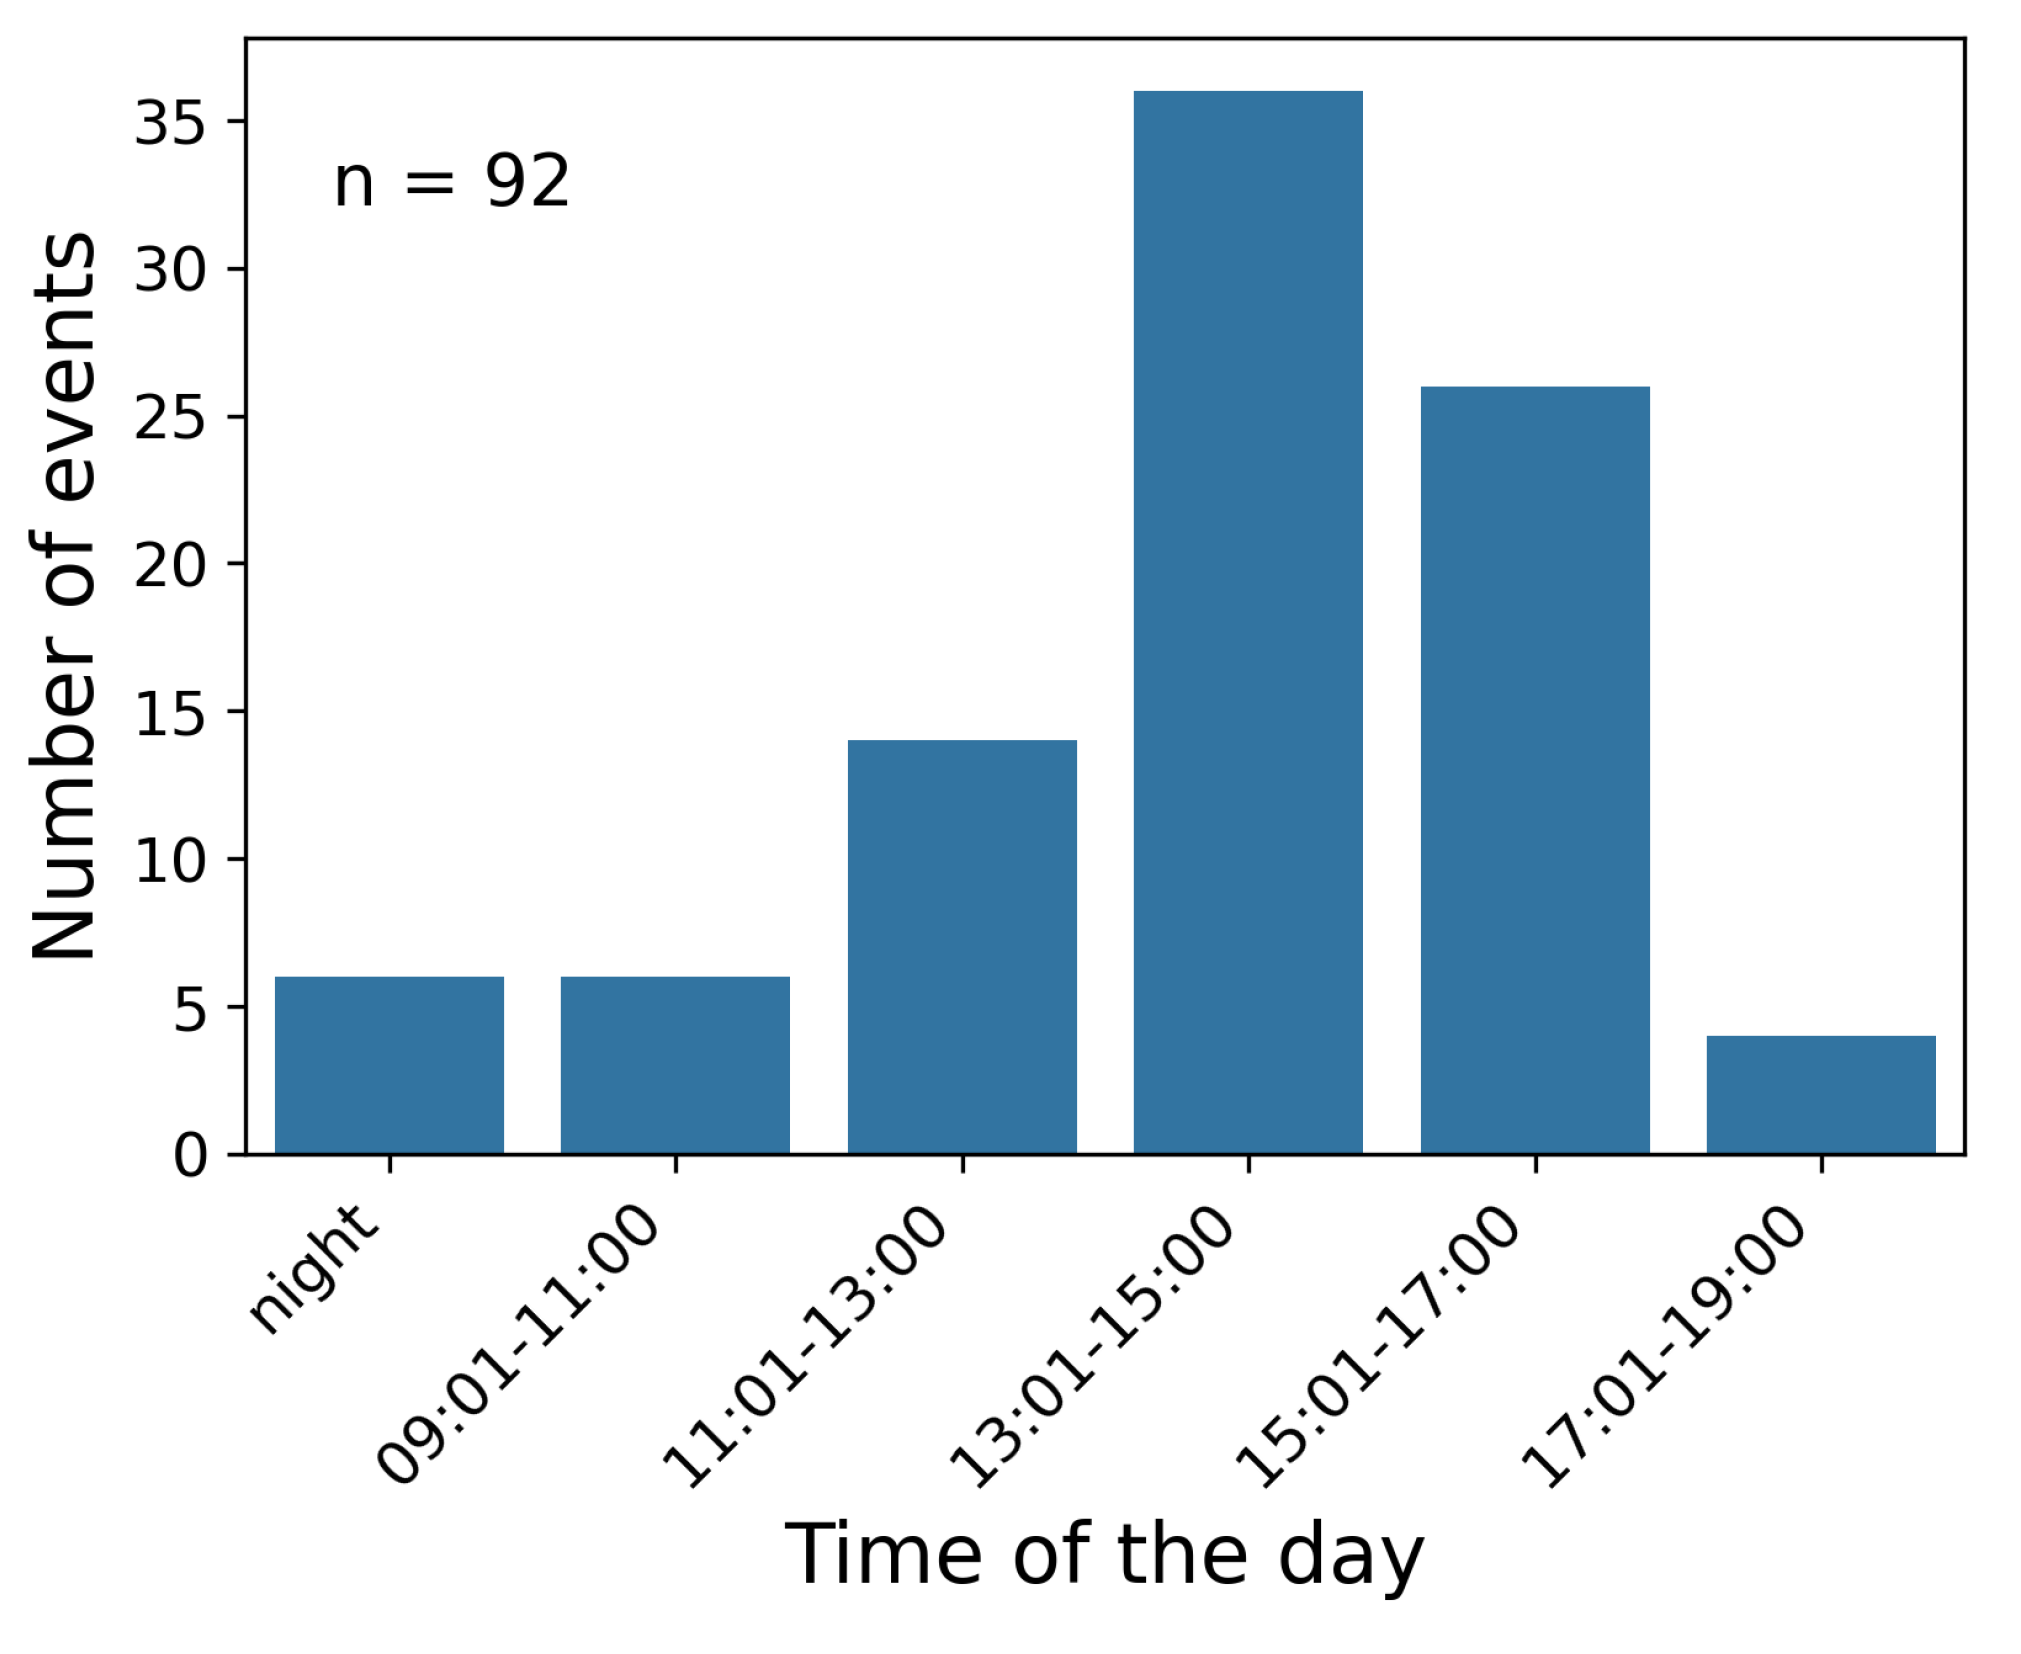
Figure 5.
Seasonal distribution of glide-snow avalanche releases.
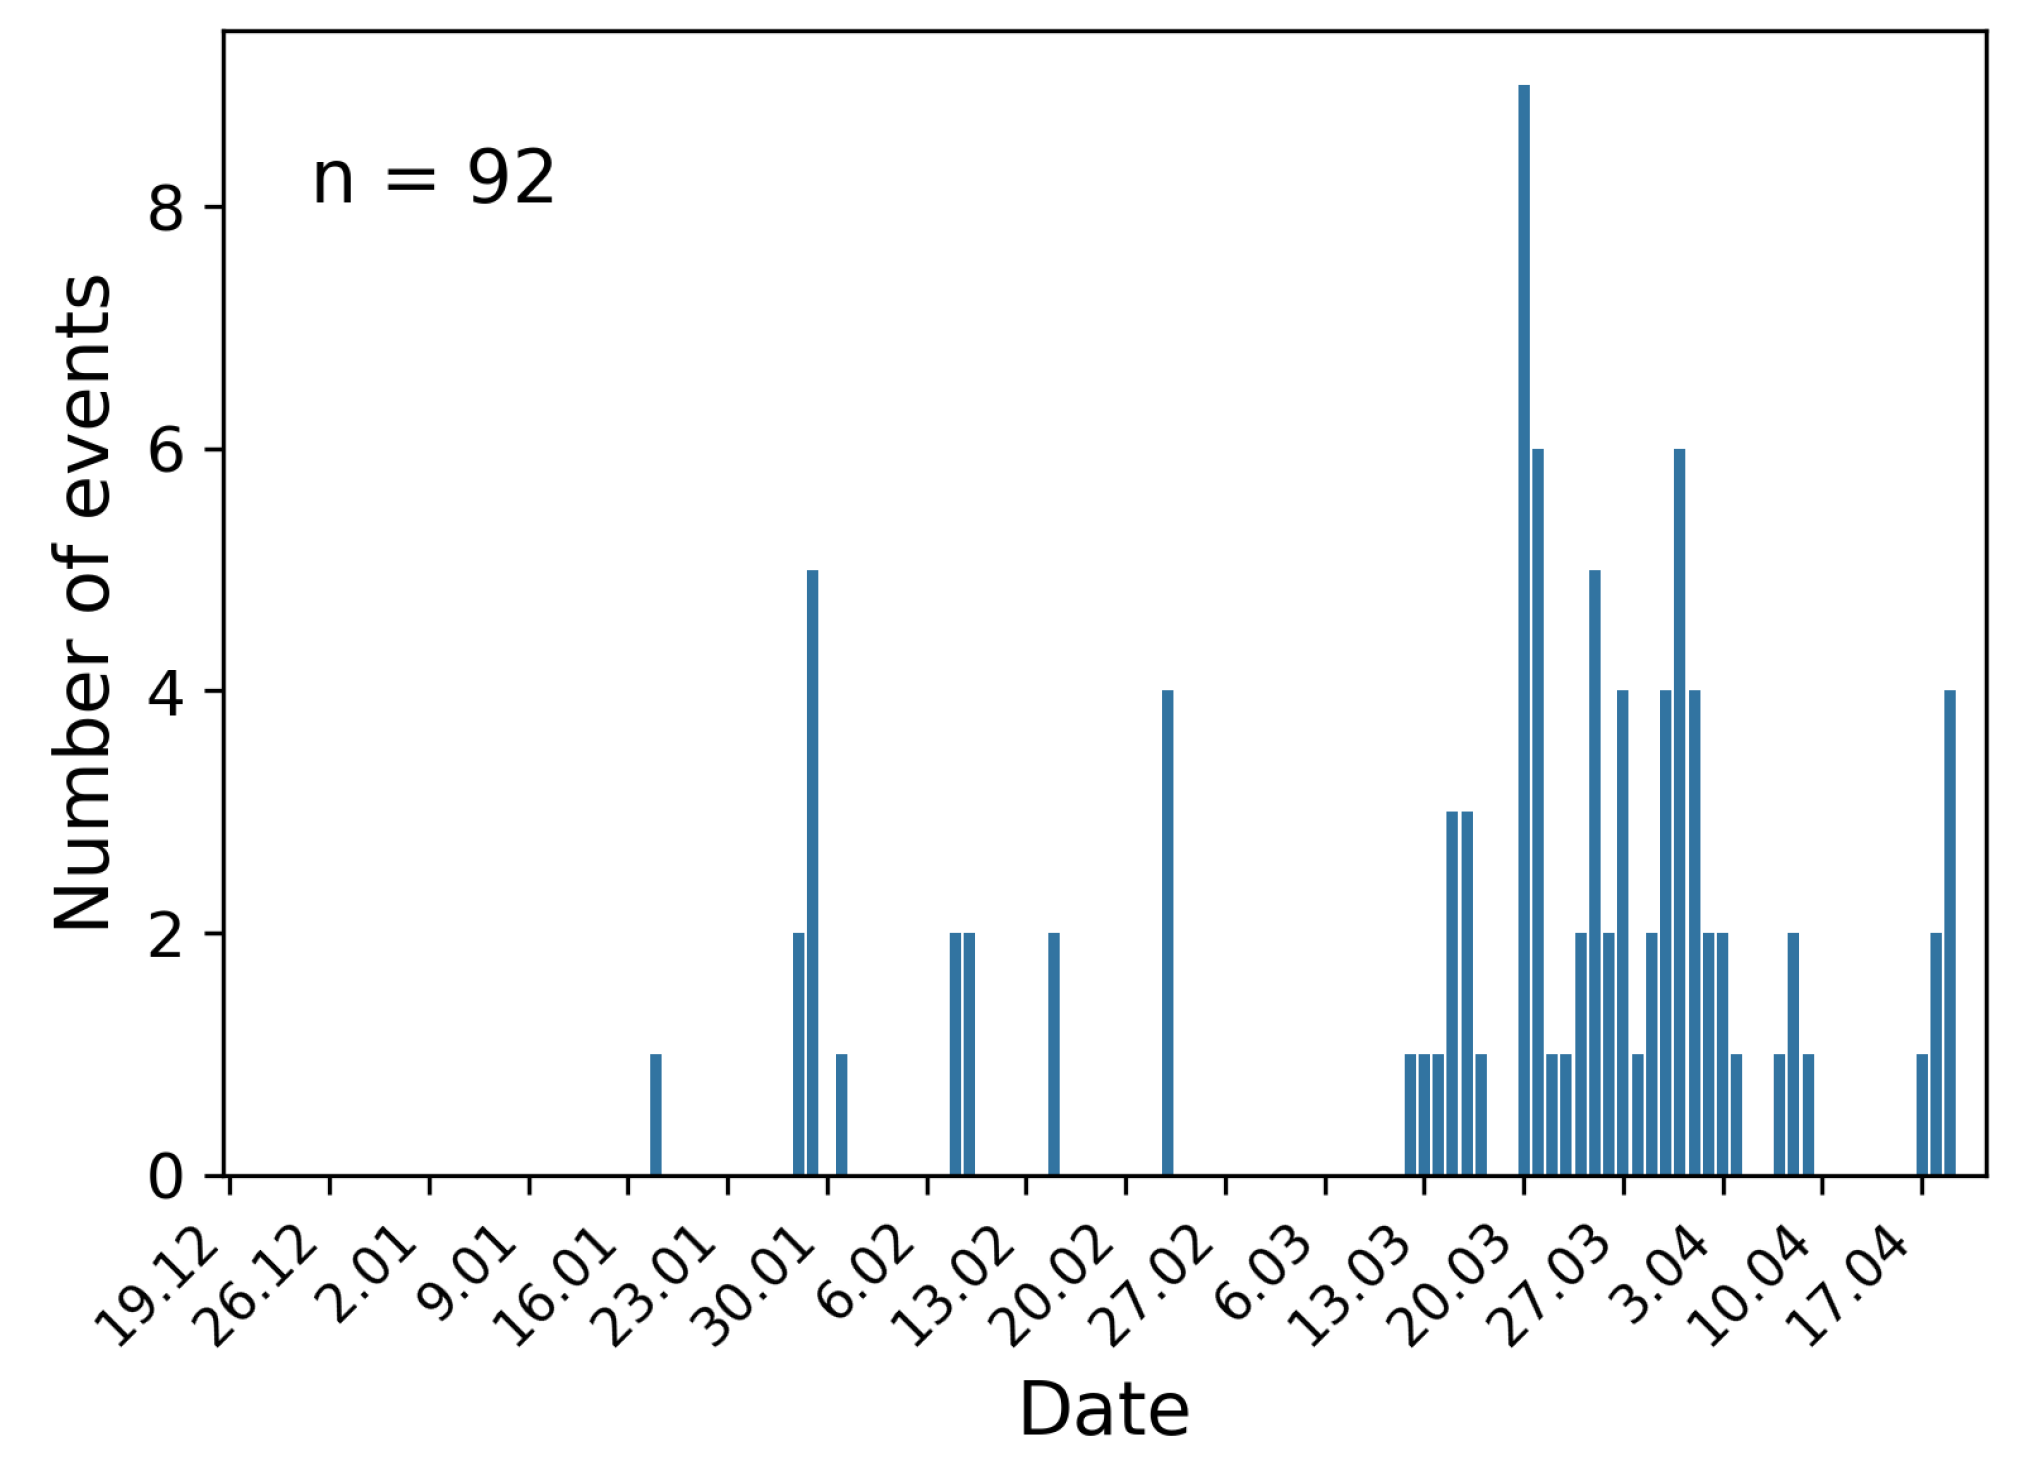
Figure 6.
Classification tree discriminating between avalanche days (AD) and non-avalanche days (NAD).
Figure 6.
Classification tree discriminating between avalanche days (AD) and non-avalanche days (NAD).
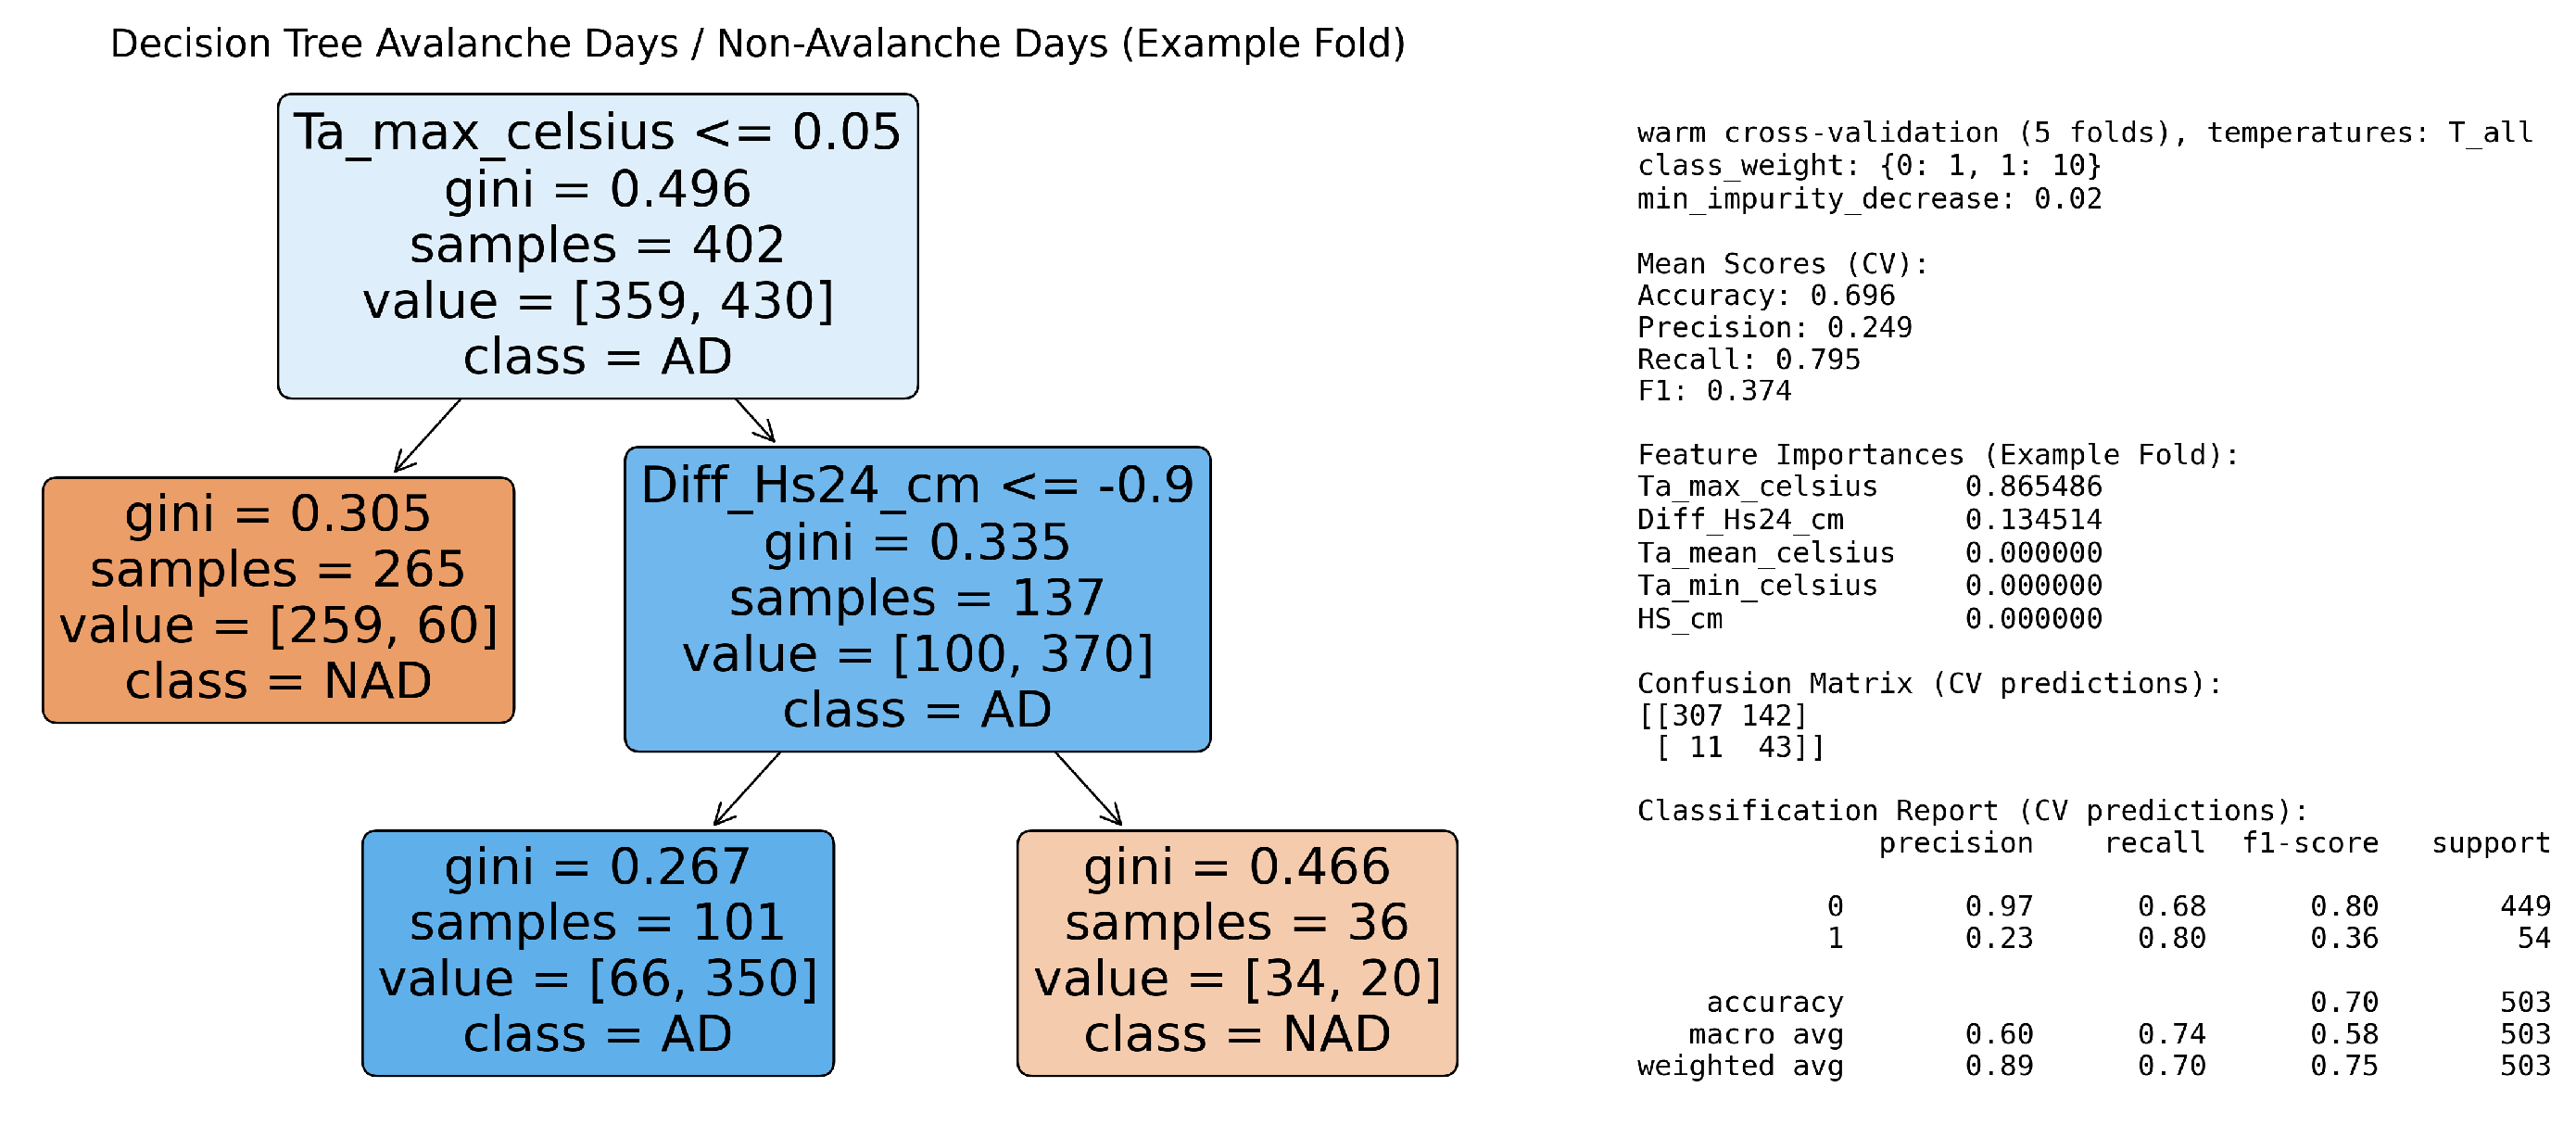

Table 1.
Meteorological and snow measurement stations used for observations.
| Attribute | Winter 2009/10 & 2010/11 (Camera viewpoint 1) |
|---|---|
| Air temperature [∘C] | Station No. 100: Planneralm Großer Rotbühel wind measurement station |
| Elevation | 2019 m |
| Location (exposition) | Situated on the summit ridge |
| Distance to observation area | 2 km |
| Operator | Province of Styria |
| Snow depth [cm] | Planneralm University Sports Centre snow measurement station |
| Elevation | 1570 m |
| Location (exposure) | Situated in the valley floor |
| Distance to observation area | Directly adjacent (next to camera viewpoint 1) |
| Operator | Province of Styria |
| Attribute | Winter 2015/16, 2016/17 & 2017/18 (Camera viewpoint 2) |
| Air temperature [∘C] | Station No. 110: Planneralm Gstemmerspitze wind measurement station |
| Elevation | 2089 m |
| Location (exposition) | Situated on the summit ridge |
| Distance to observation area | Directly adjacent |
| Operator | GeoSphere Austria |
| Snow depth [cm] | Station No. 101: Planneralm Loipe snow measurement station |
| Elevation | 1707 m |
| Location (exposure) | North-East exposure |
| Distance to observation area | Approx. 1 km |
| Operator | Geosphere Austria |
Disclaimer/Publisher’s Note: The statements, opinions and data contained in all publications are solely those of the individual author(s) and contributor(s) and not of MDPI and/or the editor(s). MDPI and/or the editor(s) disclaim responsibility for any injury to people or property resulting from any ideas, methods, instructions or products referred to in the content. |
© 2025 by the authors. Licensee MDPI, Basel, Switzerland. This article is an open access article distributed under the terms and conditions of the Creative Commons Attribution (CC BY) license (http://creativecommons.org/licenses/by/4.0/).
Copyright: This open access article is published under a Creative Commons CC BY 4.0 license, which permit the free download, distribution, and reuse, provided that the author and preprint are cited in any reuse.


