Submitted:
22 December 2025
Posted:
24 December 2025
You are already at the latest version
Abstract
Visual Impression in Architectural Space (VIAS) plays a central role in how users intuitively respond to surrounding environment, where visual stimuli such as signage, layout, and spatial density immediately shape attention, movement, and engagement. While designers intentionally deploy these visual attractors, the resulting perceptual and behavioural responses remain uncertain and vary across cultural and methodological contexts. To address this challenge, this study reframes urban public space, taking event-space as a case study, by integrating architecture and data-science into a framework that combines VIAS theory, behaviour-perception analysis, and sentiment-aware linguistic modelling. Firstly, we introduce a visual behavioural layer that identifies how spatial attractors such as advertising banners, product displays and event layouts. Secondly, we construct an expanded dataset from previous research comprising eight native participants interviewed in their native language, enabling linguistically accurate and culturally grounded comparison with the previous English-based mixed cohort. Thirdly, we develop a multi-modal sentiment-weighted keyword extraction algorithm that captures participant-initiated perceptual themes while suppressing interviewer influence and modality-specific bias, enabling alignment between verbal impressions and visual-behavioural evidence. Finally, we compare three interview modalities (onsite, video-based and virtual-environment) against behavioural observation data collected at a small-scale event in Matsue City, Japan. Results demonstrate that onsite participants exhibit systematic positive bias driven by the festive atmosphere, while remote modalities elicit more balanced assessments of visual clarity, signage effectiveness, stall arrangement, and missing spatial amenities. Furthermore, cross-linguistic analysis reveals cultural differences: native participants emphasise holistic spatial atmosphere, whereas international participants identify discrete visual focal points. By integrating visual attractors, behavioural metrics, and sentiment-aware linguistic patterns, the proposed framework provides a replicable method for explaining how designed visual elements trigger, reinforce, or contradict actual user behaviour. The findings offer evidence-based guidance for designing inclusive temporary event spaces, highlighting how architectural visual elements can be validated and refined through multi-modal computational analysis.
Keywords:
temporary event spaces
; spatial perception analysis
; behavioral tracking
; sentiment-weighted NLP
; cross-cultural evaluation
; regional revitalization
; shrinking cities
; multi-modal interview analysis
; AI-driven spatial analytics
; urban livability
1. Introduction
Architects and urban planners design physical spaces with specific experiential intentions, yet the perceptual outcomes of these design decisions remain fundamentally uncertain. This gap between design intent and user perception represents a persistent challenge in human-centered environments. The uncertainty arises from a structural mismatch in the way spatial perception can be understood. The physical-visual dimension can be measured, modelled, and manipulated using established tools from architectural analysis, environmental psychology, and, increasingly, computer vision. Designers can directly control and objectively evaluate these properties through drawings, photographs, simulations, and quantitative spatial metrics.
In contrast, the subjective-verbal dimension, the way users experience and articulate their impressions, resists systematic analysis. Although users naturally provide rich, nuanced descriptions, extracting actionable insights from unstructured language data remains methodologically challenging. Traditional approaches attempt to bridge this gap through structured surveys and manual qualitative analysis. Structured methods, such as Semantic Differential scales [1], enable quantitative comparison but constrain responses to predetermined categories, often missing emergent perceptual qualities. Manual coding preserves linguistic nuance but cannot scale to the volume of interviews needed for statistical robustness or cross-contextual comparison. As a result, designers often lack systematic evidence linking specific spatial configurations to the ways diverse users verbally describe their experiences—evidence essential for iteratively refining design strategies.
Recent advancements in generative AI, such as ChatGPT [2,3], and in natural language processing (NLP) have greatly expanded the ability to analyse verbal feedback in design-related studies [4,5]. Our previous work [6] demonstrated that NLP-driven keyword extraction can reveal meaningful perceptual themes from interview transcripts. However, that approach did not fully represent interviewer impact, variations in participant verbosity, or differences in sentiment polarity when the same keyword was mentioned in positive, neutral, or negative contexts. These limitations restrict the accuracy of conventional keyword-based methods when applied to multi-speaker interview data.
To address these gaps, the present study develops an enhanced NLP-based framework that incorporates sentiment weighting, repetition decay, and participant-specific normalisation. This approach enables balanced comparison across native and non-native participants, allowing the analysis to distinguish between culturally shared impressions and culturally specific interpretation. By refining how verbal data are quantified, the framework improves the reliability of user-centered evaluations of VIAS.
The main objectives of this study are threefold:
- To build on the Visual Impression in Architectural Space (VIAS) multi-modal framework by integrating NLP-based verbal analysis with established theories of VIAS.
- To examine how linguistic and cultural differences influence the articulation of visual attractiveness, comfort, and engagement in VIAS of temporary events.
- To develop and validate an adaptive sentiment-weighted keyword extraction algorithm that mitigates interviewer bias, adjusts for per-participant verbosity, and provides replicable, objective scoring for qualitative interview data.
These contributions extend the data-driven approach introduced in [6] by offering a rigorous and culturally adaptable method for interpreting user perceptions. The proposed framework advances both theoretical understanding of cross-cultural spatial cognition and practical tools for evidence-based design of inclusive public spaces. By supporting systematic and bias-aware analysis, this framework advances our understanding of cross-cultural spatial cognition and offers reliable tools for interpreting how native and non-native users describe built environments.
1.1. Outline of the Study
The remainder of this paper is structured as follows.
Section 2 reviews foundational and recent research on VIAS, focusing on the designer–user perception gap, cross-cultural and multi-modal elicitation methods, and emerging data-driven and NLP-based approaches for analyzing verbal spatial perception. This section also highlights the opportunities and challenges of multi-modal frameworks, motivating the need for integrated behavioral, linguistic, and spatial analysis.
Section 3 presents the proposed integrated multi-modal framework. This section details the case study setting of a temporary event space in Matsue, Japan; the behavioral observation and spatial configuration analysis; the multi-phase interview design across onsite, video-based, and virtual environments; and the construction of a culturally balanced dataset involving native and non-native participants. It also explains the overall four-stage workflow that links spatial design variables, behavioral data, and linguistic responses.
Section 4 introduces the NLP-driven data interpretation framework as a core contribution of this study. This section first describes the baseline fixed-parameter keyword weighting algorithm and identifies its limitations related to repetition bias and participant verbosity. It then presents the proposed adaptive per-participant weighting model, including personalized decay rates, sentiment polarity coupling, and normalization by utterance volume. Comparative analysis demonstrates how the adaptive model improves balance, interpretability, and robustness in multi-person, multi-modal interview data.
Section 5
examines how linguistic proficiency, questionnaire structure, and interview modality influence verbal spatial evaluation. Through cross-modal validation, it analyses keyword diversity and the emergence of critical feedback across onsite, video-based, and virtual interviews. A cross-linguistic comparison reveals that native structured protocols reduce interpretive uncertainty compared to mixed-language, free-form discussions. The results confirm that linguistically stable data collection is essential for mitigating social desirability bias, interviewer influence, and modality-driven distortions in VIAS research.
Section 6 discusses architectural and spatial design implications, translates computational findings into evidence-based architectural guidance by reconnecting sentiment-weighted linguistic patterns with the designer-controlled spatial variables established in architectural analysis. The implications cover establishing validation loops for controlled spatial variables, interpreting weighted linguistic priorities, deploying modality as a diagnostic tool, translating sentiment-weighted keywords into concrete spatial strategies, and redefining the designer’s role.
Finally, Section 7 summarises the principal findings and methodological contributions of the study, highlights implications for cross-cultural spatial perception research and AI-assisted architectural evaluation, and outlines future research directions, including scalable multi-site deployment, deeper behavioural-linguistic coupling, and integration with emerging generative AI and immersive technologies.
2. Background and Related Work
Understanding Visual Impression in Architectural Space (VIAS) requires bridging two dimensions: the physical-visual properties that designers control and the subjective verbal expressions through which users articulate their perceptions. This section reviews how VIAS research has evolved to address this challenge, examining foundational theories of spatial perception (Section 2.1), methodological considerations in eliciting verbal descriptions across different interview contexts (Section 2.2), the integration of data-driven and NLP-based approaches for analyzing spatial perception (Section 2.3), and the opportunities and challenges of multi-modal frameworks that promise to scale qualitative analysis while enabling validation through behavioural observation (Section 2.4).
2.1. Visual Impression in Architectural Space: The Designer-User Perception Gap
Understanding VIAS involves two interconnected dimensions: the physical–visual properties that designers manipulate and the subjective verbal articulations users provide when experiencing space. This duality has long been recognised in architectural and environmental psychology research.
Foundational theories in urban design and environmental psychology established frameworks for understanding how physical properties shape perception. Lynch identified structural elements that enhance imageability, the quality that makes spaces mentally navigable and memorable [7]. Cullen emphasised the temporal dimension through serial vision, arguing that spatial experience unfolds dynamically as sequences of views create cumulative emotional impressions [8]. Environmental psychology subsequently operationalised aesthetic response through measurable dimensions. Kaplan and Kaplan proposed that visual preference correlates with four perceptual properties: complexity, coherence, legibility and mystery [9]. Stamps demonstrated that hierarchical processing integrates low-level visual features into high-level evaluative judgments about attractiveness and comfort [10]. These frameworks suggested that designers could systematically influence perception by manipulating quantifiable visual properties.
However, perception is culturally and individually variable, and identical environments may elicit divergent descriptions depending on background, expertise, or expectation [11,12,13], indicating that identical physical configurations may generate systematically different verbal descriptions depending on observers’ cultural frameworks.
This variability reflects the uncontrollable side of VIAS: designers can shape physical form, but they cannot fully predict how different users will interpret or describe their spatial experiences. Structured methods such as the Semantic Differential (SD) scale [1]attempt to reduce this uncertainty by quantifying affective responses along predefined dimensions (e.g., “open–closed,” “warm–cold”). While this allows statistical comparison, it limits the ability to capture perceptual qualities that arise spontaneously in language, such as “rhythmic variation” or “sense of anticipation”.
Qualitative approaches, such as thematic analysis [14] and grounded theory [15], provide greater flexibility by allowing concepts to emerge directly from participants’ descriptions. These methods preserve nuance but require substantial time, training, and multiple coders to achieve reliability [16], making them difficult to scale to larger datasets.
This contrast highlights a persistent imbalance: the visual dimension of VIAS is supported by systematic tools such as Space Syntax [17], isovist analysis [18], and computer vision techniques [19], whereas the verbal dimension remains analytically limited. Qualitative methods capture richness but do not scale; quantitative methods scale but restrict nuance. As a result, designers lack reliable ways to link measurable visual properties to the diverse, culturally variable verbal impressions expressed by users.
A further challenge is that visual and verbal data are often analysed separately, preventing an integrated understanding of how specific spatial configurations correspond to particular patterns of description. This makes it difficult to address fundamental questions such as which configurations produce impressions of “openness,” or how increasing complexity shifts perceptions from “interesting” to “overwhelming.” Addressing these gaps requires methods that can process large volumes of natural language while preserving semantic nuance and establishing interpretable relationships with visual properties.
2.2. A Cross-Cultural Approach using Multi-Modal Framework
Theoretical work on embodied and ecological perception frames these modality effects. Gibson’s ecological approach foregrounds perception as the direct pickup of affordances in the environment [20], while Heft links affordances to culture and state-of-mind-shaping action capabilities [21]. Together they imply that elicitation modality will decide which affordances are perceived and how participants verbalise them, such as onsite experience could foreground sensory affordances, image projection could foreground visual composition, and virtual representation could foreground navigational affordances.
Verbal responses to spatial environments vary substantially depending on the elicitation method. On-site walk-through interviews offer direct, multisensory engagement and often produce affective, context-sensitive language [22,23]. Yet factors such as weather, noise, and fluctuating crowd conditions introduce inconsistencies that shape what participants notice and how they articulate their impressions.
Image- and video-based enviroment reduce this contextual variability by presenting controlled visual stimuli [24,25]. These methods enable consistent comparison among participants but also influence perception through framing, sequencing, and viewpoint selection [8], emphasising visual composition more than embodied experience.
Virtual reality (VR) offers a partial compromise, combining controlled exposure with interactive navigation [26,27]. However, perceptual fidelity varies across devices, and differences in VR familiarity can influence comfort, attention, and descriptive language [28]. Comparative studies show that each elicitation modality produces distinct linguistic patterns: onsite interviews foreground sensory and emotional descriptors, images emphasise formal attributes, and VR highlights spatial geometry and sequence [27].
Recognising these modality effects is therefore essential when interpreting verbal data within a multi-modal VIAS framework. Our previous work [6] began addressing this challenge by demonstrating that NLP-based keyword extraction can reveal meaningful perceptual themes across different interview settings. However, that initial framework did not fully account for interviewer influence, participant verbosity, or modality-driven variation in the type of language participants produce.
Furthermore, temporary event spaces, targeted in previous work [6], provide an ideal context for advancing this multi-modal approach. The high visual complexity with dense displays, temporary structures, and constant shifting crowd flows generates varied descriptive language for NLP and produces spatial differentiation detectable in behavioural patterns [29]. Also, the temporal dynamism creates naturally distinct experiences, supporting comparisons between onsite, video-based, and VR-based interviews [30]. Besides, visitors navigate voluntarily, reflecting genuine spatial preference without the commercial or institutional pressures present in retail or workplace settings [31]. Finally, the cultural diversity typical of markets, festivals, and pop-up events supports cross-cultural linguistic analysis without requiring multi-site international studies [32]. Together, these characteristics make temporary event spaces optimal environments for extending our previous framework and validating an integrated, multi-modal VIAS methodology.
2.3. Data-Driven and NLP-Based Analysis of User Perceptions
The integration of AI and natural language processing (NLP) into the analysis of spatial perception was first explored in our earlier study [6], which demonstrated that combining NLP with spatial and visual data can yield quantitative indicators of user engagement in event spaces. In that work, generative AI tools [33,34,35,36,37] were used for keyword extraction and thematic clustering of interview transcripts, establishing the feasibility of a data-driven pipeline for evaluating temporary event settings.
At the same time, [6] highlighted several structural limitations of off-the-shelf keyword extraction methods when applied to conversational and multi-speaker interview data. Widely used approaches such as YAKE! [38], RAKE [39], and TextRank [40] are effective for general document-level analysis, but they were not designed to: (1) distinguish interviewer-prompted terms from participant-initiated themes; (2) account for per-participant verbosity differences in multi-person interview settings; (3) incorporate sentiment polarity so that positive and negative evaluations of the same keyword are weighted differently; or (4) normalize across interview modalities in which environmental context (e.g., on-site versus online) shapes how participants articulate their impressions.
Recent advances in keyword extraction and representation learning have begun to address sentiment sensitivity, contextualization, and discourse structure [41,42,43], reflecting a broader push to reduce interpretive bias and increase reproducibility in qualitative analysis. These developments are particularly pertinent to multi-person, multi-modal, and cross-cultural interview studies of architectural space, where linguistic variation, interviewer prompting, and ambient context can all distort naive frequency-based keyword statistics. Motivated by these gaps, the present work builds on [6] by introducing a participant-aware, sentiment-coupled weighting framework that is explicitly tailored to conversational interview data on spatial perception.
2.4. Opportunities and Challenges of Multi-Modal Frameworks
The preceding sections identified three major limitations that undermine the verbal dimension of the VIAS framework: (1) architectural perception language is semantically abstract and context-dependent, (2) verbal responses vary systematically across elicitation modalities, and (3) existing approaches lack mechanisms for validating verbal descriptions against behavioural and visual evidence. Together, these issues restrict the ability of VIAS to link measurable spatial properties to the subjective language users generate when describing architectural experience.
First, architectural perception language relies on abstract, polysemous descriptors such as spatial flow, visual rhythm, or layered depth that lack clear physical referents and are poorly represented in general-purpose NLP. Standard keyword and topic-modelling techniques, such as TF-IDF [44], LDA [45], or embedding-based approaches like BERTopic [46], perform best with large, homogeneous datasets and frequent word occurrence. Interview datasets are small and linguistically varied, meaning semantically related expressions such as mysterious, intriguing, or hidden depth often appear too sparsely to be recognised as a coherent perceptual theme. Sentiment analysis provides polarity information [47] but cannot identify which spatial qualities generate those sentiments.
Second, multi-modal elicitation introduces systematic variation unrelated to perception itself. On-site interviews, video-based elicitation, and VR walkthrough each create distinct perceptual conditions: embodied movement, third-person observation, and simulated immersion. These differences shape participants’ vocabulary, the perceptual qualities they notice, and the emotional tone of their descriptions. Empirical findings show, for example, that onsite participants emphasise sensory and atmospheric aspects, whereas video-based participants rely heavily on spatial composition parameter [48]. Without methods to normalise modality effects, comparisons across groups risk conflating perceptual differences with methodological artefacts.
Third, verbal data require validation through independent behavioural and visual evidence. If interviewees describe an area as inviting, comfortable, or visually engaging, corresponding behavioural patterns, longer dwell times, higher stopping frequency, and exploratory movement should be observable through tracking studies [49,50]. Consistency across modalities and cultures further strengthens interpretive validity, while divergence identifies context-specific perceptual tendencies [11].
These considerations reveal a methodological gap within VIAS: while visual analysis is supported by robust, standardised tools, verbal analysis remains fragmented, culturally uneven, and sensitive to elicitation context. To function as an integrated perceptual framework, VIAS requires a scalable approach that preserves semantic nuance, accounts for sentiment, adjusts for verbosity, and normalises modality and cultural variation. The algorithm developed in this study operationalises these requirements and extends VIAS toward a unified, multi-modal understanding of spatial perception.
3. Methodology
This section outlines the four-stage integrated approach used in this study to examine VIAS, as depicted in Figure 1. The framework exemplifies the convergence of data science and architectural design methodologies by transforming behavioural and linguistic data into spatially interpretable insights.
The proposed framework consists of four stages. Stage-1, Behaviour and Perception Design, examines spatial behaviour and visual perception through observations, behaviour mapping, and questionnaires conducted at a monthly morning market in Matsue, Japan, evaluating three stall layouts, three visibility levels, and four advertising strategies across on-site, video, and virtual environments. Stage-2, Multi-Modal Interviews, captures subjective impressions via on-site, video-based, and virtual interviews with 16 participants (10 native and 6 non-native Japanese), enabling analysis of cultural and contextual differences. Stage-3, Integrated Analysis, forms the core methodological contribution of this study. In this stage, interview transcripts are processed through an NLP-driven pipeline that performs structured keyword detection, cross-linguistic normalisation, and sentiment-aware weighting. The adaptive weighting model further incorporates participant-specific verbosity correction, repetition decay, and polarity coupling to prevent dominance by verbose speakers and to ensure that positive, neutral, and negative mentions contribute proportionally. This stage establishes a quantitative bridge between linguistic expression and spatial–behavioural evidence, enabling cross-modal and cross-cultural comparison with analytical rigour. Stage-4, Cross-Model Validation, triangulates behavioural, linguistic, and cultural evidence through modality comparison and native–non-native analysis, linking quantitative results with qualitative design reasoning for evidence-based spatial evaluation. This stage validates linguistic priorities against behavioural patterns and translates sentiment-weighted findings into actionable architectural strategies.
3.1. Setting of Temporary Event Space
The study examines Imagine Coffee Morning Market, a monthly event in Matsue, Japan, designed to cultivate morning coffee culture among younger residents. The market operates as a platform for local small businesses attempting to revive regional products and traditions through contemporary retail formats. The event features a straightforward spatial arrangement: eight vendor stalls positioned outdoors and two indoor shops anchored by a coffee roastery. Established coffee vendors collaborate with rotating pop-up retailers (5–6 vendors changing monthly), many operated by young entrepreneurs seeking to establish new ventures in the region. The event functions on a community-curated model where pop-up vendors offer products and services (flowers, books, baked goods, artisan crafts) selected to complement the Sunday morning market concept. Each two-hour session draws 20–30 participants, creating an accessible entry point for emerging businesses while establishing regular social routines centred on speciality coffee and curated local offerings [51]. This format supports neighbourhood revitalisation by connecting commercial activity with community-building, appealing to residents seeking contemporary urban experiences rooted in local context. The event maintains active engagement through social media platforms, where monthly announcements communicate upcoming schedules, introduce participating vendors, and showcase featured products [52]. This digital presence extends the event’s reach beyond physical attendance, building anticipation and enabling potential visitors to preview stall offerings and discover local products before arrival.
As a single case study, this recurring event provides consistent spatial conditions (identical plaza layout, comparable vendor density, and stable demographic participation) while allowing longitudinal observation across multiple iterations. The modest scale proves methodologically advantageous: unlike large festivals where crowd dynamics dominate individual behaviour, the controlled visitor volume enables comprehensive movement tracking, detailed spatial documentation, and extended participant interviews. This environment supports the multi-layered data collection required for integrated analysis, including behavioural video capture, precise virtual reconstruction (see Figure 2), and systematic examination of how specific design variables influence perceptual responses.
3.2. Stage-1: Behavior and Perception Design
The architectural analysis focuses on spatial configurations controlled by the designer (stall owner and event organiser). Drawing on foundational spatial perception theory (Section 2.1), this analysis examines three key categories of designer-controlled physical properties: Stall Layout, Placement and Visibility, and Advertise Strategy.
3.2.1. Stall Layout (SL)
This factor is first regulated by organizer but is controllable by the vendors to deliberately manipulate within their designated stall periphery to shape the visual-spatial experience. The spatial analysis examines the spatial arrangement of temporary event core elements, such as tents, tables, and display shelves.
Three layout typologies emerged from systematic observation: SL1 places the display table at the front of the designated area, establishing immediate visual accessibility; SL2 extends display elements slightly beyond the designated boundary, creating visual complexity and suggesting progressive discovery; and SL3 incorporates additional furniture and preparation elements at the back, introducing hierarchical spatial organisation and visual depth (as depicted in Figure 3). Among the 10 stalls, SL1 (5 stalls) dominated, reflecting vendors’ preference for configurations requiring minimal setup complexity compared to SL2 (3 stalls) and SL3 (2 stalls).
3.2.2. Stall Visibility
This factor is related to the placement of the stall according to organizer decideion, which also impact on visual accessibility. Drawing on on-site observation, we documented visitor stationary spots and gathering patterns over two-hour periods. Three visibility levels emerged: PV1 (least visible) characterises locations with minimal direct sightlines from main access paths; PV2 (moderately visible) indicates positions accessible from primary circulation routes but not commanding immediate attention; and PV3 (most visible) designates prominent locations that function as visual landmarks within the event space (as depicted in Figure 4). Most outdoor stalls achieved PV2 classification, while the corner-positioned first stall attained PV3 status due to its commanding position at the main street interface. Conversely, the indoor zone received PV1 classification since the main store selling coffee is located there, suggesting that perceptual outcomes depend on environmental context, a finding consistent with VIAS theory, emphasising how contextual factors beyond designer control influence experience.
3.2.3. Advertise Strategy (AS)
This is the only factor entirely based on vendors’ deliberate manipulation of visual communication elements to capture visitor attention and shape affective response. These strategies represent a specific dimension of compositional control, ranging from minimal intervention from AS0 to AS3 (as depicted in Figure 5).
AS0 is the initial setup provided by organisers only, used by 1 stall. AS1 employs minimal advertising through text-based banners displaying product information and pricing, establishing basic informational legibility without additional visual complexity. This strategy, adopted by 7 stalls, prioritises functional communication over aesthetic elaboration. AS2 introduces moderate visual enrichment through the addition of product images, branded signage, or simple decorative elements alongside textual information. This configuration increases compositional complexity while maintaining coherence, balancing visual richness with organisational clarity as fundamental to aesthetic preference. AS3 represents the most elaborate approach, incorporating multiple signage types, three-dimensional display structures, lighting elements, and interactive components that create layered visual information and invite progressive discovery. This strategy, requiring the greatest vendor investment in both materials and spatial organisation, was employed by 1 stall and reflects an attempt to maximise the attractiveness, distinguishability, and memorability within the event environment. These three analytical dimensions (Stall Layout, Visibility, and Advertise Strategy) constitute the systematically documented physical-visual properties that vendors control. However, consistent with VIAS theory, the perceptual outcomes of these design decisions remain fundamentally uncertain, subject to individual interpretation, cultural background, and contextual factors. A stall employing AS3 strategy with prominent signage and complex display (high visual complexity) may elicit descriptions of "engaging variety" from some visitors but "overwhelming clutter" from others, both representing genuine subjective impressions yet suggesting contradictory design implications.
3.3. Stage-2: Multi-Modal Interview Data Collection
Data collection employed three complementary phases designed to capture different perceptual dimensions of the same spatial environment:
3.3.1. Phase 1: On-Site Observation and Initial Interviews (August 2024)
Systematic mapping documented spatial configurations (Layout, advertise banner, placement and positions). Concurrent video recording captured visitor movement patterns, dwell times, and engagement behaviours across multiple event iterations. One on-site interview was conducted in Japanese using structured questions based on three topic of Physical Element, Activity and Atmosphere [6] to identify which spatial attributes and behaviors spontaneously attracted participant attention, informing subsequent interview development. Initial impressions were collected through brief, in-person interviews (~5 minutes each) conducted directly during event attendance. This approach captured authentic, real-time reactions reflecting participants’ immediate sensory and emotional engagement; however, such on-site settings often produce mild positive bias due to the festive atmosphere and social desirability effects [6,53,54]. Data were obtained from eleven native participants, comprising both visitors and stallholders, forming the empirical baseline for comparison with subsequent video-based and virtual-environment interview modalities (see Appendix A).
3.3.2. Phase 2: Post-Event Video-Based Interviews and Virtual Interview with native and non-native (November-December 2024)
Eight participants was interviewed using free-form discussions in English. Participants were shown uncut video recordings of the event, capturing the complete spatial configuration and dynamic visitor movement. Each interview session (average duration ≈ 16 minutes) systematically examined both spatial comprehension and affective response, emphasizing aspects such as layout legibility, display clarity, perceived safety, and overall comfort. This video-based approach minimises atmospheric and social influences often present in on-site surveys while preserving the richness of visual information. It enables participants to evaluate spatial composition, advertisement visibility, and crowd flow patterns more critically and objectively.
Then, following the analysis of the video interview feedback, 3D virtual reconstructions were developed incorporating the design modifications suggested by participants, such as improved signage placement, enhanced visibility of child-friendly zones, and optimised stall arrangement. Rendered walkthrough videos were generated with camera angles matching the original event footage and presented to the same participants (average duration ≈ 12.5 minutes). This stage enabled validation of the proposed design adjustments and assessment of participant-reported preferences through controlled virtual spatial manipulation.
3.3.3. Phase 3: Video-based and Virtual Environment Interviews with only native (August–October 2025)
Another 8 participants were invited to a similar setting of video-based and virtual environment interview. This time, interviews were conducted in Japanese using a structured format organised around Physical Elements, Activities, and Atmosphere categories. This phase captured culturally-specific perceptual vocabulary while ensuring systematic coverage of key spatial dimensions. In addition to our prior cross-lingual analysis [6], the new dataset of interviews with only native speakers focused on culturally contextualised perceptions using detailed and structured question prompts. The detailed list of translated interview prompts used in the native speaker dataset is provided in Appendix Table A2, while representative examples of video interview data and corresponding participant evaluations are summarised in Appendix C. A summary of the virtual interview dataset and evaluation results is included in Appendix C.
To address the language bias and single-modality limitations of [6], participant feedback was systematically collected through three interview contexts with deliberate cultural diversification. In total, the study involved 16 participants across two cohorts: 8 hybrid (native and non-native) participants from the original study [6] (interviewed in English) and 8 newly recruited native participants (interviewed in Japanese by a native speaker). This design enables direct cross-cultural comparison while controlling for language-mediated interpretation effects.
Participants were stratified by: nationality (native/non-native), gender (male/female), parental status (has children/no children), age group (below 40/40 and above), and residential duration in Matsue (long-term/short-term residents). This stratification enables assessment of how demographic and cultural factors influence spatial perception patterns.
This multi-phase approach extracts maximum information from the single event case study by layering complementary data types (spatial documentation, behavioural observation, English verbal descriptions, and Japanese verbal descriptions) that together provide a comprehensive understanding of how controllable spatial properties relate to both observable engagement patterns and cultural variable verbal articulations.
3.4. Stage-3: NLP Backed Integrated Data Interpretation
Aligned with the integrated workflow illustrated in Figure 1, this stage connects linguistic feedback with behavioural analytics to interpret spatial perception patterns. Interview transcripts were processed through a structured NLP pipeline consisting of keyword extraction and categorisation, sentiment-aware weighting, and cross-modal validation.
3.4.1. Keyword Detection and Categorisation
Keyword candidates were generated using the ChatGPT-5 API with category-specific prompts and validated through morphological tokenisation (MeCab for Japanese, spaCy for English). Semantically similar terms were clustered into unified parent concepts (e.g., “colourful,” “vibrant,” “eye-catching” become “visual appeal”), reducing redundancy and facilitating cross-linguistic aggregation. The resulting taxonomy supports both fine-grained and overall trend analyses. Section 4 details the process.
3.4.2. Sentiment-Aware Weighting
Sentiment-aware weighting was incorporated to mitigate repetition bias and interviewer influence previously identified in [6]. Each keyword-containing utterance was classified by sentiment polarity and weighted according to speaker role and interview modality. The detailed sentiment classification procedure, weighting strategy, and cross-modal validation results are presented in Section 5, where the impact of social desirability and modality-driven bias is quantitatively evaluated.
3.5. Stage-4: Multi-Modal Interview Analysis Design
Stage-4 of the proposed framework focuses on structured cross-modal comparison to validate how interview context influences verbal spatial evaluation. Responses collected from onsite, video-based, and virtual-environment interviews were analysed using a common set of quantitative indicators, enabling systematic comparison across modalities under identical spatial conditions.
The analysis included responses from 11 onsite participants, 8 video interview participants, and 8 virtual-environment participants. These descriptors provide a comparative overview of the datasets generated under each interview modality, with methodological details described in Section 3.3 and further sentiment analysis explained in sub-Section 4.4, and Section 5.1.4 within Section 5.
3.6. Design Interpretation Modality Effects
In Stage-4, the objective is twofold: (i) to identify and control for modality effects, the systematic differences in verbal evaluation induced by the interview context (onsite, video, virtual) rather than by spatial qualities alone, and (ii) to support design interpretation by translating validated linguistic evidence into actionable architectural insights. In practice, modality effects are examined through cross-modal sentiment reclassification and response profiling (Section 4.4; Table 4; Figure 11), along with modality-specific keyword distributions and category-level aggregation (Table 5; Figure 12). These validated outputs provide the empirical basis for synthesising recurring spatial priorities and deficiencies, which are subsequently interpreted as design-relevant implications in Section 6.
4. NLP-Driven Data Interpretation with Sentiment-Aware Weighting
Building on our earlier data-driven spatial analysis of temporary event spaces in Matsue, where we introduced an adaptive keyword weighting algorithm for multi-person interviews [6], we now improve the underlying NLP layer to better capture how participants talk about event spaces. In the previous framework, interviewer and interviewee utterances were merged and keyword importance was regulated by a simple frequency-based scaling function that compressed raw counts into a narrow weight range shared by all speakers. While this approach successfully reduced extreme frequency bias at the keyword level and ensured that no single term dominated the analysis, it remained agnostic to who was speaking, how sentiment was expressed,and how often the same person repeated a concept over the course of an interview. In particular, the model (i) treated concise and highly verbose participants identically, (ii) did not differentiate between positive and negative mentions of the same keyword, and (iii) ignored conversational structure such as repetition order or utterance density, which can inflate scores for talkative respondents and underrepresent more concise speakers. To address these limitations, the present study develops an NLP-driven weighting framework (Stage-3 in the integrated framework) that explicitly models repetition decay, sentiment polarity, and participant-specific verbosity, providing a transparent bridge between qualitative interview data and quantitative spatial design decisions.
This section presents a comprehensive weighting methodology for analyzing qualitative interview data extracted from the spatial perception study, incorporating sentiment-aware classification and adaptive weighting mechanisms. The full methodological workflow is illustrated in Figure 6. We begin with a baseline fixed-parameter algorithm that applies uniform decay rates and polarity coupling to mitigate repetition bias and avoid domination by frequently repeated terms. Decay rates refers to the parameter that determines how quickly the weight or influence of repeated keywords decreases with each additional occurrence, thereby preventing repetitive mentions from disproportionately affecting scoring.Polarity coupling refers to the mechanism that scales each keyword’s weight according to the sentiment polarity of the utterance. Strongly positive statements contribute full weight, neutral expressions contribute partial weight, and negative responses suppress or nullify credit, preventing misleading inflation from repeated but negative remarks.Analysis of initial results reveals verbosity imbalances where highly verbal participants disproportionately influence aggregate keyword distributions. Verbosity imbalance occurs when participants who produce longer and more frequent utterances receive disproportionately higher aggregate weights, not due to richer semantic content but simply because of their verbosity. This bias inflates scores for highly verbal individuals while underrepresenting concise speakers. To address these limitations, we introduce an adaptive per-participant weighting scheme that personalises decay rates based on individual verbosity patterns, incorporates sentiment modifiers, and normalises by utterance count. Utterance count refers to the total number of distinct spoken units produced by a participant during an interview. Normalising by utterance count prevents highly verbal individuals from disproportionately influencing aggregate keyword weights. Comparative evaluation demonstrates that the adaptive approach achieves a more balanced representation across diverse communication styles while maintaining methodological transparency and interpretability.
Finally, we evaluate how sentiment influences the overall weighting behavior and interpretive outcomes within this section.
4.1. Baseline Fixed-Parameter Algorithm
In Stage-2, Phase 2 (cf Section 3.3.2), the eight interview participants (P1–P8) represented a balanced demographic group comprising four males and four females, with an equal split between married and unmarried individuals. Two of the married participants (P7 and P8) had children, providing variation in household responsibilities and life-stage perspectives. Although these demographic variables were not directly encoded in the weighting model, they offer important contextual grounding for interpreting variability in keyword emphasis, sentiment expression, and spatial concerns across individuals.
We applied the baseline algorithm to the dataset comprising 8 participants and 17 questions across four topic categories: information, activity, impression, and NA (general). The baseline fixed-parameter algorithm computes keyword weights using a uniform decay rate, fixed per-mention bounds, polarity coupling, and a repetition cap, without adjusting for participant verbosity. All participants share identical weighting parameters (e.g., , , ), resulting in a simple and interpretable scoring scheme that nonetheless amplifies verbosity imbalance in longer interviews. Here denotes the full weight assigned to the first mention of a keyword, specifies the decay applied to each subsequent repetition, and caps the number of repetitions that contribute to the score. Together, these fixed parameters form the baseline weighting scheme by controlling initial credit, redundancy suppression, and repetition limits.
Polarity scores were manually assigned based on the semantic content of each response. Strongly positive or affirmative statements (e.g., "I want to participate", "Absolutely") were assigned , while moderately positive expressions (e.g., "Seems enjoyable", "Pretty good") received . Neutral or uncertain responses (e.g., "Sort of", "Not quite sure") were given , and moderately negative remarks (e.g., "Not really", "A bit lacking") were assigned . Strongly negative or denying statements (e.g., "Won’t go", "Can’t") were assigned . Certainty weights were uniformly set to 1.0 since all transcripts were manually verified.
4.1.1. Sample Weight Calculation
Table 1 illustrates how the baseline algorithm computes weights for Participant 1 across selected questions. The interviewer’s questions (speaker flag ) contribute zero weight, while participant responses are weighted based on repetition order and polarity.
The table demonstrates three key algorithm features. First, interviewer utterances are systematically excluded regardless of content (). Second, repetition decay progressively reduces credit: the first mention receives full weight (), the second receives 75% (), and the third receives 50% (). Third, negative polarity nullifies credit: in Question 6, Participant 1’s third response expressing unwillingness to attend in the rain received , yielding zero weight despite being the participant’s utterance. This prevents verbosity from inflating scores when sentiment contradicts the keyword.
4.1.2. Aggregated Results by Category
Figure 7 presents the event-level weighted scores for each topic category, computed as . The normalized scores reveal that participants engaged actively across all categories, with the NA category achieving perfect engagement (1.00) and the impression category showing slightly lower engagement (0.81), likely reflecting more critical or neutral responses about event improvements.
Figure 8 shows substantial variability across participants under the baseline algorithm. Participant 7 (married with children) achieved the highest total normalized score (0.81), contributing extensive weighted content across all categories. In contrast, Participant 5 contributed the least (0.49), reflecting shorter responses and more neutral or negative sentiment. The mean normalized score across all participants was 0.62, indicating moderately high engagement overall.
4.1.3. Key Observations and Identified Limitations
Overall, the baseline results demonstrated high engagement across all categories, with normalized scores exceeding 0.80, indicating active discussion across information, activity, and impression domains. The activity category produced the highest raw score (26.75), highlighting participants’ focus on experiential factors such as child-friendliness and sensory appeal. Variation among participants was evident, as married respondents with children (Participants 7 and 8) contributed higher weighted scores, particularly in impression-related feedback about event improvements. Lower aggregate scores in questions on danger perception and participation intent reflected the impact of negative polarity, where negative responses contributed zero weight despite verbosity. The repetition-decay mechanism further reduced redundancy by halving weights on third mentions (), while interviewer prompts () were neutralised to prevent bias from guided questioning.
However, analysis revealed a critical limitation: verbosity imbalance. Participant 7’s score (0.81) was 65% higher than Participant 5’s (0.49), partly due to differences in response length rather than content quality. Verbose participants with 12-14 mentions per category received disproportionately high aggregate weights under the uniform decay rate (), while concise participants with 4-6 focused mentions were underrepresented. This motivated the development of an adaptive weighting scheme.
4.2. Adaptive Per-Participant Weighting
The baseline algorithm revealed an important limitation: verbose participants who spoke more frequently received disproportionately higher scores, not because their content was necessarily richer, but simply because they produced more utterances. To correct this verbosity imbalance, we developed an adaptive weighting approach that personalizes the scoring for each participant according to their individual speaking style.
In this adaptive formulation, the decay rate is no longer fixed at for all participants. Instead, it is adjusted dynamically so that participants who mention keywords with high frequency receive a steeper decay rate, causing repeated mentions to lose weight more quickly, whereas concise participants who speak less frequently receive a gentler decay rate that preserves more credit for their focused contributions. In addition, we incorporate a sentiment-based amplification factor that slightly increases the score for strongly positive utterances and reduces it for negative ones, preventing participants from accumulating inflated scores merely by repeating keywords in unfavorable contexts. Finally, the overall score for each participant is normalized by their total speaking volume to ensure that a participant who speaks twice as often does not automatically receive double the weight. This integrated adjustment enables a more equitable and content-sensitive scoring process across diverse communication styles.
4.2.1. How the Adaptive System Works
The adaptive weighting process follows these steps for each participant:
Figure 9 provides an overview of the adaptive keyword weighting pipeline, illustrating how the system integrates participant verbosity, personalized decay rates, sentiment scaling, and normalization into a unified scoring process. Building on this structure, the following steps detail the sequential operations applied to each participant.
Step 1: Determine verbosity level. We first count how many total keyword mentions each participant made across all categories. Participants are then classified on a spectrum from "concise" to "verbose" based on their total mention counts.
Step 2: Assign personalized decay rate.
Based on each participant’s verbosity level, a personalized decay rate is assigned to regulate how quickly the weight of repeated keyword mentions diminishes. Concise participants, who contribute fewer mentions, receive a lower decay rate (approximately 0.15–0.20), allowing their repetitions to retain more weight. Participants with moderate verbosity are assigned a mid-range decay rate around 0.25, while highly verbose individuals receive a higher decay rate (approximately 0.30–0.35), causing their repeated mentions to lose influence more rapidly. For example, Participant 7, a married respondent with children, produced 12 mentions related to “children” in the activity category and was classified as verbose, resulting in a decay rate of 0.32. In contrast, Participant 5 produced only five focused mentions and was assigned a lower decay rate of 0.18, reflecting their concise contribution style.
Step 3: Calculate base weights with personalized decay. Using each participant’s custom decay rate, we calculate weights for their keyword mentions just like in the baseline algorithm, but now the rate at which credit decreases varies by person. The first mention still receives full weight (1.0), but subsequent mentions decrease according to each person’s individualized decay rate.
Step 4: Apply sentiment adjustment.
After calculating the base score, a sentiment multiplier is applied to adjust the influence of each participant’s responses. For every category, the overall sentiment of a participant’s utterances determines the scaling factor: strongly positive responses increase the score by multiplying it by 1.2, neutral responses leave the score unchanged with a multiplier of 1.0, and negative responses decrease the score through a multiplier of 0.8. This sentiment coefficient () is intentionally conservative, providing a modest correction that incorporates affective tone without overwhelming the underlying weighting structure.
Step 5: Normalize by utterance count. Finally, we adjust each participant’s score based on their total number of utterances (spoken responses). We use a normalization exponent of 0.5, which means we take the square root of their utterance count and divide their score by this value. This partial normalization balances between completely ignoring verbosity (, which would be unfair to concise speakers) and completely equalizing everyone (, which would ignore genuine differences in engagement).
4.2.2. Implementation Parameters
The adaptive algorithm was implemented using the following parameter settings, selected to match the characteristics of our interview dataset: an initial weight of consistent with the baseline model; a minimum weight floor of , ensuring that sufficiently repeated mentions eventually contribute no additional credit; a personalized decay rate range from to assigned to each participant; a limit of counted repetitions, matching the baseline configuration; a sentiment coefficient of allowing a 20% adjustment range; and a normalization exponent of , which applies partial normalization based on the square root of each participant’s total utterance count. This scalable range still requires further investigation to determine the most optimized parameter set for dataset-specific applications.
The decay rate for each participant was calculated by determining where they fell on the spectrum from least verbose (minimum mentions) to most verbose (maximum mentions), then proportionally assigning a decay rate within the 0.15–0.35 range.
4.3. Comparative Analysis
This part compares the baseline and adaptive weighting algorithms to evaluate how sentiment-aware decay and verbosity normalization influence keyword importance and participant balance. By examining changes in individual and aggregate scores, we assess whether the proposed adaptive scheme yields fairer and more interpretable representations of verbal spatial impressions.
4.3.1. Impact of Adaptive Weighting on Keyword Scores
Table 2 shows how the adaptive algorithm affected weight distribution for the four most frequent keywords among selected participants. The comparison shows scores under both the baseline algorithm (uniform , no normalisation) and the adaptive algorithm (personalised between 0.15–0.35, with sentiment adjustment and partial normalisation).
The results reveal several important patterns. First, verbose participants (P1, P2, P7) saw their weights reduced by 5–12% under the adaptive scheme. This correction prevented their higher speaking volume from disproportionately inflating their influence. Second, P5, who was the most concise speaker, received modest increases of 2–10% for most keywords, ensuring their focused contributions weren’t undervalued. Third, the mean scores across all participants decreased slightly (4–8%), indicating the adaptive algorithm successfully redistributed weight more equitably rather than simply amplifying everyone.
The "children" keyword in the activity category provides a particularly illustrative example. Under the baseline algorithm, P7 (married with children) received the highest weight of 2.75 after making 12 mentions across multiple questions. The adaptive algorithm reduced this to 2.51 (an 8.7% decrease) by applying a higher decay rate of 0.32 to P7’s extensive discussion. Meanwhile, Participant 5’s weight increased from 1.25 to 1.38 (a 10.4% increase) despite having made only 5 mentions, because the lower decay rate of 0.18 preserved more credit for their focused but less frequent contributions.
4.3.2. Effect on Participant Balance
Figure 10 visualizes the adaptive algorithm’s impact on overall participant scores within the impression category. This category was chosen for illustration because it showed the most pronounced verbosity imbalance under the baseline approach.
Under the baseline algorithm, Participant 7’s impression score of 3.2 was 68% higher than Participant 5’s score of 1.9, despite both participants expressing substantive feedback about event improvements. This gap primarily reflected P7’s higher speaking volume (14 impression-related utterances) rather than fundamentally richer content. The adaptive algorithm narrowed this gap: P7’s score decreased to 2.9 (a 9.4% reduction) through application of the higher decay rate of 0.32, while P5’s score increased slightly to 2.0 (a 5.3% increase) with the protective decay rate of 0.18. The resulting 45% gap still respects genuine differences in engagement level while removing the artificial inflation from verbosity alone.
Similarly, Participant 6 saw their score decrease from 3.0 to 2.9, and Participant 1 from 2.8 to 2.6, as both had made 10–12 utterances in this category and received moderately elevated decay rates. Participant 3, who maintained consistent brevity across all categories, saw no change in their score (2.1), as their moderate speaking volume placed them at the baseline decay rate.
4.3.3. Top Weighted Keywords by Category
After applying adaptive weighting, Table 3 highlights the five highest-weighted keywords in each category. The information category centres on seasonal stalls such as shaved ice and flower shops, indicating interest in diverse vendor types. The activity category is dominated by child-related terms, reflecting a widely shared view that family-friendly features are insufficient, alongside notable mentions of couples and seating availability. In the impression category, goldfish scooping and requests for more shops capture both nostalgic expectations and practical improvement needs. General responses emphasise a welcoming, casual atmosphere that makes the event easy to visit. These rankings reflect the adaptive model’s corrections, ensuring that prominent keywords represent broad agreement rather than the influence of more talkative participants.
These results reveal clear priorities across participant responses. In the information category, "shaved ice shop" (12.48) emerged as the most discussed amenity, mentioned enthusiastically by 6 of 8 participants as a desirable summer attraction. "Flower shop" (10.92) and "hot snacks" (9.36) followed, indicating interest in diverse vendor types.
The activity category was dominated by "children/child-friendly" (17.00), reflecting widespread concern about limited entertainment for families. This keyword appeared in responses from 7 participants, including both parents (P7, P8) and non-parents, suggesting broad recognition of this gap. "Couples" (11.56) ranked second, with several participants noting the event’s romantic evening atmosphere, while "seating/benches" (10.40) highlighted comfort concerns.
In the impression category, "goldfish scooping" (11.70) topped the list as the most frequently requested addition, mentioned by 4 participants as a classic summer festival activity currently missing. "More shops needed" (10.14) captured general feedback about limited vendor variety, while "seating area" (9.60) and "food variety" (8.58) reflected practical improvement suggestions.
The NA (general) category revealed the event’s strengths: "casual visit" (8.84) and "welcoming atmosphere" (8.32) indicated that participants appreciated the low-pressure, approachable nature of the event despite its small scale. "Easy to drop by" (7.28) reinforced this accessibility theme, particularly valued by local residents (6.76).
Importantly, these rankings reflect the adaptive weighting corrections. Under the baseline algorithm, several keywords received inflated weights due to repetitive mentions by verbose participants. The adaptive approach ensured these rankings better represent genuine consensus across diverse communication styles rather than amplifying the voices of the most talkative respondents.
4.4. Sentiment Reclassification Procedures
To correct for repetition bias and interviewer influence identified in [6], all Japanese keyword-containing utterances were reclassified using GPT-5.1, which was configured to replicate the same rule-based, lexicon-guided (SentiWordNet), and contextual criteria employed in the original hybrid pipeline. Although GPT-5.1 did not use SentiWordNet or sentence-BERT internally, it followed their decision logic to ensure methodological consistency. Dual annotation on 20% of the dataset yielded high inter-rater reliability. Weighted scores were computed by integrating sentiment polarity, speaker role, and modality type (onsite, video, virtual), with interviewer utterances excluded from attribution but used to calibrate short participant responses. Figure 11 and Table 4 present the resulting sentiment distribution across modalities.
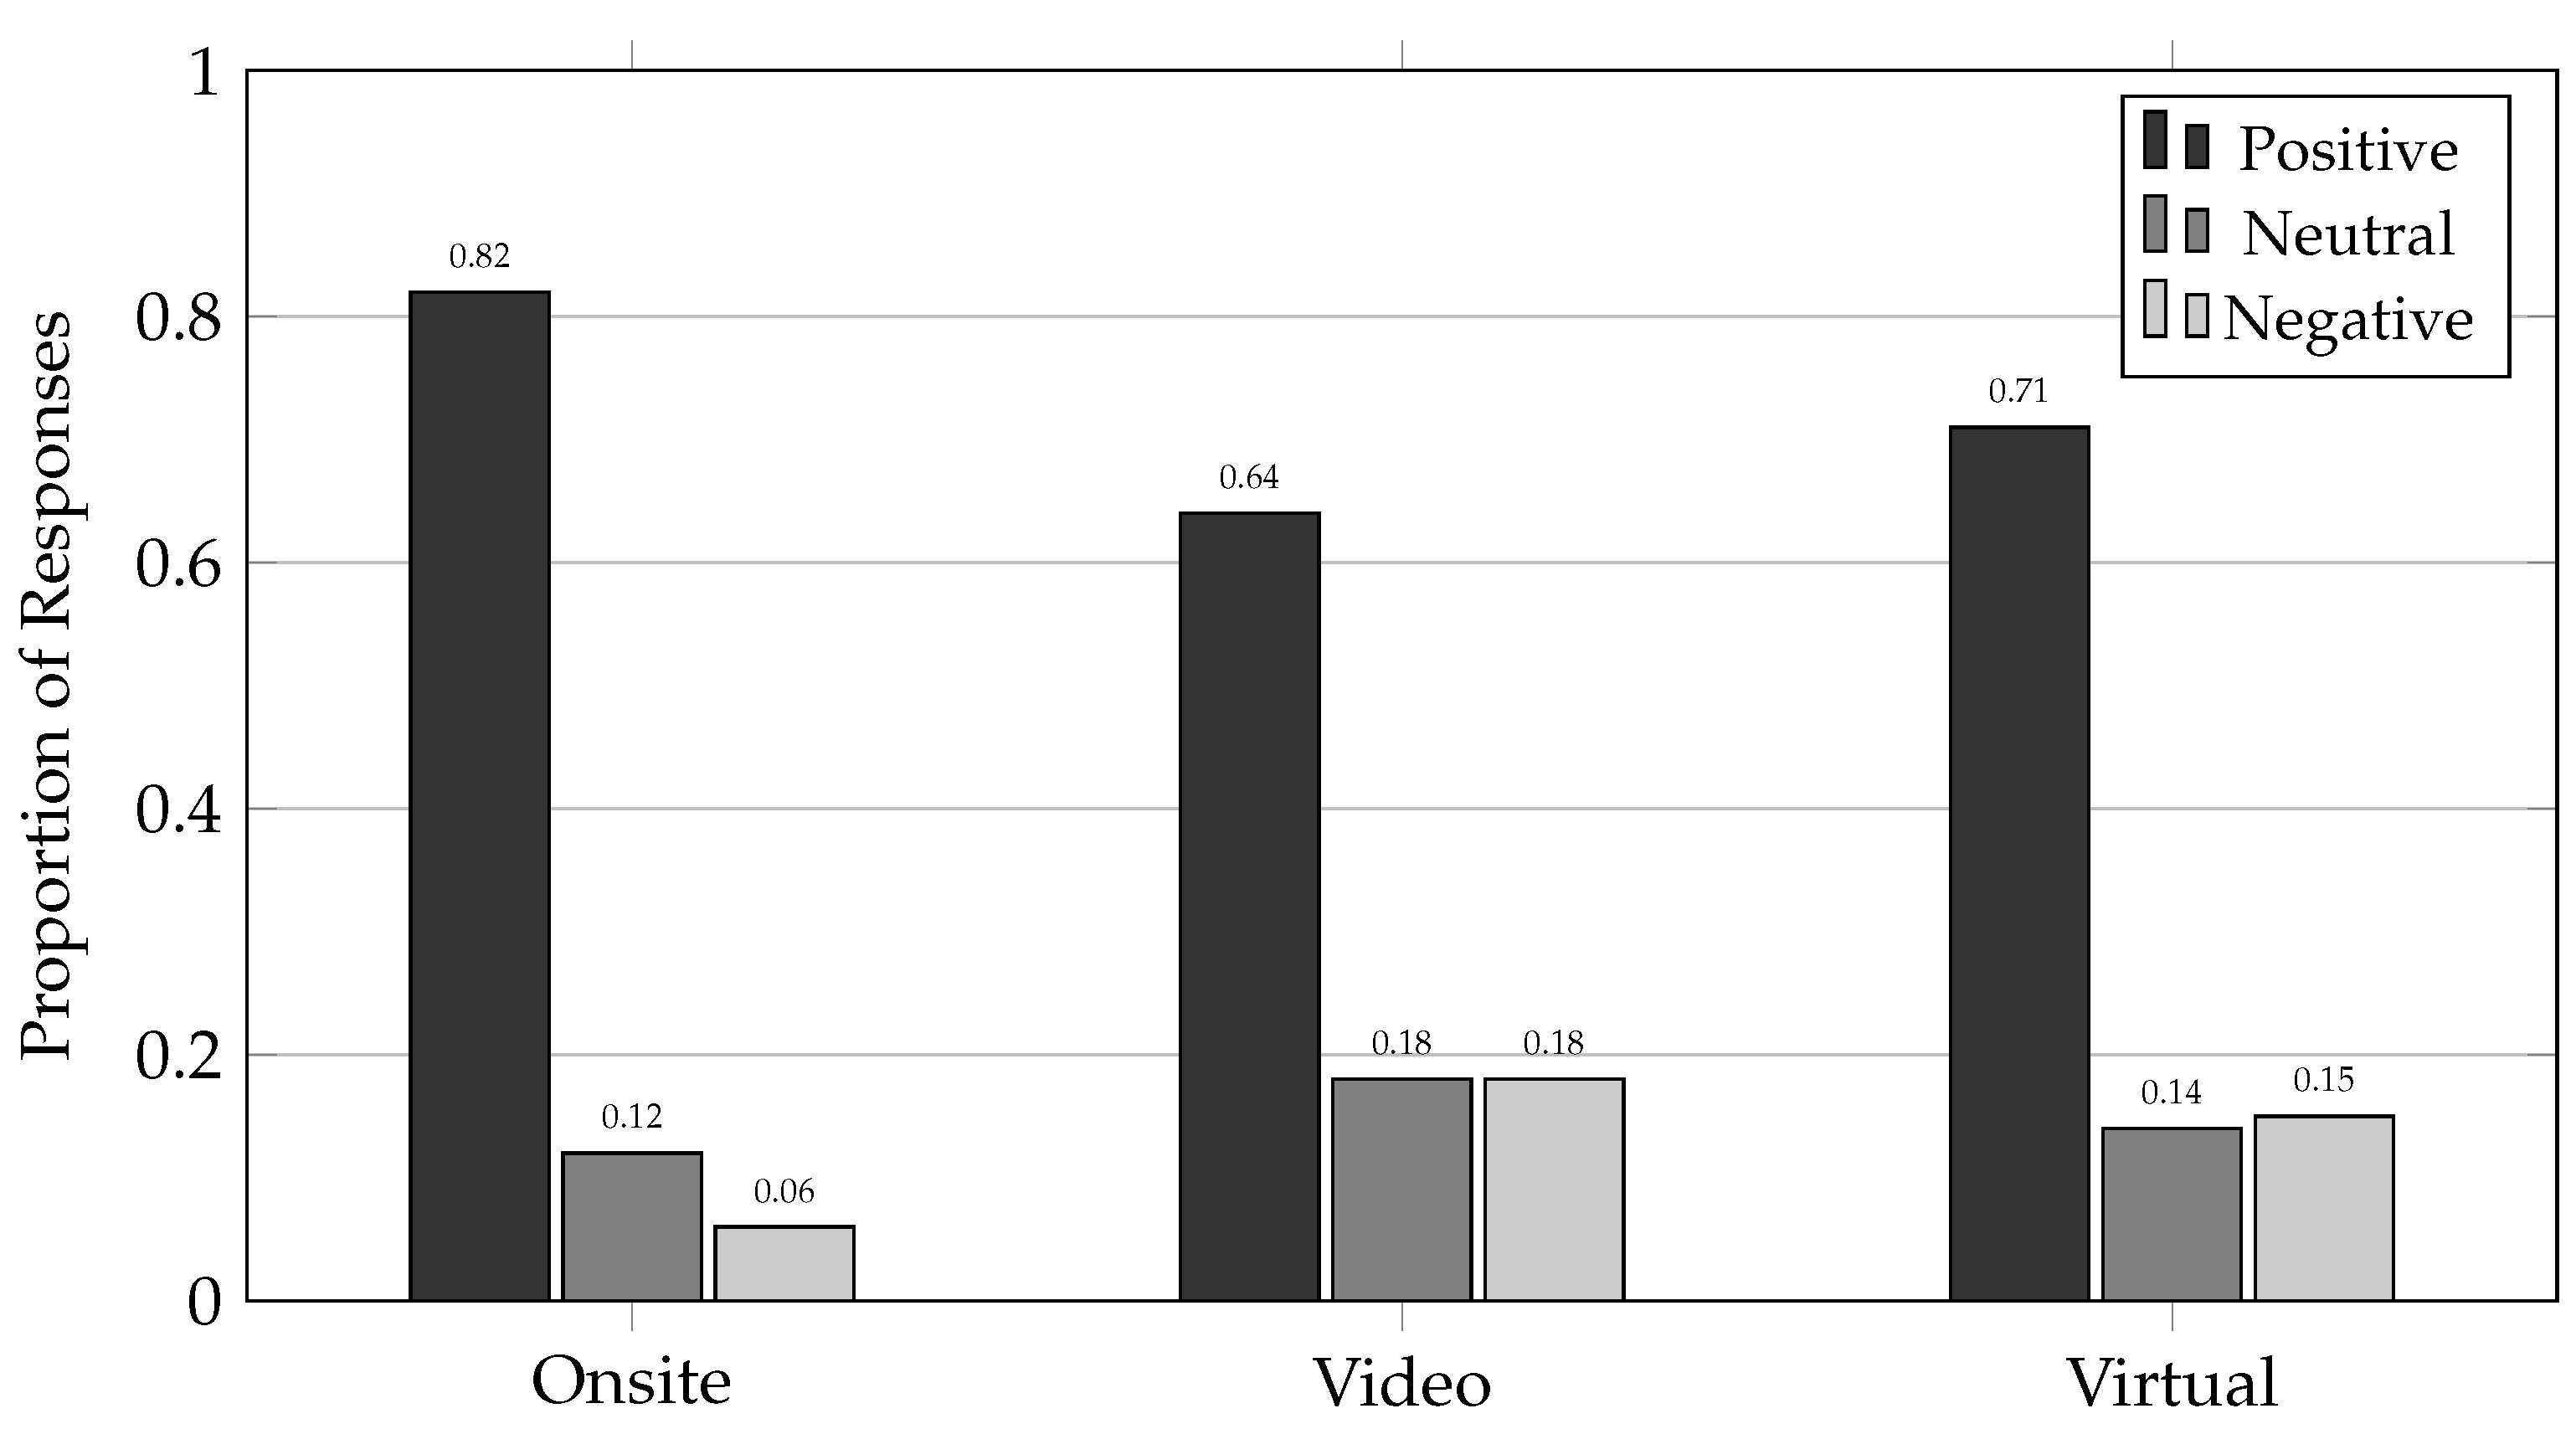
Figure 11.
Sentiment distribution across interview modalities. On-site interviews showed the highest positive sentiment (82%), reflecting social desirability bias in the event atmosphere, while video interviews exhibited more critical evaluation (18% negative sentiment).
Figure 11.
Sentiment distribution across interview modalities. On-site interviews showed the highest positive sentiment (82%), reflecting social desirability bias in the event atmosphere, while video interviews exhibited more critical evaluation (18% negative sentiment).

Table 4.
Response Characteristics Across Interview Modalities.
| Characteristic | Onsite | Video | Virtual |
|---|---|---|---|
| Total participants | 11 | 8 | 8 |
| Average response length (words) | 12.4 | 38.7 | 42.3 |
| Questions per participant | 8–12 | 17 | 9–12 |
| Average interview duration (min) | 5.2 | 16.0 | 12.5 |
| Positive sentiment ratio | 0.82 | 0.64 | 0.71 |
| Negative sentiment ratio | 0.06 | 0.18 | 0.15 |
| Neutral sentiment ratio | 0.12 | 0.18 | 0.14 |
| Unique keywords extracted | 47 | 142 | 98 |
| Keywords per participant | 4.3 | 17.8 | 12.3 |
Onsite interviews demonstrated markedly higher positive sentiment (82%) compared to video (64%) and virtual (71%) contexts. This pattern confirms the social desirability effect noted in prior work [6], where in-person interviews during festive events tend to suppress critical feedback. Video interviews, conducted in neutral settings with extended time for reflection, enabled more balanced and critical evaluation, yielding 18% negative sentiment compared to only 6% onsite.
To enable modality-level linguistic comparison, adaptive sentiment-weighted keyword scores were computed separately for each interview context. The highest-weighted keywords for each interview are summarised in Table 5. These modality-specific keyword sets serve as comparative inputs for subsequent validation and interpretation.
Table 5.
Top 8 Keywords by Interview Modality (Adaptive Weighted).
| Onsite | Video | Virtual | |||
|---|---|---|---|---|---|
| Keyword | Weight | Keyword | Weight | Keyword | Weight |
| easy to notice | 8.2 | children | 17.0 | visible shops | 6.8 |
| suitable | 7.8 | seating area | 10.4 | seating space | 6.5 |
| yes/positive | 7.5 | goldfish scooping | 11.7 | rest space | 5.9 |
| 5.4 | flower shop | 10.9 | appropriate | 5.7 | |
| parking | 4.1 | shaved ice | 12.5 | families | 5.3 |
| signage | 3.9 | more shops | 10.1 | local products | 4.8 |
| vegetables | 3.6 | safety | 8.3 | community | 4.6 |
| relax | 3.2 | atmosphere | 8.0 | entrance | 4.2 |
4.4.1. Modality-Specific Keyword Distributions
In addition to keyword-level comparison, category-level aggregation was performed to examine how different interview modalities distribute attention across thematic dimensions. Figure 12 presents normalised weighted scores across four predefined categories.
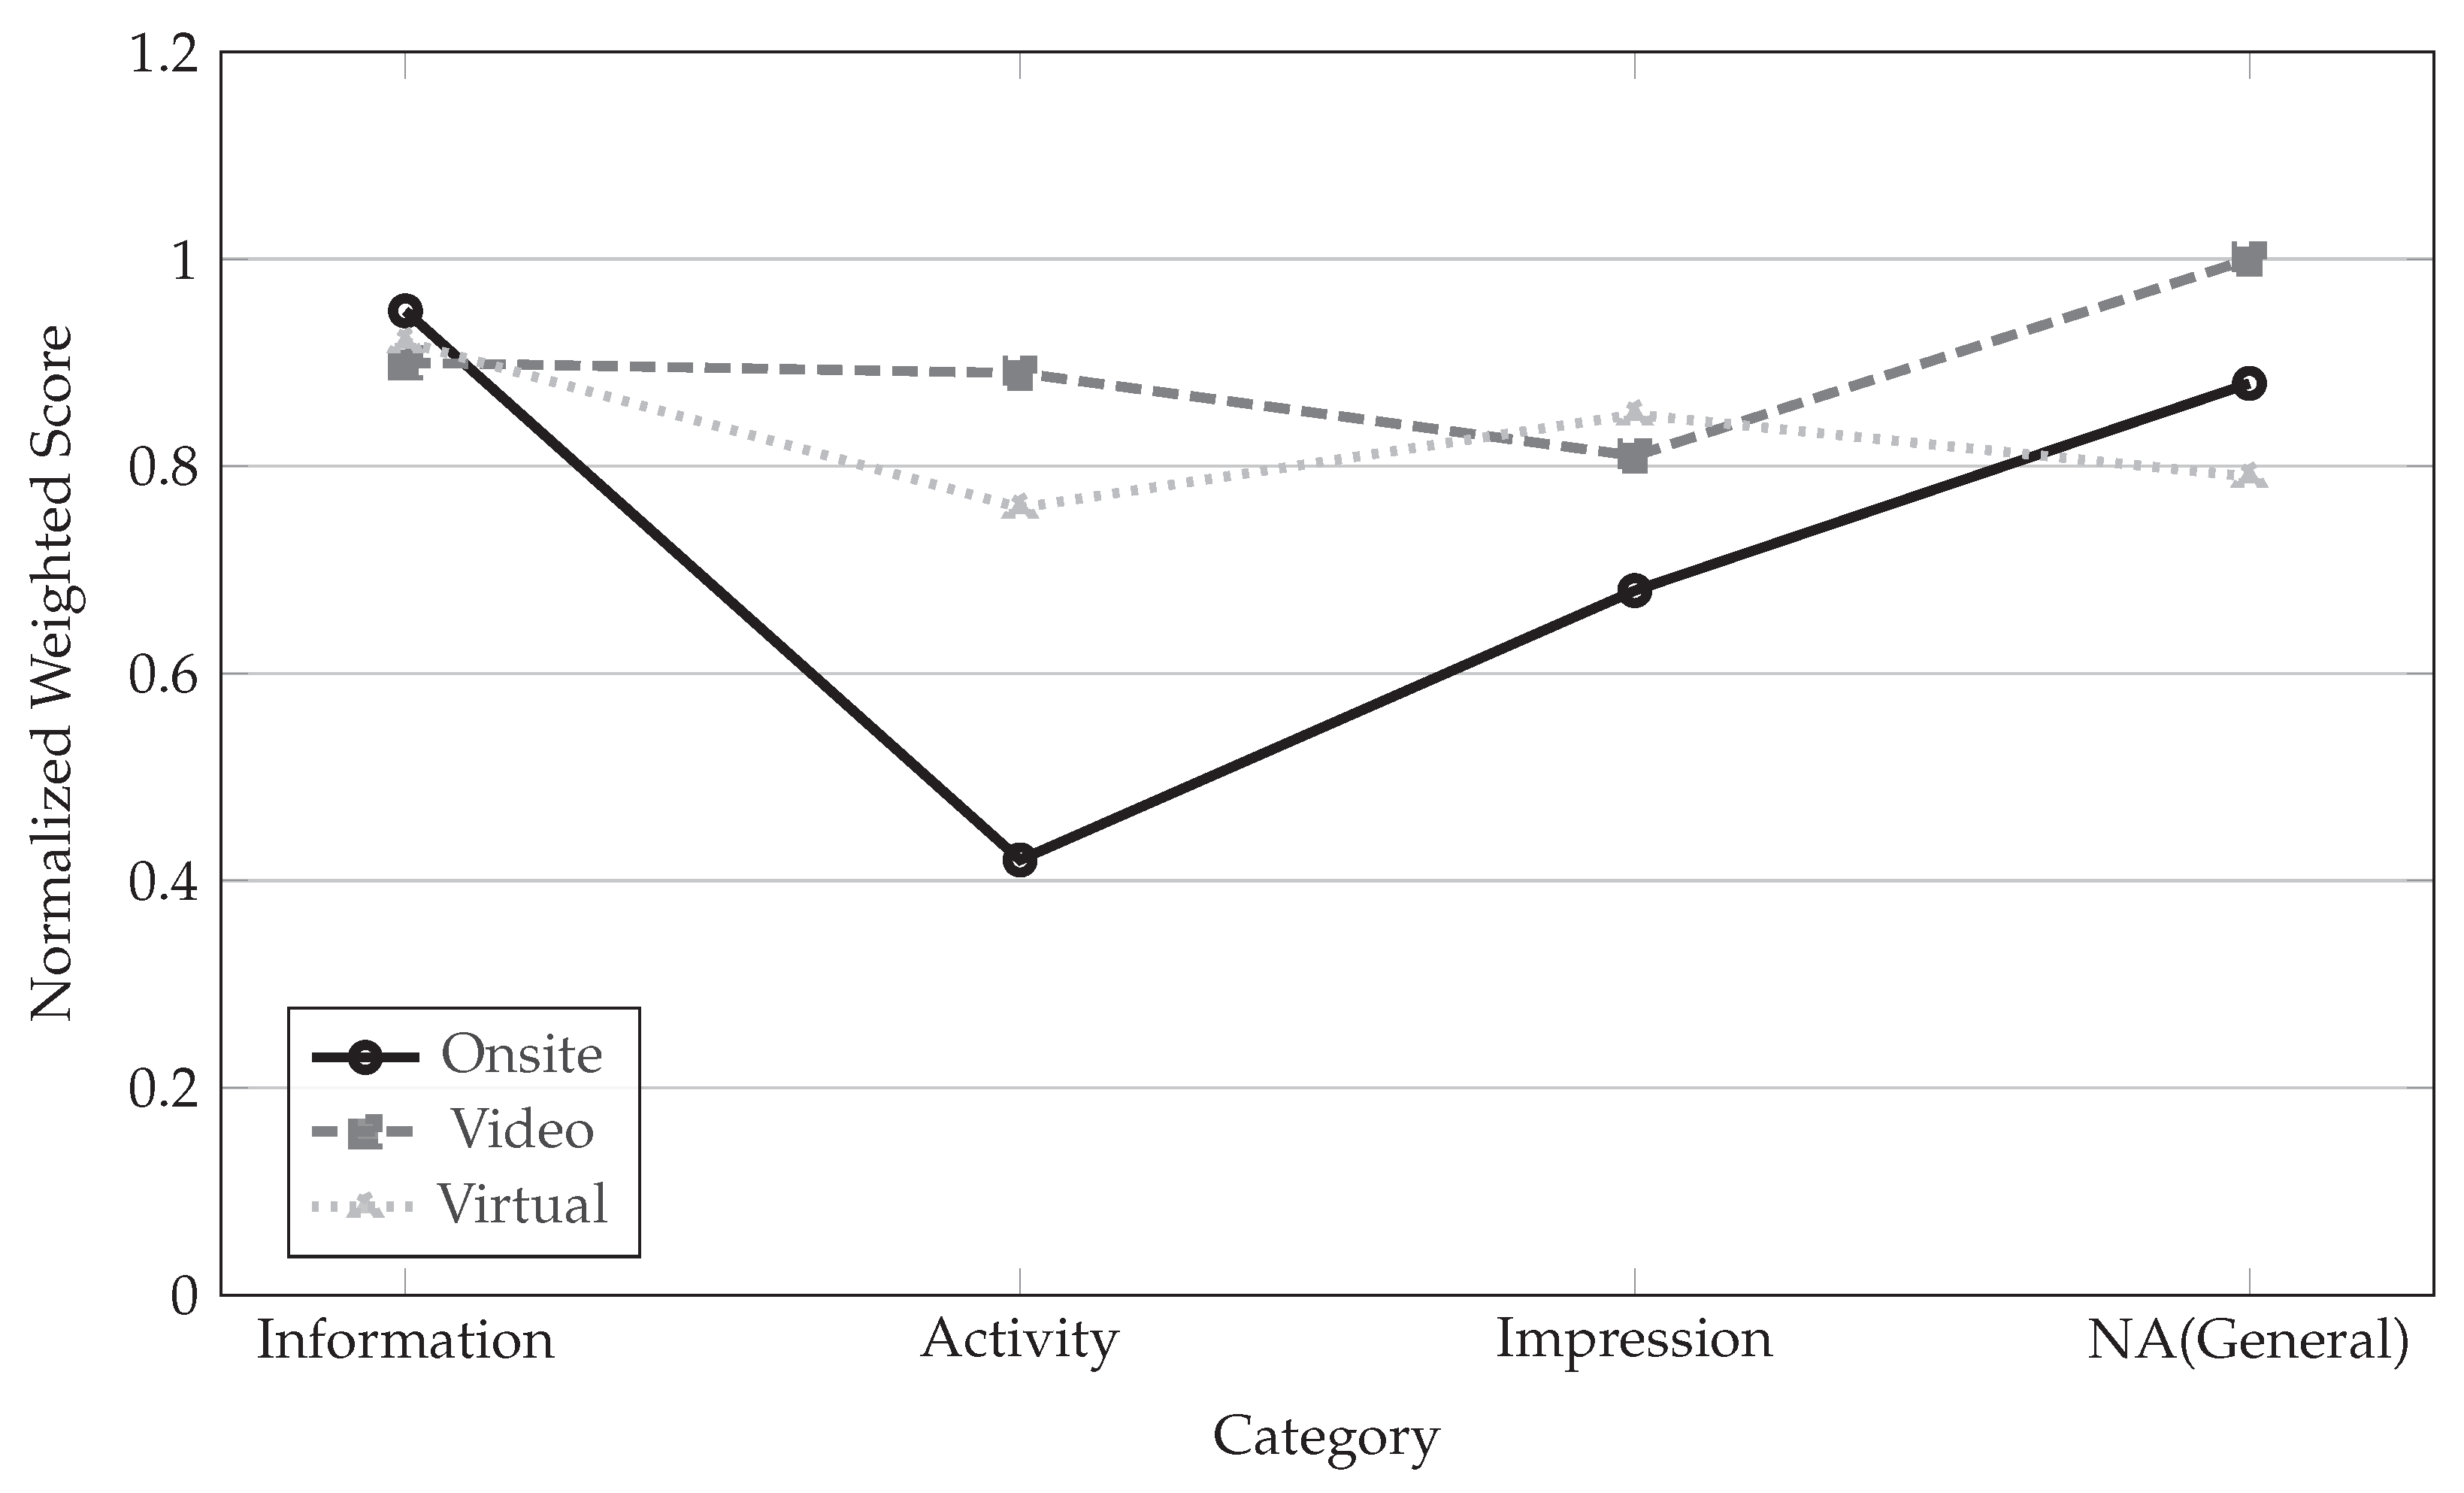
Figure 12.
Category-level normalised weighted scores across interview modalities.
5. Language and Questionnaire Structure Effects on Verbal Spatial Evaluation
Building on the baseline and adaptive weighting algorithms introduced in the previous section, this section examines how linguistic context and questionnaire structure shape the extraction and interpretation of verbal impressions (Stage-4 in Figure 1). While the earlier analysis demonstrated how frequency regulation and sentiment coupling improve robustness at the algorithmic level, the present section investigates cultural comparison of the methodological foundations that precede weighting, specifically: (1) how native-language interviewing reduces uncertainty and lexical fragmentation and (2) how fixed questionnaire phrasing constrains topic drift and clarifies turn-taking patterns. By contrasting native-language interviews (Phase 3 in Section 3.3.3) with mixed-language interviews (Phase 2 in Section 3.3.2) explored in [6] , and structured question formats with free-form conversation, we clarify the extent to which observed performance gains arise from the proposed adaptive algorithm versus improvements inherent to linguistically stable data collection. This provides a transparent bridge between qualitative elicitation protocols and quantitative sentiment-aware keyword scoring.
5.1. Linguistic and Structural Influences on Verbal Responses
Despite sentiment and verbosity differences, consistent findings emerged across all three interview modalities. Participants in every context praised the overall welcoming and relaxed atmosphere, confirming the event’s positive social tone. However, recurring spatial issues were also identified: insufficient seating was frequently mentioned, particularly in video interviews where 75% of participants raised the concern, while the lack of child entertainment facilities appeared in 18% of onsite, 88% of video, and 38% of virtual responses. Signage visibility problems were likewise noted across modalities, suggesting a genuine design limitation rather than a context-dependent artefact. These convergent observations highlight shared experiential priorities that transcend modality effects.
5.1.1. Interview Protocol Differences
P1 employed unstructured English interviews with mixed-nationality participants, where both interviewers and interviewees were non-native English speakers (cf Section 3.3.2). This resulted in linguistic inconsistencies, conversational repairs, and unbalanced turn-taking ratios. P2 addresses these issues through structured Japanese questionnaires administered by native interviewers to Japanese participants (cf Section 3.3.3), achieving a near 1:1 turn balance and consistent phrasing. Both studies share identical onsite interviews (cf subSection 3.3.1) as the reference condition.
5.1.2. Dataset Characteristics
Table 6 compares the five datasets across both studies. Native-language sessions (P2) demonstrate longer, more coherent responses with stable sentiment distributions, while non-native English sessions (P1) show fragmented utterances and higher variability.
5.1.3. Enhanced Weighting Function
To address the limitations observed in P1 (specifically the inflation of interviewer-prompted keywords, inconsistent sentiment strength, and modality-dependent bias), the enhanced weighting function in P2 integrates several conversational and contextual factors into a unified scoring framework. Only participant-generated utterances are credited, and each keyword mention is adjusted according to its sentiment strength so that clearly positive evaluations receive full weight, neutral remarks contribute proportionally less, and negative responses are assigned no weight. To prevent verbose participants or repeated clarifications from dominating the distribution, each subsequent mention of the same keyword is progressively down-weighted through a repetition-decay mechanism. Cross-lingual fairness is maintained through a language-proficiency factor, which preserves full credit for native Japanese interviews while slightly reducing weight in non-native English exchanges where hesitation or repair sequences may distort expression. A modality coefficient further corrects for known contextual influences: video-based interviews, which promote reflective evaluation, retain full weight; virtual-environment interviews receive a moderate reduction; and onsite interviews receive the strongest reduction to counter the positivity bias associated with festive atmospheres. Together, these adjustments create a more reliable and culturally robust weighting system that suppresses interviewer influence, balances verbosity differences, and yields stable keyword distributions across languages, interview modalities, and participant communication styles.
5.1.4. Measured Improvements
The P2 framework yields four key enhancements: (1) reduced sentiment variance across modalities (±0.05 vs. ±0.13 in P1), (2) neutralised onsite affirmative bias through sentiment gating, (3) 30% increase in unique keywords with fewer interviewer intrusions, and (4) balanced category attribution (Information 0.90, Activity 0.89, Impression 0.81).
By controlling for native-language proficiency and structured questioning, P2 provides a linguistically robust framework that eliminates artefacts from the previous mixed-language protocol [6] while maintaining direct comparability with the same event dataset.
5.2. Questionnaire Structure and Turn-Taking Stability
Beyond language proficiency, the structure of the questionnaire plays a decisive role in the quality and interpretability of verbal responses. In P1, interviewers relied on loosely guided English prompts, resulting in irregular topic progression, interviewer-led digressions, and conversational repairs that inflated turn counts without increasing semantic content. These unstructured exchanges made it difficult to determine whether a keyword emerged organically or was implicitly prompted.
In contrast, P2 employed a fixed Japanese questionnaire with standardised phrasing and consistent sequencing across participants. This structure constrained topic drift, reduced interviewer intrusions, and produced highly stable turn-taking patterns. Participants responded directly to each prompt, enabling clearer attribution of perceptual keywords to specific questions and minimising ambiguity in sentiment scoring. The uniformity of question structure also facilitated cross-participant comparison and strengthened the reliability of downstream keyword weighting.
6. Architectural Implications and Spatial Design Outcomes
This section translates the findings of the multi-modal VIAS framework (Figure 1) into practical guidance for architectural and spatial design. The analysis reveals a persistent gap between the physical properties designers control and the perceptual language users employ. By integrating evidence from behavioural observation in Stage-1 (Section 3.2, adaptive keyword weighting in Stage-3 (Section 4), and cross-modal sentiment analysis Stage-4 (Section 5), the framework moves spatial evaluation from anecdotal interpretation toward an evidence-based practice. The implications below are structured around the three main objectives highlighted in the introduction (cf Section 1), demonstrating how computational findings translate into evidence-based design methodology.
6.1. From Controlled Variables to Validated Experience
The first objective of this study was to integrate NLP-based verbal analysis with established VIAS theory to bridge designer-controlled physical properties and user perception. Section 3.2 documented three spatial variables: Stall Layout (SL1-SL3), Placement Visibility (PV1-PV3), and Advertise Strategy (AS0-AS3). However, the perceptual outcomes remained uncertain; the same AS3 configuration could elicit "engaging" or "cluttered" descriptions. This ambiguity is not a failure of design, but a fundamental characteristic of spatial perception that the VIAS framework is built to diagnose.
The key implication for designers is the necessity of a validation loop. The framework provides a method to test how specific configurations actually perform perceptually. By pairing the objective documentation of spatial variables with sentiment-aware linguistic analysis, designers can build a nuanced catalogue of which configurations reliably produce intended impressions and which introduce unpredictable perceptual noise. This moves design decision-making from intuition toward calibrated intervention. The adaptive weighting algorithm (Table 3) revealed which spatial qualities generated consistent priority across participants. In the Information category, "shaved ice shop" (w=12.48) and "flower shop" (w=10.92) represented vendor types that reliably attracted positive attention. The Activity category showed "children/child-friendly" (w=17.00) dominating feedback, with 7 of 8 participants mentioning it despite only 2 having children themselves. This cross-demographic consistency validates child-friendly space as a genuine design priority rather than a niche concern, demonstrating how the framework enables systematic testing of whether specific configurations reliably align design intent with user perception.
6.2. Interpreting Language with Analytical Rigour
A core contribution of this study is the adaptive weighting algorithm developed in Section 4.2, which addresses a critical flaw in using raw interview data. The initial, frequency-based analysis inflated the influence of verbose participants. The corrected algorithm, which applies sentiment polarity and repetition decay, revealed a different priority hierarchy. The strongest weighted needs, such as “children/child-friendly” (w = 17.0) and “seating/benches” (w = 10.4), were not simply the topics most frequently mentioned, but those expressed with consistent emphasis between participants when verbosity bias was removed.
For design practice, this means that conventional post-occupancy surveys or workshop feedback, which often prioritise the volume of comments, can be misleading. The VIAS methodology demonstrates that thematic importance must be weighted by expressive emphasis and corrected for participant verbosity. Under baseline weighting, Participant 7’s score (0.81) was 65% higher than Participant 5’s (0.49), primarily reflecting speaking volume rather than content quality (Figure 8). The adaptive model reduced this gap to 45% by applying personalised decay rates ( for P7, for P5). This correction changed priority rankings: the ’children’ keyword decreased from w=2.75 to w=2.51 for the verbose parent participant, while increasing from w=1.25 to w=1.38 for the concise non-parent participant (Table 2).The design response to a loudly stated but neutrally felt opinion should differ from the response to a quietly stated but strongly felt need. The framework equips designers to make this distinction, ensuring that limited resources address the most significant experiential gaps, not just the most vocal ones.
6.3. Accounting for Linguistic and Cultural Variation in Spatial Evaluation
The second objective examined how linguistic proficiency and cultural background influence spatial articulation. Table 6 reveals systematic differences between native Japanese (P2) and mixed-language English (P1) interviews. Native sessions produced longer, more coherent responses (73.4 chars vs 11.8 words average) with 30% more unique keywords (142 vs 112). Cross-linguistic analysis revealed perceptual emphasis differences: native participants emphasised holistic spatial atmosphere keywords ("welcoming atmosphere" w=8.32, "casual visit" w=8.84 in Table 5), whereas international participants in the previous study [6] identified discrete visual focal points and compositional elements. This pattern aligns with established cross-cultural perception research [11,12,13] showing native participants favour contextual integration while non-native emphasise focal object identification.
For designers, audience composition determines which spatial qualities require emphasis. Spaces serving primarily local users should prioritise atmospheric coherence and ambient qualities that support a holistic experience. Spaces attracting international visitors require stronger visual hierarchy, discrete focal points, and an explicit wayfinding, the compositional clarity that supports analytic perception patterns. The framework’s cross-linguistic weighting enables designers to identify which spatial priorities are culturally shared versus culturally specific.
6.4. Framework Integration: From Evidence to Design Decision
The integrated framework provides a complete evidence chain linking spatial documentation, weighted linguistic priorities, and cross-modal validation.
- Stage-1 documents designer-controlled variables.
- Stage-3 weights participant-generated priorities while correcting for verbosity and sentiment bias.
- Stage-4 validates priorities across modalities and cultures.
For the Matsue event, this chain produces actionable findings with multiple layers of evidence. The keyword "children/child-friendly" (w=17.00, Table 3) demonstrates this integration. It appeared consistently across 7 of 8 participants regardless of parental status (Section Table 3), in both native and non-native cohorts (cross-cultural validation), and across all three modalities with increasing specificity: onsite interviews mentioned the lack of play features, video interviews detailed safety concerns, and virtual interviews validated proposed child zones (convergent validity across Section 4.4 and Section 5.1). This multi-layered evidence, rather than simple frequency counts, justifies resource allocation toward child-friendly infrastructure. The framework systematises insight without automating design. Computational analysis identifies what users prioritise (weighted keywords), how strongly across demographics (normalised scores), and in which contexts priorities emerge (modality effects). Designers retain responsibility for how these priorities manifest physically: the materiality, cultural appropriateness, and aesthetic integration that computational methods cannot determine. This division of labour makes evidence-based design scalable: the framework handles systematic bias correction and pattern identification, freeing designers to focus on creative synthesis, technical resolution, and contextual judgment essential to architectural practice.
7. Conclusions
This study advanced the Visual Impression in Architectural Space (VIAS) framework by operationalising the integrated four-stage workflow in Figure 1 on a temporary event space in Matsue, Japan. By linking designer-controlled spatial variables, behavioural observation, and multi-modal interview data, the framework demonstrated how visual attractors such as stall layout, visibility, and advertising strategy can be evaluated through sentiment-aware linguistic evidence rather than designer intuition alone.
Methodologically, we proposed an adaptive NLP-based weighting pipeline that combines personalised repetition decay, sentiment polarity coupling, and verbosity normalisation to extract more reliable perceptual themes from multi-speaker interviews. Comparative analysis showed that this approach mitigates interviewer influence and verbosity bias, rebalances keyword weights across participants, and stabilises cross-modal comparisons between onsite, video-based, and virtual interviews.
Empirically, the results revealed systematic modality and cultural effects. Onsite interviews tended to over-emphasise festive atmosphere and positive affect, while remote modalities produced more balanced critique of signage clarity, seating provision, and child-friendly amenities. Cross-linguistic comparison further indicated that native participants foregrounded overall spatial atmosphere, whereas international participants focused on discrete visual focal points. Taken together, these findings show that sentiment-weighted, modality-aware analysis can uncover both shared priorities and culturally specific expectations in temporary event spaces.
Author Contributions
TBA.
Funding
This research was funded by OBAYASHI FOUNDATION grant number Research 2023-40-105.
Institutional Review Board Statement
Not applicable.
Informed Consent Statement
The authors have obtained informed consent from all participants involved in the interviews and related data collection for this research. Participants who took part in on-site visitor interviews, video interviews, and virtual environment interviews have given their consent for their provided data to be used in this study.
Data Availability Statement
The interview data, including videos and images used in this study, can be made available upon request to the corresponding author for non-commercial academic research, verification, and validation purposes. Please contact the corresponding author directly via the provided email for access to the data.
Acknowledgments
The authors would like to express their sincere gratitude to all associated personnel, including event organizers, stall owners, interview participants, Ochiai Wooden workshop and the Matsue City public, for their valuable support and facilitation for the conduct of this research. The authors are also grateful to the OBAYASHI FOUNDATION and Shimane University for providing the funding and research facilities necessary to conduct this study. Additionally, special thanks go to the students of Khang’s Laboratory for their tremendous cooperation and assistance throughout the research process.
Conflicts of Interest
The authors declare no conflicts of interest.
Conflicts of Interest
The authors declare no conflicts of interest. The funders had no role in the design of the study; in the collection, analyses, or interpretation of data; in the writing of the manuscript; or in the decision to publish the results.
Abbreviations
| AI | Artificial Intelligence |
| NLP | Natural Language Processing |
| EV | Event |
| P | Participant |
| SL | Stall Layout |
| PV | Product Visibility |
| DS | Display Strategy |
| GPT | Generative Pre-trained Transformer |
| MDPI | Multidisciplinary Digital Publishing Institute |
| DOAJ | Directory of Open Access Journals |
| TLA | Three-Letter Acronym |
| LD | Linear Dichroism |
Appendix A. Summary of On-Site Interviews
The on-site interview dataset consists of short (~5 min) interactions conducted directly during event attendance. This modality captures authentic, real-time impressions but tends to include mild positive bias arising from the festive atmosphere and social desirability. A total of 11 native participants contributed to this baseline set used for comparison with remote interview modalities.
Table A1.
Condensed summary of on-site interview data.
| Attribute | Description |
|---|---|
| Interview duration | Approximately 5 minutes per participant. |
| Participants | 11 native respondents (6 female, 5 male), ages 20–60. |
| Interview focus | Immediate spatial impressions, perceived comfort, child-friendliness, and stall visibility. |
| Common findings | Participants reported high approachability of stalls, moderate heat-comfort concerns, and limited child-play features. |
| Frequent improvement themes | Additional dining areas, shaded resting zones, and clearer signage orientation. |
| Data availability | Full transcripts and native originals are available upon request (contact: khang.ntr@riko.shimane-u.ac.jp). |
Representative excerpts of participant responses (paraphrased for brevity):
- “More dining space would make it easier to relax.”
- “Children enjoy seeing stalls but lack space to play.”
- “Instagram photos match reality, but signage could be clearer on site.”
These concise, real-time responses provided the perceptual baseline for evaluating neutrality and depth in the subsequent video-based and virtual-environment interviews.
Appendix B. English Translation of Japanese Interview Questions
The following table presents the English translation of the twenty-one interview questions used in the Japanese-language video interview dataset. These prompts were designed to assess participants’ spatial comprehension, emotional response, perceived safety, and overall engagement toward the event space.
Table A2.
English translation of the Japanese interview questions.
| No. | Question |
|---|---|
| 1 | Can you clearly identify all of the shops? |
| 2 | Are the pop-up displays and other visual features easy to see? |
| 3 | When watching the video, was there any shop you wanted to visit? Why? |
| 4 | Can you imagine the season or time of day based on the information about the shops and locations? |
| 5 | Does this look like a place that would be enjoyable to visit with children? |
| 6 | Is there anything or any area that feels dangerous? Why? |
| 7 | Does this look like a place you could enjoy with all five senses? |
| 8 | Can you predict the general flow or movement route of visitors? |
| 9 | Which type of visitors do you think would enjoy this place the most? |
| 10 | What could make this place more attractive? |
| 11 | If you could add one more shop, what kind would you choose? |
| 12 | Would you like to participate in this event? If so, who would you like to go with? |
| 13 | What are the good and bad aspects of the shop lineup, and why? |
| 14 | If you were the organizer, what would you change and why? (not limited to shops) |
| 15 | If you were to rank the places or shops you would like to visit, what would the order be and why? (not limited to shops) |
| 16 | If you happened to pass by this event, would it be easy to join in? |
| 17 | Would it be easy to participate alone? |
Appendix C. Summary of Video and Virtual Interview Datasets
The following tables summarise the datasets used for both the video-based interviews and the virtual environment interviews. Each entry corresponds to transcribed and sentiment-annotated responses from native participants.
Appendix C.1. Video-Based Interview Dataset
Table A3.
Summary of the video-based interview dataset.
| Attribute | Description |
|---|---|
| Recording content | Full-length event video showing spatial configuration, stalls, and visitor movement. |
| Interview duration | Average 16 minutes per participant. |
| Participants | 8 Japanese adults (4 male, 4 female), ages 20–55. |
| Focus themes | Layout legibility, product visibility, perceived safety, child-friendliness, and spatial comfort. |
| Output format | Transcribed utterances with sentiment scores and categorized keywords (Japanese). |
| Data availability | See Supplementary File (contact: khang.ntr@riko.shimane-u.ac.jp) for the original interview content. |
Appendix C.2. Virtual Environment Interview Dataset
Table A4.
Summary of the virtual environment interview dataset.
| Attribute | Description |
|---|---|
| Environment type | 3D reconstruction of the original event space based on participant feedback. |
| Interview duration | Average 12.5 minutes per participant. |
| Participants | Same as the video-based cohort (8 individuals). |
| Evaluation focus | Validation of proposed design improvements and perceptual comparison with the original event. |
| Key features tested | Signage placement, stall arrangement, circulation routes, and family-area inclusivity. |
| Data availability | See Supplementary File (contact: khang.ntr@riko.shimane-u.ac.jp) for the original interview content. |
Appendix C.3. Sample Data Excerpt
Table A5 provides an illustrative excerpt showing how interview responses were processed into sentiment-weighted keyword entries, as described in Section .
This excerpt illustrates how the sentiment-weighted keyword algorithm differentiates between original and improved spatial settings, revealing participants’ evolving perceptions of comfort, clarity, and inclusivity.
Table A5.
Representative excerpt from the Japanese interview dataset (one participant).
| Mode | Excerpt (Translated) | Category | Sentiment () | Weight () |
|---|---|---|---|---|
| Video | “The stall arrangement looks easy to follow.” | Layout Legibility | 0.85 | 0.80 |
| Video | “The drink bar seems too crowded.” | Crowd Flow / Comfort | 0.35 | 0.25 |
| Virtual | “The added signboard makes it clearer for first-time visitors.” | Signage Visibility | 0.95 | 0.90 |
| Virtual | “The child area feels safer now.” | Child-Friendly Zone | 0.90 | 0.85 |
References
- Osgood, C.E.; Suci, G.J.; Tannenbaum, P.H. The Measurement of Meaning; University of Illinois Press: Urbana, IL, 1957. [Google Scholar]
- Bansal, G.; Chamola, V.; Hussain, A.; Guizani, M.; Niyato, D. Transforming Conversations with AI—A Comprehensive Study of ChatGPT. Cognitive Computation 2024, 16, 2487–2510. [Google Scholar] [CrossRef]
- OpenAI. ChatGPT-4, 2024. Accessed online.
- Chen, M.; Yuan, Q.; Yang, C.; Zhang, Y. Decoding Urban Mobility: Application of Natural Language Processing and Machine Learning to Activity Pattern Recognition, Prediction, and Temporal Transferability Examination. IEEE Transactions on Intelligent Transportation Systems 2024, 25, 7151–7173. [Google Scholar] [CrossRef]
- Cantamessa, M.; Montagna, F.; Altavilla, S.; Casagrande-Seretti, A. Data-driven design: the new challenges of digitalization on product design and development. Design Science 2020, 6, e27. [Google Scholar] [CrossRef]
- Nguyen-Tran, Y.K.; Majiid, A.; Mian, R.u.h. Data-Driven Spatial Analysis: A Multi-Stage Framework to Enhance Temporary Event Space Attractiveness. World 2025, 6, 54. [Google Scholar] [CrossRef]
- Lynch, K.M. The Image of the City; MIT Press: MA, 1960. [Google Scholar]
- Cullen, G. The Concise Townscape; Architectural Press, 1995. [Google Scholar]
- Kaplan, R.; Kaplan, S. The Experience of Nature: A Psychological Perspective; Cambridge University Press: New York, NY, 1989. [Google Scholar]
- Stamps, A.E. Use of static and dynamic media to simulate environments: A meta-analysis. Perceptual and Motor Skills 2010, 111, 355–364. [Google Scholar] [CrossRef] [PubMed]
- Nitschke, G. Ma: The Japanese Sense of Place. Architectural Design 1966, 36, 116–156. [Google Scholar]
- Bognar, B. The Japan Style; Kodansha International: Tokyo, 1985. [Google Scholar]
- Nisbett, R.E.; Miyamoto, Y. The influence of culture: Holistic versus analytic perception. Trends in Cognitive Sciences 2005, 9, 467–473. [Google Scholar] [CrossRef]
- Braun, V.; Clarke, V. Using thematic analysis in psychology. Qualitative Research in Psychology 2006, 3, 77–101. [Google Scholar] [CrossRef]
- Strauss, A.; Corbin, J. Basics of Qualitative Research: Techniques and Procedures for Developing Grounded Theory; Sage Publications: Thousand Oaks, CA, 1998. [Google Scholar]
- Hallgren, K.A. Computing inter-rater reliability for observational data: An overview and tutorial. Tutorials in Quantitative Methods for Psychology 2012, 8, 23–34. [Google Scholar] [CrossRef]
- Hillier, B.; Hanson, J. The Social Logic of Space; Cambridge University Press: Cambridge, 1984. [Google Scholar]
- Benedikt, M.L. To Take Hold of Space: Isovists and Isovist Fields. Environment and Planning B: Planning and Design 1979, 6, 47–65. [Google Scholar] [CrossRef]
- Dubey, A.; Naik, N.; Parikh, D.; Raskar, R.; Hidalgo, C.A. Deep Learning the City: Quantifying Urban Perception at a Global Scale. In Proceedings of the European Conference on Computer Vision (ECCV); Springer, 2016; pp. 196–212. [Google Scholar]
- Gibson, J.J. The Ecological Approach to Visual Perception; Houghton Mifflin, 1979. [Google Scholar]
- Heft, H. Environment, cognition, and culture: Reconsidering the cognitive map. Journal of Environmental Psychology 2013, 33, 14–25. [Google Scholar] [CrossRef]
- Alberti, M.; Pahl, S. People’s perception of urban green spaces: A multisensory approach. Urban Forestry & Urban Greening 2018, 36, 104–113. [Google Scholar]
- Warren, W.H. Perceiving the environment: Theoretical perspectives on the ecological approach. Annual Review of Psychology 2019, 70, 1–24. [Google Scholar]
- Li, X.; Zhang, C.; Li, W. A review of visual methods in environmental perception research. Journal of Environmental Psychology 2020, 68, 101389. [Google Scholar]
- Gao, T.; Zhang, S. Using videos to elicit spatial perception: Effects of camera movement on spatial understanding. Environment and Behavior 2021, 53, 763–788. [Google Scholar]
- Spanlang, B.; et al. How to build an embodied VR system for spatial behavior studies. Frontiers in Psychology 2014, 5, 879. [Google Scholar]
- Kuliga, S.F.; Thrash, T.; Dalton, R.C.; Hölscher, C. Virtual reality as an empirical research tool — Exploring user experience in a real building and a corresponding virtual model. Computers, Environment and Urban Systems 2015, 54, 363–375. [Google Scholar] [CrossRef]
- Carrozzino, M.; Bergamasco, M. Beyond virtual museums: Experiencing immersive virtual reality in real contexts. Journal of Cultural Heritage 2010, 11, 452–458. [Google Scholar] [CrossRef]
- Chen, H.; Suhr, A.; Misra, D.K.; Snavely, N.; Artzi, Y. TOUCHDOWN: Natural Language Navigation and Spatial Reasoning in Visual Street Environments. 2019 IEEE/CVF Conference on Computer Vision and Pattern Recognition (CVPR), 2018; pp. 12530–12539. [Google Scholar]
- Singh, M.; Basu, A.; Mandal, M.K. Event Dynamics Based Temporal Registration. IEEE Transactions on Multimedia 2007, 9, 1004–1015. [Google Scholar] [CrossRef]
- Morgan, M.A. Festival Spaces and the Visitor Experience; 2007. [Google Scholar]
- Watson, S.; Studdert, D.M. Markets as sites for social interaction: Spaces of diversity; 2006. [Google Scholar]
- OpenAI. ChatGPT: Optimizing Language Models for Dialogue. 2023. Available online: https://openai.com/chatgpt Accessed: [2025-02-1=22].
- Anthropic. Claude: A Next-Generation AI Assistant. 2023. Available online: https://www.anthropic.com/claude Accessed: [2025-02-1=22].
- Google. Gemini: Multimodal AI Model by Google. 2023. Available online: https://blog.google/technology/ai/google-gemini-ai/ Accessed: [2025-02-1=22].
- DeepSeek. DeepSeek: Advanced AI for Natural Language Processing. 2023. Available online: https://www.deepseek.com Accessed: [2025-02-1=22].
- Microsoft. GitHub Copilot: Your AI Pair Programmer. 2023. Available online: https://github.com/features/copilot Accessed: [2025-02-1=22].
- Campos, R.; Mangaravite, V.; Pasquali, A.; Jorge, A.M.; Nunes, C.; Jatowt, A. YAKE! Keyword extraction from single documents using multiple local features. Information Sciences 2020, 509, 257–289. [Google Scholar] [CrossRef]
- Rose, S.; Engel, D.; Cramer, N.; Cowley, W. Automatic keyword extraction from individual documents. In Proceedings of the Text Mining: Applications and Theory; John Wiley & Sons, Ltd, 2010; pp. 1–20. [Google Scholar]
- Mihalcea, R.; Tarau, P. TextRank: Bringing order into text. In Proceedings of the 2004 Conference on Empirical Methods in Natural Language Processing; 2004; pp. 404–411. [Google Scholar]
- Karlgren, J.; Li, R.; Meyersson Milgrom, E.M. Text Mining for Processing Interview Data in Computational Social Science. arXiv 2020, arXiv:2011.14037. [Google Scholar] [CrossRef]
- Ushio, A.; Liberatore, F.; Camacho-Collados, J. Back to the Basics: A Quantitative Analysis of Statistical and Graph-Based Term Weighting Schemes for Keyword Extraction. arXiv 2021, arXiv:2104.08028. [Google Scholar] [CrossRef]
- Wang, X.; Zhang, L.; Klabjan, D. Keyword-based Topic Modeling and Keyword Selection. arXiv 2020, arXiv:2001.07866. [Google Scholar] [CrossRef]
- Salton, G.; Buckley, C. Term-weighting approaches in automatic text retrieval. Information Processing & Management 1988, 24, 513–523. [Google Scholar] [CrossRef]
- Blei, D.M.; Ng, A.Y.; Jordan, M.I. Latent Dirichlet Allocation. Journal of Machine Learning Research 2003, 3, 993–1022. [Google Scholar]
- Grootendorst, M. KeyBERT: Minimal keyword extraction with BERT. arXiv preprint arXiv:2010.11918 2020. Accessed: 2025-02-03.
- Liu, B. Sentiment Analysis and Opinion Mining; Synthesis Lectures on Human Language Technologies, Morgan & Claypool Publishers, 2012. [Google Scholar]
- Narahara, T. Kurashiki Viewer: Qualitative Evaluations of Architectural Spaces inside Virtual Reality. In Proceedings of the International Conference for The Association for Computer Aided Architectural Design Research in Asia (CAADRIA); 2022; Vol. 1, pp. 11–18. [Google Scholar]
- and, V.M. Look Closely and You Will See, Listen Carefully and You Will Hear: Urban Design and Social Interaction on Streets. Journal of Urban Design 2009, 14, 29–64. [CrossRef]
- Gehl, J.; Svarre, B. How to Study Public Life; Island Press: Washington, DC, 2013. [Google Scholar]
- nana, media. Imagine Coffee Morning Market] Held once a month! Handmade sweets and fresh vegetables lined up | Matsue City | na-na (Nana) | Tottori and Shimane gourmet, outing, and lifestyle magazine — na-na.media. 2023. Available online: https://na-na.media/imagine-coffee-morning/ (accessed on 09-02-2025).
- instagram. imagine coffee. 2025. Available online: https://www.instagram.com/imagine_coffee_/ (accessed on 15-12-2025).
- Rezaei, N.; Mirzaei, R.; Abbasi, R. A study on motivation differences among traditional festival visitors based on demographic characteristics, case study: Gol-Ghaltan festival, Iran. Journal of Convention & Event Tourism 2018, 19, 120–137. [Google Scholar] [CrossRef]
- Walters, T.; Insch, A. How community event narratives contribute to place branding. Journal of Place Management and Development 2018, 11, 130–144. [Google Scholar] [CrossRef]
Figure 1.
Integrated four-stage workflow combining behavioural observation, multi-modal interviews, and NLP-based analysis. The shaded background panel (Stage-3) indicates the core methodological contribution of this study: an NLP-driven, sentiment-aware integration layer that links behavioural, linguistic, and cultural evidence into a unified spatial-perception evaluation framework.
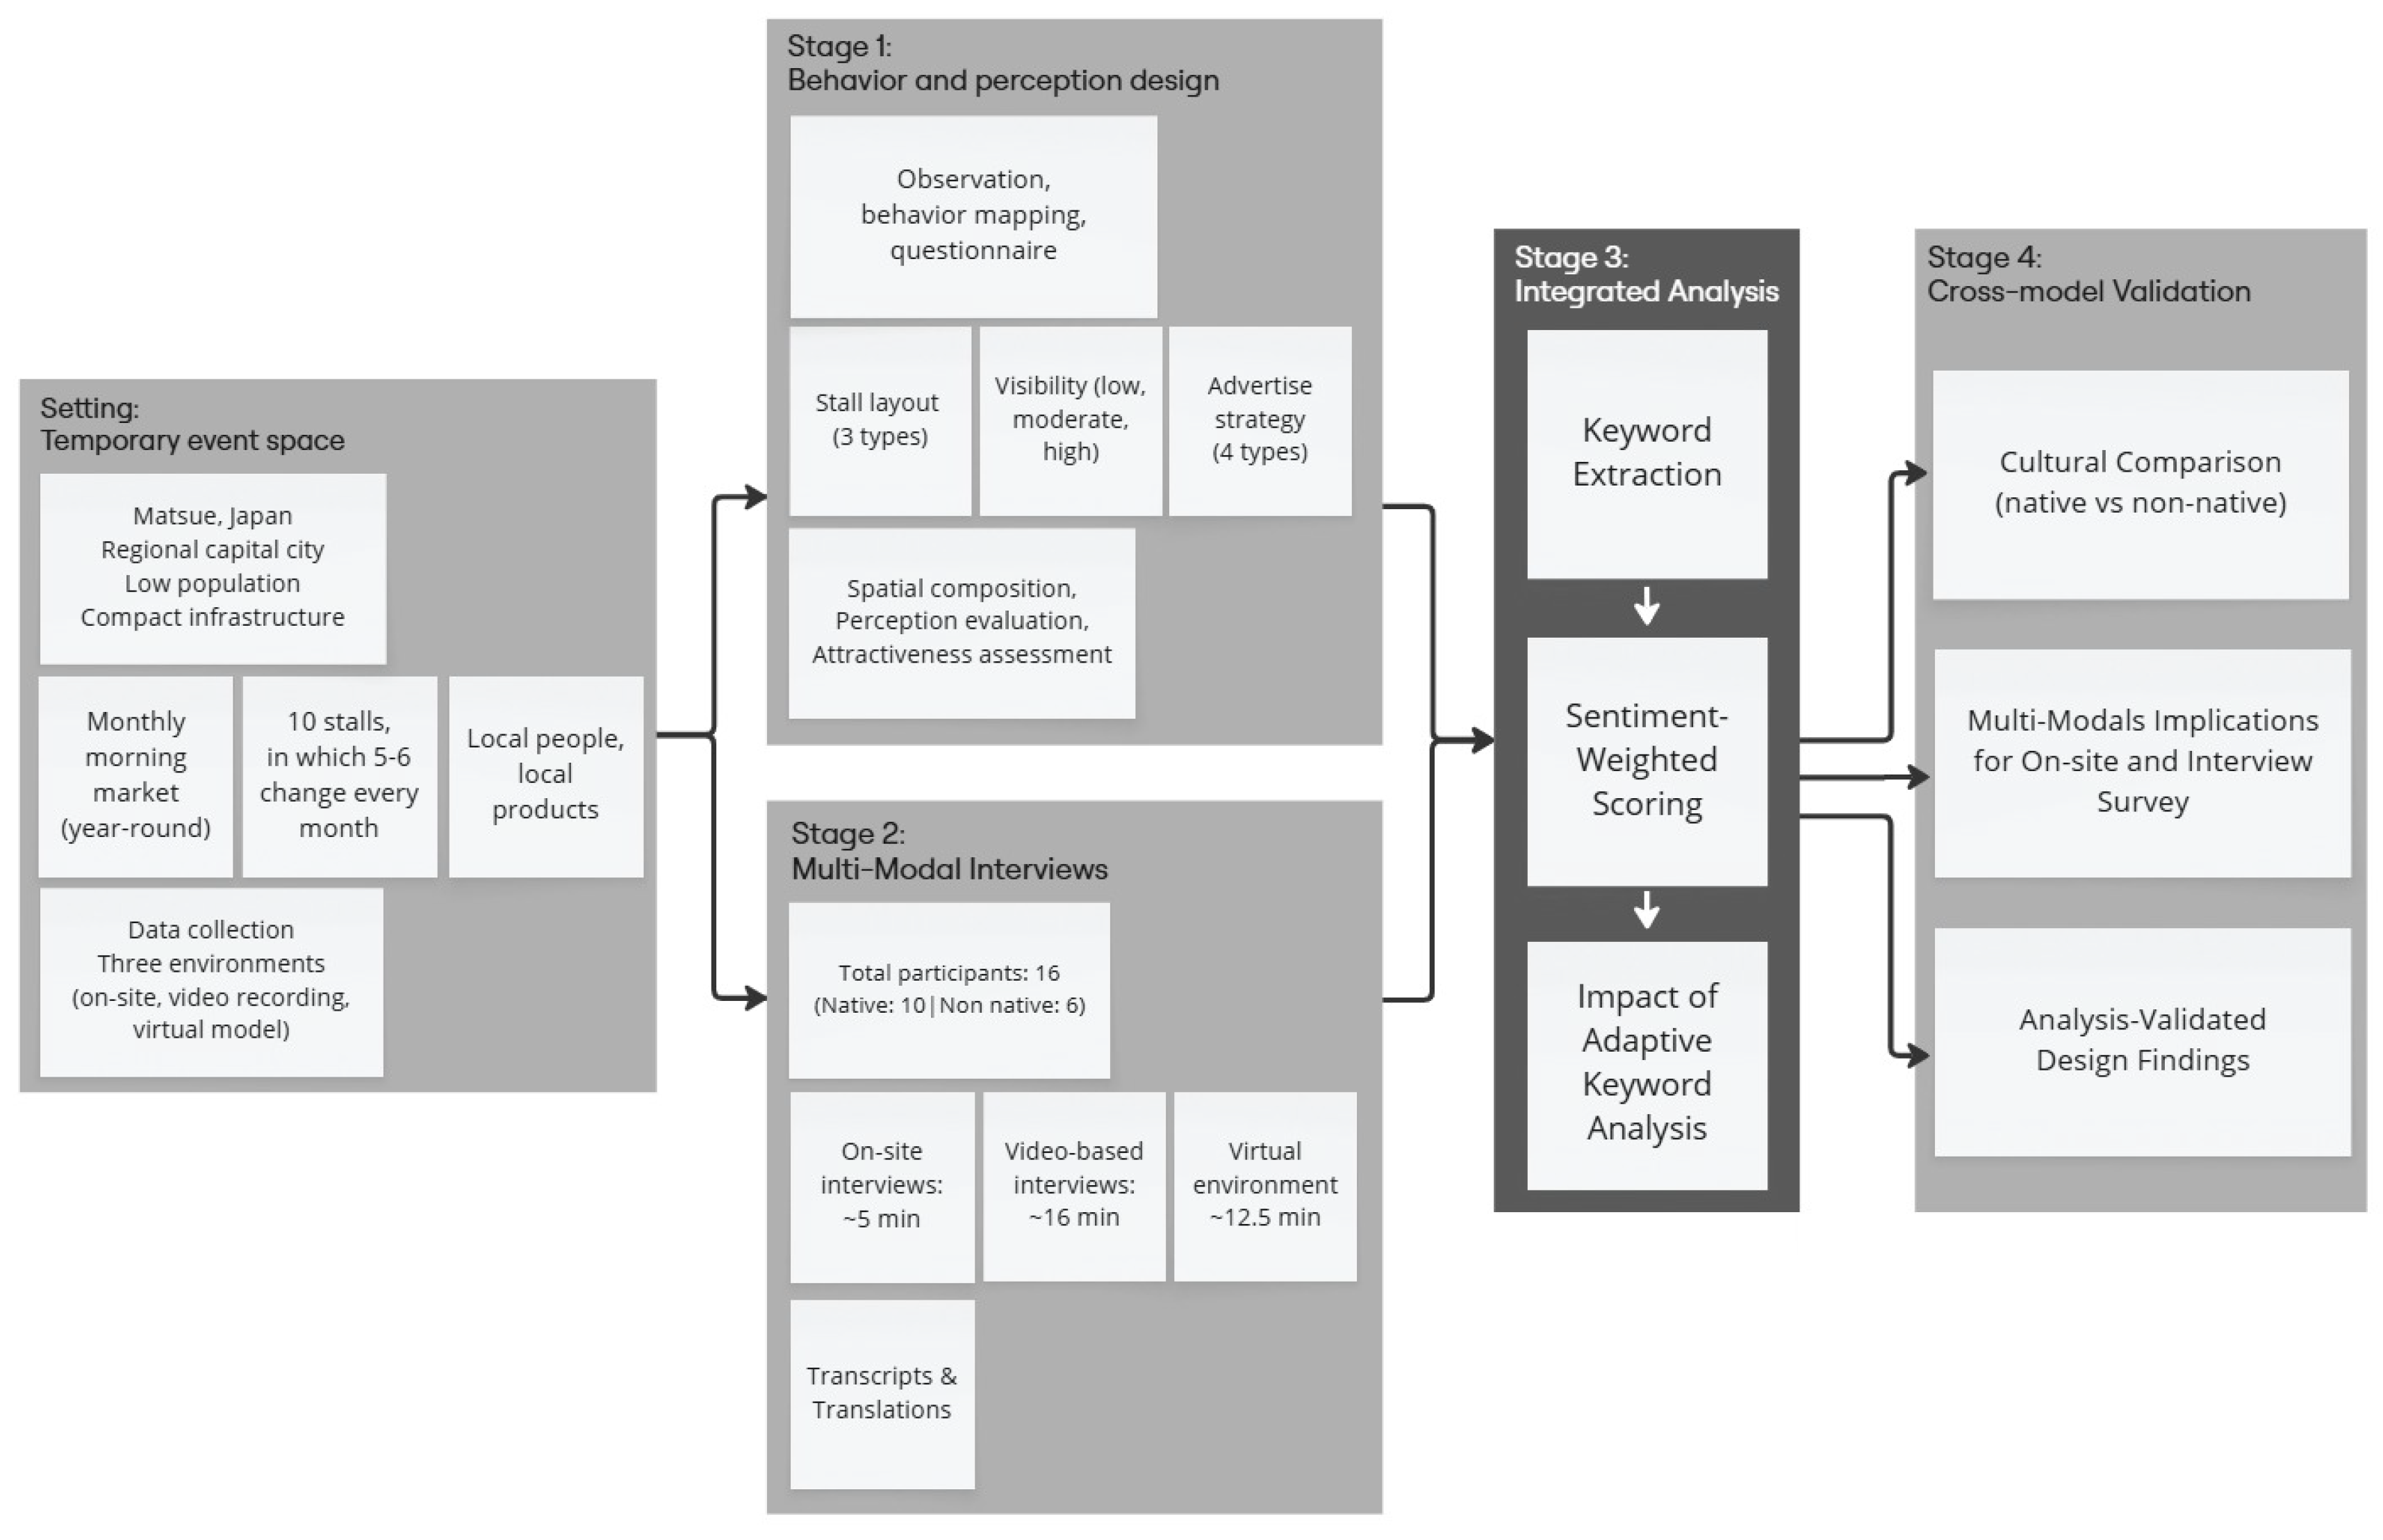
Figure 2.
Comparison between (a) the actual event image and (b) the developed virtual environment integrated within the proposed behavioral–perceptual analysis framework [6].
Figure 2.
Comparison between (a) the actual event image and (b) the developed virtual environment integrated within the proposed behavioral–perceptual analysis framework [6].
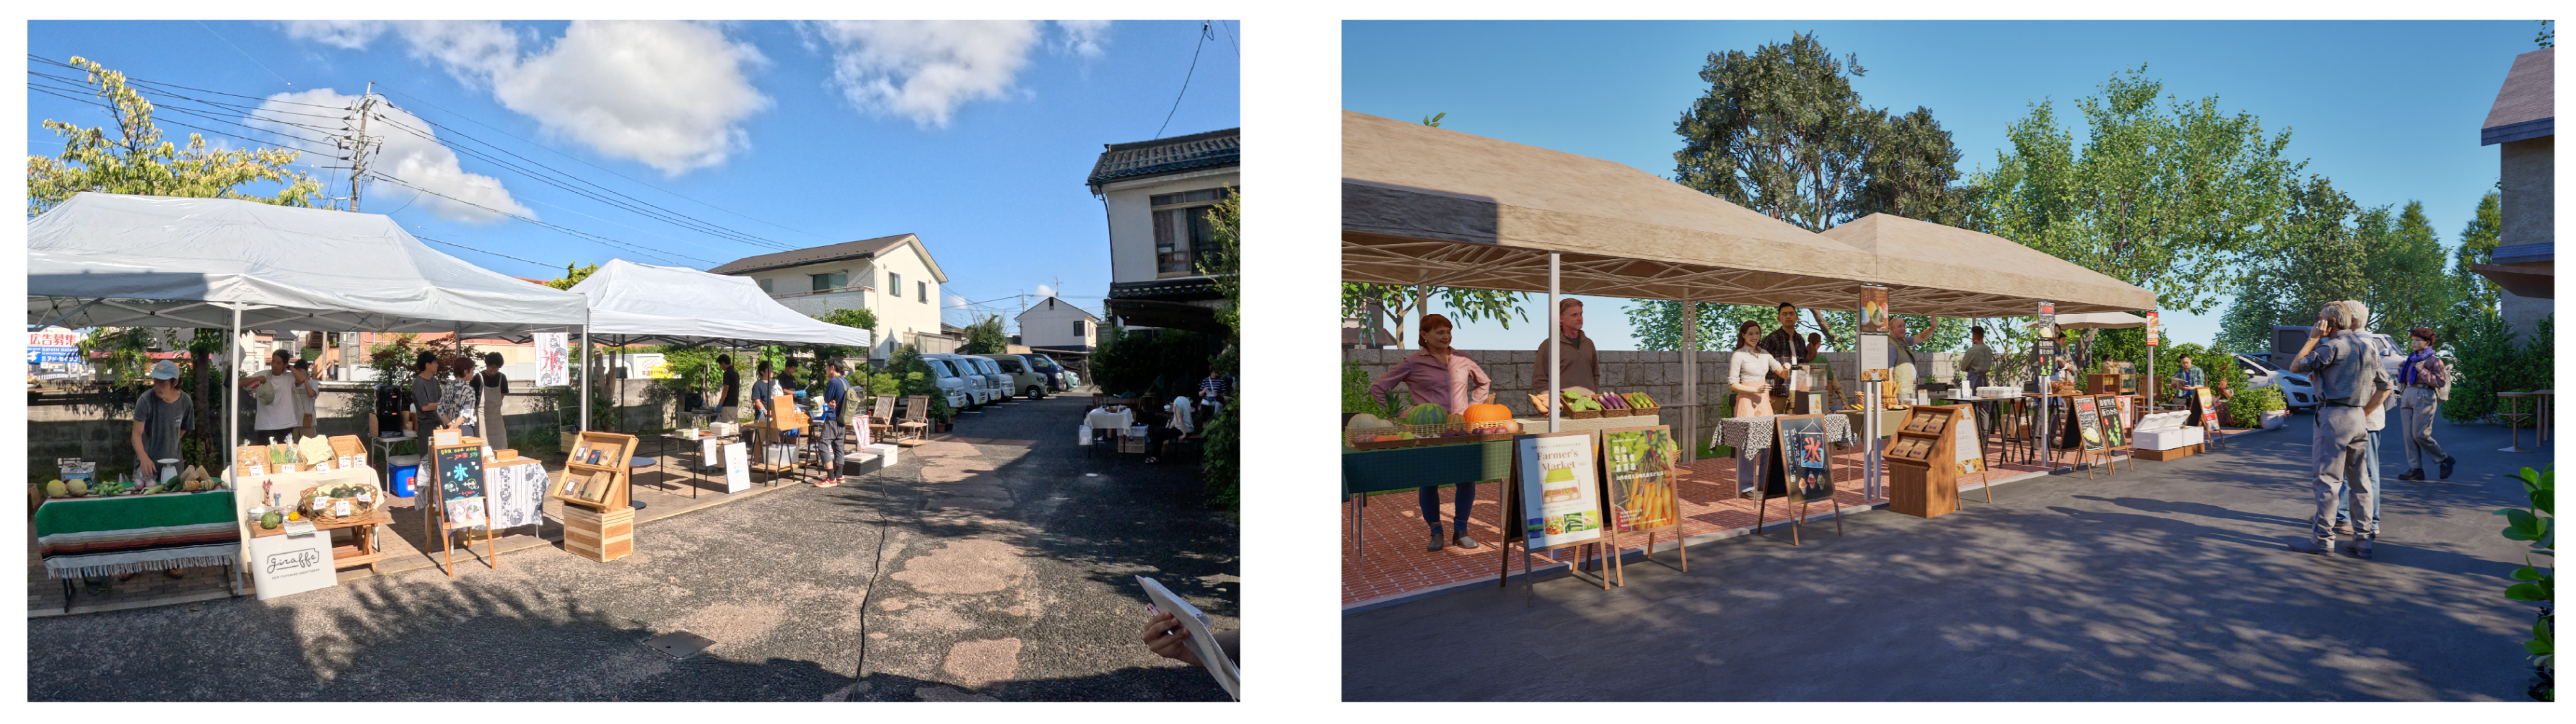
Figure 3.
Stall Layout (revised from [6]).
Figure 3.
Stall Layout (revised from [6]).
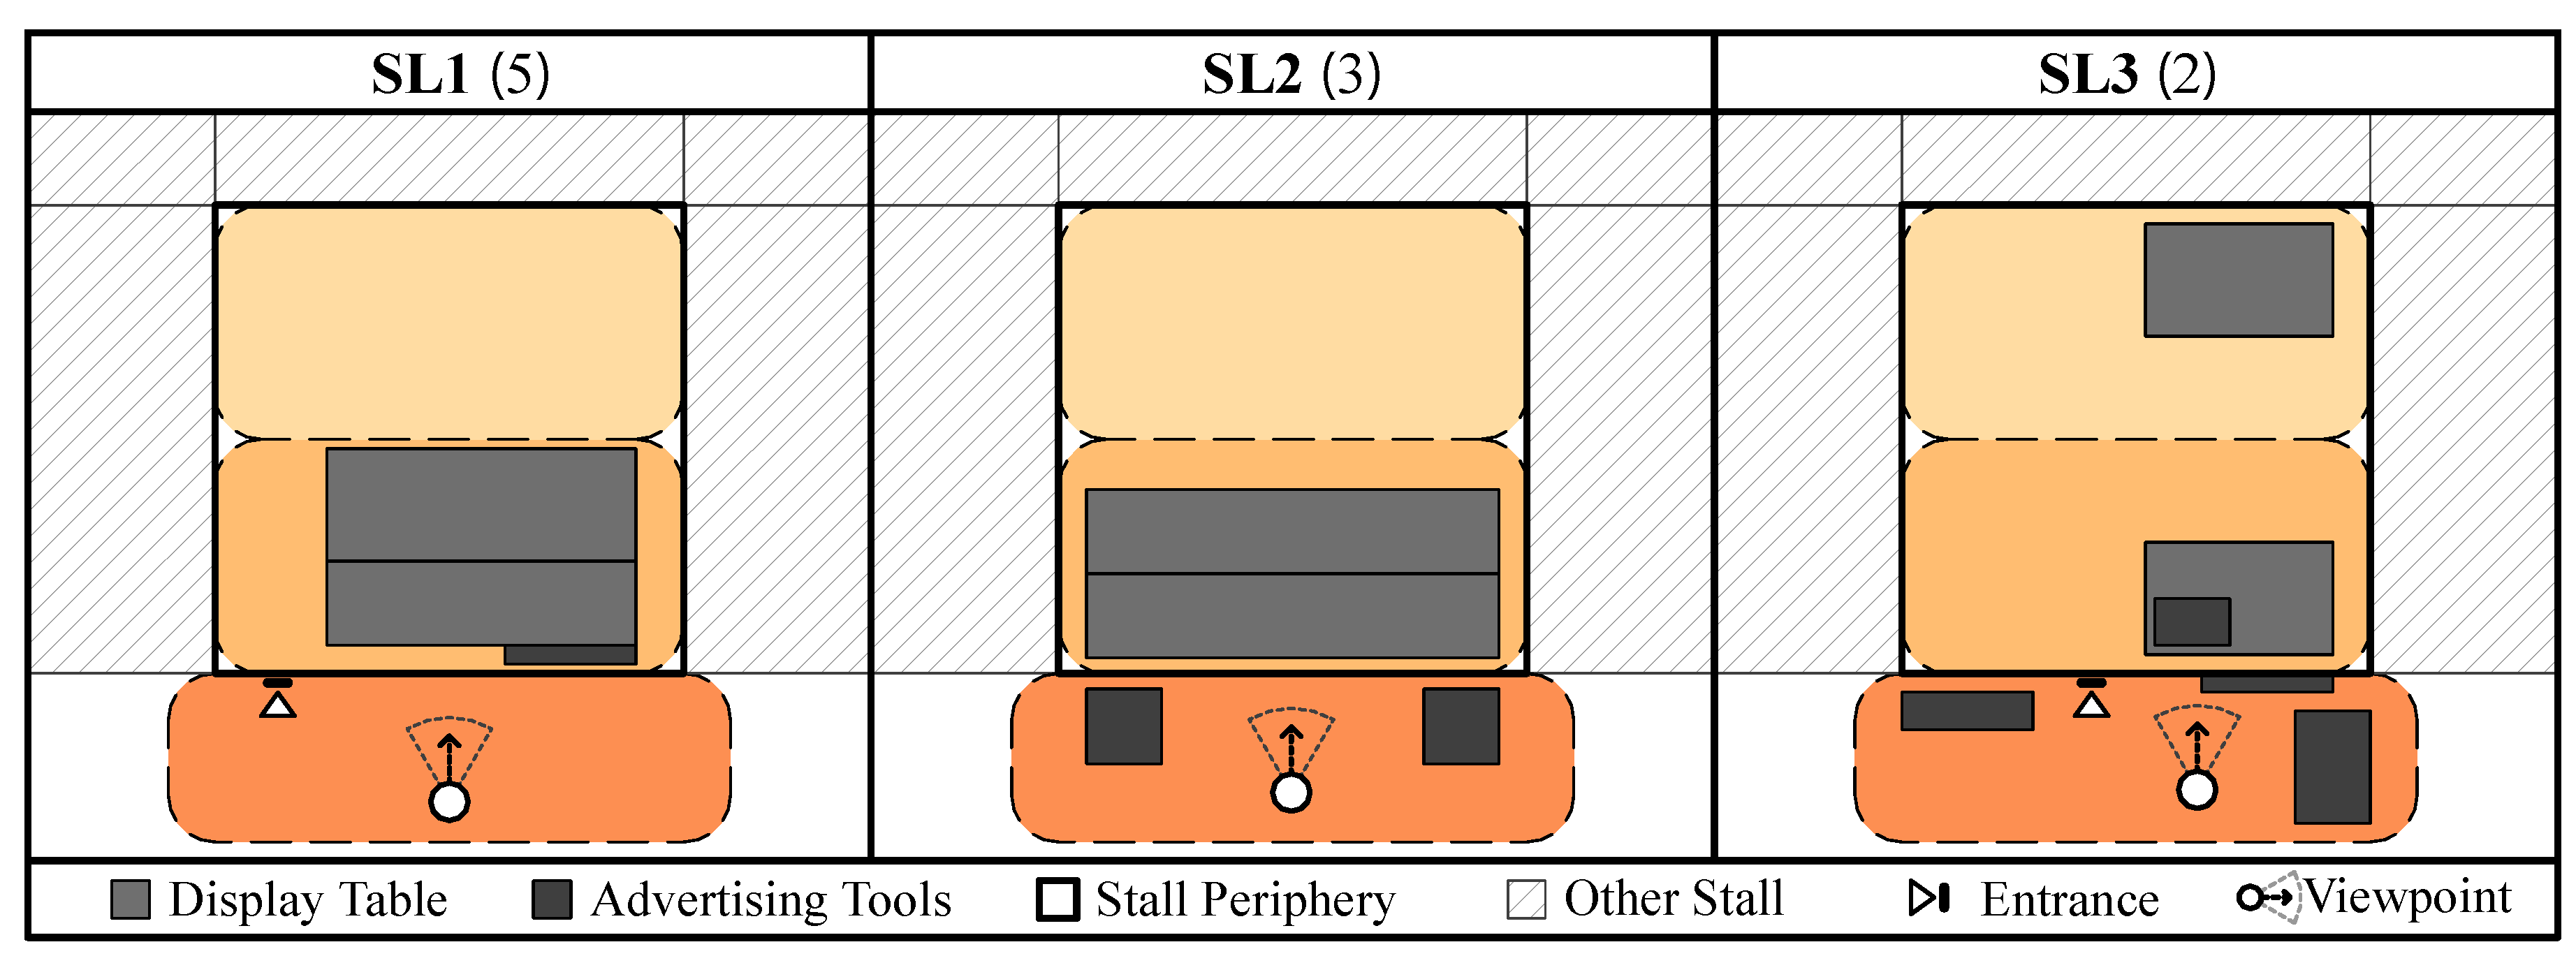
Figure 4.
Visibility (revised from [6]).
Figure 4.
Visibility (revised from [6]).
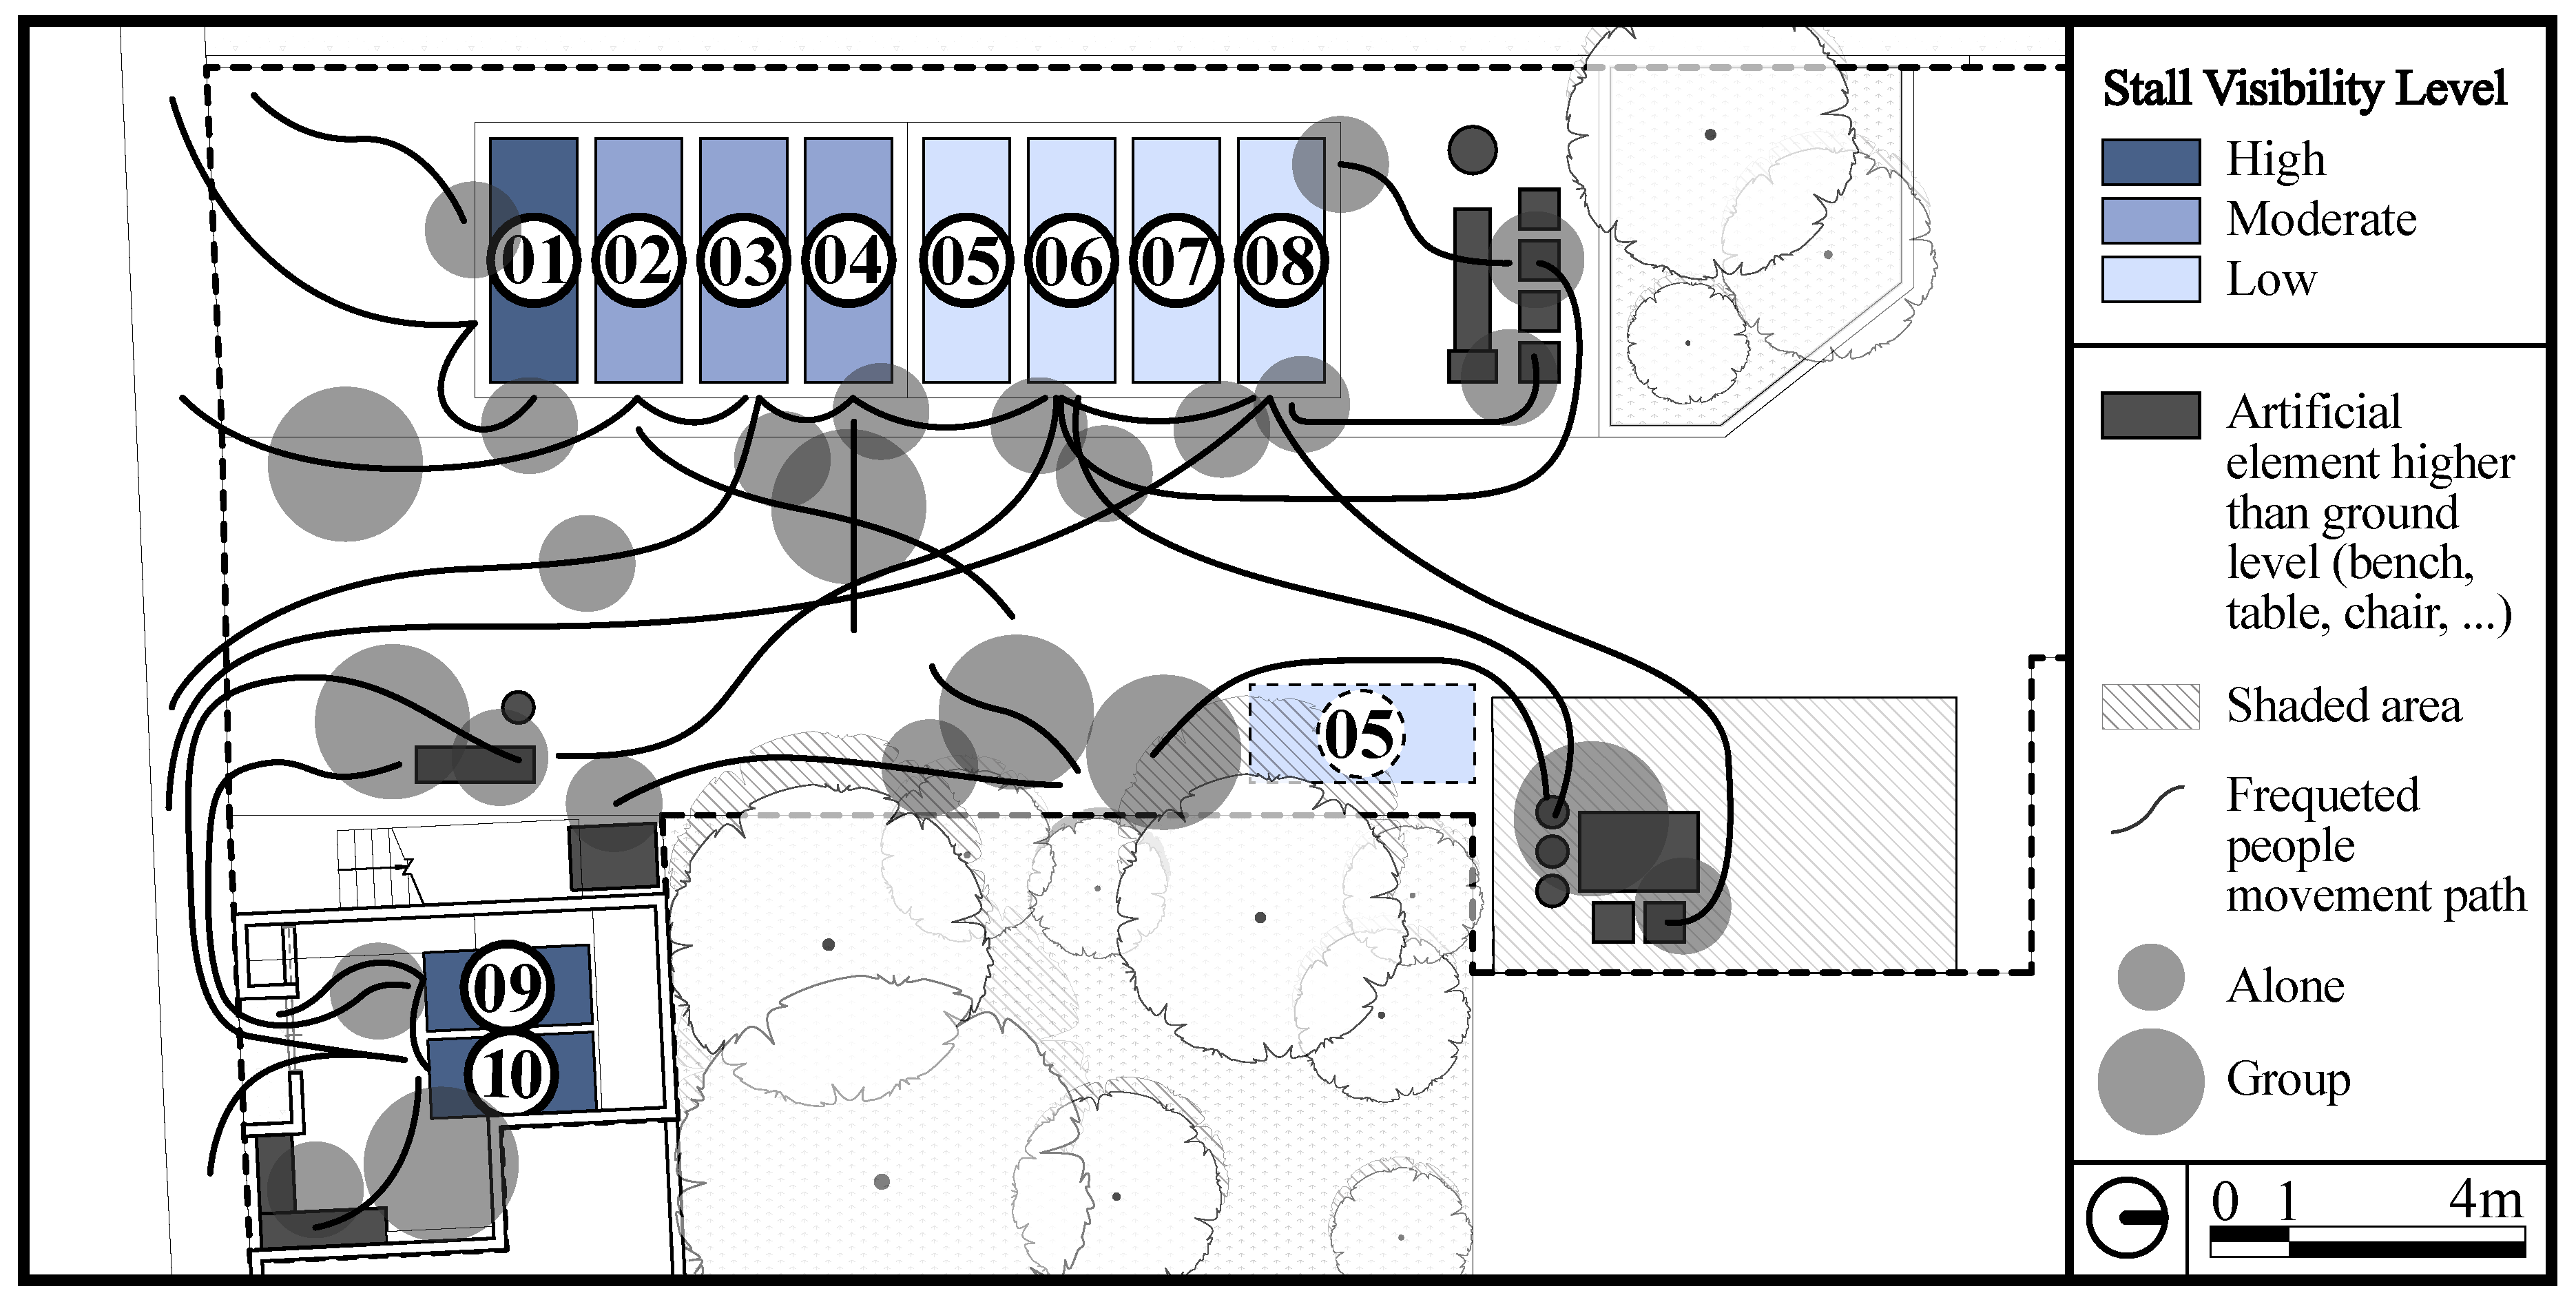
Figure 5.
Visibility (revised from [6]).
Figure 5.
Visibility (revised from [6]).
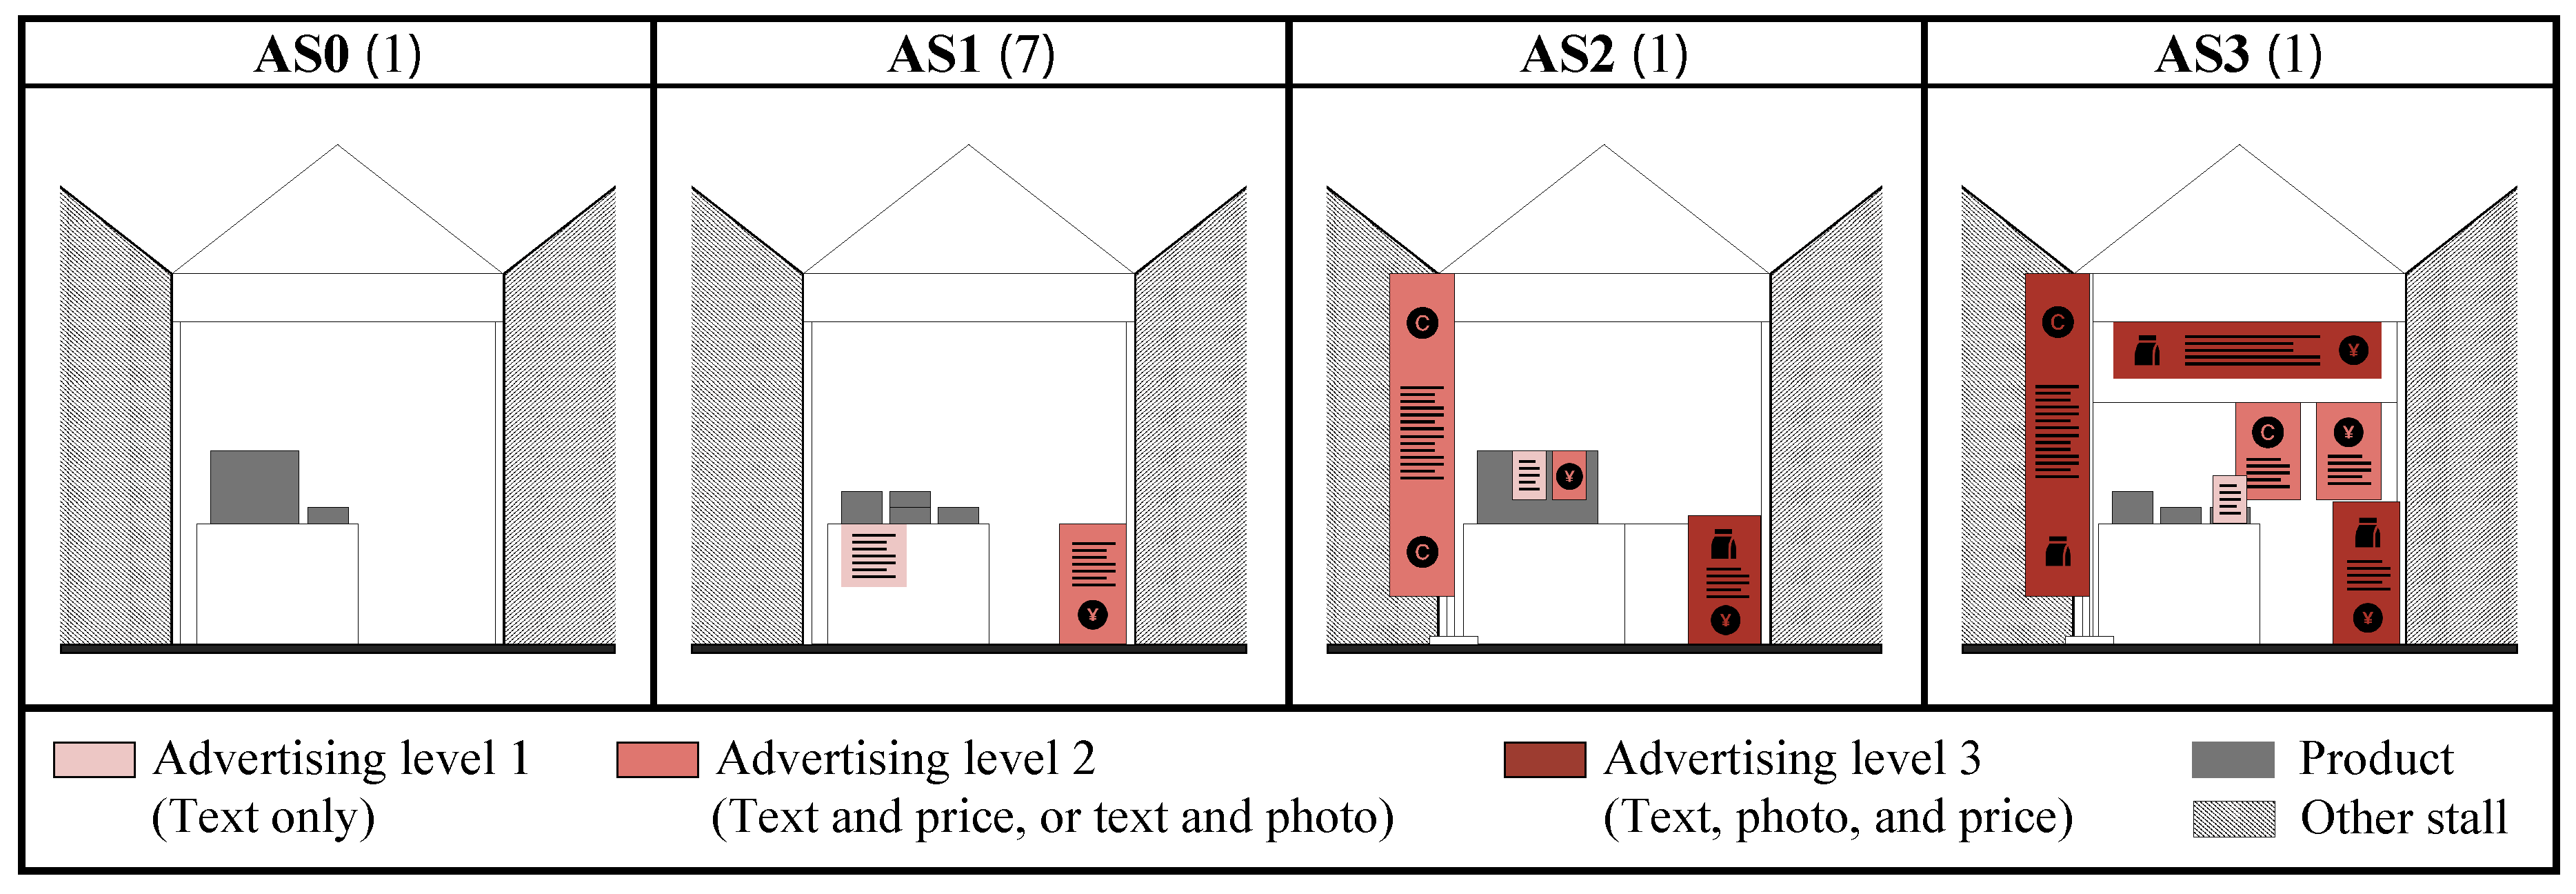
Figure 6.
Baseline fixed-parameter keyword weighting pipeline. The algorithm applies uniform repetition decay (), sentiment-based polarity coupling, and a fixed repetition cap to participant-generated keyword mentions, then aggregates scores by participant and category without adjusting for verbosity differences.
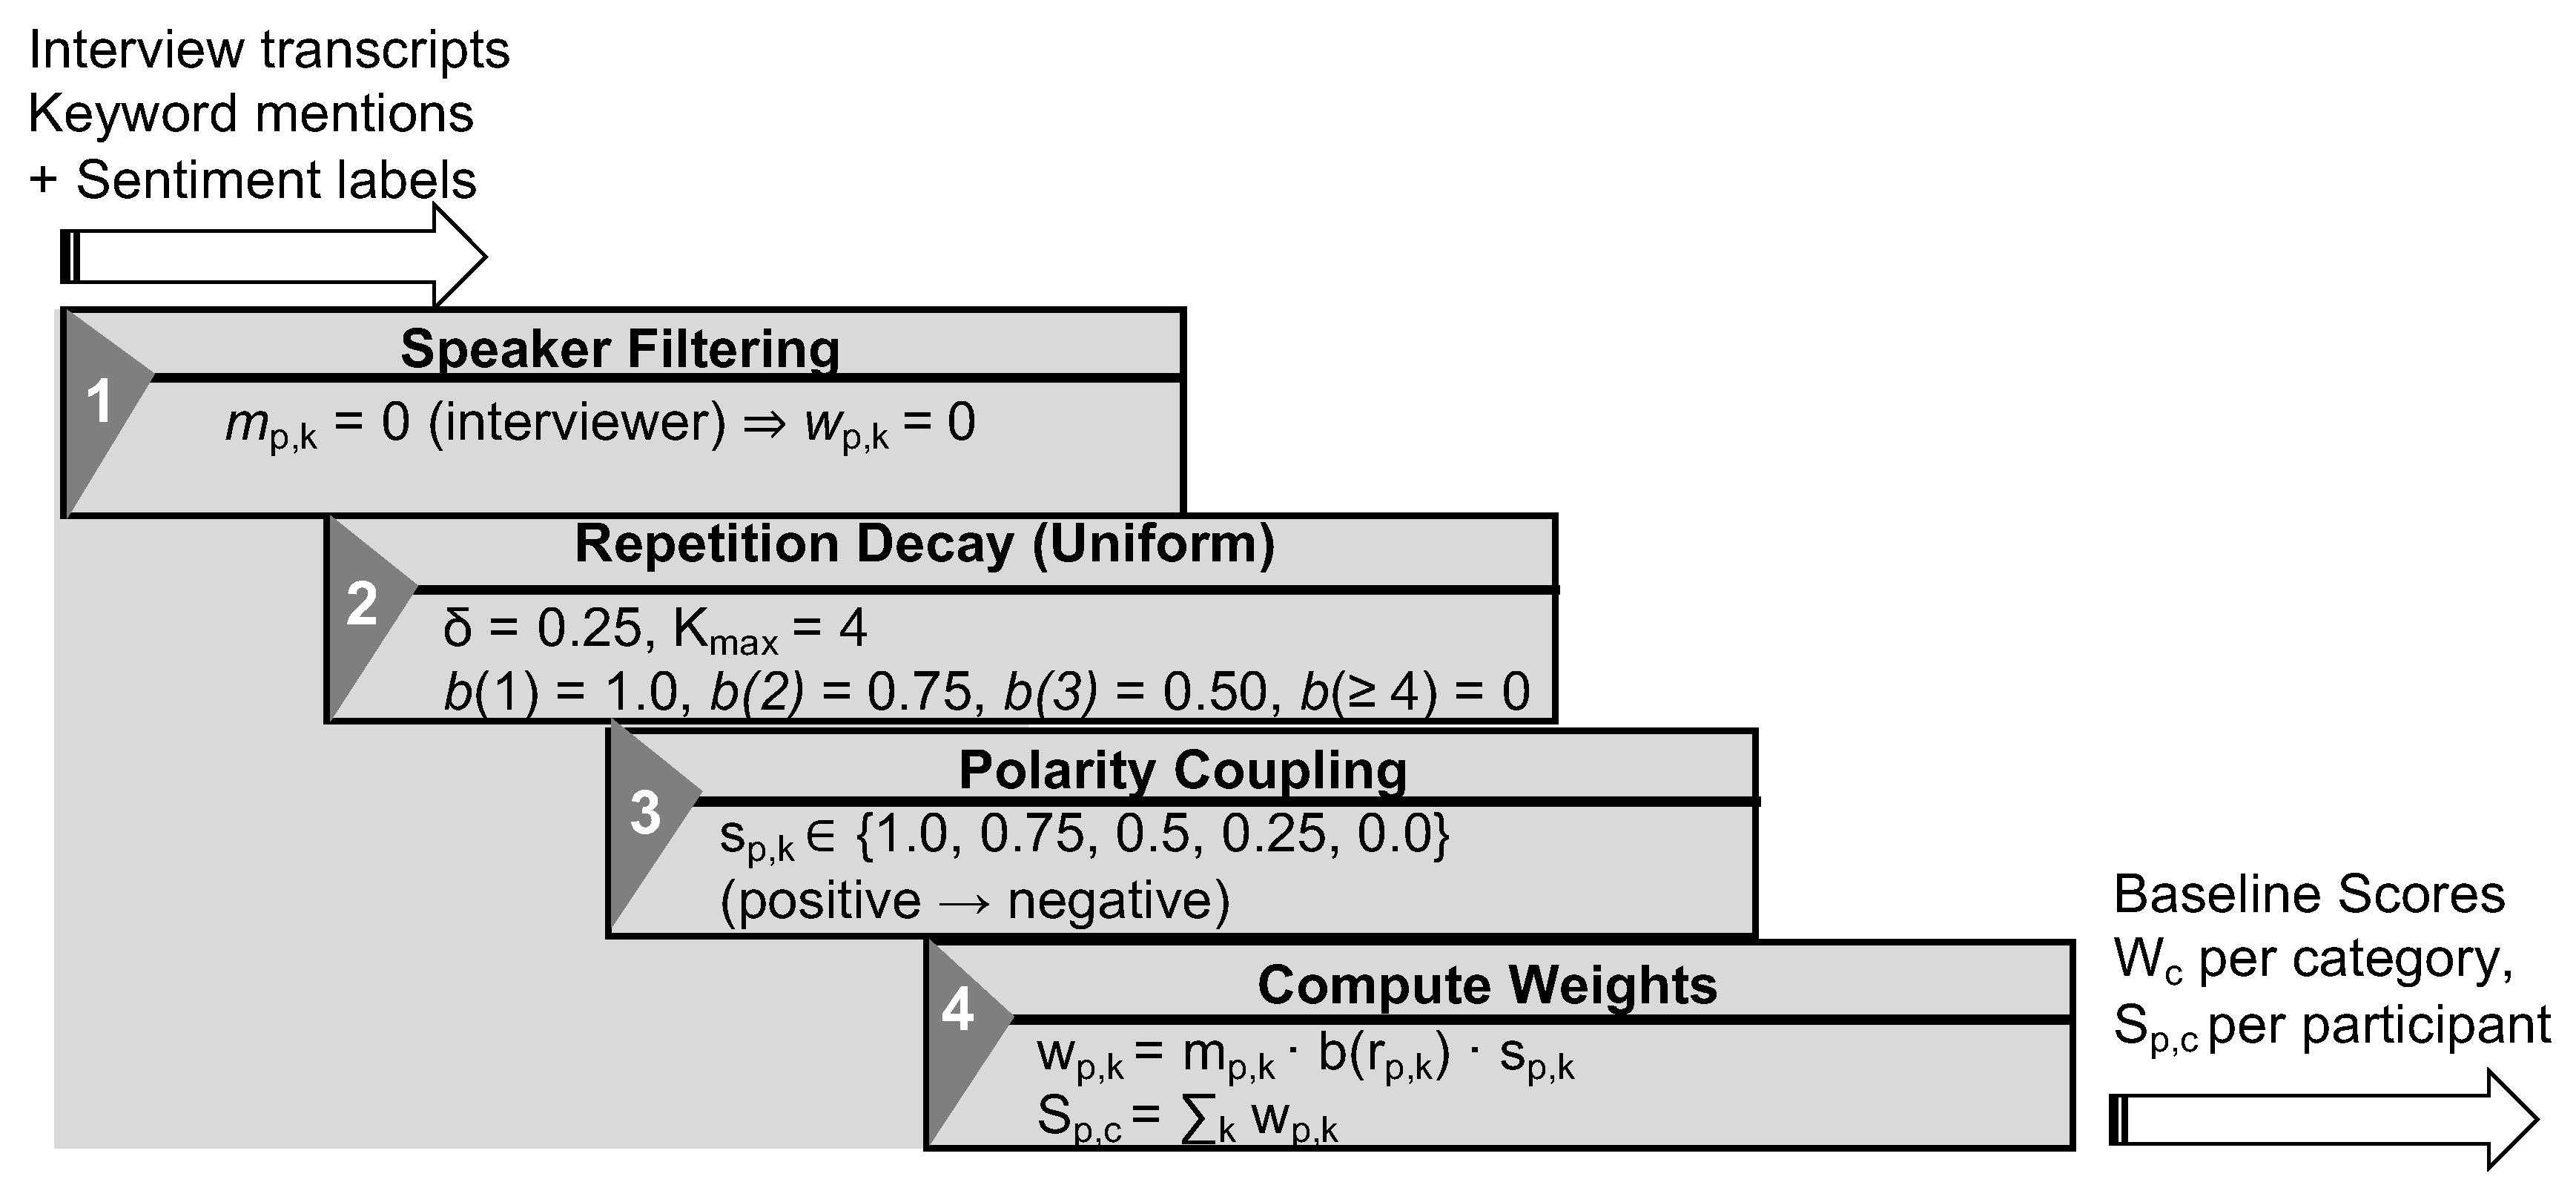
Figure 7.
Event-level weighted keyword scores by category (baseline algorithm). All categories showed strong normalized scores (), with NA questions achieving maximum engagement (1.00).
Figure 7.
Event-level weighted keyword scores by category (baseline algorithm). All categories showed strong normalized scores (), with NA questions achieving maximum engagement (1.00).
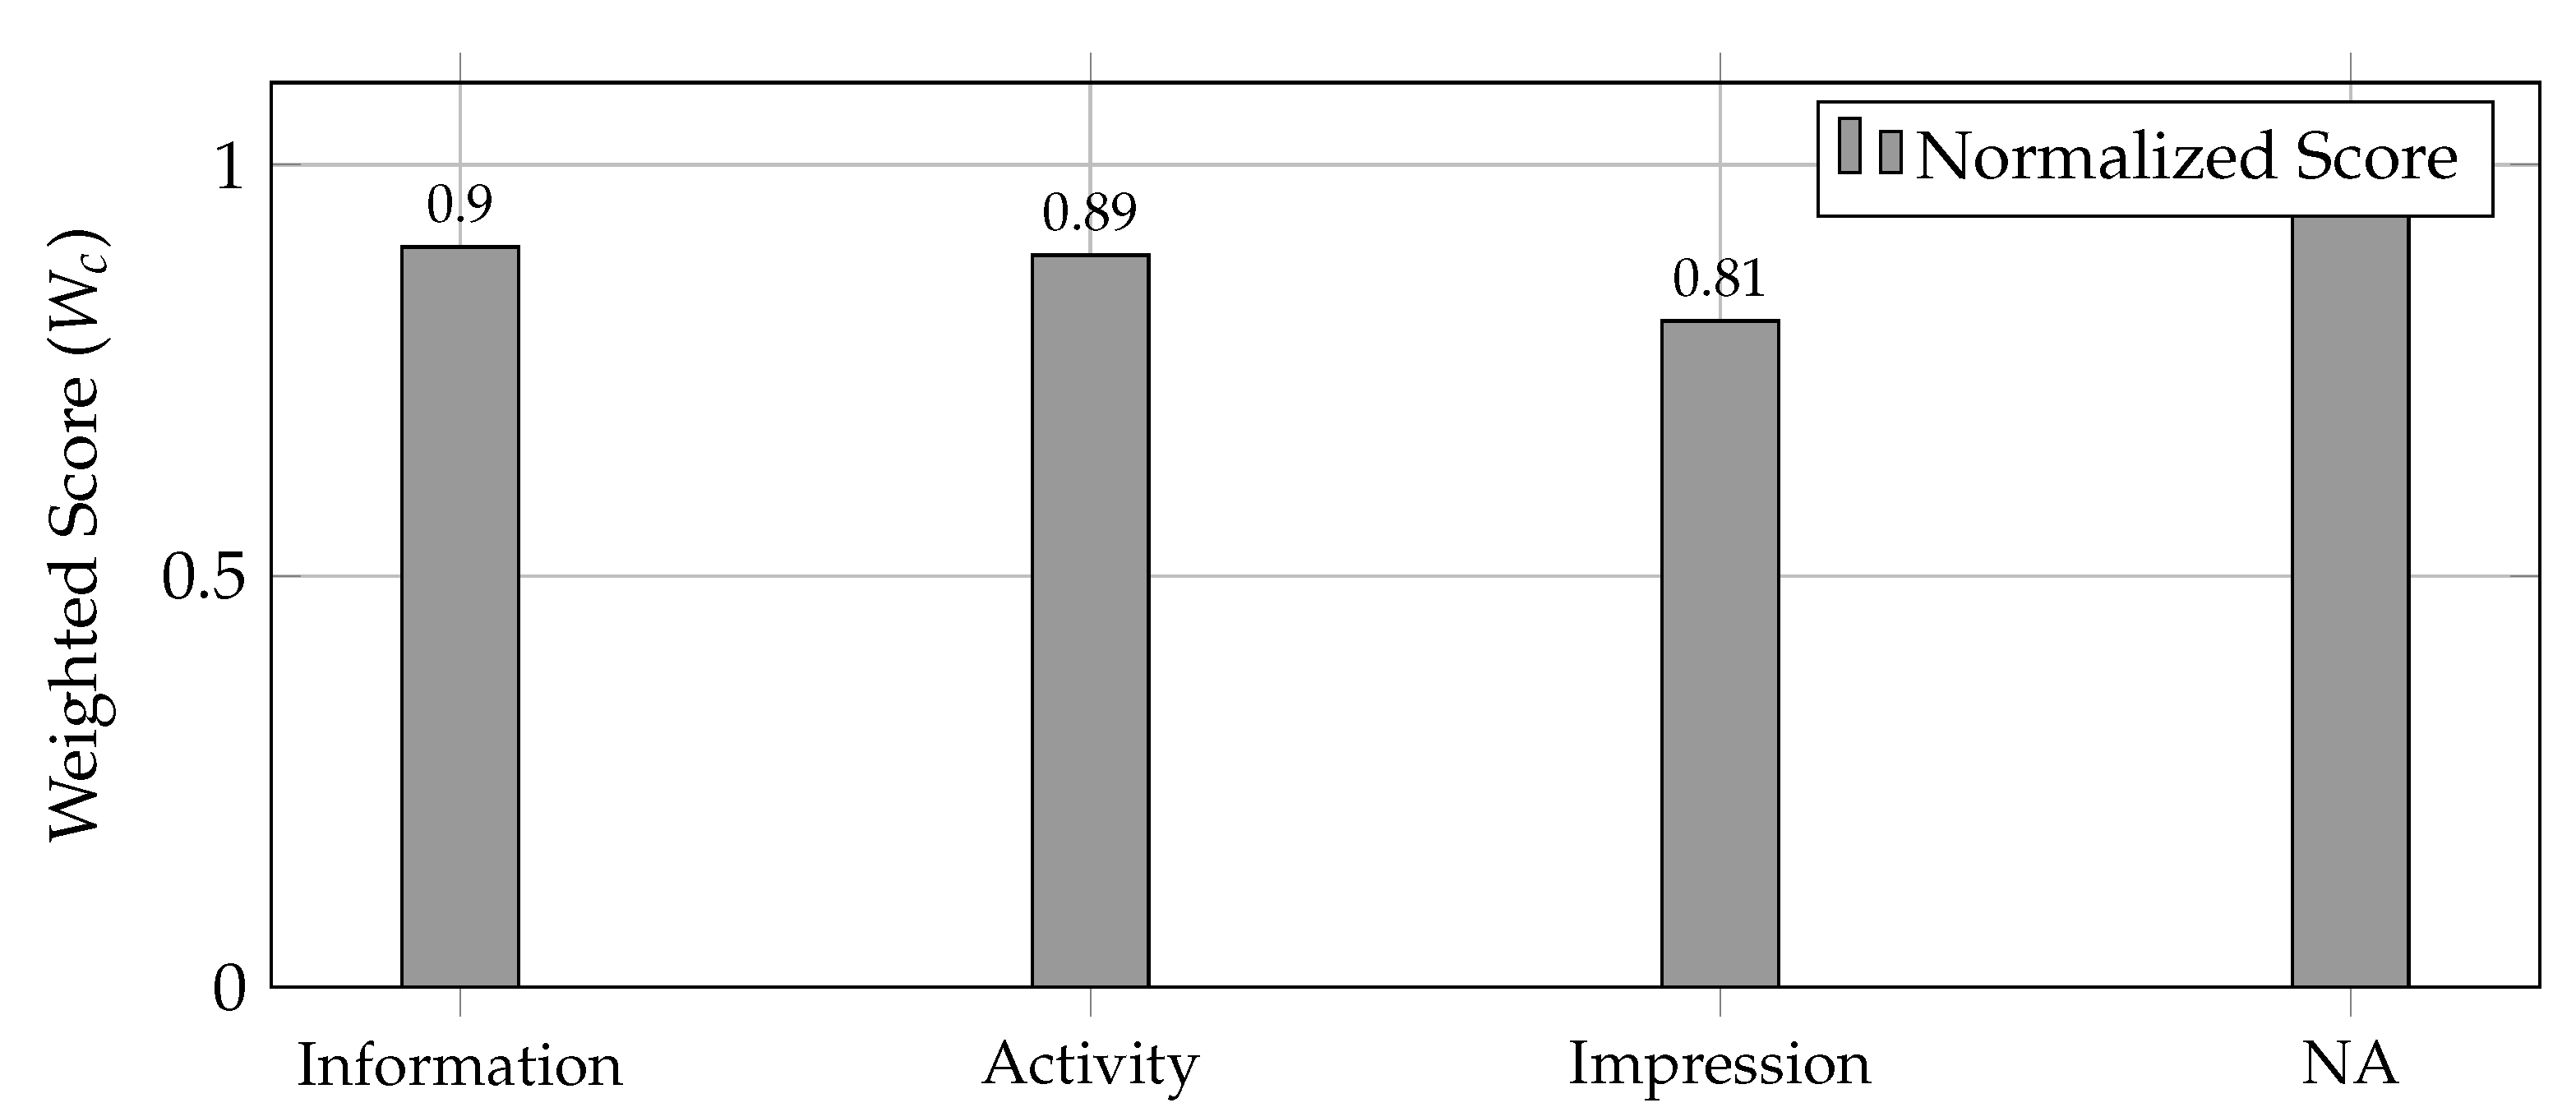
Figure 8.
Per-participant total normalized scores across all categories (baseline algorithm). Participants 6 and 7 showed higher engagement, while Participant 5 contributed the least weighted content.
Figure 8.
Per-participant total normalized scores across all categories (baseline algorithm). Participants 6 and 7 showed higher engagement, while Participant 5 contributed the least weighted content.
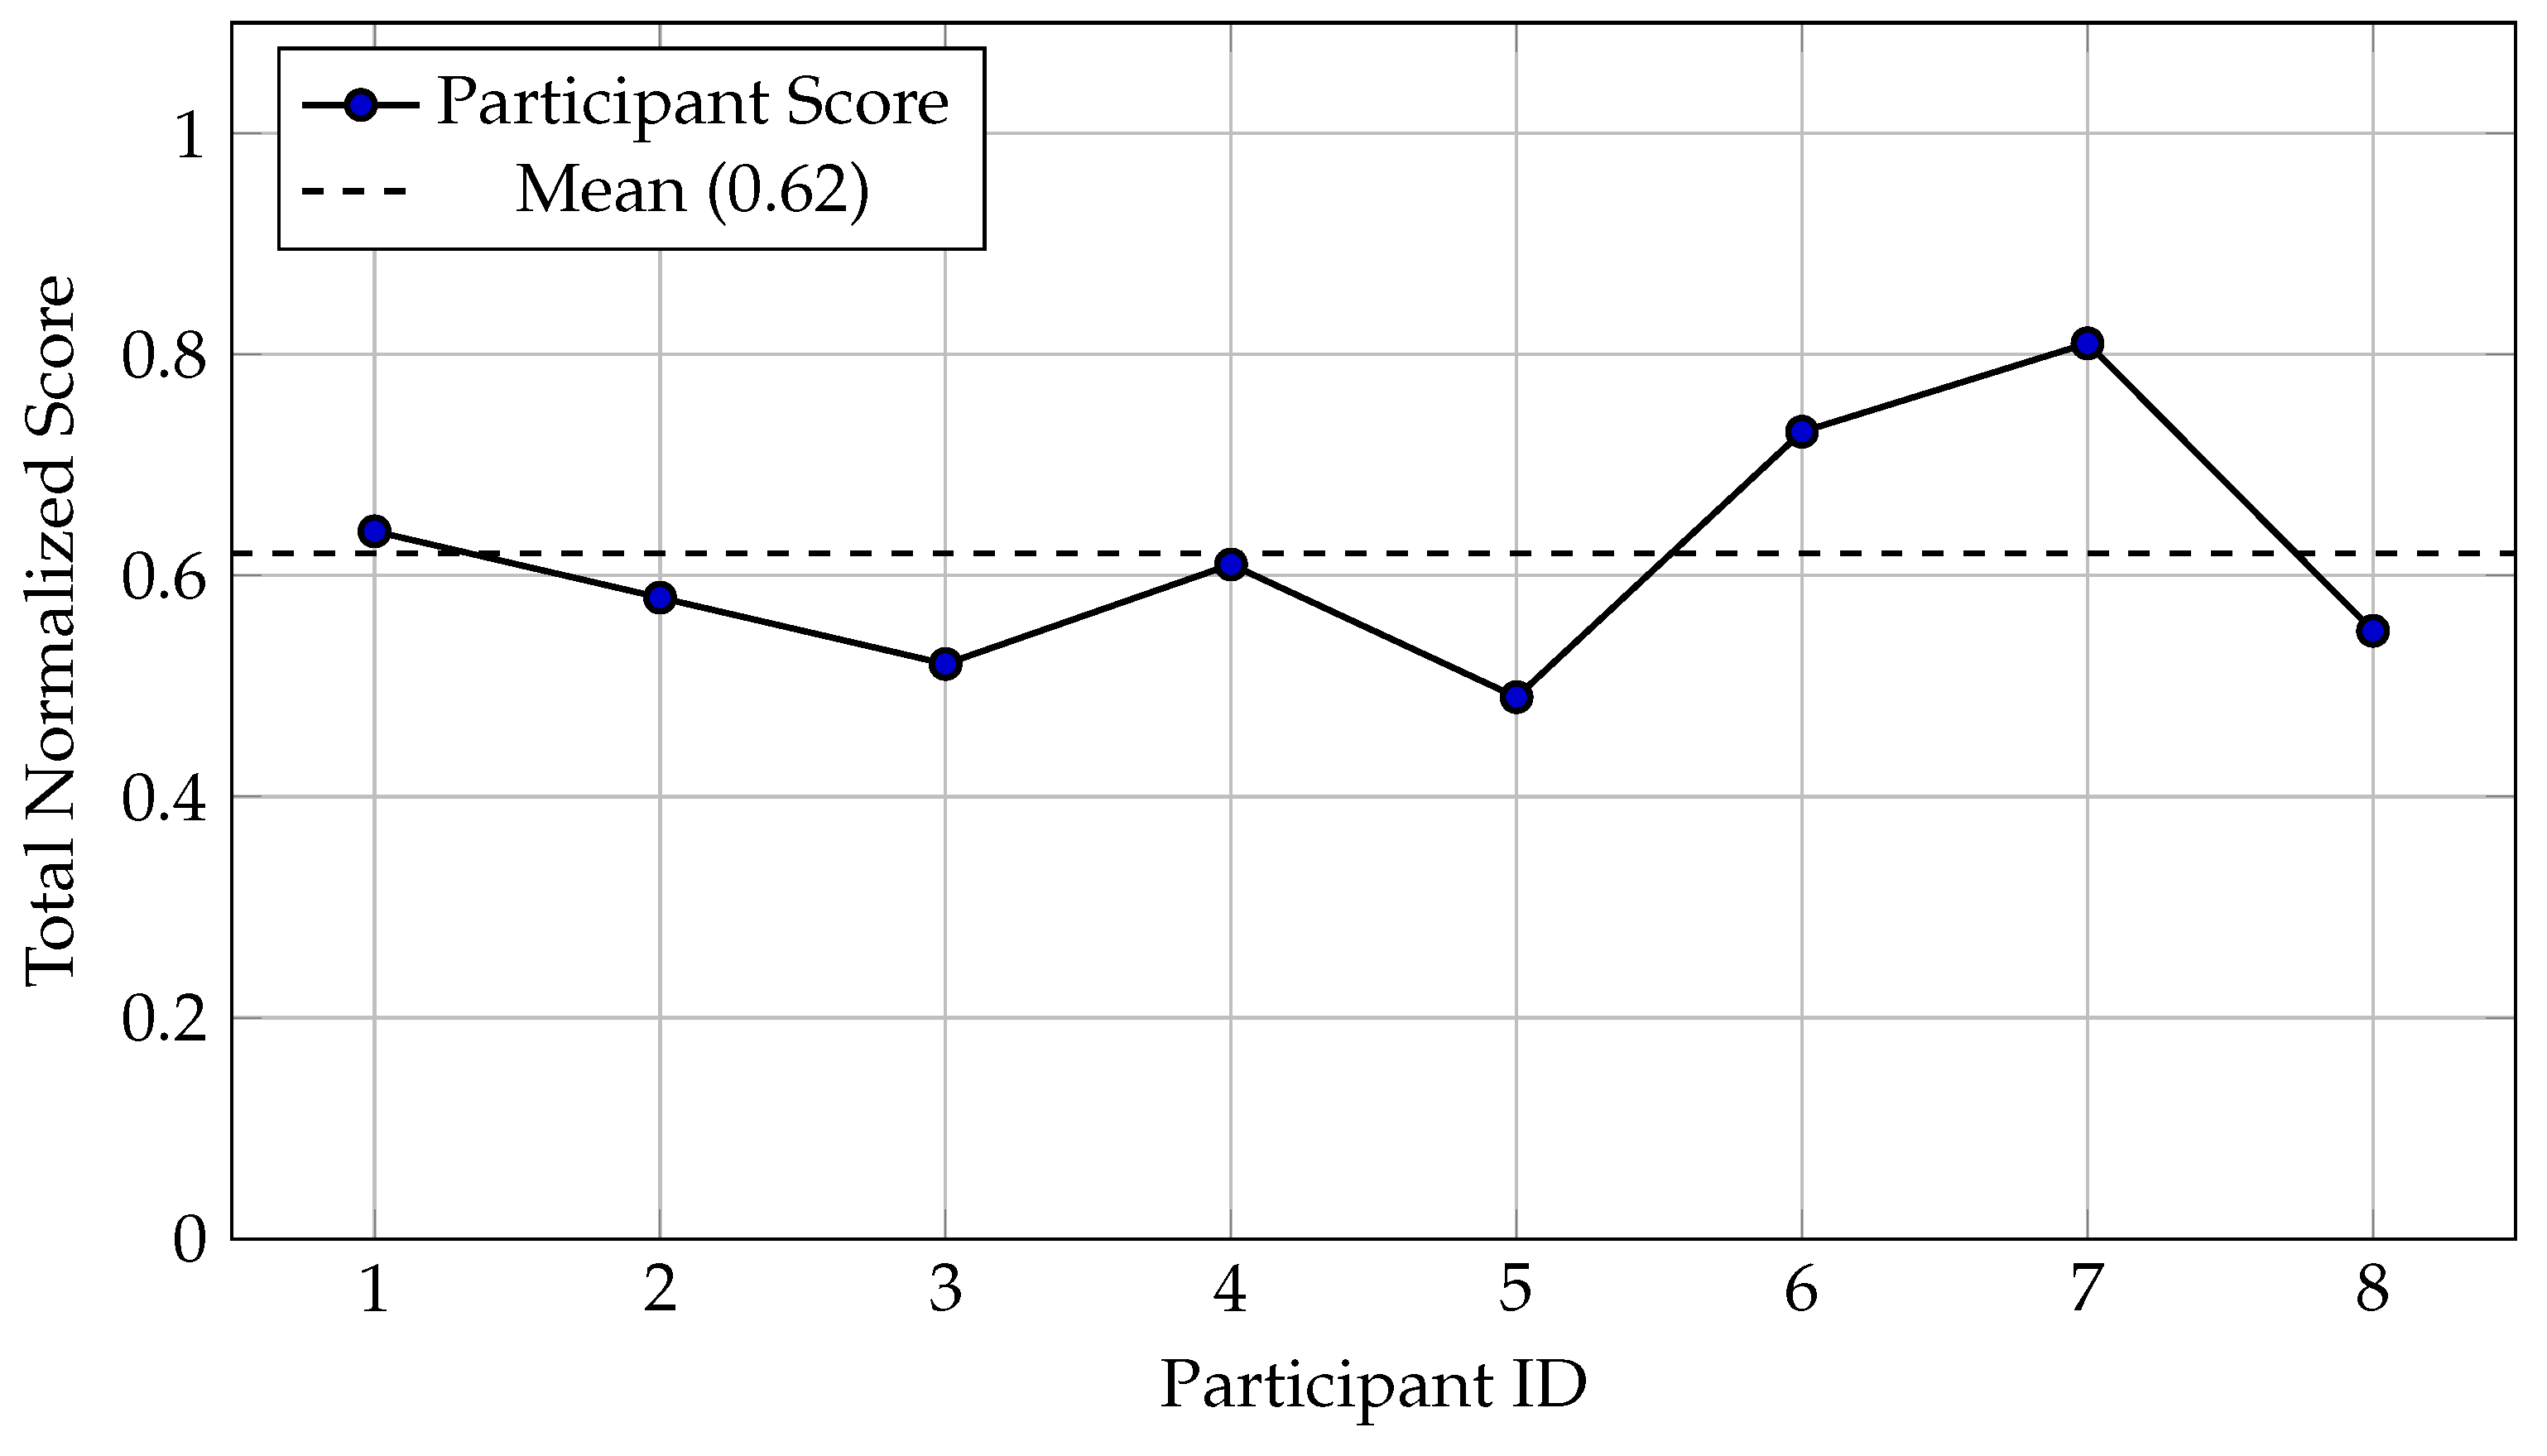
Figure 9.
Adaptive keyword weighting pipeline. The algorithm first estimates each participant’s verbosity, assigns a personalized decay rate, computes base repetition weights, applies sentiment-based scaling, and finally normalizes by utterance count to obtain balanced keyword scores.
Figure 9.
Adaptive keyword weighting pipeline. The algorithm first estimates each participant’s verbosity, assigns a personalized decay rate, computes base repetition weights, applies sentiment-based scaling, and finally normalizes by utterance count to obtain balanced keyword scores.
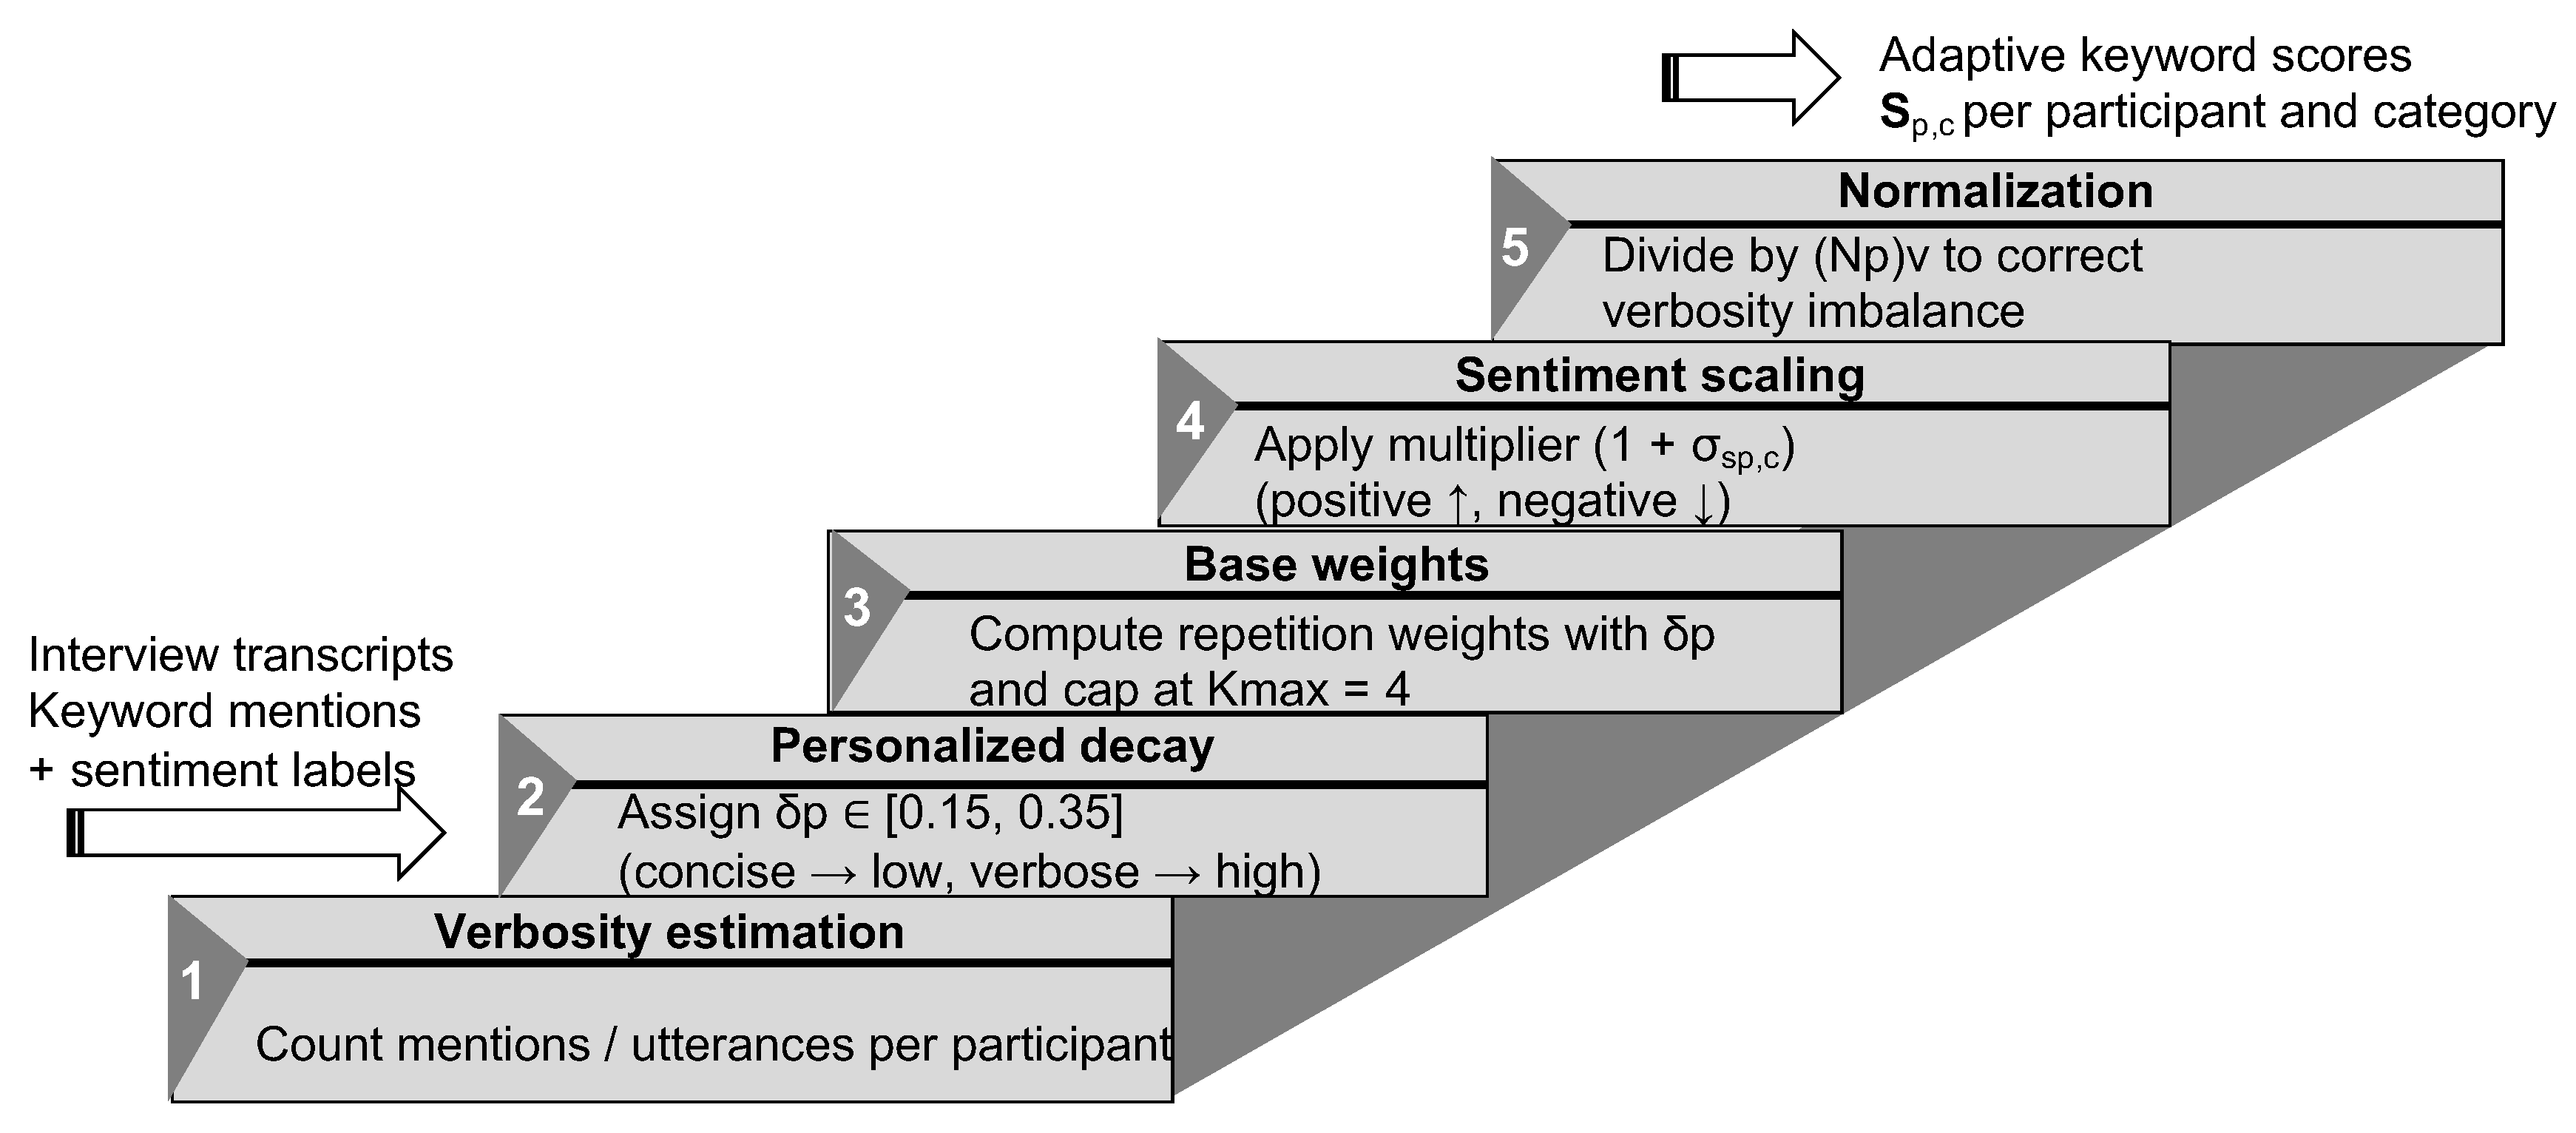
Figure 10.
Impression category scores under baseline and adaptive algorithms. The adaptive scheme reduced scores for verbose participants (P1, P6, P7) while slightly increasing P5’s contribution, achieving better balance across speaking styles.
Figure 10.
Impression category scores under baseline and adaptive algorithms. The adaptive scheme reduced scores for verbose participants (P1, P6, P7) while slightly increasing P5’s contribution, achieving better balance across speaking styles.
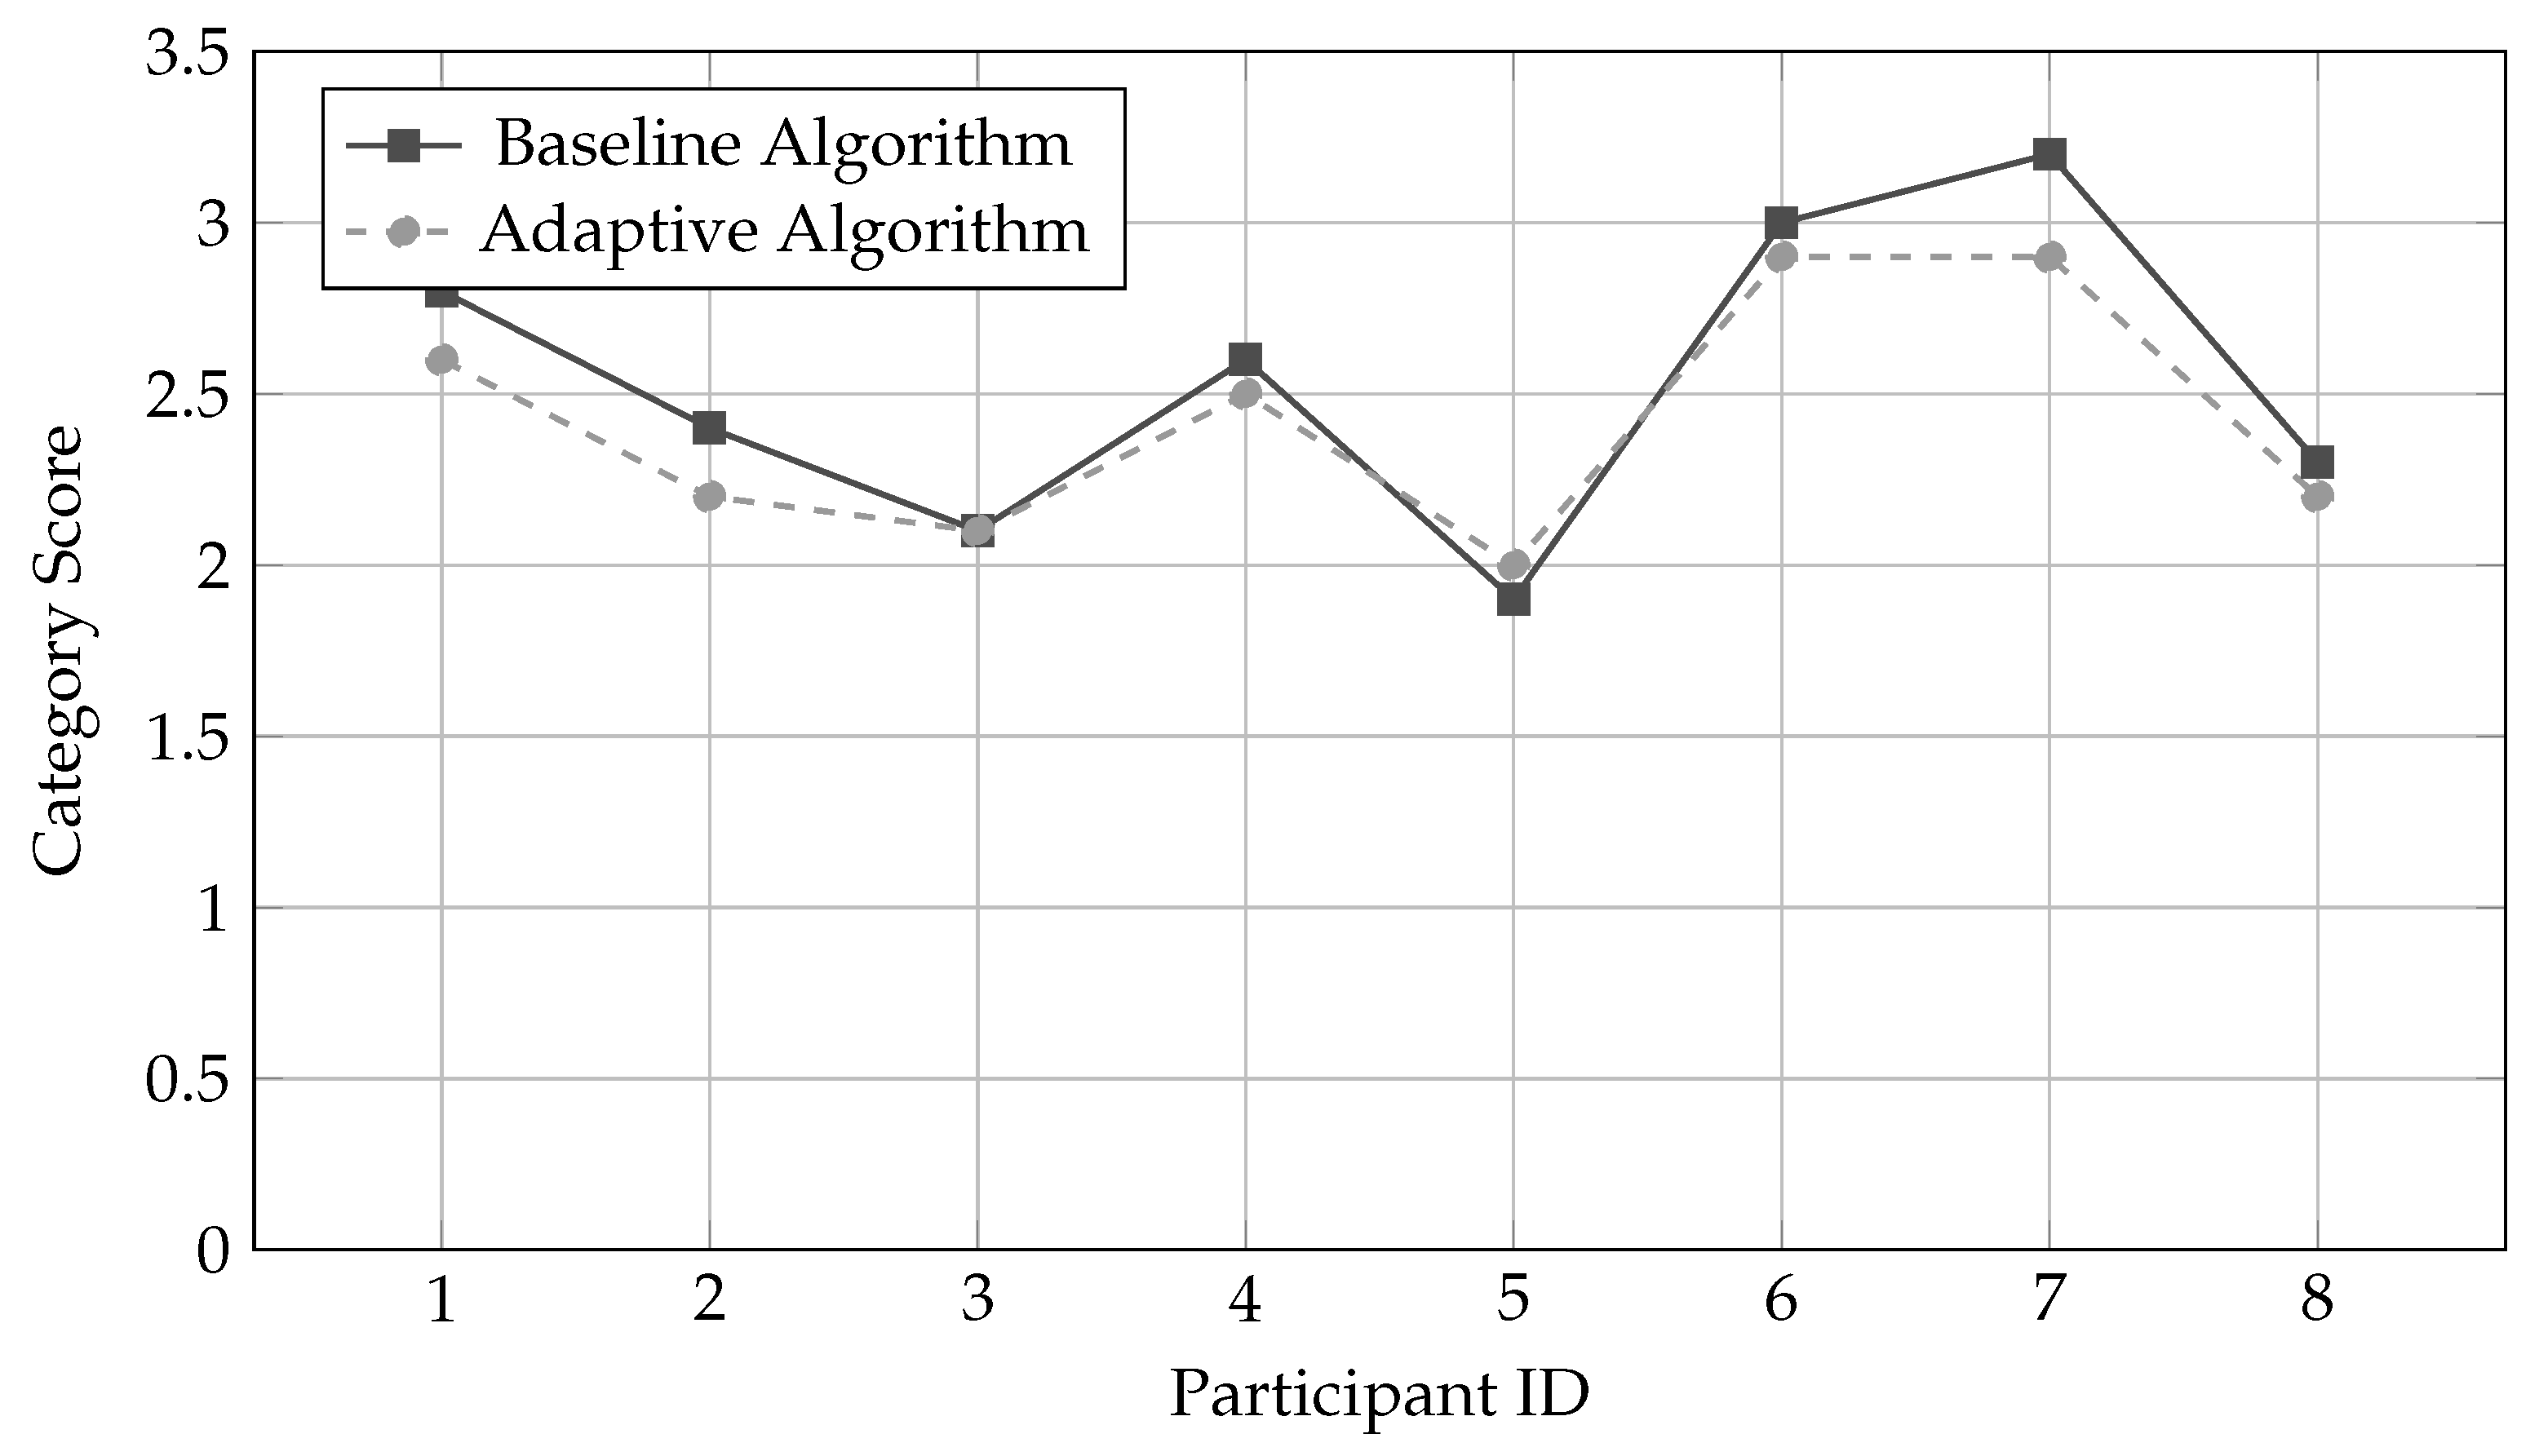
Table 1.
Weight Calculation Example for Participant 1 (Baseline Algorithm).
| Q# | Category | Speaker | Mention # | ||||
|---|---|---|---|---|---|---|---|
| 1 | Information | Interviewer | 0 | – | – | – | 0.00 |
| 1 | Information | Participant | 1 | 1 | 1.00 | 1.0 | 1.00 |
| 2 | Information | Interviewer | 0 | – | – | – | 0.00 |
| 2 | Information | Participant | 1 | 2 | 0.75 | 1.0 | 0.75 |
| 5 | Activity | Interviewer | 0 | – | – | – | 0.00 |
| 5 | Activity | Participant | 1 | 1 | 1.00 | 1.0 | 1.00 |
| 6 | Activity | Interviewer | 0 | – | – | – | 0.00 |
| 6 | Activity | Participant | 1 | 2 | 0.75 | 0.5 | 0.38 |
| 6 | Activity | Interviewer | 0 | – | – | – | 0.00 |
| 6 | Activity | Participant | 1 | 3 | 0.50 | 0.0 | 0.00 |
| Participant 1 Raw Score (partial): | 3.13 | ||||||
Table 2.
Keyword Weight Comparison: Baseline vs. Adaptive Algorithm.
| Keyword | Category | P1 | P2 | P5 | P7 | Mean | Change |
|---|---|---|---|---|---|---|---|
| Baseline Algorithm (fixed decay) | |||||||
| shaved ice | Information | 2.25 | 1.75 | 1.50 | 1.00 | 1.63 | – |
| children | Activity | 2.50 | 2.00 | 1.25 | 2.75 | 2.13 | – |
| flower shop | Information | 1.75 | 2.25 | 1.75 | 1.50 | 1.81 | – |
| seating area | Impression | 1.00 | 1.50 | 0.75 | 2.00 | 1.31 | – |
| Adaptive Algorithm (participant-specific decay + sentiment) | |||||||
| shaved ice | Information | 2.18 | 1.52 | 1.58 | 0.94 | 1.56 | -4.3% |
| children | Activity | 2.35 | 1.76 | 1.38 | 2.51 | 2.00 | -6.1% |
| flower shop | Information | 1.68 | 2.02 | 1.82 | 1.41 | 1.73 | -4.4% |
| seating area | Impression | 0.88 | 1.26 | 0.81 | 1.84 | 1.20 | -8.4% |
Table 3.
Top 5 Weighted Keywords per Category (Adaptive Algorithm).
| Category | Keyword | Aggregate Weight |
|---|---|---|
| Information | shaved ice shop | 12.48 |
| flower shop | 10.92 | |
| hot snacks | 9.36 | |
| signage/displays | 7.80 | |
| summer atmosphere | 6.24 | |
| Activity | children/child-friendly | 17.00 |
| couples | 11.56 | |
| seating/benches | 10.40 | |
| five senses | 9.88 | |
| safety concerns | 8.32 | |
| Impression | goldfish scooping | 11.70 |
| more shops needed | 10.14 | |
| seating area | 9.60 | |
| food variety | 8.58 | |
| decorations | 7.02 | |
| NA (general) | casual visit | 8.84 |
| welcoming atmosphere | 8.32 | |
| easy to drop by | 7.28 | |
| local residents | 6.76 | |
| alone-friendly | 5.20 |
Table 6.
Comparison of datasets used in P1 (previous study) and P2 (proposed study).
| Metric | EN–Video (P1) | EN–Virtual (P1) | JP–Video (P2) | JP–Virtual (P2) | Onsite (JP) |
|---|---|---|---|---|---|
| Participants (n) | 5 | 5 | 8 | 8 | 14 |
| Total turns | 410 | 230 | 274 | 160 | 269 |
| Avg. response length | 11.8 words | 13.5 words | 73.4 chars | 83.0 chars | 12.0 words |
| Avg. duration (min) | 9.2 | 11.0 | 16.0 | 12.5 | 5.2 |
| Positive sentiment ratio | 0.61 | 0.58 | 0.64 | 0.71 | 0.82 |
| Neutral sentiment ratio | 0.22 | 0.25 | 0.18 | 0.14 | 0.12 |
| Negative sentiment ratio | 0.17 | 0.17 | 0.18 | 0.15 | 0.06 |
| Unique keywords* | 112 | 97 | 142 | 98 | 47 |
| Keywords per participant | 15.3 | 12.8 | 17.8 | 12.3 | 4.3 |
Disclaimer/Publisher’s Note: The statements, opinions and data contained in all publications are solely those of the individual author(s) and contributor(s) and not of MDPI and/or the editor(s). MDPI and/or the editor(s) disclaim responsibility for any injury to people or property resulting from any ideas, methods, instructions or products referred to in the content. |
© 2025 by the authors. Licensee MDPI, Basel, Switzerland. This article is an open access article distributed under the terms and conditions of the Creative Commons Attribution (CC BY) license (http://creativecommons.org/licenses/by/4.0/).
Copyright: This open access article is published under a Creative Commons CC BY 4.0 license, which permit the free download, distribution, and reuse, provided that the author and preprint are cited in any reuse.


