Submitted:
22 December 2025
Posted:
23 December 2025
You are already at the latest version
Abstract
This study addresses four major gaps in existing research on poverty and health in Africa. First, prior studies rarely consider moderation effects, particularly how age shapes the link between poverty and health outcomes. Second, research often focuses on isolated health indicators, overlooking broader institutional factors such as healthcare access systems and corruption. Third, data and design limitations persist, especially the scarcity of longitudinal datasets. Even so, rigorous cross-sectional moderation analysis can still illuminate developmental differences. Fourth, national contexts vary widely across the continent, with differing structures of poverty and health governance that influence age-related patterns in health vulnerability. Drawing on Round 8 (2019) Afrobarometer data from 34 countries and 47,405 respondents, the study employs three sets of regression models. A complementary log-log model estimates the likelihood of going without healthcare, suitable for this relatively rare event. Negative log-log bivariate and multivariate models assess the probability of paying a bribe for healthcare and the difficulty of accessing care. These models first examine unadjusted relationships between poverty, age, and health outcomes, then incorporate controls to reveal deeper patterns. The results show that poverty consistently increases health-related disadvantages, and although education and employment contribute to understanding these effects, they do not eliminate them. Youth emerge as especially vulnerable, and once controls are included, additional inequalities—such as those linked to gender and urban–rural divides—become more apparent. The findings underscore the need for integrated policies that combine poverty reduction, youth-focused interventions, strengthened health systems, and anti-corruption efforts to advance health equity and universal health coverage across Africa.
Keywords:
youth
; health inequality
; healthcare access
; complementary log-log regression
; negative log-log bivariate
; multivariate models
; bribery
; corruption
; urbanicity
; health system
; Africa
Introduction
Health inequality remains one of the most persistent challenges in Africa, undermining human development, economic productivity, and social cohesion (Marmot, 2017; World Health Organization, 2018). Despite measurable progress in selected indicators, preventable morbidity and premature mortality continue to disproportionately affect low-income populations, particularly the youth (Goodburn & Ross, 2000; World Health Organization, 2020). The intersection of youth, poverty, and health, therefore, represents a critical nexus with implications for immediate well-being and lifelong developmental trajectories (Black et al., 2017).
Africa’s demographic structure is characterized by a pronounced youth bulge: roughly 60 percent of the population is under 25 years (United Nations, 2019). This demographic reality creates both opportunities and vulnerabilities. Young people face a dangerous convergence of health risks including communicable diseases, malnutrition, reproductive health challenges, injuries, mental health disorders, anti-microbial resistance and emerging non-communicable diseases within under-resourced health systems (Sawyer et al., 2012; WHO, 2018). Yet these risks are not evenly distributed. They interact with socioeconomic determinants, especially poverty, which limits access to quality healthcare, nutrition, housing, and information to create a cascade of health risks and inequalities (Link & Phelan, 1995; Phelan et al., 2010).
Poverty operates as a fundamental cause of health inequality, constraining the resources needed to avoid and mitigate risks, and pursue preventive or curative care (Braveman & Gottlieb, 2014). Although the adverse health effects of deprivation are well documented, less attention has been paid to whether these effects vary systematically across stages of youth development. Distinct physiological, psychological, and social processes from early adolescence to young adulthood may alter vulnerability to the consequences of poverty (Cicchetti & Rogosch, 2002).
Age as a moderating variable in the poverty–health relationship draws from life-course and developmental perspectives (Elder et al., 2003; Kuh et al., 2003). Early childhood and adolescence represent sensitive periods in which environmental stressors and limited access to care can produce lasting impacts (Shonkoff & Garner, 2012). In contrast, young adulthood introduces new exposures related to employment, family formation, and autonomy. Understanding these stage-specific pathways is essential for designing interventions that reduce health inequality over the life course (Richter et al., 2017).
Importantly, inequality in African health systems manifests not only through morbidity and mortality but also through institutional barriers, notably difficulty accessing care, receiving quality care and exposure to informal payments or bribery (Oke & Sibomana, 2025). Such systemic inequalities disproportionately burden the poor and young, who often possess limited bargaining power and weaker social capital.
This study, therefore, examines whether age moderates the relationship between poverty and two institutional dimensions of health inequality across African countries: difficulty accessing healthcare and exposure to healthcare corruption. Using nationally representative Afrobarometer data and moderation models, we test whether the poverty–health gradient differs across life stages. The findings aim to clarify developmental variations in structural vulnerability and to inform age-appropriate, equity-focused policy design.
Literature Review
Youth Health and Structural Determinants in Africa
Youth health in Africa is shaped by structural determinants operating through economic, social, environmental, and infrastructural pathways. The continent faces a dual burden of disease: enduring communicable conditions such as HIV/AIDS, malaria, and tuberculosis coexist with rising non-communicable and mental health disorders (Sawyer et al., 2012; WHO, 2018). Weak health infrastructure, constrained fiscal capacity, and wide urban–rural disparities exacerbate inequality (Van de Poel et al., 2007). Although child and maternal health indicators have improved, under-five mortality and malnutrition remain disproportionately high (ICF International, 2022; Victora et al., 2008). Adolescents and young adults additionally face reproductive and behavioral risks, including premature sexual experiences, unintended pregnancy, and sexually transmitted infections, with HIV prevalence highest among young women (Pettifor et al., 2004). Mental health disorders, substance use, and injuries from preventable accidents add to the burden yet remain under-recognized due to stigma and service scarcity (Patel et al., 2007; United Nations Children’s Fund, 2021).
Education functions as a pivotal determinant through its effects on literacy, agency, and economic opportunity (Howe et al., 2012). However, access and quality remain stratified by gender, residence, and socioeconomic status, perpetuating intergenerational inequality (Smith & Smith, 2010). Beyond direct morbidity, inequalities also manifest institutionally through barriers such as informal payments, corruption, and differential treatment within health systems. These systemic obstacles translate structural disadvantage into everyday exclusion from essential health services.
Poverty as the Fundamental Determinant of Health Inequality
The persistence of poor health outcomes among low-income groups across contexts supports the fundamental cause theory (Link & Phelan, 1995). Poverty limits access to material, social, and informational resources that protect and promote health. In Africa, deprivation encompasses multidimensional deficits in education, housing, and sanitation (Alkire & Santos, 2014). These conditions hinder preventive care, delay treatment, and expose individuals to environmental hazards (Braveman & Gottlieb, 2014). Chronic stress from financial insecurity activates physiological stress pathways that elevate disease risk (Shonkoff et al., 2009). Structural inequalities rooted in colonial histories and governance failures sustain socioeconomic gradients in nutrition, vaccination, maternal care, and adolescent health (Case et al., 2002; Mackenbach, 2012). Accordingly, poverty is both a proximal and structural determinant of health inequality and of the informal transactions that compromise healthcare integrity.
Age-Differentiated Health Vulnerability
Youth constitute a heterogeneous population spanning biologically and socially distinct stages. Developmental science emphasizes that the pathways linking poverty to health differ by stage (Chen et al., 2006). Early childhood deprivation constrains growth and neurodevelopment, producing long-term metabolic and cognitive deficits (Barker, 2007; Gluckman et al., 2007). During middle childhood, poverty disrupts schooling and social competence, lowering future health literacy and opportunity for quality care (Smith & Smith, 2010). In adolescence, emerging autonomy exposes individuals to new risks such as sexual behavior, migration, mental distress, substance use, while poverty limits mitigation options (Pettifor et al., 2004; Sawyer et al., 2012). In young adulthood, earlier deprivation constrains access to employment, family stability, and ability to access quality healthcare services (Wagmiller Jr et al., 2006). Age thus represents shifting biological and social contexts through which poverty’s health effects operate.
Theoretical Foundations for Age as a Moderator
Life-course theory posits that health trajectories reflect cumulative exposures and critical periods (Elder et al., 2003; Kuh et al., 2003). Early poverty may have irreversible biological consequences, whereas later exposures accumulate through persistent disadvantage. Cumulative inequality theory extends this argument, suggesting that disadvantage compounds over time (Ferraro et al., 2009). Developmental psychopathology further highlights differential susceptibility: poverty may influence younger children primarily via caregiving resources, and older youth through autonomy and peer environments (Cicchetti & Rogosch, 2002; McLoyd, 1998).
Two mechanisms yield contrasting expectations. If poverty acts through critical-period effects (e.g., early nutritional deprivation), younger children should show stronger poverty–health associations (Barker, 2007). If cumulative disadvantage dominates, the gradient should steepen with age as exposures persist (Ferraro et al., 2009). Testing these alternatives clarifies whether inequality is driven by early-life sensitivity or sustained exposure.
Empirical Evidence on Age-Differentiated Poverty Effects
Empirical research on age moderation remains sparse in African contexts. Studies typically control for, rather than interrogate, age interactions (Chen et al., 2006). Evidence from early childhood demonstrates steep socioeconomic gradients in stunting, underweight, and mortality (Fotso, 2007; Victora et al., 2008). Adolescent studies reveal enduring inequalities in reproductive and mental health (Patel et al., 2007; Pettifor et al., 2004), while young-adult research links prolonged poverty to constrained life chances (Wagmiller Jr et al., 2006). Cross-national analyses using Demographic and Health Surveys show that poverty–health gradients persist across youth age groups but vary by outcome: nutritional inequalities are largest in early childhood, reproductive inequalities in adolescence (ICF International, 2022). However, formal interaction tests remain rare. Evidence from higher-income settings is mixed—some support early-life sensitivity (Heckman, 2006), others cumulative disadvantage (Currie & Stabile, 2003). The lack of comparable longitudinal data in Africa underscores the value of systematic moderation tests using cross-sectional, multi-country datasets.
Rationale for the Current Study
The current study is driven by four key limitations observed in existing research. First, there is a noticeable neglect of moderation, as few studies in Africa specifically examine how age influences the relationship between poverty and health. Second, many studies tend to focus narrowly on a single health outcome, often overlooking broader institutional factors like access to healthcare and corruption issues. Third, there are limitations in data and design, with longitudinal data being scarce; however, robust cross-sectional moderation analysis can still provide valuable insights into developmental differences (ICF International, 2022). Furthermore, variations in national contexts, especially regarding the structures of poverty and health governance, can greatly influence age-related patterns in these areas.
This research addresses these gaps by using Afrobarometer survey data to test whether the relationship between poverty and health inequality varies across youth and adult populations. By operationalising inequality through difficulty in accessing healthcare and exposure to bribery in health services, and by incorporating age–poverty interaction terms, the study directly examines moderation effects. Theoretically, evidence of moderation would support life-course and cumulative-inequality perspectives; its absence would reinforce fundamental-cause theory’s claim of persistent gradients (Link & Phelan, 1995). Practically, identifying age-specific vulnerability can guide policy timing and targeting. If early deprivation exerts the greatest influence, maternal-child investments yield the highest returns; if cumulative exposure dominates, sustained poverty-reduction efforts throughout youth are essential (Richter et al., 2017).
In sum, existing research confirms poverty as a core determinant of health inequality but rarely asks when during the life course its effects are strongest. This study advances the field by empirically testing age-linked moderation of poverty’s impact on healthcare access and integrity across African contexts, thereby bridging developmental theory and structural health inequality research.
Materials and Methods
Data Source and Study Design
This study draws on data from Round 8 (2019) of the Afrobarometer survey, a cross-national public opinion survey (URL: https://www.afrobarometer.org/data/data-sets/) that collects nationally representative data on attitudes toward democracy, governance, and socio-economic conditions across African countries. The Afrobarometer survey employs a cross-sectional design, using standardised questionnaires administered through face-to-face interviews with adult respondents aged 18 years and older. For this analysis, data from 34 African countries were pooled, yielding a total sample of 47,405 respondents.
Sampling and Data Collection
Afrobarometer applies a multi-stage, stratified, cluster sampling strategy to ensure representativeness at national and regional levels. In the first stage, enumeration areas (EAs) are selected from the most recent national census frames, stratified by region and urban-rural location. In the second stage, households are randomly selected within each EA using systematic random sampling. Within selected households, one eligible adult respondent is chosen using the Kish grid method. Sampling weights provided by Afrobarometer were applied in all analyses to adjust for unequal probabilities of selection and to restore population representativeness.
Data collection was conducted by trained enumerators in the respondents’ preferred languages, ensuring cultural and linguistic appropriateness. Quality assurance procedures—such as back-checking, field supervision, and data consistency checks—were employed to maintain data integrity.
Ethical Considerations
The Afrobarometer project adheres to strict ethical standards, including obtaining informed consent from all participants before data collection. Participation was voluntary, and anonymity was guaranteed. This study utilised publicly available, de-identified secondary data and therefore did not require additional institutional ethics approval.
Measures
Dependent Variables
Three indicators of health inequality were examined:
- Gone without healthcare at least once – a binary variable (1 = yes, 0 = no) indicating whether respondents reported going without needed healthcare services at least once in the previous 12 months. Nearly 60% yes and 40% no responses were recorded for which reason a complementary log-log regression was selected.
- Paid a bribe to access healthcare – a binary variable (1 = yes, 0 = no) capturing whether respondents reported paying a bribe or gift to obtain healthcare during the same period. Almost 11% yes and 89% no responses were obtained, and negative log-log regression model was adopted.
- Difficulty in accessing healthcare – a binary variable (1 = yes, 0 = no) measuring respondents’ self-reported difficulty in obtaining medical care when needed. About 30% yes and 70% no responses were obtained, and negative log-log regression model was executed.
Independent Variables
- Poverty status was operationalised using Afrobarometer’s Lived Poverty Index (LPI), which captures the frequency with which individuals go without basic necessities such as food, clean water, or medical care. Higher scores indicate greater material deprivation.
- Age was measured as a continuous variable (in years) and re-categorised into four mutually-exclusive groups for regression models. For moderation analysis, interaction terms between age groups and poverty were constructed.
- Control variables included sex, educational attainment, employment status, urban-rural residence, and country fixed effects to account for structural and contextual variation across national settings.
Statistical Analysis
All analyses were performed using Stata 17. Descriptive statistics were computed to summarise sample characteristics. Bivariate relationships between key predictors and health inequality outcomes were first examined.
For inferential analysis, three sets of regression models were estimated:
- Bivariate complementary log-log (cloglog) regression model predicting the likelihood of having gone without healthcare at least once. The cloglog link was chosen due to the asymmetric distribution of the outcome and its appropriateness for modeling binary rare-event data.
- Bivariate and multivariate negative log-log regression models predicting the probability of paying a bribe to access healthcare. The bivariate models examined the unadjusted relationships between poverty, age, and the dependent variable, while multivariate models adjusted for all control variables.
- Bivariate and multivariate negative log-log regression models predicting difficulty in accessing healthcare, following the same modeling strategy as above.
The moderating effect of age groups on the association between poverty and each health inequality outcome was assessed by including an interaction term (poverty groups × age) in the multivariate models. Marginal effects and predictive margins were computed to facilitate interpretation of interaction effects. All models accounted for country-level clustering and applied sampling weights to produce robust standard errors. Statistical significance was set at p < 0.05.
Results
Table 1 presents the results of a bivariate negative log-log regression model predicting the likelihood of paying a bribe to access healthcare services across African countries. The model examines both the independent effects of poverty and its interaction with age, as well as several sociodemographic controls.
There is a strong, graded association between lived poverty and the odds of paying a bribe for healthcare. Compared to respondents reporting no lived poverty, those experiencing low lived poverty are 1.21 times more likely to pay a bribe (OR = 1.209, p < .001). The odds increase to 1.41 for those with moderate lived poverty (OR = 1.408, p < .001) and 1.53 for those with high lived poverty (OR = 1.530, p < .001). This consistent upward trend suggests a dose–response relationship in which increasing material deprivation systematically raises the likelihood of engaging in or being subjected to informal healthcare payments. The combined poverty–age categories reveal that youth poverty is a stronger predictor of healthcare-related bribery than adult poverty. Relative to non-poor youth, non-poor adults do not differ significantly (OR = 1.056, p = .171). However, both youth and adults within each poverty category exhibit higher odds of paying bribes, with youth consistently at greater risk. For example, minimally-poor youth have 1.29 times higher odds (p < .001) compared to 1.18 among minimally-poor adults (p < .001). Similarly, moderately-poor youth are 1.52 times more likely (p < .001) to pay a bribe, while moderately-poor adults have odds of 1.36 (p < .001). At the highest poverty level, highly-poor youth show the greatest vulnerability, with odds of 1.64 (p < .001), compared to 1.49 (p < .001) for highly-poor adults. These results indicate that age moderates the poverty–corruption relationship in accessing healthcare services: while poverty increases exposure to healthcare corruption for all, its effects are amplified among youth, possibly due to weaker social networks, lower bargaining power, or less familiarity with institutional procedures. When age is considered independently, adults (aged 36 years and above) are significantly less likely to pay bribes than youth (OR = 0.916, p < .001). This finding reinforces the protective role of maturity and accumulated social capital in navigating healthcare systems. Gender differences are not statistically significant: women are as likely as men to report paying bribes (OR = 0.989, p = .365).
Education exhibits a protective pattern against corruption. Compared to individuals with no formal education, those with secondary (OR = 0.919, p < .001) and post-secondary education (OR = 0.929, p < .001) are significantly less likely to pay bribes, while those with primary education do not differ meaningfully (p = .164). These results suggest that higher education may enhance individuals’ awareness of rights and their capacity to resist or avoid exploitative practices. Religious affiliation also plays a modest but significant role. Muslim respondents are slightly more likely than Christians to report paying bribes (OR = 1.065, p < .001), whereas respondents affiliated with other religions are less likely (OR = 0.888, p < .001). These differences likely reflect contextual variations in governance and health system integrity across regions rather than religious identity per se.
Employment status shows limited influence. Individuals actively seeking work are somewhat more likely to pay bribes (OR = 1.104, p < .001), whereas those employed part-time (OR = 1.036, p = .069) or full-time (OR = 0.991, p = .566) do not differ significantly from those not seeking work. This suggests that economic precarity, rather than employment per se, shapes vulnerability to payment of bribes in the healthcare system.
Urbanicity does not appear to influence the likelihood of paying a bribe. Respondents residing in rural areas have odds statistically indistinguishable from those in urban settings (OR = 0.996, p = .730), implying that informal healthcare payments are a widespread phenomenon cutting across geographic divides. Overall, the findings underscore a robust link between poverty and exposure to healthcare corruption, with youth poverty exerting a particularly strong effect. The interaction between age and poverty highlights how structural and generational inequalities intersect to shape unequal access to health services. While education and age provide modest protective effects, the persistence of payment of bribes to access healthcare services across socioeconomic and geographic categories suggests that corruption in healthcare is a systemic rather than localised problem, deeply intertwined with broader patterns of poverty and social exclusion in Africa.
Table 2. Presents the results of a bivariate negative log-log regression model estimating the likelihood of reporting difficulty in accessing healthcare. The model incorporates measures of lived poverty, youth–adult poverty interactions, and several sociodemographic characteristics to capture the multidimensional structure of inequality in healthcare access across African contexts.
A strong and graded relationship emerges between lived poverty and difficulty in accessing healthcare. Compared to respondents reporting no lived poverty, individuals with low lived poverty are 34% more likely to experience healthcare access difficulties (OR = 1.341, p < .001). This likelihood rises sharply to 72% higher for those with moderate lived poverty (OR = 1.720, p < .001) and more than doubles for those experiencing high lived poverty (OR = 2.010, p < .001). These results underscore a pronounced dose–response pattern, where increasing material deprivation translates into progressively greater barriers to healthcare utilisation. Poverty, in this sense, appears to directly constrain both the ability and opportunity to seek timely medical care. The interaction between poverty and age provides deeper insights into how life stage shapes the effects of deprivation. Relative to non-poor youth, non-poor adults are not significantly more likely to face healthcare difficulties (OR = 1.063, p = .082), suggesting broadly similar experiences among the economically secure. However, within every level of poverty, both youth and adults exhibit substantially higher odds of difficulty compared to non-poor youth, with the intensity of poverty amplifying the risk for both groups.
Among the minimally poor, both youth (OR = 1.383, p < .001) and adults (OR = 1.378, p < .001) report a similar increase in difficulty. As deprivation deepens, the odds escalate markedly—moderately-poor youth are 1.80 times more likely to face access challenges (p < .001), compared to 1.74 times for moderately-poor adults (p < .001). At the highest levels of poverty, both highly-poor youth (OR = 2.075, p < .001) and highly-poor adults (OR = 2.065, p < .001) face roughly double the odds of experiencing healthcare access difficulties relative to non-poor youth. Overall, while both age groups experience the negative consequences of poverty, youth do not appear distinctly advantaged or disadvantaged once poverty level is considered; rather, poverty itself remains the overriding determinant of healthcare access difficulty.
When examined independently, life stage does not significantly predict healthcare access difficulty. Adults (aged 36 years and older) are no more or less likely than youth to report such challenges (OR = 0.991, p = .461). This finding suggests that structural and economic conditions, rather than age alone, drive healthcare access inequalities. Gender, however, shows a modest but statistically significant effect. Women are slightly more likely than men to experience difficulty accessing healthcare (OR = 1.033, p = .005). Though the effect size is small, this finding aligns with broader evidence of gendered disparities in healthcare systems, possibly reflecting constraints such as caregiving responsibilities, financial dependency, or gender bias within service delivery.
Educational attainment is inversely associated with difficulty in accessing healthcare. Compared to respondents with no formal education, those with primary (OR = 0.963, p = .030), secondary (OR = 0.953, p = .003), and post-secondary education (OR = 0.922, p < .001) are progressively less likely to face access barriers. These findings highlight the protective role of education—through increased health literacy, resourcefulness, and familiarity with bureaucratic systems—in mitigating access challenges. Religion also plays a modest but consistent role. Muslim respondents are more likely than Christians to report difficulty in accessing healthcare (OR = 1.075, p < .001), whereas those affiliated with other religions are significantly less likely (OR = 0.857, p < .001). These patterns likely reflect contextual or regional differences in the organisation and accessibility of healthcare services rather than religious affiliation itself. Employment status exhibits mixed associations. Individuals actively seeking work are slightly more likely to experience difficulty, though not significantly (OR = 1.024, p = .101). Part-time workers show no significant difference (OR = 1.014, p = .464), while those employed full-time are significantly less likely to report healthcare access difficulties (OR = 0.938, p < .001). Stable employment may therefore buffer against access barriers by providing income security, time flexibility, or access to employment-related healthcare benefits.
Also, urbanicity does not significantly predict healthcare access difficulty. Respondents in rural areas are statistically indistinguishable from those in urban settings (OR = 0.994, p = .591). This finding suggests that healthcare access challenges are pervasive across both rural and urban contexts, pointing to systemic barriers rather than geographically isolated issues.
Table 3 and Figure 1 present estimates from the multivariate negative log-log regression model predicting the likelihood of paying a bribe to access healthcare. This model builds on the earlier bivariate analysis by including a range of socioeconomic and demographic covariates to isolate the unique contribution of poverty and life-stage interactions to healthcare corruption.
In the multivariate model, the effects of youth and adult poverty remain robust and statistically significant, even after controlling for education, employment, religion, and urbanicity. The general pattern mirrors that of the bivariate model but with slightly attenuated odds ratios—suggesting that part of the observed bivariate relationship between poverty and bribe-paying is mediated by socioeconomic resources (particularly education and employment). Compared to non-poor youth, both youth and adults in poverty categories exhibit elevated odds of paying a bribe, with the likelihood increasing consistently across poverty intensity. Minimally-poor youth have odds ratios around 1.29–1.30 (p < .001), moderately-poor youth around 1.51 (p < .001), and highly-poor youth approximately 1.63 (p < .001). Adults show a parallel gradient, with minimally-poor adults at 1.17, moderately-poor adults at 1.35, and highly-poor adults at 1.48 (p < .001). This persistence across models confirms that poverty exerts a direct and independent effect on the likelihood of paying bribes to access healthcare, consistent with a structural interpretation of corruption exposure as a function of material deprivation. The relative stability of coefficients—despite controlling for multiple mediators—indicates that education and employment do not fully account for the effect of poverty, though they partially attenuate it.
When comparing youth and adult poverty categories, the magnitude of odds ratios remains consistently higher among youth than adults at equivalent poverty levels, echoing the bivariate findings. This suggests that age moderates the effect of poverty: young people in poverty are relatively more exposed to corrupt healthcare demands than their adult counterparts. However, the difference narrows slightly in the multivariate model, implying that part of the earlier age gap was suppressed by omitted socioeconomic variables. Once controls for education and employment are introduced, some of the vulnerability associated with youthhood appears to be mediated by these covariates rather than age per se. Interestingly, the life stage variable (“Adult 36 years or older”) was omitted due to collinearity, reflecting that once youth/adult poverty interaction terms were introduced, age as an independent predictor no longer contributed unique explanatory variance. This reinforces the interpretation that the impact of age is conditional on poverty level, not independent of it.
Gender becomes weakly significant in the fully adjusted model, with women slightly less likely than men to report paying a bribe (OR = 0.975, p = .040). This effect, absent or marginal in the bivariate model, suggests a mild suppression effect where gender’s relationship with bribery only becomes evident after accounting for education, religion, and employment. The direction of the association implies that once structural disadvantages are controlled for, women may be marginally less exposed to corrupt exchanges in healthcare settings, possibly due to differing service use patterns or social expectations in provider interactions. Educational attainment continues to play a protective role, though its magnitude diminishes once other covariates are introduced. In the multivariate model, secondary education (OR = 0.923, p < .001) and post-secondary education (OR = 0.955, p = .038) remain significantly associated with lower odds of paying bribes, while primary education is non-significant. The slight attenuation of these effects relative to the bivariate results suggests partial mediation through employment status, education reduces exposure to corruption partly by improving one’s economic standing or institutional literacy.
Religious affiliation retains a consistent and statistically significant effect. Muslims remain more likely than Christians to report bribery (OR = 1.067, p < .001), whereas respondents of other religions remain less likely (OR = 0.892, p < .001). The stability of these coefficients across models indicates that religious differences are not mediated by education, employment, or location, but may instead reflect contextual governance or institutional variations across regions.
Employment status also becomes a significant determinant once introduced. Individuals actively seeking work (OR = 1.094, p < .001) and those employed part-time (OR = 1.049, p = .014) or full-time (OR = 1.045, p = .010) are all more likely to pay bribes than those not looking for work. This contrasts with the bivariate model, where employment effects were weaker or insignificant. The reversal in sign for full-time employment (now positively associated) signals a suppression effect, suggesting that after controlling for poverty and education, those in paid employment may encounter the healthcare system more frequently, thereby increasing their exposure to corrupt demands rather than insulating them from it. Urbanicity retains its negative and significant association with bribe-paying. Rural residents are less likely to report paying a bribe than urban counterparts (OR = 0.948, p < .001). This effect, absent in the bivariate model, may reflect a contextual mediation: once socioeconomic and employment differences are controlled for, rural populations that may face greater access barriers overall have fewer direct encounters with healthcare providers, reducing opportunities for bribery.
Table 4 and Figure 2 present findings from the multivariate negative log-log regression model predicting the likelihood of reporting difficulty in accessing healthcare services across African countries. The model controls for gender, education, religion, employment, and urbanicity, allowing for a more refined understanding of how poverty and age jointly shape healthcare access challenges.
After adjustment, the strong and graded association between poverty and difficulty in accessing healthcare persists, though with slightly magnified odds ratios, suggesting that the relationship between poverty and access difficulties is direct and robust, rather than fully explained by socioeconomic covariates. Relative to non-poor youth, individuals in all poverty categories remain significantly more likely to report difficulties. For instance, minimally-poor youth have odds ratios around 1.39 (p < .001), moderately-poor youth around 1.84 (p < .001), and highly-poor youth approximately 2.13 (p < .001). Adults follow a similar pattern, with minimally-poor adults at 1.41, moderately-poor adults at 1.79, and highly-poor adults at 2.15 (all p < .001). The consistency and magnitude of these coefficients across models indicate that poverty’s effect on healthcare access is largely unmediated by education, employment, or urbanicity. Indeed, compared to the bivariate model, poverty effects become slightly stronger in the multivariate model — a hallmark of a suppression effect, where omitted variables in the simpler model (e.g., education or employment) were negatively correlated with poverty and partially concealed its true impact. When these controls are introduced, the underlying strength of poverty’s association with access difficulty becomes more visible. The youth–adult interaction terms again confirm that both age groups experience the adverse effects of poverty, but the difference between them remains modest. In both the bivariate and multivariate models, the youth and adult odds ratios are nearly parallel within each poverty level, suggesting that poverty exerts a universal effect on healthcare access across the life course. The persistence of similar odds between moderately and highly-poor youth and adults suggests that age does not significantly moderate the poverty–access relationship once controls are introduced. In other words, while youth and adults both experience steep declines in healthcare accessibility with rising poverty, this decline is driven more by structural deprivation than by age-related differences in social capital or health system familiarity.
Interestingly, the life stage variable (adult = 36+ years) was omitted due to collinearity, indicating that the interaction terms between age and poverty fully capture the age-based variation in healthcare access. Thus, the moderating role of age is entirely conditional on poverty status rather than age alone, pointing to a poverty-dependent life-stage effect.
Gender effects become more consistent and statistically significant after adjustment. Females are slightly more likely to report difficulty in accessing healthcare (OR ≈ 1.03, p < .01), a relationship that was weak or non-significant in the bivariate model. This suggests a suppression effect where the introduction of covariates such as employment and education uncovers a latent gender disparity that was previously masked. The direction of the relationship implies that women’s structural disadvantages (e.g., caregiving responsibilities, lower mobility, or limited healthcare autonomy) persist even when socioeconomic differences are accounted for. The educational pattern shifts meaningfully from the bivariate to the multivariate model. In the bivariate model, higher education was associated with reduced odds of healthcare difficulty, but in the multivariate model, this relationship becomes positive or non-significant. Respondents with secondary education now show slightly higher odds (OR ≈ 1.06, p < .05 in some specifications), while post-secondary education remains positively associated (OR ≈ 1.05–1.08, p < .05).
This inversion indicates a mediation and suppression dynamic: once income and employment are held constant, education alone does not guarantee easier healthcare access and in some cases, more educated individuals may face higher expectations, greater dissatisfaction with service quality, or greater willingness to report difficulties. In short, the protective effect of education observed bivariately is mediated by the material advantages and job stability it affords, not by education itself.
Religious differences persist even after controlling for socioeconomic factors. Muslim respondents remain significantly more likely than Christians to report difficulties (OR ≈ 1.08, p < .001), while members of other religions continue to be less likely (OR ≈ 0.88, p < .001). The stability of these coefficients across models suggests that religious variation in healthcare access reflects contextual or structural factors such as regional governance differences or health system disparities rather than compositional differences in wealth or education. Employment effects are subtle. Part-time workers are marginally more likely to report difficulty (OR ≈ 1.04–1.05, p < .05), whereas those actively looking for work or working full time show no significant differences. This contrasts with the bivariate pattern, where unemployment was associated with greater difficulty. The shift implies a suppression effect: once poverty and education are controlled for, employment may no longer operate as a protective factor. Instead, those who are employed (especially part-time) might encounter healthcare systems more often, thereby being more aware of and more likely to report difficulties. Urbanicity retains its significant and negative association with healthcare difficulty. Rural residents are less likely than urban dwellers to report challenges (OR = 0.93, p < .001). However, this result likely reflects contextual mediation: after adjusting for poverty and employment, rural respondents may have fewer interactions with the formal healthcare system, thus reporting fewer difficulties not because of better access, but because of lower utilisation or lower expectations.
Discussion
This study set out to examine how poverty and age jointly shape two dimensions of healthcare inequality, namely, corruption (measured as paying a bribe for care) and access difficulties among youth and adults in African settings. The findings are revealing: poverty exerts a robust and graded effect on both outcomes, and while age in isolation plays a limited role, youth in poverty are especially vulnerable. Moreover, the transition from bivariate to multivariate modelling illuminate mediation, moderation and suppression processes that refine our understanding of the mechanisms at work.
Poverty as a Core Determinant of Healthcare Inequality
Consistent with prior research (Asongu & Diop, 2025; Justesen & Bjørnskov, 2014; Nwokolo et al., 2025), our results show that material deprivation measured through “lived poverty” indices and youth/adult poverty categories is strongly associated with both increased odds of paying bribes and increased odds of difficulty accessing care. For example, individuals with moderate to high lived poverty were substantially more likely to pay bribes, and similarly more likely to report access difficulties, with odds ratios exceeding 1.7 in the multivariate access model. These findings align closely with earlier work suggesting that corruption in the health sector is itself a barrier to access, including work showing that respondents who had paid bribes were about four times more likely to report difficulty obtaining care (Hsiao et al., 2019). The dose–response gradient in our models underscores the structural nature of these inequalities: as deprivation intensifies, vulnerability to healthcare corruption and access barriers rises sharply. Furthermore, the fact that the effects of poverty remain strong even when controlling for education, employment, religion, gender and urbanicity suggests that poverty is not merely a proxy for these other factors but rather operates as a direct structural constraint. In other words, having less material means or greater deprivation appears to limit one’s ability to escape corrupt demands (e.g., paying bribes) and to navigate access to health services in the first place.
Age, Youth Vulnerability, and the Moderation of Poverty
Our analyses show that while a simple adult vs. youth dichotomy is not a strong independent predictor (after controlling for other factors), age moderates the effect of poverty. This builds on the extant literature (e.g., Asongu & Diop, 2025; Gao et al., 2022). Youth in poverty, particularly the minimally-poor, moderately-poor and highly-poor youth categories—exhibit higher odds of paying bribes than their adult counterparts at the same poverty level. This pattern held in both bivariate and multivariate models, indicating that younger individuals are more exposed to corrupt practices when impoverished. This aligns with a vulnerability hypothesis: youth may have weaker social networks, less institutional experience, and fewer resources to cope with or resist informal payments. Some studies point to this phenomenon (Han, 2023; Rock et al., 2016; Stahl & Kassa, 2022). The moderation effect is nuanced. Once socioeconomic controls are included, the age difference shrinks, suggesting that part of youth vulnerability is mediated by education and employment deficits (youth are more likely to lack both). However, because youth still fare worse even when those are controlled, the moderation is not fully explained by mediated pathways. It appears to reflect generational-level vulnerability embedded in structural contexts. Thus, while poverty is the engine of inequality, the age lens adds nuance: youth poverty is more pernicious than adult poverty, indicating that policy and programming must attend not only to economic status but to life stage.
Mediation and Suppression Effects: What the Multivariate Transition Reveals?
By comparing bivariate and multivariate models we are able to trace how other factors play mediating or suppressing roles. First, the attenuation (or in the access model, slight strengthening) of poverty coefficients when education and employment are included suggests partial mediation: part of poverty’s effect works through limited access to education and labour market opportunities. However, the fact that the poverty effect remains substantial implies incomplete mediation, i.e., education and employment only explain part of the story. Second, the emergence of significant effects for gender (women slightly more likely to report difficulty), urbanicity (rural residents slightly less likely to report difficulty) and employment (part-time working associated with greater difficulty) in multivariate but not bivariate models indicate suppression or hidden relationships. For example, in the access model, more educated respondents appear more likely to report difficulty once controls are introduced, a counterintuitive result that may reflect more educated individuals having higher expectations of service, or being more aware of system failings. This shift suggests that education’s protective effect may be overestimated in simpler models if one does not adjust for structural exposures such as poverty and corruption. Furthermore, the suppressed effect of rural-residence in the bribery model (i.e., rural residents slightly less likely to report paying a bribe once other factors are controlled) may suggest that rural service environments offer fewer opportunities for informal payments simply because of lower service availability or different provider–patient dynamics, hinting at contextual mediation by service supply constraints.
Healthcare Integrity vs. Accessibility: Distinct but Connected Outcomes
An important contribution of this research is the parallel modelling of two outcomes, bribe-paying and access difficulty, and the observation that poverty affects both, though perhaps via slightly different mechanisms. For instance, the odds ratios for poverty in the access difficulty model are generally higher than in the bribery model, indicating the magnitude of effect is greater when the outcome is not simply paying bribes but failing to access care altogether. This suggests that material deprivation impedes not only corrupt interactions but also basic entry into the healthcare system (Kabia et al., 2021). Moreover, the interplay between bribery and access difficulties documented in other literature (e.g., those who pay bribes are much more likely to report access problems) (Hsiao et al., 2019; Naher et al., 2020) means that corruption and access obstacles are two sides of the same coin: impoverished individuals may face both extra financial demands (bribes) and diminished ability to navigate or obtain services.
Policy and Research Implications
First, strategies aimed at improving health equity in Africa must confront poverty reduction and youth vulnerability directly, focusing only on health system supply (clinics, staff) or general anti-corruption campaigns is insufficient if large swathes of the population lack the resources to engage with the system in the first place. Second, anti-corruption interventions (such as behavioural change campaigns against bribe culture in health services) are necessary but may be insufficient without addressing structural drivers of vulnerability. As prior studies (e.g., Bukari et al., 2024; Naher et al., 2020; Sommersguter-Reichmann & Reichmann, 2024) show, social norms (e.g., gift-giving codes) sustain petty corruption unless the underlying material and socio-structural constraints are addressed. Therefore, programmes that integrate social protection, reduce lived- poverty and strengthen youth socio-economic inclusion, as well as improvements in the behaviour of service providers, may help reduce bribery. Third, because youth poverty is especially consequential, interventions that target young people’s access to education, employment, and institutional literacy may serve as preventative mechanisms against both corruption exposure and access failure. Moreover, future research should explore longitudinal mechanisms (how youth poverty unfolds over time into adulthood), and examine contextual supply-side factors (distance, facility quality, provider behaviour) alongside demand-side poverty factors. Mixed-method studies could illuminate how corrupt practices vary across rural/urban, age-group, and poverty strata, thereby refining policy targeting.
Limitations
The cross-sectional design prevents causal inference. While poverty is strongly associated with outcomes, reverse causality (healthcare access problems leading to poverty) cannot be ruled out. Self-reported measures may be subject to recall or social desirability bias, especially regarding bribe-paying. Also, although the sample spans multiple countries, variation in national health systems and corruption levels may limit generalisability to specific contexts. We were also unable to determine which department in the healthcare delivery continuum was more prone to accepting bribes (Laboratory, Out-Patient-Department, Wards, or Finance).
Conclusion
This study reinforces that lived poverty remains the fundamental axis of healthcare inequality in African settings, shaping both corruption exposure and access difficulty, and that youth living in poverty are particularly disadvantaged. The mediation and suppression analyses reveal complex mechanisms: education and employment matter, but they do not eliminate poverty’s effects; youth status aggravates vulnerability; and previously hidden inequalities (gender, urban/rural) become visible with proper controls. Addressing these challenges requires policies that marry poverty alleviation, youth empowerment, health system strengthening, and anti-corruption action in an integrated fashion. Only then can the continent move meaningfully towards the twin goals of health equity and universal health coverage.
Funding
This research received no specific grant from any funding agency in the public, commercial, or not-for-profit sectors.
References
- Alkire, S.; Santos, M. E. Measuring Acute Poverty in the Developing World: Robustness and Scope of the Multidimensional Poverty Index. World Development 2014, 59, 251–274. [Google Scholar] [CrossRef]
- Asongu, S. A.; Diop, S. Bribing to Escape Poverty in Africa. International Journal of Public Administration 2025, 48(1), 30–42. [Google Scholar] [CrossRef]
- Barker, D. J. The origins of the developmental origins theory. J Intern Med 2007, 261(5), 412–417. [Google Scholar] [CrossRef] [PubMed]
- Black, M. M.; Walker, S. P.; Fernald, L. C. H.; Andersen, C. T.; DiGirolamo, A. M.; Lu, C.; Grantham-McGregor, S. Early childhood development coming of age: science through the life course. Lancet 2017, 389(10064), 77–90. [Google Scholar] [CrossRef]
- Braveman, P.; Gottlieb, L. The social determinants of health: it’s time to consider the causes of the causes. Public Health Rep 2014, 129 Suppl 2(Suppl 2), 19–31. [Google Scholar] [CrossRef]
- Bukari, C.; Seth, S.; Yalonetkzy, G. Corruption can cause healthcare deprivation: Evidence from 29 sub-Saharan African countries. World Development 2024, 180, 106630. [Google Scholar] [CrossRef]
- Case, A.; Lubotsky, D.; Paxson, C. Economic Status and Health in Childhood: The Origins of the Gradient. Am Econ Rev 2002, 92(5), 1308–1334. [Google Scholar] [CrossRef]
- Chen, E.; Martin, A. D.; Matthews, K. A. Understanding Health Disparities: The Role of Race and Socioeconomic Status in Children’s Health. American Journal of Public Health 2006, 96(4), 702–708. [Google Scholar] [CrossRef]
- Cicchetti, D.; Rogosch, F. A. A developmental psychopathology perspective on adolescence. J Consult Clin Psychol 2002, 70(1), 6–20. [Google Scholar] [CrossRef]
- Currie, J.; Stabile, M. Socioeconomic Status and Child Health: Why Is the Relationship Stronger for Older Children? Am Econ Rev 2003, 93(5), 1813–1823. [Google Scholar] [CrossRef]
- Elder, G. H.; Johnson, M. K.; Crosnoe, R. The Emergence and Development of Life Course Theory. In Handbook of the Life Course; Mortimer, J. T., Shanahan, M. J., Eds.; Springer US, 2003; pp. 3–19. [Google Scholar] [CrossRef]
- Ferraro, K. F.; Shippee, T. P.; Schafer, M. H. Cumulative inequality theory for research on aging and the life course. 2009. [Google Scholar]
- Fotso, J.-C. Urban–rural differentials in child malnutrition: Trends and socioeconomic correlates in sub-Saharan Africa. Health & Place 2007, 13(1), 205–223. [Google Scholar] [CrossRef]
- Gao, Q.; Prina, A. M.; Ma, Y.; Aceituno, D.; Mayston, R. Inequalities in Older age and Primary Health Care Utilization in Low- and Middle-Income Countries: A Systematic Review. Int J Health Serv 2022, 52(1), 99–114. [Google Scholar] [CrossRef] [PubMed]
- Gluckman, P. D.; Hanson, M. A.; Beedle, A. S. Early life events and their consequences for later disease: a life history and evolutionary perspective. Am J Hum Biol 2007, 19(1), 1–19. [Google Scholar] [CrossRef]
- Goodburn, E. A.; Ross, D. Young people’s health in developing countries: A neglected problem and opportunity. Health policy and planning 2000, 15, 137–144. [Google Scholar] [CrossRef]
- Han, J. Examining Determinants of Corruption at the Individual Level in South Asia. Economies 2023, 11(7). [Google Scholar] [CrossRef]
- Heckman, J. J. Skill formation and the economics of investing in disadvantaged children. Science 2006, 312(5782), 1900–1902. [Google Scholar] [CrossRef]
- Howe, L. D.; Galobardes, B.; Matijasevich, A.; Gordon, D.; Johnston, D.; Onwujekwe, O.; Hargreaves, J. R. Measuring socio-economic position for epidemiological studies in low- and middle-income countries: a methods of measurement in epidemiology paper. Int J Epidemiol 2012, 41(3), 871–886. [Google Scholar] [CrossRef]
- Hsiao, A.; Vogt, V.; Quentin, W. Effect of corruption on perceived difficulties in healthcare access in sub-Saharan Africa. PLoS One 2019, 14(8), e0220583. [Google Scholar] [CrossRef]
- ICF International. Demographic and Health Surveys (DHS) Program: Key Indicators Report; M. I. Calverton, 2022. [Google Scholar]
- Justesen, M. K.; Bjørnskov, C. Exploiting the Poor: Bureaucratic Corruption and Poverty in Africa. World Development 2014, 58, 106–115. [Google Scholar] [CrossRef]
- Kabia, E.; Goodman, C.; Balabanova, D.; Muraya, K.; Molyneux, S.; Barasa, E. The hidden financial burden of healthcare: a systematic literature review of informal payments in Sub-Saharan Africa. Wellcome Open Research 2021, 6, 297. [Google Scholar] [CrossRef]
- Kuh, D.; Ben-Shlomo, Y.; Lynch, J.; Hallqvist, J.; Power, C. Life course epidemiology. J Epidemiol Community Health 2003, 57(10), 778–783. [Google Scholar] [CrossRef] [PubMed]
- Link, B. G.; Phelan, J. Social conditions as fundamental causes of disease. J Health Soc Behav 1995, Spec No, 80–94. [Google Scholar] [CrossRef] [PubMed]
- Mackenbach, J. P. The persistence of health inequalities in modern welfare states: the explanation of a paradox. Soc Sci Med 2012, 75(4), 761–769. [Google Scholar] [CrossRef] [PubMed]
- Marmot, M. The Health Gap: The Challenge of an Unequal World: the argument. Int J Epidemiol 2017, 46(4), 1312–1318. [Google Scholar] [CrossRef]
- McLoyd, V. C. Socioeconomic disadvantage and child development. Am Psychol 1998, 53(2), 185–204. [Google Scholar] [CrossRef]
- Naher, N.; Hoque, R.; Hassan, M. S.; Balabanova, D.; Adams, A. M.; Ahmed, S. M. The influence of corruption and governance in the delivery of frontline health care services in the public sector: a scoping review of current and future prospects in low and middle-income countries of south and south-east Asia. BMC public health 2020, 20(1), 880. [Google Scholar] [CrossRef]
- Nwokolo, C.; Onwujekwe, O.; McKee, M.; Ojiakor, I.; Angell, B.; Balabanova, D. Household health-seeking behaviour and response to Informal payment: does economic status matter? Health Economics Review 2025, 15(1), 83. [Google Scholar] [CrossRef]
- Oke, G. I.; Sibomana, O. Understanding Health Inequality, Disparity and Inequity in Africa: A Rapid Review of Concepts, Root Causes, and Strategic Solutions. Public Health Chall 2025, 4(1), e70040. [Google Scholar] [CrossRef]
- Patel, V.; Flisher, A. J.; Hetrick, S.; McGorry, P. Mental health of young people: a global public-health challenge. Lancet 2007, 369(9569), 1302–1313. [Google Scholar] [CrossRef]
- Pettifor, A. E.; van der Straten, A.; Dunbar, M. S.; Shiboski, S. C.; Padian, N. S. Early age of first sex: a risk factor for HIV infection among women in Zimbabwe. Aids 2004, 18(10), 1435–1442. [Google Scholar] [CrossRef]
- Phelan, J. C.; Link, B. G.; Tehranifar, P. Social conditions as fundamental causes of health inequalities: theory, evidence, and policy implications. J Health Soc Behav 2010, 51 Suppl, S28–40. [Google Scholar] [CrossRef] [PubMed]
- Richter, L. M.; Daelmans, B.; Lombardi, J.; Heymann, J.; Boo, F. L.; Behrman, J. R.; Darmstadt, G. L. Investing in the foundation of sustainable development: pathways to scale up for early childhood development. Lancet 2017, 389(10064), 103–118. [Google Scholar] [CrossRef] [PubMed]
- Rock, A.; Barrington, C.; Abdoulayi, S.; Tsoka, M.; Mvula, P.; Handa, S. Social networks, social participation, and health among youth living in extreme poverty in rural Malawi. Social science & medicine 2016, 170, 55–62. [Google Scholar] [CrossRef]
- Sawyer, S. M.; Afifi, R. A.; Bearinger, L. H.; Blakemore, S. J.; Dick, B.; Ezeh, A. C.; Patton, G. C. Adolescence: a foundation for future health. Lancet 2012, 379(9826), 1630–1640. [Google Scholar] [CrossRef]
- Shonkoff, J. P.; Boyce, W. T.; McEwen, B. S. Neuroscience, molecular biology, and the childhood roots of health disparities: building a new framework for health promotion and disease prevention. Jama 2009, 301(21), 2252–2259. [Google Scholar] [CrossRef]
- Shonkoff, J. P.; Garner, A. S. The lifelong effects of early childhood adversity and toxic stress. Pediatrics 2012, 129(1), e232-246. [Google Scholar] [CrossRef]
- Smith, J. P.; Smith, G. C. Long-term economic costs of psychological problems during childhood. Soc Sci Med 2010, 71(1), 110–115. [Google Scholar] [CrossRef]
- Sommersguter-Reichmann, M.; Reichmann, G. Untangling the corruption maze: exploring the complexity of corruption in the health sector. Health Econ Rev 2024, 14(1), 50. [Google Scholar] [CrossRef]
- Stahl, C.; Kassa, S. The ambivalence of social networks and their role in spurring and potential for curbing petty corruption: Comparative insights from East Africa. In Basel Institute on Governance; 2022. [Google Scholar]
- United Nations Children’s Fund. The State of the World’s Children 2021: On My Mind—Promoting, protecting and caring for children’s mental health; Unicef: New York, Issue, 2021. [Google Scholar]
- Van de Poel, E.; O’Donnell, O.; Van Doorslaer, E. Are urban children really healthier? Evidence from 47 developing countries. Soc Sci Med 2007, 65(10), 1986–2003. [Google Scholar] [CrossRef]
- Victora, C. G.; Adair, L.; Fall, C.; Hallal, P. C.; Martorell, R.; Richter, L.; Sachdev, H. S. Maternal and child undernutrition: consequences for adult health and human capital. The Lancet 2008, 371(9609), 340–357. [Google Scholar] [CrossRef]
- Wagmiller, R. L., Jr.; Lennon, M. C.; Kuang, L.; Aber, J. L.; Alberti, P. M. The Dynamics of Economic Disadvantage and Children’s Life Chances. American Sociological Review 2006, 71(5), 847–866. [Google Scholar] [CrossRef]
- WHO, G. WHO methods and data sources for life tables 1990-2016. Global health estimates technical paper; 2018. [Google Scholar]
- World Health Organization. Global status report on alcohol and health 2018; World Health Organization, 2018. [Google Scholar]
- World Health Organization. World health statistics 2020 2020.
Figure 1.
Likelihood of paying bribe to access healthcare and demographic factors.
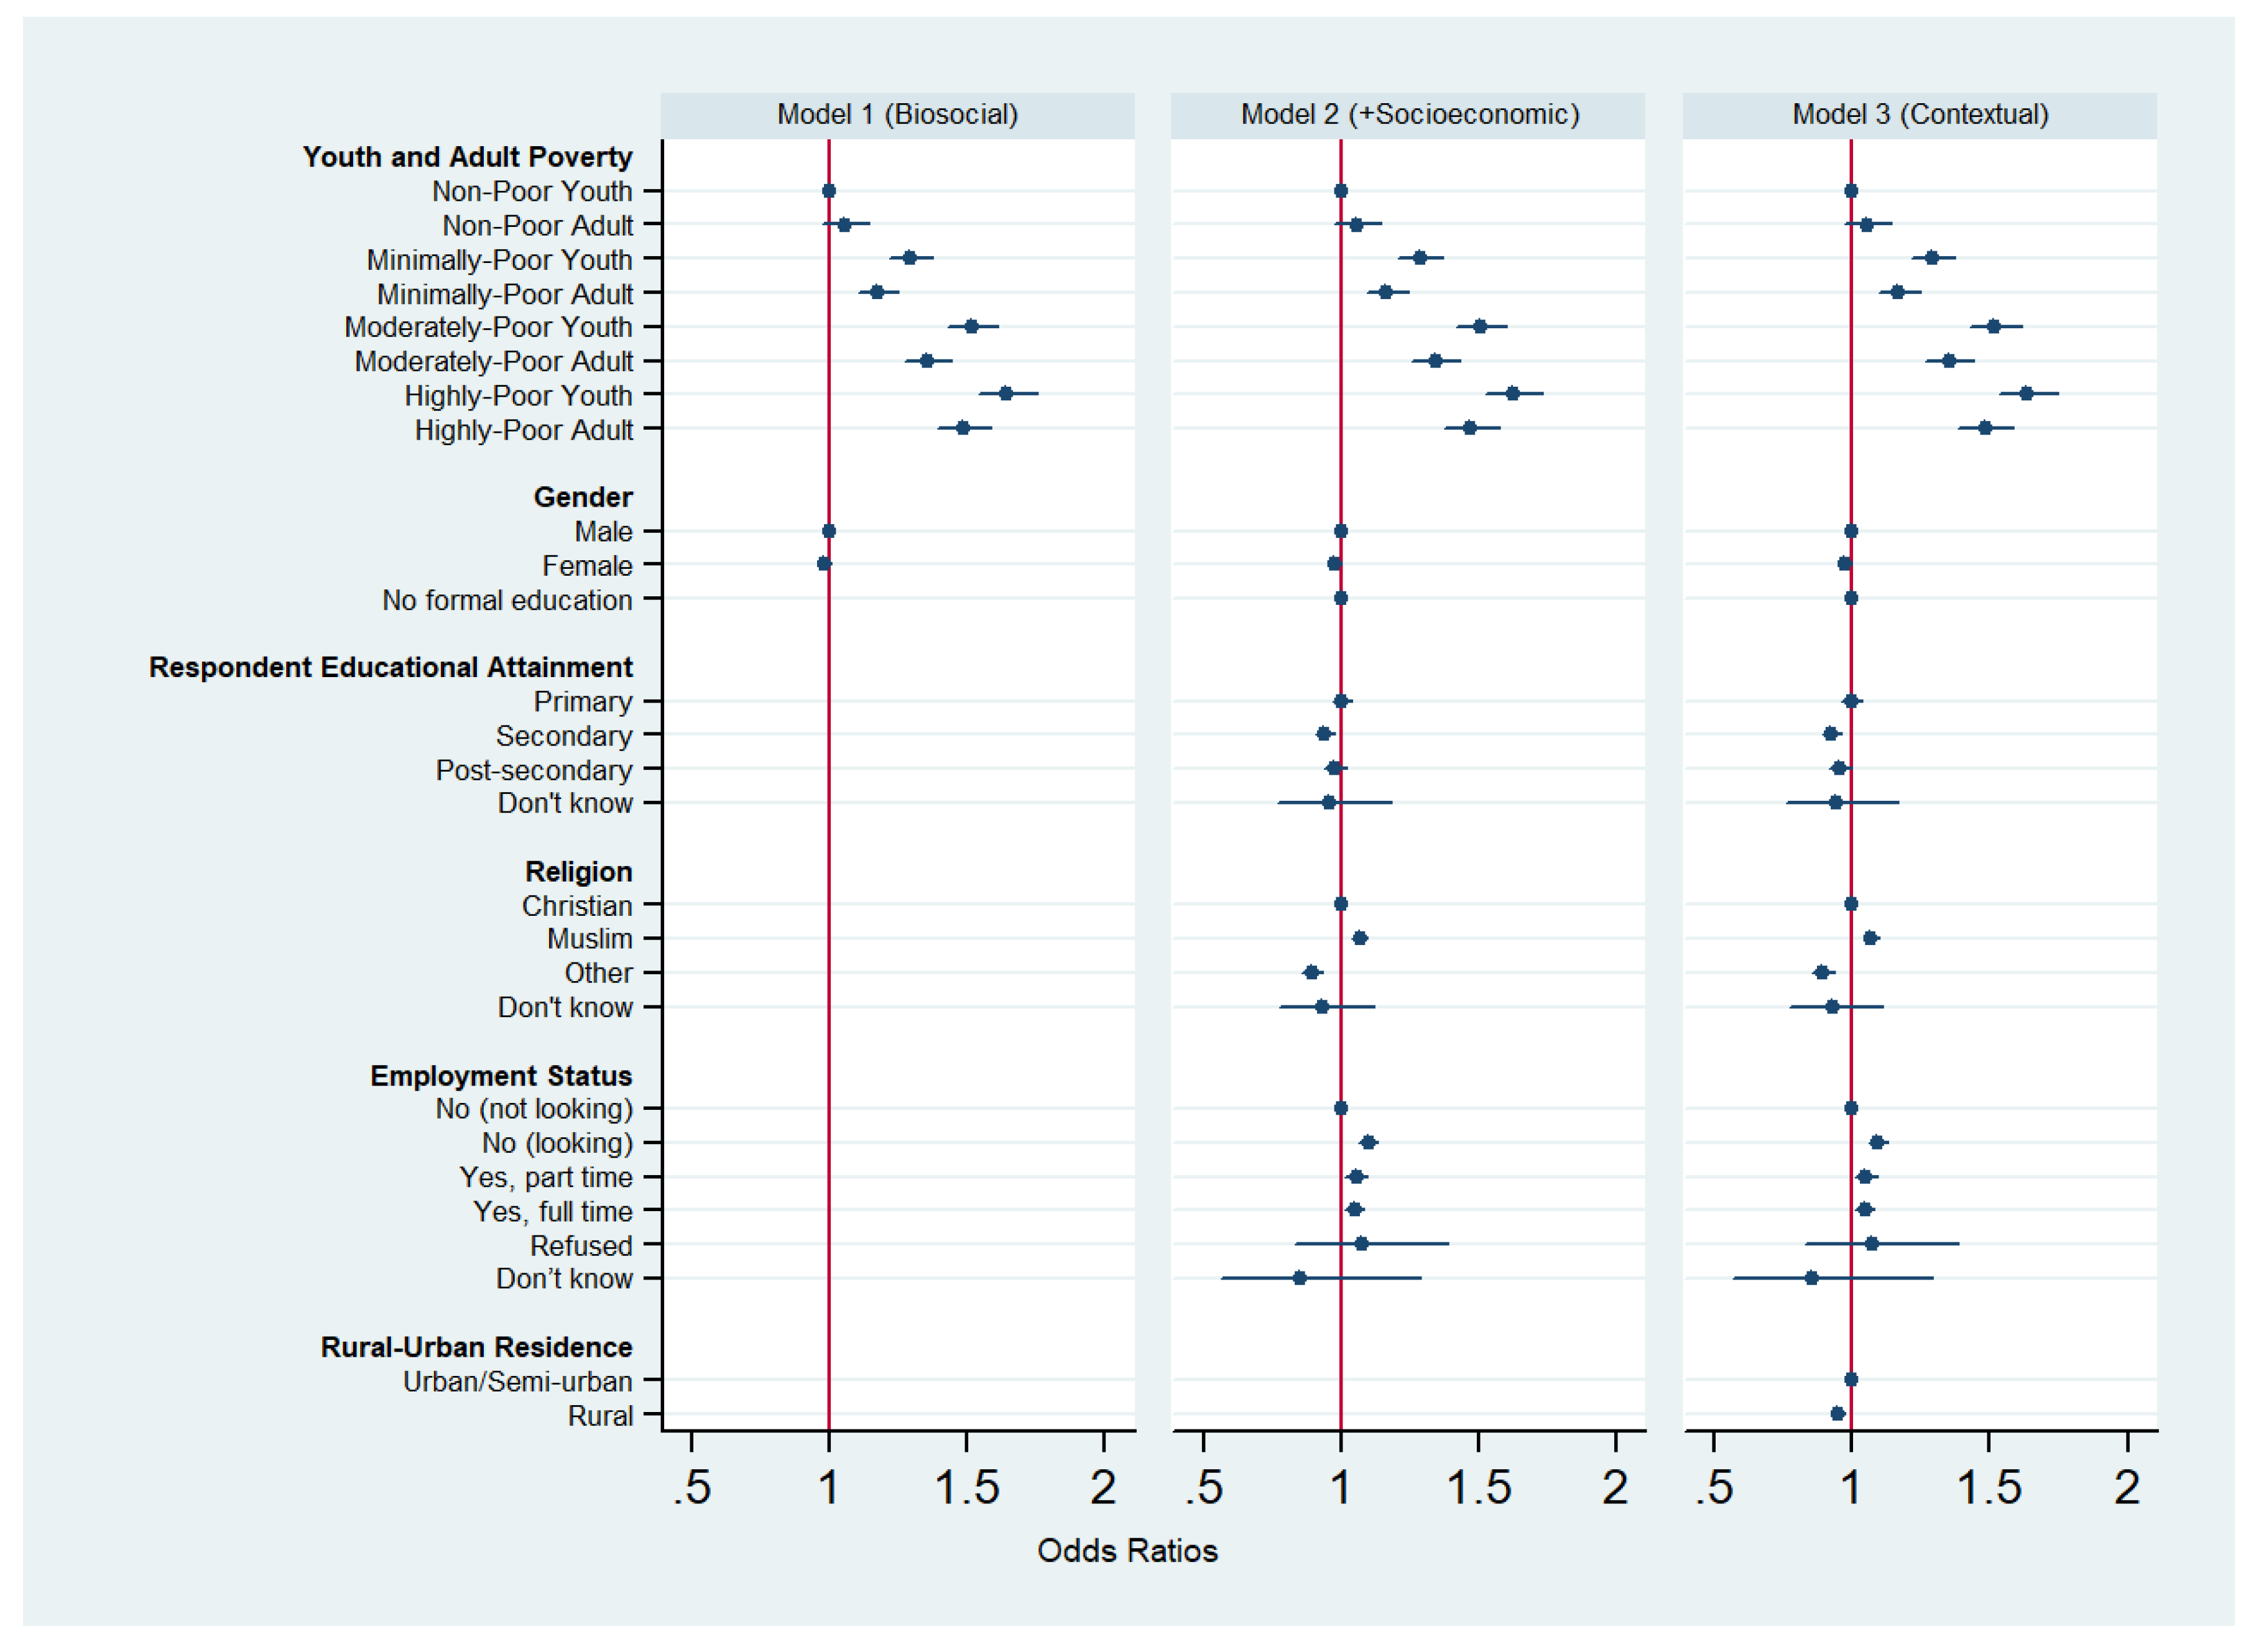
Figure 2.
Difficulty in access to healthcare and demographic factors.
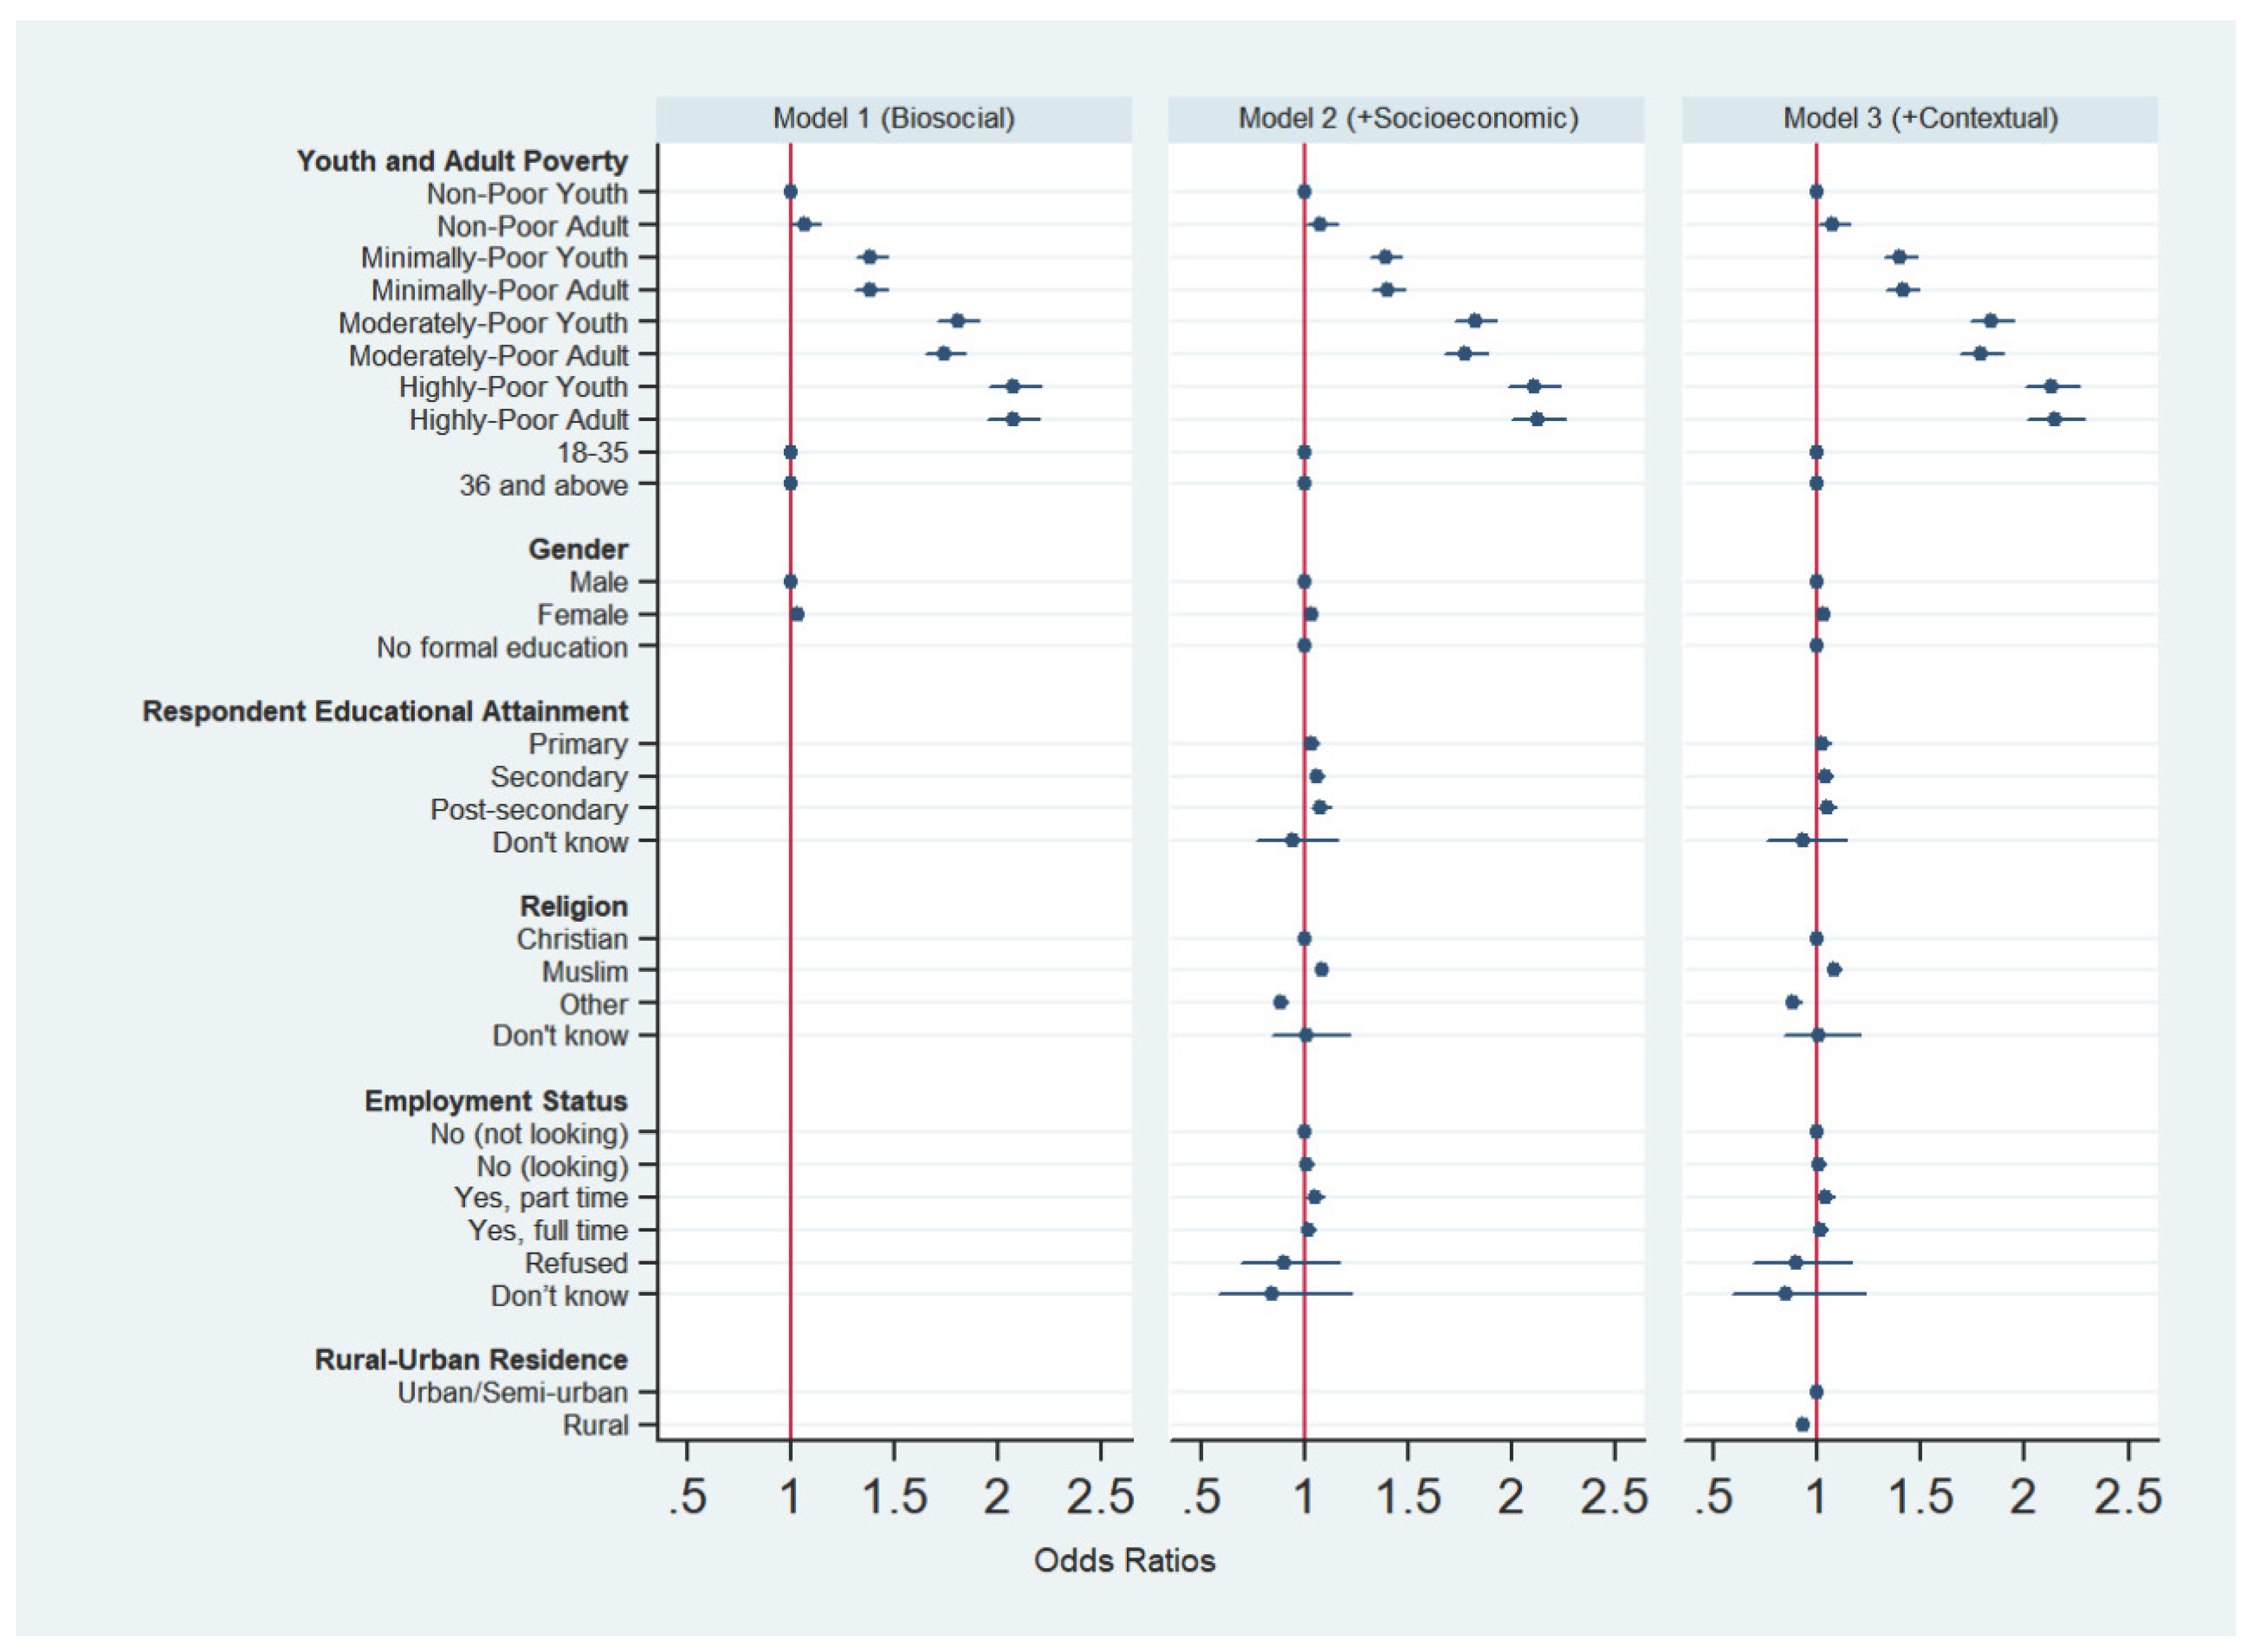

Table 1.
Bivariate negative log-log regression model predicting the likelihood of paying a bribe to access healthcare services across African countries.
Table 1.
Bivariate negative log-log regression model predicting the likelihood of paying a bribe to access healthcare services across African countries.
| Variable | Odds Ratio | SE | P-Value | 95% CI | |
|---|---|---|---|---|---|
| Lived Poverty (Ref: No Lived Poverty) | |||||
| Low Lived Poverty | 1.209 | 0.027 | 0.000 | 1.157 | 1.264 |
| Moderate Lived Poverty | 1.408 | 0.031 | 0.000 | 1.348 | 1.471 |
| High Lived Poverty | 1.530 | 0.036 | 0.000 | 1.461 | 1.602 |
| Youth & Adult Poverty (Ref: Non-poor youth) | |||||
| Non-Poor Adult | 1.056 | 0.042 | 0.171 | 0.977 | 1.142 |
| Minimally-Poor Youth | 1.294 | 0.040 | 0.000 | 1.217 | 1.375 |
| Minimally-Poor Adult | 1.175 | 0.038 | 0.000 | 1.104 | 1.252 |
| Moderately-Poor Youth | 1.518 | 0.047 | 0.000 | 1.428 | 1.613 |
| Moderately-Poor Adult | 1.359 | 0.043 | 0.000 | 1.277 | 1.447 |
| Highly-Poor Youth | 1.644 | 0.054 | 0.000 | 1.542 | 1.753 |
| Highly-Poor Adult | 1.490 | 0.050 | 0.000 | 1.396 | 1.590 |
| Life Stage (Youth Ref: 35 years or younger) | |||||
| Adult (36 years and older) | 0.916 | 0.011 | 0.000 | 0.894 | 0.937 |
| Gender/Sex (Ref: Male) | |||||
| Female | 0.989 | 0.012 | 0.365 | 0.967 | 1.012 |
| Educational Attainment (Ref: No formal education) | |||||
| Primary education | 0.976 | 0.017 | 0.164 | 0.944 | 1.010 |
| Secondary education | 0.919 | 0.015 | 0.000 | 0.890 | 0.950 |
| Post-secondary education | 0.929 | 0.018 | 0.000 | 0.894 | 0.965 |
| Religion (Ref: Christian) | |||||
| Muslim | 1.065 | 0.014 | 0.000 | 1.039 | 1.092 |
| Others | 0.888 | 0.019 | 0.000 | 0.851 | 0.927 |
| Employment Status (Ref: No (not looking)) | |||||
| No (looking) | 1.104 | 0.016 | 0.000 | 1.073 | 1.137 |
| Yes, part time | 1.036 | 0.020 | 0.069 | 0.997 | 1.075 |
| Yes, full time | 0.991 | 0.016 | 0.566 | 0.960 | 1.022 |
| Urbanicity (Ref: Urban residence) | |||||
| Rural residence | 0.996 | 0.012 | 0.730 | 0.973 | 1.019 |
Table 2.
Bivariate negative log-log regression model estimating the likelihood of reporting difficulty in accessing healthcare.
Table 2.
Bivariate negative log-log regression model estimating the likelihood of reporting difficulty in accessing healthcare.
| Variable | Odds Ratio | SE | P-Value | 95% CI | |
|---|---|---|---|---|---|
| Lived Poverty (Ref: No Lived Poverty) | |||||
| Low Lived Poverty | 1.341 | 0.027 | 0.000 | 1.289 | 1.395 |
| Moderate Lived Poverty | 1.720 | 0.035 | 0.000 | 1.653 | 1.790 |
| High Lived Poverty | 2.010 | 0.044 | 0.000 | 1.925 | 2.098 |
| Youth & Adult Poverty (Ref: Non-poor youth) | |||||
| Non-Poor Adult | 1.063 | 0.037 | 0.082 | 0.992 | 1.139 |
| Minimally-Poor Youth | 1.383 | 0.038 | 0.000 | 1.310 | 1.461 |
| Minimally-Poor Adult | 1.378 | 0.039 | 0.000 | 1.302 | 1.457 |
| Moderately-Poor Youth | 1.802 | 0.050 | 0.000 | 1.706 | 1.903 |
| Moderately-Poor Adult | 1.735 | 0.050 | 0.000 | 1.641 | 1.836 |
| Highly-Poor Youth | 2.075 | 0.063 | 0.000 | 1.955 | 2.202 |
| Highly-Poor Adult | 2.065 | 0.064 | 0.000 | 1.943 | 2.194 |
| Life Stage (Youth Ref: 35 years or younger) | |||||
| Adult (36 years and older) | 0.991 | 0.012 | 0.461 | 0.969 | 1.014 |
| Gender/Sex (Ref: Male) | |||||
| Female | 1.033 | 0.012 | 0.005 | 1.010 | 1.057 |
| Educational Attainment (Ref: No formal education) | |||||
| Primary education | 0.963 | 0.017 | 0.030 | 0.931 | 0.996 |
| Secondary education | 0.953 | 0.016 | 0.003 | 0.923 | 0.984 |
| Post-secondary education | 0.922 | 0.018 | 0.000 | 0.888 | 0.958 |
| Religion (Ref: Christian) | |||||
| Muslim | 1.075 | 0.014 | 0.000 | 1.049 | 1.102 |
| Others | 0.857 | 0.018 | 0.000 | 0.824 | 0.892 |
| Employment Status (Ref: No (not looking)) | |||||
| No (looking) | 1.024 | 0.015 | 0.101 | 0.995 | 1.054 |
| Yes, part time | 1.014 | 0.019 | 0.464 | 0.977 | 1.052 |
| Yes, full time | 0.938 | 0.015 | 0.000 | 0.910 | 0.967 |
| Urbanicity (Ref: Urban residence) | |||||
| Rural residence | 0.994 | 0.012 | 0.591 | 0.971 | 1.017 |
Table 3.
multivariate negative log-log regression model predicting the likelihood of paying a bribe to access healthcare.
Table 3.
multivariate negative log-log regression model predicting the likelihood of paying a bribe to access healthcare.
| Variable | Odds Ratio | SE | P-Value | 95% CI | Odds Ratio | SE | P-Value | 95% CI | Odds Ratio | SE | P-Value | 95% CI | |||
|---|---|---|---|---|---|---|---|---|---|---|---|---|---|---|---|
| Youth & Adult Poverty (Ref: Non-poor youth) | |||||||||||||||
| Non-Poor Adult | 1.054 | 0.042 | 0.186 | 0.975 | 1.140 | 1.056 | 0.042 | 0.171 | 0.977 | 1.143 | 1.054 | 0.042 | 0.188 | 0.975 | 1.141 |
| Minimally-Poor Youth | 1.293 | 0.040 | 0.000 | 1.216 | 1.374 | 1.286 | 0.040 | 0.000 | 1.210 | 1.368 | 1.291 | 0.041 | 0.000 | 1.214 | 1.373 |
| Minimally-Poor Adult | 1.173 | 0.038 | 0.000 | 1.101 | 1.249 | 1.166 | 0.038 | 0.000 | 1.093 | 1.243 | 1.169 | 0.038 | 0.000 | 1.096 | 1.246 |
| Moderately-Poor Youth | 1.517 | 0.047 | 0.000 | 1.428 | 1.612 | 1.506 | 0.047 | 0.000 | 1.416 | 1.602 | 1.516 | 0.048 | 0.000 | 1.426 | 1.613 |
| Moderately-Poor Adult | 1.357 | 0.043 | 0.000 | 1.275 | 1.444 | 1.342 | 0.044 | 0.000 | 1.259 | 1.430 | 1.351 | 0.044 | 0.000 | 1.268 | 1.440 |
| Highly-Poor Youth | 1.644 | 0.054 | 0.000 | 1.542 | 1.753 | 1.625 | 0.054 | 0.000 | 1.523 | 1.734 | 1.637 | 0.054 | 0.000 | 1.534 | 1.747 |
| Highly-Poor Adult | 1.487 | 0.050 | 0.000 | 1.393 | 1.588 | 1.472 | 0.050 | 0.000 | 1.377 | 1.574 | 1.483 | 0.051 | 0.000 | 1.387 | 1.586 |
| Life Stage (Youth Ref: 35 years or younger) | |||||||||||||||
| Adult (36 years and older) | Omitted owing to collinearity | ||||||||||||||
| Gender/Sex (Ref: Male) | |||||||||||||||
| Female | 0.980 | 0.012 | 0.083 | 0.957 | 1.003 | 0.978 | 0.012 | 0.067 | 0.955 | 1.002 | 0.975 | 0.012 | 0.040 | 0.952 | 0.999 |
| Educational Attainment (Ref: No formal education) | |||||||||||||||
| Primary education | 1.003 | 0.018 | 0.871 | 0.968 | 1.039 | 0.996 | 0.018 | 0.835 | 0.962 | 1.032 | |||||
| Secondary education | 0.940 | 0.017 | 0.001 | 0.907 | 0.974 | 0.923 | 0.017 | 0.000 | 0.890 | 0.957 | |||||
| Post-secondary education | 0.978 | 0.021 | 0.301 | 0.938 | 1.020 | 0.955 | 0.021 | 0.038 | 0.915 | 0.998 | |||||
| Religion (Ref: Christian) | |||||||||||||||
| Muslim | 1.068 | 0.014 | 0.000 | 1.040 | 1.097 | 1.067 | 0.014 | 0.000 | 1.039 | 1.095 | |||||
| Others | 0.894 | 0.020 | 0.000 | 0.856 | 0.933 | 0.892 | 0.020 | 0.000 | 0.855 | 0.932 | |||||
| Employment Status (Ref: No (not looking)) | |||||||||||||||
| No (looking) | 1.098 | 0.017 | 0.000 | 1.066 | 1.132 | 1.094 | 0.017 | 0.000 | 1.062 | 1.128 | |||||
| Yes, part time | 1.055 | 0.021 | 0.007 | 1.015 | 1.096 | 1.049 | 0.021 | 0.014 | 1.010 | 1.091 | |||||
| Yes, full time | 1.049 | 0.018 | 0.004 | 1.015 | 1.085 | 1.045 | 0.018 | 0.010 | 1.010 | 1.080 | |||||
| Urbanicity (Ref: Urban residence) | |||||||||||||||
| Rural residence | 0.948 | 0.012 | 0.000 | 0.924 | 0.972 | ||||||||||
Table 4.
Multivariate negative log-log regression model predicting the likelihood of reporting difficulty in accessing healthcare services across African countries.
Table 4.
Multivariate negative log-log regression model predicting the likelihood of reporting difficulty in accessing healthcare services across African countries.
| Variable | Odds Ratio | SE | P-Value | 95% CI | Odds Ratio | SE | P-Value | 95% CI | Odds Ratio | SE | P-Value | 95% CI | |||
|---|---|---|---|---|---|---|---|---|---|---|---|---|---|---|---|
| Youth & Adult Poverty (Ref: Non-poor youth) | |||||||||||||||
| Non-Poor Adult | 1.065 | 0.037 | 0.073 | 0.994 | 1.141 | 1.0782 | 0.0382 | 0.0340 | 1.0059 | 1.1557 | 1.075 | 0.038 | 0.042 | 1.002 | 1.152 |
| Minimally-Poor Youth | 1.384 | 0.038 | 0.000 | 1.311 | 1.461 | 1.3920 | 0.0389 | 0.0000 | 1.3177 | 1.4704 | 1.398 | 0.039 | 0.000 | 1.324 | 1.477 |
| Minimally-Poor Adult | 1.382 | 0.040 | 0.000 | 1.306 | 1.461 | 1.4040 | 0.0408 | 0.0000 | 1.3263 | 1.4863 | 1.409 | 0.041 | 0.000 | 1.331 | 1.492 |
| Moderately-Poor Youth | 1.802 | 0.050 | 0.000 | 1.706 | 1.903 | 1.8227 | 0.0516 | 0.0000 | 1.7243 | 1.9266 | 1.839 | 0.052 | 0.000 | 1.740 | 1.944 |
| Moderately-Poor Adult | 1.740 | 0.050 | 0.000 | 1.645 | 1.841 | 1.7756 | 0.0521 | 0.0000 | 1.6764 | 1.8806 | 1.791 | 0.053 | 0.000 | 1.691 | 1.897 |
| Highly-Poor Youth | 2.074 | 0.063 | 0.000 | 1.955 | 2.201 | 2.1060 | 0.0647 | 0.0000 | 1.9829 | 2.2367 | 2.128 | 0.066 | 0.000 | 2.004 | 2.261 |
| Highly-Poor Adult | 2.069 | 0.064 | 0.000 | 1.948 | 2.199 | 2.1256 | 0.0675 | 0.0000 | 1.9974 | 2.2620 | 2.146 | 0.068 | 0.000 | 2.016 | 2.284 |
| Life Stage (Youth Ref: 35 years or younger) | |||||||||||||||
| Adult (36 years and older) | Omitted owing to collinearity | ||||||||||||||
| Gender/Sex (Ref: Male) | |||||||||||||||
| Female | 1.031 | 0.012 | 0.010 | 1.007 | 1.055 | 1.038 | 0.012 | 0.002 | 1.013 | 1.062 | 1.033 | 0.012 | 0.006 | 1.009 | 1.058 |
| Educational Attainment (Ref: No formal education) | |||||||||||||||
| Primary education | 1.032 | 0.019 | 0.084 | 0.996 | 1.069 | 1.023 | 0.018 | 0.207 | 0.987 | 1.060 | |||||
| Secondary education | 1.059 | 0.019 | 0.001 | 1.023 | 1.097 | 1.035 | 0.019 | 0.060 | 0.999 | 1.073 | |||||
| Post-secondary education | 1.079 | 0.023 | 0.000 | 1.035 | 1.125 | 1.047 | 0.023 | 0.037 | 1.003 | 1.092 | |||||
| Religion (Ref: Christian) | |||||||||||||||
| Muslim | 1.084 | 0.014 | 0.000 | 1.056 | 1.113 | 1.082 | 0.014 | 0.000 | 1.054 | 1.111 | |||||
| Others | 0.883 | 0.018 | 0.000 | 0.848 | 0.920 | 0.882 | 0.018 | 0.000 | 0.847 | 0.919 | |||||
| Employment Status (Ref: No (not looking)) | |||||||||||||||
| No (looking) | 1.011 | 0.015 | 0.471 | 0.981 | 1.042 | 1.006 | 0.015 | 0.688 | 0.976 | 1.037 | |||||
| Yes, part time | 1.048 | 0.020 | 0.015 | 1.009 | 1.089 | 1.041 | 0.020 | 0.038 | 1.002 | 1.081 | |||||
| Yes, full time | 1.019 | 0.017 | 0.251 | 0.987 | 1.052 | 1.012 | 0.017 | 0.461 | 0.980 | 1.045 | |||||
| Urbanicity (Ref: Urban residence) | |||||||||||||||
| Rural residence | 0.931 | 0.012 | 0.000 | 0.908 | 0.954 | ||||||||||
Disclaimer/Publisher’s Note: The statements, opinions and data contained in all publications are solely those of the individual author(s) and contributor(s) and not of MDPI and/or the editor(s). MDPI and/or the editor(s) disclaim responsibility for any injury to people or property resulting from any ideas, methods, instructions or products referred to in the content. |
© 2025 by the authors. Licensee MDPI, Basel, Switzerland. This article is an open access article distributed under the terms and conditions of the Creative Commons Attribution (CC BY) license (http://creativecommons.org/licenses/by/4.0/).
Copyright: This open access article is published under a Creative Commons CC BY 4.0 license, which permit the free download, distribution, and reuse, provided that the author and preprint are cited in any reuse.


