Submitted:
19 December 2025
Posted:
23 December 2025
You are already at the latest version
Abstract
Background: Persistent poverty and the residential environment both significantly affect how Africans experience the healthcare system. However, evidence on the interaction of these factors on perceived access to healthcare is limited.Methods: This analysis used pooled data from the Afrobarometer Round 8 surveys across 34 African countries (n ≈ 46,885 adults) to assess perceived ease or difficulty of obtaining necessary healthcare. The primary predictor was residential poverty status, classified using a composite of the Lived Poverty Index (LPI) and urban, semi-urban, and rural residency, resulting in eight groups, with non-poor urban/semi-urban residents serving as the reference category. The analysis employed complementary log–log regression, sequentially adjusting for various biosocial and socioeconomic predictors, including age, sex, education, employment, and religion, while incorporating country fixed effects and Afrobarometer survey weights.Results: Residential poverty status remained a strong predictor of healthcare access, even after sequential adjustment for biosocial and socioeconomic factors. When biosocial controls were accounted for, the odds ratios for all residential poverty categories remained largely stable, with only minimal attenuation, suggesting that age and gender do not mediate the relationship between deprivation and healthcare access in any substantial way. Moderately-poor rural residents had 72.5% higher odds of reporting access compared to non-poor urban/semi-urban residents (OR = 1.725, P< 0.001), while highly-poor rural residents had 66.0% higher odds (OR = 1.660, P< 0.001).Women and older adults reported better access than men and younger individuals (P<0.001). Higher education levels were linked to lower odds of reporting access (secondary: OR=0.870; post-secondary: OR=0.878; both P<0.001). Conclusion: The relationship between poverty and healthcare access in Africa is more nuanced than often assumed. In some contexts, poorer individuals reported higher odds of access, reflecting potential effects of subsidized care and infrastructure investments. Residential context—especially the rural–urban divide—proved a stronger predictor than poverty alone, with notable cross-country variation. These findings challenge uniform exclusion narratives and underscore the need for integrated policies addressing place, education, and financial protection to promote equitable healthcare access.
Keywords:
afrobarometer round 8
; lived poverty index (LPI)
; healthcare access
; residential poverty
; urban–rural disparities
; complementary log–log regression
; Africa
1. Introduction
Over the past decade, Africa has witnessed a troubling persistence, and in some cases, a resurgence, of lived poverty, defined as the frequent inability to meet basic needs such as adequate food, clean water, healthcare, and essential energy sources (Akello, 2023). Post-2015, economic stagnation in several African economies, compounded by the COVID-19 pandemic, has intensified this deprivation across multiple dimensions of life (Mattes, 2020). Analysis of Afrobarometer Round 8 survey data, encompassing 34 African countries, reveals that a significant share of households experienced deprivation of essential goods and services between 2019 and 2021. The distribution of such deprivation exhibits pronounced spatial disparities, with populations residing in urban informal settlements, rural areas, and peri-urban zones disproportionately burdened by deficits in material well-being and constrained access to quality healthcare services (Ezeh et al., 2017).
These deprivations and residential status (e.g. urban vs. rural) influence access to healthcare facilities and services (Moeti et al., 2023), and for that matter health outcomes (World Health Organization, 2021). Access to healthcare connotes the ability of individuals to promptly use health services for best or optimal health outcomes. Availability of health facilities is basic to enhancing and expanding access to healthcare (National Academies of Sciences et al., 2018; World Health Organization, 2021). In Africa, residential status is a significant determinant of access to healthcare and related outcomes, with rural areas often facing infrastructural deficits, long travel distances to health facilities, higher costs, and lower availability of skilled health professionals (Boerma et al., 2018; Moeti et al., 2023). Conversely, while urban residents may be closer to healthcare infrastructure, those in informal settlements (or slums) encounter overcrowding, environmental hazards, and barriers related to cost, discrimination, and service quality (Armah et al., 2018; Ekumah et al., 2020; Lilford et al., 2017). Yet, despite the recognized importance of both poverty and residence status as individual predictors of health inequality, much less is known about how lived poverty interacts with residential status to shape healthcare access and outcomes. Understanding this interaction is critical, as deprivation in essential goods and services can amplify the disadvantages associated with rural isolation or informal urban living, creating compounded barriers to healthcare access and poverty reduction.
Existing literature often treats poverty and residential context as independent variables in health inequality analysis (Marmot, 2005). This separation risks overlooking the structural and intersectional nature of disadvantages. For example, individuals in rural communities with high lived poverty may not only face limited facility availability but also lack the financial and material resources needed to overcome these barriers, even when services exist. Similarly, urban informal residents may live in physical proximity to health facilities but be unable to afford consultations, medication, or diagnostic services due to persistent income insecurity. These layered disadvantages contribute to disparities in preventive care uptake, treatment adherence, and overall health outcomes (Polin et al., 2021).
The implications of this interaction extend beyond individual health to public health systems, as regions with concentrated deprivation and poor service access often bear higher burdens of preventable disease and mortality. The COVID-19 pandemic underscored these vulnerabilities: communities with high lived-poverty experienced both reduced access to healthcare and acute deprivations of food and income during lockdowns, and greater indirect health impacts due to the diversion of resources toward pandemic response (Hogan et al., 2020). Yet, systematic, region-wide analysis of how lived poverty and residential category jointly influence healthcare access in Africa remains rare, particularly using harmonized, multi-country survey data.
This study, therefore, addresses the aforementioned knowledge gap by assessing the relationship between lived poverty and residential category (urban formal, urban informal, rural) in shaping inequalities in healthcare access in 34 African countries. Drawing on multi-country survey data and applying rigorous statistical modeling, this study explains the compounded and intersecting dimensions of deprivation that contribute to persistent health inequalities. The findings are expected to generate empirical evidence to guide the design of targeted interventions that account for the intersection between socioeconomic disadvantages and geographic context in determining healthcare access. Understanding this relationship is pivotal for developing equitable health systems and advancing progress toward universal health coverage in the African context (World Health Organization, 2021).
2. Data and Methods
2.1. Data Source and Study Design
This study employs a pooled cross-sectional design, drawing on publicly available data from Afrobarometer Round 8, conducted between 2019 and 2021 (Afrobarometer, 2023). Afrobarometer is a well-established Pan-African survey initiative that collects nationally representative data on public opinion concerning democracy, governance, economic performance, and societal well-being (Afrobarometer, 2025). The project is widely used in empirical research on political behavior, development, and inequality in sub-Saharan Africa. The dataset covers 34 African countries, providing extensive geographic, political, and economic diversity. Sampling in each country is designed to be nationally representative of the adult population (aged 18 and over), stratified by region and urban-rural status. The multi-stage, stratified, clustered sampling approach includes:
- Stage 1: Stratification by region and urban/rural locality.
- Stage 2: Selection of enumeration areas (EAs) using probability proportional to population size.
- Stage 3: Random selection of households within each EA.
- Stage 4: Random selection of one adult respondent per household using the Kish grid method.
Sample sizes per country range from 1,200 to 2,400 respondents, depending on population size and logistical feasibility, yielding a pooled sample of over 46,885 individuals. The pooling of country data allows for comparative analysis across contexts, while the inclusion of country fixed effects in the models accounts for unobserved heterogeneity at the national level. All respondents provided informed consent, and Afrobarometer adheres to strict ethical guidelines. The data used are anonymized, and the study received exemption from further ethical review due to the use of publicly available secondary data.
2.2. Measures
2.2.1. Dependent Variable: Difficulty Accessing Healthcare
The outcome variable of interest is perceived difficulty in accessing medical care, derived from the Afrobarometer question: “How easy or difficult is it for you to obtain the medical care you need?” Respondents were presented with four response options: “Very easy”, “Easy”, “Difficult”, and “Very difficult”. These were recoded into a binary variable for the purposes of regression analysis: 0 = Easy/Very easy; 1 = Difficult/Very difficult. This binary operationalization captures barriers to healthcare access as perceived by respondents, encompassing both structural constraints (e.g., cost, distance, availability of services) and subjective experiences (e.g., discrimination, quality of care). While self-reported, such measures have been shown to correlate strongly with health service utilization and system performance in low- and middle-income country contexts (Coste & Bousmah, 2023).
2.2.2. Main Predictor: Residential Poverty Status
The key independent variable is a composite indicator that encompasses the level of lived poverty and the respondent’s residential location (urban/semi-urban vs. rural). This variable reflects the intersectional nature of economic deprivation and geographic marginalization, both of which independently and jointly shape access to healthcare. Lived Poverty Index (LPI): Based on Afrobarometer’s standard practice, the LPI is calculated from responses to five questions on how often respondents went without the following in the past 12 months: Enough food to eat, Clean water for home use, Medical care, Cooking fuel, and cash income. Each item is rated on a 5-point frequency scale: “Never,” “Just once or twice,” “Several times,” “Many times,” “Always.” Responses are scored from 0 to 4 and averaged to form a continuous LPI score (0 = no deprivation, 4 = chronic deprivation). Respondents are then classified into four poverty levels: Non-poor (LPI = 0); Minimally poor (0 < LPI < 1); Moderately poor (1 ≤ LPI < 2); and Highly poor (LPI ≥ 2). This poverty score is cross-tabulated with residential status (urban/semi-urban or rural) to produce eight mutually exclusive categories: Non-Poor Urban/Semi-Urban (reference category); Non-Poor Rural; Minimally-Poor Urban/Semi-Urban; Minimally-Poor Rural; Moderately-Poor Urban/Semi-Urban; Moderately-Poor Rural; Highly-Poor Urban/Semi-Urban; and Highly-Poor Rural. This classification enables a nuanced understanding of how economic hardship and place-based disadvantage interact to shape healthcare experiences.
2.2.3. Control Variables
To reduce the risk of omitted variable bias, the analysis incorporates nested models that sequentially adjust for individual-level confounders.
Model 1: Biosocial Controls
Age (grouped): Older adults may face more health problems and logistical barriers to access. Sex (binary: male = 0, female = 1): Women and men may experience different barriers, due to physiological traits or roles and sociocultural norms that shape material circumstances.
Model 2: Socioeconomic Controls
- Educational Attainment (categorical): No formal education, Primary, Secondary, Postsecondary. Education is closely linked to health literacy, system navigation skills, and awareness of entitlements.
- Employment Status (categorical): Unemployed and not looking, unemployed and looking, employed and not looking, employed and looking. Employment may influence the ability to pay, as well as the opportunity costs of time spent seeking care.
- Subjective Economic Standing (ordinal or categorical): Derived from responses about perceived adequacy of income or material well-being.
- Religious Affiliation (categorical): Includes major religious groups in the sample (e.g., Christian, Muslim, Traditional, Other). Religion may influence health behaviours, norms around medical/healthcare, and community-level support.
2.3. Analytical Strategy
The binary nature of the outcome variable — and its skewed distribution (a substantial portion reporting difficulty accessing care) — motivates the use of a complementary log-log (cloglog) regression model. The cloglog model is appropriate for modeling the probability of non-rare events, especially when the hazard of the event increases exponentially, as is often the case with health-related access barriers in resource-poor contexts. Parameters in three models were estimated:
- Model 0 (Baseline): Examines the bivariate association between residential poverty status and difficulty accessing healthcare, with country fixed effects.
- Model 1 (Biosocial Model): Adds controls for age and sex.
- Model 2 (Socioeconomic Model): Adds education, employment, subjective income, and religion.
All models include country fixed effects to account for differences in national-level health systems, political conditions, and macroeconomic contexts. These fixed effects absorb all time-invariant country-specific heterogeneity, ensuring that observed effects of residential poverty status are not confounded by country-level institutional differences.
We applied survey weights provided by Afrobarometer to adjust for unequal probabilities of selection and post-stratification imbalances. Standard errors are clustered at the country level to account for intra-country correlation and ensure robust inference. Model diagnostics included: Likelihood ratio tests for nested models; Tests for multi-collinearity among predictors; and Examination of residuals and influential observations. Robustness checks included: Alternative codings of the poverty variable (e.g., using continuous LPI); Gender-stratified models; and Models excluding outlier countries (e.g., with unusually high or low levels of healthcare access).
2.4. Software and Reproducibility
All data preparation, statistical modeling, and visualization were conducted using Stata 13. The analytical scripts are fully documented and available upon request for purposes of replication, transparency, and peer verification.
Results
Residential Poverty and National Contexts: A Nuanced Landscape
The distribution of residential poverty across African countries reveals a complex and deeply uneven geography of deprivation (Supplementary material). Using eight mutually exclusive categories that combine both poverty intensity and residence type (urban/semi-urban vs. rural), we observe that countries vary substantially not only in levels of poverty, but also in the modal pattern of how poverty is spatially experienced. The chi-squared test of independence confirms that this variation is highly statistically significant (χ² (231) = 17,000, P < .001), while Cramér’s V (0.2267) indicates a moderate association—strong enough to reflect real structural differences, yet also suggesting overlap and shared characteristics among some countries (Please see supplementary material).
In several countries—particularly Guinea, Niger, Burkina Faso, Malawi, and Mali—poverty is not only prevalent but concentrated in rural areas and intensified at the highest deprivation levels. For example, nearly one-third of Guinea’s sample is classified as highly-poor rural dwellers (30%), with similarly elevated proportions in Niger (32%) and Burkina Faso (16%). In these settings, the overlap between rurality and poverty is more than coincidental—it is structural. It reflects persistent underinvestment in rural infrastructure and social services (healthcare, education, and market access). Here, deprivation is deeply embedded in geography, reinforcing the idea that spatial location itself is a major social determinant (Please see supplementary material).
Conversely, countries such as South Africa, Botswana, Gabon, and, to some extent, Tunisia, exhibit a different form of deprivation: one that is urban in character, but not necessarily less severe. In South Africa, 28% are minimally-poor urban dwellers and nearly 19% are moderately-poor urban dwellers. In Gabon, strikingly, more than two-thirds of respondents fall into moderately- or highly-poor urban categories (35% and 33%, respectively), while no respondents are categorized as non-poor rural (Please see supplementary material). Thus, a pattern of urbanized marginality is observed, where persons live in cities but are not fully integrated into the economic or service infrastructures of the cities. Such groups may reside in informal settlements or peri-urban slums—technically or symbolically “urban,” but functionally or substantively excluded from the full benefits of urban citizenship. This underscores an important insight: urban residential status does not confer immunity against deprivation, and indeed, it may obscure vulnerability when viewed through a binary rural/urban lens.
Some countries stand out for their unusually favorable residential poverty profiles, most notably Mauritius, Cabo Verde, and Tunisia. These nations show higher proportions in non-poor and minimally-poor urban categories, and low shares in rural highly-poor groups. In Mauritius, for instance, 21% of respondents are non-poor urban dwellers, with less than 1% falling into the highly-poor rural category. Cabo Verde shows a similarly urban-skewed profile with substantial proportions in non- and minimally-poor urban groups. These patterns likely reflect both structural advantages (e.g., small geographic size, middle-income status, or more extensive welfare systems) and policy success in narrowing the rural-urban divide. They serve as counterpoints to the more fragmented or rural-heavy profiles seen elsewhere, and raise important questions about replicability: to what extent can such success be transferred to larger or more unequal countries? On the other end of the spectrum, countries like Gambia, Eswatini, and Togo exhibit relatively balanced but high poverty across categories, suggesting a broader base of vulnerability that does not clearly prioritize one area (rural or urban) over another. These are examples of poverty fragmentation, where need is widespread and diffuse, and thus harder to target through place-based policy alone. If poverty is spatially distributed in such varied ways, then the relationship between deprivation and healthcare access must also be mediated by national contexts.
Notably, the descriptive data suggest potential suppression effects that the regression models, below, picked up: more educated populations—common in urbanized contexts—do not always show higher access to healthcare. This could be due to higher expectations, greater provider selectivity, or even systemic distrust, leading to lower utilization despite greater availability. These results underscore that poverty in Africa is neither uniform nor predictable, and its interaction with place is deeply context-specific. Countries differ not just in how poor their populations are, but in where poverty lives, and in how it shapes access to essential services like healthcare. Recognizing this complexity is not merely academic—it is essential for crafting responsive, targeted, and just interventions that align with the lived realities of those they aim to serve.
Access to Healthcare by Residential Poverty and Demographic Attributes
In a detailed analysis of the dataset covering 34 African countries (N = 46,885), notable disparities and surprises in healthcare access were identified based on residential poverty status and various demographic factors. As shown in Table 1, individuals from economically disadvantaged backgrounds had relatively higher rates of healthcare access. Specifically, 65% of highly-poor rural residents reported having access to a health facility, compared to just 46% of their non-poor urban or semi-urban counterparts. Notably, we found that greater access to a health facility corresponded with higher levels of poverty, especially in rural areas (Cramér’s V = 0.1043, P < 0.001).
Furthermore, gender differences were evident; women reported a significantly higher likelihood of accessing healthcare services than men, with rates of 64% for women compared to 58% for men (P < 0.001). Age also showed a significant, positive correlation (P < 0.001) with access, as 57% of the youth (ages 18-24) and 66% of seniors (aged 65 and older) indicated availability of healthcare services. Additionally, an inverse relationship between educational attainment and healthcare access was observed: individuals with no formal or primary education reported higher access rates than those with post-secondary qualifications. Moreover, while religion and employment status had statistically significant associations with access, these correlations were weak.
Bribery and Informal Costs in Healthcare Access
Table 2 shows the differences in exposure to bribery when accessing healthcare services, indicating that poorer and rural populations face a higher rate of reported bribery. Specifically, among individuals classified as very poor in rural areas, 4% reported frequently paying bribes, while 5% said they had done so on a few occasions. In contrast, these numbers are much lower for non-poor urban respondents, with only 1% reporting frequent payments and 2% indicating occasional payments. Additionally, more than half (54%) of non-poor urban respondents said bribery was not part of their experiences, whereas 36% of highly-poor rural residents felt the same way.
Additionally, male respondents reported slightly higher rates of bribery compared to female respondents. There is a noted decrease in bribery exposure as age increases, with younger individuals (ages 18-34) showing a greater tendency to make frequent bribery payments. Furthermore, lower levels of education are linked to higher instances of bribery, emphasizing the vulnerabilities faced by certain groups within the healthcare system.
Regression Analysis: Predictors of Access to Healthcare
Bivariate complementary log-log regression analysis (Table 3) showed that, compared to non-poor urban and semi-urban residents, all other poverty categories had significantly higher odds of reporting access to healthcare. The strongest effects were found among moderately poor rural residents (OR = 1.725, P < 0.001) and highly poor rural residents (OR = 1.660, P < 0.001), indicating 72.5% and 66.0% higher odds of reporting access, respectively. Age was positively linked to access across all older age groups, with those aged 65 and over having 30.1% higher odds compared to the youngest group (18–24 years) (OR = 1.301, P < 0.001). Female respondents had 19.3% higher odds of reporting access than males (OR = 1.193, P < 0.001). In contrast, higher education was linked to lower access. People with secondary education had 13.0% lower odds (OR = 0.870, P < 0.001), and those with post-secondary education had 22.8% lower odds (OR = 0.772, P < 0.001) compared to respondents with no formal education.
Religious affiliation also showed disparities: Muslims had 3.3% lower odds (OR = 0.967, P = 0.011), and members of minority religions had 12.8% lower odds (OR = 0.872, P < 0.001) of reporting access compared to Christians. Full-time employment was linked to 6.1% lower odds of reported access (OR = 0.939, P < 0.001) relative to those not seeking work.
Multivariate Regression Models
Multivariate complementary log-log regression models (Table 4) showed that residential poverty status remained a strong and independent predictor of healthcare access, even after sequential adjustment for biosocial and socioeconomic factors. Across all three models, residential poverty status consistently emerged as a strong and significant predictor of access to healthcare. In Model 1, which includes only deprivation variables, all poverty subgroups—particularly those residing in rural settings—had significantly higher odds of accessing healthcare compared to the reference group. For instance, highly-poor rural dwellers had an odds ratio (OR) of 1.660 (95% CI: 1.561–1.764, P < .001), indicating 66% higher odds of access.
When biosocial controls (such as age and sex) were added in Model 2, the odds ratios for all residential poverty categories remained largely stable, with only minimal attenuation. This stability suggests that age and sex do not mediate the relationship between deprivation and healthcare access in any substantial way. Moderately poor rural residents exhibit a 72.5% higher likelihood of accessing healthcare compared to non-poor urban/semi-urban individuals (OR = 1.725, 95% CI: 1.627–1.828, P < 0.001). Highly poor rural residents follow closely, with 66.0% increased odds of access (OR = 1.660, 95% CI: 1.561–1.764, P < 0.001). Age is a significant factor as well; respondents aged ≥65 years demonstrate a 30.1% greater likelihood of accessing healthcare compared to those in the 18–24 age group (OR = 1.301, 95% CI: 1.232–1.374, P < 0.001). Furthermore, gender disparities are notable, with women reporting access at 19.3% higher odds than men (OR = 1.193, 95% CI: 1.164–1.222, P < 0.001). The inclusion of age in Model 2 revealed a monotonic increase in access to healthcare with increasing age. Compared to those aged 18–24, older adults—particularly those 65 and above—were significantly more likely to access care (OR = 1.318, 95% CI: 1.248–1.392, P < .001). These age effects remained virtually unchanged in Model 3 (OR = 1.296), suggesting that age operates independently of both deprivation and socioeconomic position, consistent with age-related increases in healthcare needs.
Figure 1.
Odds ratios of multivariate regression models assessing predictors of healthcare access across three sequential specifications.
Figure 1.
Odds ratios of multivariate regression models assessing predictors of healthcare access across three sequential specifications.
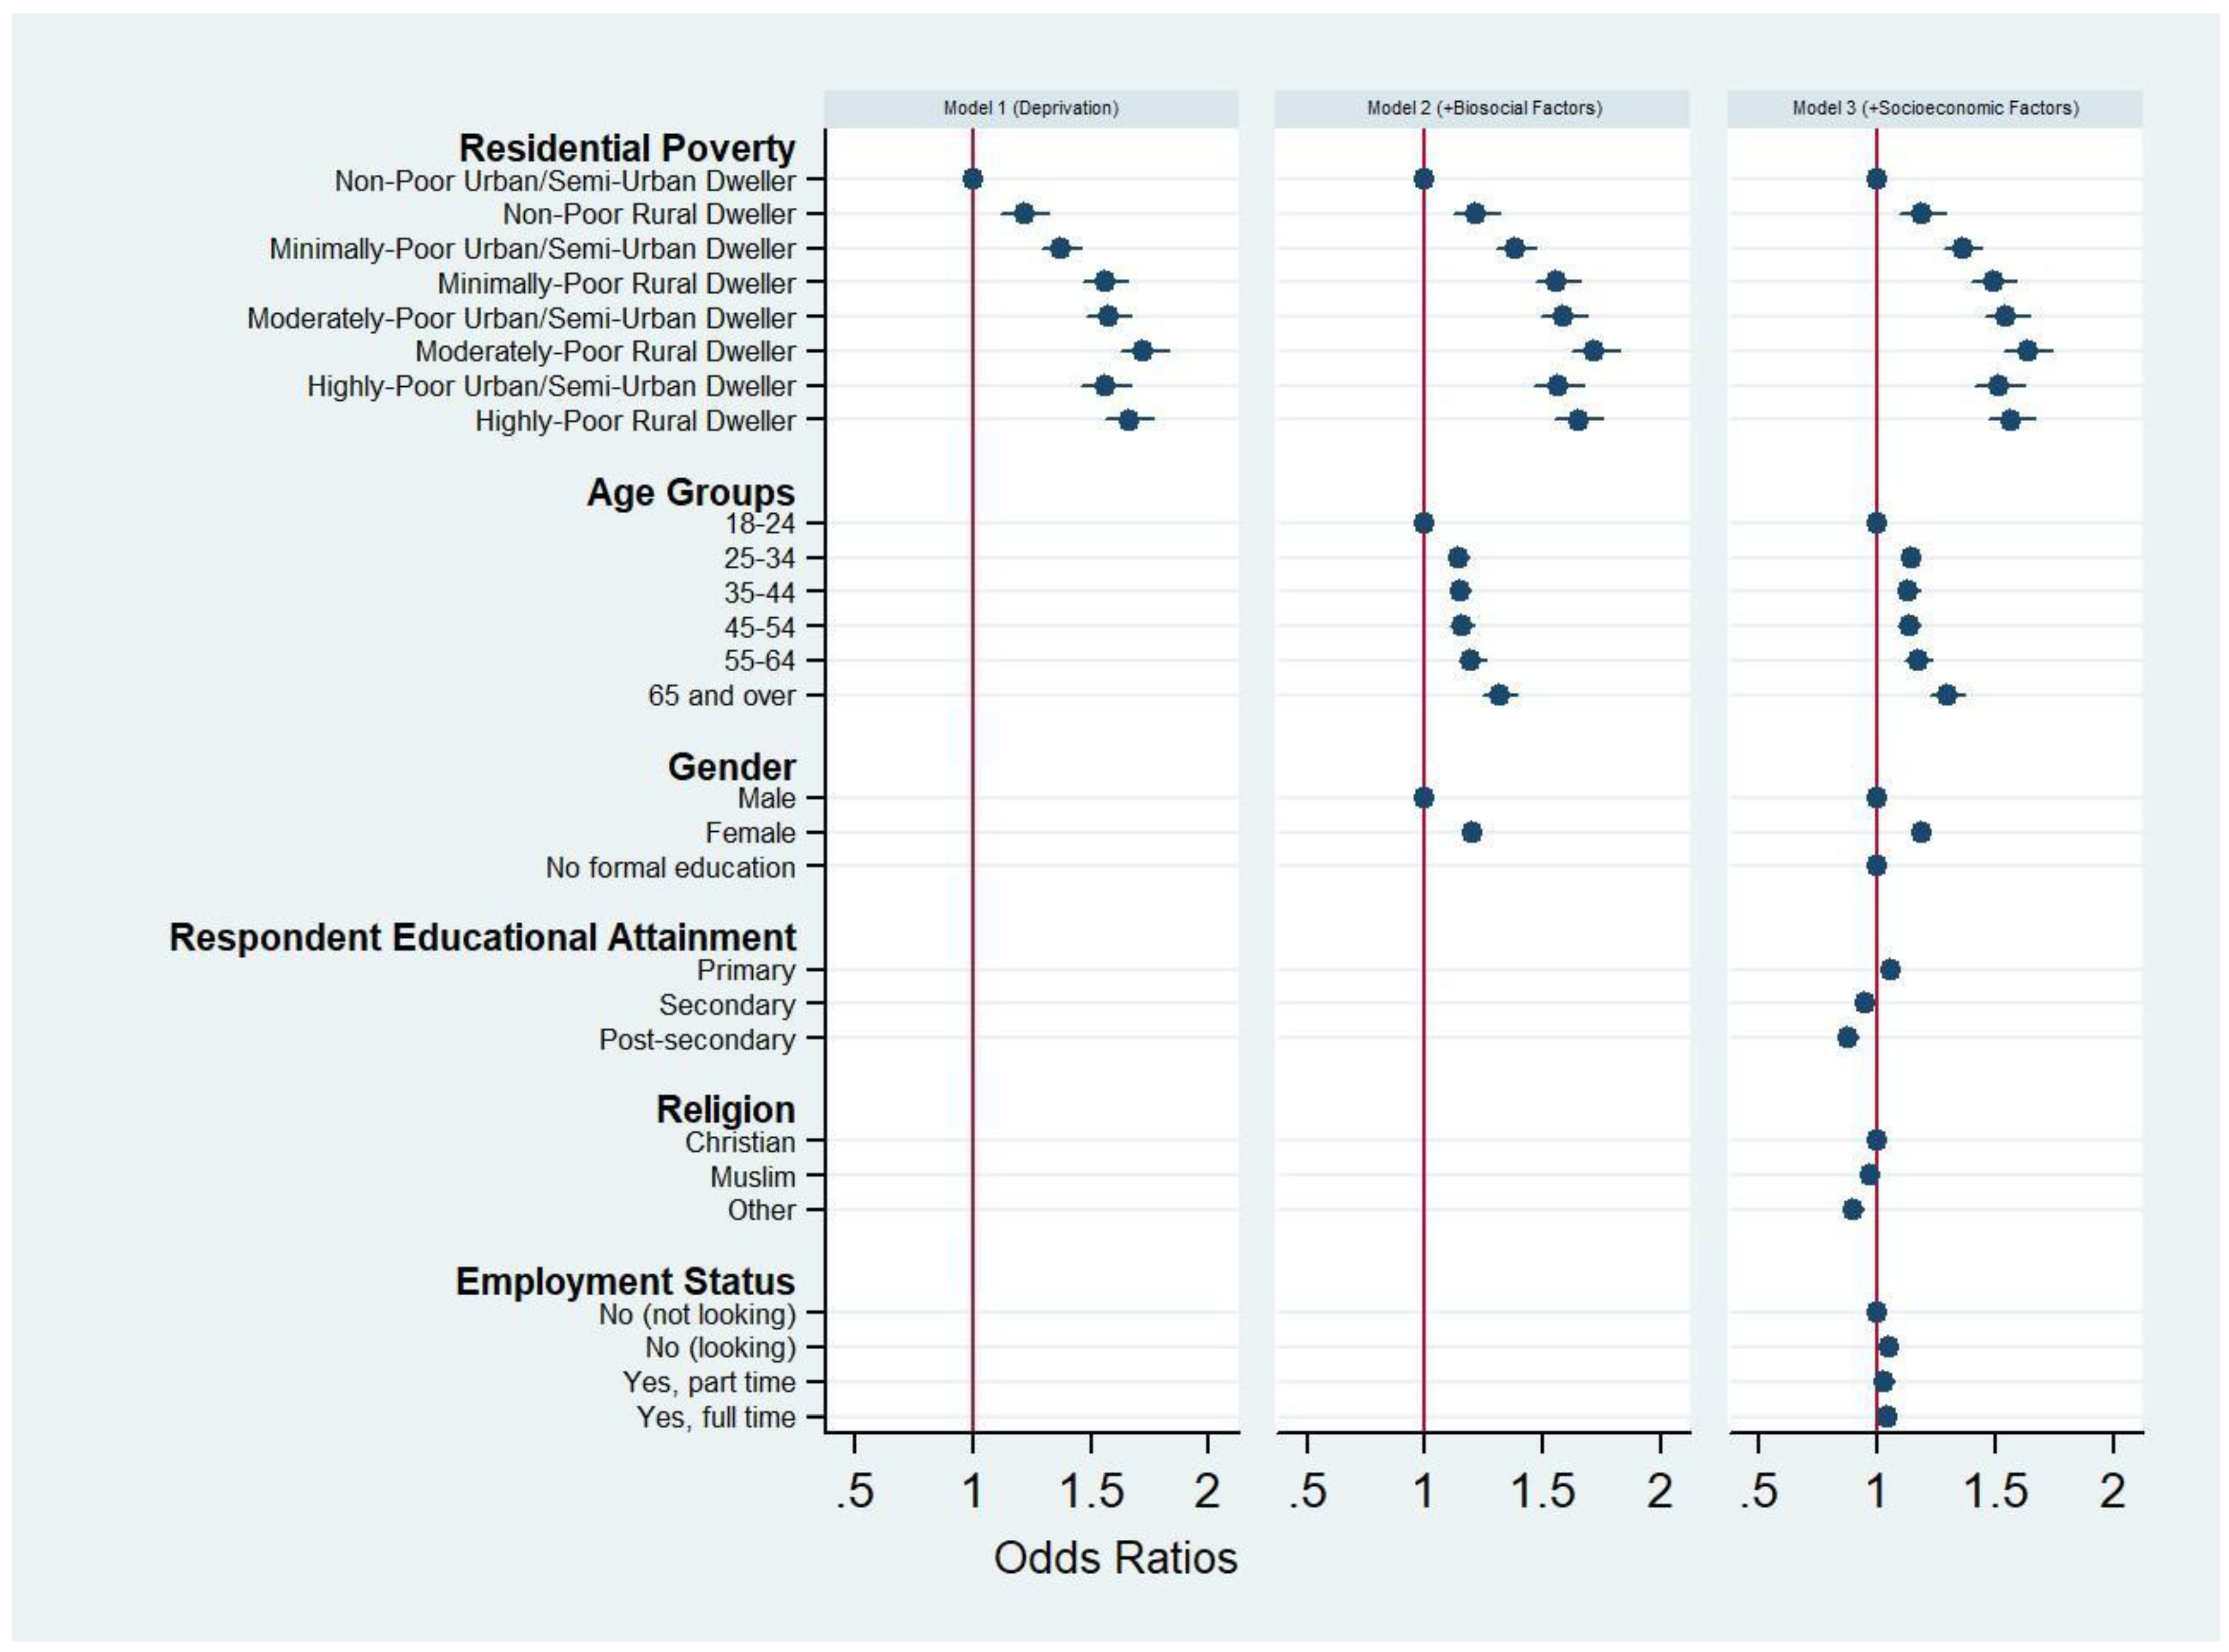
In the fully adjusted Model 3, which accounted for socioeconomic factors such as education, religion, and employment, the poverty–access gradient observed in Model 2 persisted, although with modest or insignificant reductions in effect sizes. For example, the OR for highly-poor rural dwellers decreased to 1.568 (95% CI: 1.472 – 1.671), suggesting that these factors partly explain the advantage conferred by living in poor or rural areas with respect to access to healthcare. Contrary to expectations, educational attainment exhibited a nonlinear and counterintuitive relationship with healthcare access in Model 3. While those with primary education had slightly increased odds of access (OR = 1.057), individuals with secondary (OR = 0.951) and post-secondary education (OR = 0.878) had significantly lower odds of accessing care compared to those with no formal education. This reversal may indicate a suppression effect: in earlier models, without adjusting for education, more deprived groups appeared to have greater access. But once education was controlled for, it became evident that more educated individuals may face structural or behavioral barriers—such as greater selectivity in provider choice, reliance on private care, or distrust of local systems—that reduce their effective access. Employment status, introduced in Model 3, showed a nuanced relationship with access. Individuals who were looking for work had slightly higher odds of access (OR = 1.050), as did those employed full-time (OR = 1.045), whereas part-time employment was not significantly associated with access (P = 0.160). The inclusion of employment status also contributed to the partial mediation of some poverty effects, reinforcing the idea that employment operates as a partial pathway through which deprivation influences healthcare access.
Discussion
This study analysed the perceived difficulty in accessing healthcare due to the interaction between lived poverty and residential status of 46,885 individuals in 34 African countries in the Afrobarometer Round 8 data. Access to healthcare is fundamental to improving overall healthcare and reducing poverty and inequalities. The intertwined goals of improving access to healthcare and reducing poverty and inequalities are core to the Sustainable Development Goals (SDGs). Our results show persistence of higher odds of access to healthcare among the most economically deprived populations, even after adjusting for various covariates across the models, suggesting that this result is robust. Within the limits of the dataset, the main implication of this finding is that the divide between the urban and rural dwellers and between the rich and poor in terms of access to healthcare is narrowing in Africa. It points to notable progress in Africa in the efforts to reduce inequalities in access to healthcare and in achieving the SDGs.
Access to healthcare implies that individuals can have prompt utilization of health services to achieve the best possible outcomes. Access to healthcare is fundamentally mediated by two broad factors: physical availability and personal circumstances (including income, age, sex, education, dwelling place, perceptions about healthcare services, ethnicity, among others), which drive utilization (Figueroa et al., 2017). As a result, the spatial distribution of healthcare facilities between and within both urban and rural areas, rich and poor neighbourhoods, and the affordability of care are critical. The preponderance of acute and chronic poverty and multi-dimensional deprivation in Africa, as well as the factors that mediate healthcare access, including spatial disparities, are very well reported in literature (Ezeh et al., 2017; Mattes, 2020). In theory, it is expected that lived poverty would correspond to lower odds of access to healthcare, but this is contrary to our findings. The higher odds of access to healthcare by the poor is significant in and of itself and signals a need to seize the momentum to further enhance access in all its dimensions and quality of care.
The observed improvement in perceived access to healthcare in the current study might reflect positive outcomes in healthcare interventions by various African governments. These interventions include increasing the number of healthcare facilities and primary services, especially in rural areas, while reducing the cost of healthcare delivery to the poor. For example, in Ghana, Malawi, and Ethiopia, governments have embarked on improving the physical availability of healthcare facilities, coupled with the implementation of basic promotive, preventive, and curative health services in rural settlements by Community Health Nurses, Health Surveillance Assistants, and Health Extension Workers (Adusei et al., 2024; Elsey et al., 2023; Kok et al., 2016; Negussie & Girma, 2017). In Ghana, the supply of Community-based Health Planning and Services (CHPS) Compounds has increased substantially in the last decade. The provision of CHPS Compounds is an intervention aimed at enhancing access to basic healthcare services in rural areas and poor communities. The CHPS Compounds are much closer and affordable to those who most need these services. The introduction of a national health insurance scheme might have also helped address the affordability question in both rural and urban contexts (Wagnild et al., 2025), and, therefore, contributed to increased access or utilization of healthcare. Such interventions across the studied countries might help explain the narrowing gap in access to healthcare between the rural poor and the urban dweller.
Our results also provide nuanced insights into emerging patterns of differentiated access to healthcare between socio-economic groups. For example, individuals with higher levels of education may have lower odds of access due to selection bias. It is plausible that individuals with higher levels of education may have a smaller set of providers due to their perceptions of themselves and healthcare facilities (Saeed et al., 2016). This results in stringent selection criteria and, ultimately, greater reliance on expensive and distant private care facilities or services. These findings highlight the complexity of access dynamics and caution against assuming that higher education automatically enhances healthcare access. Females have greater odds of access than males. This might be due partly to the efforts to reduce the cost-burden of maternity care and general promotion of maternal and reproductive health programmes in Africa. Muslims and individuals associated with other religious beliefs had lower odds of access compared to Christians. This might be due to beliefs and practices, as opposed to the availability of healthcare facilities, constraining individuals from some services or promoting preference for specific services or facilities. Individuals in full-time employment or actively seeking a job had significantly higher odds of access to healthcare than individuals in other employment categories. This suggests that full-time employment may confer logistical or financial advantages in accessing care (Moeti et al., 2023; Saeed et al., 2016), while part-time work may lack sufficient stability or benefits to make a measurable difference. Some employment conditions include healthcare benefits, which enhance access to healthcare. Those seeking jobs would likely want to maintain a reasonable health status, which contributes to employability. These results suggest that employment, whether active or potential, can play a mediating role in access to healthcare, as it is a primary route to addressing other deprivations. Overall, our results suggest improvement in access to healthcare by the poor and rural dwellers in Africa. While socio-economic factors may have moderate effect on access to healthcare, the net interactive effects of geographic residence and lived poverty are the strongest predictor of access to healthcare in the studied countries in Africa.
Policy implications
The findings from the Afrobarometer Round 8 data provide encouraging evidence that access to healthcare in Africa is improving, particularly among poor populations in both urban and rural settings. This positive trend suggests that healthcare interventions in many African countries are beginning to break down long-standing barriers faced by economically disadvantaged groups. However, while access may be improving, persistent poor health outcomes indicate that access alone is not enough — the quality, reach, and integration of healthcare services remain critical concerns that policymakers must address.
One key implication of the study is the need to build upon the current successes. The observation that poor individuals report higher odds of accessing healthcare could reflect the impact of targeted interventions such as mobile clinics, expanded physical infrastructure, reduced costs, or growing public confidence in health systems. These interventions appear to be working in some contexts and should be scaled up or replicated where applicable. Policymakers should prioritize identifying the specific components that have contributed to improved access so they can be adapted and implemented in other regions with similar challenges.
Equally important is the recognition that healthcare access must not be considered in isolation from broader poverty reduction efforts. The relationship between poverty and health is deeply intertwined — poor health can drive households deeper into poverty, while poverty exacerbates poor health outcomes. Therefore, healthcare policies must be aligned with and embedded within national poverty alleviation strategies. Integrated programs that combine access to healthcare with social protection measures such as cash transfers or subsidies for the poor can help address the root causes of health inequities.
Study Limitations
The cross-sectional design limits causal inference given that the predictors and outcomes are contemporaneous; self-reported measures may suffer from reporting bias; residential categories may miss peri-urban gradient. Additionally, the study data does not reflect the scale and scope of health services utilization or the quality of service.
Conclusion
Access to healthcare and efforts to reduce poverty and inequalities are closely intertwined. Africa is known for its persistent poverty, inequalities, and limited access to healthcare, especially by poor households and rural dwellers. The results of the current study, derived from the Afrobarometer Round 8 data, point to a heartwarming progress in access to healthcare by the poor in both urban and rural settings. The results show that the interaction of lived poverty and residential status are the strongest predictor of healthcare access and this effect is only moderately affected by socio-economic factors. This suggests that efforts to improve access to healthcare ought to be solidly embedded in poverty reduction policies and programmes. Four main categories of countries, in terms of spatial concentration or distribution of poverty were found: countries (i) with high levels of poverty concentrated in rural areas (e.g. Burkina Faso and Malawi), (ii) with poverty concentrated in urban areas (e.g. South Africa and Gabon), (iii) with non-poor or minimally poor residents in both urban and rural settings (e.g. Mauritius and Cape Verde), and (iv) with balanced distribution of poverty across urban and rural areas. These heterogeneous characteristics suggest differences in structural factors that underpin poverty and access to healthcare. In general, the gradient in odds of reporting difficulty accessing medical care follows a clear and consistent pattern: as poverty intensifies, and as residence shifts from urban to rural, barriers to healthcare become more pronounced. Nonetheless, the robust finding from the pooled analysis is that poor individuals showed higher odds of access to healthcare. We conclude that, within the limits of this study, healthcare interventions in the countries studied are positively impacting access in rural areas and poor neighbourhoods and require further investigations. This might be due to increased supply and better spatial distribution of physical facilities, reduced cost of access or service, mobile health services, and increasing confidence in healthcare services, among others. The results point to a potential model that needs further investigation for refinement to inform the design and management of interventions aimed at increasing access to healthcare by poor households in similar jurisdictions, so that lived poverty and dwelling place do not constitute a blockade to access to healthcare. It is therefore imperative to identify the success factors of healthcare interventions and twinning those with poverty reduction efforts in Africa. Although the findings from the data point to high access to healthcare services by the rural/semi-urban dwellers in Africa, persistent poor health outcomes ought to be the new focus of African healthcare policy formulators and programme developers. This will require targeted interventions such as training and deploying qualified health professionals to rural areas, provision of mobile clinics to augment the existing rural health infrastructure, and further extending healthcare services to the current unreached rural dwellers and urban poor, and provision of financial subsidies, including amendments to health financing regulations and funding sources that will directly target improving health services. This is important in consideration of the observed emergent patterns of differentiated access (e.g. increased access by poor individuals while those with higher levels of education having lower access than individuals with lower levels of education).
Supplementary Materials
The following supporting information can be downloaded at the website of this paper posted on Preprints.org.
References
- Adusei, A. B.; Bour, H.; Amu, H.; Afriyie, A. Community-based Health Planning and Services programme in Ghana: a systematic review. Front Public Health 2024, 12, 1337803. [Google Scholar] [CrossRef] [PubMed]
- Afrobarometer. Merged Round 8 data (34 Countries) (2022). 2023. Available online: https://www.afrobarometer.org/survey-resource/merged-round-8-data-34-countries-2022/.
- Afrobarometer. What we do. 2025. Available online: https://www.afrobarometer.org/about/what-we-do/.
- Akello, B. Poverty in Africa: Causes, Consequences, and Potential Solutions. International Journal of Science and Society 2023, 5(4). [Google Scholar] [CrossRef]
- Armah, F. A.; Ekumah, B.; Yawson, D. O.; Odoi, J. O.; Afitiri, A.-R.; Nyieku, F. E. Access to improved water and sanitation in sub-Saharan Africa in a quarter century. Heliyon 2018, 4(11), e00931. [Google Scholar] [CrossRef] [PubMed]
- Boerma, T.; Ronsmans, C.; Melesse, D. Y.; Barros, A. J. D.; Barros, F. C.; Juan, L.; Temmerman, M. Global epidemiology of use of and disparities in caesarean sections. Lancet 2018, 392(10155), 1341–1348. [Google Scholar] [CrossRef] [PubMed]
- Ekumah, B.; Armah, F. A.; Yawson, D. O.; Quansah, R.; Nyieku, F. E.; Owusu, S. A.; Afitiri, A. R. Disparate on-site access to water, sanitation, and food storage heighten the risk of COVID-19 spread in Sub-Saharan Africa. Environ Res 2020, 189, 109936. [Google Scholar] [CrossRef] [PubMed]
- Elsey, H.; Abboah-Offei, M.; Vidyasagaran, A. L.; Anaseba, D.; Wallace, L.; Nwameme, A.; Agyepong, I. Implementation of the Community-based Health Planning and Services (CHPS) in rural and urban Ghana: a history and systematic review of what works, for whom and why [Systematic Review]. 2023, 11–2023. [Google Scholar] [CrossRef] [PubMed]
- Ezeh, A.; Oyebode, O.; Satterthwaite, D.; Chen, Y. F.; Ndugwa, R.; Sartori, J.; Lilford, R. J. The history, geography, and sociology of slums and the health problems of people who live in slums. Lancet 2017, 389(10068), 547–558. [Google Scholar] [CrossRef] [PubMed]
- Figueroa, J. F.; Frakt, A. B.; Lyon, Z. M.; Zhou, X.; Jha, A. K. Characteristics and spending patterns of high cost, non-elderly adults in Massachusetts. Healthc (Amst) 2017, 5(4), 165–170. [Google Scholar] [CrossRef] [PubMed]
- Hogan, A. B.; Jewell, B. L.; Sherrard-Smith, E.; Vesga, J. F.; Watson, O. J.; Whittaker, C.; Hallett, T. B. Potential impact of the COVID-19 pandemic on HIV, tuberculosis, and malaria in low-income and middle-income countries: a modelling study. Lancet Glob Health 2020, 8(9), e1132–e1141. [Google Scholar] [CrossRef] [PubMed]
- Kok, M. C.; Namakhoma, I.; Nyirenda, L.; Chikaphupha, K.; Broerse, J. E. W.; Dieleman, M.; Theobald, S. Health surveillance assistants as intermediates between the community and health sector in Malawi: exploring how relationships influence performance. BMC Health Services Research 2016, 16(1), 164. [Google Scholar] [CrossRef] [PubMed]
- Lilford, R. J.; Oyebode, O.; Satterthwaite, D.; Melendez-Torres, G. J.; Chen, Y. F.; Mberu, B.; Ezeh, A. Improving the health and welfare of people who live in slums. Lancet 2017, 389(10068), 559–570. [Google Scholar] [CrossRef] [PubMed]
- Marmot, M. Social determinants of health inequalities. Lancet 2005, 365(9464), 1099–1104. [Google Scholar] [CrossRef] [PubMed]
- Mattes, R. Lived Poverty On the Rise: Decade of Living Standard Gain Ends in Africa (Afrobarometer Policy Papers, Issue. Afrobarometer. 2020. Available online: https://pureportal.strath.ac.uk/en/publications/lived-poverty-on-the-rise-decade-of-living-standard-gain-ends-in-.
- Moeti, T.; Mokhele, T.; Weir-Smith, G.; Dlamini, S.; Tesfamicheal, S. Factors Affecting Access to Public Healthcare Facilities in the City of Tshwane, South Africa. Int J Environ Res Public Health 2023, 20(4). [Google Scholar] [CrossRef] [PubMed]
- Medicine, Health; Medicine, D.; Board on Health Care, S.; Adults with, D.; National Academies of Sciences; E; Committee on Health Care; U. Health-Care Utilization as a Proxy in Disability Determination; National Academies Press (US), 2018. [Google Scholar]
- Copyright 2018 by the National Academy of Sciences; All rights reserved. [CrossRef]
- Negussie, A.; Girma, G. Is the role of Health Extension Workers in the delivery of maternal and child health care services a significant attribute? The case of Dale district, southern Ethiopia. BMC Health Services Research 2017, 17(1), 641. [Google Scholar] [CrossRef] [PubMed]
- Polin, K.; Hjortland, M.; Maresso, A.; van Ginneken, E.; Busse, R.; Quentin, W. “Top-Three” health reforms in 31 high-income countries in 2018 and 2019: an expert informed overview. Health Policy 2021, 125(7), 815–832. [Google Scholar] [CrossRef] [PubMed]
- Saeed, B. I. I.; Yawson, A. E.; Nguah, S.; Agyei-Baffour, P.; Emmanuel, N.; Ayesu, E. Effect of socio-economic factors in utilization of different healthcare services among older adult men and women in Ghana. BMC Health Services Research 2016, 16(1), 390. [Google Scholar] [CrossRef] [PubMed]
- Wagnild, J. M.; Owusu, S. A.; Mariwah, S.; Kolo, V. I.; Vandi, A.; Namanya, D. B.; Hampshire, K. Can public education campaigns equitably counter the use of substandard and falsified medical products in African countries? Health Policy Plan 2025, 40(4), 447–458. [Google Scholar] [CrossRef] [PubMed]
- World Health Organization. Global strategic directions for nursing and midwifery 2021-2025. In Global strategic directions for nursing and midwifery 2021-2025; 2021. [Google Scholar]

Table 1.
Association between access to health facility and demographic attributes in 34 African countries (n=46885).
Table 1.
Association between access to health facility and demographic attributes in 34 African countries (n=46885).
| Variable | Access to healthcare | Inferential Statistics | |
|---|---|---|---|
| No (%) | Yes (%) | ||
| Residential poverty status | Pearson chi2(7) = 510.1049 Pr = 0.000, Cramér’s V = 0.1043 | ||
| Non-Poor Urban/Semi-Urban Dweller | 54 | 46 | |
| Non-Poor Rural Dweller | 47 | 53 | |
| Minimally-Poor Urban/Semi-Urban Dweller | 42 | 58 | |
| Minimally-Poor Rural Dweller | 37.7 | 62.3 | |
| Moderately-Poor Urban/Semi-Urban Dweller | 37.4 | 62.6 | |
| Moderately-Poor Rural Dweller | 34.1 | 65.9 | |
| Highly-Poor Urban/Semi-Urban Dweller | 37.8 | 62.2 | |
| Highly-Poor Rural Dweller | 35.5 | 64.5 | |
| Gender/Sex | Pearson chi2(1) = 206.4849 Pr = 0.000, Cramér’s V = 0.0664 | ||
| Male | 42.1 | 57.9 | |
| Female | 35.6 | 64.4 | |
| Age | Pearson chi2(5) = 128.3003 Pr = 0.000, Cramér’s V = 0.0523 | ||
| 18-24 | 43.2 | 56.8 | |
| 25-34 | 38.1 | 61.9 | |
| 35-44 | 38.0 | 62.0 | |
| 45-54 | 38.1 | 61.9 | |
| 55-64 | 37.0 | 63.0 | |
| 65 and over | 33.6 | 66.4 | |
| Educational Attainment | Pearson chi2(3) = 273.2232 Pr = 0.000, Cramér’s V = 0.0763 | ||
| No formal education | 35.6 | 64.4 | |
| Primary education | 35.0 | 65.0 | |
| Secondary education | 40.7 | 59.3 | |
| Post-secondary education | 45.1 | 55.0 | |
| Religion | Pearson chi2(2) = 40.1463 Pr = 0.000, Cramér’s V = 0.0293 | ||
| Christian | 37.9 | 62.1 | |
| Muslim | 39.2 | 60.8 | |
| Others | 43.0 | 57.1 | |
| Employment Status | Pearson chi2(3) = 22.7159 Pr = 0.000, Cramér’s V = 0.0220 | ||
| No (not looking) | 38.3 | 61.7 | |
| No (looking) | 37.8 | 62.2 | |
| Yes, part time | 39.6 | 60.4 | |
| Yes, full time | 40.6 | 59.4 | |
Table 2.
Association between payment of bribe for access to healthcare and demographic factors (N=46885).
Table 2.
Association between payment of bribe for access to healthcare and demographic factors (N=46885).
| Variable | Payment of a bribe to access healthcare | Inferential Statistics | ||||
|---|---|---|---|---|---|---|
| Never (%) | Once or twice (%) | A few times (%) | Often (%) | Not applicable (%) | ||
| Residential poverty status | Pearson chi2(28) = 914.0231 Pr = 0.000, Cramér’s V = 0.0698 | |||||
| Non-Poor Urban/Semi-Urban Dweller | 40.4 | 3.0 | 1.6 | 1.4 | 53.6 | |
| Non-Poor Rural Dweller | 48.0 | 2.5 | 1.7 | 1.1 | 46.8 | |
| Minimally-Poor Urban/Semi-Urban Dweller | 48.0 | 5.0 | 2.7 | 1.8 | 42.4 | |
| Minimally-Poor Rural Dweller | 53.3 | 4.6 | 2.7 | 1.7 | 37.7 | |
| Moderately-Poor Urban/Semi-Urban Dweller | 48.7 | 6.4 | 4.2 | 3.3 | 37.4 | |
| Moderately-Poor Rural Dweller | 53.5 | 6.0 | 3.8 | 2.6 | 34.1 | |
| Highly-Poor Urban/Semi-Urban Dweller | 46.1 | 6.2 | 5.6 | 4.4 | 37.8 | |
| Highly-Poor Rural Dweller | 49.7 | 5.3 | 5.2 | 4.2 | 35.5 | |
| Gender/Sex | Pearson chi2(4) = 234.3382 Pr = 0.000, Cramér’s V = 0.0707 | |||||
| Male | 46.3 | 5.3 | 3.7 | 2.6 | 42.1 | |
| Female | 53.1 | 5.2 | 3.5 | 2.7 | 35.6 | |
| Age | Pearson chi2(20) = 296.7697 Pr = 0.000, Cramér’s V = 0.0398 | |||||
| 18-24 | 45.0 | 5.2 | 3.7 | 2.9 | 43.2 | |
| 25-34 | 49.0 | 6.1 | 4.0 | 2.9 | 38.1 | |
| 35-44 | 50.2 | 5.3 | 3.9 | 2.7 | 38.0 | |
| 45-54 | 51.1 | 5.0 | 3.5 | 2.3 | 38.1 | |
| 55-64 | 53.4 | 4.5 | 2.7 | 2.4 | 37.0 | |
| 65 and over | 59.6 | 3.2 | 2.1 | 1.5 | 33.6 | |
| Educational Attainment | Pearson chi2(12) = 305.2040 Pr = 0.000, Cramér’s V = 0.0466 | |||||
| No formal education | 51.7 | 5.3 | 4.3 | 3.1 | 35.6 | |
| Primary education | 52.9 | 5.5 | 3.5 | 3.0 | 35.0 | |
| Secondary education | 48.7 | 5.0 | 3.3 | 2.3 | 40.7 | |
| Post-secondary education | 44.1 | 5.2 | 3.5 | 2.2 | 45.1 | |
| Religion | Pearson chi2(8) = 109.2195 Pr = 0.000, Cramér’s V = 0.0341 | |||||
| Christian | 50.9 | 5.3 | 3.4 | 2.5 | 37.9 | |
| Muslim | 48.1 | 5.5 | 4.1 | 3.1 | 39.2 | |
| Others | 48.6 | 3.9 | 2.7 | 1.9 | 43.0 | |
| Employment Status | Pearson chi2(12) = 77.8964 Pr = 0.000, Cramér’s V = 0.0235 | |||||
| No (not looking) | 50.9 | 5.0 | 3.4 | 2.4 | 38.3 | |
| No (looking) | 49.0 | 6.0 | 4.0 | 3.3 | 37.8 | |
| Yes, part time | 48.8 | 5.3 | 3.8 | 2.5 | 39.6 | |
| Yes, full time | 48.8 | 4.9 | 3.3 | 2.4 | 40.6 | |
Table 3.
Bivariate complementary log-log regression predicting access to healthcare.
| Odds Ratio | SE | P-Value | 95% CI | ||
|---|---|---|---|---|---|
| Variable | |||||
| Residential poverty status (Ref: Non-Poor Urban/Semi-Urban Dweller) | |||||
| Non-Poor Rural Dweller | 1.217 | 0.051 | 0.000 | 1.121 | 1.321 |
| Minimally-Poor Urban/Semi-Urban Dweller | 1.376 | 0.042 | 0.000 | 1.295 | 1.461 |
| Minimally-Poor Rural Dweller | 1.561 | 0.048 | 0.000 | 1.470 | 1.657 |
| Moderately-Poor Urban/Semi-Urban Dweller | 1.575 | 0.049 | 0.000 | 1.481 | 1.674 |
| Moderately-Poor Rural Dweller | 1.725 | 0.051 | 0.000 | 1.627 | 1.828 |
| Highly-Poor Urban/Semi-Urban Dweller | 1.559 | 0.054 | 0.000 | 1.457 | 1.667 |
| Highly-Poor Rural Dweller | 1.660 | 0.052 | 0.000 | 1.561 | 1.764 |
| Age (Ref: 18-24 years) | |||||
| 25-34 years | 1.149 | 0.020 | 0.000 | 1.110 | 1.189 |
| 35-44 years | 1.153 | 0.022 | 0.000 | 1.111 | 1.197 |
| 45-54 years | 1.148 | 0.025 | 0.000 | 1.101 | 1.198 |
| 55-64 years | 1.185 | 0.030 | 0.000 | 1.129 | 1.245 |
| 65 and over years | 1.301 | 0.036 | 0.000 | 1.232 | 1.374 |
| Gender/Sex (Ref: Male) | |||||
| Female | 1.193 | 0.015 | 0.000 | 1.164 | 1.222 |
| Educational Attainment (Ref: No formal education) | |||||
| Primary education | 1.016 | 0.018 | 0.358 | 0.982 | 1.052 |
| Secondary education | 0.870 | 0.015 | 0.000 | 0.842 | 0.900 |
| Post-secondary education | 0.772 | 0.016 | 0.000 | 0.742 | 0.804 |
| Religion (Ref: Christian) | |||||
| Muslim | 0.967 | 0.013 | 0.011 | 0.942 | 0.992 |
| Others | 0.872 | 0.020 | 0.000 | 0.835 | 0.911 |
| Employment Status (Ref: No (not looking)) | |||||
| No (looking) | 1.015 | 0.016 | 0.334 | 0.985 | 1.046 |
| Yes, part time | 0.966 | 0.019 | 0.086 | 0.929 | 1.005 |
| Yes, full time | 0.939 | 0.016 | 0.000 | 0.909 | 0.970 |
Table 4.
Multivariate complementary log-log regression model predicting access to healthcare.
| Model 1 (Deprivation) | Model 2 (+Biosocial Factors) | Model 3 (+Socioeconomic Factors) | |||||||||||||
|---|---|---|---|---|---|---|---|---|---|---|---|---|---|---|---|
| Odds Ratio | SE | P-Value | 95% CI | Odds Ratio | SE | P-Value | 95% CI | Odds Ratio | SE | P-Value | 95% CI | ||||
| Variable | |||||||||||||||
| Residential poverty status (Ref: Non-Poor Urban/Semi-Urban Dweller) | |||||||||||||||
| Non-Poor Rural Dweller | 1.217 | 0.051 | 0.000 | 1.121 | 1.321 | 1.215 | 0.051 | 0.000 | 1.120 | 1.319 | 1.185 | 0.050 | 0.000 | 1.091 | 1.288 |
| Minimally-Poor Urban/Semi-Urban Dweller | 1.376 | 0.042 | 0.000 | 1.295 | 1.461 | 1.385 | 0.043 | 0.000 | 1.304 | 1.471 | 1.361 | 0.042 | 0.000 | 1.281 | 1.446 |
| Minimally-Poor Rural Dweller | 1.561 | 0.048 | 0.000 | 1.470 | 1.657 | 1.560 | 0.048 | 0.000 | 1.469 | 1.656 | 1.492 | 0.047 | 0.000 | 1.403 | 1.586 |
| Moderately-Poor Urban/Semi-Urban Dweller | 1.575 | 0.049 | 0.000 | 1.481 | 1.674 | 1.588 | 0.050 | 0.000 | 1.494 | 1.688 | 1.548 | 0.049 | 0.000 | 1.455 | 1.647 |
| Moderately-Poor Rural Dweller | 1.725 | 0.051 | 0.000 | 1.627 | 1.828 | 1.719 | 0.051 | 0.000 | 1.622 | 1.823 | 1.637 | 0.050 | 0.000 | 1.541 | 1.738 |
| Highly-Poor Urban/Semi-Urban Dweller | 1.559 | 0.054 | 0.000 | 1.457 | 1.667 | 1.562 | 0.054 | 0.000 | 1.461 | 1.671 | 1.516 | 0.053 | 0.000 | 1.417 | 1.623 |
| Highly-Poor Rural Dweller | 1.660 | 0.052 | 0.000 | 1.561 | 1.764 | 1.650 | 0.051 | 0.000 | 1.552 | 1.754 | 1.568 | 0.051 | 0.000 | 1.472 | 1.671 |
| Age (Ref: 18-24 years) | |||||||||||||||
| 25-34 years | 1.144 | 0.020 | 0.000 | 1.105 | 1.184 | 1.142 | 0.020 | 0.000 | 1.102 | 1.183 | |||||
| 35-44 years | 1.148 | 0.022 | 0.000 | 1.106 | 1.191 | 1.134 | 0.022 | 0.000 | 1.092 | 1.178 | |||||
| 45-54 years | 1.155 | 0.025 | 0.000 | 1.107 | 1.204 | 1.135 | 0.025 | 0.000 | 1.087 | 1.185 | |||||
| 55-64 years | 1.196 | 0.030 | 0.000 | 1.139 | 1.257 | 1.175 | 0.030 | 0.000 | 1.117 | 1.236 | |||||
| 65 and over years | 1.318 | 0.037 | 0.000 | 1.248 | 1.392 | 1.296 | 0.037 | 0.000 | 1.225 | 1.371 | |||||
| Gender/Sex (Ref: Male) | |||||||||||||||
| Female | 1.200 | 0.015 | 0.000 | 1.171 | 1.229 | 1.189 | 0.015 | 0.000 | 1.160 | 1.219 | |||||
| Educational Attainment (Ref: No formal education) | |||||||||||||||
| Primary education | 1.057 | 0.019 | 0.003 | 1.019 | 1.096 | ||||||||||
| Secondary education | 0.951 | 0.018 | 0.009 | 0.916 | 0.987 | ||||||||||
| Post-secondary education | 0.878 | 0.020 | 0.000 | 0.839 | 0.918 | ||||||||||
| Religion (Ref: Christian) | |||||||||||||||
| Muslim | 0.970 | 0.013 | 0.030 | 0.944 | 0.997 | ||||||||||
| Others | 0.901 | 0.020 | 0.000 | 0.862 | 0.942 | ||||||||||
| Employment Status (Ref: No (not looking)) | |||||||||||||||
| No (looking) | 1.050 | 0.017 | 0.002 | 1.018 | 1.084 | ||||||||||
| Yes, part time | 1.029 | 0.021 | 0.160 | 0.989 | 1.071 | ||||||||||
| Yes, full time | 1.045 | 0.018 | 0.013 | 1.009 | 1.082 | ||||||||||
Disclaimer/Publisher’s Note: The statements, opinions and data contained in all publications are solely those of the individual author(s) and contributor(s) and not of MDPI and/or the editor(s). MDPI and/or the editor(s) disclaim responsibility for any injury to people or property resulting from any ideas, methods, instructions or products referred to in the content. |
© 2025 by the authors. Licensee MDPI, Basel, Switzerland. This article is an open access article distributed under the terms and conditions of the Creative Commons Attribution (CC BY) license (http://creativecommons.org/licenses/by/4.0/).
Copyright: This open access article is published under a Creative Commons CC BY 4.0 license, which permit the free download, distribution, and reuse, provided that the author and preprint are cited in any reuse.


