
Submitted:
18 December 2025
Posted:
19 December 2025
You are already at the latest version
Abstract
High construction costs have plagued recent nuclear projects, and they hamper the widespread deployment of nuclear technology. The Nuclear Cost Reduction Tool is a reactor economic framework that quantifies the impact that various reactor design and construction attributes have on construction costs and cost overruns and shows the positive effects of learning over a series of deployments. However, a downside of the current model is that all model output and capabilities are deterministic. To provide a more comprehensive view, this study evaluated the impact of model parameter uncertainty through sensitivity analysis applied to 18 model parameters. This approach quantified the impact of model uncertainty on the output variables of Net Overnight Capital Cost (Net OCC), Construction Duration (CD), and Levelized Cost of Electricity (LCOE). Monte Carlo analysis revealed uncertainty distributions for these variables, showing that absolute uncertainty decreases over a series of deployments. A local sensitivity analysis showed that even small parameter perturbations (5%) can have a significant impact on project execution, highlighting areas that could reduce costs by billions across an order book of reactors. The results of this study have improved the understanding of the model and identified the most impactful model parameters and construction attributes.
Keywords:
nuclear
; economics
; uncertainty quantification
; Monte Carlo
; sensitivity analysis
; construction costs
; levelized cost of electricity
1. Introduction
A key issue impeding the deployment of new advanced reactor designs is cost, specifically the capital costs of first-of-a-kind (FOAK) reactor projects and the potential for cost overruns [1,2]. An additional component of this issue is that discerning the impact and importance of different reactor design and construction project characteristics can be difficult due to a lack of information and conflicting analysis methods. Consequently, this challenge makes it hard to determine which aspects of reactor projects should receive investments for potential cost improvements.
An important study to examine nuclear costs and trends for nuclear cost drivers was the Energy Economics Database, which organized economics data into a code-of-accounts structure to quantify economic correlations in nuclear project economics [3,4,5,6,7]. Subsequent studies on nuclear economics and cost drivers used this original data as the basis for their analyses and tools [8,9,10,11,12,13,14,15,16]. Many cost trend analyses tend to rely on the learning rate equation, which describes how costs decrease due to the improved construction experience and supply chain development that are the result of more reactors of the same type being built [17,18]. However, this approach can be an oversimplification of how costs are reduced between deployments and provides little insight into what drives the pathways to cost reduction. Improving on this, recent studies have combined the learning rate equation with a bottom-up approach in which costs related to individual components and subsystems of a reactor design are calculated and used to derive overall system costs [19,20,21]. Increasingly, this approach is being used to estimate costs for advanced reactor designs and small modular reactor designs as overall cost data for these yet-to-be deployed designs is nearly non-existent. Consequently, there is a large degree of uncertainty in the estimation of advanced reactor learning rates.
To address these concerns, the Nuclear Cost Reduction Tool was created to provide a framework for estimating the costs over an order book or series of deployments for FOAK advanced reactor designs based on various reactor design and construction attributes [22]. The tool uses the generalized nuclear code-of-accounts as a basis for inputting the well-executed FOAK and Nth-of-a-kind (NOAK) cost estimates. Then, it incorporates design attributes, construction attributes, supply chain maturity levels, and other factors to estimate FOAK costs, which include cost and schedule overruns. The tool then projects cost reductions over an order book of the same plants as they approach NOAK costs. This approach allows for the identification of learning and cost savings on a more granular, plant-by-plant level, demonstrating the transition from FOAK to NOAK. [17,18]. The hope is that the tool will help catalyze the investment and deployment of FOAK reactor projects by quantifying the size of potential risk associated with early deployments and improve transparency of risk associated with various design and construction attributes. Additionally, the tool can demonstrate how this risk can be reduced locally through the creation of a large order book and the potential cost savings for NOAK reactors that result from learning-by-doing [23]. The correlations and calculations in the tool are based on previous studies on nuclear cost drivers [1,8,24] that made progress to untangle the attributes that affect learning rates.
An important aspect of the Nuclear Cost Reduction Tool is that it accounts for the effects of construction attributes (some of which are connected to design) and non-design-related factors on the cost of nuclear projects. The tool uses and follows the findings of several previous reports and studies that attributed reactor project cost increases to labor and working statistics, factory and equipment costs, regulatory interference, design completion, design modularity, and more [25,26,27,28]. The tool also integrates indirect costs (related to engineering services, construction management, field supervision, startup, and testing) [29], an important component of project costs that often does not receive robust consideration in cost analyses and is usually attributed to a single static factor of direct costs. The tool leverages these insights and considers the impact of high-level decisions (e.g., government support, contractor proficiency, reactor order book size, etc.) to provide FOAK and NOAK cost evolutions.
However, one limitation of the tool is that all model output and capabilities are deterministic; no uncertainty ranges or error bars are used to estimate output variables. This downside has the potential to lead to inaccurate results that do not account for inherent uncertainty in the cost model and therefore lead to lower trust in model outputs. This issue is further exacerbated by the large degree of uncertainty in advanced reactor economic metrics and the wide variety of nuclear economic studies that use different databases and analysis techniques for studying advanced reactor economics and learning rates [2,25,26].
To address this limitation, this study presents an uncertainty quantification of the Nuclear Cost Reduction Tool to determine the effect that uncertainty has on the model outputs of Net Overnight Capital Cost (Net OCC), Construction Duration (CD), and Levelized Cost of Electricity (LCOE). Additionally, a local sensitivity analysis is performed to estimate the relative importance of the model parameters (compared to each other) on output variables and to quantify potential cost savings that arise from perturbing model parameters. Given the large degree of uncertainty in advanced reactor economic data, it is crucial to quantify the uncertainty in the Nuclear Cost Reduction Tool and add uncertainty estimates to it. This will improve the trustworthiness of its results and address the shortcomings in economic data and calculations.
The analysis discussed in this article is broken into three main sections. Section 2 describes the methodology of the work, the underlying model, and the parameters that were analyzed in the study. Section 3 discusses the results and key findings from the study. Section 4 provides the discussion, and last, Section 5 summarizes the findings and highlights potential areas of future work.
2. Methodology
The cost reduction framework contains three different types of variables. The first type is input levers, which are values that the user can directly change. Input levers are the independent variables of the model that users can freely modify to assess the impact of different input lever values. The second type is model parameters, which are underlying variables that modify the input levers. Model parameters function similarly to coefficients, determining the impact of the input levers on the model outputs. The third and final type is output variables, which are the important variables that users aim to estimate. The output variables are obtained by modifying the input levers by the model parameters and are important project statistics, such as costs and construction durations.
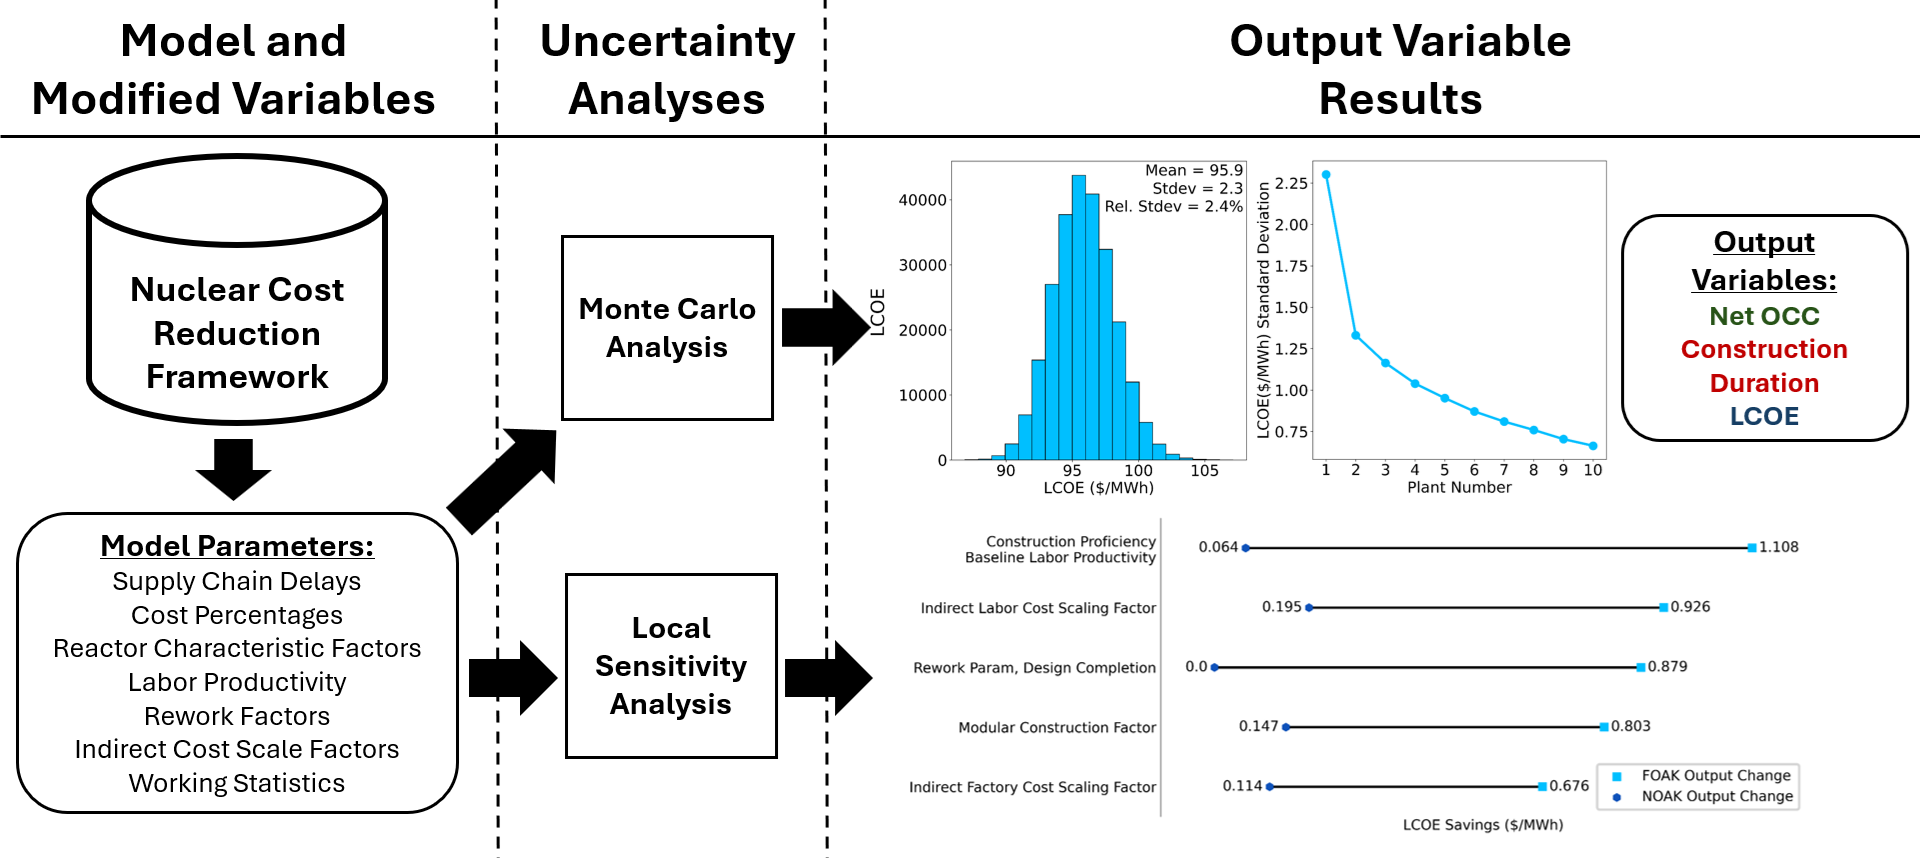
Since the goal of this analysis is to evaluate how uncertainty in the model’s underlying assumptions affects its outputs, uncertainty was applied only to the model parameters. These parameters represent the assumptions that govern how input lever values influence output variables. Uncertainty was not applied to the input levers themselves, as users can already explore variability in those values independently. Figure 1 shows the input levels, model parameter groups, and output variables that were important for the analysis (the variables included are not exhaustive).
2.1. Model Parameters
A total of 18 model parameters, organized into seven groups, were modified for the analysis. The following subsections detail each parameter group and any relation it may have with the relevant input levers based on the relationship each parameter group has with the input levers. There are three types of parameters discussed below: static parameters that are not affected by inputs, linear parameters that are affected by inputs, and reactor characteristic variables that are affected by design characteristics (also an input).
2.1.1. Static Parameters
These groups of parameters have singular values that do not change as input lever values are changed, nor do they change throughout a plant order book.
Cost Percentages represent the cost amount for specified indirect cost categories as a percentage of the factory and construction supervision indirect costs. The nominal percentage values are taken from a sodium fast reactor study by Prosser [30]. There are three parameters in this group: Startup Cost Percent, Shipping and Transportation Cost Percent, and Engineering Services Cost Percent.
Working Statistics measure statistics related to the size and time commitment of the construction labor force. The nominal statistics are taken from an analysis by Stewart [15]. There are two parameters in this group: Average Number of Workers and Working Hours per Month.
Indirect Cost Scale Factors define the ratio in magnitude between direct costs and indirect costs for different cost categories. The nominal ratios are again taken from an analysis by Stewart [15]. There are three parameters in this group: Indirect Factory Cost Scale Factor, Indirect Materials Cost Scale Factor, and Indirect Labor Cost Scale Factor.
2.1.2. Linear Parameters
This group of parameters are linear coefficients in linear equations where the independent variable is an input lever variable. Each linear equation has two constraints: a baseline value at the lowest proficiency and an optimal value at maximum proficiency. Because of these constraints, these linear relationships can be controlled just by the baseline value and then by adjusting the linear relationship to meet the constraints.
A key feature of these parameters is that as the input lever proficiency increases, the range of possible outcomes for the dependent variable becomes smaller. At maximum proficiency, the outcomes converge to a single value with no variation. This is important because the model assumes that proficiency improves with each new plant, which means that the uncertainty in these parameters decreases for subsequent plants.
Labor Productivity measures how efficiently construction converts working hours to project progress. It is linearly dependent on the Construction Proficiency parameter and can be controlled via the Baseline Labor Productivity at minimum Construction Proficiency, which was taken from the average labor productivity of the Vogtle nuclear project [31]. The only parameter in this group is Baseline Labor Productivity.
Rework Factors measure the percentage of the reactor construction that must be redone after initial construction is finished. It is controlled via the baseline rework factor at minimum proficiencies that are estimated based on data from two separate studies by Stewart and the U.S. DOE [15,27]. This group contains three parameters: Rework from Design Completion, Rework from Architecture/Engineering Proficiency, and Rework from Construction Proficiency.
Supply Chain Delay measures the amount of time that construction is delayed due to inefficiencies in the supply chain. The baseline Supply Chain Delay values are from an analysis by Stewart [15]. This group contains two parameters: Delay from Design Maturity and Delay from Supply Chain Proficiency.
2.1.3. Reactor Characteristic Factors
This group of parameters reduces construction duration or total cost by a set percentage based on specific reactor design characteristics.
The Modular Civil Construction Characteristic depends on whether or not the reactor parts are designed for modularity. If the characteristic is TRUE, construction duration is reduced by a factor taken from an analysis by Stewart [14].
The Commercial Balance of Plant (BOP) Characteristic depends on whether the balance- of- plant can be commercially sourced from non-nuclear vendors (and therefore is NOT subject to nuclear qualifications). If TRUE, the total cost is reduced by a factor derived from a cost data study by Delene [32].
Lastly, the Non-safety Related Reactor Building (RB) characteristic depends on if the RB needs safety functionality (if the passive safety features of the reactor are sufficient), the total cost is reduced by a factor derived from a cost data study by Delene [32].
Parameter group behaviors can be used to predict how important each group will be to output variables. We expect the linear parameters to be the most impactful for the earlier plants in the order book because lower lever proficiencies result in greater variation from the different linear parameter baseline values. For later plants in the order book, the higher lever proficiencies will cause less variation in the linear parameters for later plants in the order book. The values of the static parameter and reactor characteristic factors do not change throughout an order book. Because of this consistency in value, the static parameter and reactor characteristic factors should have more impact for later plants in an order book.
2.2. Output Variables
There are three output variables measured by this analysis: Net OCC, CD, and LCOE. Net OCC represents the inherent cost to build the reactor without the inclusion of interest costs. The Net OCC output is represented by units of dollars or $/kWe. CD measures how long it will take to build the reactor and is represented in units of months. The CD value impacts indirect costs, which in turn can affect the Net OCC. LCOE measures the cost needed for the reactor to produce electricity per unit energy. This output is represented in units $/MWh.
Additionally, each output variables has two variants for FOAK and NOAK. For FOAK, there is no learning-by-doing. Therefore, the Net OCC, CD, and LCOE for the FOAK plant are almost always the highest compared to subsequent plants. For NOAK, the Net OCC, CD, and LCOE represent that maximum learning-by-doing has been achieved. NOAK plants almost always have the lowest Net OCC, CD, and LCOE (compared to previous plants), and their input lever values are at or near their maximum proficiency.
2.3. Uncertainty Analyses
Two types of uncertainty analyses are performed on the model parameters:
- Monte Carlo Sampling: All model parameter values are sampled from normal distributions where their mean value is their respective nominal value, and their standard deviation is 5% of their respective nominal value. A normal distribution was chosen as a generic distribution due to the lack of information about the uncertainty behavior of the parameters. Meanwhile, the perturbation percentage was chosen because it is a good representative value that can capture the effect of uncertainty on the output variables without being too large. This is done for a set number of samples, and the output variable values are recorded for each sample. This list of output values can then be analyzed using distribution plotting and uncertainty measurements for different plants in an order book.
- Local Sensitivity Analysis: All model parameters are individually perturbed by a set amount of their nominal value (±5% in this study) and the change to the output variable values is recorded. This change can be used to estimate the impact that each parameter has on the output variables and the potential cost savings, or construction duration decreases that can be achieved by perturbing the parameter values.
2.4. Input Lever Values
The same input lever values were used for all analyses and are shown in Table 1. The reactor design used for all analyses is the dual-unit, 2,234 MWe Large Passive Safety Reactor (LPSR)[15]. A few input lever values were changed from their original values to improve the quality of the uncertainty analyses. First, all the reactor characteristic Boolean levers were set to TRUE so the effect of changing the reactor characteristic factors could be measured. If the Boolean levers were set to FALSE, then changing the factor values would have had no effect. Next, all input lever FOAK proficiencies were set to a value of 1 because it was the middle value in the proficiency range of values (ranging from 0 to 2). Last, a feature of the tool is that the proficiency lever values increase toward the maximum proficiency values for each subsequent plant. Since the learning effects and NOAK performance of advanced reactors are not well understood, the number of plants to achieve best proficiency was set to 9 so that all proficiencies would reach their maximum value at the final tenth plant instead of the optimistic scenario where maximum proficiency is reached before the final plant.
3. Results
3.1. Omitted Parameters
Some parameters that were originally included in the uncertainty quantification were removed for the final analysis:
Land cost measures the dollars per acre needed to acquire the land needed for the nuclear construction project. Applying uncertainty to this parameter had no impact on Net OCC, CD, or LCOE because this cost is not included in the Net OCC or LCOE calculations. For the sake of brevity, it was omitted.
The Indirect Labor Hours Scale Factor measures the ratio between labor hours needed for indirect cost related tasks to the labor hours needed for direct cost related tasks. Applying uncertainty to this parameter had no impact on Net OCC, CD, or LCOE. At the time of this analysis, it was unclear whether this was an actual result or a mistake in the code. Once this has been determined, this parameter will be included in future analyses.
The Baseline Cross Site Standardization measures the percentage of the FOAK reactor design that can be standardized for different sites. Applying uncertainty to this parameter did have an impact on the output variables but the results were unexpected with a higher baseline cross site standardization resulting in worse output variable metrics. This may be due to an issue with the model or how the uncertainty quantification was applied to this parameter. Therefore, this variable was omitted and remained at its nominal value for this analysis to not alter the results of the other parameters.
3.2. Monte Carlo Sampling, Output Variable Distributions
Figure 2 shows the resulting distributions for FOAK Net OCC (top), CD (middle), and LCOE (bottom) when all model parameters are sampled from normal distributions with a 5% standard deviation compared to their nominal values. All output distributions appear to be normally distributed, but the FOAK Net OCC distribution has a slight rightward tail which is more apparent in the Cumulative Distribution Function (CDF) plot, where the difference in the last two percentile points is larger than the difference in the first two percentile points. This rightward tail indicates that some of the model parameters have nonlinear relationships with FOAK Net OCC and FOAK LCOE; the parameter perturbations that increase costs are more impactful than parameter perturbations that decrease costs. These nonlinear relationships might be a contributing factor to the difficulty in lowering the costs of nuclear construction projects; the relevant parameters are more sensitive to increasing costs than to decreasing costs. The relative uncertainties for FOAK Net OCC (3.24%) and FOAK LCOE (2.40%) are larger than the relative uncertainty for CD (0.87%), which indicates that uncertainty in the model parameters has a greater impact on FOAK Net OCC and FOAK LCOE than on FOAK CD. This indicates that uncertainty in model parameters affects cost-related outputs more significantly than CD, underscoring the need to focus on cost-controlling strategies in FOAK nuclear projects.
Figure 3 shows the resulting distributions for NOAK Net OCC (top), CD (middle), and LCOE (bottom) when all model parameters are sampled from normal distributions with a 5% standard deviation compared to their nominal values. All three output distributions are mostly normally distributed, with the slight rightward tail for FOAK Net OCC and FOAK LCOE still present for NOAK Net OCC and NOAK LCOE. While the relative uncertainties for NOAK Net OCC (2.49%) and NOAK LCOE (1.36%) are larger than the relative uncertainty for CD (0.97%), the gap in relative uncertainty for the NOAK outputs is smaller than it is for the FOAK outputs. Similar to before, costs appear more sensitive to uncertainty than construction duration, likely due to a compounding effect where construction issues drive both schedule delays and cost increases, while schedule delays independently contribute to additional costs.
3.3. Monte Carlo Sampling, Uncertainty Trends
Because tracking the values of output variables over a plant order book is an important capability of the tool, an analysis of how uncertainty in output variables changes over a plant order book was performed. Figure 4 shows the trend in standard deviation for Net OCC, CD, and LCOE from the first plant built to the tenth. The absolute uncertainty trend figures for all three output variables show the same thing: the absolute uncertainty in the output variables is highest for the FOAK plant before decreasing with diminishing returns for subsequent plants. This trend matches the trend in the output variable values themselves, of starting at the highest value for the FOAK plant and decreasing with diminishing returns for subsequent plants [22]. This result meets expectations where uncertainty reduces as learning increases.
3.4. Local Sensitivity Analysis, Cost and Time Savings
The most impactful variables for FOAK Net OCC changes are related to Labor Productivity, Rework from Design Completion, Indirect Cost Scale Factors, and Working Statistic parameters. The Labor Productivity parameter is the most impactful with a potential Net OCC change of roughly $270 million from just a 5% parameter perturbation, and the savings from the other parameter perturbations are still in the range of hundreds of millions of dollars.
For NOAK Net OCC, only the Working Statistics and Indirect Cost Scale Factors parameters have high importance, having a change of approximately $100 million in Net OCC from 5% parameter perturbations, while the impact of the Rework and Labor Productivity parameters drops dramatically. This is expected due to the behavior of linear parameters (Labor productivity, Rework, and Supply Chain Delay parameters) at near maximum input level proficiencies for NOAK reactors (see subsection 2.1.2. for more details). While the Net OCC changes for the NOAK plants are smaller than the changes in the FOAK plants for all parameters, potential cost savings of $100 million are still a significant change from 5% individual parameter perturbations.
Figure 5.
Potential cost savings (in millions of dollars) comparison for FOAK and NOAK Net OCC from parameter perturbations of 5% for a 2,234 MWe reactor design.
Figure 5.
Potential cost savings (in millions of dollars) comparison for FOAK and NOAK Net OCC from parameter perturbations of 5% for a 2,234 MWe reactor design.
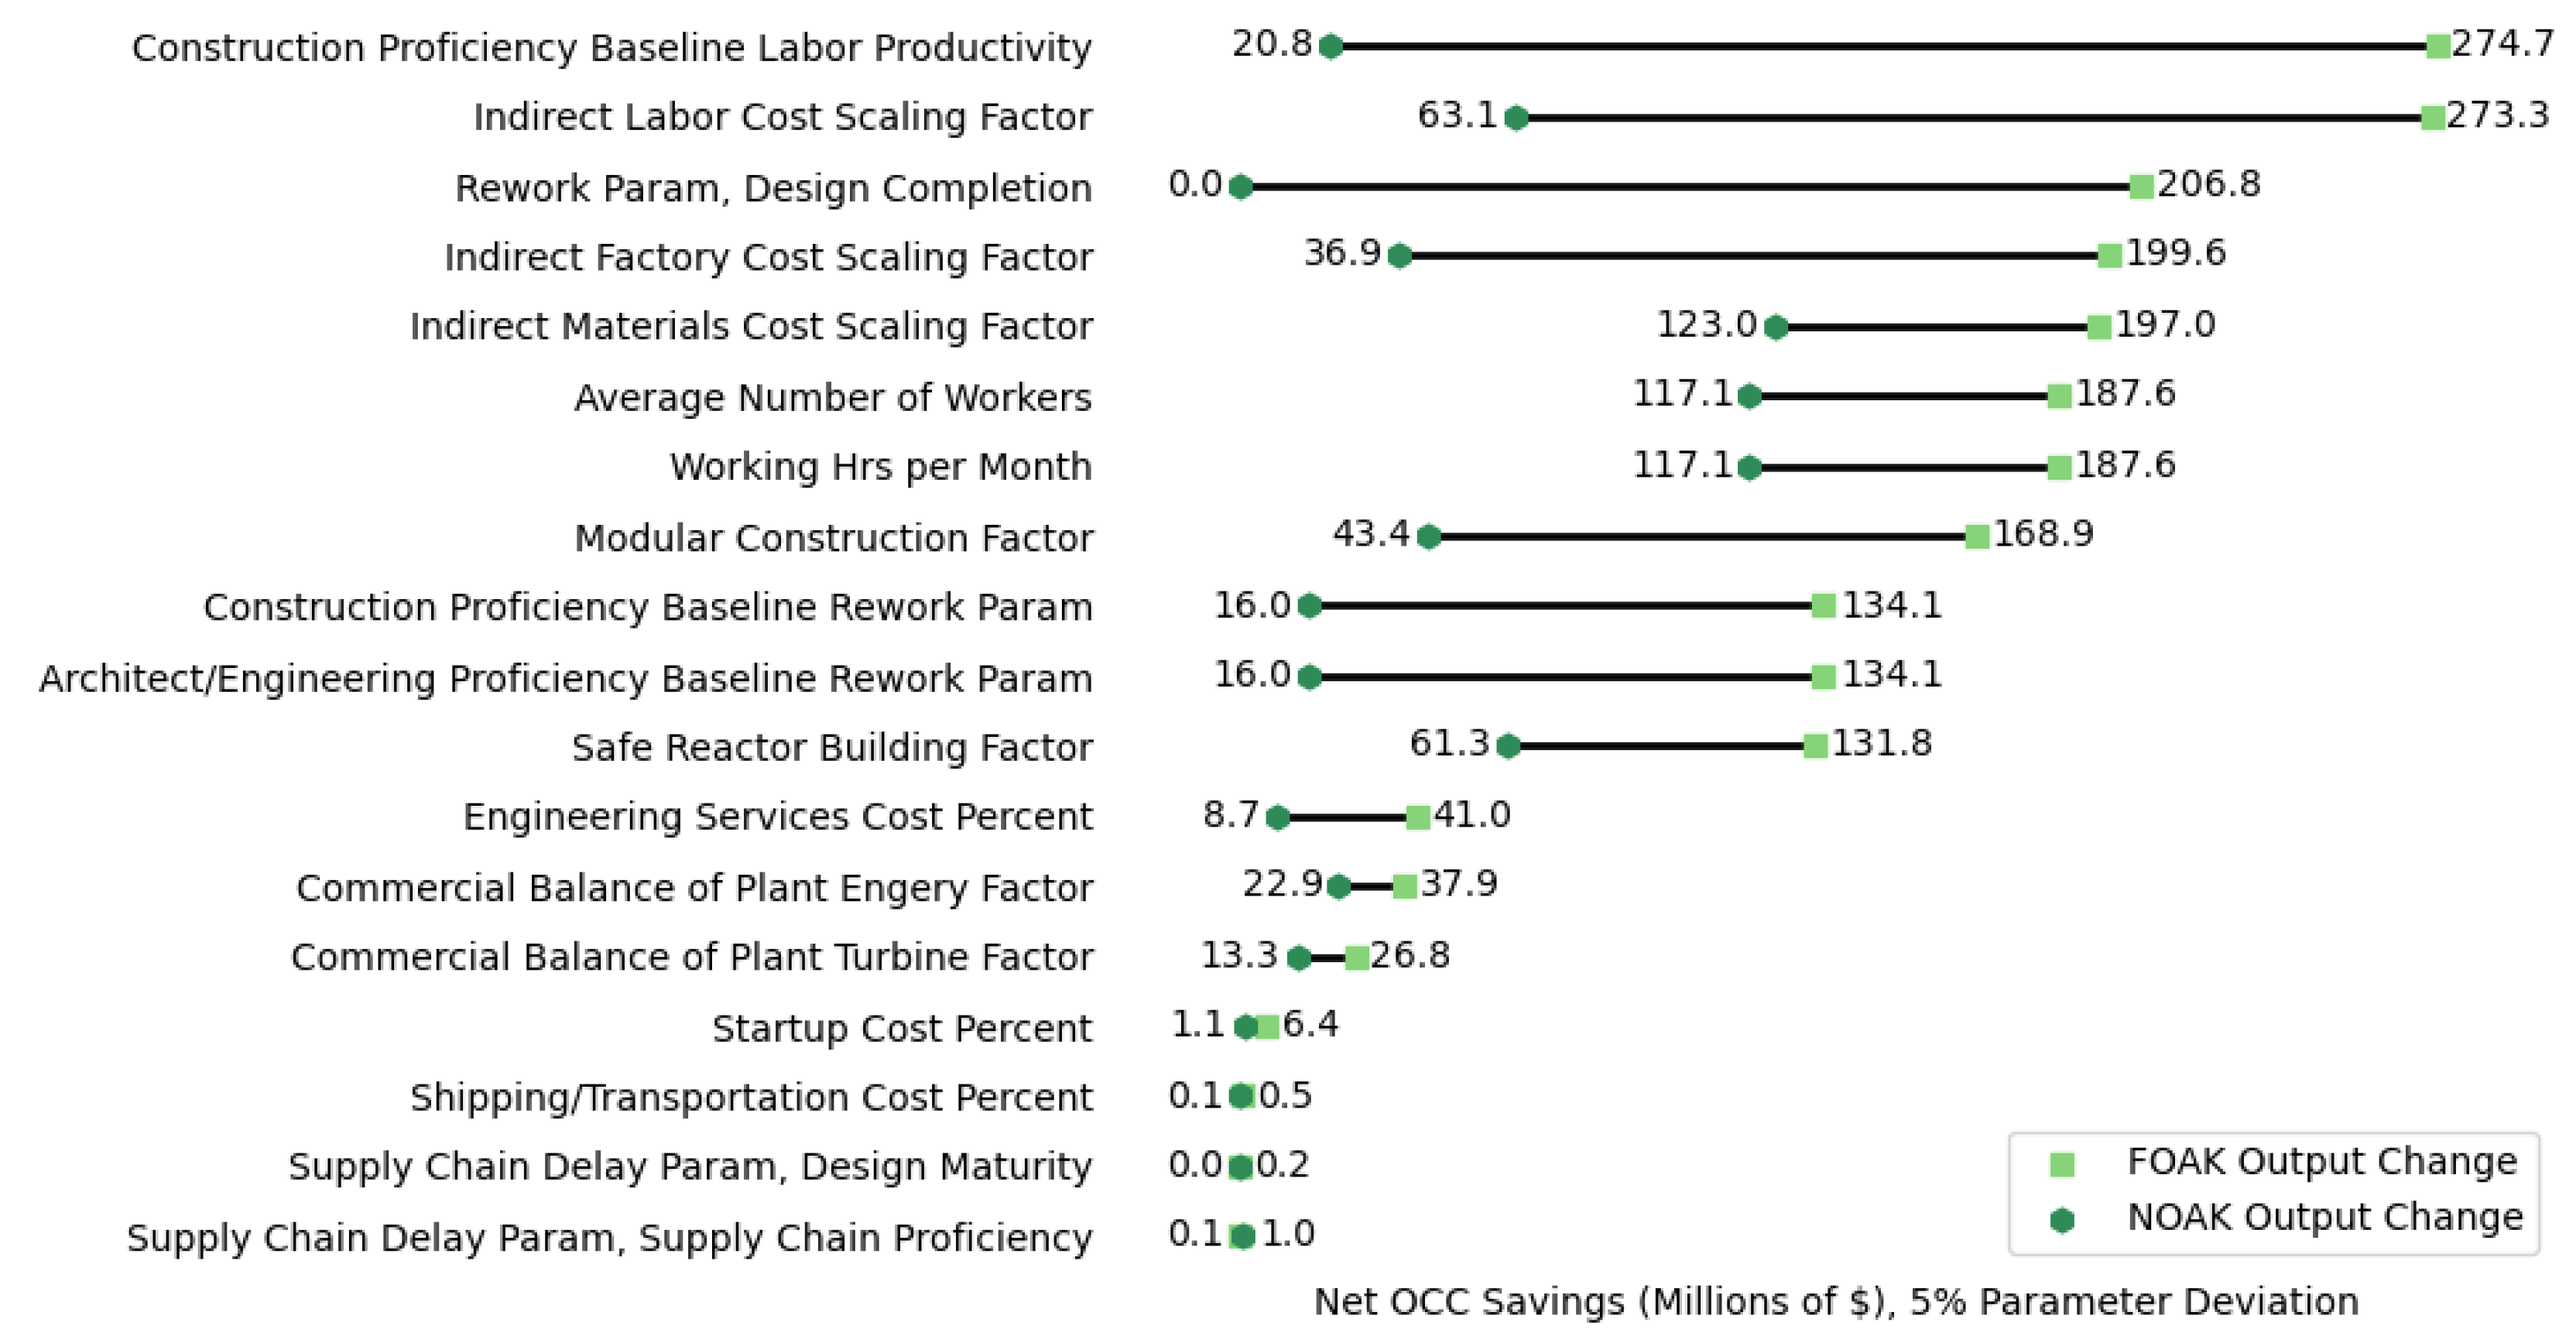
Figure 6 shows the changes in FOAK and NOAK CD from 5% individual parameter perturbations in the 18 input variables for a 2,234 MWe dual reactor plant design. One interesting observation is that many parameters do not affect CD (compared to Net OCC, for which nearly all parameters have some impact). This difference in the number of impactful variables may explain why the relative uncertainty in CD is lower than it is for Net OCC because there are fewer sources of uncertainty.
The most impactful parameters for FOAK CD changes are related to Modular Civil Construction and Supply Chain Delays. This makes sense given that the Modular Civil Construction Factor and Supply Chain Delay Parameters have a direct impact on CD with the Modular Civil Construction Factor directly reducing the CD by a specified factor and Supply Chain Delay being a duration term directly included in the CD formula.
For NOAK CD, only the Modular Civil Construction Factor appears to have any impact. This is because the other variables with significant impacts on FOAK CD are all linear parameters (Supply Chain Delay, Labor Productivity, Rework), and their uncertainty decreases significantly when input level proficiencies are nearly maximized for the NOAK plants (see 2.1.2. for more details). The results suggest that making effective changes to Modular Civil Construction is one of the more meaningful ways to impact NOAK CD.
Figure 7 shows the changes in FOAK and NOAK LCOE from 5% individual parameter perturbations in the 18 input variables for a 2,234 MWe dual reactor plant design. The trends for the most impactful parameters for FOAK and NOAK LCOE are nearly identical to those of the most impactful parameters for FOAK and NOAK Net OCC. They even have the same relative magnitudes in change from parameter perturbations, though slight differences do exist for the less impactful parameters. This matches expectations because Net OCC is the largest driver of LCOE, and as such, the results for both output variables should look very similar.
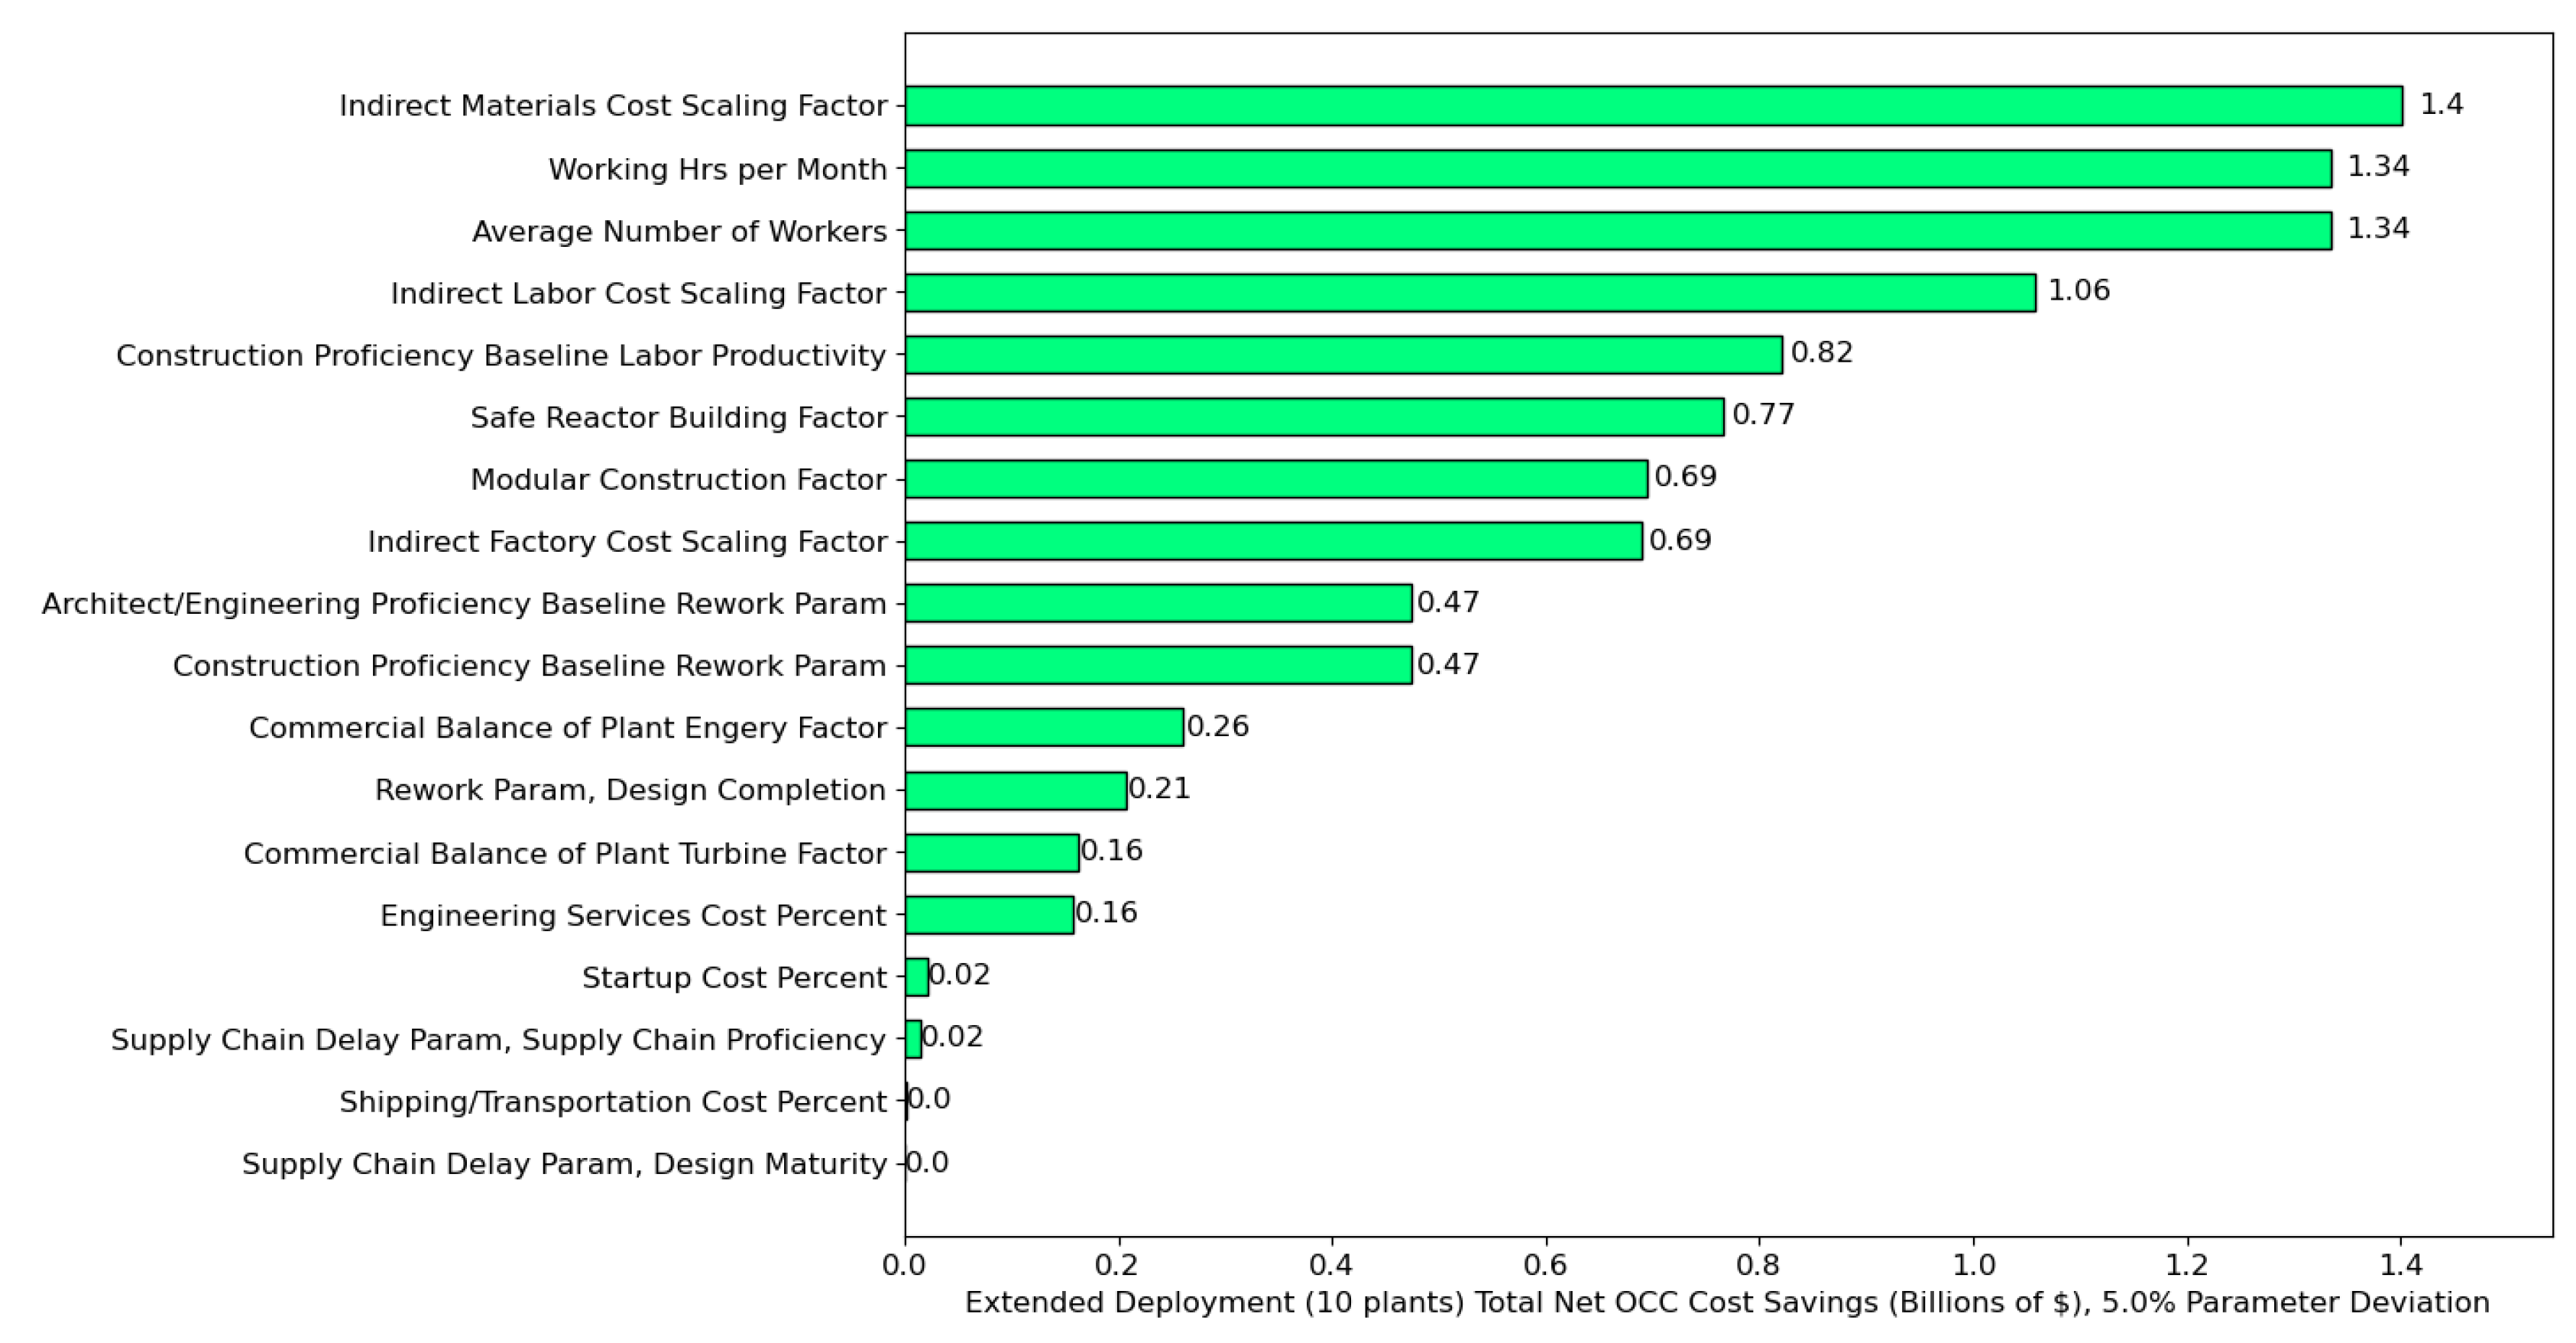
Because tracking the values of output variables over a plant order book is an important capability of the tool, the total summed cost and time savings from parameter perturbations over a ten-plant extended deployment were estimated for Net OCC, CD, and LCOE. The potential cost savings for a ten-plant order book are in billions of dollars, and the most impactful variables overall are related to working statistics and indirect cost scaling factors. Keep in mind that these large savings occur from a singular 5% perturbation from one parameter. The Labor Productivity parameter still has a large impact on potential cost savings, but its perturbation impact shrinks significantly for the building of subsequent plants due to being a linear parameter (see subsection 2.1.2. for more details).
Figure 8.
Total potential cost savings (in billions of dollars) for Net OCC from parameter perturbations of 5% for a ten-plant order book of a 2,234 MWe reactor design.
Figure 8.
Total potential cost savings (in billions of dollars) for Net OCC from parameter perturbations of 5% for a ten-plant order book of a 2,234 MWe reactor design.
The Modular Civil Construction factor is the only parameter that significantly reduces CD, likely because the other parameters with notable impacts are linear, and their effects decrease dramatically after the FOAK deployment (see subsection 2.1.2 for more details).
Figure 9.
Total potential time savings (in months) for CD from parameter perturbations of 5% for a ten-plant order book of a 2,234 MWe reactor design.
Figure 9.
Total potential time savings (in months) for CD from parameter perturbations of 5% for a ten-plant order book of a 2,234 MWe reactor design.
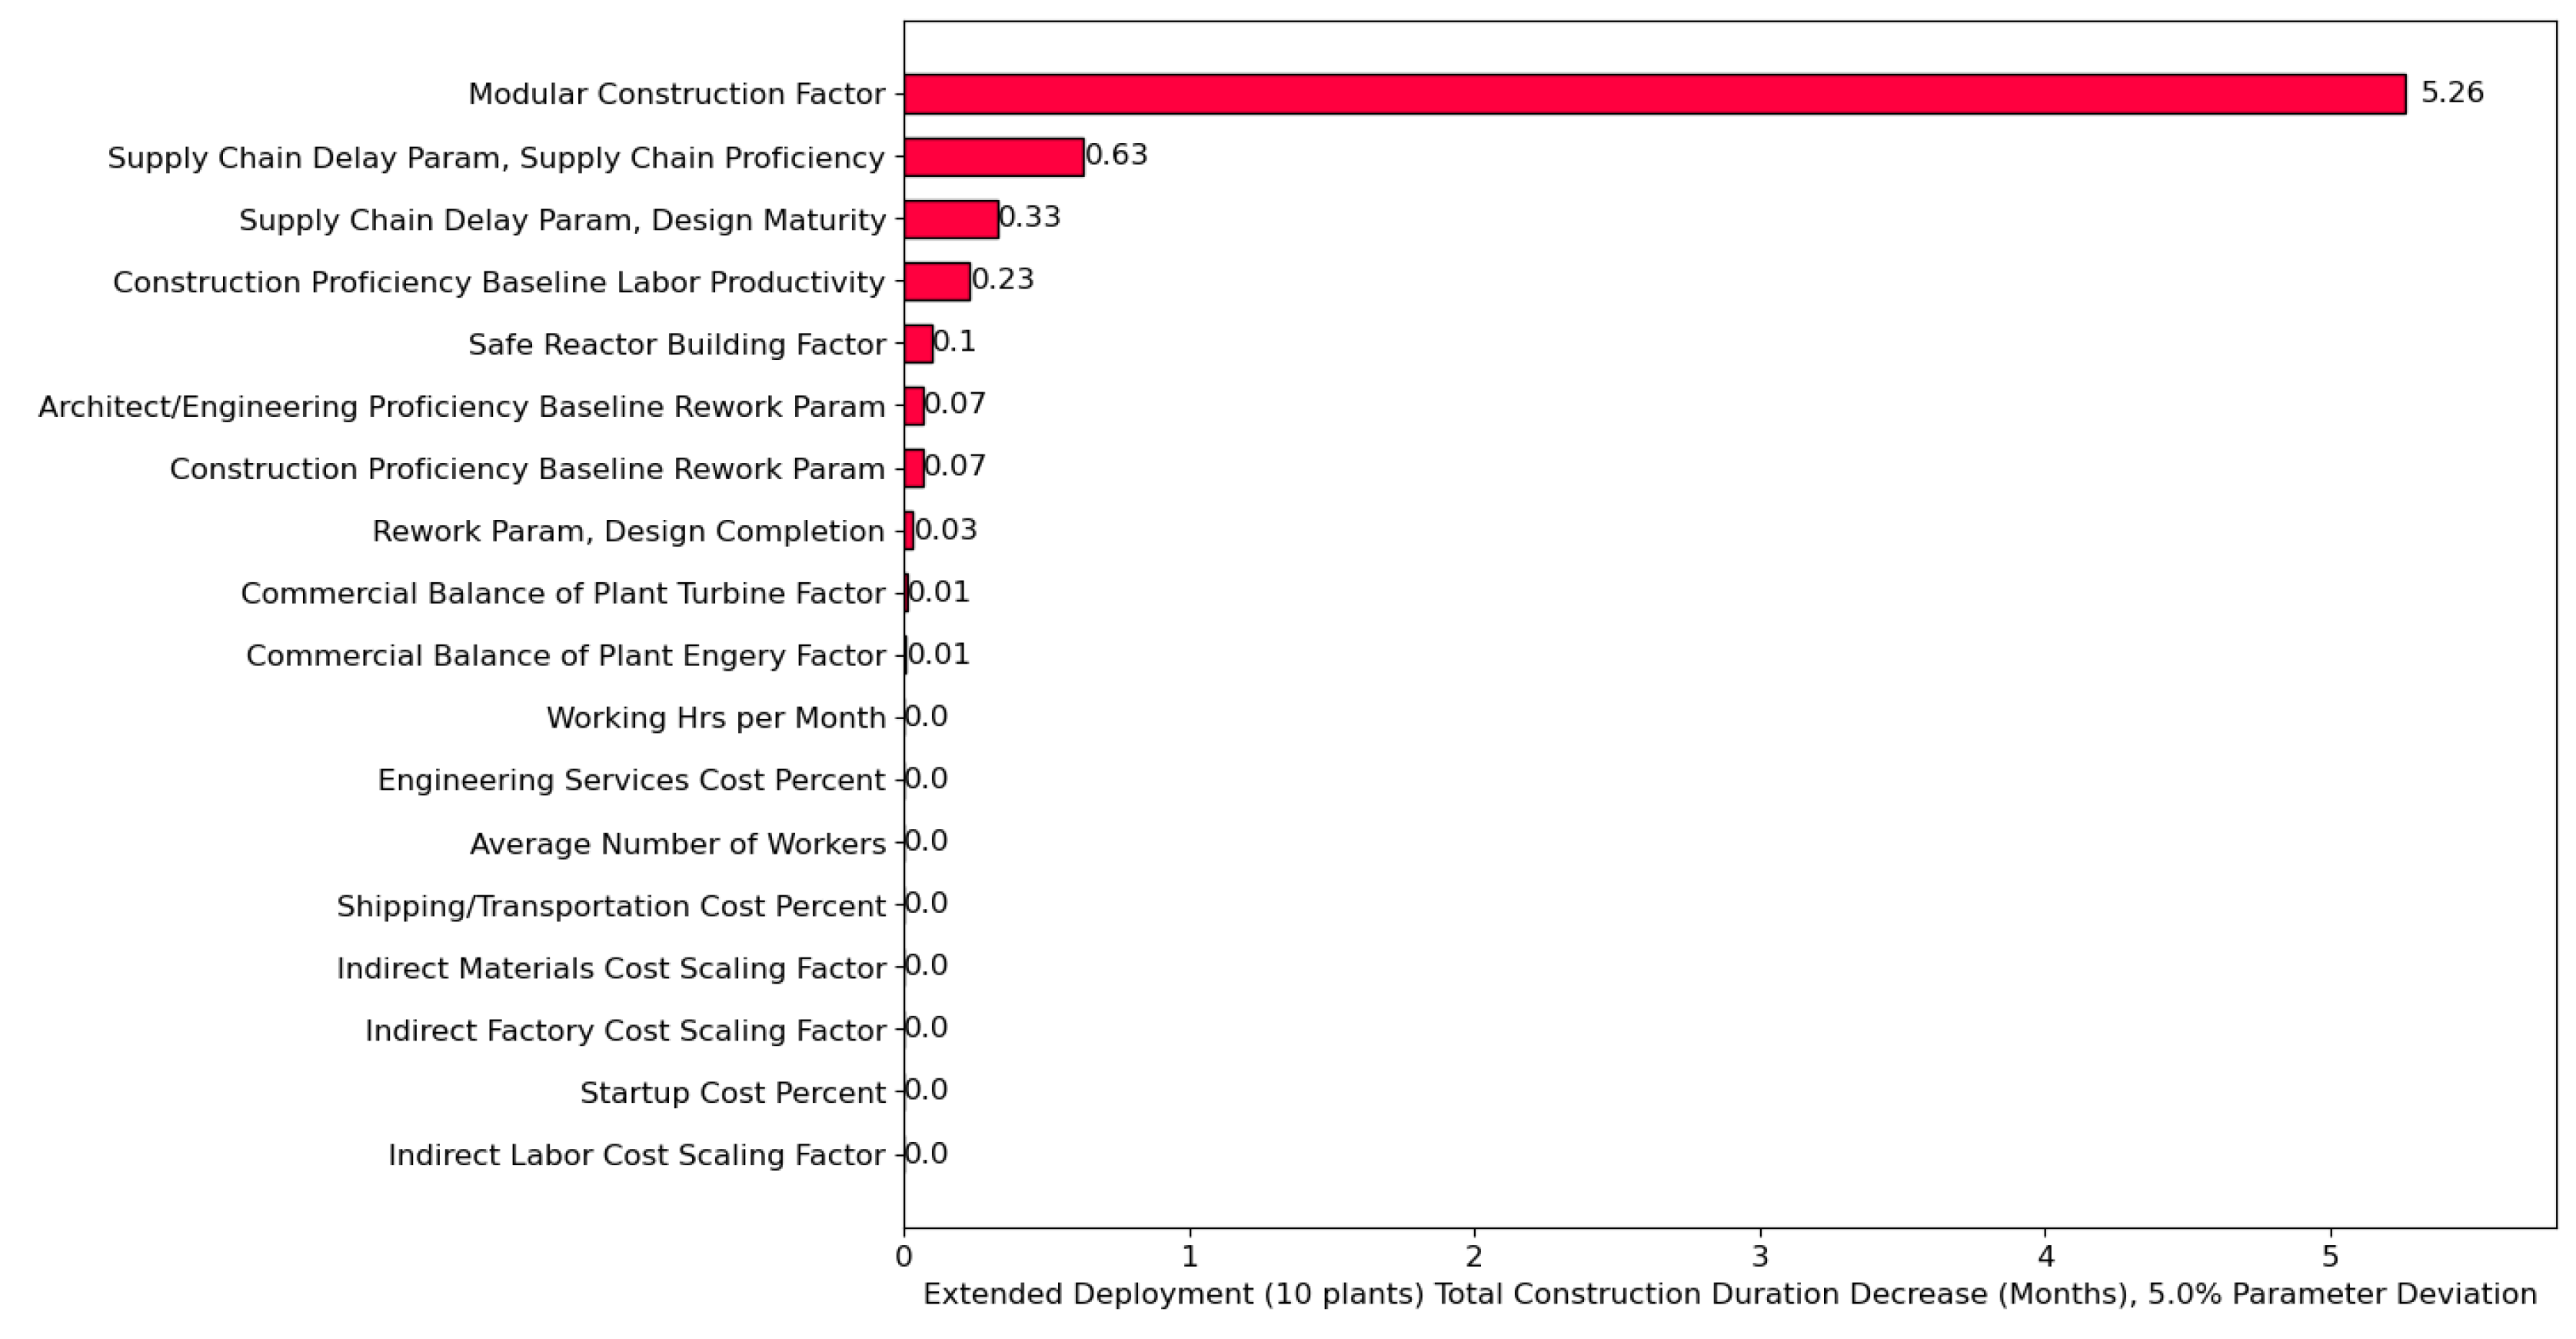
Figure 10 shows the total summed savings in LCOE from 5% parameter perturbations for a ten-plant extended deployment of a 2,234 MWe dual reactor plant design. Once again, the trends for LCOE are similar to the trends seen in Figure 8 for Net OCC, which is expected because Net OCC is the largest driver for LCOE.
4. Discussion
The results obtained from the uncertainty quantification provide valuable insights into how variation in model parameters translate to uncertainty in the nuclear project costs and construction duration to provide a more holistic estimation of these important model outputs. Additionally, the results provide data on how impactful the reactor design and construction attributes represented by the model parameters are in estimating project costs and construction duration. Even small differences and perturbations in model parameters have the potential to change project costs by hundreds of millions of dollars for a single plant and billions of dollars for an order book of plants as shown in Figure 8.
The results can also be used to verify that the model is functioning correctly by identifying if trends in parameter uncertainty and perturbations match intuition on how the parameters impact model outputs. For example, earlier iterations of the uncertainty quantification showed that the Rework from Design Completion was not as impactful in modifying project cost variables as it should have been. This discovery led to a closer examination of how Design Completion was used in the model which allowed for improved model accuracy and development.
Future work will involve further analysis of other model parameters and general sensitivity analyses. Further examination of the omitted parameters listed in section 3.1 could allow for them to be included in future analyses along with more possible parameters that weren’t identified in this study. Also, sensitivity analyses could be performed with specific perturbation percentages from a literature review of past nuclear studies. This could give a better understanding of how impactful each parameter value is in affecting nuclear construction costs. Lastly, the uncertainty results from this study and the Nuclear Cost Reduction tool could be used to estimate costs of possible cost ranges for recent and upcoming reactor design projects to validate if the cost and uncertainty estimates give accurate values.
5. Conclusion
This work showed that applying uncertainty and perturbations to model parameters can improve the functionality of the Nuclear Cost Reduction tool and provide valuable insight into the tool itself and the quantification of possible cost savings related to improving reactor design and construction attributes. The Monte Carlo analysis of the model parameters we performed provided information on the distributions of the output variables of Net OCC, CD, and LCOE. These variables can be applied as uncertainty bounds for the output variables, making future applications of the tool more accurate. This analysis also showed how the uncertainty in the output variables decreases with diminishing returns as subsequent plants are built, which matches the trend of the output variable nominal values from the FOAK to NOAK plants indicated by the tool [22]. Researchers can use the distributions and trends from this study to estimate a realistic range of possible cost values (and the likelihood of each possible cost value), and to estimate how the possible range of cost values will change as more plants of the same design are built, thus improving future cost estimations for nuclear projects.
The local sensitivity analysis of the model parameters we performed showed the relative importance of different model parameters and quantified the impacts of model parameter perturbations. This information can be used for cost-benefit analyses to determine, for example, if the cost of improving a particular construction parameter will lead to net cost savings. Small perturbations of important model parameters such as Baseline Labor Productivity, Indirect Cost Scale Factors, Baseline Rework Factors, and Working statistics can potentially lead to hundreds of millions of dollars in savings for a single large plant and billions of dollars for an entire order book of large plants. The results of this work also provide insight into which reactor design and construction attributes, connected to the various model parameters, should be a focus for developers based on their impact on the economic performance of reactor deployment.
Author Contributions
Conceptualization, R.S., L.L., C.B., B.H., J.Z., and A. A-J.; methodology, R.M., and R.S.; formal analysis, R.M.; investigation, R.M., R.S., L.L.; resources, R.S. and A. A-J.; data curation, R.M.; writing—original draft preparation, R.M.; writing—review and editing, R.M., R.S., L.L., J.Z., B.H., and C.B.; visualization, R.M.; supervision, R.S., L.L., and A.A-J..; project administration, R.S. and A.A-J.; funding acquisition, R.S. and A.A-J. All authors have read and agreed to the published version of the manuscript.
Funding
Funding was provided by the U.S. Department of Energy (DOE) through the Systems Analysis & Integration (SA&I) Campaign and a University Nuclear Leadership Program (UNLP) Graduate Fellowship by the Nuclear Energy University Program (NEUP).
Data Availability Statement
The authors do not have permission to share data.
Acknowledgments
This report was authored at Idaho National Laboratory (INL) by Battelle Energy Alliance, LLC, with the U.S. DOE.
Conflicts of Interest
The authors declare no conflicts of interest.
Abbreviations
The following abbreviations are used in this manuscript:
| Net OCC | Net Overnight Capital Cost |
| CD | Construction Duration |
| LCOE | Levelized Cost of Electricity |
| FOAK | first of a kind |
| NOAK | Nth of a kind |
| RB | reactor building |
References
- Buongiorno, J.; Parsons, J.; Dawson, K. “The Future of Nuclear Energy in a Carbon-Constrained World.” MIT Energy Initiative. 2018. Available online: https://energy.mit.edu/research/future-nuclear-energy-carbon-constrained-world/.
- Lovering, J. R.; Yip, A.; Nordhaus, T. Historical Construction Costs of Global Nuclear Power Reactors. Energy Policy 2016, 91, 371–382. [Google Scholar] [CrossRef]
- U.S. DOE. DOE/NE-0092; Technical Reference Book for the Energy Economic Data Base Program EEDBIX. United States Department of Energy, Office of Nuclear Energy, United Engineers and Constructors, Inc, 1988.
- U.S. DOE. DOE/NE-0091; Phase IX Update (1987) Report for the Energy Economic Data Base Program EEDB-IX. United States Department of Energy, Office of Programs Support, 1988.
- U.S. DOE. DOE/NE-0091; Phase IX Update Report for the Energy Economic Data Base Program EEDB-IX. United States Department of Energy, United Engineers and Constructors, Inc., 1988. [CrossRef]
- U.S. DOE. Nuclear Energy Cost Data Base: A Reference Data Base for Nuclear and Coal-Fired Powerplant Power Generation Cost Analysis. DOE/NE-95. United States Department of Energy, Office of Program Support, 1988. [Google Scholar]
- U.S. DOE. “Nuclear Energy Cost Data Base: A Reference Data Base for Nuclear and Coal-Fired Powerplant Power Generation Cost Analysis.” DOE/NE-0095, United States Department of Energy. 1988. Available online: https://inis.iaea.org/search/search.aspx?orig_q=RN:20013280.
- Stewart, W. R.; Shirvan, K. Construction Schedule and Cost Risk for Large and Small Light Water Reactors. Nuclear Engineering and Design 2023, 407, 112305. [Google Scholar] [CrossRef]
- Ganda, F.; Maronati, G.; Kim, T. K.; Taiwo, T. A.; Wigeland, R. Report on Cost Estimation Algorithm for Advanced Nuclear Reactor Concepts. Argonne National Laboratory, 2017. Available online: https://sai.inl.gov/report/cost-estimation-algorithm-for-advanced-nuclear-reactor-concepts/.
- Ganda, F.; Taiwo, T. A.; Kim, T. K. “Report on the Update of Fuel Cycle Cost Algorithms.” NTRD-FCO-2018-000439, Argonne National Laboratory. 2018. Available online: https://publications.anl.gov/anlpubs/2018/07/144923.pdf.
- Ganda, F.; Hoffman, E.; Taiwo, T. A.; Kim, T. K.; Hansen, J. “Report on the ACCERT Cost Algorithms Tool.” ANL/NSE-19/10, Argonne National Laboratory. 2019. Available online: https://publications.anl.gov/anlpubs/2019/06/152862.pdf.
- Zhou, J.; Hoffman, E.; Stauff, N. E. Automating Algorithm Management and Techno-Economic Analysis of Nuclear Power Plants: Introduction to the ACCERT Software. Transactions of the American Nuclear Society 2023, 128, 600 –603. [Google Scholar]
- Bolisetti, C.; Hanna, B.; Zhou, J.; Abou-Jaoude, A.; Stauff, N. E.; Hoffman, E. Demonstration of ACCERT Software for Nuclear Power Plant Techno-Economics. Transactions of the American Nuclear Society 2023, 128, 604 –607. [Google Scholar]
- Stewart, R. W.; Gregory, J.; Shirvan, K. Impact of Modularization and Site Staffing on Construction Schedule of Small and Large Water Reactors. Nuclear Engineering and Design 2022, 397, 111922. [Google Scholar] [CrossRef]
- Stewart, W. R.; Shirvan, K. “Capital Cost Evaluation of Advanced Water-Cooled Reactor Designs with Consideration of Uncertainty and Risk.” MIT-ANP-TR-194, Center for Advanced Nuclear Energy Systems (CANES), Massachusetts Institute of Technology; 2022; Available online: https://47278698.fs1.hubspotusercontent-na1.net/hubfs/47278698/194-ANP-TR%20MIT%20CANES.pdf.
- Stewart, W. R.; Shirvan, K. Capital Cost Estimation for Advanced Nuclear Power. Renewable and Sustainable Energy Reviews 2022, 155, 111880. [Google Scholar] [CrossRef]
- Wright, T. P. Factors Affecting the Cost of Airplanes. Journal of the Aeronautical Sciences 1936, 122–128. [Google Scholar] [CrossRef]
- Mislick, G. K.; Nussbaum, D. A. Cost Estimation: Methods and Tools; Wiley: New York, 2015. [Google Scholar]
- Atkins. SMR Techno-Economic Assessment - Project 1 – SMRs: Comprehensive Analysis and Assessment, SMR TEA Report. In Atkins Limited and Ernst & Young LLP; 2016; Volume 1. Available online: https://assets.publishing.service.gov.uk/media/5a81c445ed915d74e33fff21/TEA_Project_1_Vol_1_-_Comprehensive_Analysis_and_Assessment_SMRs.pdf.
- Stewart, W. R.; Velez, E.; Wiser, R.; Shirvan, K. Pathways to Cost-Effective Advanced Nuclear Technology. Energy Proceedings 2020, 8. [Google Scholar] [CrossRef]
- Abou-Jaoude, A.; Arafat, Y.; Foss, A.; Dixon, B. INL/EXT-21-63067; An Economics-by-Design Approach Applied to a Heat Pipe Microreactor Concept. Idaho National Laboratory, 2021. [CrossRef]
- Bolisetti, C.; Abou-Jaoude, A.; Hanna, B.; Larsen, L. M.; Zhou, J.; Shirvan, K. INL/RPT-24-7767; Quantifying Capital Cost Reduction Pathways for Advanced Nuclear Reactors. Idaho National Laboratory, 2024. [CrossRef]
- U.S. DOE. “Pathways to Commercial Liftoff: Advanced Nuclear.” United States Department of Energy. 2023. Available online: https://gain.inl.gov/content/uploads/4/2024/11/DOE-Advanced-Nuclear-Liftoff-Report.pdf.
- OECD. “Unlocking Reductions in the Construction Costs of Nuclear: A Practical Guide for Stakeholders.” Organization for Economic Co-operation and Development, Nuclear Energy Agency. 2020. Available online: https://www.oecd.org/content/dam/oecd/en/publications/reports/2020/08/unlocking-reductions-in-the-construction-costs-of-nuclear_2ca6777b/33ba86e1-en.pdf.
- Marciulescu, C.; Reinder, J.; Varrin, R.; Marcks, C.; Ingersoll, E.; Foss, A. Advanced Nuclear Technology: Economic-Based Research and Development Roadmap for Nuclear Power Plant Construction. Electric Power Research Institute (EPRI). 2019. Available online: https://www.epri.com/research/products/000000003002015935.
- Eash-Gates, P.; Klemun, M. M.; Kavlak, G.; McNerney, J.; Buongiorno, J.; Trancik, J. E. Sources of Cost Overrun in Nuclear Power Plant Construction Call for a New Approach to Engineering Design. Joule 2020, 4, 2348–2373. [Google Scholar] [CrossRef]
- U.S. DOE Energy Information Administration. Analysis of nuclear power plant construction costs. 1985. [Google Scholar] [CrossRef]
- Stewart, W. R.; Velez-Lopez, E.; Wiser, R.; Shirvan, K. Economic Solution for Low Carbon Process Heat: A Horizontal, Compact High Temperature Gas Reactor. Applied Energy 2021, 304, 117650. [Google Scholar] [CrossRef]
- Ganda, F.; Dixon, B.; Hoffman, E.; Kim, T. K.; Taiwo, T.; Wigeland, R. Economic Analysis of Complex Nuclear Fuel Cycles with NE-COST. Nuclear Technology 2016, 193, 219–233. [Google Scholar] [CrossRef]
- Prosser, J. H.; Graham, M.; Acevedo, Y.; Jensen, M.; James, B. D.; Abou-Jaoude, A. INL/RPT-23-74316; First-Principles Cost Estimation of a Sodium Fast Reactor Nuclear Plant. Idaho National Laboratory, 2023. [CrossRef]
- Georgia Public Commission. Twenty-fifth Semi-annual Vogtle Construction Monitoring Report. 2021. Available online: https://psc.ga.gov/search/facts-document/?documentId=186935.
- Delene, J. G.; Hudson, C. R., II. Cost Estimate Guidelines for Advanced Nuclear Power Technologies. In ORNL/TM-10071/R3; Oak Ridge National Laboratory, 1993. [Google Scholar] [CrossRef]
Figure 1.
Non-exhaustive chart for the input levers, model parameter groups, and output variables in the cost reduction framework that are important to uncertainty quantification. Arrows from input levers to model parameters indicate that the model parameter modifies the input lever value, while arrows from model parameters to output variables indicate that those modified values are used in the output variable calculation.
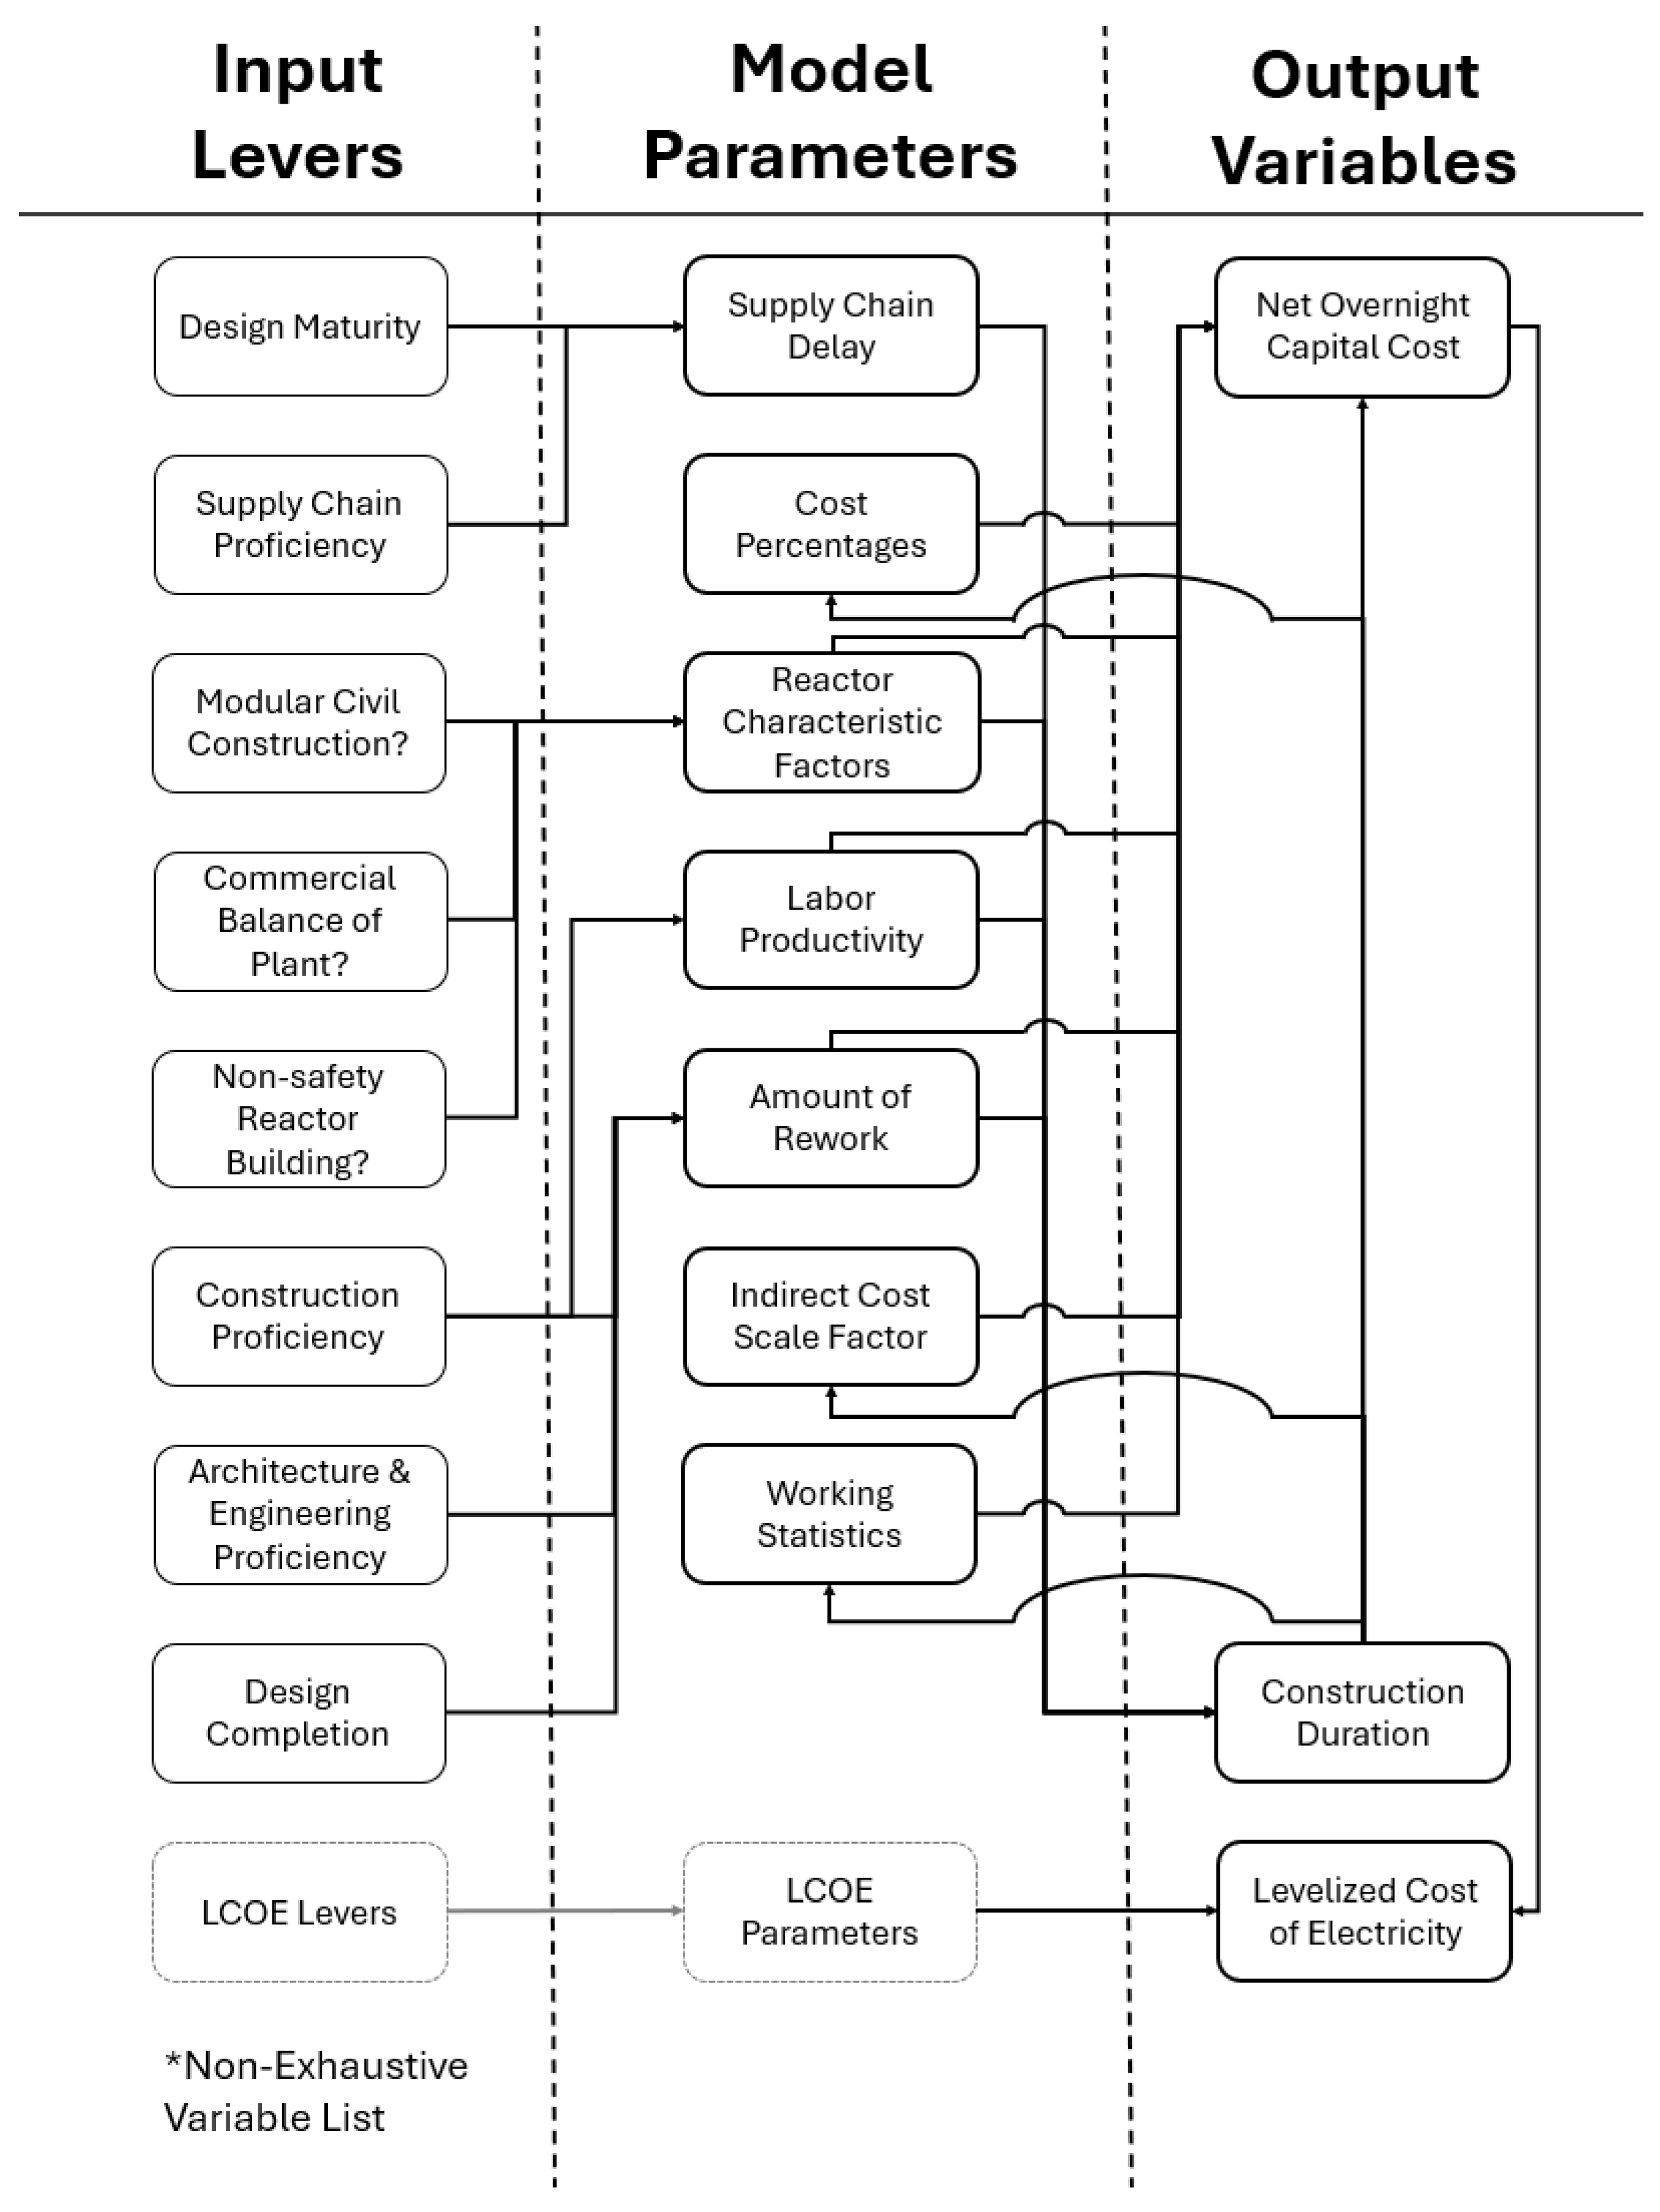
Figure 2.
Histogram distribution (left) and CDF plots (right) for FOAK Net OCC (top), CD (middle), and LCOE (bottom) for 250,000 samples.
Figure 2.
Histogram distribution (left) and CDF plots (right) for FOAK Net OCC (top), CD (middle), and LCOE (bottom) for 250,000 samples.

Figure 3.
Histogram distribution (left) and CDF plots (right) for NOAK Net OCC (top), CD (middle), and LCOE (bottom) for 250,000 samples.
Figure 3.
Histogram distribution (left) and CDF plots (right) for NOAK Net OCC (top), CD (middle), and LCOE (bottom) for 250,000 samples.
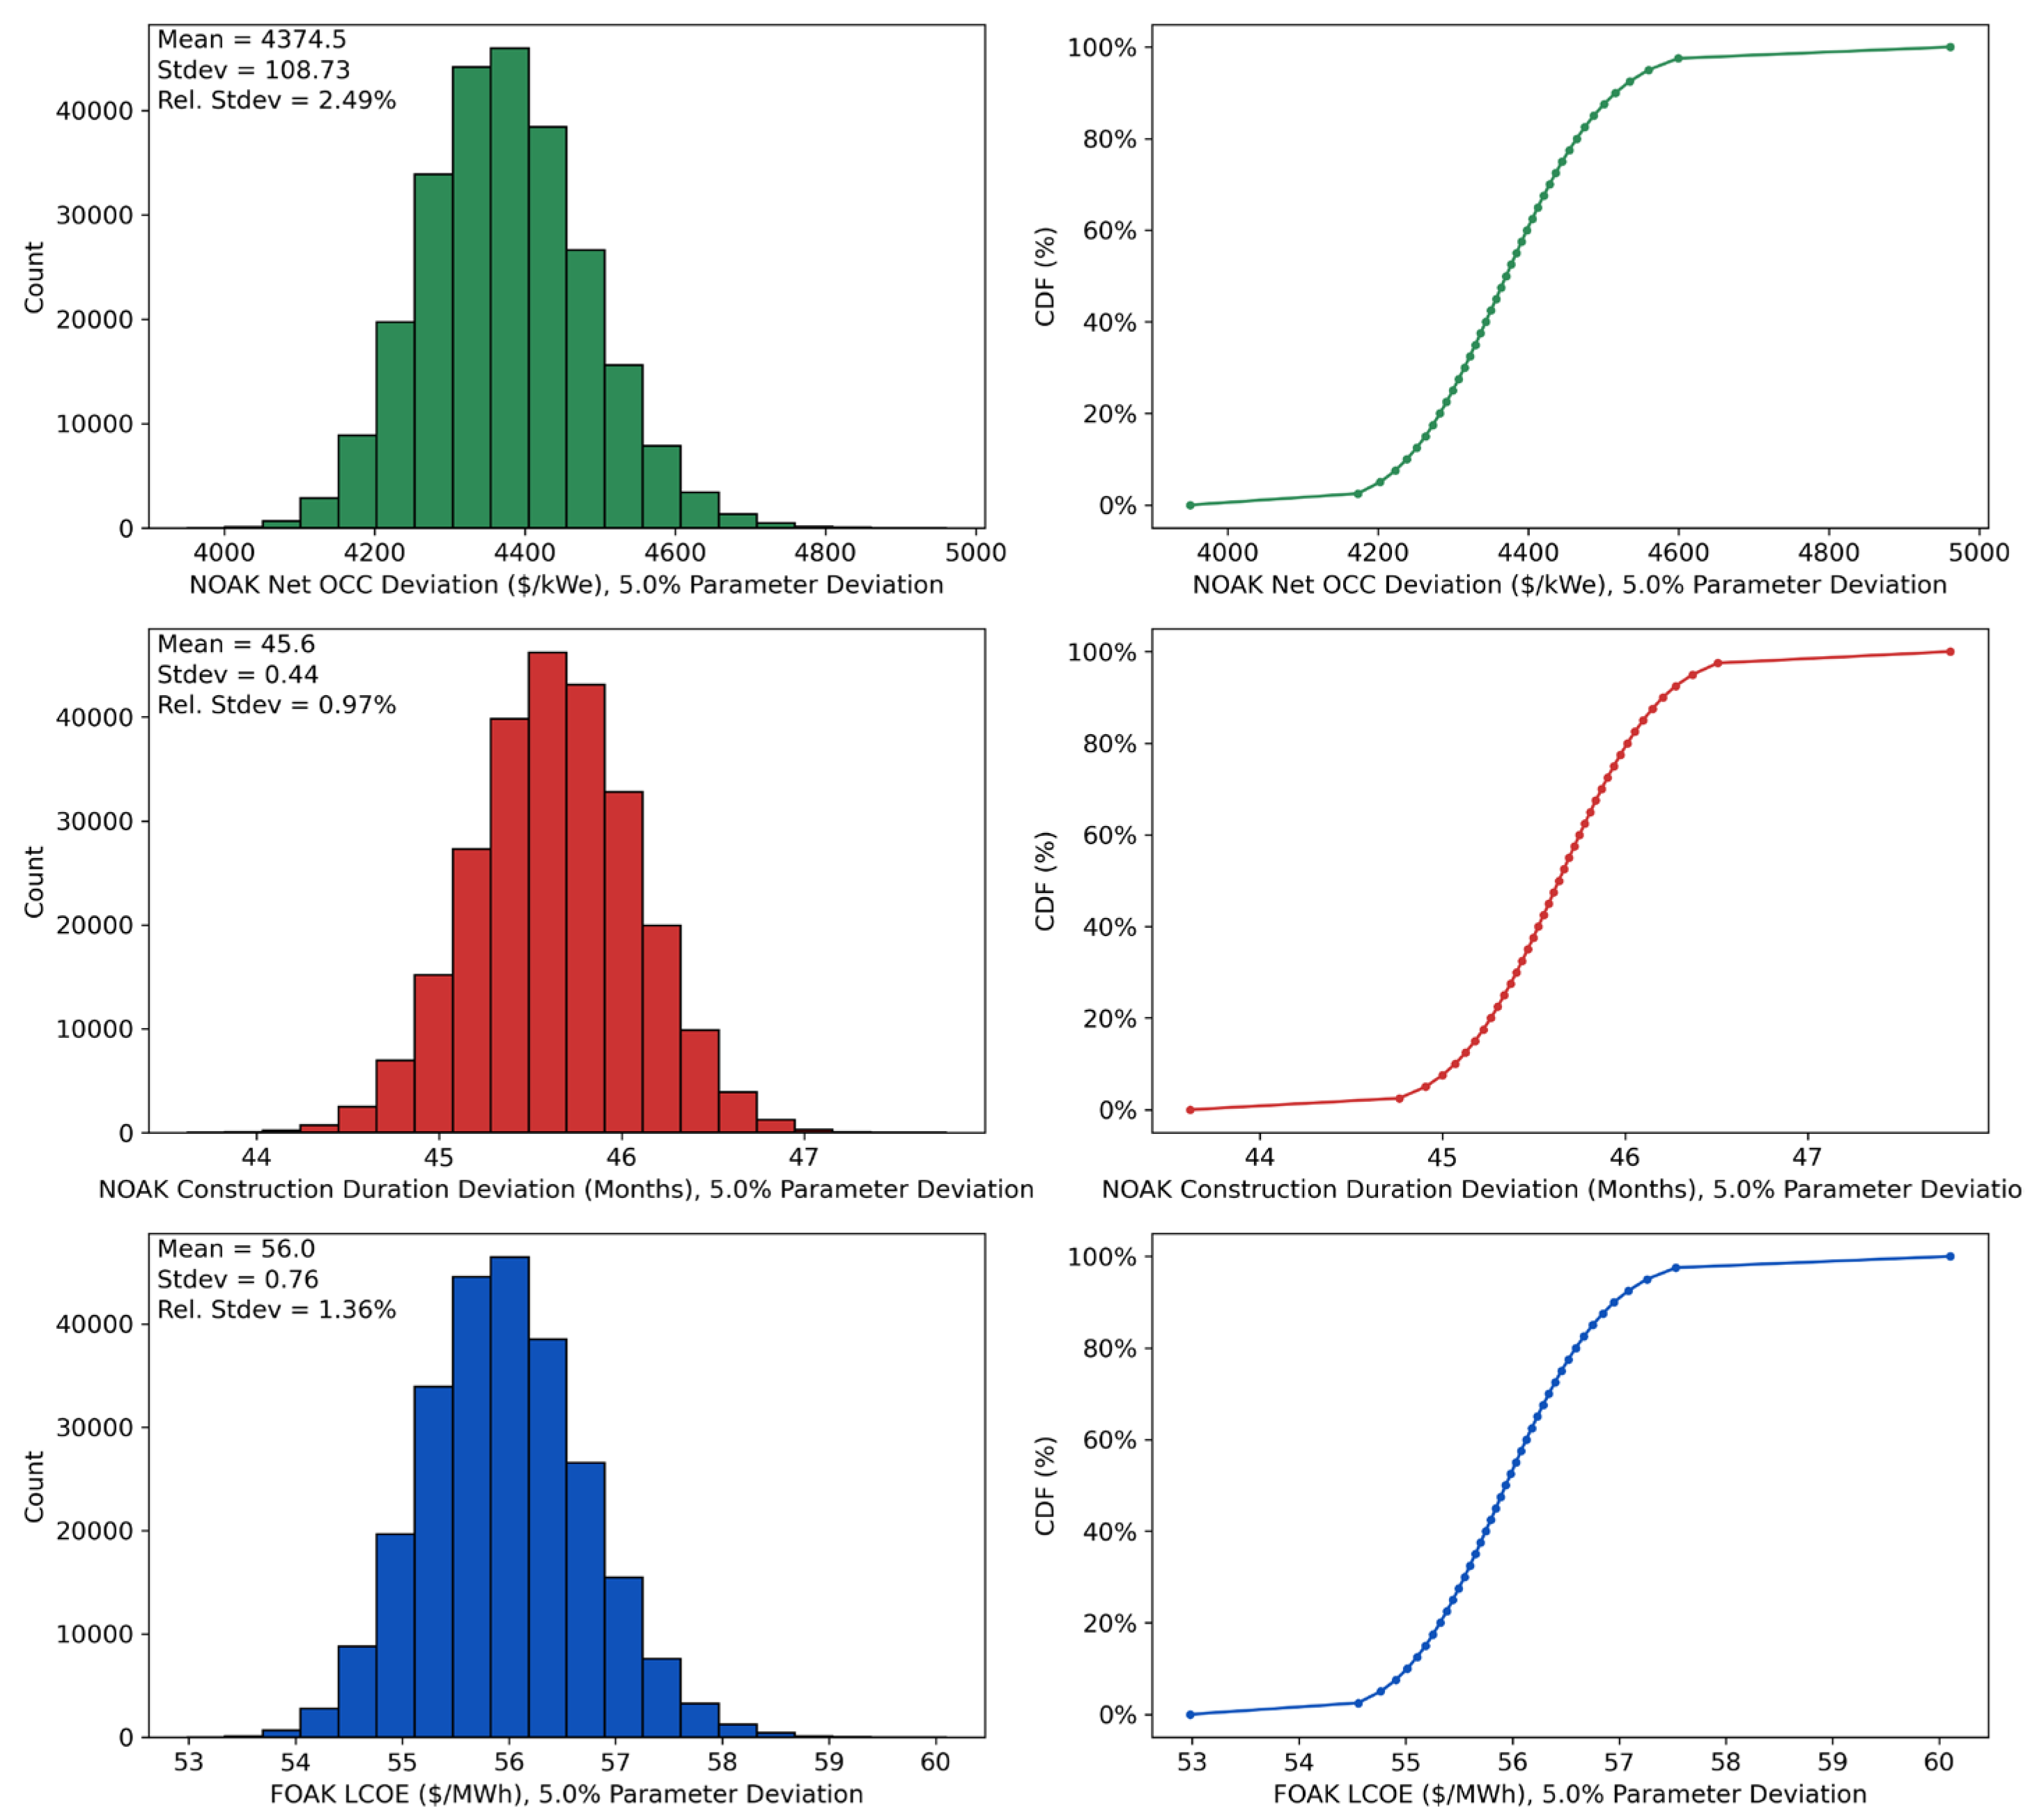
Figure 4.
Trend in absolute uncertainty versus plant number for Net OCC (left), CD (middle), and LCOE (right).
Figure 4.
Trend in absolute uncertainty versus plant number for Net OCC (left), CD (middle), and LCOE (right).

Figure 6.
Potential time savings (in months) comparison for FOAK and NOAK CD from parameter perturbations of 5% for a 2,234 MWe reactor design.
Figure 6.
Potential time savings (in months) comparison for FOAK and NOAK CD from parameter perturbations of 5% for a 2,234 MWe reactor design.
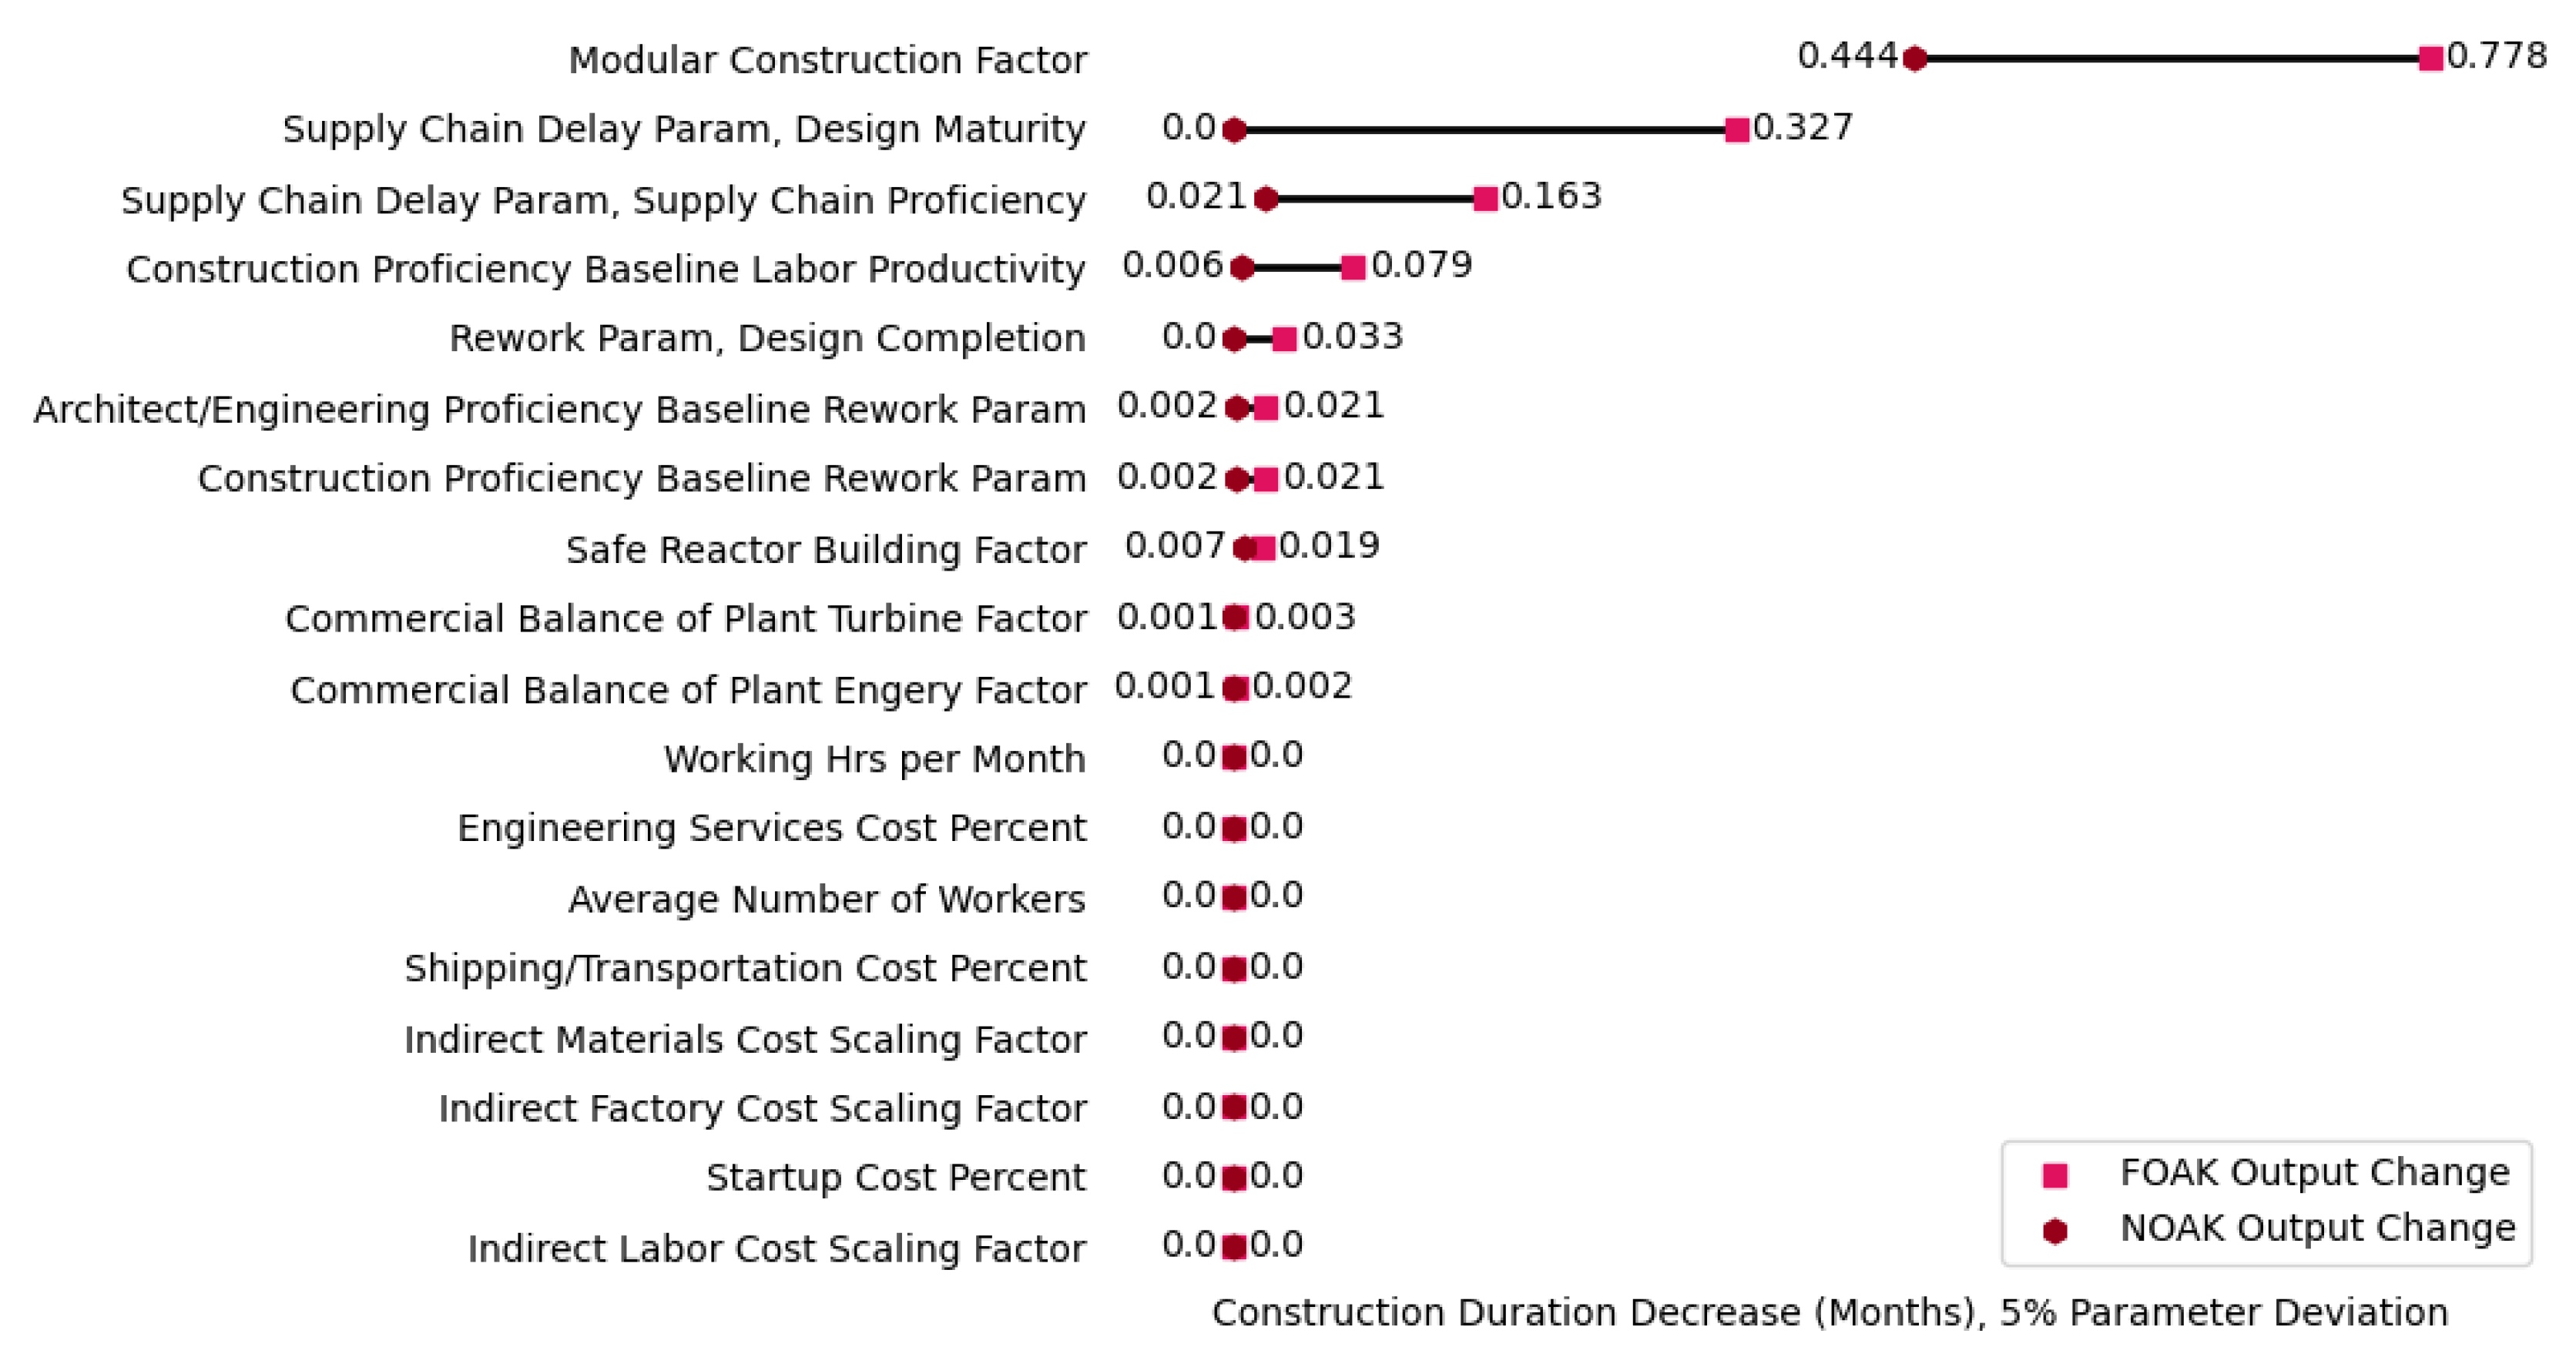
Figure 7.
Potential cost savings (in $/MWh) comparison for FOAK and NOAK LCOE from parameter perturbations of 5% for a 2,234 MWe reactor design.
Figure 7.
Potential cost savings (in $/MWh) comparison for FOAK and NOAK LCOE from parameter perturbations of 5% for a 2,234 MWe reactor design.
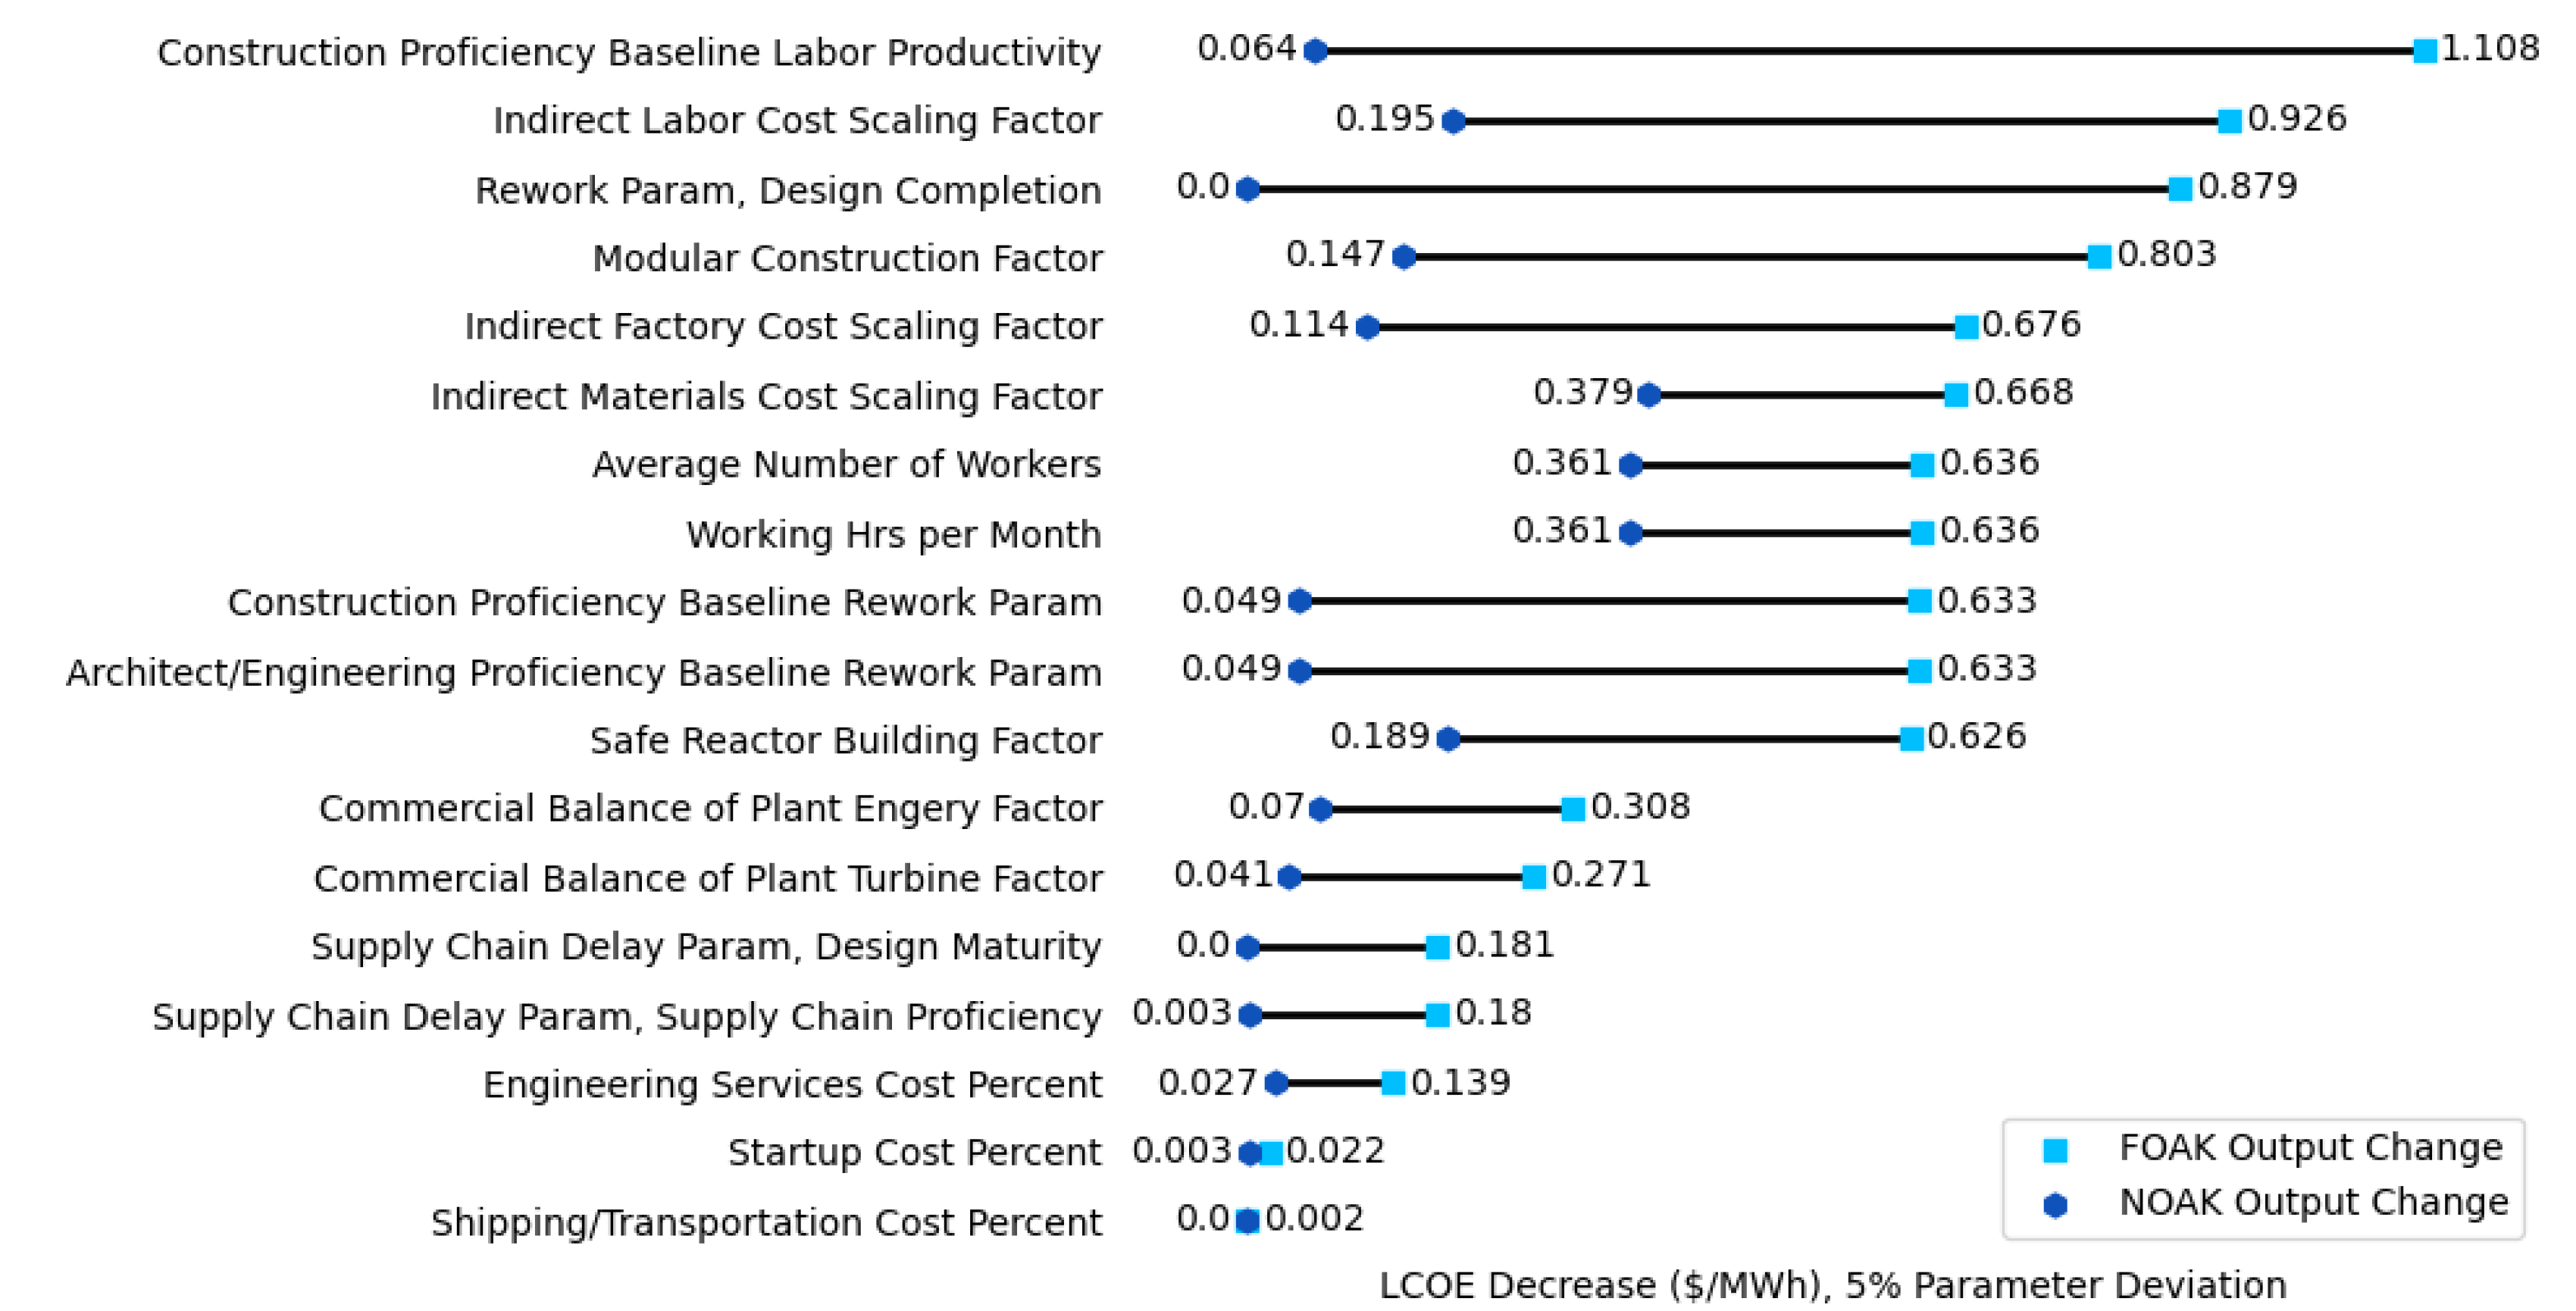
Figure 10.
Total potential cost savings (in $/MWh) for LCOE from parameter perturbations of 5% for a ten-plant order book of a 2,234 MWe reactor design.
Figure 10.
Total potential cost savings (in $/MWh) for LCOE from parameter perturbations of 5% for a ten-plant order book of a 2,234 MWe reactor design.
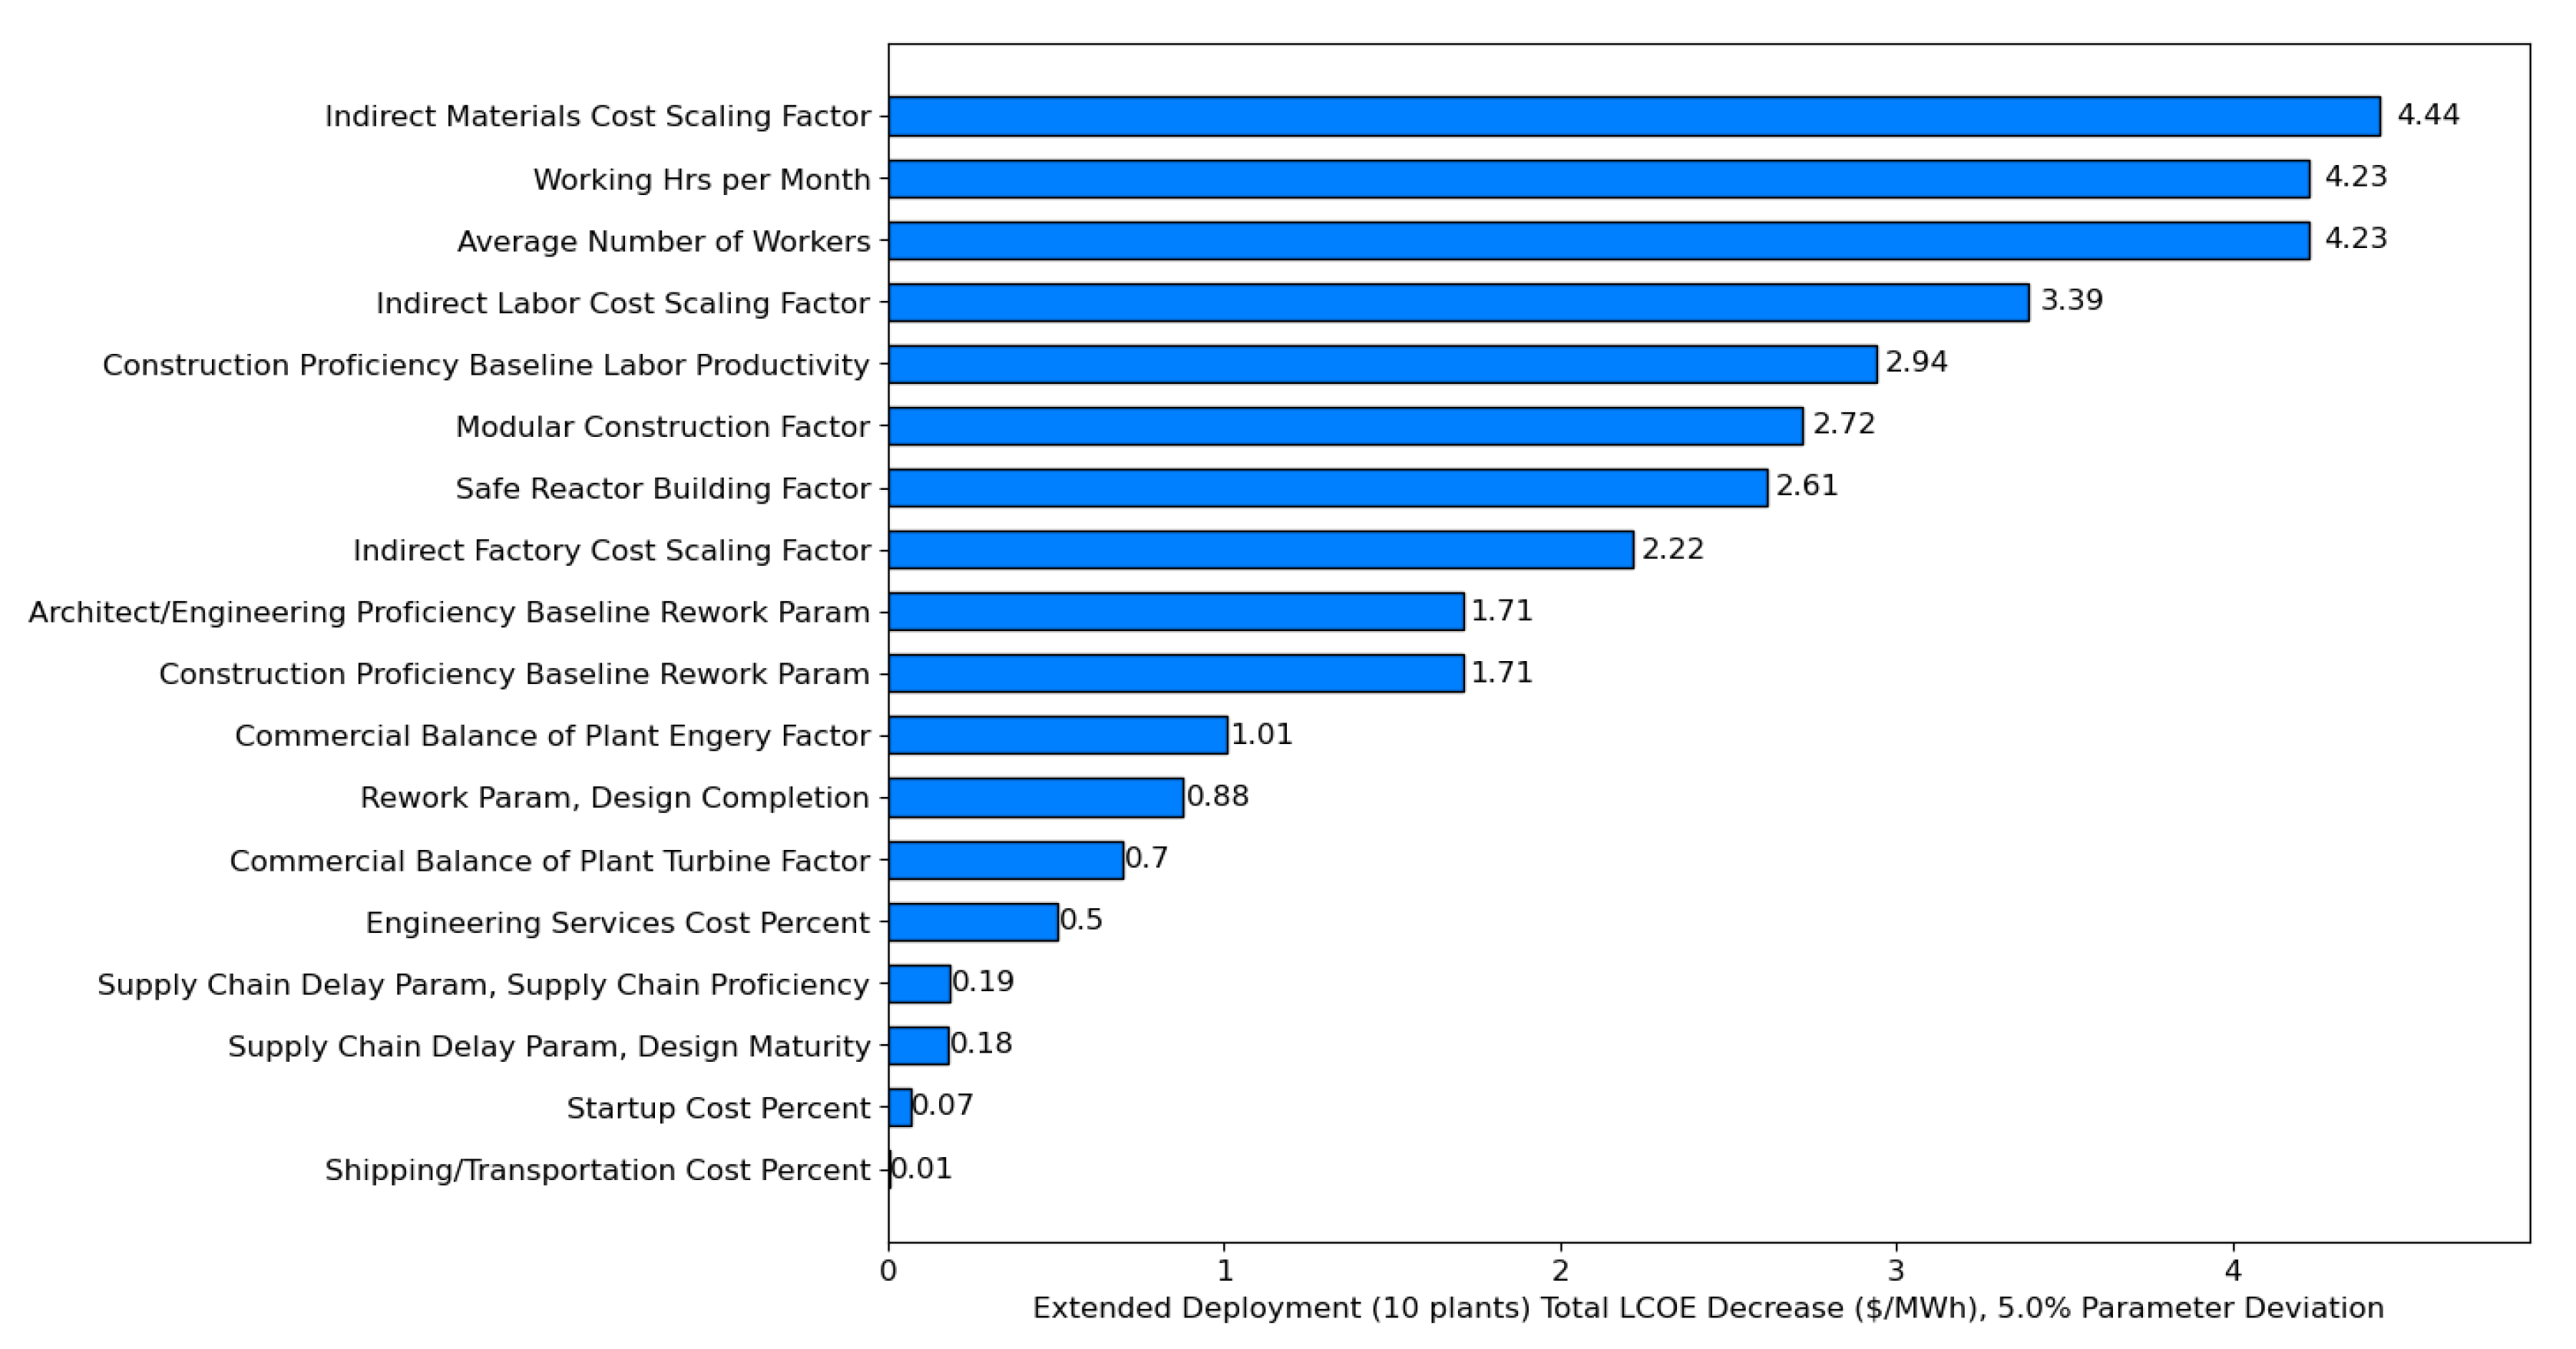

Table 1.
The important input lever values used for all uncertainty analyses.
| Input Lever Label | Input Lever Value |
| Number of Firm Orders (N) | 10 |
| Number of Plant to Reach NOAK | 8 |
| FOAK Design Completion | 70% |
| FOAK Supply Chain Proficiency | 1 |
| FOAK Architecture/Engineering Proficiency | 1 |
| FOAK Construction Proficiency | 1 |
| Cross Site Standardization | 80% |
| Cross Site Transfer Efficiencies | 80% |
| Modular Civil Construction? (All plants) | TRUE |
| Commercial BOP? (All plants) | TRUE |
| Non-Safety-Related RB (All plants) | TRUE |
| Number of plants to achieve best proficiency (All) | 9 |
Disclaimer/Publisher’s Note: The statements, opinions and data contained in all publications are solely those of the individual author(s) and contributor(s) and not of MDPI and/or the editor(s). MDPI and/or the editor(s) disclaim responsibility for any injury to people or property resulting from any ideas, methods, instructions or products referred to in the content. |
© 2025 by the authors. Licensee MDPI, Basel, Switzerland. This article is an open access article distributed under the terms and conditions of the Creative Commons Attribution (CC BY) license (http://creativecommons.org/licenses/by/4.0/).
Copyright: This open access article is published under a Creative Commons CC BY 4.0 license, which permit the free download, distribution, and reuse, provided that the author and preprint are cited in any reuse.


