Preprint
Article

This version is not peer-reviewed.

The Influence of Transgenic Insect-Resistance and Herbicide-Tolerance Soybean KM2208-23 on the Rhizosphere Micro-Biome

Submitted:

18 December 2025

Posted:

19 December 2025

You are already at the latest version

Abstract

The consequences of stacking multiple insect-resistance and herbicide-tolerance genes, particularly across the entire plant life cycle, remain inadequately understood. This study investigated the impact of stacked-trait transgenic soybean (expressing cry1Ac, vip3Aa19, mOsPPO2, and pat genes) on rhizosphere microbial communities across five growth stages (pre-sowing, V3, R3, R5, R8). Using 16S rRNA and ITS sequencing, we compared the rhizosphere microbiome of the transgenic modified soybean (GMO) with its non-transgenic control check (CK). Results showed transient but significant shifts in soil properties (e.g., available nitrogen) and microbial beta-diversity during the V3 stages. However, plant developmental stage was the predominant factor shaping microbial succession, with its effect outweighing that of the transgene. No persistent changes in microbial alpha-diversity were observed. We conclude that the influence of this stacked-trait soybean on the rhizosphere is growth-stage-specific and represents a minor, recoverable perturbation rather than a sustained ecological impact. These findings contribute to the ecological safety assessment of multi-gene transgenic crops.

Keywords: 
;  ;  

1. Introduction

The global cultivation area of genetically modified (GM) crops has consistently expanded, with soybean (Glycine max L.) being one of the most widely adopted transgenic species [1]. These modifications primarily target agronomic traits such as insect resistance (e.g., via Bacillus thuringiensis (Bt) Cry and Vip proteins) and herbicide tolerance (e.g., to glyphosate or glufosinate), aiming to enhance crop yield and reduce management costs [2]. Notably, stacked-trait varieties, combining multiple transgenes, are increasingly prevalent to address complex field challenges [3]. However, the potential environmental impacts of these transgenic plants, particularly on non-target soil ecosystems, remain a critical component of comprehensive biosafety assessment. Among these concerns, the effects on the structure and function of rhizosphere microbial communities warrant in-depth investigation, given their indispensable roles in soil fertility, nutrient cycling, plant health, and overall ecosystem stability [4].
The rhizosphere, a narrow zone of soil directly influenced by root exudates and activities, harbors an immensely diverse and dynamic microbial consortium [5]. Its community composition is highly sensitive to alterations in plant physiology, biochemistry, and root architecture [6]. Consequently, the introduction of transgenes may indirectly modify the rhizosphere microbiome through changes in root exudation patterns, litter quality, or subtle shifts in plant growth and development [7]. While numerous studies have examined the impact of single-trait GM crops (especially Bt crops) on soil microorganisms, conclusions have been variable, often reporting minor, transient, or plant genotype-dependent effects rather than consistent adverse outcomes attributed solely to the transgene [8,9]. Recent meta-analyses and high-throughput sequencing studies suggest that factors such as plant growth stage, soil type, and agricultural practices often exert stronger influences on microbial communities than the transgenic trait itself [10]. Nevertheless, research on multi-gene stacked traits, particularly those combining insect resistance and novel herbicide tolerance mechanisms, is comparatively limited. The potential synergistic or novel interactive effects of multiple transgenes on the soil microbiome are not yet fully understood, representing a significant knowledge gap.
Most existing temporal studies have focused on limited growth stages, potentially missing critical shifts during key physiological transitions. A comprehensive, stage-resolved analysis-from early seedling establishment through vegetative growth to reproductive maturity and senescence-is essential to capture the full dynamic response of microbial communities to transgenic plants. Furthermore, simultaneous characterization of both bacterial (via 16S rRNA gene sequencing) and fungal (via Internal Transcribed Spacer (ITS) sequencing) communities provides a more holistic view of the rhizosphere ecosystem, as these groups respond differently to plant cues and play distinct ecological roles.
This study aims to explore the potential impact of this complex trait transgenic soybean on the microbial community in the rhizosphere. We compared the dynamic changes of bacterial (16S rRNA) and fungal (ITS) communities in the rhizosphere of the transgenic lines and their non-transgenic isogenic lines before sowing and at five key growth stages (V3, R3, R5, and R8). We hypothesized that, given the targeting nature of the exogenous genes and the dominant influence of plant development and environmental factors, any differences between the transgenic and non-transgenic soybean rhizosphere microbial communities would be minor, transient, and within the natural variation range caused by plant growth stages. The results of this study will provide important scientific basis for the ecological safety assessment of transgenic crops with complex traits.

2. Materials and Methods

2.1. Genetically Modified Soybean

The transgenic transgenic insect-resistance and herbicide-tolerance soybean KM2208-23, which contained the cry1Ac, vip3Aa19, mOsPPO2 and pat genes, was selected as the experimental treatment material, while the non-genetically modified corn QYZ014 served as the control. The experience was performed at No. 53, Qinglong River Road, Hongshiya Sub-district, Huangdao District, Qingdao City, Shandong Province, at the test base of Qingyuan Compound Co., Ltd (36°04′37″N,120°06′13″E). For each soybean variety, 3 replicate plots were set up. In each plot, the 5-point diagonal sampling method was adopted. Two soybeans were taken from each point. The 10 root samples from these 5 points were combined into one sample and placed in a sampling bag. Two samples were taken from each plot, totaling 6 replicates for each variety in each period. Rhizosphere soil of GMO and CK soybean at five growth stages including BQ (pre-sowing), V3 (trefoil stage), R3 (beginning pod), R5 (be-ginning seed) and R8 (full maturity) were collected. In brief, the whole root system was pulled out from the field and remove the loosely attached soil on the roots by shaking. Rhizosphere soil were finally obtained by rinsing the roots with sterile water and high-speed centrifugation of the suspension (6000 g, 20 min).

2.2. Determination of Physical and Chemical Properties of Rhizosphere Soil

The total kalium (TK), available kalium (AK), effective nitrogen (EN), pH, organic matter (OM), total phosphorus (TP), available phosphorus (AP) and total nitrogen (TN) of the rhizosphere soil were detected. In brief, the total nitrogen in the soil, with the participation of the accelerator, is digested using concentrated sulfuric acid. It is converted into ammonium nitrogen. It is alkalinized with sodium hydroxide, and the ammonia vaporized by heating is absorbed with boric acid. It is titrated with an acid standard solution to determine the total nitrogen content of the soil. Under high-temperature conditions, the phosphorus-containing minerals and organic phosphorus compounds in the soil react with sulfuric acid and perchloric acid, causing them to completely decompose and all converting into orthophosphate and entering the solution. Then, the molybdenum-sulfur antimony colorimetric method is used for determination. Under heating conditions, the soil organic carbon is oxidized using an excess of potassium dichromate-sulfuric acid solution. The excess potassium dichromate is titrated with a standard solution of ferrous sulfate. The amount of organic carbon is calculated based on the consumed amount of potassium dichromate using the oxidation correction coefficient, and then multiplied by the constant 1.724 to obtain the soil organic matter content. In the diffusion dish, the soil is hydrolyzed with 1.8 mol·L-1 NaOH to convert the readily hydrolyzable nitrogen (potential available nitrogen) into NH3 through alkaline hydrolysis. After NH3 diffuses, it is absorbed by H3BO3. The NH3 in the H3BO3 absorption solution is then titrated with standard acid, from which the content of alkali-hydrolyzed nitrogen in the soil can be calculated. The acidic forest soil samples were extracted with ammonium fluoride and hydrochloric acid. By taking advantage of the ability of F- to complex Fe3+ and Al3+ in acidic solutions, the relatively active iron phosphate and aluminum salts in these soils were gradually activated and released. The phosphorus in the leaching solution was determined by the molybdenum-sulfur antimony colorimetric method. Fluorine decomposes silicate minerals by reacting with silicon to form fluorosilicon. It can be heated and volatilized under the presence of strong acids. Perchloric acid is a very strong oxidizing agent under high-temperature conditions. It can decompose organic matter in the soil and effectively remove excess HF in the samples.

2.3. DNA Extraction and Amplicon Sequencing

Extract the DNA from 0.5g rhizosphere soil using the Fast DNA SPIN Kit for Soil (MP Bio-medicals, Solon, USA). DNA quality testing was performed using Qubit® dsDNA HS Assay and NanoDrop. The bacterial 16S rRNA gene was amplified using primers 341F (5’-CCTAYGGGRBGCASCAG-3’)/805R (‘-GACTACHVGGGTATCTAATCC-3’). The fungal ITS region was amplified using primers ITS1F (5’-CTTGGTCATTTAGAGGAAGTAA-3’)/ITS2R (5’-GCTGCGTTCTTCATCGATGC-3’). The amplification reaction contains high-fidelity enzymes (such as KAPA HiFi HotStart ReadyMix), primers (10 μM each 0.2 μL), and template DNA. The amplification procedure is 95℃ 3 min, denaturation: 95℃ 30 s, annealing: 55℃ 30 s (for bacteria) or 50℃ 30 s (for fungi), extension: 72℃ 30s (30 cycles), final extension: 72 °C 5 min. The library was conducted using the Nextera XT Index Kit and quantify the library concentration using Qubit®. Library fragment sizes were confirmed using a Gilent 2100 Bioanalyzer or LabChip GX. After library construction, sequencing was performed using the Illumina MiSeq (2×250/300bp, suitable for high throughput) platform.

2.4. Bioinformatic Analysis of Amplicon Sequencing Data

The analysis of bacterial 16S rRNA genes and fungal ITS sequences was conducted using QIIME version 1.9 [11] and USEARCH version 10 [12]. Initially, FastQC version 0.11.5 [13] was employed to assess the quality of the reads. Subsequently, Trimmomatic version 0.39 [14] was utilized to trim paired reads with quality scores below Q30. The processed sequences were then clustered, with those exhibiting a similarity greater than 97% being classified as belonging to the same operational taxonomic unit (OTU). Taxonomic classification of the sequences was performed using the SILVA version 138.1 [15] and UNITE version 8.2 databases [16] to distinguish between bacterial and fungal sequences. For α diversity estimation, the OTU tables for bacteria and fungi were standardized using the normalize_table.py script in QIIME, following the cumulative sum scaling (CSS) method. β diversity analysis was conducted using the beta_diversity.py script, also employing the CSS normalization approach. Operational taxonomic units present in all samples were identified as core taxonomic units. Principal coordinate analysis (PCoA) was performed using the R software environment, version 4.1.0 [17], employing the Vegan package version 2.6.4 [18] and the Tidyverse package version 2.0.0 [19]. PICRUSt2 version 2.6.2 [20] was used to perform functional prediction of 16S rRNA gene sequences in the Kyoto Encyclopedia of Genes and Genomes (KEGG) functional database. Pairwise T-test was performed for different groups, with the P threshold set at 0.05 (P < 0.05 indicate significance). FunGuild version 1.0 [21] was used to perform the ecological function prediction of fungal community. The biomarker bacteria were identified using LEfSe (logarithmic LDA score > 3.0, P < 0.05).

3. Results

3.1. The Influence of GMO on Physical and Chemical Properties of Soil

To investigate the influence of GMO on soil, rhizosphere soil of soybeans from five different growth stages were collected to detect the physical and chemical properties. The five periods were BQ (before sowing), V3 (trefoil stage), R3 (beginning pod), R5 (beginning seed) and R8 (full maturity). Results showed that the EN, OM and TN indexes showed the significant differences between GMO and CK groups at V3 and R3 period (Table 1, Wilcoxon rank sum test, P < 0.05). The pH index showed the between-group variance at the later stage of soybean growth (R5 and R8). The TK and AP indexes showed the differences at BQ and R3 stage, respectively. In general, genetically modified soybean has a greater impact on the physical and chemical properties of the rhizosphere soil at V3 and R3 stage.

3.2. The Basic Information of Amplicon Sequencing Data

At the BQ, V3, R3, R5 and R8 stage, rhizosphere soil of soybean from both the GMO and CK groups were selected for further analysis. We characterized the bacterial and fungal community compositions by sequencing the small ribosomal subunit (16S rRNA) gene fragments and internally transcribed spacer (ITS) sequences, followed by clustering into operational taxonomic units (OTUs) at 97% identity. From 60 samples, we obtained 4,792,307 high-quality 16S rRNA reads and 5,574,493 ITS reads, with individual sample reads ranging from 42,015 to 128,946 and an average of 86,390 reads per sample, representing 3,284 bacterial and 821 fungal OTUs. The dilution curve, constructed based on the Shannon index, demonstrated a tendency to plateau, indicating that species richness in this environment does not significantly increase with additional sequencing, thereby satisfying the requirements for subsequent analysis (Fig. A1).

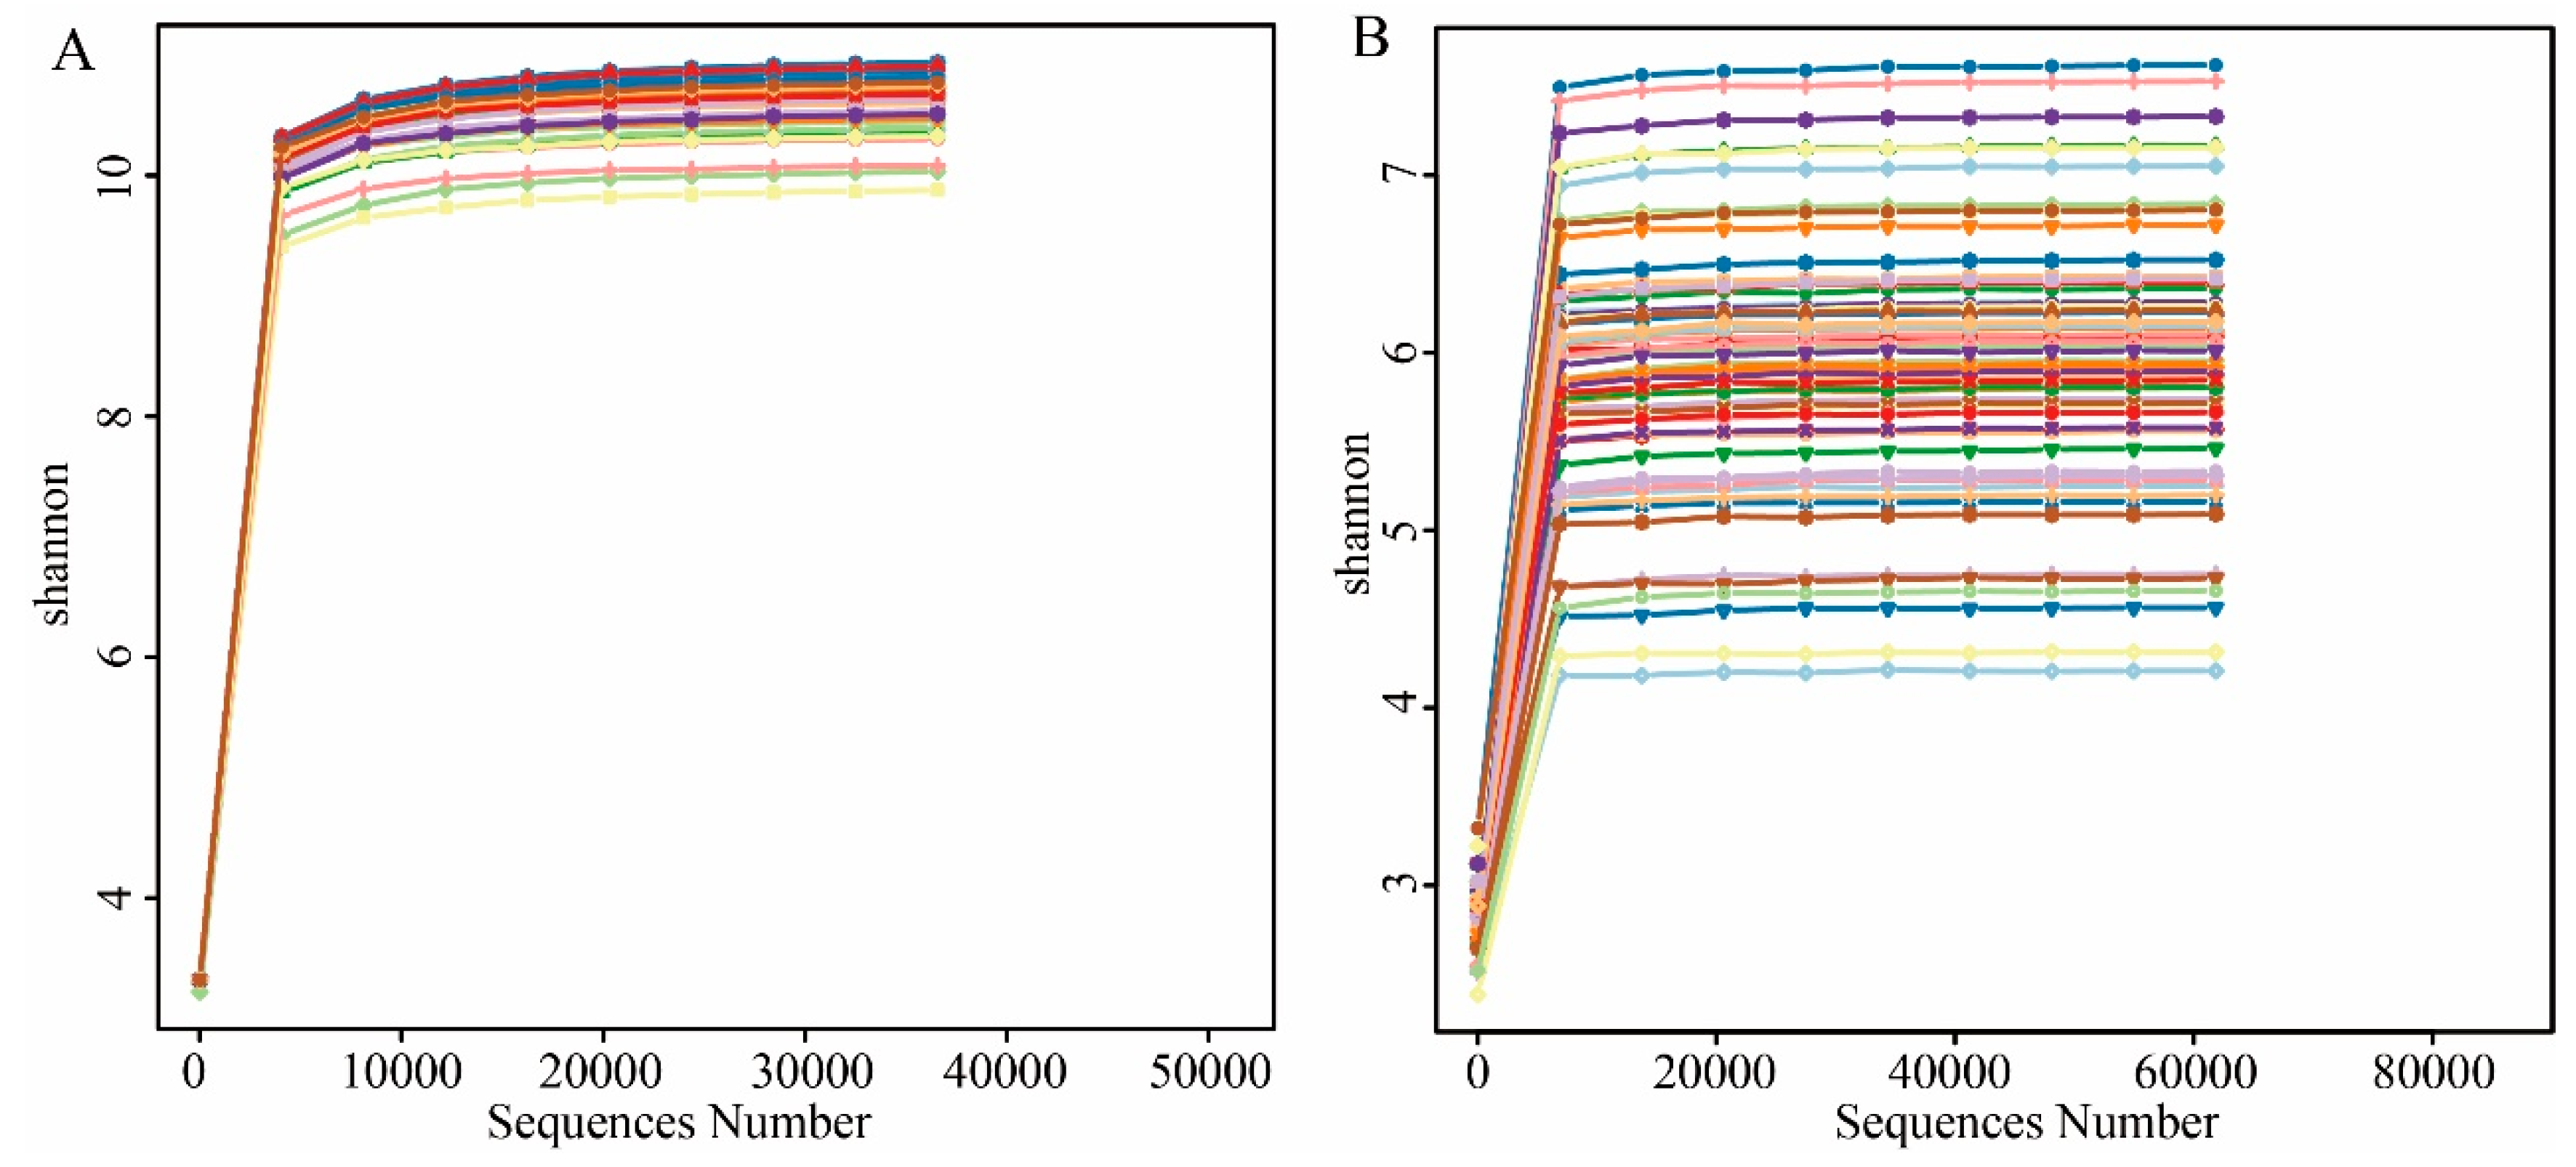
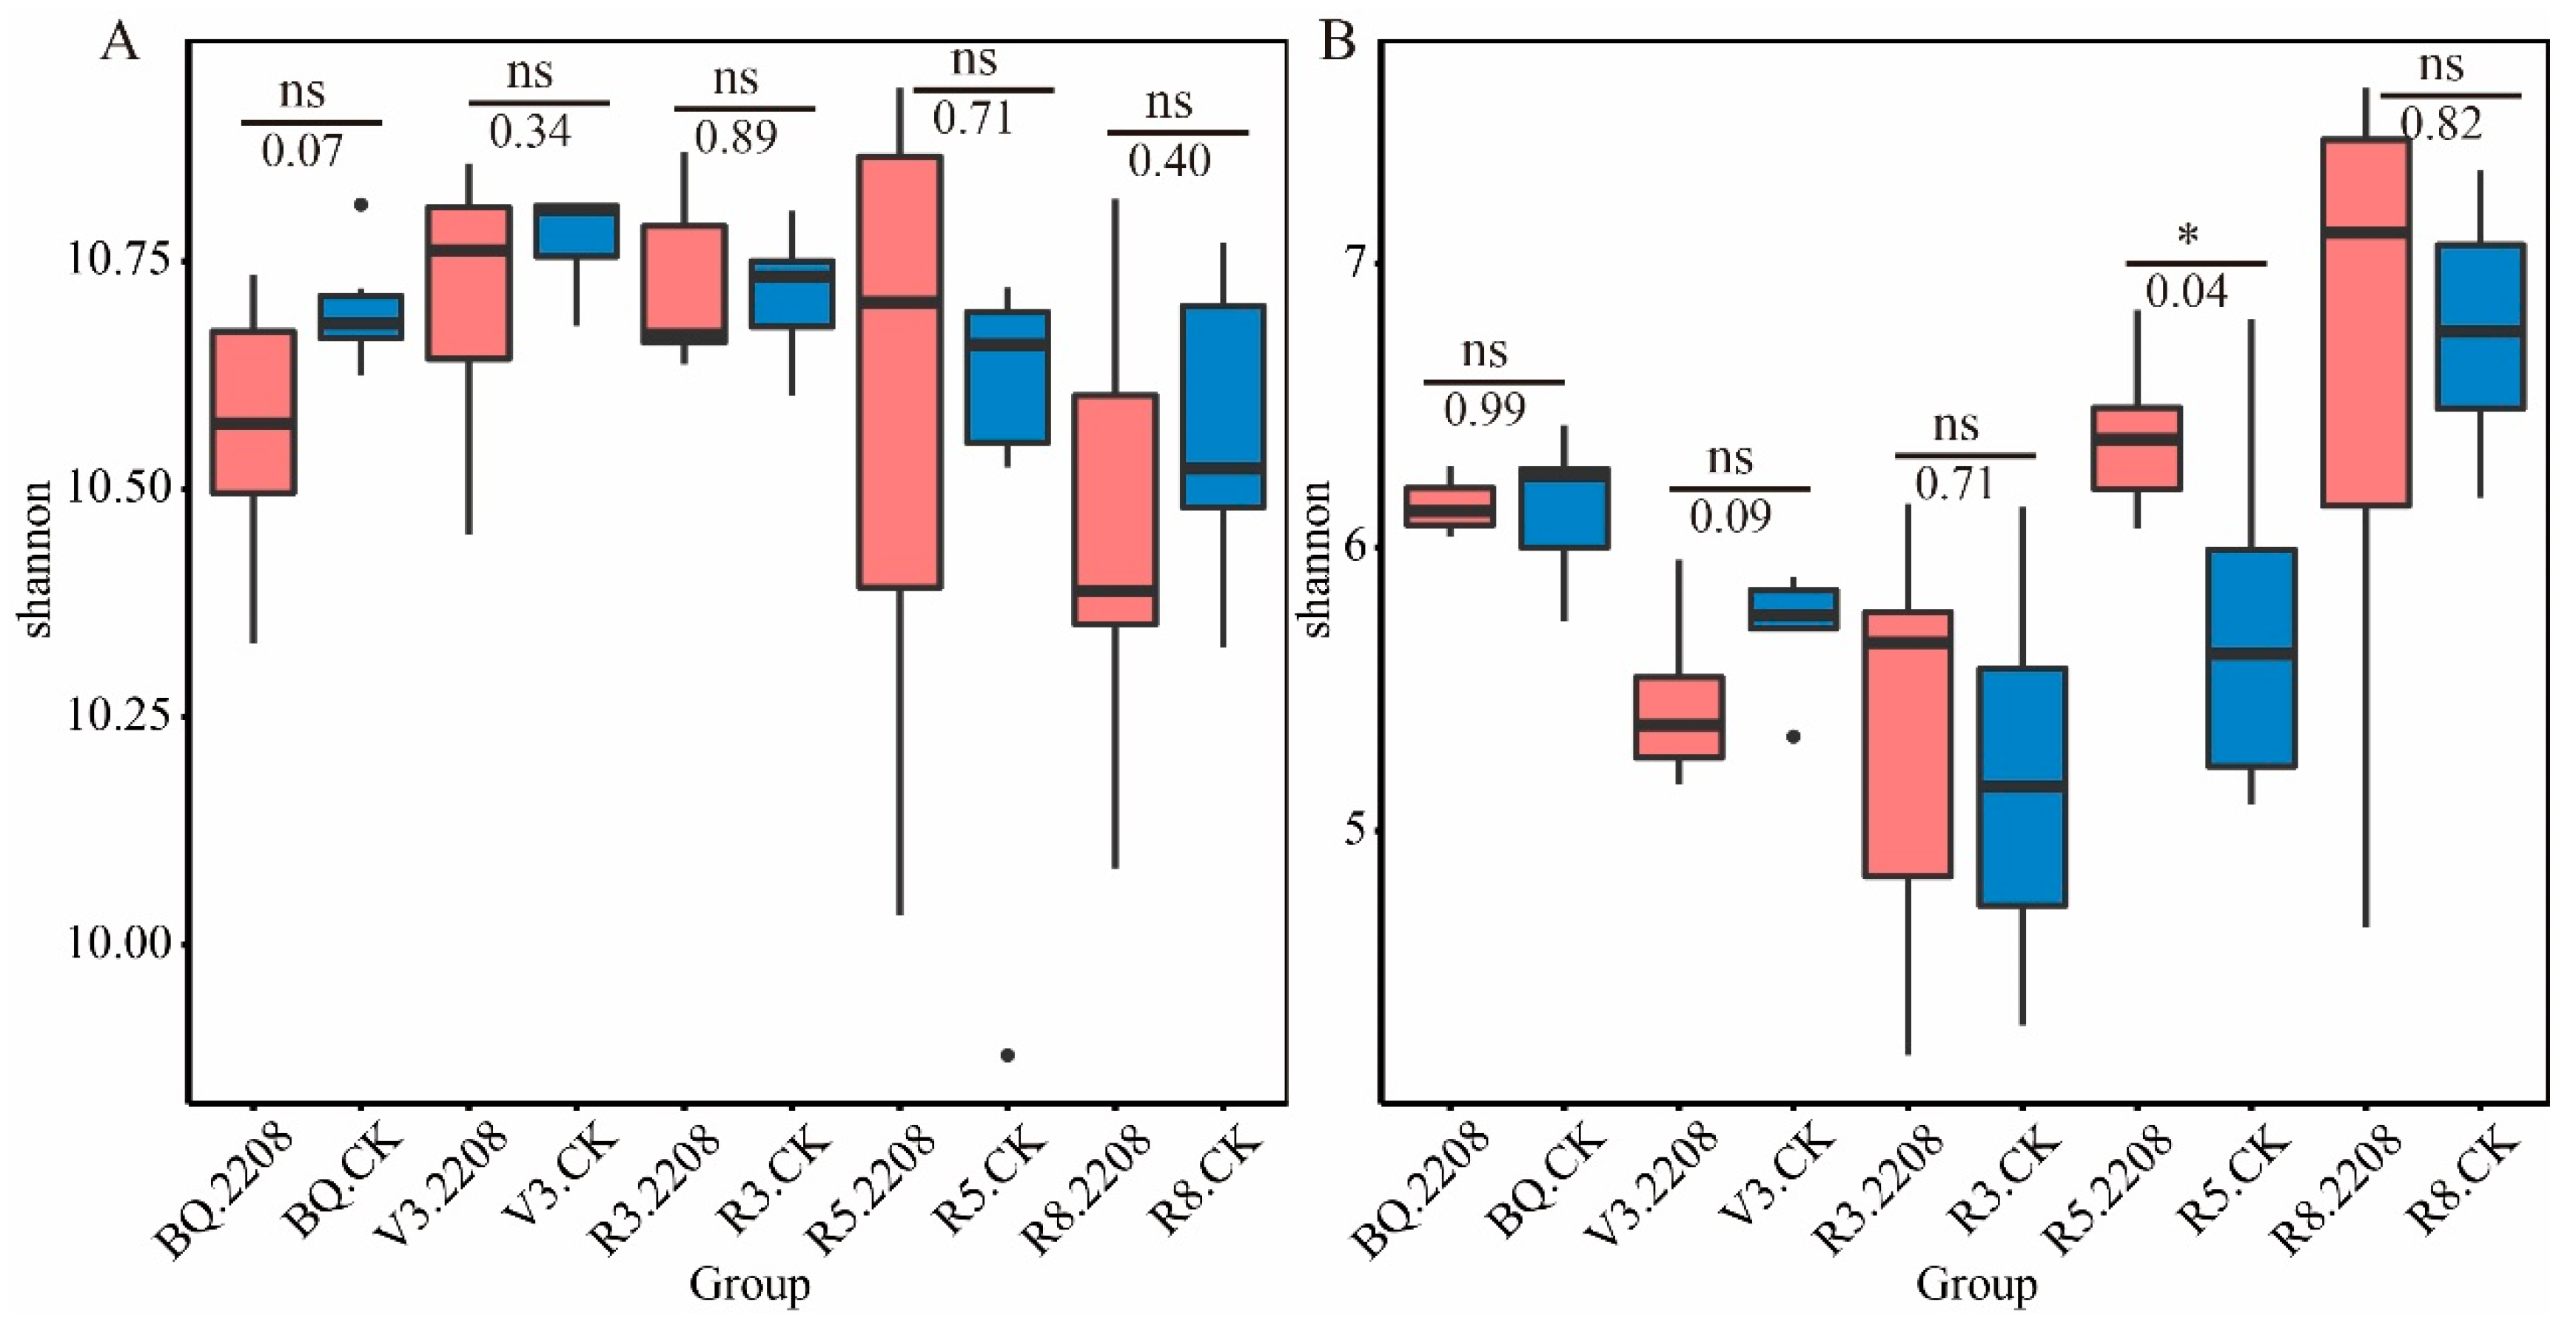
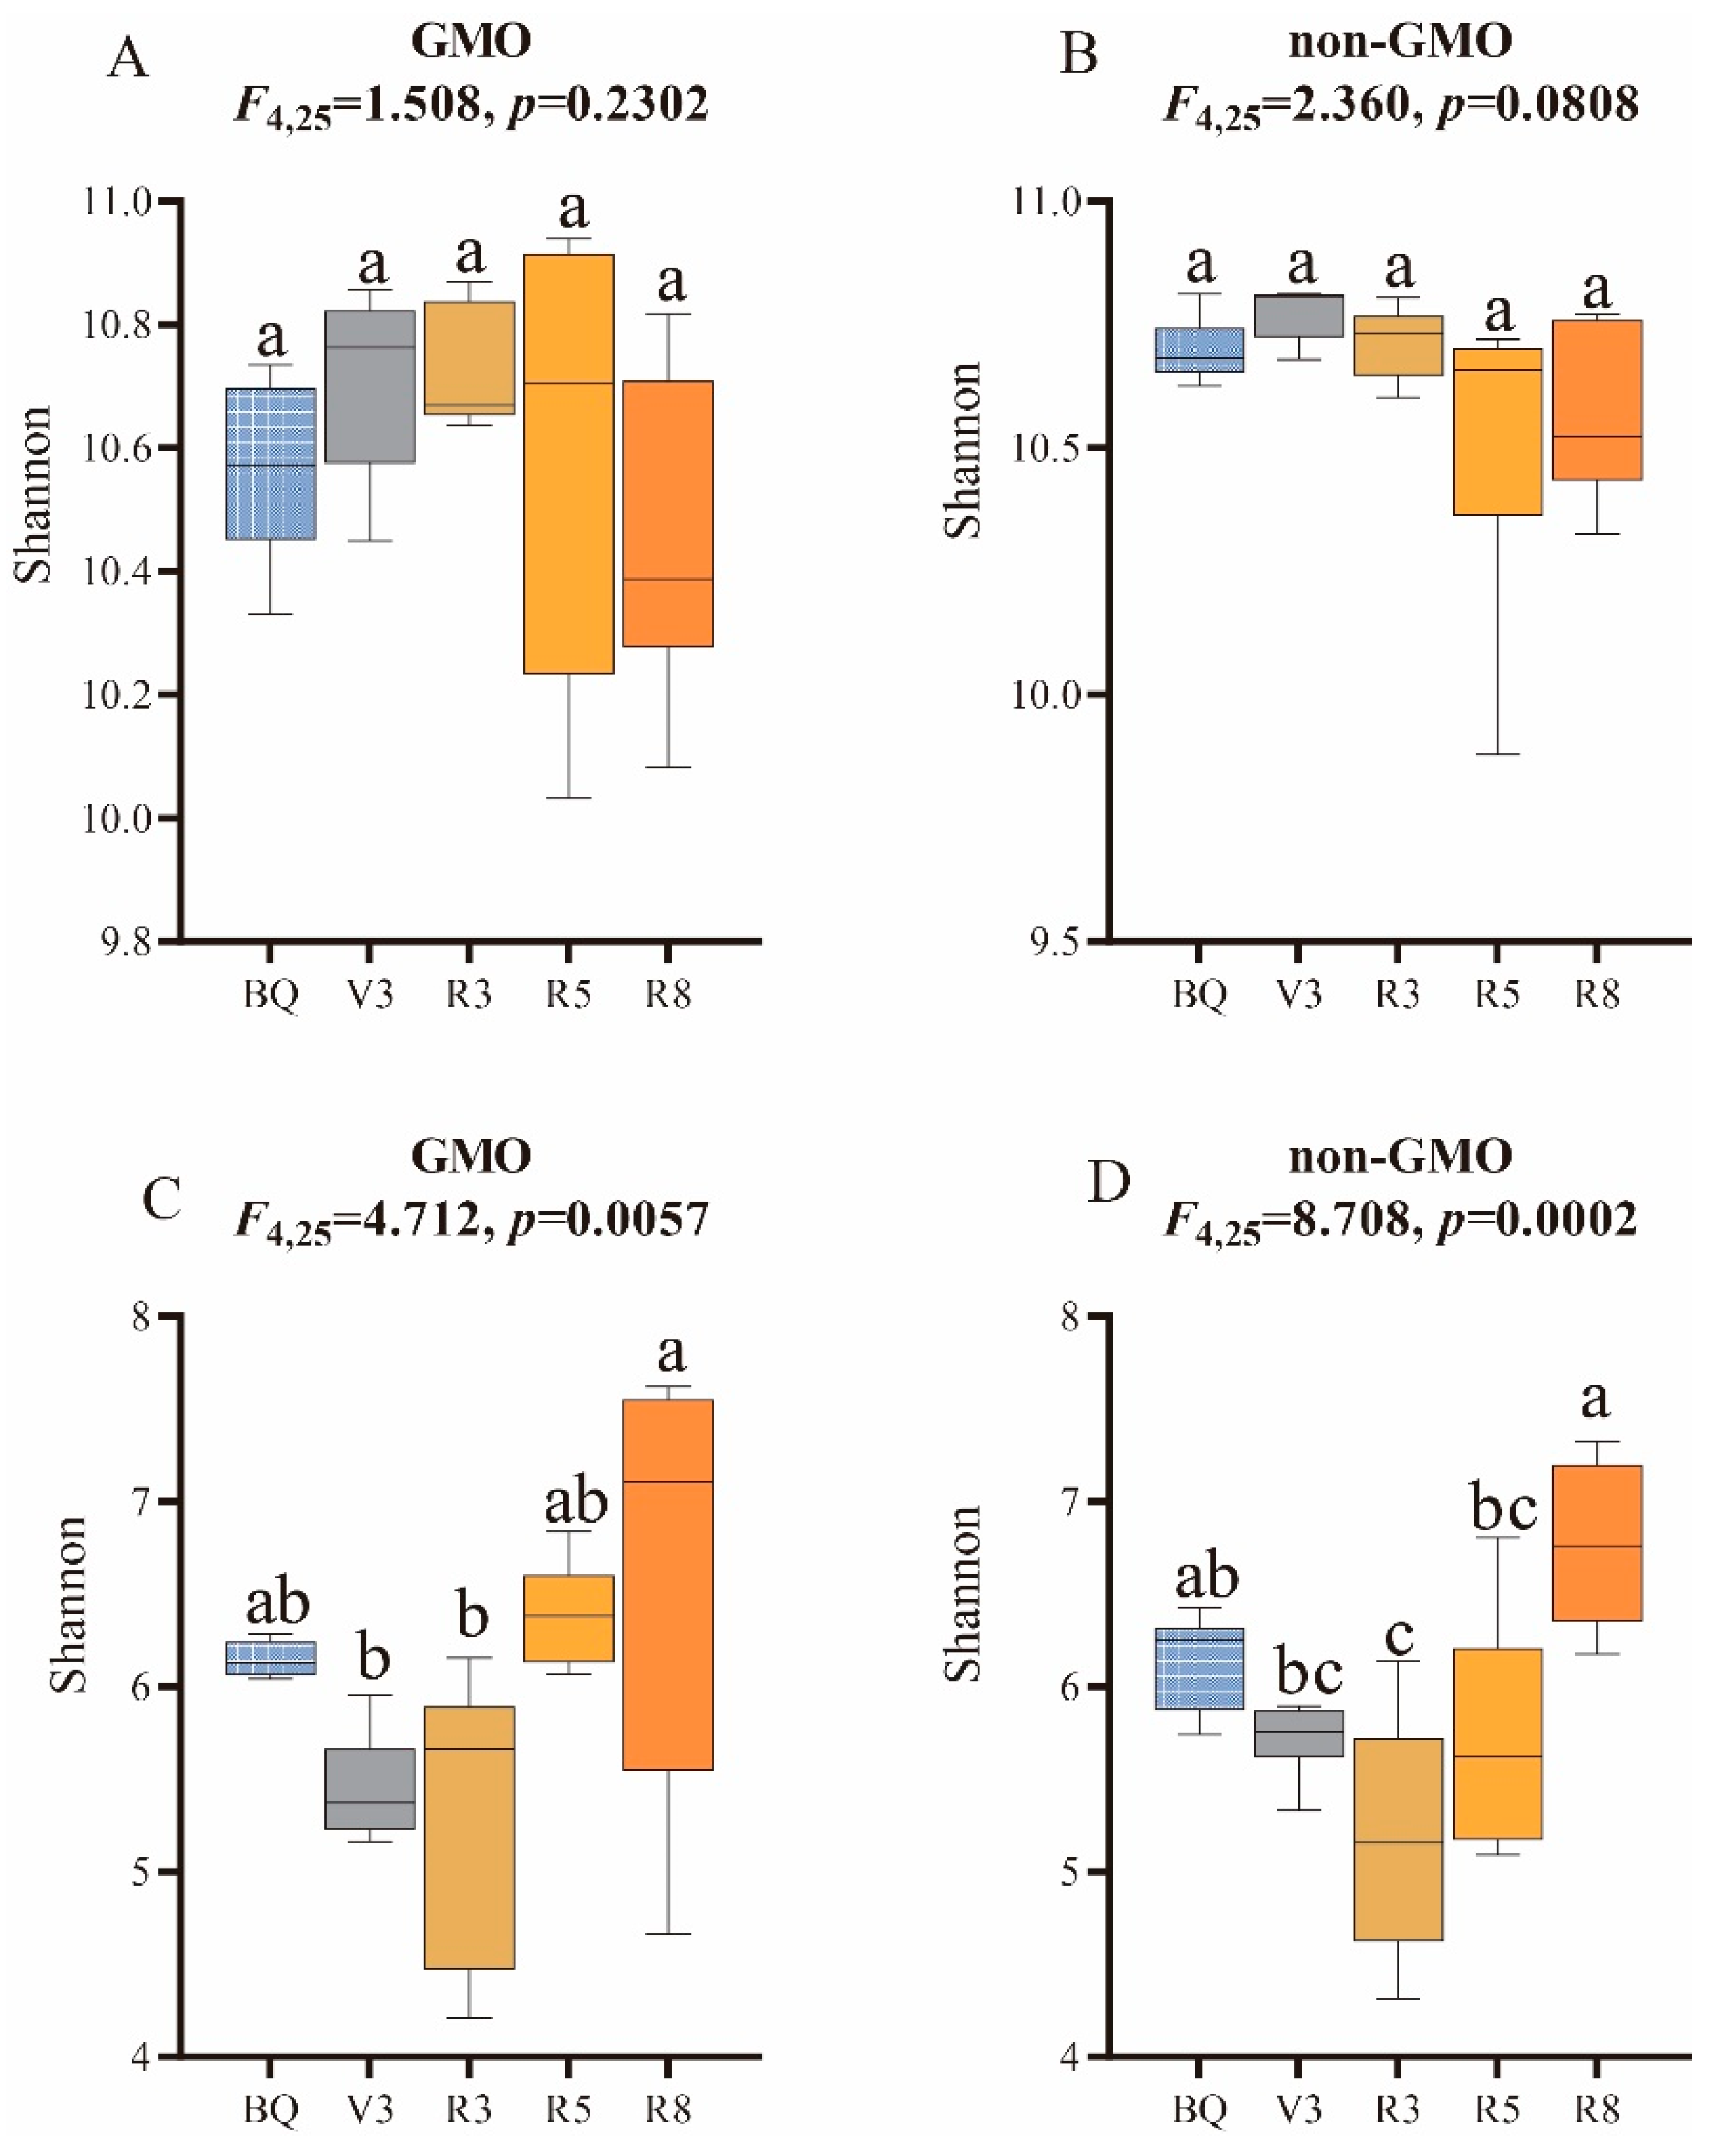
3.3. The Influence of GMO on Microbial Alpha Diversity of Soybean

Comparative analyses of Shannon Diversity Index (SDI) were conducted between GMO and CK groups for both bacterial and fungal communities. The SDI for bacterial communities did not exhibit statistically significant differences between GMO and CK groups across the five stages, as determined by the Wilcoxon rank sum test (P > 0.05; Figure 1A). In contrast, the SDI for fungal communities was observed to be higher at R5 stage in the GMO groups compared to the CK group (P < 0.05; Figure 1B). In addition, the influence of growth stage on microbial alpha diversity were also investigated. As Figure 2A and 2B shown, no significant difference of the bacterial SDI was found across the five stages for GMO or CK groups (Tukey’s multiple comparisons test P > 0.05). On the contrary, the SDI of fungal community significantly increased from V3 to R3 stages in both GMO and CK groups (Tukey’s multiple comparisons test P < 0.05, Figure 2C and 2D).

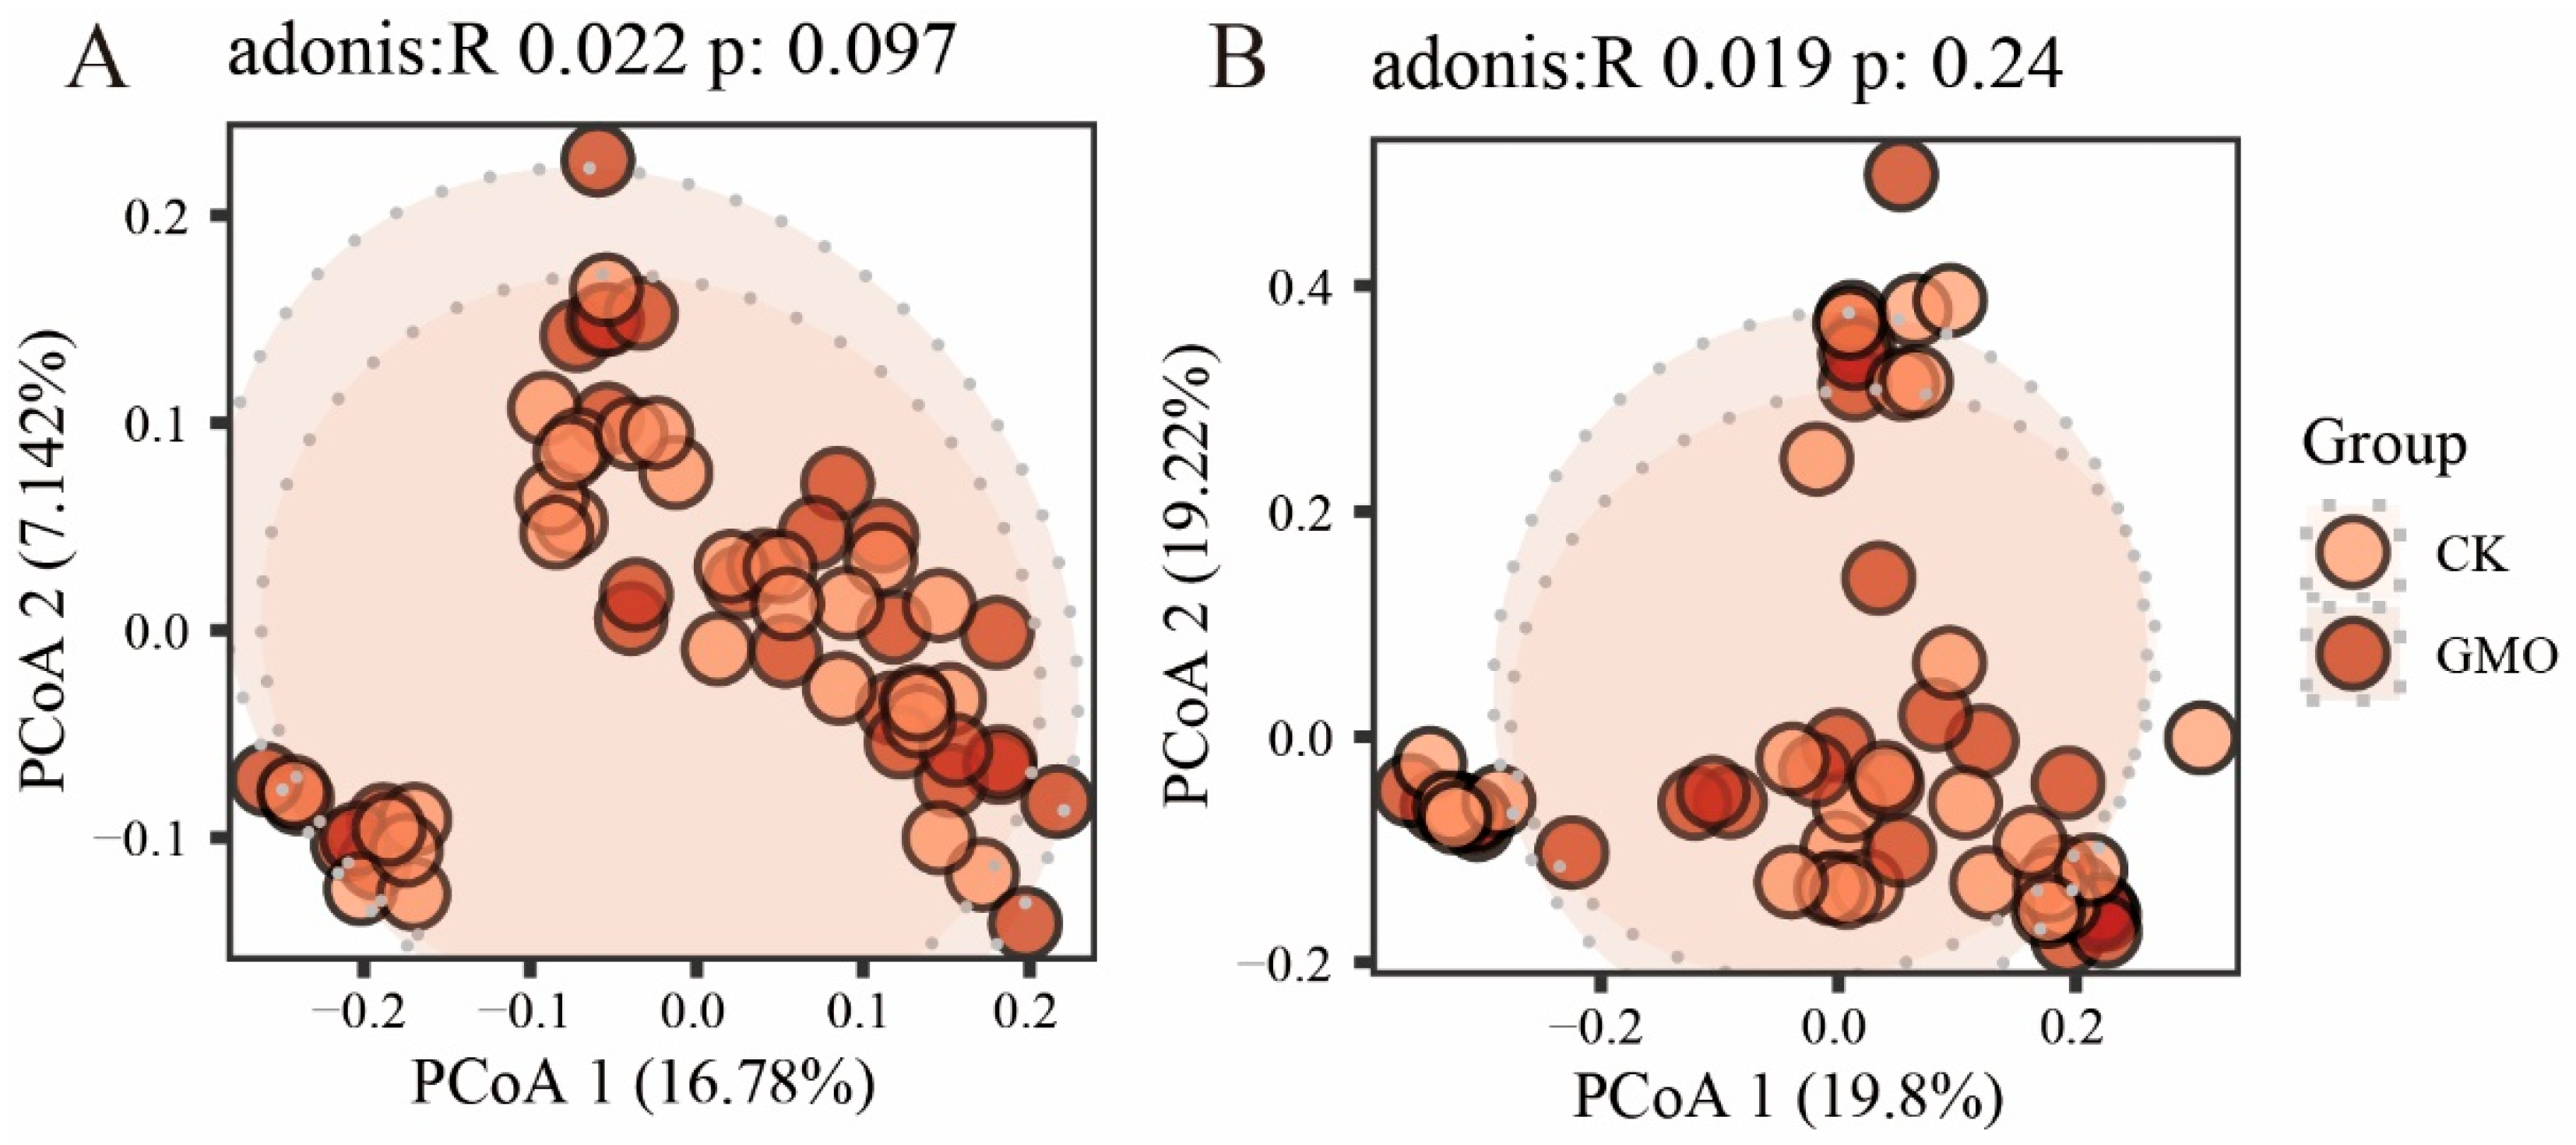
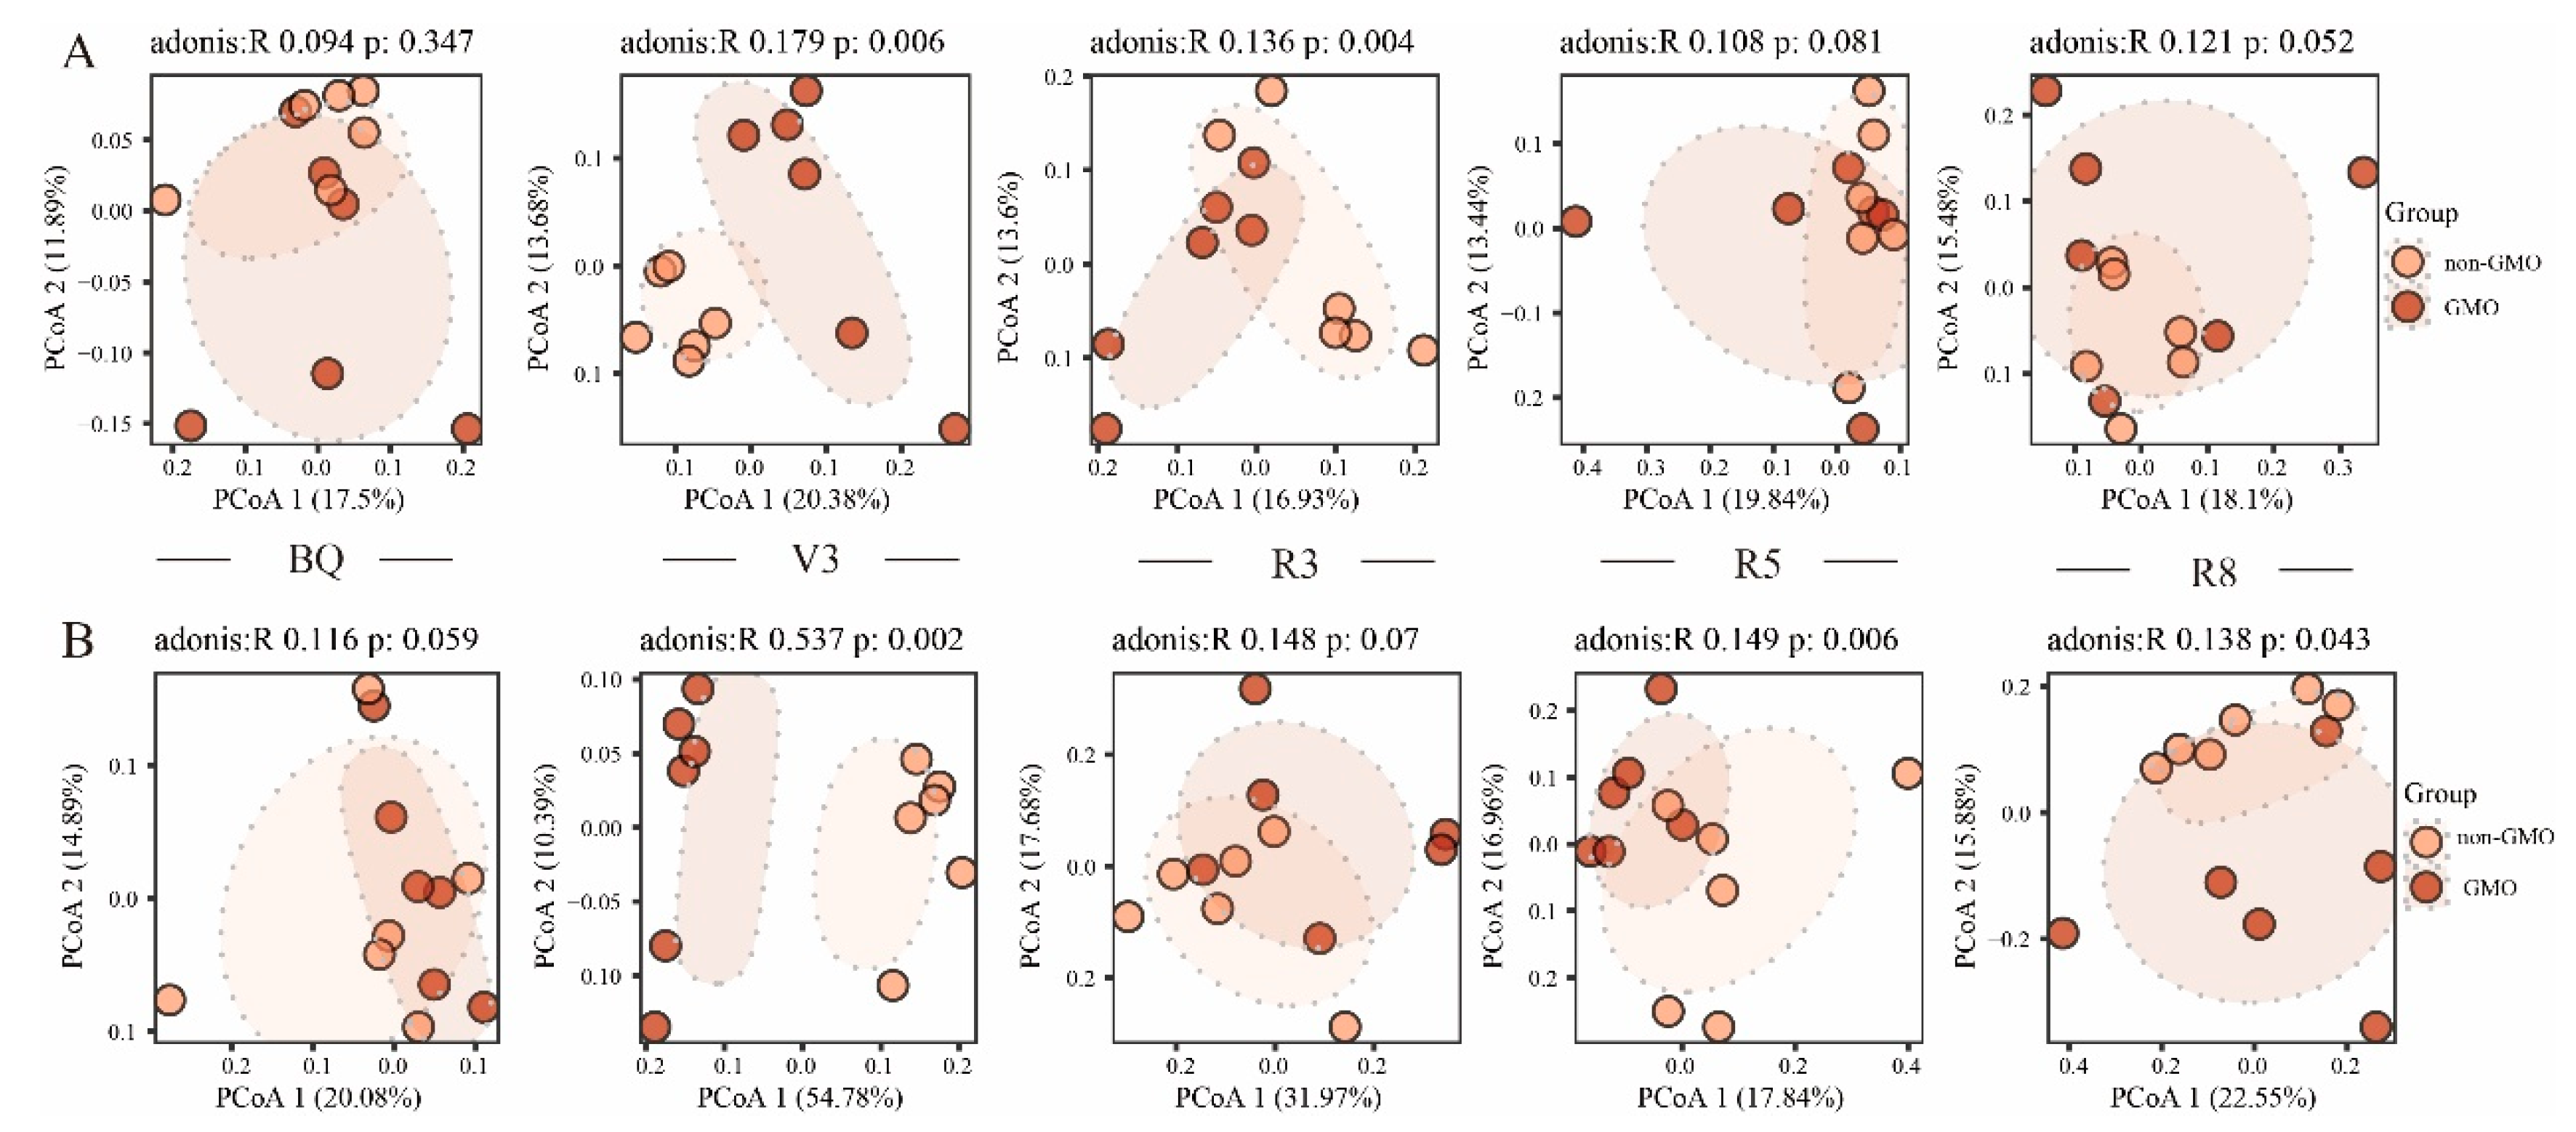
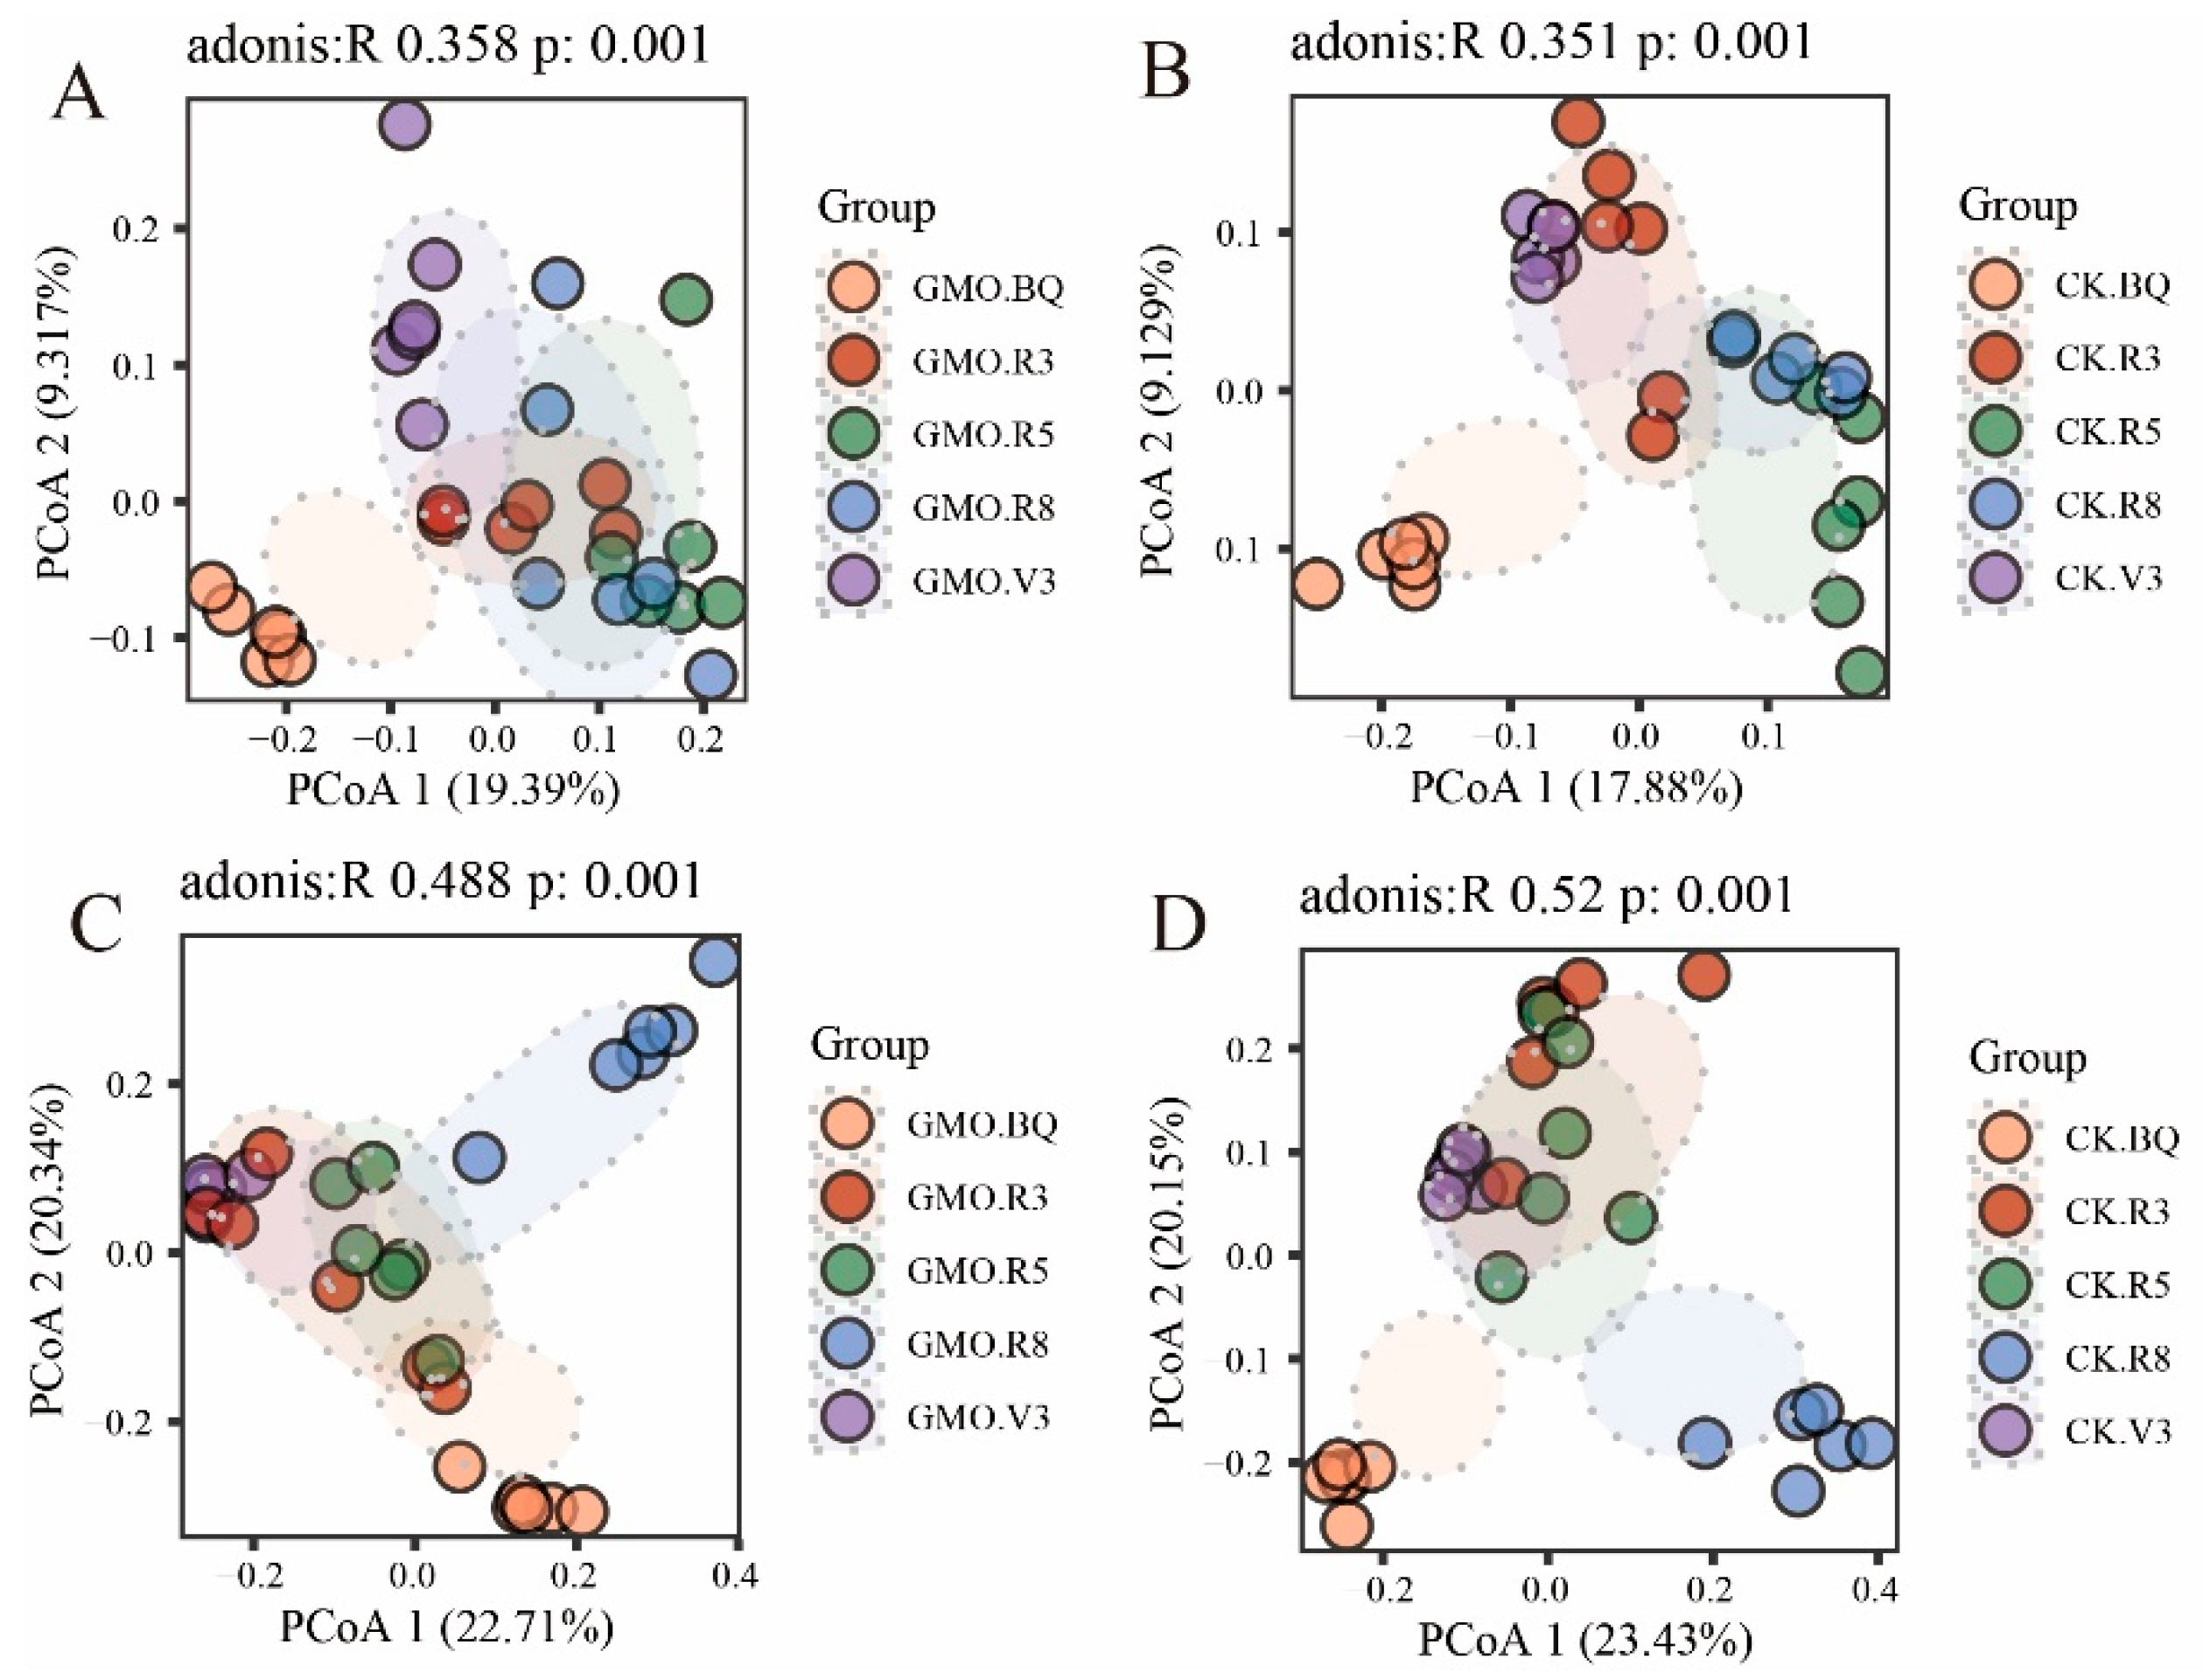
3.4. The Influence of GMO on Microbial Beta Diversity of Soybean

Principal coordinates analysis (PCoA) utilizing Bray–Curtis dissimilarity didn’t distinguish GEO and CK groups both in bacterial communities (Figure A2A, Adonis R²=0.022, P=0.097) and fungal communities (Figure A2B, Adonis R²=0.019, P=0.24) without considering the growth stage. Examining separately the different stage, significant compositional differences in bacterial communities were observed between GMO and CK groups at the V3 (Figure 3A, Adonis R²=0.179, P=0.006) and R3 (Adonis R²=0.136, P=0.004) stages along the first principal component. As for fungal community, significant compositional differences were found at V3 (Figure 3B, Adonis R²=0.537, P=0.002), R5 (Adonis R²=0.149, P=0.006) and R8 (Adonis R²=0.138, P=0.043) stages. These results of PCoA indicated that GMO influenced the beta diversity of both bacterial and fungal community at V3 stage.
To investigate whether growth stage affects the composition of microbiome communities, PCoA was conducted across the five stages. For bacteria, samples in each growth stages significantly separated with others for both GMO and CK groups (Figure 4A and 4B). Fungal communities showed a similar pattern in PCoA results. All these PCoA findings suggest that growth stages deeply influence the composition of microbiome communities, and GMO influence these at special growth stages (Figure 4C and 4D).

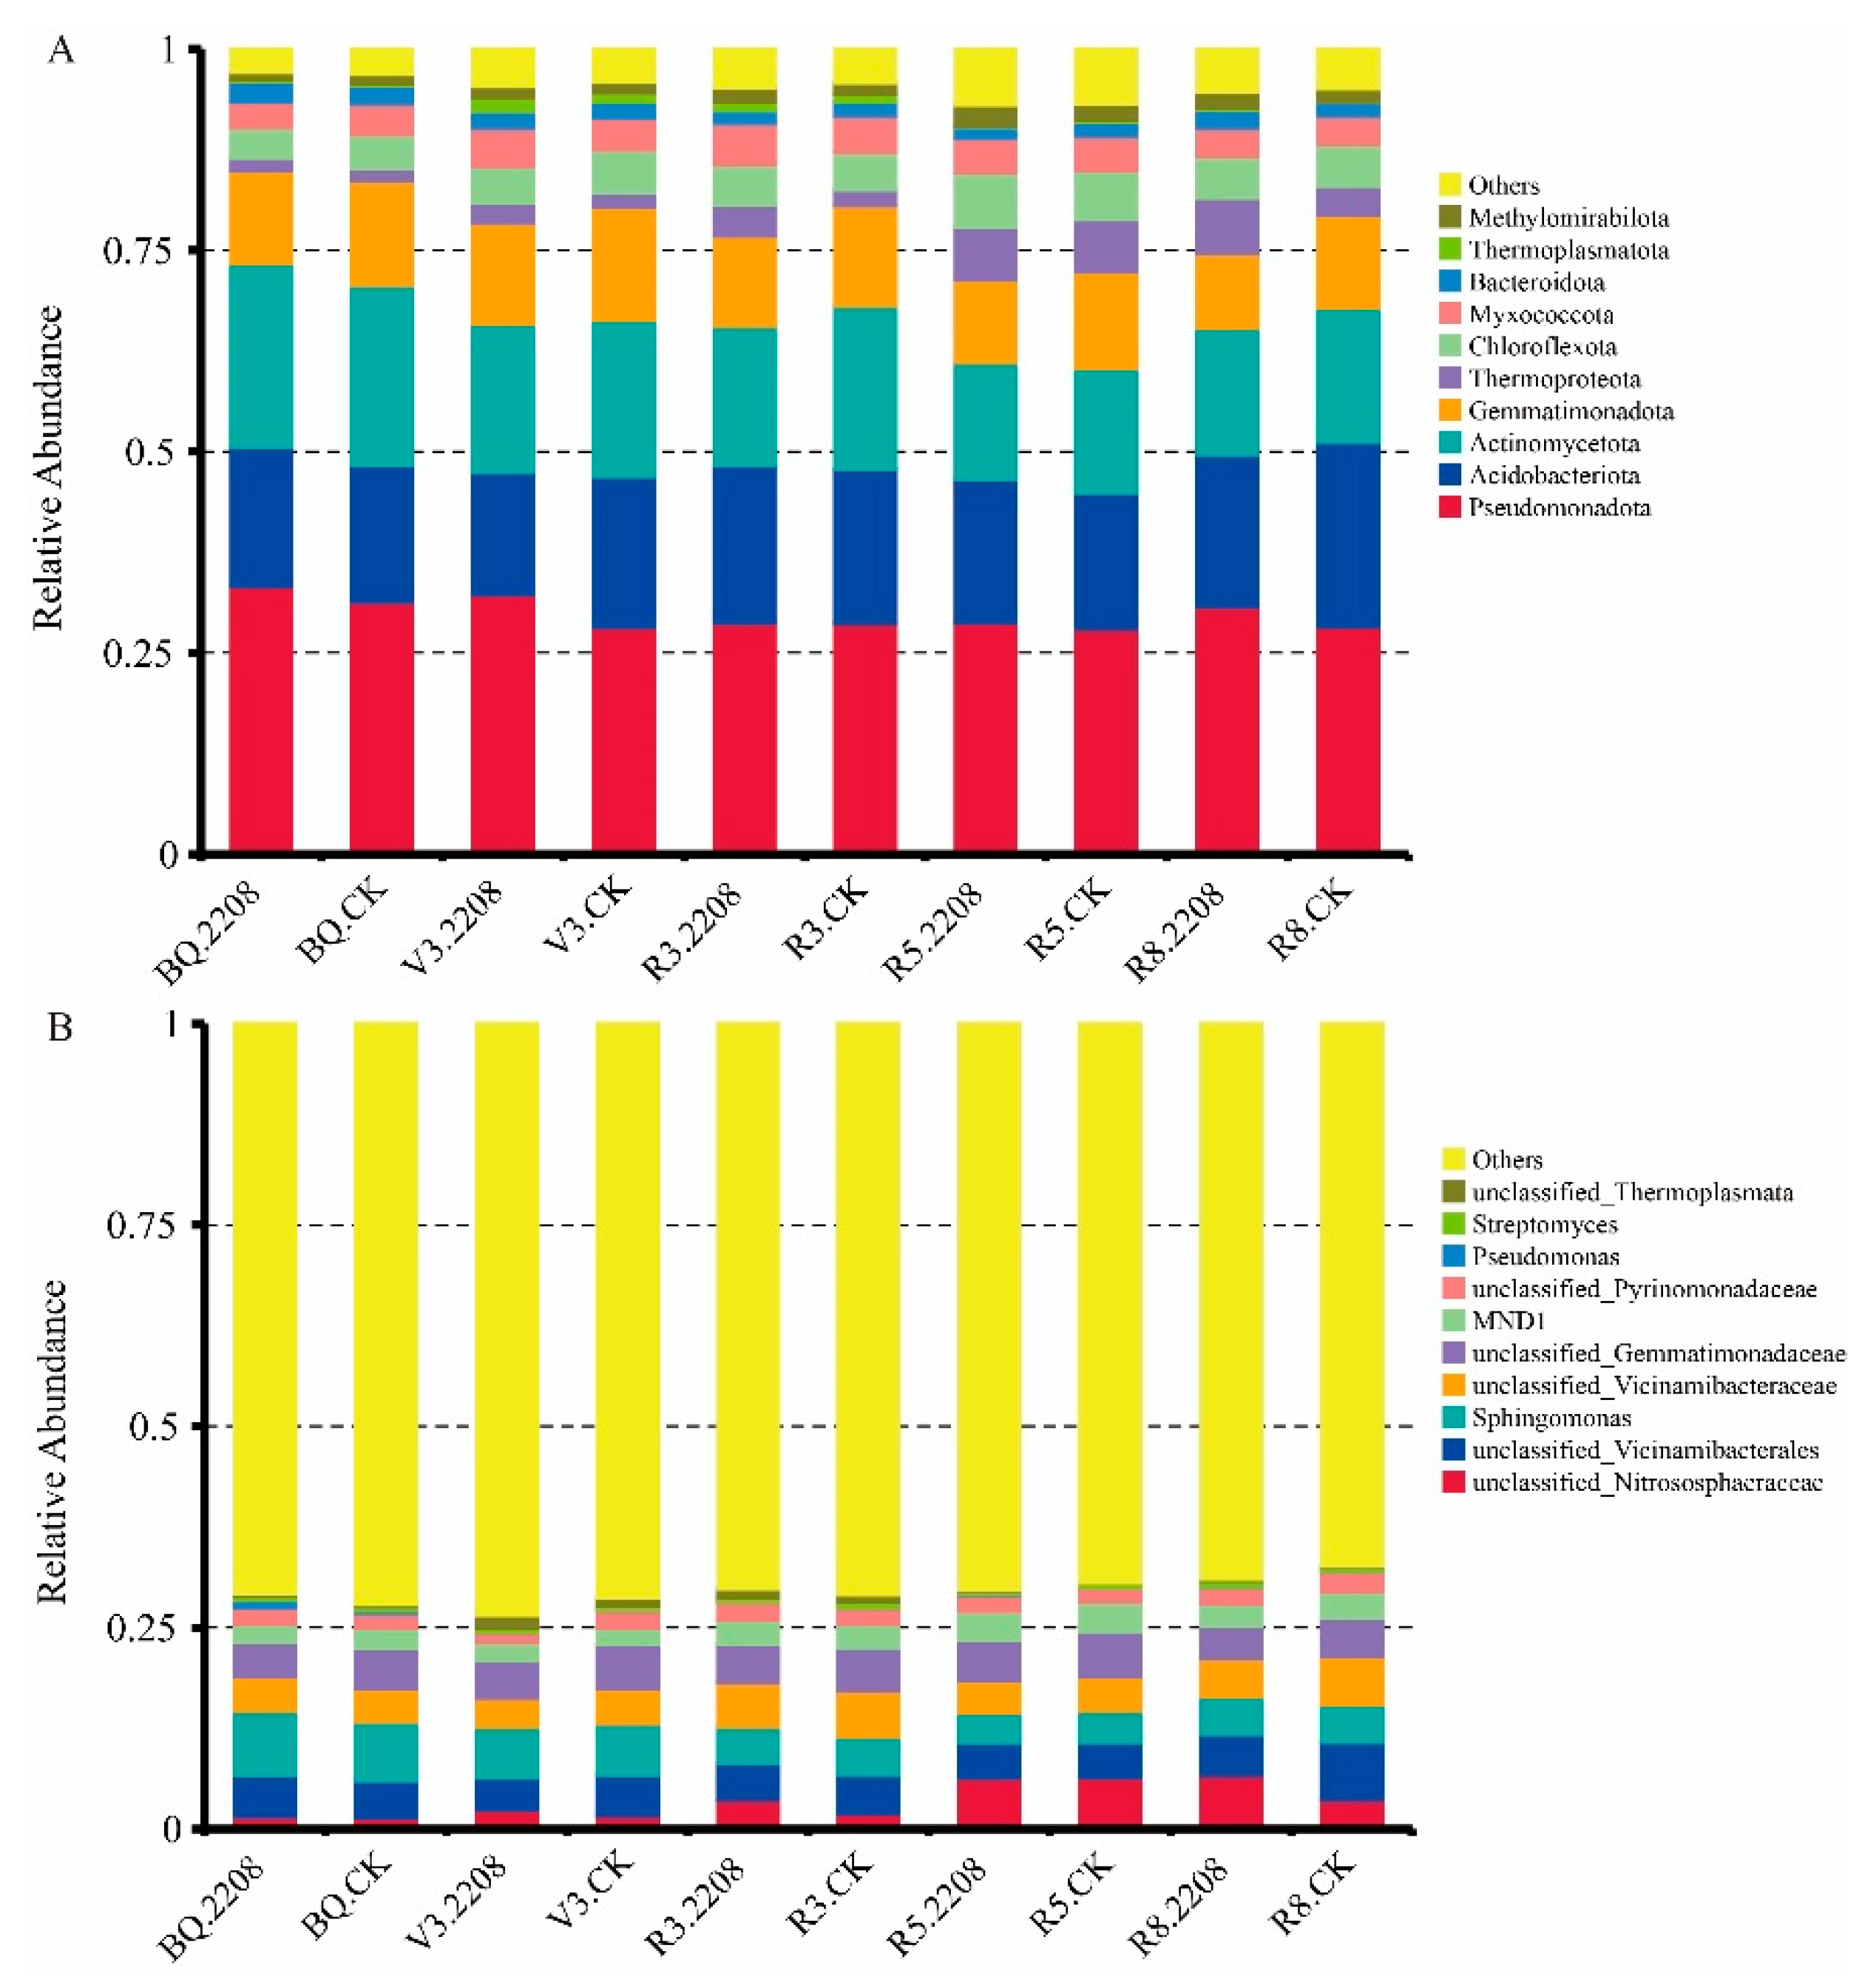
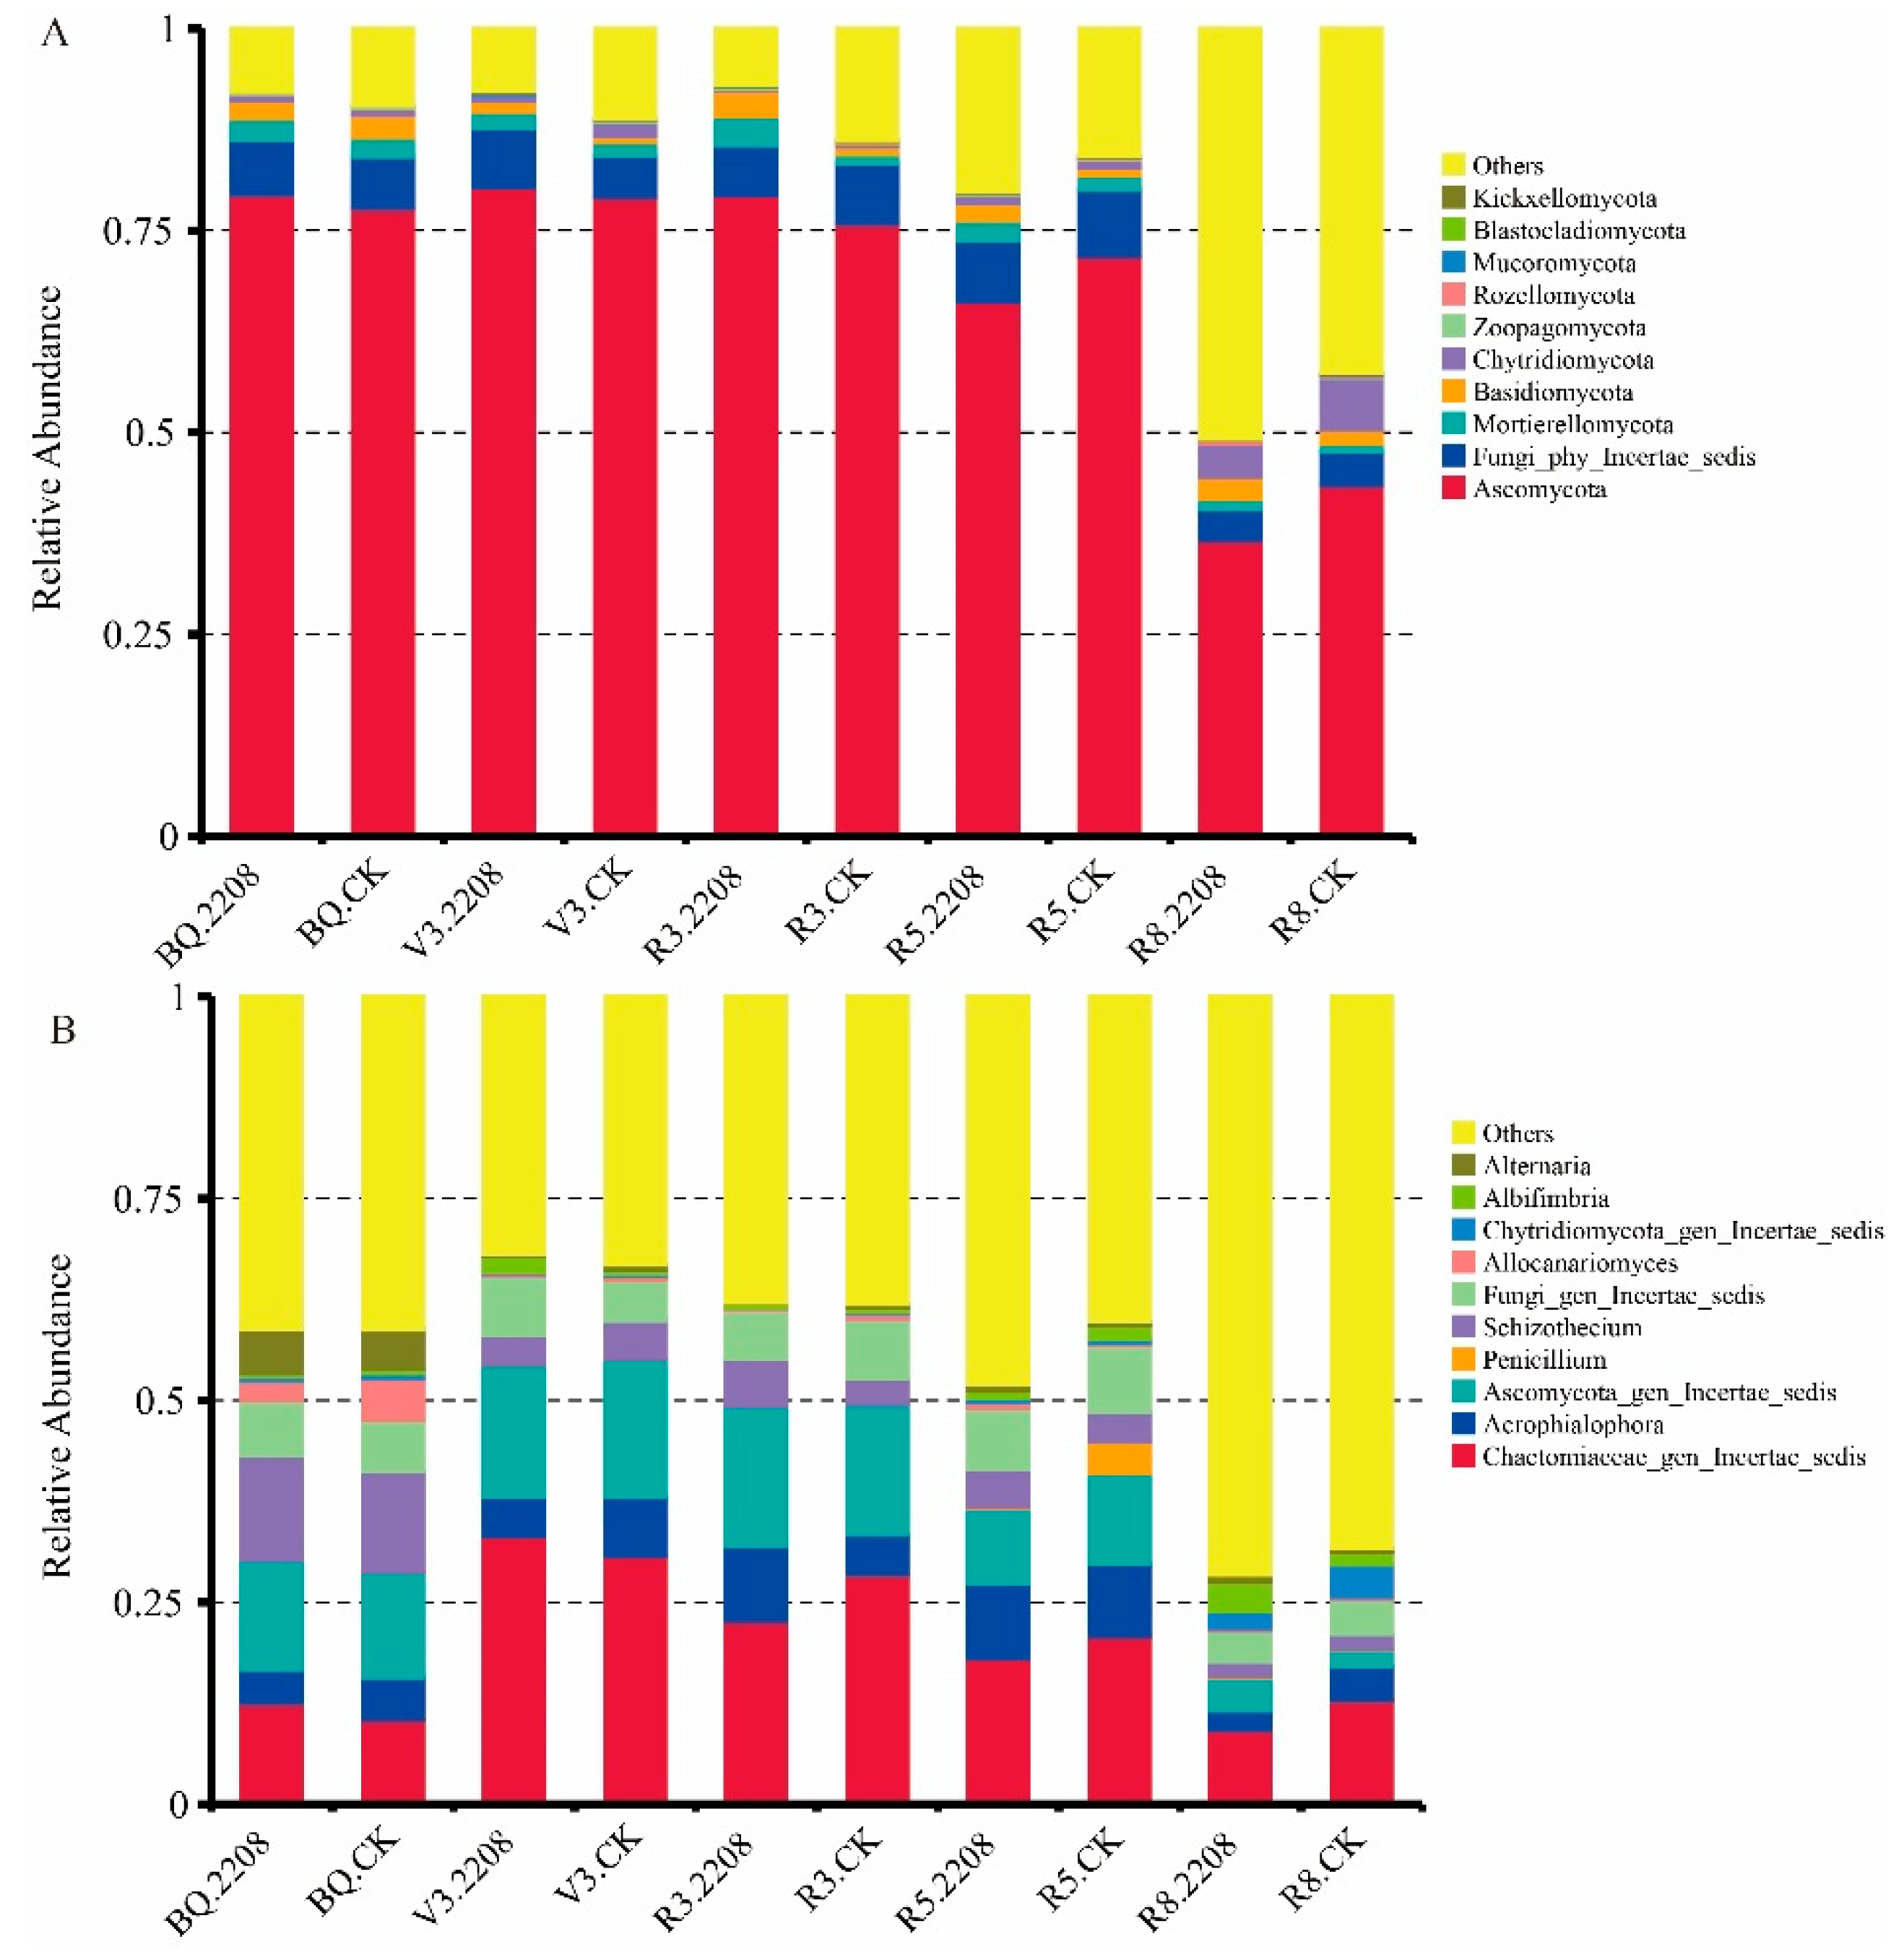
3.5. The Influence of GMO on Microbial Community Structure of Soybean

To characterize the core microbiota associated with the GMO group, we conducted a comprehensive analysis of the taxonomic compositions of their bacterial and fungal communities. Analysis of microbial communities at the phylum level revealed similar compositions between the GMO and CK groups (Figure A3 and Figure A4). The predominant bacterial phyla (Figure A3A) identified were Proteobacteria (29.81%), Acidobacteriota (18.33%), Actinomycetota (18.32%), and Gemmatimonadota (11.78%). A parallel analysis of fungal communities (Fig. A4A) indicated that Ascomycota (68.97%) and Fungi_phy_Incertae_sedis (6.30%) were the dominant phyla. At the genus level, the principal bacterial taxa included Sphingomonas (5.43%), MND1 (2.84%), Streptomyces (0.49%), and Pseudomonas (0.18%) (Fig. A3B). The dominant fungal genera were Acrophialophora (6.05%), Schizothecium (5.47%), Alternaria (1.45%), and Albifimbria (1.21%) (Fig. A4B). According to the Wilcoxon rank sum test, five bacterial dominant phyla, including Pseudomonadota, Acidobacteriota, Thermoproteota, Chloroflexota and Myxococcota showed significant differences between the GMO and CK groups at V3 stage (P < 0.05). Similar results were also found in fungal community, in which Mortierellomycota, Mucoromycota, Kickxellomycota and Fungi_phy_Incertae_sedis showed the differences between the two groups at V3 stages. It’s worth noting that more fungal genus was found sensitive to GMO than bacteria at V3 stage, that Acrophialophora, Schizothecium, Ascomycota_gen_Incertae_sedis, Chytridiomycota_gen_Incertae_sedis and Alternaria were influenced by GMO. This differential analysis of the bacterial and fungal communities suggested that soybean at V3 growth stage were more sensitive to the GMO treatment.

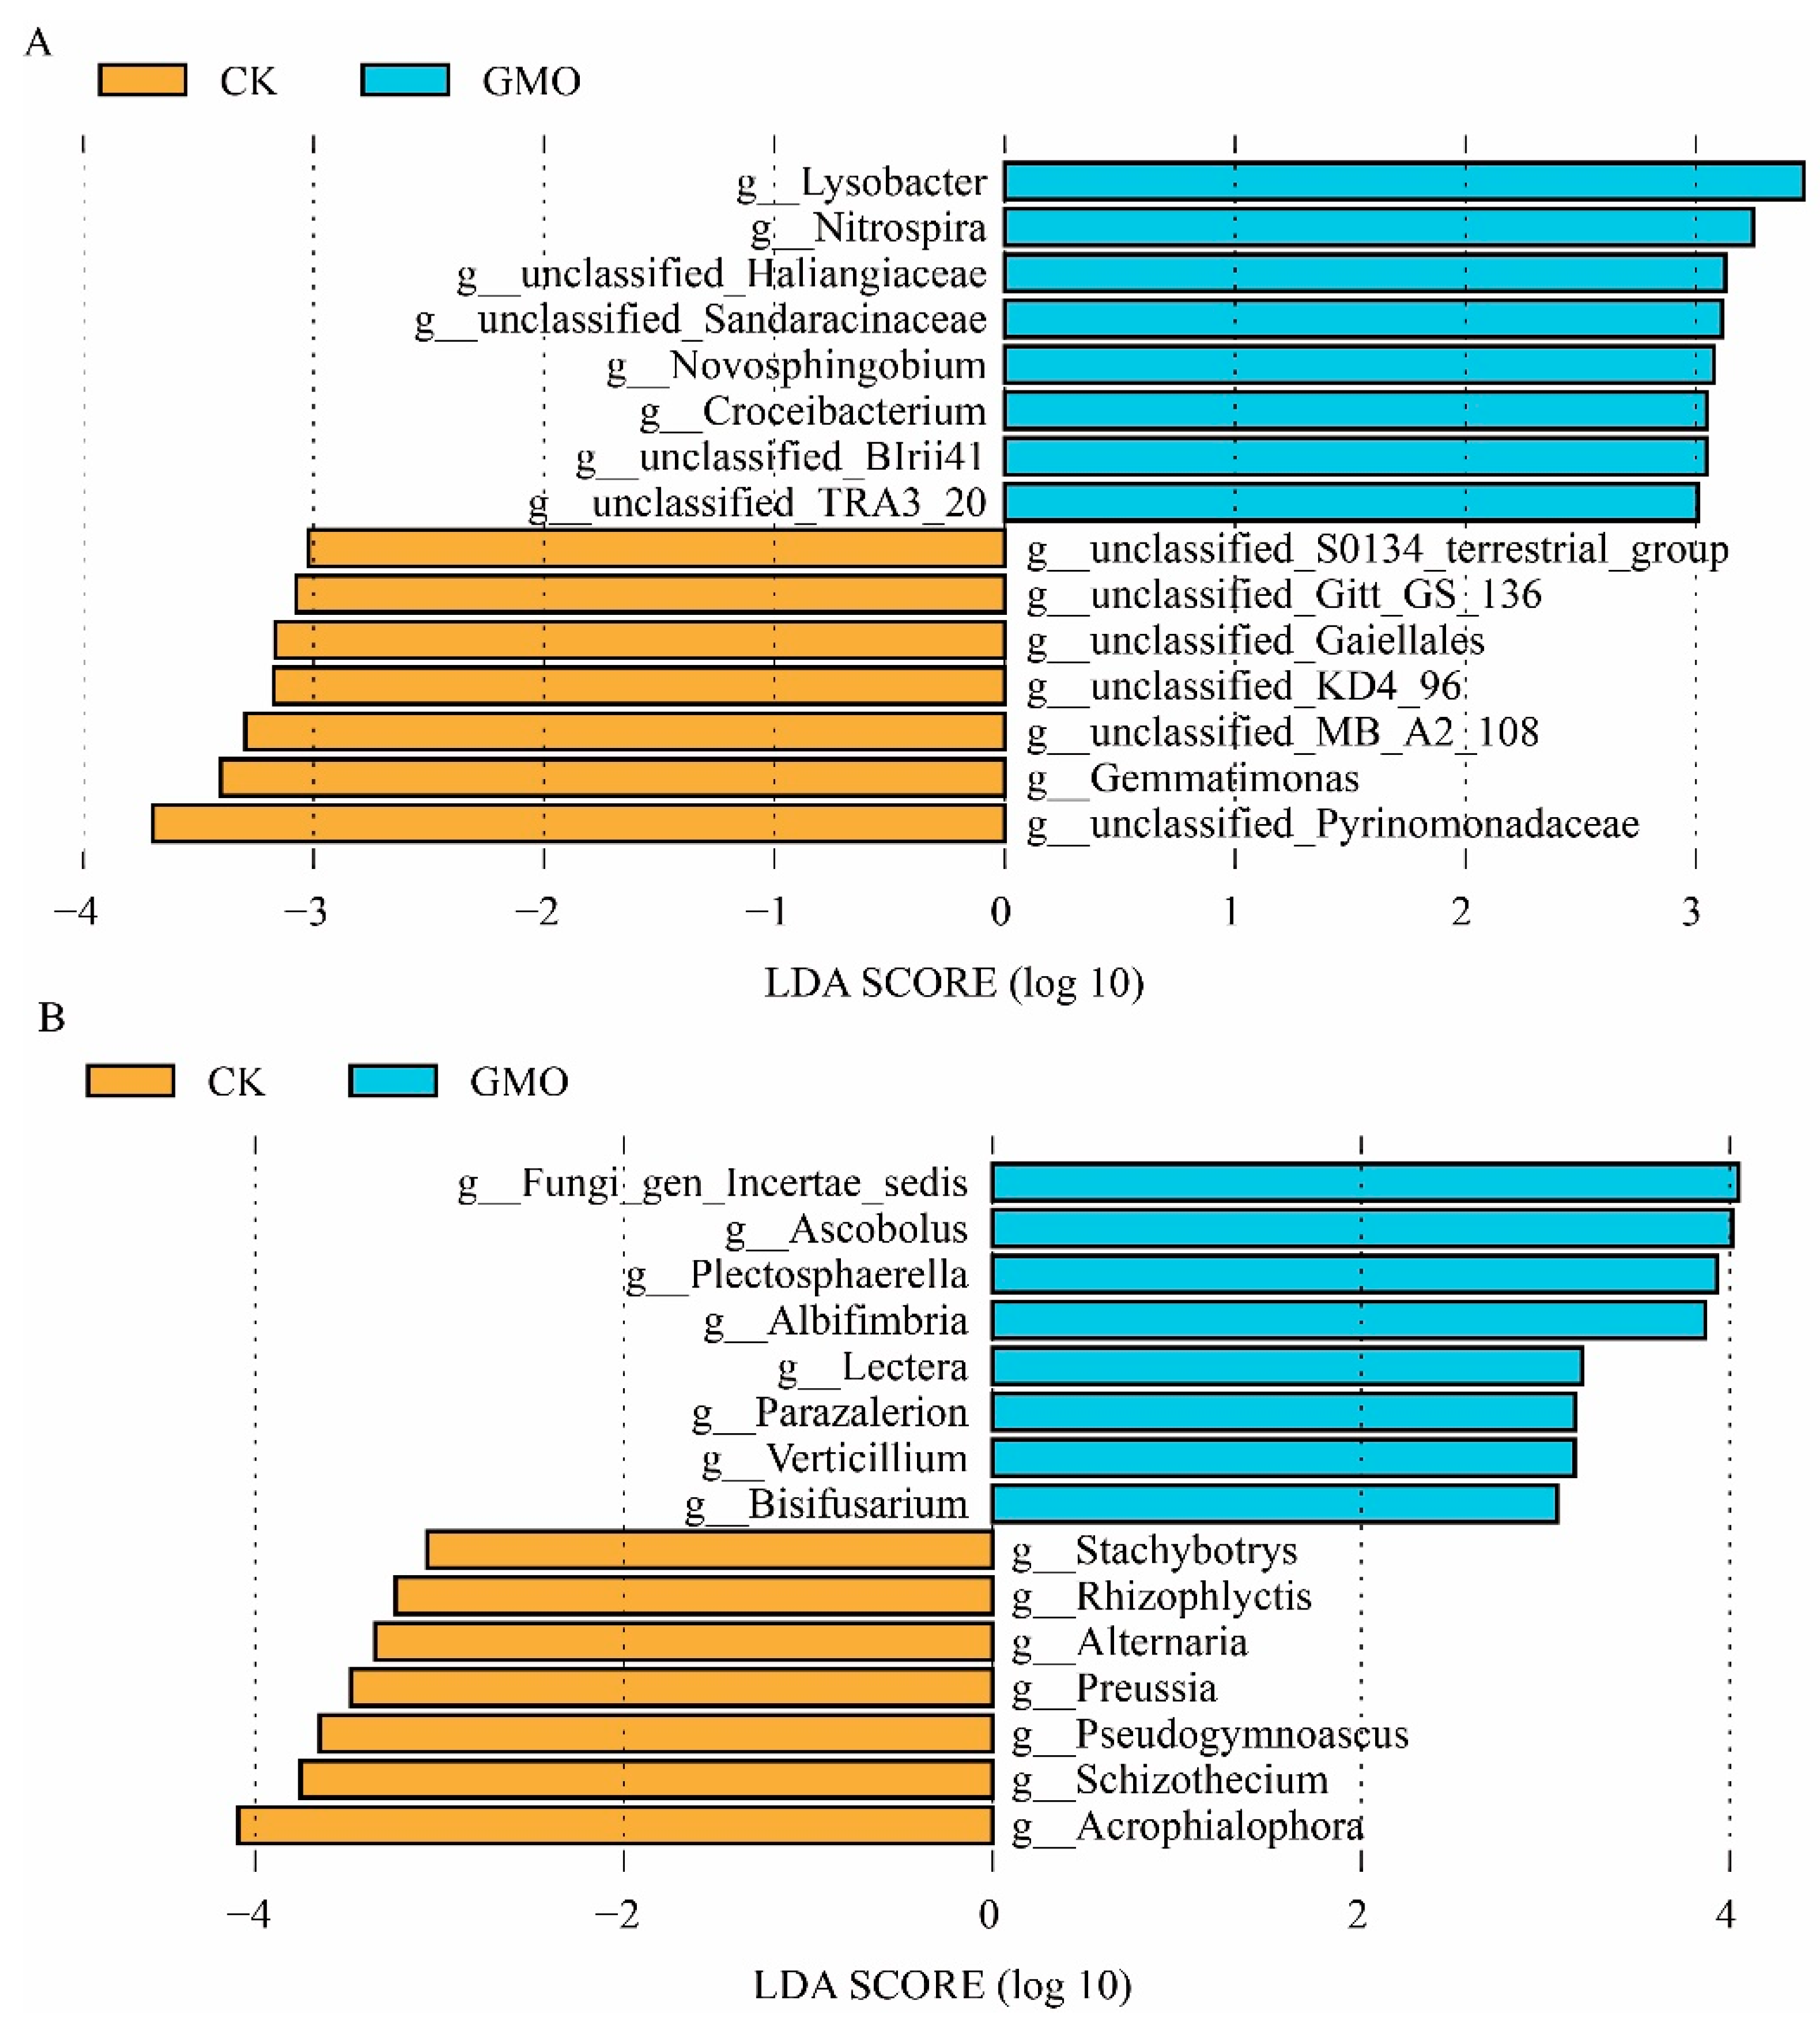
3.6. The Influence of GMO on Microbial Biomarkers of Soybean

Line Discriminant Analysis (LDA) Effect Size (LEfSe) is an analytical technique that integrates the non-parametric Kruskal-Wallis and Wilcoxon rank sum tests with the effect size derived from LDA. This method is employed to identify biomarkers exhibiting statistically significant differences across various groups. Considering that the bacterial and fungal community of soybean at V3 stage were sensitive to GMO, LDA was performed to find the biomarkers related to GMO at V3 stage. As Figure 5A shown, Lysobacter, Nitrospira, Novosphingobium and Croceibacterium could serve as the bacterial genus-level biomarkers for GMO group. As for fungal community, Ascobolus, Plectosphaerella, Albifimbria, Lectera, Parazalerion, Verticillium and Bisifusarium were the biomarkers for GMO group (Figure 5B).

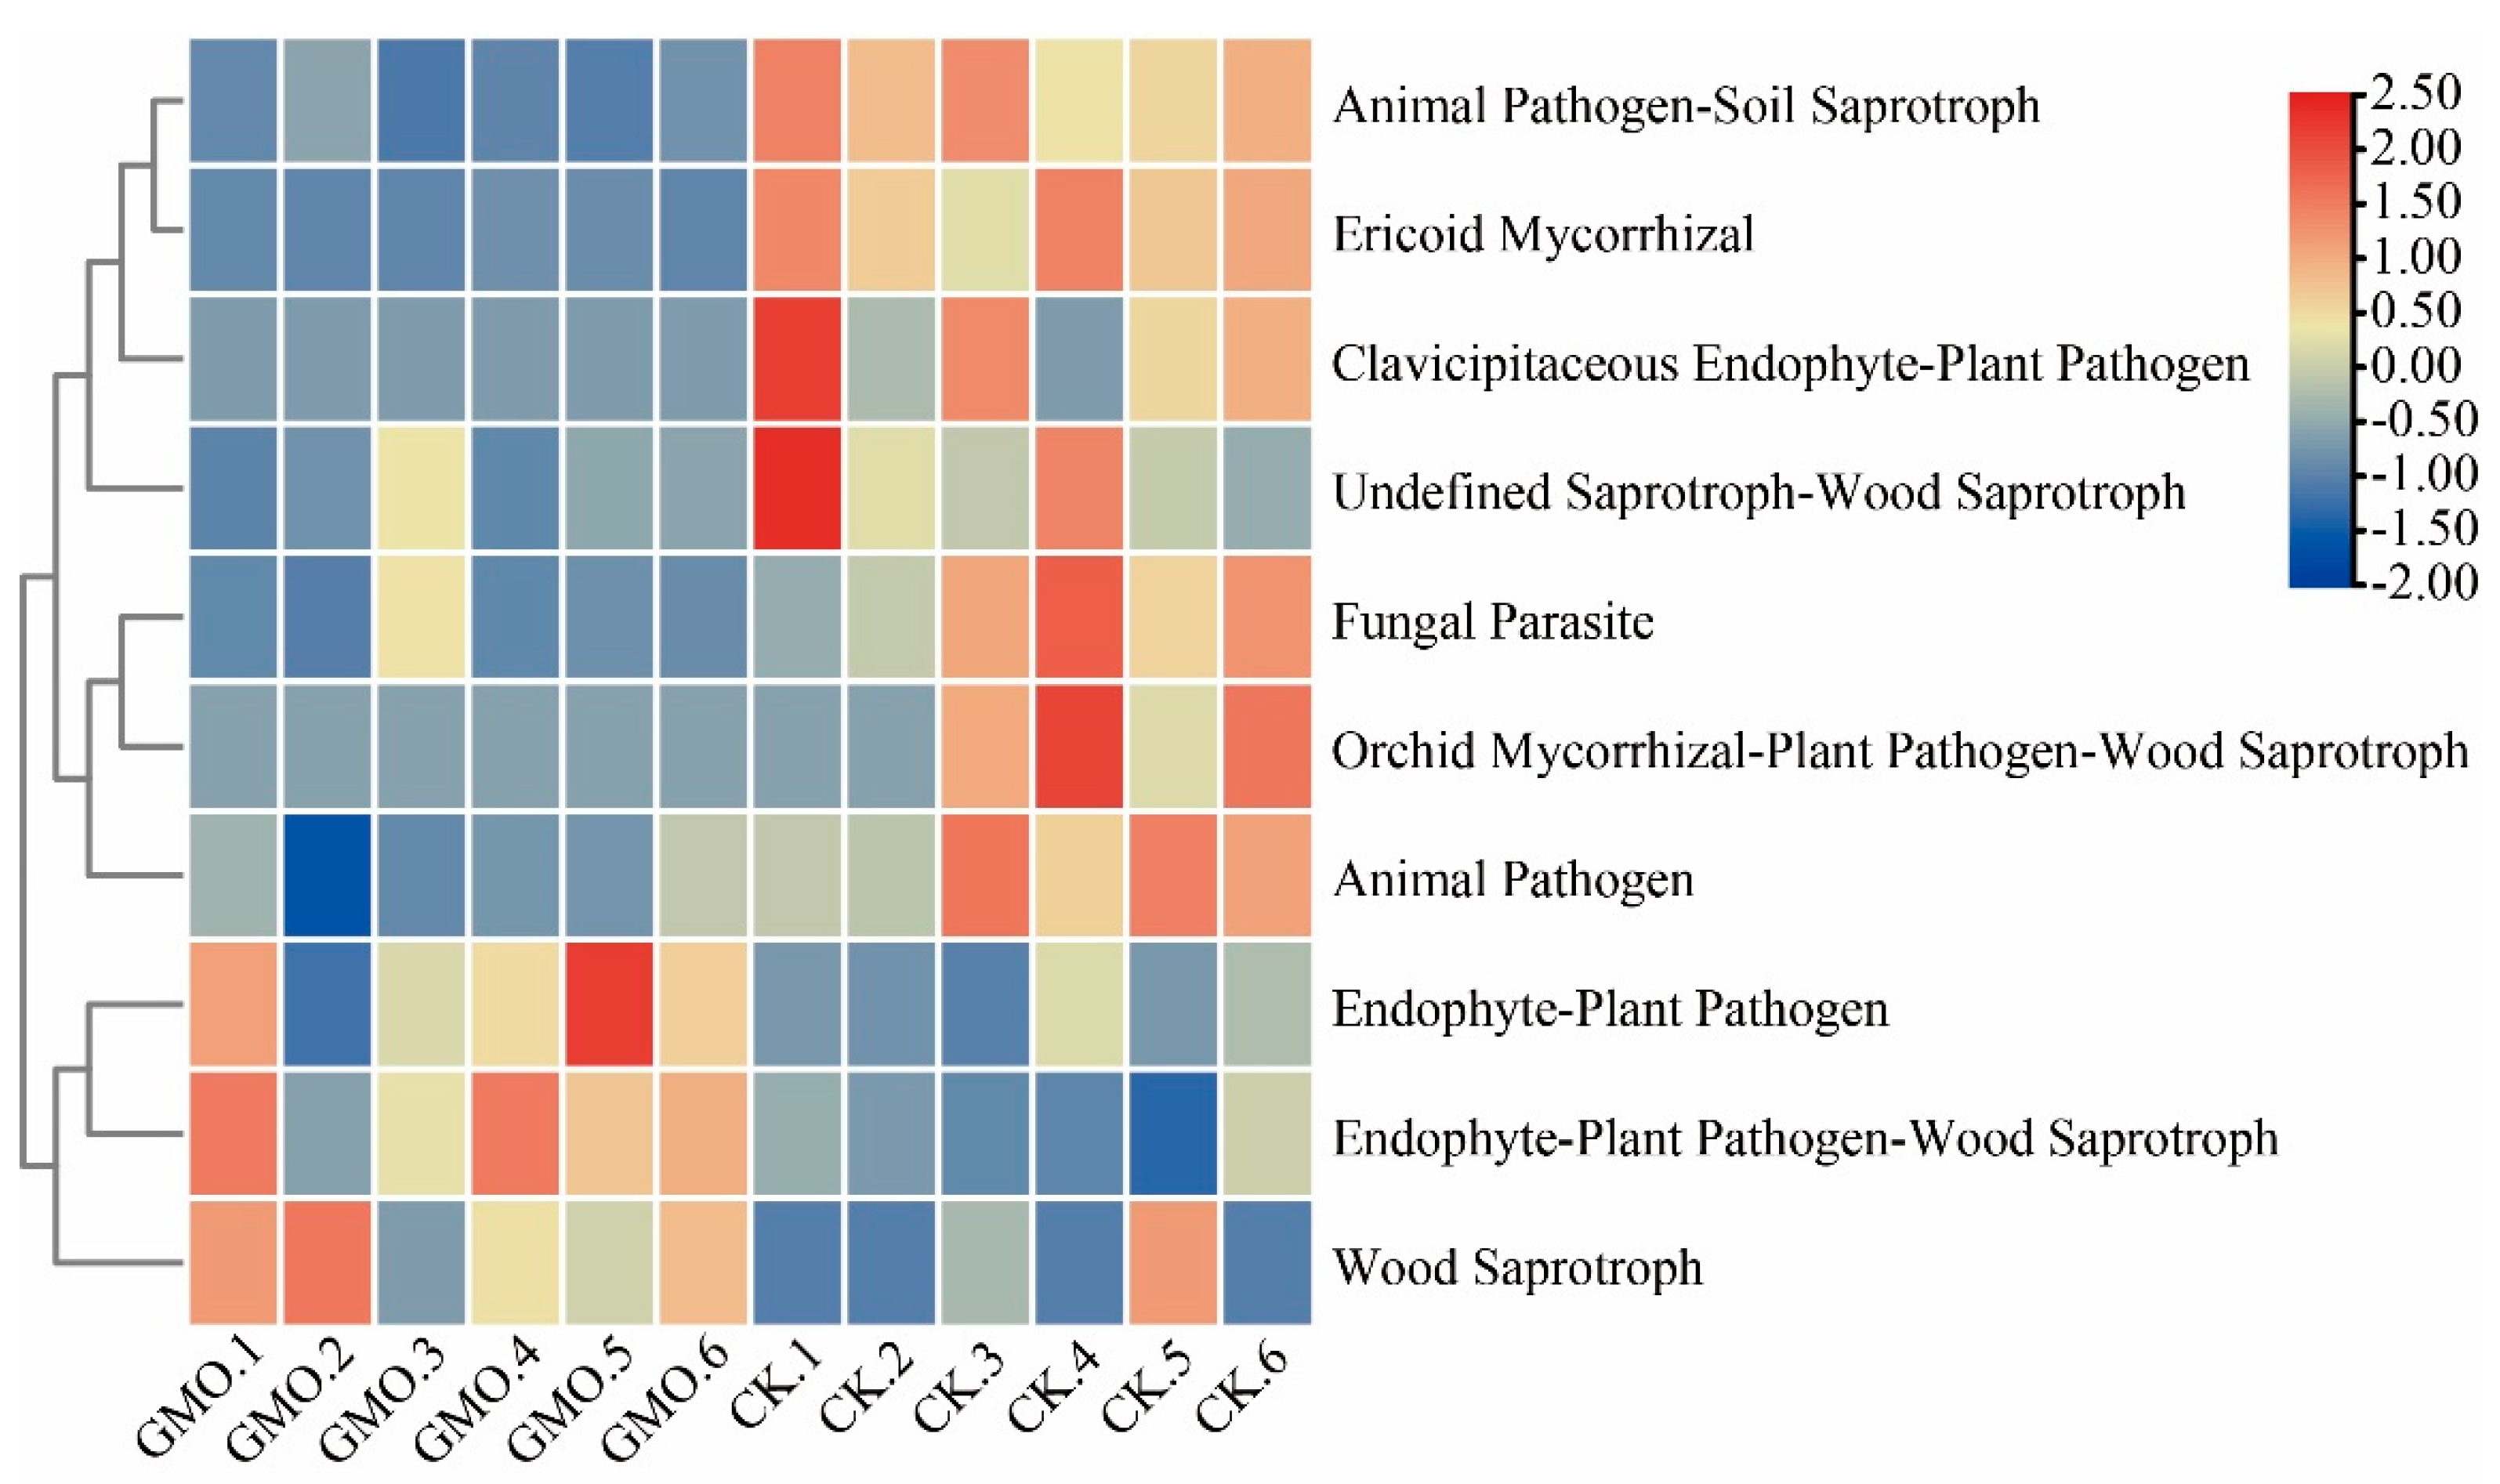
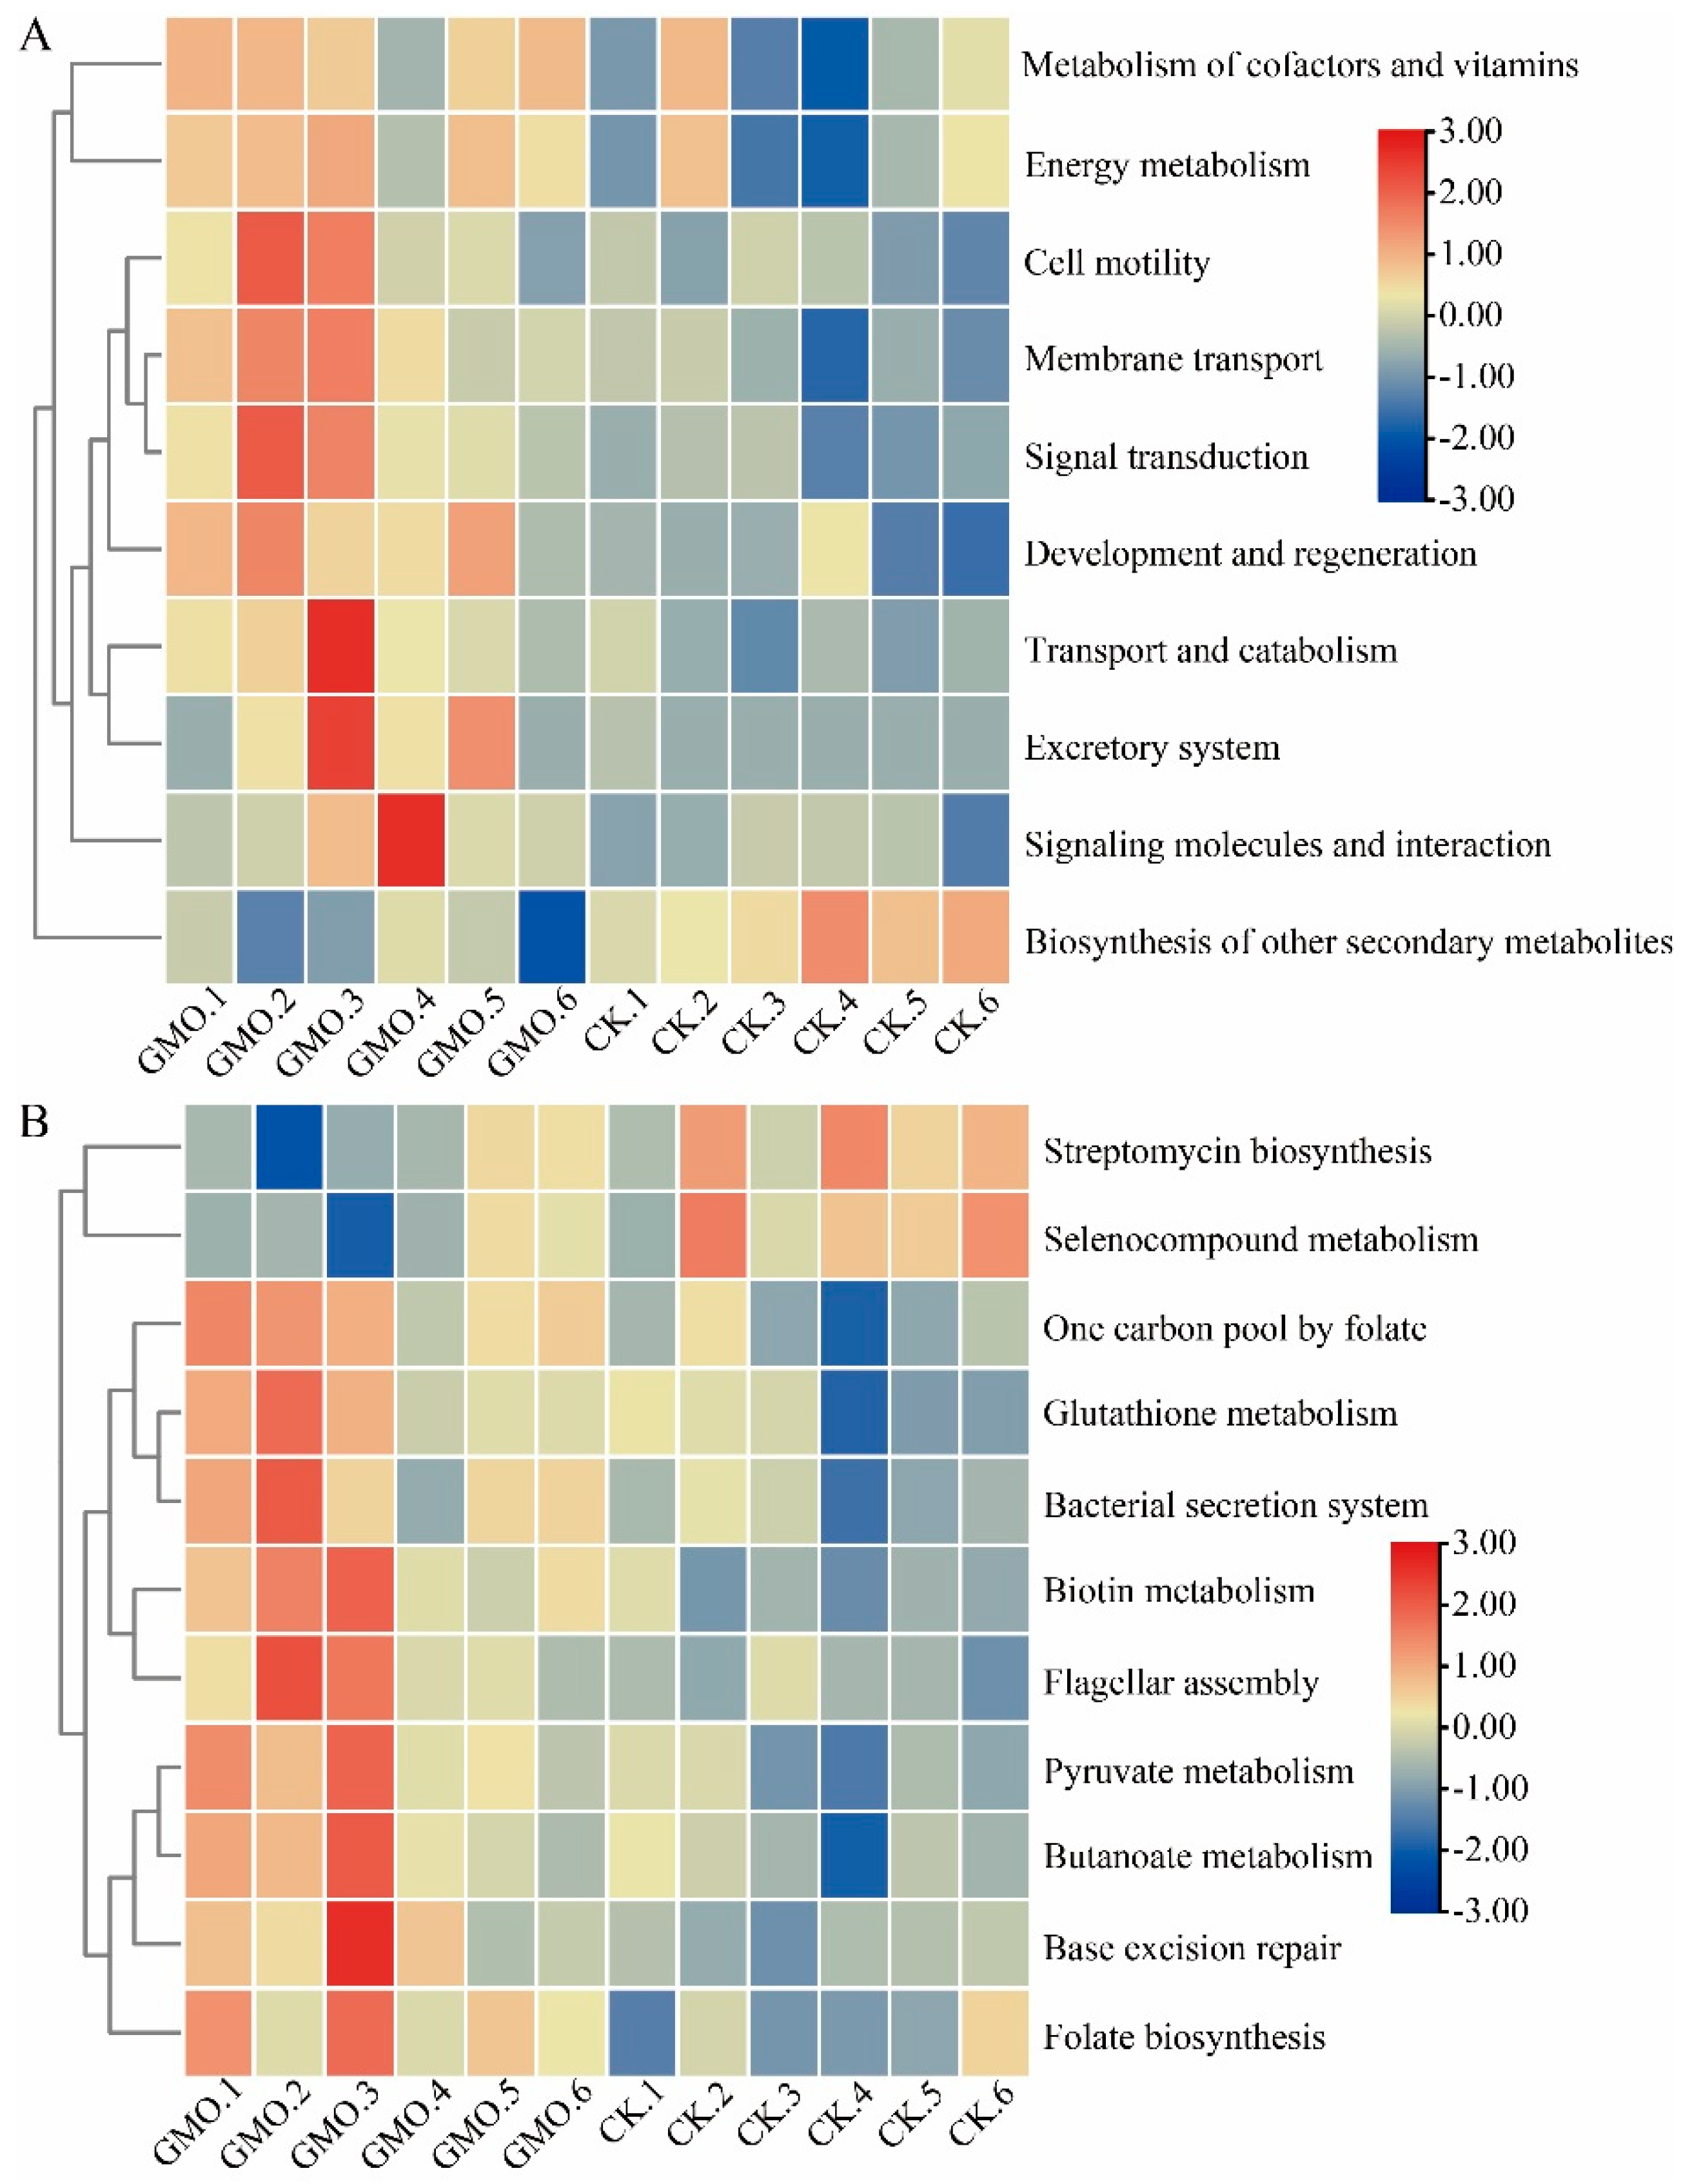
3.7. The Influence of GMO on Microbial Function of Soybean

To explore the functional disparities among microbial groups, we employed PICRUSt2 to predict 16S rRNA gene sequences within the KEGG database. Subsequently, we conducted pairwise significance tests between samples using the Wilcoxon rank sum test. Given that rhizosphere microbiome of soybean at V3 stage, our analysis concentrated on the functional differences between the GMO and CK groups at this juncture. As illustrated in Figure 6A, pathways at level 2 related to metabolism of cofactors and vitamins, energy metabolism, cell motility, membrane transport, signal transduction, development and regeneration, transport and catabolism and energy metabolism were enriched in the GMO group (Figure 6A). Conversely, pathways at level 3 associated with one carbon pool by folate, glutathione metabolism, bacterial secretion system, biotin metabolism, flagellar assembly, pyruvate metabolism, butanoate metabolism, base excision repair and folate biosynthesis were more prevalent in the GMO group (Figure 6B). In addition, the role that fungi play in the ecosystem was predicted based on fungal taxa using FunGuild. Results showed that, at V3 stage of soybean, endophyte-plant pathogen and wood saprotroph were enriched in GMO group (Figure A5).

4. Discussion

This study comprehensively evaluated the temporal impacts of a novel stacked-trait (insect-resistant and herbicide-tolerant) transgenic soybean on the physicochemical properties and microbial communities of the rhizosphere soil. Our multi-stage analysis revealed a nuanced pattern: while the transgenic soybean did induce detectable shifts in specific soil properties and microbiome composition, these effects were largely confined to specific growth stages, most prominently the V3 stages. Furthermore, the influence of the plant’s developmental stage itself exerted a dominant and consistent effect on microbial community assembly, a force that far outweighed the impact of the transgene over the entire growth cycle. These findings align with the growing consensus that the effects of GM crops on soil ecosystems are often subtle, transient, and context-dependent rather than profound and persistent [22,23].

4.1. Stage-Specific Modulation of Rhizosphere Environment and Microbiome

The most pronounced differences between GM and non-GM soybean rhizospheres occurred during the V3 and R3 stages. Significant alterations in soil available nitrogen (EN), organic matter (OM), and total nitrogen (TN) at these stages suggest a potential shift in root exudation patterns or nitrogen uptake efficiency mediated by the transgenic traits. Root exudates are primary drivers of rhizosphere chemistry and microbial recruitment [24]. Modifications in plant physiology due to the expression of cry1Ac, vip3Aa19, mOsPPO2, and pat genes may lead to qualitative or quantitative changes in exudate profiles, particularly during active vegetative growth and reproductive onset, thereby altering nutrient dynamics. This is supported by the concomitant significant shifts in bacterial and fungal community beta-diversity specifically at V3. The identification of specific bacterial (e.g., Lysobacter, Nitrospira) and fungal (e.g., Albifimbria, Verticillium) genera as biomarkers for the GM rhizosphere at V3 further underscores this critical stage. The sensitivity of the V3 stage microbiome is notable; it may represent a key window where the plant microbiome is being established and is most receptive to plant-mediated changes.
The lack of persistent divergence in alpha-diversity (Shannon index) for bacteria and its only sporadic increase for fungi at R5 indicates that the transgene did not fundamentally reduce or enhance microbial species richness in a lasting manner. This is a crucial finding for ecological risk assessment, as sustained loss of diversity could impair ecosystem resilience. The overwhelming separation of samples by growth stage in PCoA for both treatments powerfully demonstrates that plant phenology is the principal factor structuring the rhizosphere microbiome, consistent with studies on conventional and other GM crops [25]. The transgene effect, while statistically significant at certain points, appears as a secondary modulation within this dominant developmental trajectory.

4.2. Functional Implications of Microbial Community Shifts

The predicted profiling (PICRUSt2) at the sensitive V3 stage revealed intriguing functional differences. The enrichment of pathways related to energy metabolism (e.g., pyruvate metabolism, oxidative phosphorylation), membrane transport, and bacterial motility (flagellar assembly) in the GM rhizosphere suggests a potentially more metabolically active or copiotrophic bacterial consortium. This could be a response to altered carbon substrate availability from GM root exudates. Notably, the enrichment of “bacterial secretion system” pathways might indicate shifts in inter-microbial or plant-microbe interactions, possibly linked to competition or symbiosis [26]. For fungi, the FunGuild prediction indicated a higher relative abundance of endophyte-plant pathogen guilds in the GM rhizosphere at V3. It does not necessarily imply increased disease risk but may reflect a shift in the competitive balance within the fungal community [27]. Some endophytic plant pathogenic fungi are highly responsive to root exudate chemistry [28]. The observed change could be a transient ecological rearrangement rather than a proliferation of pathogens. Long-term field studies are needed to assess the agronomic significance of such compositional shifts.

4.3. Ecological Significance and Biosafety Perspective

From an ecological safety standpoint, our results support the hypothesis that the impact of this stacked-trait transgenic soybean on the rhizosphere microbiome is limited and stage-specific. The effects were most detectable during peak vegetative/reproductive activity when root exudation is high, and they diminished or became non-detectable at later stages (R5, R8). This “transient perturbation” model is consistent with numerous studies on single-trait Bt crops, where differences often converge with those of conventional crops at maturity [29]. The fact that the core microbial phyla (e.g., Proteobacteria, Acidobacteriota, Ascomycota) remained dominant and unchanged in both treatments reinforces the stability of the overall community structure.
The significant changes in key soil nutrients (EN, TN) at V3 stage, coupled with the microbial community shifts, suggest that the transgenic plant interacts differently with the soil nutrient cycle during these phases. However, these biochemical differences also did not persist, indicating a resilient soil system that buffers short-term changes. The ecological relevance of these temporary shifts is likely minimal, as they fall within the range of variation caused by standard agricultural practices, plant genotype, and environmental fluctuations [30].

5. Conclusions

In conclusion, our temporal study demonstrates that the cultivation of the investigated stacked-trait transgenic soybean induces significant but transient and stage-specific alterations in the rhizosphere environment, primarily during the V3 growth stages. These alterations manifest as changes in soil nitrogen parameters, shifts in microbial community composition (particularly for fungi), and modulations in predicted microbial functional potential. Crucially, the overarching influence of soybean developmental stage remains the primary driver of microbial community succession, and no sustained negative impact on microbial diversity was observed. The effects documented here appear to represent minor ecological perturbations rather than fundamental, lasting dysbiosis. These findings con-tribute to a more nuanced understanding of the interactions between complex transgenic plants and soil ecosystems, supporting the view that their environmental impact is con-text-dependent and should be evaluated across the entire crop life cycle.

Author Contributions

L.X.B designed the study. Y.S.K. carried out the molecular and genetic experiments. S. X. performed the data analyses. S.X. drafted the manuscript, and L.X.B revised the manuscript. All authors read and approved the contents of this paper.

Funding

This research was supported by the Biological Breeding-Major Projects (2023ZD04062), the Agricultural Variety Improvement Project of Shandong Province (2024LZGC010) and Shan-dong Province Natural Science Foundation Young Project (ZR2021QC207).

Institutional Review Board Statement

Not applicable.

Informed Consent Statement

Not applicable.

Data Availability Statement

Sequencing data in this study can be found in the open repository Zenodo (https://doi.org/10.5281/zenodo.17938657).

Conflicts of Interest

The authors declare no conflicts of interest.

Appendix A

Figure A1. Rarefaction curves of 16S (A) and ITS (B) samples. Different colored curves correspond to different samples.
Preprints 190345 g0a1
Figure A2. Principal coordinates analysis (PCoA) of bacterial (A) and fungal (B) communities based on Bray–Curtis distances among the five stages. Significant differences among the groups were determined using PERMANOVA (n=60).
Preprints 190345 g0a2
Figure A3. Relative abundance of the dominant bacterial phylum(A) and genus (B) genus between GMO and CK groups among the 5 stages.
Preprints 190345 g0a3
Figure A4. Relative abundance of the dominant fungal phylum(A) and genus (B) genus between GMO and CK groups among the 5 stages.
Preprints 190345 g0a4
Figure A5. Metabolic pathway difference analysis diagram of the fungal community between GMO and CK groups.
Preprints 190345 g0a5

References

  1. Council, N.R.; Plants, C.O.G.M.P.-P. enetically modified pest-protected plants: science and regulation, (2000).
  2. Yang, X.; Chen, S.; Liu, D.; Zhao, S.; Kang, G.; Song, C.; Tian, Z.; Li, H.; Chen, J.; Li, X.; et al. Insect resistant and glyphosate tolerant maize, Bt11 × MIR162 × GA21, can enhance management of fall armyworm and weeds in tropical Asia. Èntomol. Gen. 2024. [Google Scholar] [CrossRef]
  3. Ricroch, A.E.; Martin-Laffon, J.; Rault, B.; Pallares, V.C.; Kuntz, M. Next biotechnological plants for addressing global challenges: The contribution of transgenesis and new breeding techniques. New Biotechnol. 2022, 66, 25–35. [Google Scholar] [CrossRef]
  4. Chen, Q.; Song, Y.; An, Y.; Lu, Y.; Zhong, G. Soil Microorganisms: Their Role in Enhancing Crop Nutrition and Health. Diversity 2024, 16, 734. [Google Scholar] [CrossRef]
  5. Snelders, N.C.; Rovenich, H.; Thomma, B.P.H.J. Microbiota manipulation through the secretion of effector proteins is fundamental to the wealth of lifestyles in the fungal kingdom. FEMS Microbiol. Rev. 2022, 46. [Google Scholar] [CrossRef]
  6. Sun, K.; Niu, Z.; Xiao, S.; Qi, X.; Li, S.; Chen, M.; Dai, L.; Si, Y. Artificially regulated humification in creating humic-like biostimulators. npj Clean Water 2024, 7, 47. [Google Scholar] [CrossRef]
  7. Bano, S.; Wu, X.; Zhang, X. Towards sustainable agriculture: rhizosphere microbiome engineering. Appl. Microbiol. Biotechnol. 2021, 105, 7141–7160. [Google Scholar] [CrossRef] [PubMed]
  8. Yang, Z.; Duan, Y.; Wei, R.; Yuan, Y.; Yan, H.; Tang, T.; Shang, H. Rhizosphere Microbiome and Nutrient Fluxes Reveal Subtle Biosafety Signals in Transgenic Cotton. Microorganisms 2025, 13, 2702. [Google Scholar] [CrossRef]
  9. Sharma, B.; Sharma, K.; Sharma, P.; Gupta, I.; Kour, J.; Kour, K. Genetically modified maize. In Genetically Modified Crops and Food Security; Routledge, 2022; pp. 85–96. [Google Scholar]
  10. Lynch, J.M.; Benedetti, A.; Insam, H.; Nuti, M.P.; Smalla, K.; Torsvik, V.; Nannipieri, P. Microbial diversity in soil: ecological theories, the contribution of molecular techniques and the impact of transgenic plants and transgenic microorganisms. Biol. Fertil. Soils 2004, 40, 363–385. [Google Scholar] [CrossRef]
  11. Caporaso, J.G.; Kuczynski, J.; Stombaugh, J.; Bittinger, K.; Bushman, F.D.; Costello, E.K.; Fierer, N.; Gonzalez Peña, A.; Goodrich, J.K.; Gordon, J.I.; et al. QIIME allows analysis of high-throughput community sequencing data. Nat. Methods 2010, 7, 335–336. [Google Scholar] [CrossRef] [PubMed]
  12. Zhou, Y.; Liu, Y.; Li, X. USEARCH 12: Open-source software for sequencing analysis in bioinformatics and microbiome. iMeta 2024, 3, e236. [Google Scholar] [CrossRef] [PubMed]
  13. Wingett, S.W.; Andrews, S. FastQ Screen: A tool for multi-genome mapping and quality control. F1000Research 2018, 7, 1338. [Google Scholar]
  14. Bolger, A.M.; Lohse, M.; Usadel, B. Trimmomatic: A flexible trimmer for Illumina sequence data. Bioinformatics 2014, 30, 2114–2120. [Google Scholar] [CrossRef]
  15. R. Santos, Silva, FNO, Fernandes, AM, Teixeira, FG, Soto, DAS, Brito, CJ, & Miarka, B. 2022.
  16. Kõljalg, U.; Larsson, K.-H.; Abarenkov, K.; Nilsson, R.H.; Alexander, I.J.; Eberhardt, U.; Erland, S.; Høiland, K.; Kjøller, R.; Larsson, E.; et al. UNITE: a database providing web-based methods for the molecular identification of ectomycorrhizal fungi. New Phytol. 2005, 166, 1063–1068. [Google Scholar] [CrossRef] [PubMed]
  17. de Micheaux, P.L.; Drouilhet, R.; Liquet, B. The R software. Fundamentals of programming and statistical analysis 2013, 978–971. [Google Scholar]
  18. Oksanen, J.; Blanchet, F.G.; Kindt, R.; Legendre, P.; Minchin, P.R.; O’hara, R.; Simpson, G.L.; Solymos, P.; Stevens, M.H.H.; Wagner, H. Package ‘vegan’, Community ecology package; version 2, 2013, 1-295.
  19. Wickham, H.; Wickham, M.H. Package tidyverse, Easily install and load the ‘Tidyverse; 2017. [Google Scholar]
  20. Douglas, G.M.; Maffei, V.J.; Zaneveld, J.R.; Yurgel, S.N.; Brown, J.R.; Taylor, C.M.; Huttenhower, C.; Langille, M.G.I. PICRUSt2 for prediction of metagenome functions. Nat. Biotechnol. 2020, 38, 685–688. [Google Scholar] [CrossRef] [PubMed]
  21. Nguyen, N.H.; Song, Z.; Bates, S.T.; Branco, S.; Tedersoo, L.; Menke, J.; Schilling, J.S.; Kennedy, P.G. FUNGuild: An open annotation tool for parsing fungal community datasets by ecological guild. Fungal Ecol. 2016, 20, 241–248. [Google Scholar] [CrossRef]
  22. Lehman, R.M.; Cambardella, C.A.; Stott, D.E.; Acosta-Martinez, V.; Manter, D.K.; Buyer, J.S.; Maul, J.E.; Smith, J.L.; Collins, H.P.; Halvorson, J.J.; et al. Understanding and Enhancing Soil Biological Health: The Solution for Reversing Soil Degradation. Sustainability 2015, 7, 988–1027. [Google Scholar] [CrossRef]
  23. Khan, N. Decoding the long-term impacts of genetic modifications in hormone pathways on plant physiology and ecosystem stability. Environ. Rev. 2025, 33, 1–20. [Google Scholar] [CrossRef]
  24. Zhalnina, K.; Louie, K.B.; Hao, Z.; Mansoori, N.; da Rocha, U.N.; Shi, S.; Cho, H.; Karaoz, U.; Loqué, D.; Bowen, B.P.; et al. Dynamic root exudate chemistry and microbial substrate preferences drive patterns in rhizosphere microbial community assembly. Nat. Microbiol. 2018, 3, 470–480. [Google Scholar] [CrossRef] [PubMed]
  25. Ajilogba, C.F.; Olanrewaju, O.S.; Babalola, O.O. Plant Growth Stage Drives the Temporal and Spatial Dynamics of the Bacterial Microbiome in the Rhizosphere of Vigna subterranea. Front. Microbiol. 2022, 13, 825377. [Google Scholar] [CrossRef]
  26. Trivedi, P.; Leach, J.E.; Tringe, S.G.; Sa, T.; Singh, B.K. Plant–microbiome interactions: From community assembly to plant health. Nat. Rev. Microbiol. 2020, 18, 607–621. [Google Scholar] [CrossRef] [PubMed]
  27. Zhao, C.; Onyino, J.; Gao, X. Current Advances in the Functional Diversity and Mechanisms Underlying Endophyte–Plant Interactions. Microorganisms 2024, 12, 779. [Google Scholar] [CrossRef] [PubMed]
  28. Baetz, U.; Martinoia, E. Root exudates: the hidden part of plant defense. Trends Plant Sci. 2014, 19, 90–98. [Google Scholar] [CrossRef] [PubMed]
  29. Icoz, I.; Stotzky, G. Fate and effects of insect-resistant Bt crops in soil ecosystems. Soil Biol. Biochem. 2008, 40, 559–586. [Google Scholar] [CrossRef]
  30. Dyer, A.R.; Knapp, E.E.; Rice, K.J. Unintentional Selection and Genetic Changes in Native Perennial Grass Populations During Commercial Seed Production. Ecol. Restor. 2016, 34, 39–48. [Google Scholar] [CrossRef]
Figure 1. Shannon diversity index (SDI) of bacterial (A) and fungal communities (B). Along the x-axis, 2208 represented the transgenic soybean KM2208-23.
Preprints 190345 g001
Figure 2. Shannon diversity index (SDI) of bacterial GMO(A), CK (B) and fungal GMO (C), CK (D) communities. Different letters indicate significant differences (ordinary one-way ANOVA test, P < 0.05).
Preprints 190345 g002
Figure 3. Principal coordinates analysis (PCoA) of bacterial (A) and fungal (B) communities based on Bray–Curtis distances among the five stages. Significant differences among the groups were determined using PERMANOVA (n=12).
Preprints 190345 g003
Figure 4. Principal coordinates analysis (PCoA) of bacterial GMO (A), bacterial CK (B), fungal GMO (C) and fungal CK (D) communities based on Bray–Curtis distances among the five stages. Significant differences among the groups were determined using PERMANOVA (n=32).
Preprints 190345 g004
Figure 5. Biomarkers of bacterial (A) and fungal (B) community were identified by LEfSe (LDA> 3) between GMO and the CK groups at V3 stage.
Preprints 190345 g005
Figure 6. Inter-group KEGG metabolic pathway difference analysis diagram at level 2 (A) and level 3 (B).
Preprints 190345 g006
Table 1. Changes in the physicochemical properties of the rhizosphere soil of GMO and CK group at five growth stages.
Indexes Groups BQ V3 R3 R5 R8
TK
(g/Kg)
GMO 22.70±1.68a 19.27±0.54a 19.77±0.70a 19.82±1.07a 19.68±0.26a
CK 20.08±0.67b 20.05±0.64a 20.43±0.63a 20.20±0.76a 19.87±0.58a
AK
(mg/Kg)
GMO 914.00±52.29a 1012.50±51.72a 1055.83±58.37a 1002.00±100.73a 1013.00±36.3a
CK 946.67±41.97a 1024.83±62.23a 1056.00±48.43a 1064.00±55.17a 996.17±38.97a
EN
(mg/Kg)
GMO 162.00±42.09a 128.43±21.92a 95.03±9.29a 103.33±22.82a 92.77±16.81a
CK 182.33±43.28a 111.90±15.8b 114.15±16.8b 100.75±23.48a 100.35±18.05a
pH GMO 7.35±0.14a 6.97±0.19a 7.37±0.27a 7.00±0.18b 7.12±0.08b
CK 7.42±0.04a 7.38±0.26a 7.62±0.15a 7.62±0.33a 7.68±0.19a
OM
(g/Kg)
GMO 19.98±0.71a 17.77±0.69b 16.85±0.78b 18.38±0.83a 20.33±1.66a
CK 19.88±0.53a 18.95±0.32a 20.28±2.36a 19.47±1.34a 19.18±1.99a
TP
(g/Kg)
GMO 0.72±0.31a 1.32±0.02a 1.29±0.06a 1.32±0.1a 1.33±0.07a
CK 1.31±0.04a 1.26±0.07a 1.38±0.06a 1.24±0.11a 1.26±0.15a
AP
(mg/Kg)
GMO 152.67±7.34a 150.83±11.63a 125.00±9.14b 125.17±14.11a 130.83±15.16a
CK 144.5±11.84a 137.83±14.41a 136.17±5.64a 115.83±17.99a 118.33±12.27a
TN
(%)
GMO 0.15±0.00a 0.13±0.00b 0.12±0.00b 0.13±0.00a 0.14±0.01a
CK 0.15±0.00a 0.14±0.00a 0.14±0.01a 0.14±0.01a 0.14±0.01a
1Wilcoxon rank sum test was used to test for the significant difference between the two groups. The same letters indicate that there is no significant difference between the two groups (P > 0.05, n = 60).
Disclaimer/Publisher’s Note: The statements, opinions and data contained in all publications are solely those of the individual author(s) and contributor(s) and not of MDPI and/or the editor(s). MDPI and/or the editor(s) disclaim responsibility for any injury to people or property resulting from any ideas, methods, instructions or products referred to in the content.
Copyright: This open access article is published under a Creative Commons CC BY 4.0 license, which permit the free download, distribution, and reuse, provided that the author and preprint are cited in any reuse.
Prerpints.org logo

Preprints.org is a free preprint server supported by MDPI in Basel, Switzerland.

Subscribe

Disclaimer

Terms of Use

Privacy Policy

Privacy Settings

© 2026 MDPI (Basel, Switzerland) unless otherwise stated