
Submitted:
17 December 2025
Posted:
18 December 2025
You are already at the latest version
Abstract
Obesity is a multidimensional condition characterized by autonomic imbalance, reduced metabolic inflexibility, impaired physical resilience, and ectopic adiposity, pathophysiological alterations that arise long before overt cardiometabolic disease becomes clinically detectable. Despite this, current cardiometabolic risk scores continue to rely predominantly on biochemical and anthropometric variables, such as BMI, waist circumference, glucose, and lipid levels. While these markers are practical, inexpensive, and validated across large population cohorts, growing evidence shows that they offer limited incremental predictive value and fail to capture early functional and structural abnormalities. Recent literature highlights the prognostic importance of autonomic dysfunction, reduced metabolic flexibility, diminished cardiorespiratory fitness, impaired muscular strength, and ectopic fat depots including visceral and epicardial adiposity, independently of the traditional anthropometric indices. The domains remain absent from traditional algorithms such as the Metabolic Syndrome criteria, the Framingham Risk Score, and SCORE2. As a result, cardiometabolic risk is frequently underestimated in key subgroups, including young adults with obesity, individuals with high visceral adiposity but normal BMI, those with subclinical myocardial dysfunction, and metabolically unhealthy normal-weight phenotypes. This narrative review synthesizes current evidence on the multidimensional nature of obesity-related cardiometabolic impairment, identifies major gaps in established risk scores, and supports the conceptual development of the C.O.R.E. (Cardio-Obesity Risk Evaluation) Indicator Model, a proposed multidomain framework integrating autonomic, metabolic, functional, and structural markers to enable earlier and more accurate cardiometabolic risk stratification.
Keywords:
obesity
; cardiometabolic risk assessment
; autonomic dysfunction
; heart rate variability
; metabolic flexibility
; epicardial adipose tissue
; visceral adiposity
; functional capacity
; multidomain risk stratification
; preventive cardiology
1. Introduction
Obesity represents one of the most relevant and rapidly growing public health challenges worldwide [1,2]. While excessive caloric intake remains a central driver of weight gain [3], modern sedentary behaviors, occupational inactivity, and lifestyle changes significantly contribute to its global rise [4]. Socioeconomic and environmental conditions further modulate obesity risk through gene–environment interactions and possible epigenetic mechanisms [5].
Obesity, defined as an abnormal or excessive accumulation of adipose tissue that impairs health, is characterized not only by increased fat mass but also by profound adipose tissue dysfunction. In individuals with obesity, this dysfunction promotes chronic low-grade inflammation, dysregulated adipokine secretion, and neurohormonal activation—processes that are strongly implicated in cardiovascular disease (CVD), particularly in the development of cardiac damage, and in multiple obesity-related comorbidities [6]. Structural and functional cardiac alterations are common and vary across obesity classes [7]. Despite the frequent preservation of left ventricular ejection fraction, advanced imaging modalities have revealed subclinical myocardial dysfunction in a substantial proportion of obese patients, with impaired myocardial strain [8], increased left ventricular mass, elevated diastolic filling pressures [9,10] and left atrial enlargement [11,12]. Obesity also affects myocardial substrate utilization, shifting energy production toward increased fatty acid oxidation and reduced glucose oxidation, which impairs cardiac efficiency and contributes to heart failure development [13]. Moreover, epicardial adipose tissue (EAT) has emerged as a metabolically active organ capable of influencing cardiac structure and electrophysiology, particularly in the context of atrial fibrillation (AF), through inflammation, oxidative stress, fibrosis, and myocardial fat infiltration [14].
Additionally, the chronic inflammatory and pro-thrombotic milieu characteristic of obesity contributes to coronary atherosclerotic damage, to atrial myopathy and increased thromboembolic risk, which is often underestimated in clinical practice [15].
Taken together, these findings highlight the complex and multidimensional nature of cardiometabolic impairment in obesity, to coronary atherosclerotic damage [16,17,18]. However, current cardiometabolic risk scores insufficiently capture these early functional and anatomical alterations, as they rely predominantly on biochemical or anthropometric variables.
This gap underscores the need for integrated, multidomain tools capable of assessing cardiometabolic risk from a functional, autonomic, and structural perspective, providing the conceptual foundation for the C.O.R.E. (Cardio-Obesity Risk Evaluation) framework proposed in this narrative review.
2. Limitations of Current Cardiometabolic Risk Scores
Despite significant progress in the prevention and management of metabolic and cardiovascular diseases, current cardiometabolic risk scores remain largely grounded in static biochemical and anthropometric measures. Variables such as BMI, waist circumference (WC), fasting glucose, and lipid profiles form the basis of most risk stratification systems, including the Metabolic Syndrome criteria, the Framingham Risk Score, SCORE2, and other widely adopted prediction algorithms [19]. However, as as recently published elsewhere, these traditional markers, although valuable for population-level risk estimation, offer limited incremental predictive value when combined with standard clinical variables and fail to capture early alterations that occur long before overt cardiometabolic disease becomes clinically apparent [20]. Specifically, current models do not incorporate key dimensions such as autonomic imbalance, metabolic inflexibility, impaired physical resilience, and structural adiposity, all of which are central to the pathophysiology of obesity-related cardiometabolic dysfunction.
As a result, traditional risk scores to categorize cardiometabolic risk in an overly simplistic manner and to underestimate cardiometabolic risk in several clinical subgroups, including young adults with obesity, individuals with high visceral adiposity but normal BMI, patients with subclinical cardiac dysfunction, and metabolically unhealthy normal-weight individuals. These gaps underscore the limitations of static, phenotype-based tools and highlight the need for multidomain assessment frameworks capable of capturing the dynamic and multidimensional nature of cardiometabolic impairment.
Traditional Risk Markers: Strengths and Limitations
Classical cardiometabolic markers continue to represent the backbone of risk assessment owing to several well-recognized strengths [21]. These measures—including BMI, WC, blood pressure, fasting glucose, and lipid profiles—are inexpensive, easily obtained during routine clinical evaluations, and widely applicable across diverse healthcare settings [22]. Their predictive capacity is supported by extensive epidemiological research, with consistent associations between traditional markers and long-term cardiovascular morbidity and mortality [23]. Because of their simplicity, reproducibility, and strong epidemiological grounding, these parameters remain integral to public health strategies and primary prevention frameworks [24].
Despite these advantages, traditional cardiometabolic markers exhibit important limitations, particularly in the early detection of cardiometabolic dysfunction. Most existing risk scores—including the Metabolic Syndrome criteria, the Framingham Risk Score, and SCORE2—are based on static biochemical and anthropometric variables and therefore fail to capture the dynamic physiological processes that characterize the initial stages of metabolic and cardiovascular disease [25]. In a recent analysis, Stefan and Schulze demonstrated that anthropometric markers (BMI, WC) and standard biochemical parameters (fasting glucose, lipid levels) provide limited incremental predictive value when added to clinical variables and do not identify early pathophysiological alterations such as autonomic dysfunction, reduced metabolic flexibility, or abnormalities in fat distribution—mechanisms central to obesity-related cardiometabolic deterioration [20].
Growing evidence highlights that autonomic imbalance, characterized by reduced vagal tone and sympathetic predominance, represents one of the earliest indicators of cardiometabolic impairment and is strongly associated with insulin resistance, arrhythmogenesis, and increased cardiovascular mortality, yet remains entirely absent from current risk assessment tools [26,27]. Similarly, metabolic inflexibility, reflecting early mitochondrial and substrate-utilization abnormalities, cannot be detected through fasting glucose, HbA1c, or lipid profiles—biomarkers that primarily represent late-stage metabolic dysfunction [28]. Moreover, markers of physical resilience, such as cardiorespiratory fitness, submaximal exercise performance, and muscular strength, consistently predict cardiovascular and all-cause mortality but are not incorporated into conventional scoring algorithms [27].
A further critical limitation is the lack of assessment of structural adiposity. Visceral adipose tissue (VAT), epicardial adipose tissue (EAT), and ectopic fat infiltration within skeletal or cardiac muscle are strongly linked to inflammation, atrial myopathy, heart failure with preserved ejection fraction (HFpEF), and cardiometabolic disease progression. However, neither BMI nor WC adequately reflect these ectopic fat depots, resulting in frequent misclassification of cardiometabolic risk—particularly among individuals with obesity or metabolically unhealthy normal-weight phenotypes [29].
Taken together, these limitations explain why traditional cardiometabolic scores often underestimate risk in key clinical subgroups such as young adults with obesity, individuals with high visceral adiposity but normal BMI, patients with subclinical cardiac dysfunction, and metabolically unhealthy normal-weight individuals. This diagnostic gap reinforces the need for integrated, multidomain frameworks capable of identifying early alterations across autonomic, metabolic, functional, and structural domains of cardiometabolic health.
3. Multidimensional Pathophysiology of Obesity-Related Cardiometabolic Impairment
Obesity is increasingly understood not as a simple consequence of excessive adiposity but as a complex, multisystem disorder involving early disturbances across autonomic, metabolic, functional, and structural domains. These alterations frequently precede overt clinical manifestations and act synergistically to drive cardiometabolic decline.
Autonomic imbalance represents one of the earliest and most consistent observed features of obesity-related cardiometabolic dysfunction. Reduced vagal tone, heightened sympathetic activation, and impaired heart rate variability have been documented even in metabolically “healthy” obese individuals and are strongly correlated with insulin resistance, systemic inflammation, arrhythmogenicity, and increased cardiovascular mortality [17,26]. These data highlight autonomic dysregulation as a subclinical yet clinically meaningful determinant of cardiometabolic vulnerability.
Simultaneously, metabolic inflexibility, defined as the impaired ability to switch between lipid and glucose oxidation, reflects early mitochondrial dysfunction and disrupted substrate utilization. An increase in adiposity is associated with reduced oxidative flexibility, accumulation of lipid intermediates, and impaired energetic efficiency, all of which contribute to insulin resistance and myocardial metabolic remodelling [28,30]. These abnormalities occur long before alterations in fasting glucose or lipid profiles become detectable, emphasizing the need for erlier metabolic markers.
Functional impairment further contributes to early cardiometabolic instability. Decreased cardiorespiratory fitness, suboptimal responses to submaximal exertion—such as alterations in DFA-α1 (the short-term scaling exponent derived from detrended fluctuation analysis of heart rate variability, reflecting autonomic–metabolic coupling during exercise)—delayed heart rate recovery, and reduced muscular strength are strong, independent predictors of cardiovascular and all-cause mortality [25,31]. These markers reflect a progressive deterioration in physiological resilience, an essential but largely unmeasured dimension of cardiometabolic health, and they often manifest before individuals with dysmetabolism develop clinically detectable obesity.
Finally, structural adiposity, particularly VAT and EAT, plays a direct mechanistic role in cardiometabolic deterioration. These ectopic fat depots exhibit high inflammatory and endocrine/paracrine activity, contributing to atrial myopathy, HFpEF, ventricular remodeling, endothelial dysfunction, and systemic inflammation. Increased VAT and EAT burden—sometimes present even in individuals with normal BMI, further demonstrating that conventional anthropometric indices cannot accurately capture structural cardiometabolic risk(7,9,25,29).
4. Existing Composite Cardiometabolic Scores and Current Gaps
Over the past decade, several composite indices have been introduced to improve cardiometabolic risk estimation beyond traditional anthropometric and biochemical parameters. Among the most prominent are the Visceral Adiposity Index (VAI), the Metabolic Score for Visceral Fat (METS-VF), and various Cardiometabolic Risk (CMR) Scores used in youth and general populations. (Table 1)
The VAI integrates WC, BMI, triglycerides, and high-density lipoprotein (HDL) cholesterol to estimate visceral adipose tissue dysfunction. Compared with simple anthropometric markers, VAI provides a better approximation of visceral fat activity; however, it remains limited to lipid and anthropometric parameters and does not capture the other pathophysiological alterations associated with adiposity [32].
The METS-VF score extends traditional metabolic indices by incorporating the METS-IR algorithm along with demographic variables to estimate visceral fat mass. While METS-VF improves the identification of insulin resistance and metabolic dysfunction, its focus remains restricted to the metabolic–visceral dimension, lacking integration of autonomic, functional, or ectopic fat markers [33]. Similar limitations apply to the CMR scores, predominantly used in youth research, combine standardized z-scores of fasting glucose, lipid parameters, blood pressure, and adiposity indices. Although useful for evaluating clustered metabolic risk, these scores rely exclusively on static biochemical and anthropometric measures, providing limited insight into early physiological disturbances such as autonomic imbalance, metabolic inflexibility, or early ectopic adiposity [34].
Across these tools, three key limitations consistently emerge:
- Narrow biological scope – existing indices predominantly capture metabolic or adiposity-related abnormalities while overlooking autonomic, functional, and structural domains.
- Static nature of variables – none of these scores incorporate dynamic physiological processes such as HRV, DFA-α1 patterns, muscular strength, or cardiorespiratory fitness.
- Absence of a resilience–burden model, current scores quantify risk, but do not integrate positive markers of physiological resilience (e.g., HRV, fitness, handgrip) together with negative markers of structural burden (e.g., EAT, VAT distribution).
Given these limitations, there is a clear unmet need for a multidomain, physiologically grounded tool capable of capturing early autonomic dysregulation, metabolic inflexibility, functional impairment, and structural adiposity, dimensions that are fundamentally involved in the pathogenesis of obesity-related cardiometabolic disease. In response to this gap, we introduce the C.O.R.E. Score, a novel integrative framework designed to provide a more sensitive and comprehensive assessment of cardiometabolic vulnerability.
5. The C.O.R.E. Score: Rationale, Domains, and Structure
The C.O.R.E. (Cardio-Obesity Risk Evaluation) Score was conceptualized to address these gaps by integrating complementary physiological and anatomical markers into a single, clinically applicable framework.
The C.O.R.E. model is based on two fundamental principles:
- Early cardiometabolic dysfunction develops across multiple interdependent domains—autonomic, metabolic, functional, and fat distribution.
- Risk stratification should reflect both protective capacities and pathological burdens—represented respectively by positive physiological indicators and negative structural markers of cardiometabolic deterioration.
Accordingly, the C.O.R.E. Score is composed of:
- Five domains (“resilience indicators”), which account for autonomic, functional, and metabolic variables, and to which a positive score above 0 was assigned.
- Two domains (“structural penalty indicators”), which account for the structural distribution of adipose tissue, and to which a negative score below 0 was arbitrarily assigned.
This multidimensional structure is designed to enhance early detection of cardiometabolic vulnerability in individuals with obesity or at risk of obesity-related cardiometabolic disease. (Figure 1, Table 2 and Table 3)
5.1. Positive Domains (Resilience Indicators)
Total score: 0–120 points
These domains reflect physiological systems whose integrity is indicative of cardiometabolic resilience. Higher scores across each domain reflect better indicate better cardiometabolic health.
- Resting Heart Rate Variability (HRV) – 0 to 30 points
HRV reflects vagal modulation, autonomic balance, inflammatory tone, and overall systemic resilience.
Reduced HRV is associated with insulin resistance, arrhythmias, hypertension, and cardiometabolic disease progression[26].
- 2.
- Submaximal Exercise Test with DFA-α1 – 0 to 30 points
This parameter captures metabolic flexibility, aerobic efficiency, and neural–metabolic coordination.
Lower DFA-α1 value during submaximal work indicates early dysregulation of autonomic–metabolic coupling [35].
- 3.
- Resting Heart Rate (RHR) – 0 to 30 points
A higher RHR reflects sympathetic predominance and impaired fitness/metabolic health.
Conversely, a lower RHR is a powerful predictor of longevity and cardiometabolic resilience, and is associated with a higher score in this domain [36].
- 4.
- Waist Circumference – 0 to 10 points
Despite its limitations, WC remains a simple and validated indicator of central adiposity and cardiometabolic risk.
It reflects the metabolic burden associated with abdominal fat expansion, lower waist circumference is associated with a higher score in this domain [37,38].
- 5.
- Handgrip Strength – 0 to 20 points
Handgrip strength represents muscular fitness, metabolic efficiency, mitochondrial function and global vitality.
Low handgrip predicts diabetes, cardiovascular disease and all-cause mortality [39].
5.2. Negative Domains (Structural Penalty Indicators)
Total penalty: –40 points
These indices reflect structural deterioration and adipose tissue dysfunction that directly increase cardiometabolic risk.
- 6.
- Epicardial Adipose Tissue (EAT) to -20-0 points
Higher EAT thickness/volume is associated with atrial fibrillation, coronary disease, inflammation, and HFpEF [39].
- 7.
- Abdominal Fat Distribution (VAT/SAT ratio + rectus fat ratio) to -20-0 points
Higher visceral adipose tissue (VAT), an altered ratio between subcutaneous adipose tissue (SAT) and VAT, and fat infiltration of the abdominal wall reflect severe metabolic dysfunction, insulin resistance, and ectopic fat deposition [29].
5.3. C.O.R.E. Score Formula
To integrate these multidimensional components into a single composite risk metric, the following indices are defined:
- Cardiometabolic Index (CmI)
CmI = HRV + DFA−α1 + RHR + WC + Handgrip
(Positive resilience indicators)
- Cardiometabolic Index- Ultrasound (CmI-U)
CmI-U = EAT + VAT / SAT Index
(Negative penalty indicators)
- C.O.R.E. Score
C.O.R.E. = CmI – CmI-U
The C.O.R.E. (Cardio-Obesity Risk Evaluation) conceptual model. The left balance plate represents positive resilience domains—physiological systems that contribute to cardiometabolic protection—including Heart Rate Variability (HRV), DFA-α1 Step Test (autonomic–metabolic coupling), Resting Heart Rate, Waist Circumference, and Handgrip Strength. The right balance plate illustrates the negative structural domains—Epicardial Adipose Tissue (EAT) and Abdominal Fat Distribution (VAT/SAT ratio)—which impose cardiometabolic burden. The C.O.R.E. model integrates these multidimensional indicators to quantify the balance between physiological resilience and structural risk in individuals with obesity.
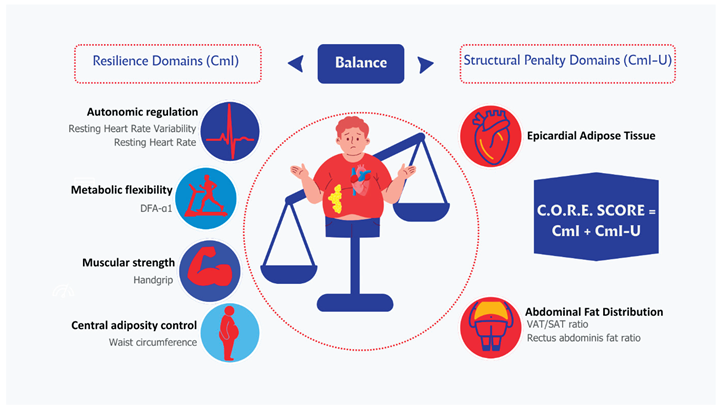
The figure illustrates the multidimensional architecture of the C.O.R.E. model, which integrates positive resilience domains and negative structural domains to provide an early and comprehensive assessment of cardiometabolic vulnerability in obesity.
On the left, five resilience domains (including Heart Rate Variability, DFA-α1 Step Test, Resting Heart Rate, Waist Circumference, and Handgrip Strength) contribute positively to the Cardiometabolic Index (CmI), reflecting preserved physiological adaptability and cardiometabolic health.
On the right, two structural penalty domains—epicardial adipose tissue and adverse abdominal fat distribution—contribute negatively to the Cardiometabolic Index–Ultrasound (CmI-U), representing pathological structural burden and adipose tissue dysfunction.
The final C.O.R.E. Score results from the balance between resilience (CmI) and structural burden (CmI-U), conceptualizing cardiometabolic risk as a dynamic interaction between protective physiological capacity and pathological adiposity-related damage. This framework enables earlier identification of cardiometabolic risk beyond traditional biochemical and anthropometric markers.
6. Operationalizing the C.O.R.E. Score: A Practical Clinical Guide
The preceding sections have outlined the conceptual foundations of the C.O.R.E. Score as a multidomain framework designed to capture the early autonomic, metabolic, functional, and structural alterations that characterize obesity-related cardiometabolic vulnerability, alterations associated to adiposity. To translate this conceptual model into clinical practice, it is essential to provide clear operational guidelines for the standardized assessment, interpretation, and scoring of each domain.
Each domain, whether representing a resilience indicator (HRV, DFA-α1, resting heart rate, waist circumference, handgrip strength) or a structural burden indicator (epicardial adipose tissue, VAT/SAT and rectus fat ratio), is presented with consistent structure, including: pathophysiological rationale, measurement protocol, clinically relevant thresholds, scoring implications within the C.O.R.E. framework, supporting evidence.
This unified presentation ensures that the C.O.R.E. Score can be applied reliably across clinical settings, enabling clinicians to detect cardiometabolic impairment earlier than with conventional biomarkers alone. The goal is not merely to offer a new risk score, but to provide an actionable approach for identifying patients whose cardiometabolic resilience is declining despite normal biochemical or anthropometric markers. (Table 4)
6.1. Resting Heart Rate Variability (HRV)
Score Range: 0–30 points
6.1.1. Pathophysiological Rationale
Resting heart rate variability (HRV) is one of the most sensitive indicators of autonomic–metabolic integrity. RMSSD (Root Mean Square of Successive Differences), reflecting vagal modulation, and SDNN (Standard Deviation of NN Intervals), representing overall autonomic variability, capture the capacity of the autonomic nervous system to dynamically regulate cardiovascular function in response to internal and external demands. Reduced HRV signifies autonomic rigidity, heightened sympathetic activation, and impaired homeostatic adaptability, alterations strongly associated with insulin resistance, systemic inflammation, and cardiometabolic disease progression [16,26]. Importantly, reduced HRV can be observed even in individuals with normal anthropometric and biochemical profiles, making it a powerful early marker of visceral adiposity and latent metabolic dysfunction [29].
6.1.2. Measurement Protocol
HRV should be recorded during a standardized 5-minute resting measurement, with the patient supine in a quiet, thermoneutral room (22–24°C). (Figure 2)
Patients should abstain from caffeine, nicotine, and alcohol for at least three hours before the test and avoid exercise for at least 12 hours. The gold standard for measurement is ECG, although validated chest sensors (e.g., Polar H10 and Movesense) are acceptable alternatives for clinical practice. RMSSD is used as the primary metric, with SDNN evaluated as a complementary index.
6.1.3. Interpretation & Thresholds
According to the normative ranges summarized in the literature[40], healthy adults typically exhibit RMSSD values around 30–40 ms in men and 32–42 ms in women, whereas values below 20 ms indicate a clinically meaningful impairment of vagal modulation. SDNN values above 50 ms reflect preserved global autonomic variability, while values below 30 ms are associated with increased cardiometabolic risk.
Within the C.O.R.E. framework, HRV scoring is intentionally conceived as a semi-quantitative, category-based approach rather than a continuous mathematical function. Points are assigned according to predefined physiological ranges that reflect autonomic integrity, early dysfunction, or overt impairment, rather than through proportional or exponential transformations.
Specifically, the proposed 0–30 point range is derived from RMSSD-centered categories as follows:values ≥30 ms are assigned the highest score range, reflecting preserved vagal modulation; values between 20 and 29 ms correspond to an intermediate score range, consistent with early autonomic strain; and values <20 ms are assigned the lowest score range, indicating significant autonomic dysregulation. SDNN values are used as a complementary indicator to confirm global autonomic variability and reinforce classification in borderline cases.
This categorical scoring approach was deliberately chosen to enhance clinical interpretability and feasibility in routine practice. The development of continuous scoring functions, weighting schemes, or non-linear transformations will require prospective validation studies and outcome-based calibration, and therefore lies beyond the scope of the present review.
6.1.4. Clinical Meaning
Low HRV is consistently associated with insulin resistance, metabolic syndrome progression, visceral adiposity accumulation [16,26], and cardiometabolic risk even in metabolically “normal” individuals [29]. Reduced vagal activity also predicts cardiac arrhythmias, heightened sympathetic tone, systemic inflammation, and increased all-cause mortality[41,42]. These associations underscore HRV as a non-invasive biomarker capable of identifying early cardiometabolic vulnerability far earlier than conventional markers such as fasting glucose, lipids, or blood pressure.
6.1.5. Interpretation & Thresholds
Within the C.O.R.E. framework, HRV contributes to the autonomic resilience domain as follows:
- -
- 25–30 points: RMSSD ≥ 30 ms and SDNN ≥ 50 ms → robust autonomic resilience
Preserved vagal modulation with intact global autonomic variability
- -
- 15–24 points: RMSSD 20–29 ms and/or SDNN 30–49 ms →early autonomic strain
Mild-to-moderate reduction in autonomic flexibility, compatible with early cardiometabolic vulnerability
- -
- 0–14 points: RMSSD < 20 ms and/or SDNN < 30 ms →marked autonomic dysfunction
Significant autonomic dysregulation associated with increased cardiometabolic risk
In cases of discordance between RMSSD and SDNN (e.g., preserved RMSSD with reduced SDNN, or vice versa), the lower category prevails, reflecting reduced overall autonomic robustness.
6.2. Submaximal DFA-α1 Step Test
Score Range: 0–30 points
6.2.1. Pathophysiological Rationale
The analysis of DFA-α1 (Detrended Fluctuation Analysis, short-term scaling exponent) of RR-interval dynamics during submaximal exercise provides a sensitive insight into the interaction between autonomic regulation, metabolic flexibility, and aerobic efficiency. Unlike resting HRV, DFA-α1 captures autonomic–metabolic coupling under controlled physiological stress, reflecting the capacity of the cardiovascular system to preserve complexity while adapting to increasing energetic demands.
In healthy individuals, heart rate dynamics maintain a fractal-like structure at low workloads (α1 ≈ 1.0), reflecting a balanced interplay between vagal withdrawal, sympathetic activation, ventilatory control, and efficient substrate switching. As workload increases, DFA-α1 declines in a predictable manner toward values around 0.75, marking the progressive loss of complexity associated with sympathetic predominance and the transition toward anaerobic metabolism. Gronwald et al. demonstrated that this decline closely tracks the aerobic threshold and represents an integrative marker of physiological resilience and autonomic–metabolic coordination [35].
6.2.2. Measurement Protocol
The test is performed using a standardized 30-cm step or an equivalent low-intensity exercise protocol at a fixed cadence. RR-interval data are continuously recorded using validated chest-strap sensors (e.g., Polar H10 or Movesense). The primary measurement window corresponds to the steady-state phase at mild-to-moderate intensity (approximately 2–4 METs), a range in which autonomic complexity should remain preserved in metabolically healthy individuals. DFA-α1 is calculated over consecutive 2-minute windows using validated algorithms and software.
6.2.3. Interpretation and Thresholds
A DFA-α1 value ≥ 0.85 during low-to-moderate workloads indicates preserved physiological complexity and intact autonomic–metabolic coordination. Values between 0.75 and 0.84 suggest emerging dysregulation, reflecting early impairment in metabolic flexibility and autonomic adaptability. A premature decline of DFA-α1 below 0.75—particularly when occurring at workloads below 3–4 METs—signals an early loss of physiological resilience and disproportionate sympathetic dominance during minimal exertion.
Within the C.O.R.E. framework, the DFA-α1 domain is scored using a piecewise linear model (0–30 points) based on the steady-state DFA-α1 value recorded during submaximal exercise, with an additional penalty applied for premature loss of complexity at very low workloads:
- -
- 25–30 points: α1 ≥ 0.85 → preserved physiological complexity and robust autonomic–metabolic resilience
- -
- 15–24 points: α1 = 0.75–0.84 → early autonomic–metabolic dysregulation
- -
- 0–14 points: α1 < 0.75 at low workloads (< 3–4 METs) → impaired physiological resilience
This transparent scoring strategy preserves the biological meaning of DFA-α1 thresholds while allowing proportional risk stratification across a continuous physiological spectrum.
6.2.4. Clinical Meaning
Individuals with obesity, metabolic syndrome, or insulin resistance frequently exhibit attenuated DFA-α1 responses, transitioning to low-complexity states at disproportionately low workloads [25,28]. This pattern reflects impaired mitochondrial efficiency, reduced oxidative capacity, and diminished vagal modulation during exercise, often preceding detectable abnormalities in fasting glucose, HbA1c, lipid profiles, or even resting HRV. DFA-α1 has also been linked to inflammatory burden, inefficient oxygen utilization, and exercise intolerance, supporting its role as an early and dynamic marker of cardiometabolic risk [30,35].
6.3. Resting Heart Rate (RHR)
Score Range: 0–30 points
6.3.1. Phatopysiological Rationale
RHR is a simple yet powerful biomarker of autonomic balance and cardiometabolic fitness. A lower resting heart rate reflects robust parasympathetic tone, efficient myocardial energetics, and enhanced cardiorespiratory conditioning. Conversely, an elevated RHR is a marker of sympathetic overactivity, reduced vagal influence, and impaired metabolic health. Cooney et al. showed that RHR strongly predicts cardiovascular and all-cause mortality independently of conventional risk factors [33].
6.3.2. Measurement Protocol
RHR is measured after at least 5 minutes of resting in a seated or supine position. The measurement should avoid recent caffeine intake, nicotine, or emotional stress. The average of 2–3 readings is recommended.
6.3.3. Interpretation & Thresholds
Resting heart rate contributes up to 30 points to the C.O.R.E. score and is calculated using a piecewise linear model based on established prognostic thresholds. This approach was chosen to preserve clinical interpretability and avoid overfitting in the absence of prospective validation.
Scores are assigned as follows:
- -
- 25–30 points: <60 bpm → high cardiometabolic resilience
- -
- 10–24 points: 60–74 bpm→ intermediate autonomic profile
- -
- 0–9 points: ≥75 bpm → increased autonomic and cardiometabolic risk
Within each category, points are allocated proportionally according to resting heart rate values, with lower heart rates receiving higher scores. For example, within the 60–74 bpm range, a heart rate of 60 bpm corresponds to 24 points, whereas 74 bpm corresponds to 10 points, with linear interpolation for intermediate values.
This linear scoring strategy reflects the continuous relationship between resting heart rate and cardiovascular risk reported in large epidemiological studies, while maintaining ease of application in routine clinical practice.
6.3.4. Clinical Meaning
An elevated RHR correlates with insulin resistance, increased inflammatory load, impaired vascular compliance, and reduced cardiorespiratory fitness. It predicts incident diabetes, hypertension, and premature mortality independently of BMI or metabolic biomarkers.
6.4. Waist Circumference
Score Range: 0–10 points
6.4.1. Pathophysiological Rationale
Waist circumference (WC) remains one of the most robust, reproducible, and clinically practical markers of central adiposity and cardiometabolic risk. Unlike BMI, which does not differentiate between lean and fat mass and fails to capture fat distribution, WC directly reflects abdominal fat accumulation—a key determinant of insulin resistance, chronic low-grade inflammation, dyslipidemia, and cardiometabolic burden.
As emphasized in the IAS–ICCR Consensus Statement, WC should be considered a true clinical vital sign, given its strong and independent association with VAT, ectopic fat deposition, and cardiovascular morbidity and mortality [34]. Central adiposity exerts deleterious effects through inflammatory, endocrine, and lipotoxic mechanisms, directly contributing to metabolic dysfunction, myocardial remodeling, and vascular disease, even in individuals with normal BMI.
6.4.2. Measurement Protocol
Waist circumference should be measured at the midpoint between the lowest rib and the iliac crest using a non-elastic measuring tape, with the patient standing upright, abdomen relaxed, and at the end of a normal expiration. Two consecutive measurements within 1 cm of each other should be obtained and averaged. Clinical interpretation should account for sex-specific and, when available, ethnicity-specific cut-offs, given known differences in fat distribution and cardiometabolic risk.
6.4.3. Interpretation and Thresholds
According to the IAS–ICCR consensus, WC categories associated with increasing cardiometabolic risk are defined as follows:
- -
- <80 cm in women / <94 cm in men → low central adiposity
- -
- 80–88 cm in women / 94–102 cm in men → intermediate risk
- -
- ≥88 cm in women / ≥102 cm in men → high central adiposity
These thresholds align closely with longitudinal trajectories of incident type 2 diabetes, hypertension, non-alcoholic fatty liver disease (NAFLD), HFpEF, and adverse cardiometabolic events.
Within the C.O.R.E. framework, WC contributes to the anthropometric domain through a piecewise linear scoring model (0–10 points) designed to reflect the progressive increase in cardiometabolic burden associated with central fat accumulation:
- -
- 8–10 points: normal WC (below sex-specific low-risk thresholds) → minimal visceral adiposity burden
- -
- 4–7 points: intermediate WC (between low- and high-risk thresholds) → moderate central adiposity and early metabolic strain
- -
- 0–3 points: elevated WC (≥88 cm in women or ≥102 cm in men) → high visceral fat burden and increased cardiometabolic risk
This scoring strategy preserves the clinical interpretability of established WC cut-offs while allowing proportional integration of central adiposity into the multidomain C.O.R.E. score.
6.4.4. Clinical Meaning
Waist circumference correlates strongly with visceral adiposity, hepatic steatosis, atherogenic dyslipidemia, impaired glucose tolerance, and systemic inflammatory activation [34]. Elevated WC is also associated with left atrial enlargement, diastolic dysfunction, coronary microvascular impairment, and increased risk of HFpEF, even in the absence of overt obesity.
Importantly, WC frequently identifies high-risk phenotypes such as metabolically unhealthy normal-weight (MUNW) individuals and thin-outside–fat-inside (TOFI) phenotypes, which are often misclassified as low risk by BMI-based or traditional cardiometabolic scores.
6.5. Handgrip Strength
Score Range: 0–20 points
6.5.1. Pathophysiological Rationale
Handgrip strength represents a robust, low-cost, and highly reproducible index of global muscular fitness, functional capacity, and cardiometabolic health. It correlates closely with skeletal muscle mass, neuromuscular integrity, mitochondrial efficiency, and insulin-mediated glucose uptake. Given that skeletal muscle is the largest insulin-sensitive tissue in the human body, reduced muscular strength reflects impaired metabolic reserve, anabolic resistance, and early disruption of whole-body energy homeostasis.
Beyond its musculoskeletal significance, handgrip strength integrates multiple cardiometabolic pathways, including chronic low-grade inflammation, autonomic imbalance, reduced oxidative capacity, and physical inactivity. Large population-based cohorts have consistently demonstrated that lower grip strength is independently associated with increased risk of type 2 diabetes, cardiovascular disease, frailty, hospitalization, and all-cause mortality, even after adjustment for BMI and traditional risk factors [35].
6.5.2. Measurement Protocol
Handgrip strength is assessed using a calibrated handheld dynamometer (e.g., Jamar). The patient is seated or standing, with the shoulder neutrally positioned, elbow flexed at 90°, forearm in neutral position, and wrist slightly extended. Three maximal voluntary contractions are performed for each hand, separated by short rest intervals. The highest value obtained from the dominant hand is typically used for scoring.
To ensure clinical relevance and comparability, grip strength values should be interpreted using age- and sex-specific normative reference ranges derived from large population datasets.
6.5.3. Interpretation and Thresholds
Population-based reference data identify three broad categories of functional status based on age- and sex-adjusted percentiles:
- Above the 50th percentile → preserved muscular and metabolic reserve
- Between the 25th and 50th percentile → early functional impairment
- Below the 25th percentile → high-risk profile consistent with sarcopenia, frailty, and adverse cardiometabolic prognosis
These thresholds show strong associations with incident type 2 diabetes, cardiovascular events, cancer mortality, disability, and reduced life expectancy [35].
Within the C.O.R.E. framework, handgrip strength contributes to the functional resilience domain through a percentile-based, piecewise linear scoring model (0–20 points) designed to reflect progressive loss of muscular and metabolic reserve.
- 16–20 points: above the age- and sex-specific 50th percentile → preserved functional capacity and cardiometabolic resilience
- 8–15 points: between the 25th and 50th percentile → intermediate strength and early functional decline
- 0–7 points: below the 25th percentile → marker of functional impairment and a frailty-prone phenotype
This approach allows proportional integration of muscular fitness into the global C.O.R.E. score while maintaining strong epidemiological grounding and clinical interpretability.
6.5.4. Clinical Meaning
Low handgrip strength reflects the convergence of several adverse biological processes, including mitochondrial dysfunction, impaired oxidative metabolism, systemic inflammation, autonomic dysregulation, and reduced habitual physical activity. Importantly, reduced strength often precedes overt weight gain or metabolic abnormalities and may be present in individuals with normal BMI or WC, thereby identifying early loss of physiological resilience that traditional anthropometric measures fail to detect.
As such, handgrip strength provides a simple yet powerful functional biomarker of cardiometabolic vulnerability and biological aging, with direct implications for risk stratification and intervention planning.
6.6. Epicardial Adipose Tissue (EAT)
Penalty Range: −20 to 0 points
6.6.1. Pathophysiological Rationale
Epicardial adipose tissue (EAT) is a metabolically active visceral fat depot located between the myocardium and the visceral pericardium. Unlike other adipose tissues, EAT is in direct anatomical and paracrine contact with the coronary arteries and atrial myocardium, lacking a fascial barrier. In conditions of excess accumulation, EAT undergoes a phenotypic shift toward a pro-inflammatory and profibrotic profile, characterized by the secretion of cytokines, adipokines, and oxidative mediators that directly promote atrial fibrosis, electrical remodeling, endothelial dysfunction, coronary atherosclerosis, and HFpEF pathophysiology.
6.6.2. Measurement Protocol
EAT thickness is assessed primarily by transthoracic echocardiography (Figure 3), which represents the most practical and widely available imaging modality for routine clinical evaluation and longitudinal follow-up. EAT is measured as the echo-lucent space between the outer myocardial wall and the visceral pericardium, most commonly on the right ventricular free wall using parasternal long-axis and short-axis views. Measurements are obtained at end-systole—when EAT thickness is maximal—and averaged over at least three consecutive cardiac cycles.
Although computed tomography (CT) and magnetic resonance imaging (MRI) allow accurate volumetric quantification of epicardial fat and are considered reference techniques for research purposes, they are not incorporated into the C.O.R.E. score due to limited availability, radiation exposure (for CT), higher costs, and reduced feasibility for large-scale or repeated assessments. Accordingly, volumetric cut-offs are not included in the current scoring framework.
It should be acknowledged that echocardiography provides a linear estimate and does not fully capture total epicardial fat volume. Nevertheless, several studies have demonstrated a strong correlation between echocardiographic EAT thickness and volumetric measurements obtained by CT or MRI, as well as with cardiometabolic risk and cardiovascular outcomes. Thus, echocardiography is adopted in the C.O.R.E. model as a pragmatic compromise between diagnostic accuracy and clinical applicability, while recognizing its lower spatial resolution compared with tomographic techniques.
6.6.3. Interpretation & Thresholds
Although no universally accepted cut-off exists, commonly used echocardiographic thresholds include:
- < 5 mm: minimal or physiological EAT
- 5–7 mm: moderate EAT expansion
- o 7 mm: severe EAT accumulation
These ranges have been consistently associated with increasing cardiometabolic risk, atrial arrhythmias, coronary artery disease, and HFpEF. While CT-based volumetric thresholds (e.g., >125 mL) have been linked to elevated risk, they are reported here for contextual reference only and are not used for scoring.
In the C.O.R.E. framework, EAT contributes as a negative (penalty) domain, reflecting structural cardiometabolic burden:
- 0 points penalty: EAT < 5 mm → minimal structural burden
- −10 points: EAT 5–7 mm → moderate epicardial adiposity
- −20 points: EAT > 7 mm → severe epicardial adiposity
6.6.4. Clinical Meaning
EAT is a particularly valuable marker in individuals who otherwise appear metabolically stable based on traditional parameters. Increased EAT can be present even when glucose, lipid profiles, and blood pressure are within normal ranges, frequently identifying TOFI (thin-outside–fat-inside) phenotypes and metabolically unhealthy normal-weight individuals. Elevated EAT burden correlates strongly with atrial fibrillation, coronary artery disease, ventricular remodeling, HFpEF, and systemic inflammatory activation, providing incremental risk information beyond BMI and waist circumference [36,37,44,45].
6.7. Abdominal Fat Distribution: VAT/SAT Ratio and Rectus Fat Ratio
Penalty Range: -20 to 0 points
6.7.1. Phatopysiological Rationale
Abdominal adipose distribution is one of the strongest determinants of cardiometabolic risk. A higher visceral-to-subcutaneous fat ratio (VAT/SAT) reflects deep, metabolically active adiposity associated with insulin resistance, hepatic steatosis, systemic inflammation, and ectopic lipid deposition. The rectus abdominis fat ratio adds further information on local ectopic fat infiltration into the abdominal wall musculature, a marker of impaired muscle quality and metabolic dysfunction.
6.7.2. Measurement Protocol
VAT and SAT can be quantified using ultrasound, CT, or MRI.
- -
- Ultrasound represents a practical and low-cost approach suitable for routine clinical assessment [46]: VAT is measured as the distance between the posterior surface of the abdominal muscles and the anterior wall of the aorta or lumbar spine, while SAT is measured from the skin to the linea alba (Figure 4).
- -
- CT and MRI provide precise volumetric quantification and remain the reference standards in research settings.
Rectus abdominis fat infiltration is evaluated using ultrasound by assessing muscle thickness and echotexture, or by CT cross-sectional imaging when available. Ultrasound-based assessment focuses on increased muscle echogenicity and reduced contractile tissue, which reflect fatty infiltration and fibrotic remodeling.
6.7.3. Interpretation & Thresholds
VAT/SAT ratio
Commonly used research benchmarks include:
- VAT/SAT < 0.4 → favorable fat distribution
- VAT/SAT 0.4–0.7 → intermediate cardiometabolic risk
- VAT/SAT > 0.7 → high visceral fat dominance
At present, no universally accepted quantitative cut-off values exist for rectus muscle fat infiltration. Therefore, assessment is based on qualitative or semi-quantitative criteria, including:
- increased muscle echogenicity compared with adjacent tissues,
- reduced muscle thickness,
- loss of normal fibrillar architecture.
Moderate-to-severe rectus fat infiltration—particularly when associated with increased echogenicity and muscle hypotrophy—has been consistently linked to insulin resistance, impaired glucose uptake, reduced metabolic flexibility, and adverse cardiometabolic profiles, independent of BMI and overall adiposity.
For this reason, rectus fat infiltration is considered a risk-amplifying structural marker, complementing VAT/SAT ratio rather than replacing it.
Within the C.O.R.E. framework, abdominal fat distribution contributes as a structural penalty indicator as follows:
- -
- 0 points penalty: low VAT/SAT + minimal rectus fat infiltration
- -
- –10 points: moderate visceral/ectopic fat distribution
- -
- –20 points: high visceral dominance + rectus fat infiltration
6.7.4. Clinical Meaning
Elevated visceral adiposity and rectus muscle fat infiltration are strongly associated with insulin resistance, NAFLD, HFpEF, atrial myopathy, and cardiometabolic disease progression [38]. Importantly, these patterns are common in normal-BMI individuals with high cardiometabolic risk and therefore correct one of the major blind spots of traditional scores.
7. Discussion
The evidence summarized in this narrative review reinforces the notion that obesity-related cardiometabolic disease is not merely a consequence of excess adiposity or abnormal biochemical markers, but rather a progressive, multisystem condition characterized by early and often silent disturbances across autonomic regulation, metabolic efficiency, physical resilience, and structural adiposity. Traditional cardiometabolic risk scores, such as the Metabolic Syndrome criteria, the Framingham Risk Score, and SCORE2, have undoubtedly played a central role in cardiovascular prevention, yet their reliance on static biochemical and anthropometric variables increasingly appears insufficient to capture the earliest phases of cardiometabolic vulnerability [19,20]. These tools were developed in a historical context where obesity was conceptualized primarily as excessive fat accumulation and metabolic disturbance. However, current evidence paints a far more complex pathophysiological scenario.
One of the most compelling insights emerging from recent literature is that cardiometabolic deterioration often begins several years before measurable changes in glucose, lipid levels, or blood pressure. Autonomic dysregulation, for example, is detectable even in individuals classified as “metabolically healthy obese,” and reduced vagal activity has been consistently associated with insulin resistance, systemic inflammation, and visceral adiposity [16,26]. This early autonomic imbalance contributes to a state of reduced physiological flexibility that remains invisible to standard clinical metrics. Similarly, metabolic inflexibility, characterized by impaired transitions between lipid and glucose oxidation, has been identified as a precursor to insulin resistance and myocardial metabolic remodeling, occurring long before abnormalities in fasting glucose or HbA1c become apparent [28,30].
Functional impairments also precede clinical disease. Low cardiorespiratory fitness and reduced muscular strength are among the most powerful predictors of cardiovascular and all-cause mortality, outperforming many traditional risk factors [27,31]. Yet these dimensions of physiological resilience do not appear in any existing cardiometabolic scoring system. The consequence is a diagnostic gap in which individuals with preserved laboratory values but diminished physiological reserve may be incorrectly classified as low-risk.
Structural adiposity further complicates this picture. VAT and EAT are not inert depots but highly active endocrine and inflammatory organs. Their expansion contributes to atrial remodeling, HFpEF, endothelial dysfunction, and disturbances in myocardial metabolism (7,9,25). Importantly, increased VAT or EAT can occur even in people with normal BMI or with apparently favorable lipid profiles, classic examples of the “TOFI” phenotype (thin outside, fat inside). VAT/SAT imbalance, rectus muscle quality, and EAT thickness have all been associated with early cardiometabolic risk in multiple imaging studies [29,36,37,38,39,47]. Yet none of these structural markers are considered in widely used risk scores.
Collectively, this convergence of evidence underscores a fundamental limitation of current cardiometabolic assessment strategies: its focus on late, static manifestations of disease rather than early, dynamic physiological processes. Modern cardiometabolic pathology does not begin with overt hypertension, dyslipidemia, or glucose dysregulation; it begins with the loss of complexity, flexibility, and resilience across interconnected systems. Capturing these early abnormalities requires a multidomain framework that integrates autonomic markers, functional indicators, metabolic signals, and structural imaging findings.
The C.O.R.E. model emerges as a conceptual response to this unmet need. Rather than relying solely on risk factor accumulation, C.O.R.E. reframes cardiometabolic risk as a balance between resilience and structural burden. This dual-axis approach incorporates markers that reflect the body’s adaptive capacity, such as HRV, submaximal DFA-α1 dynamics, resting heart rate, waist phenotype, and muscular strength, alongside markers representing anatomical deterioration, including EAT and VAT/SAT distribution. Such integration allows for a more nuanced characterization of cardiometabolic status, particularly in individuals whose traditional risk scores fail to reveal subclinical dysfunction.
A physiology-based model may offer several advantages. First, it has the potential to identify at-risk individuals earlier, when interventions such as lifestyle modification, exercise therapy, or autonomic training can exert maximal benefit. Second, it provides clinicians with a more comprehensive picture of a patient’s cardiometabolic profile, enabling targeted therapeutic strategies rather than one-size-fits-all interventions. Third, many of the components of the C.O.R.E. Score, such as HRV, handgrip strength, and ultrasound-based VAT/SAT evaluation, are inexpensive, repeatable, and feasible in primary care or outpatient cardiology settings.
Despite its promise, the C.O.R.E. framework remains conceptual and requires rigorous validation. Prospective cohort studies are essential to determine whether its multidomain structure improves prediction of cardiovascular events compared with existing risk scores. Moreover, the optimal weighting of each component will need refinement through statistical modeling and possibly machine learning approaches. Validation across diverse populations, different ages, sexes, ethnicities, and obesity phenotypes, will also be critical, given the heterogeneity of obesity-related cardiometabolic disease.
Ultimately, the shift from static to dynamic, multidomain assessment mirrors a broader transformation in cardiovascular medicine. As our understanding of the early phases of cardiometabolic disease deepens, the tools we use to detect and stratify risk must evolve accordingly. By integrating autonomic, metabolic, functional, and structural domains into a unified framework, the C.O.R.E. Score represents a step toward more sensitive and physiologically grounded risk assessment. Whether it will achieve widespread clinical adoption will depend on future validation, but the rationale for moving beyond traditional metrics is increasingly compelling.
8. Strengths and Limitations
The present review offers several strengths. First, it synthesizes evidence across traditionally separate domains, autonomic physiology, metabolic flexibility, functional capacity, and structural adiposity, providing an integrated perspective on the early pathophysiological mechanisms that precede overt cardiometabolic disease. This multidomain approach reflects the contemporary understanding that obesity-related cardiometabolic risk emerges from the interplay of neural, metabolic, and anatomical factors rather than from isolated biochemical abnormalities alone. Second, the review highlights limitations of existing risk scores using high-quality evidence from epidemiological, physiological, and imaging studies, strengthening the rationale for developing new assessment tools. Third, the C.O.R.E. model proposed here is grounded in clinically accessible biomarkers, HRV, submaximal DFA-α1 dynamics, resting heart rate, waist phenotype, handgrip strength, and basic ultrasound measures, enhancing its potential real-world applicability in both primary care and cardiometabolic settings.
However, several limitations must be acknowledged. This work is primarily conceptual and does not provide empirical validation of the C.O.R.E. Score. The relative weight of each domain has been defined based on patophysiological plausibility and evidence of prognostic relevance, but future prospective studies are required to refine scoring thresholds and establish predictive accuracy. Additionally, while the review incorporates robust literature, heterogeneity across studies—differences in HRV methodology, exercise testing protocols, ultrasound techniques, and definitions of ectopic adiposity, may influence comparability and limit generalizability. The proposed model also assumes that all domains contribute additively to cardiometabolic risk, whereas interactions between autonomic, metabolic, and structural systems may be nonlinear and more complex. Finally, access to certain measures (e.g., EAT assessment or detailed VAT/SAT characterization) may vary across clinical settings, potentially limiting early implementation.
Despite these limitations, the review establishes a clear conceptual and scientific foundation for a multidomain cardiometabolic risk model. Future research should focus on validating the C.O.R.E. Score in diverse populations, examining longitudinal trajectories, and determining whether interventions targeting autonomic, metabolic, or structural domains can modify the score and improve clinical outcomes.
9. Future Perspectives
Looking forward, several research directions could substantially strengthen, validate, and expand the clinical utility of the C.O.R.E. model. One of the most compelling avenues involves exploring its relationship with subclinical atherosclerosis, particularly carotid intima–media thickness (cIMT) and plaque burden. Carotid ultrasonography is an established surrogate marker of early vascular injury and a robust predictor of cardiovascular events [48,49]. Demonstrating that autonomic–functional markers such as HRV or DFA-α1, as well as structural markers such as EAT or the VAT/SAT ratio, correlate with carotid atherosclerotic changes would provide strong external validation for the multidomain logic underlying the C.O.R.E. score. Emerging evidence already suggests that impaired HRV is linked to early vascular aging and endothelial dysfunction [26], while visceral adiposity strongly correlates with carotid atherosclerosis and plaque presence [29]. Establishing these relationships within an integrated framework would clarify whether early autonomic and metabolic dysregulation precedes or parallels subclinical vascular disease development.
A second key area for future work concerns the feasibility of deriving HRV metrics from a standard 10-second ECG. While 5-minute recordings remain the gold standard for assessing RMSSD and SDNN, several studies suggest that short ECG segments can provide reliable approximations of vagally mediated HRV indices [50,51]. If short-ECG HRV metrics prove sufficiently concordant with 5-minute recordings in obese and metabolically impaired populations, this would dramatically increase the scalability of autonomic assessment. Since 10-second ECGs are already ubiquitous in clinical care, this approach could allow seamless integration of the autonomic dimension of the C.O.R.E. score into routine cardiometabolic evaluation without requiring specialized equipment or prolonged assessments.
A third promising direction involves expanding the model into an exercise-based framework, tentatively conceptualized as C.O.R.E.-X (Cardio-Obesity Risk Evaluation – Exercise). Exercise testing offers unique insights into physiological resilience and metabolic efficiency that cannot be captured at rest. Parameters such as estimated VO₂max, HR recovery, ventilatory thresholds, and DFA-α1 behavior during graded exertion are among the strongest predictors of cardiovascular and all-cause mortality[31,35]. Integrating these functional signals with advanced metabolic biomarkers, including ApoB and LDL particle metrics, Lp(a), free fatty acids, fasting insulin/glucose ratios, and inflammatory indices such as the neutrophil-to-lymphocyte ratio (NLR), could provide a multidimensional phenotype that reflects not only cardiometabolic risk but also adaptive capacity, systemic metabolic strain, and cardiometabolic “reserve.” Recent evidence shows that markers like ApoB and Lp(a) carry substantial predictive value beyond traditional lipids [52], while metabolic biomarkers such as FFA (Free Fatty Acids) and glucose/insulin ratios reflect mitochondrial function and metabolic flexibility[28,30].
Together, these future directions outline a coherent strategy for transforming the C.O.R.E. score from a conceptual model into a validated, clinically actionable tool. By linking autonomic–functional dynamics with early vascular imaging, simplifying HRV acquisition for real-world application, and exploring resilience-based phenotyping under physiological stress, the next generation of C.O.R.E. research may significantly improve early cardiometabolic risk detection. Such developments would not only enhance predictive accuracy but also deepen our mechanistic understanding of how autonomic, metabolic, functional, and structural disturbances converge in the earliest stages of obesity-related cardiometabolic disease.
10. Conclusions
The evidence synthesized in this review highlights the need to rethink cardiometabolic risk assessment in the context of obesity. Traditional scores, grounded in static biochemical and anthropometric parameters, identify risk only after substantial metabolic and structural deterioration has occurred. In contrast, contemporary research demonstrates that early cardiometabolic impairment is characterized by autonomic imbalance, reduced metabolic flexibility, diminished functional capacity, and the accumulation of ectopic adipose depots, alterations that remain largely invisible to current clinical tools.
The C.O.R.E. framework proposed here addresses this diagnostic gap by integrating complementary domains of cardiometabolic health into a unified model. By combining autonomic markers (HRV, DFA-α1), functional indices (resting heart rate, handgrip strength), anthropometric profiling (waist circumference), and imaging-derived measures of ectopic adiposity (EAT, VAT/SAT distribution), C.O.R.E. reframes risk assessment as a balance between physiological resilience and structural burden.
This multidomain approach may enable earlier identification of vulnerable individuals, particularly those with discordant phenotypes such as metabolically unhealthy normal-weight subjects or young adults with subclinical dysfunction. Its components are accessible, non-invasive, and applicable in routine clinical settings, suggesting good potential for scalability.
However, C.O.R.E. remains a conceptual model and requires rigorous validation through prospective cohorts to define optimal weighting, thresholds, and predictive value relative to existing scores. Future studies should also examine whether targeted interventions can modify these domains and translate into improved clinical outcomes.
In summary, the C.O.R.E. model offers a physiologically grounded, multidimensional perspective on cardiometabolic risk, aligning with emerging evidence that early dysfunction is systemic rather than purely metabolic. Its validation could support more precise, anticipatory, and personalized approaches to cardiometabolic prevention in obesity.
Author Contributions
For research articles with several authors, a short paragraph specifying their individual contributions must be provided. The following statements should be used “Conceptualization, X.X. and Y.Y.; methodology, X.X.; software, X.X.; validation, X.X., Y.Y. and Z.Z.; formal analysis, X.X.; investigation, X.X.; resources, X.X.; data curation, X.X.; writing—original draft preparation, X.X.; writing—review and editing, X.X.; visualization, X.X.; supervision, X.X.; project administration, X.X.; funding acquisition, Y.Y. All authors have read and agreed to the published version of the manuscript.” Please turn to the CRediT taxonomy for the term explanation. Authorship must be limited to those who have contributed substantially to the work reported.
Funding
This research received no external funding.
Institutional Review Board Statement
Not applicable.
Informed Consent Statement
Not applicable.
Data Availability Statement
Not applicable.
Acknowledgments
We wish to thank the Scientific Bureau of the University of Catania for language support.
Conflicts of Interest
Authors declare no conflicts of interest.
References
- Bentham, J.; Di Cesare, M.; Bilano, V.; Bixby, H.; Zhou, B.; Stevens, G.A.; et al. Worldwide trends in body-mass index, underweight, overweight, and obesity from 1975 to 2016: a pooled analysis of 2416 population-based measurement studies in 128·9 million children, adolescents, and adults. The Lancet 2017, 390, 2627–2642. [Google Scholar]
- Bastien, M.; Poirier, P.; Lemieux, I.; Després, J.P. Overview of epidemiology and contribution of obesity to cardiovascular disease. Prog Cardiovasc Dis 2014, 56, 369–381. [Google Scholar] [CrossRef]
- Swinburn, B.; Sacks, G.; Ravussin, E. Increased food energy supply is more than sufficient to explain the US epidemic of obesity. American Journal of Clinical Nutrition 2009, 90, 1453–1456. [Google Scholar] [CrossRef]
- Church, T.S.; Thomas, D.M.; Tudor-Locke, C.; Katzmarzyk, P.T.; Earnest, C.P.; Rodarte, R.Q.; et al. Trends over 5 decades in U.S. occupation-related physical activity and their associations with obesity. PLoS One 2011, 6. [Google Scholar] [CrossRef]
- Faienza, M.F.; Wang, D.Q.H.; Frühbeck, G.; Garruti, G.; Portincasa, P. The dangerous link between childhood and adulthood predictors of obesity and metabolic syndrome. In Internal and Emergency Medicine; Springer-Verlag Italia s.r.l., 2016; Vol. 11, pp. 175–182. [Google Scholar]
- Lavie, CJ; McAuley, PA; Church, TS; Milani, R.V.; Blair, S.N. Obesity and cardiovascular diseases: Implications regarding fitness, fatness, and severity in the obesity paradox. In Journal of the American College of Cardiology; Elsevier USA., 2014; Vol. 63, pp. 1345–1354. [Google Scholar]
- Alpert, M.A.; Lavie, C.J.; Agrawal, H.; Kumar, A.; Kumar, S.A. Cardiac effects of obesity: Pathophysiologic, clinical, and prognostic consequences-A review. In Journal of Cardiopulmonary Rehabilitation and Prevention; Lippincott Williams and Wilkins, 2016; Vol. 36, pp. 1–11. [Google Scholar]
- Barbosa, MM; Beleigoli, AM; De Fatima Diniz, M.; Freire, C.V.; Ribeiro, AL; Nunes, M.C.P. Strain imaging in morbid obesity: Insights into subclinical ventricular dysfunction. Clin Cardiol 2011, 34, 288–293. [Google Scholar] [CrossRef]
- Obokata, M; Reddy, YNV; Pislaru, S.V.; Melenovsky, V.; Borlaug, B.A. Evidence Supporting the Existence of a Distinct Obese Phenotype of Heart Failure with Preserved Ejection Fraction. Circulation 2017, 136, 6–19. [Google Scholar] [CrossRef]
- Kosmala, W.; Sanders, P.; Marwick, T.H. Subclinical Myocardial Impairment in Metabolic Diseases [Internet]. 2017. Available online: http://www.acc.org/jacc-journals-cme.
- Ayer, J.G.J.; Almafragy, H.S.; Patel, A.A.; Hellyer, R.L.; Celermajer, D.S. Body Mass Index is an Independent Determinant of Left Atrial Size. Heart Lung Circ 2008, 17, 19–24. [Google Scholar] [CrossRef]
- Aiad, N.N.; Hearon, C.; Hieda, M.; Dias, K.; Levine, B.D.; Sarma, S. Mechanisms of Left Atrial Enlargement in Obesity. American Journal of Cardiology 2019, 124, 442–447. [Google Scholar] [CrossRef] [PubMed]
- Taegtmeyer, H.; Young, M.E.; Lopaschuk, G.D.; Abel, E.D.; Brunengraber, H.; Darley-Usmar, V.; et al. Assessing Cardiac Metabolism. Circ Res 2016, 118, 1659–1701. [Google Scholar] [CrossRef] [PubMed]
- Conte, M.; Petraglia, L.; Cabaro, S.; Valerio, V.; Poggio, P.; Pilato, E.; et al. Epicardial Adipose Tissue and Cardiac Arrhythmias: Focus on Atrial Fibrillation. In Frontiers in Cardiovascular Medicine; Frontiers Media, S.A., 2022; Vol. 9. [Google Scholar]
- Lembo, M.; Strisciuglio, T.; Fonderico, C.; Mancusi, C.; Izzo, R.; Trimarco, V.; et al. Obesity: the perfect storm for heart failure. In ESC Heart Failure; John Wiley and Sons Inc, 2024; Vol. 11, pp. 1841–1860. [Google Scholar]
- Wulsin, L.; Herman, J.; Thayer, J.F. Stress, autonomic imbalance, and the prediction of metabolic risk: A model and a proposal for research. In Neuroscience and Biobehavioral Reviews; Elsevier Ltd, 2018; Vol. 86, pp. 12–20. [Google Scholar]
- Mannozzi, J.; Massoud, L.; Stavres, J.; Al-Hassan, M.H.; O’Leary, D.S. Altered Autonomic Function in Metabolic Syndrome: Interactive Effects of Multiple Components. In Journal of Clinical Medicine; Multidisciplinary Digital Publishing Institute (MDPI), 2024; Vol. 13. [Google Scholar]
- Cosentino, F.; Verma, S.; Ambery, P.; Treppendahl, M.B.; Van Eickels, M.; Anker, S.D.; et al. Cardiometabolic risk management: insights from a European Society of Cardiology Cardiovascular Round Table. In European Heart Journal; Oxford University Press, 2023; Vol. 44, pp. 4141–4156. [Google Scholar]
- Crea, F. Strengths and limitations of risk scores in cardiovascular prevention. In European Heart Journal; Oxford University Press, 2024; Vol. 45, pp. 75–78. [Google Scholar]
- Stefan, N.; Schulze, M.B. Metabolic health and cardiometabolic risk clusters: implications for prediction, prevention, and treatment. Lancet Diabetes Endocrinol [Internet] 2023, 11, 426–440. [Google Scholar] [CrossRef] [PubMed]
- Asztalos, B.F.; Russo, G.; He, L.; Diffenderfer, M.R. Body Mass Index and Cardiovascular Risk Markers: A Large Population Analysis. Nutrients 2025, 17. [Google Scholar] [CrossRef]
- Zong, X.; Kelishadi, R.; Kim, H.S.; Schwandt, P.; Matsha, T.E.; Mill, J.G.; et al. Utility of waist-to-height ratio, waist circumference and body mass index in predicting clustered cardiometabolic risk factors and subclinical vascular phenotypes in children and adolescents: A pooled analysis of individual data from 14 countries; Clinical Research and Reviews: Diabetes and Metabolic Syndrome, 2024; Volume 18. [Google Scholar]
- Nevill, A.M.; Duncan, M.J.; Myers, T. BMI is dead; long live waist-circumference indices: But which index should we choose to predict cardio-metabolic risk? Nutrition, Metabolism and Cardiovascular Diseases 2022, 32, 1642–1650. [Google Scholar]
- Seyedhoseinpour, A.; Barzin, M.; Mahdavi, M.; Valizadeh, M.; Azizi, F.; Ghareh, S.; et al. BMI category-specific waist circumference thresholds based on cardiovascular disease outcomes and all-cause mortality: Tehran lipid and glucose study (TLGS). BMC Public Health 2023, 23. [Google Scholar] [CrossRef]
- Neeland, I.J.; Poirier, P.; Després, J.P. Cardiovascular and Metabolic Heterogeneity of Obesity: Clinical Challenges and Implications for Management. Circulation 2018, 137, 1391–1406. [Google Scholar] [CrossRef] [PubMed]
- Thayer, J.F.; Yamamoto, S.S.; Brosschot, J.F. The relationship of autonomic imbalance, heart rate variability and cardiovascular disease risk factors. International Journal of Cardiology 2010, 141, 122–131. [Google Scholar] [CrossRef]
- Carnethon, M.R.; Gidding, S.S.; Nehgme, R.; Sidney, S.; Jacobs, D.R.; Liu, K.; et al. Cardiorespiratory Fitness in Young Adulthood and the Development of Cardiovascular Disease Risk Factors [Internet]. 2003, Vol. 290, JAMA. Available online: www.jama.com.
- Kelley, D.E.; Goodpaster, B.H. Skeletal Muscle Triglyceride An aspect of regional adiposity and insulin resistance [Internet]. Available online: http://diabetesjournals.org/care/article-pdf/24/5/933/643913/933.pdf.
- Neeland, I.J.; Turer, A.T.; Ayers, C.R.; Powell-Wiley, T.M.; Vega, G.L.; Farzaneh-Far, R.; et al. Dysfunctional Adiposity and the Risk of Prediabetes and Type 2 Diabetes in Obese Adults [Internet]. Available online: www.jamaarchivescme.com.
- Ang, J.H.C.; Sun, L.; Foo, S.Y.R.; Leow, M.K.S.; Vidal-Puig, A.; Fontana, L.; et al. Perspectives on whole body and tissue-specific metabolic flexibility and implications in cardiometabolic diseases. In Cell Reports Medicine; Cell Press, 2025; Vol. 6. [Google Scholar]
- Kodama, S.; Saito, K.; Tanaka, S.; Maki, M.; Yachi, Y.; Asumi, M.; et al. Cardiorespiratory Fitness as a Quantitative Predictor of All-Cause Mortality and Cardiovascular Events in Healthy Men and Women A Meta-analysis [Internet]. Available online: www.jamaarchivescme.com.
- Amato, M.C.; Giordano, C.; Galia, M.; Criscimanna, A.; Vitabile, S.; Midiri, M.; et al. Visceral adiposity index: A reliable indicator of visceral fat function associated with cardiometabolic risk. Diabetes Care 2010, 33, 920–922. [Google Scholar]
- Bello-Chavolla, O.Y.; Antonio-Villa, N.E.; Vargas-Vázquez, A.; Viveros-Ruiz, T.L.; Almeda-Valdes, P.; Gomez-Velasco, D.; et al. Metabolic Score for Visceral Fat (METS-VF), a novel estimator of intra-abdominal fat content and cardio-metabolic health. Clinical Nutrition 2020, 39, 1613–1621. [Google Scholar] [PubMed]
- Magnussen, C.G.S.K.J.M. What the cardiovascular risk calculators are still missing: youth cardiometabolic risk. Atherosclerosis 2012, 224, 305–6. [Google Scholar]
- Gronwald, T.; Rogers, B.; Hoos, O. Fractal Correlation Properties of Heart Rate Variability: A New Biomarker for Intensity Distribution in Endurance Exercise and Training Prescription? Front Physiol. 2020, 11. [Google Scholar] [CrossRef]
- Cooney, M.T.; Vartiainen, E.; Laatikainen, T.; Joulevi, A.; Dudina, A.; Graham, I. Simplifying cardiovascular risk estimation using resting heart rate. Eur Heart J 2010, 31, 2141–2147. [Google Scholar] [CrossRef] [PubMed]
- Thomas, E.L.; Frost, G.; Taylor-Robinson, S.D.; Bell, J.D. Excess body fat in obese and normal-weight subjects. Nutrition Research Reviews 2012, 25, 150–161. [Google Scholar] [CrossRef]
- Ross, R.; Neeland, I.J.; Yamashita, S.; Shai, I.; Seidell, J.; Magni, P.; et al. Waist circumference as a vital sign in clinical practice: a Consensus Statement from the IAS and ICCR Working Group on Visceral Obesity. Nat Rev Endocrinol 2020, 16, 177–189. [Google Scholar] [CrossRef]
- Celis-Morales, C.A.; Welsh, P.; Lyall, D.M.; Steell, L.; Petermann, F.; Anderson, J.; et al. Associations of grip strength with cardiovascular, respiratory, and cancer outcomes and all cause mortality: Prospective cohort study of half a million UK Biobank participants. BMJ (Online) 2018, 361. [Google Scholar] [CrossRef]
- Shaffer, F.; Ginsberg, J.P. An Overview of Heart Rate Variability Metrics and Norms. In Frontiers in Public Health; Frontiers Media, S.A., 2017; Vol. 5. [Google Scholar]
- Tsuji, H.; Larson, M.G.; Venditti, F.J.; Manders, E.S.; Evans, J.C.; Feldman, C.L.; et al. Impact of Reduced Heart Rate Variability on Risk for Cardiac Events. Circulation 1996, 94, 2850–2855. [Google Scholar] [CrossRef]
- Jensen, M.T.; Suadicani, P.; Hein, H.O.; Gyntelberg, F. Elevated resting heart rate, physical fitness and all-cause mortality: A 16-year follow-up in the Copenhagen Male Study. Heart 2013, 99, 882–887. [Google Scholar] [CrossRef] [PubMed]
- Iacobellis, G.; Ribaudo, M.C.; Assael, F.; Vecci, E.; Tiberti, C.; Zappaterreno, A.; et al. Echocardiographic Epicardial Adipose Tissue Is Related to Anthropometric and Clinical Parameters of Metabolic Syndrome: A New Indicator of Cardiovascular Risk. J Clin Endocrinol Metab 2003, 88, 5163–5168. [Google Scholar] [CrossRef] [PubMed]
- Arpaci, D.; Ugurlu, B.P.; Aslan, A.N.; Ersoy, R.; Akcay, M.; Cakir, B. Epicardial fat thickness in patients with prediabetes and correlation with other cardiovascular risk markers. Internal Medicine 2015, 54, 1009–14. [Google Scholar] [CrossRef]
- Packer, M. Epicardial Adipose Tissue May Mediate Deleterious Effects of Obesity and Inflammation on the Myocardium. In Journal of the American College of Cardiology; Elsevier USA., 2018; Vol. 71, pp. 2360–2372. [Google Scholar]
- Klopfenstein, B.J.; Kim, M.S.; Krisky, C.M.; Szumowski, J.; Rooney, W.D.; Purnell, J.Q. Comparison of 3 T MRI and CT for the measurement of visceral and subcutaneous adipose tissue in humans. British Journal of Radiology 2012, 85. [Google Scholar] [CrossRef]
- Nerlekar, N.; Baey, Y.W.; Brown, A.J.; Muthalaly, R.G.; Dey, D.; Tamarappoo, B.; et al. Poor Correlation, Reproducibility, and Agreement Between Volumetric Versus Linear Epicardial Adipose Tissue Measurement: A 3D Computed Tomography Versus 2D Echocardiography Comparison. In JACC: Cardiovascular Imaging; Elsevier Inc., 2018; Vol. 11, pp. 1035–1036. [Google Scholar]
- Howard, G.; Richey Sharrett, A.; Heiss, G.; Evans, G.W.; Chambless, L.E.; Riley, W.A.; et al. Carotid Artery Intimal-Medial Thickness Distribution in General Populations As Evaluated by B-Mode Ultrasound [Internet]. Available online: http://ahajournals.org.
- Lorenz, M.W.; Markus, H.S.; Bots, M.L.; Rosvall, M.; Sitzer, M. Prediction of clinical cardiovascular events with carotid intima-media thickness: A systematic review and meta-analysis. Circulation 2007, 115, 459–467. [Google Scholar] [CrossRef]
- Nussinovitch, U.; Elishkevitz, K.P.; Katz, K.; Nussinovitch, M.; Segev, S.; Volovitz, B.; et al. Reliability of Ultra-Short ECG Indices for Heart Rate Variability. Annals of Noninvasive Electrocardiology 2011, 16, 117–122. [Google Scholar] [CrossRef] [PubMed]
- Munoz, M.L.; Van Roon, A.; Riese, H.; Thio, C.; Oostenbroek, E.; Westrik, I.; et al. Validity of (Ultra-)Short recordings for heart rate variability measurements. PLoS One 2015, 10. [Google Scholar] [CrossRef] [PubMed]
- Ference, B.A.; Ginsberg, H.N.; Graham, I.; Ray, K.K.; Packard, C.J.; Bruckert, E.; et al. Low-density lipoproteins cause atherosclerotic cardiovascular disease. 1. Evidence from genetic, epidemiologic, and clinical studies. A consensus statement fromthe European Atherosclerosis Society Consensus Panel. Eur Heart J 2017, 38, 2459–2472. [Google Scholar] [CrossRef] [PubMed]
Figure 1.
The C.O.R.E. (Cardio-Obesity Risk Evaluation) conceptual model. Total Score Range: −40 to +120.
Figure 1.
The C.O.R.E. (Cardio-Obesity Risk Evaluation) conceptual model. Total Score Range: −40 to +120.
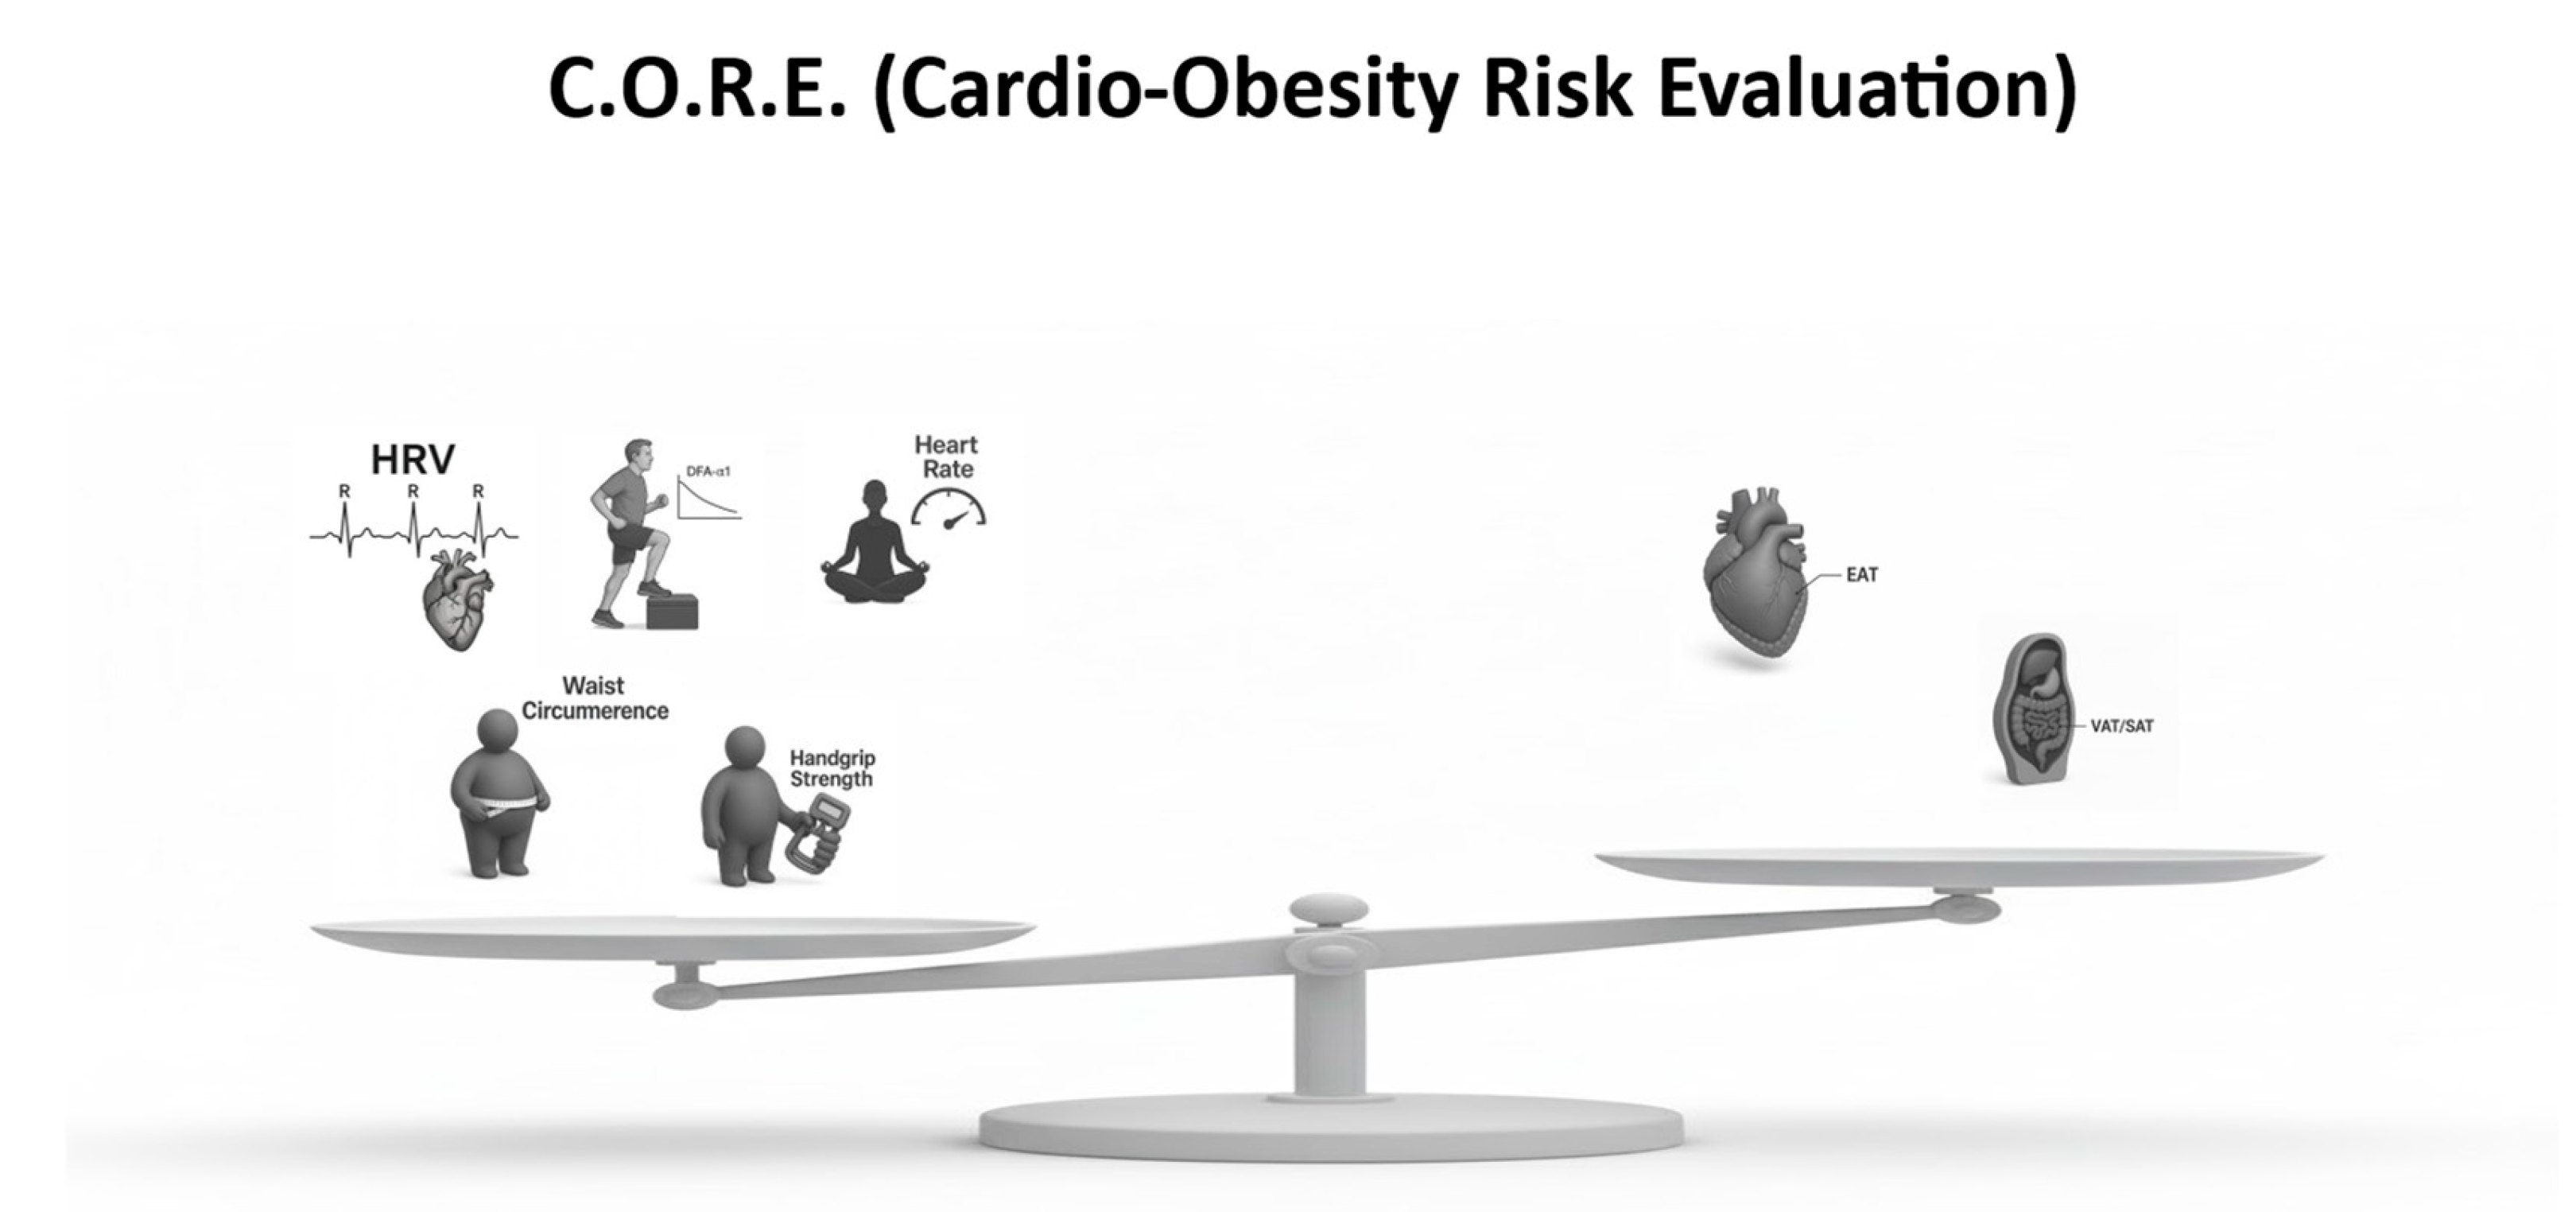
Figure 2.
Resting Heart Rate Variability.From the standardized 5-minute ECG assessment, two 10-second segments were selected to visually exemplify different autonomic profiles. Panel A illustrates a patient with preserved autonomic modulation, showing wider fluctuations in R–R intervals. Panel B illustrates a patient with reduced autonomic variability. These tracings serve only as visual examples; all HRV values reported in the study derive from complete 5-minute ECG recordings.
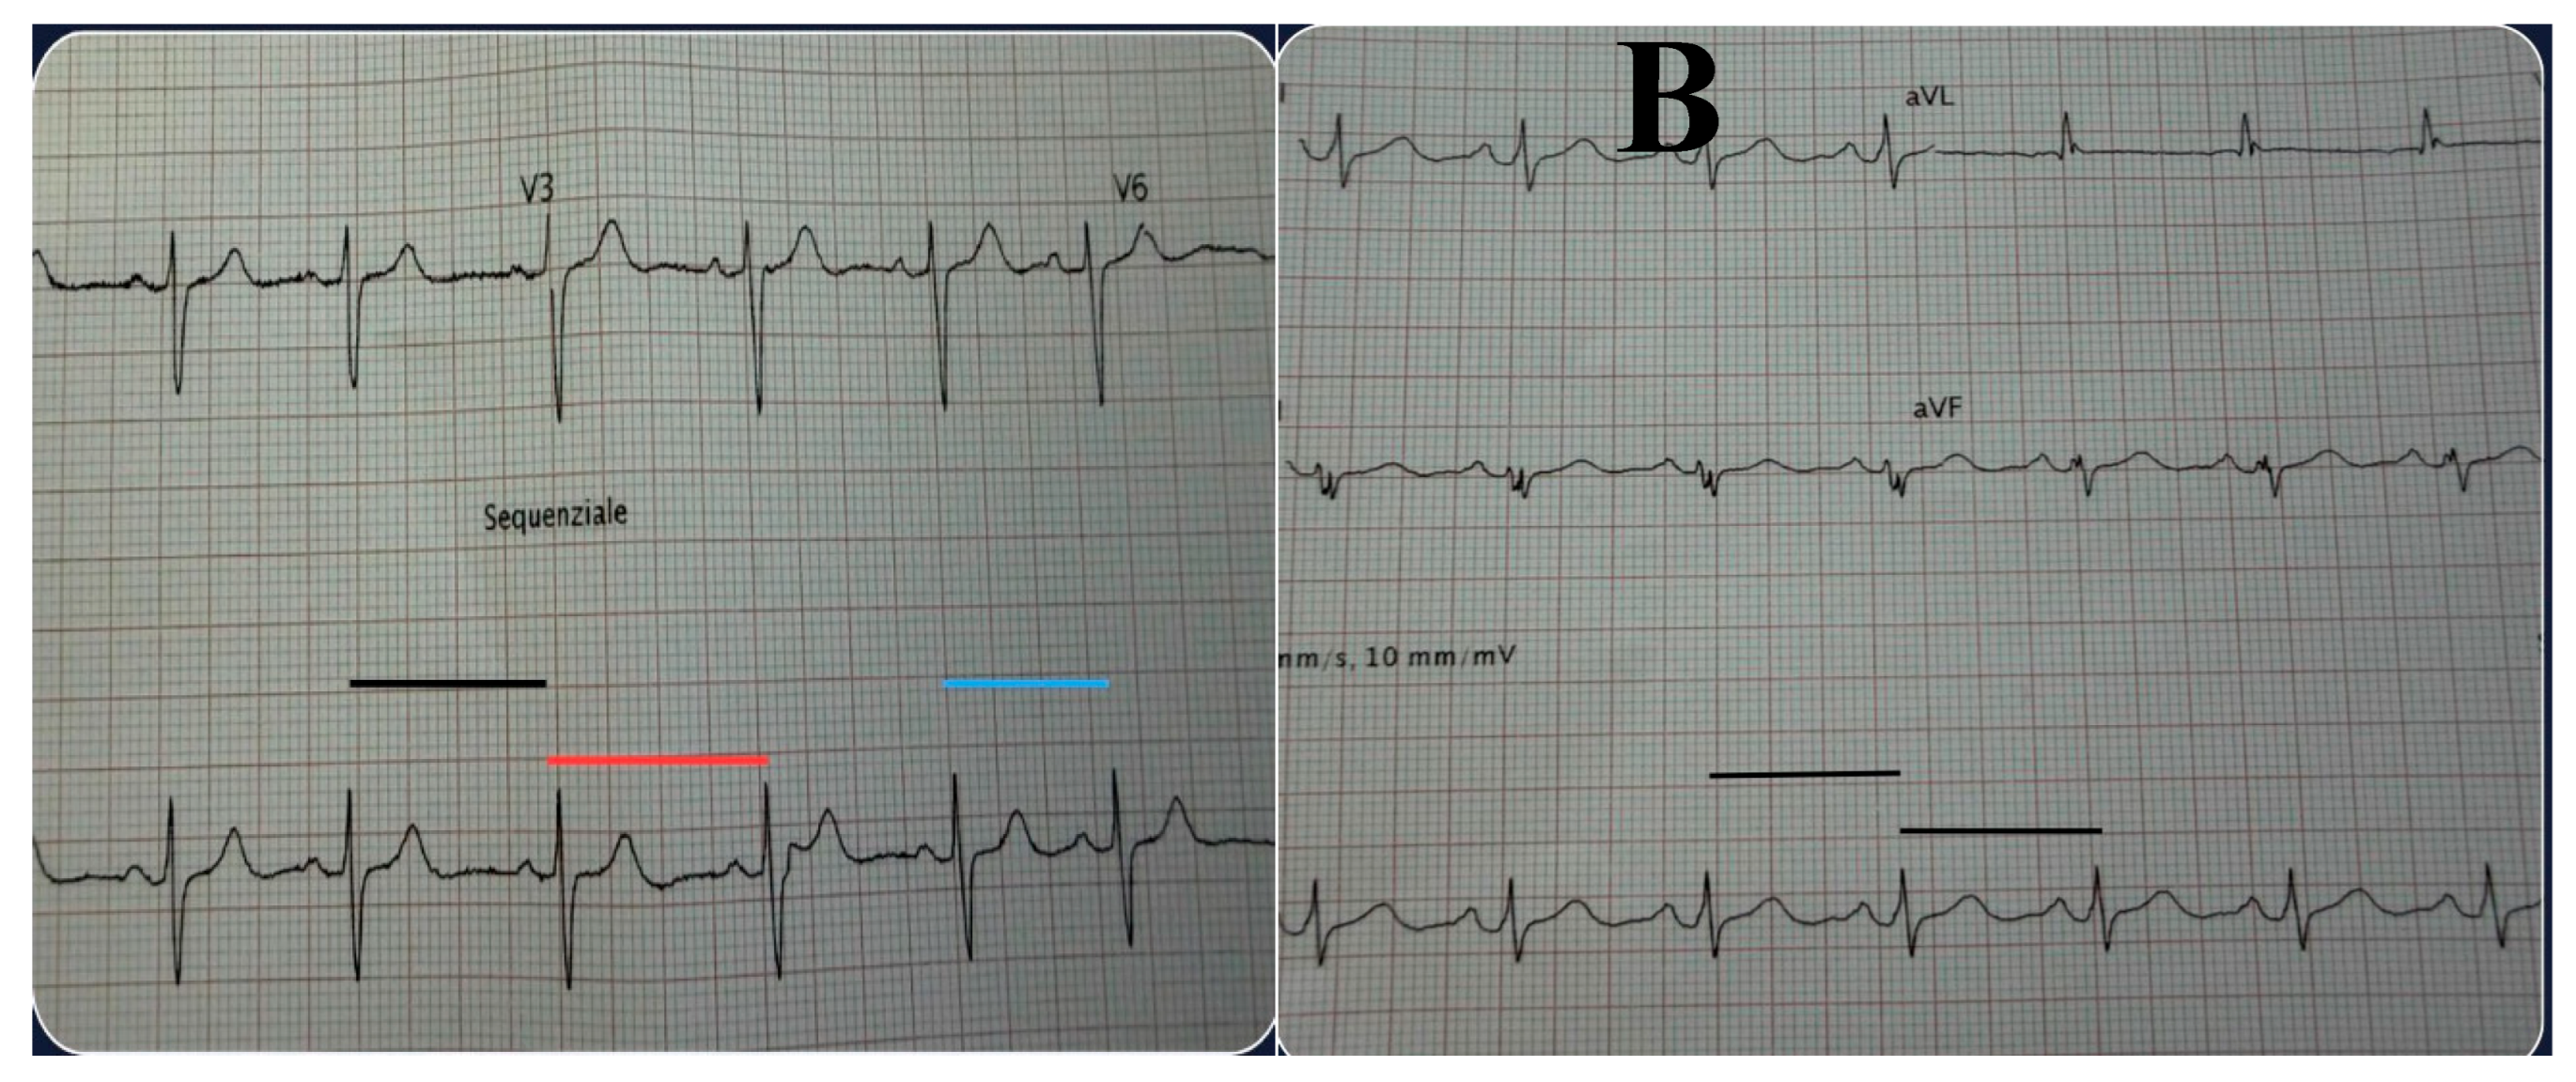
Figure 3.
Echocardiographic Epicardial Adipose Tissue.The echocardiographic frame shows the hypoechoic adipose layer located between the visceral pericardium and the outer myocardial wall along the right ventricular free wall (arrow). EAT thickness is measured perpendicularly at end-systole, when the adipose layer is most clearly delineated.
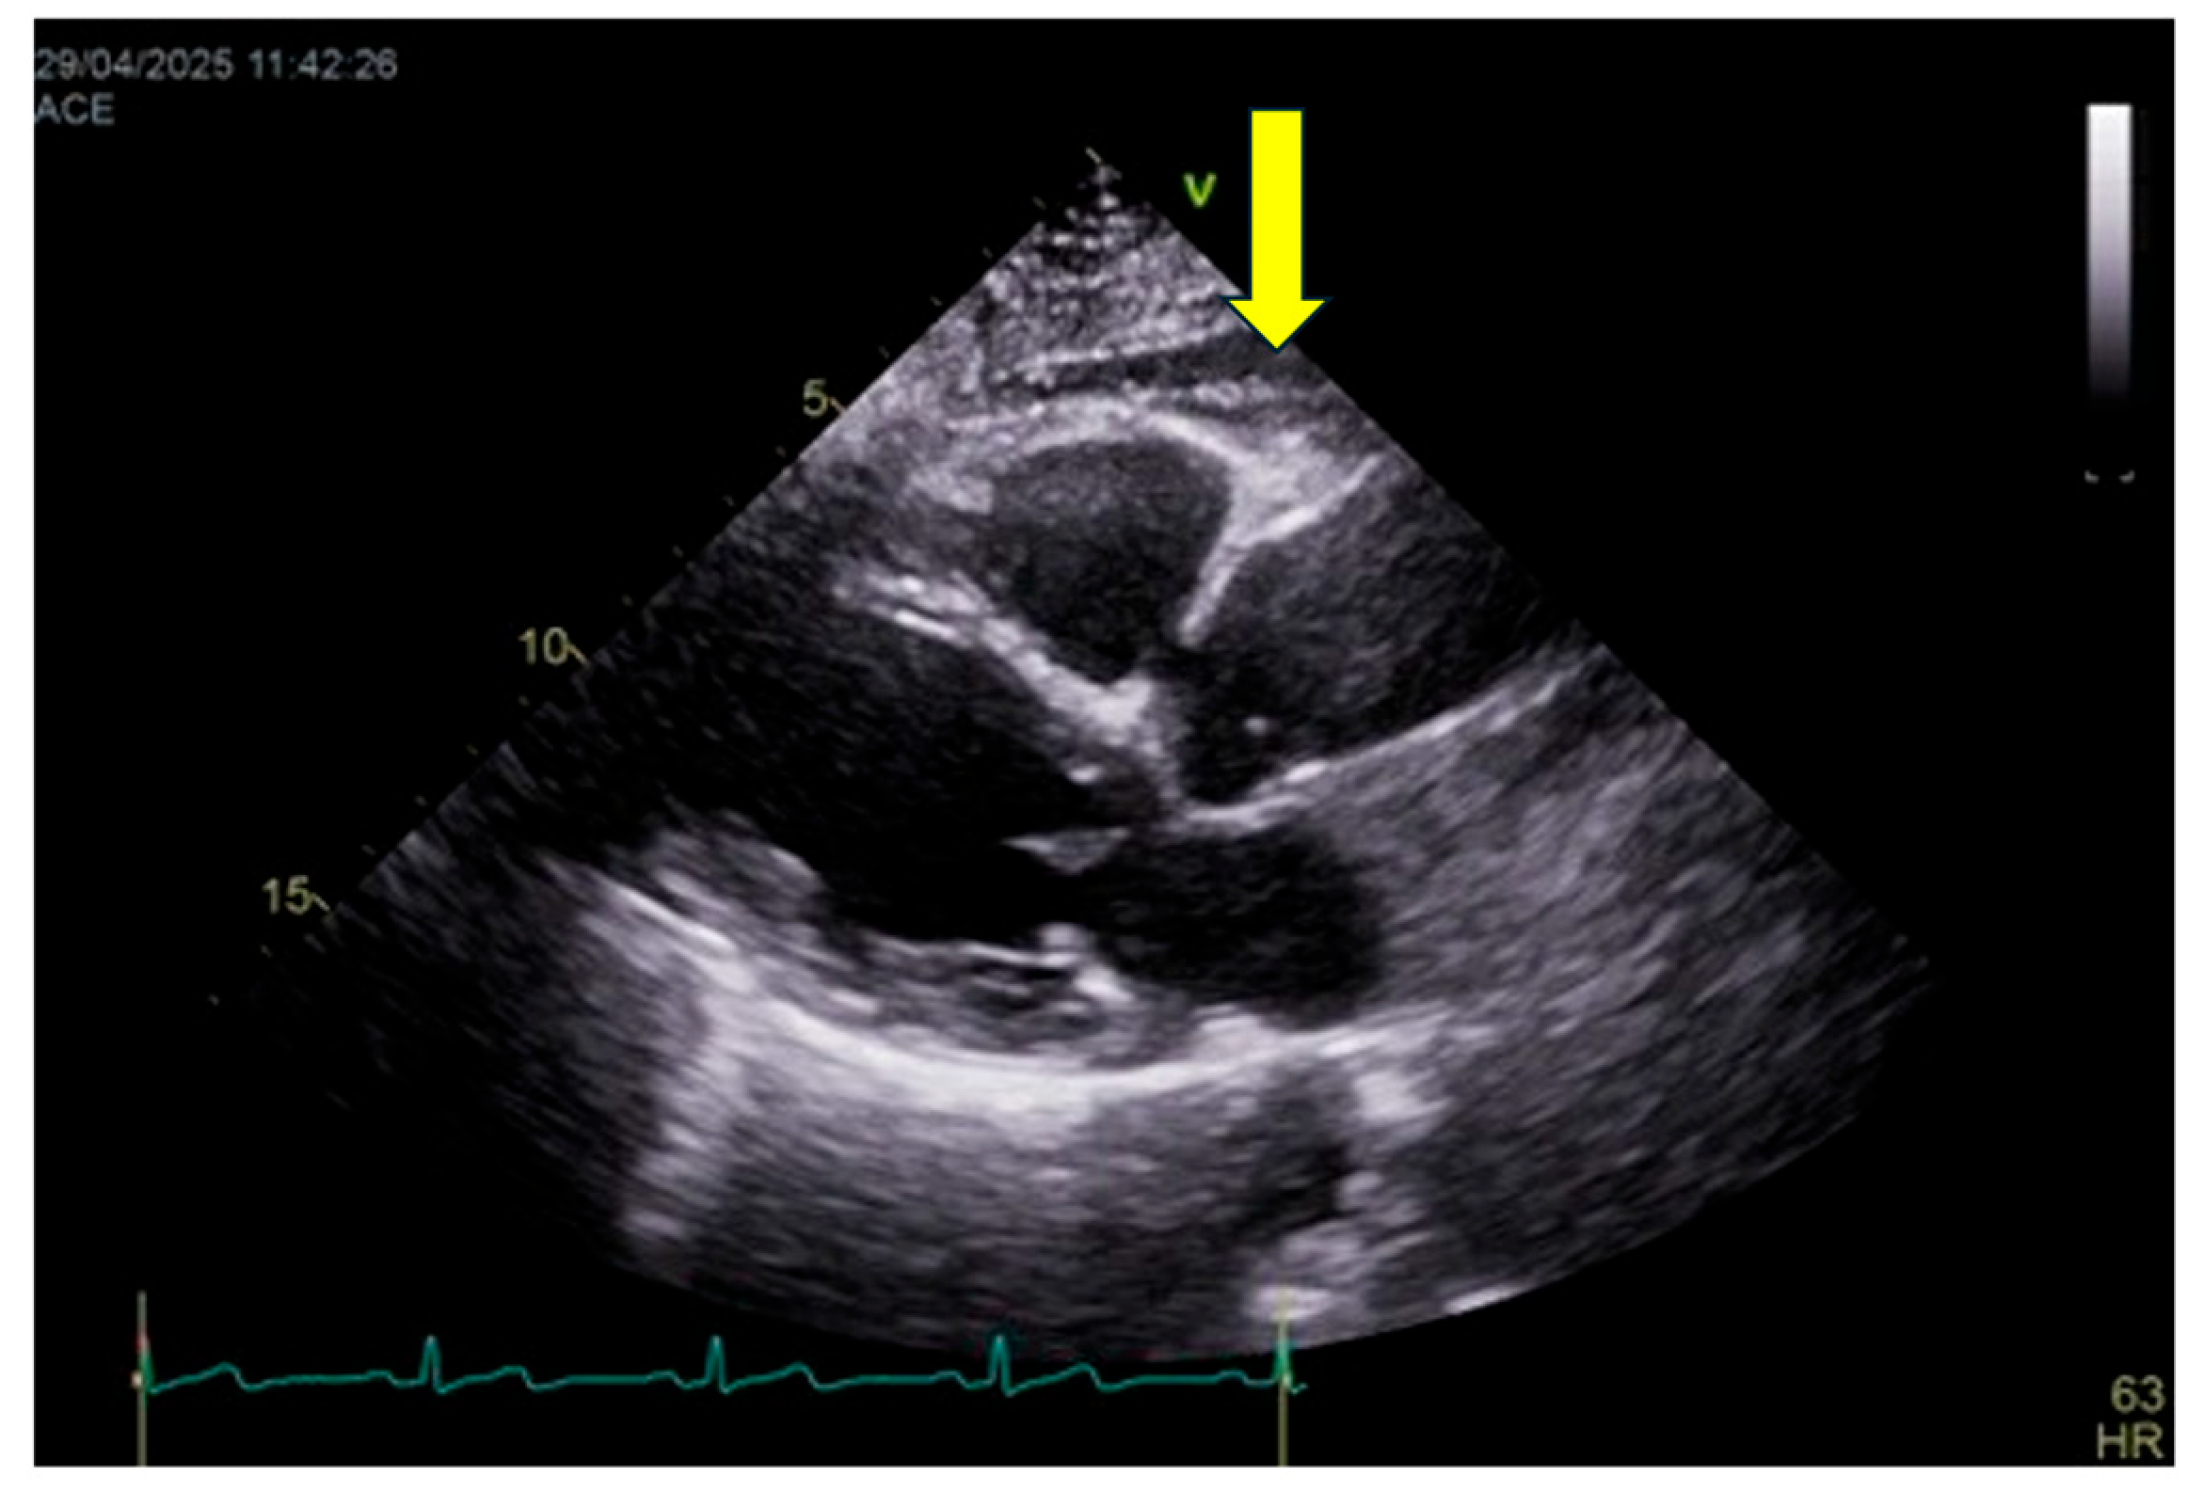
Figure 4.
Ultrasound assessment of abdominal subcutaneous fat (SAT), visceral fat (VAT), and rectus muscle morphology across different cardiometabolic profiles.(A) Male, 45 years, no cardiometabolic disease. The ultrasound shows a well-organized layering pattern with clear distinction between SAT and VAT compartments, and a preserved, normally hypoechoic rectus abdominis muscle with appropriate thickness. (B) Male, 39 years, advanced cardiometabolic disease. The image demonstrates poor differentiation between SAT and VAT, with adipose tissue appearing predominantly hyperechoic and structurally disorganized. The rectus abdominis muscle shows marked hypotrophy and sclerosis, appearing diffusely hyperechoic on ultrasound. (C) Female, 70 years, early cardiometabolic impairment. A measurable distinction between SAT and VAT is still present, but the rectus abdominis muscle shows hypotrophy and increased echogenicity consistent with early sclerosis.
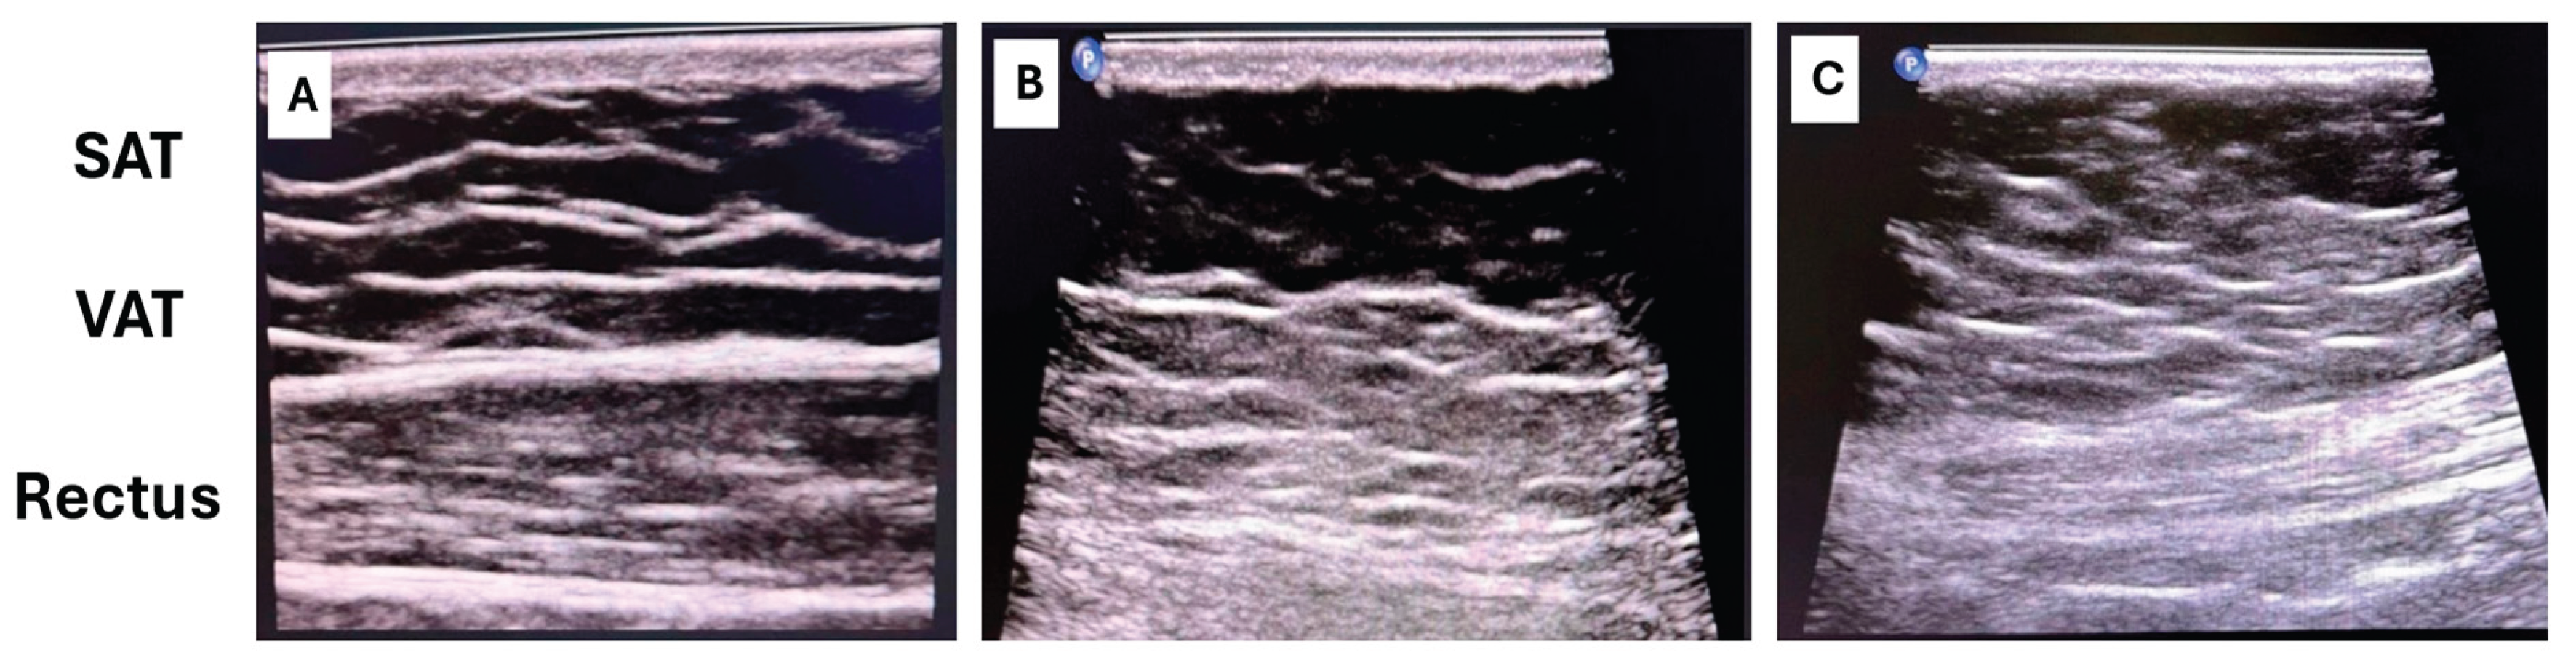

Table 1.
Comparison of Existing Cardiometabolic Scores vs the C.O.R.E. Model.
| Score / Model | Biological Domains Covered | Core Variables | Captures Autonomic Function? | Captures Functional Capacity / Fitness? | Captures Structural Adiposity (EAT, VAT)? | Major Limitations |
|---|---|---|---|---|---|---|
| VAI | Metabolic–Lipid | WC, BMI, TG, HDL | No | No | No | Restricted to lipid–anthropometric markers; does not assess autonomic or functional domains |
| METS-VF | Metabolic–Visceral | WC, glucose, TG/HDL, age | No | No | No | Focused solely on metabolic–visceral axis; lacks functional and autonomic markers |
| CMR Scores | Metabolic–Anthropometric | Glucose, TG, HDL, BP, BMI, WC | No | No | No | Based on static variables; provides no insight into early autonomic or functional impairment |
| C.O.R.E. Score | Autonomic–Metabolic–Functional–Structural | HRV, DFA-α1, RHR, WC, handgrip strength, EAT, VAT/SAT | Yes | Yes | Yes | First integrated multidomain model combining resilience indicators and structural burden; requires validation in prospective cohorts |
Abbreviations: BMI, body mass index; BP, blood pressure; C.M.R., cardiometabolic risk; C.O.R.E., cardio-obesity risk evaluation; DFA-α1, detrended fluctuation analysis alpha-1; EAT, epicardial adipose tissue; HDL, high-density lipoprotein; HRV, heart rate variability; METS-VF, Metabolic Score for Visceral Fat; RHR, resting heart rate; SAT, subcutaneous adipose tissue; TG, triglycerides; VAI, visceral adiposity index; VAT, visceral adipose tissue; WC, waist circumference.
Table 2.
Official C.O.R.E. Table – Domains, Range, Meaning.
| Domain | Category | Range | Direction | Physiological Meaning |
|---|---|---|---|---|
| HRV (RMSSD/SDNN) | Positive | 0–30 | Higher = better | Autonomic resilience |
| DFA-α1 Step Test | Positive | 0–30 | Higher = better | Metabolic & aerobic efficiency |
| RHR | Positive | 0–30 | Lower = better | Autonomic/metabolic fitness |
| WC | Positive | 0–10 | Lower = better | Central adiposity burden |
| Handgrip Strength | Positive | 0–20 | Higher = better | Functional/physiological reserve |
| EAT | Negative | -20–0 | Higher = worse | Structural cardiac adiposity |
| VAT/SAT + Rectus Fat | Negative | -20–0 | Higher = worse | Abdominal/ectopic adiposity |
Abbreviations DFA-α1, detrended fluctuation analysis alpha-1; EAT, Epicardial Adipose Tissue; HRV, Heart Rate Variability; RMSSD, Root Mean Square of Successive Differences; RHR, Resting Heart Rate; SAT, Subcutaneous Adipose Tissue; SDNN, Standard Deviation of NN Intervals; VAT, Visceral Adipose Tissue; VAT/SAT, Visceral Adipose Tissue/Subcutaneous Adipose Tissue; WC, Waist Circumference.
Table 3.
Proposed Interpretation and Preliminary Thresholds (Pending Validation).
| C.O.R.E. Score Range | Risk Interpretation | Predominant Phenotype |
|---|---|---|
| ≥ 80 | Normal / Resilient | High autonomic–functional–metabolic integrity |
| 40–79 | Intermediate cardiometabolic risk | Early dysfunction / mixed phenotype |
| < 40 | High cardiometabolic risk | Structural–autonomic–metabolic deterioration |
Thresholds are hypothesis-generating; clinical cut-offs require prospective validation.
Table 4.
Operationalization of the C.O.R.E. Score: Clinical Measurement, Key Cut-Offs, and Interpretation.
Table 4.
Operationalization of the C.O.R.E. Score: Clinical Measurement, Key Cut-Offs, and Interpretation.
| Domain | Clinical Measurement | Key Cut-offs (C.O.R.E.) | Clinical Interpretation |
|---|---|---|---|
| Resting HRV | 5-min supine ECG recording; RMSSD and SDNN analysis; avoidance caffeine/nicotine/exercise before testing. |
RMSSD ≥30 ms (high resilience); 20–29 ms (early autonomic dysregulation); <20 ms (high autonomic risk) |
Early autonomic marker linked to vagal tone, inflammation, and cardiometabolic vulnerability |
| DFA-α1 Step Test | Submaximal step or treadmill test; steady-state DFA-α1 analysis during exercise. | α1 ≥0.85 (preserved complexity); 0.75–0.84 (mild dysfunction); <0.75 (impaired metabolic–autonomic coupling) |
Identifies metabolic inflexibility, low CRF, and early mitochondrial inefficiency |
| RHR | Seated or supine HR after 5–10 min rest; validated HR monitor. | <70 bpm (optimal); 70–79 bpm (moderate risk); ≥80 bpm (high sympathetic burden) |
Predictor of mortality risk, autonomic imbalance, and reduced fitness |
| WC | Measurement at midpoint between iliac crest and lower ribs; end-expiration. | Sex-specific IAS/ICCR thresholds | Surrogate marker of visceral adiposity; identifies central obesity not captured by BMI |
| Handgrip Strength | Handheld dynamometer; dominant hand; best of three trials. | Age- and sex-adjusted quintiles; lowest quintile = highest risk | Marker of muscular reserve, metabolic health, frailty, and mortality |
| EAT | Echocardiography (linear thickness); CT/MRI (volumetric assessment) | <5 mm (typical); ≥7–9 mm (increased cardiometabolic burden) |
Local indicator of inflammation; associated with AF, HFpEF, and TOFI phenotype |
| VAT/SAT + Rectus Fat Ratio | Ultrasound or CT/MRI | Higher VAT/SAT or rectus fat ratio = higher structural/metabolic risk | Detects ectopic adiposity, insulin resistance, and early metabolic dysfunction |
Provides a concise clinical summary of each C.O.R.E. domain, including recommended measurement techniques, scoring thresholds, physiological significance, and supporting evidence.Abbreviations: AF, Atrial Fibrillation; CRF, Cardiorespiratory Fitness; CT, Computed Tomography; DFA, Detrended Fluctuation Analysis; DFA-α1, Detrended Fluctuation Analysis alpha-1; EAT, Epicardial Adipose Tissue; HFpEF, Heart Failure with Preserved Ejection Fraction; HR, Heart Rate; HRV, Heart Rate Variability; IAS/ICCR, International Atherosclerosis Society/International Chair on Cardiometabolic Risk; MRI, Magnetic Resonance Imaging; RMSSD, Root Mean Square of Successive Differences; RHR, Resting Heart Rate; SAT, Subcutaneous Adipose Tissue; SDNN, Standard Deviation of NN Intervals; TOFI, Thin Outside Fat Inside; VAT, Visceral Adipose Tissue; VAT/SAT, Visceral Adipose Tissue/Subcutaneous Adipose Tissue; WC, Waist Circumference.
Disclaimer/Publisher’s Note: The statements, opinions and data contained in all publications are solely those of the individual author(s) and contributor(s) and not of MDPI and/or the editor(s). MDPI and/or the editor(s) disclaim responsibility for any injury to people or property resulting from any ideas, methods, instructions or products referred to in the content. |
© 2025 by the authors. Licensee MDPI, Basel, Switzerland. This article is an open access article distributed under the terms and conditions of the Creative Commons Attribution (CC BY) license (http://creativecommons.org/licenses/by/4.0/).
Copyright: This open access article is published under a Creative Commons CC BY 4.0 license, which permit the free download, distribution, and reuse, provided that the author and preprint are cited in any reuse.


