
Submitted:
15 December 2025
Posted:
18 December 2025
You are already at the latest version
Abstract
The aim of this study is to investigate the impact of layered nano-modifiers with distinct chemical structure and morphology, namely graphene nanoplates (GnP) and sodium montmorillonite (Na-MMT), on thermal degradation of polylactic acid (PLA). The exploration was performed with thermogravimetric analysis (TGA), differential scanning calorimetry (DSC), and pyrolytic gas chromatography–mass spectrometry (PyGCMS). The findings revealed a catalytic effect of Na MMT on PLA thermal destabilization, manifested in accelerated degradation and the notable change in the composition of pyrolysis products. In contrast, the incorporation of graphene nanoplates into the PLA matrix induced a “barrier effect”: it imposed diffusion limitations on the emission of volatile degradation products during pyrolysis, which is enhanced the thermal stability of the PLA/GnP composite and led to quantitative alterations in the distribution of major pyrolysis products. To elucidate the underlying degradation pathways, authors proposed a model kinetic analysis of thermal degradation for both PLA/GnP and PLA/Na MMT composites. The analysis clearly distinguished the mechanistic differences between the two systems: while Na MMT promotes catalytic decomposition, GnP primarily acts as the physical barrier retarding mass transport and delaying the thermal degradation development. Good alignment of theoretical model-kinetic predictions with Pyrolysis–GC–MS observations confirms the robustness of suggested kinetic modeling method.
Keywords:
polylactide
; thermal degradation
; kinetics modeling
; graphene nanoplates
; Na-montmorillonite
; atomic force microscopy
; differential scanning calorimetry
; thermogravimetric analysis
; gas chromatography–mass spectrometry
1. Introduction
The polylactides (PLA), classified as aliphatic polyesters synthesized from bio-based lactic acid, have gained recognition as a viable biopolymer alternative to conventional petroleum-derived plastics. Although PLA exhibit acceptable mechanical properties and barrier characteristics, their thermal stability fall within the optimal requirements, constituting a major limitation in its applications [1,2,3,4,5,6]. To overcome this inherent limitation and expand application potential, PLA is frequently combined with different functional fillers. Among these, nanosized carbon materials, such as carbon nanotubes, carbon fibres, graphene, and graphite nanoplates (GnP) and layered clays as Na-MMT and organically modified MMT have attracted considerable interest. The integration of such fillers into PLA matrices results in the formation of advanced nanocomposite materials. These composites demonstrate superior electrical conductivity, enhanced barrier performance, improved physico-mechanical properties, elevated thermal stability, and lowered flammability [7,8,9,10,11,12,13,14,15,16,17,18,19,20]. The exploration of novel applications for such composites constitutes a widespread area of both fundamental and applied research.
In general, the thermal degradation of PLA involves a complex of chemical processes, including: radical-chain «zipper-like» depolymerization, intermolecular transesterification, yielding monomeric and oligomeric esters and intramolecular transesterification, leading to oligomer formation [21,22,23,24,25]. These processes were studied in detail in the classical works by McNeill et all and Kopinke [24,25]. The ester interchange mechanism of PLA degradation leading to the formation of lactides with two lactic acid residues (n=2) was suggested on the grounds of pyrolysis products analysis. On the other hand, the formation of cyclic oligomers with n> 2 was explained by the intra-molecular transesterification mechanism [18]. In addition to lactides and PLA cyclic oligomers, such compounds as CO, CO2, acetaldehyde, acrylic acid, and acetone were identified in the pyrolysis products [20,21]. Key studies by Kopinke and McNeill et al. [24,25] have provided detailed insights into the mechanisms driving these processes. The breakdown of polylactic acid (PLA) through the backbiting ester interchange pathway was hypothesized following an analysis of pyrolysis by-products. This pathway leads to the creation of lactides that contain two lactic acid residues (n=2). On the other hand, the formation of cyclic oligomers with n>2 is believed to stem from intramolecular transesterification, as outlined in reference [25]. In addition to lactides and cyclic PLA oligomers, pyrolysis yields a range of other compounds. Among these are carbon monoxide (CO), carbon dioxide (CO₂), acetaldehyde, acrylic acid, and acetone [26]. To date, scientists have proposed various routes for PLA thermal degradation. These pathways cover both non-radical and radical reaction mechanisms. The notable variants of PLA degradation include random chain scission, depolymerization, as well as intramolecular and intermolecular transesterification reactions [24,25,26].
Recent research by Usachev et al. [27] revealed dioxolanones as the novel degradation products of thermally degraded PLA. These findings lead to a revised mechanism of PLA thermal degradation that challenges the classical model proposed by Kopinke and McNeil [24,25]. While the traditional mechanism emphasizes non-radical reverse exchange between ester bonds and terminal hydroxyl groups, the new pathway suggests that dioxolanones form when terminal hydroxyl groups react with the α-carbon (adjacent to the carbonyl group), rather than with the ester bond. The research also investigated the effect of reduced graphene oxide (rGO ) on the pyrolysis process of polylactide (PLA) composites. Compared to pure PLA, the PLA/rGO pyrolysis products showed a significant reduction in five-membered cyclic dioxolanes, alongside increased levels of lactides and cyclic oligomeric lactides. The authors attribute this shift to rGO restricting the segmental mobility of PLA chains, thereby lowering the likelihood of dioxolane formation via the backbiting mechanism (which involves a six-membered ring transition state). Additionally, the elevated lactide concentration in PLA/rGO may stem from enhanced intramolecular reactions within the PLA chains.
Alongside the analysis of thermal degradation product composition (via pyrolysis chromatography-mass spectrometry), thermokinetic methods relying on TGA data represent an essential component in investigating the PLA thermal degradation mechanism [28,29,30].
Thermal degradation kinetics provide valuable insights into the underlying mechanisms and help predict material behavior under various conditions. Thermogravimetric Analysis (TGA) has emerged as a powerful tool for evaluating thermal degradation kinetics in polymeric materials. This technique enables the determination of key kinetic parameters, including apparent activation energy, pre-exponential factors and reaction orders. Various models can be employed to analyze thermal degradation kinetics, with isoconversion model-free methods gaining prominence due to their versatility. There are various models that can be used to calculate the activation energy, but the isoconversion model-free methods, such as the Flynn-Wall-Ozawa (FWO), Kissinger-Akahira-Sunose, ASTM, Friedman, and Coats–Redfern methods gaining prominence due to their versatility [31,32,33,34,35]. Among these, the Flynn-Wall-Ozawa (FWO) method has been particularly effective in analyzing thermal degradation processes, providing reliable results across multiple studies [33,34].
This approach enables the determination of isoconversional activation energy values without relying on any specific reaction model. Due to this feature, isoconversional techniques are commonly referred to as “model-free” methods. Since thermal degradation processes often involve multiple stages and exhibit complex behavior, a nonlinear regression-based kinetic modeling approach is employed to achieve an accurate description. The modeling workflow begins with an initial kinetic assessment using model-free isoconversion methods. This step aims to define the initial conditions along with the kinetic triplets (i.e., activation energy, pre-exponential factor, and reaction order). The data derived from this preliminary analysis can then serve as input parameters for the subsequent nonlinear approximation procedure. In this work, kinetic studies were carried out using a nonlinear regression-based kinetic modeling approach [35,36,37].
A comprehensive investigation was conducted to elucidate the effects of Na-MMT and graphene nanoplates (GNP) fillers on the thermal degradation characteristics of polylactic acid (PLA) composites. The research program encompassed: (1) structural analysis via atomic force microscopy (ASM) and differential scanning calorimetry (DSC) to evaluate filler dispersion and interactions; (2) thermogravimetric analysis (TGA) for thermal stability quantification; (3) pyrolysis gas chromatography-mass spectrometry (Py-GCMS) for detailed product analysis; and (4) kinetic modeling based on a dual-competing reaction framework. Improving the thermal stability of PLA materials is a key objective, making this study particularly valuable. The development of advanced materials and the expansion of PLA composites’ utility in diverse industries rely heavily on a profound comprehension of PLA degradation, encompassing both its mechanisms and kinetic aspects.
2. Materials and Methods
2.1. Materials
Polylactide PLA 4043D from Nature Works (Minnetonka, MN, USA) as pellets with diameter of 3mm (Mw = 2.2×10⁵, Mn = 1.65×10⁵, Тm = 155°С, polydispersity index D = Mw/Mn = 1.35, transparency 2.1 % was used as a matrix polymer.
Natural montmorillonite (Na-MMT) under the trade name of Cloisite Na+ (cation exchange capacity, CEC = 90–95 mequiv/100 g) was obtained from Southern Clay Products (Gonzalez, TX, USA). Graphite nanoplates (GnP) (XG Sciences, Michigan State University, USA) with diameter d = 10 nm, length l = 5 μ, relation l/d = 500, surface area between 120 – 150 m2/g and density ρ= 1.8 g/cm3 were taken as objects of investigation. Dichloromethane from SHARLAU (HPLC grade) was used as received.
2.2. Preparation of Compositions
Compositions of PLA/Na-MMT and PLA/GnP with 1, 5 and 10 wt.% of additives were obtained by the liquid-phase method. For obtaining mixed compositions with 1, 5 and 10 wt.% of filler (Na-MMT and GnP), PLA4043D (495, 475, and 450 mg, respectively) was dissolved in 25 mL CH2Cl2 at 22±1°C for 48 h. To the resulting solution, filler (5, 25 and 50 mg, respectively) was added. The mixture was treated on a sonication bath (35 kHz, 50 W, 30 min, 12±2°C). The resulting mixture was poured into a Petri dish. The solvent was removed at room temperature for 24 hours and then at 110°C for 6 hours.
2.3. Thermogravimetric Analysis (TGA)
Thermogravimetric analysis (TGA) of the samples was performed on NETZSCH TG 209 F1 Iris thermal balance (NETZSCH-Gerätebau GmbH, Germany) in the temperature range 25 – 800°C at the heating rate of 20°/min in inert atmosphere of Ar with a flow rate of 20 ml/min. Weight of samples were 5±1 mg. The primary criteria for assessing the thermal stability of the compositions under investigation are the onset temperature of thermal degradation (Ton) according to ASTM E2550 standard test method and the temperature at which the maximum rate of thermal degradation (Tmax) occurs, corresponding to the peak temperature observed in the Differential Thermogravimetry (DTG) analysis, which is the first derivative of the TGA curve.
2.4. Differential Scanning Calorimetry (DSC)
The thermophysical characteristics of PLA, PLA/Na-MMT and PLA/GnP compositions were studied using DSC method on a DSC-204 F1 Phoenix calorimeter (NETZSCH-Gerätebau GmbH, Germany) at the heating rate of 10 K/min in an inert atmosphere of Ar in the temperature range of 25–180°C. The numerical calculations of the enthalpy changes (ΔH) derived from integral heat flux curves (DSC curves) for of PLA and its compositions were conducted utilizing NETZSCH Proteus version 4.8.4 software. When studying the morphology of polymers by the DSC method, it is customary to use the repeated heating-cooling mode to remove the “prehistory” of their formation and “thermodynamically balance” their original structure. The degree of crystallinity of PLA samples, χ%, was calculated by equation
Where ∆Hm - enthalpy of melting, ∆Hcc - enthalpy of “cold” crystallization, α - mass fraction of GnP and Na-MMT fillers (10% by mass.), ∆H100m - the theoretical value of the of 100%-crystalline poly(L-lactide) melting enthalpy (93.6 J/g) [38].
2.5. Atomic Force Microscopy (AFM)
Structural studies to investigate dispersion and distribution of Na-MMT and GnP fillers in PLA-matrix were performed by atomic force microscopy (AFM) in intermittent contact mode (Tapping ModeTM) at room temperature using a MultiModeTM scanning probe microscope and a Nanoscope IIIATM controller (Bruker NanoSurface Inc., USA). Before the imaging to have an access to the inner structure the samples were microtomed with a diamond knife at T = -50°C using the MicroStar 01 device (USA) to obtain an extremely flat sample surface with low roughness. AFM scanning was performed with silicon probes with a hardness of ~ 40 Nm and a resonance frequency of ~150 kHz. To enhance the phase contrast, a mode was selected in which the scanning amplitude was 0.4-0.5 of the amplitude of the free oscillation of the probe.
2.6. Pyrolysis of PLA, PLA/Na-MMT and PLA/GnP Compositions
The samples of compositions (1.8±0.1 mg) were subjected to pyrolysis in inert atmosphere of Ar in a quartz horizontal tubular reactor at the temperature of 400°C which controlled with a platinum thermosensitive resistor Pt100 with the accuracy of temperature in the heating zone of sample equal to ±2°C. The pyrolysis products were removed from the reaction zone with argon flow (15 ml/min) and were collected in methylene chloride (0.6 ml) at 4°C (bath with cold water).The pyrolysis products were removed from the reaction zone with argon flow (15 ml/min) and were collected in methylene chloride (0.6 ml) at 4°C (bath with cold water). The analysis of the obtained products was carried out by GC/MS method without further treatment.
2.7. Gas Chromatography–Mass Spectrometry (GC–MS)
GC-MS measurements were performed on a gas chromatograph Trace-1310 and ISQ™ Single Quadrupole Mass Spectrometer (Thermo Fisher Scientific Inc.) as described earlier [20] (S13). MS-spectra of degradation components were identified and interpreted by matching the results with NIST 2011 Mass Spectral library. All detected degradation products were standardized by relative peak area of particular product (RPAi) according to equation
where PAi – peak area of particular product, ΣPAi – sum of peak areas of all detected products. Relative peak area of particular product (RPAi) presents a sum of RPAi for corresponded fraction.
2.8. Model Thermokinetics
Model Kinetic analysis of PLA, PLA/Na-MMT and PLA/GnP compositions thermal degradation was carried out using NETZSCH Thermokinetics 3.0 software by NETZSCH-Gerätebau GmbH.
3. Results
3.1. AFM Characterization
To elucidate in what form Na-MMT and GNP nanofillers were incorporated into PLA matrix, the results of the high-resolution AFM technique providing the «phase» images was presented in Figure 1. AFM imaging was carried out for the PLA/Na MMT and PLA/GNP samples containing the same concentrations of the fillers (5 wt.%). It should be noted that the changes in contrast for the AFM images are due to change in the oscillation phase of the probe when it interacts with regions of the polymer matrix having different mechanical properties being due to stiffness or adhesion [39]. In our case, the brightest areas correspond to rigid fillers plates, while the dark ones belong to the PLA matrix.
Images on Figure 1 (a-c) indicates that the filler of Na -MMT layered clay are quite evenly distributed in PLA matrix. It can be seen the areas where two consistent processes are observed: the first one (Figure 1b) corresponds to the initial intercalation of the matrix material between the layers of Na-MMT clay which are 5-10 nm in thickness and the second one (Figure 1c) shows the areas of filler exfoliation.
Figure 2 shows the cross-section of the morphological structure in the PLA/GNP composite with interconnected layers of GNP particles with ~10 nm in the thickness. They are preferentially oriented along the flow alignment of polymer matrix during mixing and subsequent pressing at high-temperature.
3.2. DSC Analysis of PLA/CR PLA/Na-MMT and PLA/GnP Compositions
Differential scanning calorimetry (DSC) was employed to investigate how fillers affect the thermophysical properties and morphological characteristics of the synthesized composites.
Figure 3 shows the DSC thermograms obtained in a repeated heating-cooling mode for PLA and its various composites containing 1, 5 and 10 wt.% of Na-MMT (Figure 3 a, b) and PLA/GnP (Figure 3 c, d). The key DSC parameters analyzed include the glass transition temperature (Tg), the peaks temperatures for cold crystallization (Tcc) and the melting (Tm). Additionally, the characteristic enthalpies related to cold crystallization (ΔHcc) and melting (ΔHm), as well as the degree of crystallization (χ,%), are summarized in Table 1. The analysis of data presented in Figure 3 and Table 1 indicates that a transition from a glassy to an elastic state occurs in all PLA/GnP specimens within the temperature range of 53.9 to 64.6°C for the first heating and in a narrower temperature range of 61.3 to 62.0°C for the second heating, respectively. For PLA/Na-MMT compositions the glass transition occurs within the temperature range of 51.0 to 66.4°C for the first heating and in a narrower temperature range of 60.8 to 61.2°C for the second heating, respectively.
At temperatures exceeding 110.5°C, all PLA compositions exhibited an exothermic effect associated with "cold crystallization" (Table 1). It is important to highlight that a distinct double endothermic melting peak is observed during second heating in the profile of PLA/GnP 10 wt.% composition, as illustrated in Figure 3 b and Table 2. These peaks are characteristic of α-ordered (orthorhombic) and α′-limit disordered (hexagonal) crystalline forms of PLA [40]. The analysis of the primary heating via DSC technique presented in Table 1 shows that the PLA/Na-MMT 10 wt.% and PLA/GnP 10 wt.% samples exhibit the highest degree of crystallinity for all the samples, measuring 39.7% and 34.2%, respectively.
The obtained results indicate that Na-MMT particles, and to a lesser extent GnP ones, can act as the effective nucleating agents promoting PLA crystallization in the composites. Comparative DSC analysis of the second heating cycle for PLA, PLA/Na-MMT, and PLA/GnP composites revealed that an increase in the filler concentration in the PLA matrix leads to a marked growth in ΔHcc relative to the first heating, indicating a nucleating effect of the fillers. Furthermore, the degree of crystallinity dropped more than tenfold upon reheating (Table 1).
3.3. Thermogravimetric Analysis of PLA/Na-MMT and PLA/GnP Compositions
In this study, the effect of Na-MMT and GnP additives on the thermal stability of PLA was investigated. As already noted in the introduction, GTP and Na-MMT fillers have different effects on the thermal degradation of PLA. GnP acts as a stabilizing agent in PLA composites, increasing thermal stability as evidenced by higher onset degradation temperatures (Ton) and maximum degradation temperatures (Tmax). This improvement is attributed to the strong interactions between GNP and PLA, which hinder polymer chain breakdown during heating. Additionally, GNP can act as a barrier to heat penetration, reducing mass loss.
In contrast, Na-MMT clay often leads to a decrease in PLA's thermal stability. The filler addition can lower the onset degradation temperature and reduce the temperature at which maximum weight loss occurs. This destabilizing effect may be due to the presence of sodium cations or traces of water molecules located in the clay structure, which can catalyze degradation reactions. The thermogravimetric (TG) curves and their corresponding derivatives (DTG) curves obtained in this work are depicted in Figure 4. A summary of the key parameters derived from the TG curves, which are critical for assessing the dynamics of material degradation, is provided in Table 2, where Ton (onset) denotes the temperature at which the degradation of the sample commences and Tmax signifies the temperature at which the degradation rate of the sample reaches its maximum.
The thermal analysis data (Figures 4a-d and Table 2) reveal divergent trends: PLA/GnP composites demonstrate enhanced thermal stability compared to unmodified PLA, with stability increasing monotonically with GnP content (Figures 4a–b, Table 2). In contrast, PLA/Na-MMT composites exhibit reduced thermal stability relative to pure PLA, with stability decreasing as Na-MMT concentration rises (Figures 4c–d, Table 2).
The trends become particularly evident in Figure 5, which plots how the experimental Tₒₙ and Tₘₐₓ values vary with the concentration of fillers (GnP and Na-MMT) added to the PLA polymer matrix.
It is evident that Na MMT play a crucial role in promoting the depolymerization of polylactic acid (PLA) through an unzipping mechanism. This process appears to engage both hydroxyl and carbonyl functional groups in the polymer structure. Additionally, an alternative reaction pathway involving interchain transesterification may be activated. Consequently, the presence of Na-MMT in PLA compositions leads to a noticeable decrease in thermal stability. In contrast, the thermal stabilizing effect of GnP in PLA composites is demonstrated by increased onset (Ton) and maximum (Tmax) degradation temperatures. Two primary mechanisms contribute to this improvement: (1) robust interfacial interactions between GnP and PLA that limit the mobility of polymer chains in the molten degradation phase, and (2) the formation of a physical barrier by GnP particles that hinders both heat propagation and mass transfer, ultimately reducing material loss during thermal decomposition.
3.4. Pyrolysis–Gas Chromatography–Mass Spectrometry (PyGCMS) of PLA, PLA/Na-MMT and PLA/GnP Compositions
Pyrolysis of PLA, PLA/Na-MMT, and PLA/GnP composites was performed at 400°C in Ar, which corresponds to the final stage of thermal degradation as evidenced by the TG curves (Figure 4). The resulting pyrolysis products were analyzed using gas chromatography coupled with mass spectrometric detection (GC-MS). Figure 6 presents chromatograms of the pyrolysis products for pure PLA and PLA/Na-MMT composites containing 1 , 5 and 10 wt.% filler. The corresponding composition data are provided in Table 6. Analysis of the data presented in Table 6 reveals that lactides and dioxalanones represent the predominant pyrolysis products generated from both PLA and its Na-MMT composite formulations. This data corroborates findings from prior studies of Usachev et al. [27] where nanolayered clay and nanographite additives significantly modify the thermal degradation behavior of PLA. These results demonstrated that such layered materials substantially modified the balance of the main pyrolysis products (lactides and 1,3-dimethyldioxolan-4-ones).
Figure 6.
Chromatograms of pyrolysis products for pristine PLA (1), PLA/Na-MMT 1 wt.% (2), PLA/Na-MMT 5 wt.% (3) and PLA/Na-MMT 10 wt.% (4).
Figure 6.
Chromatograms of pyrolysis products for pristine PLA (1), PLA/Na-MMT 1 wt.% (2), PLA/Na-MMT 5 wt.% (3) and PLA/Na-MMT 10 wt.% (4).
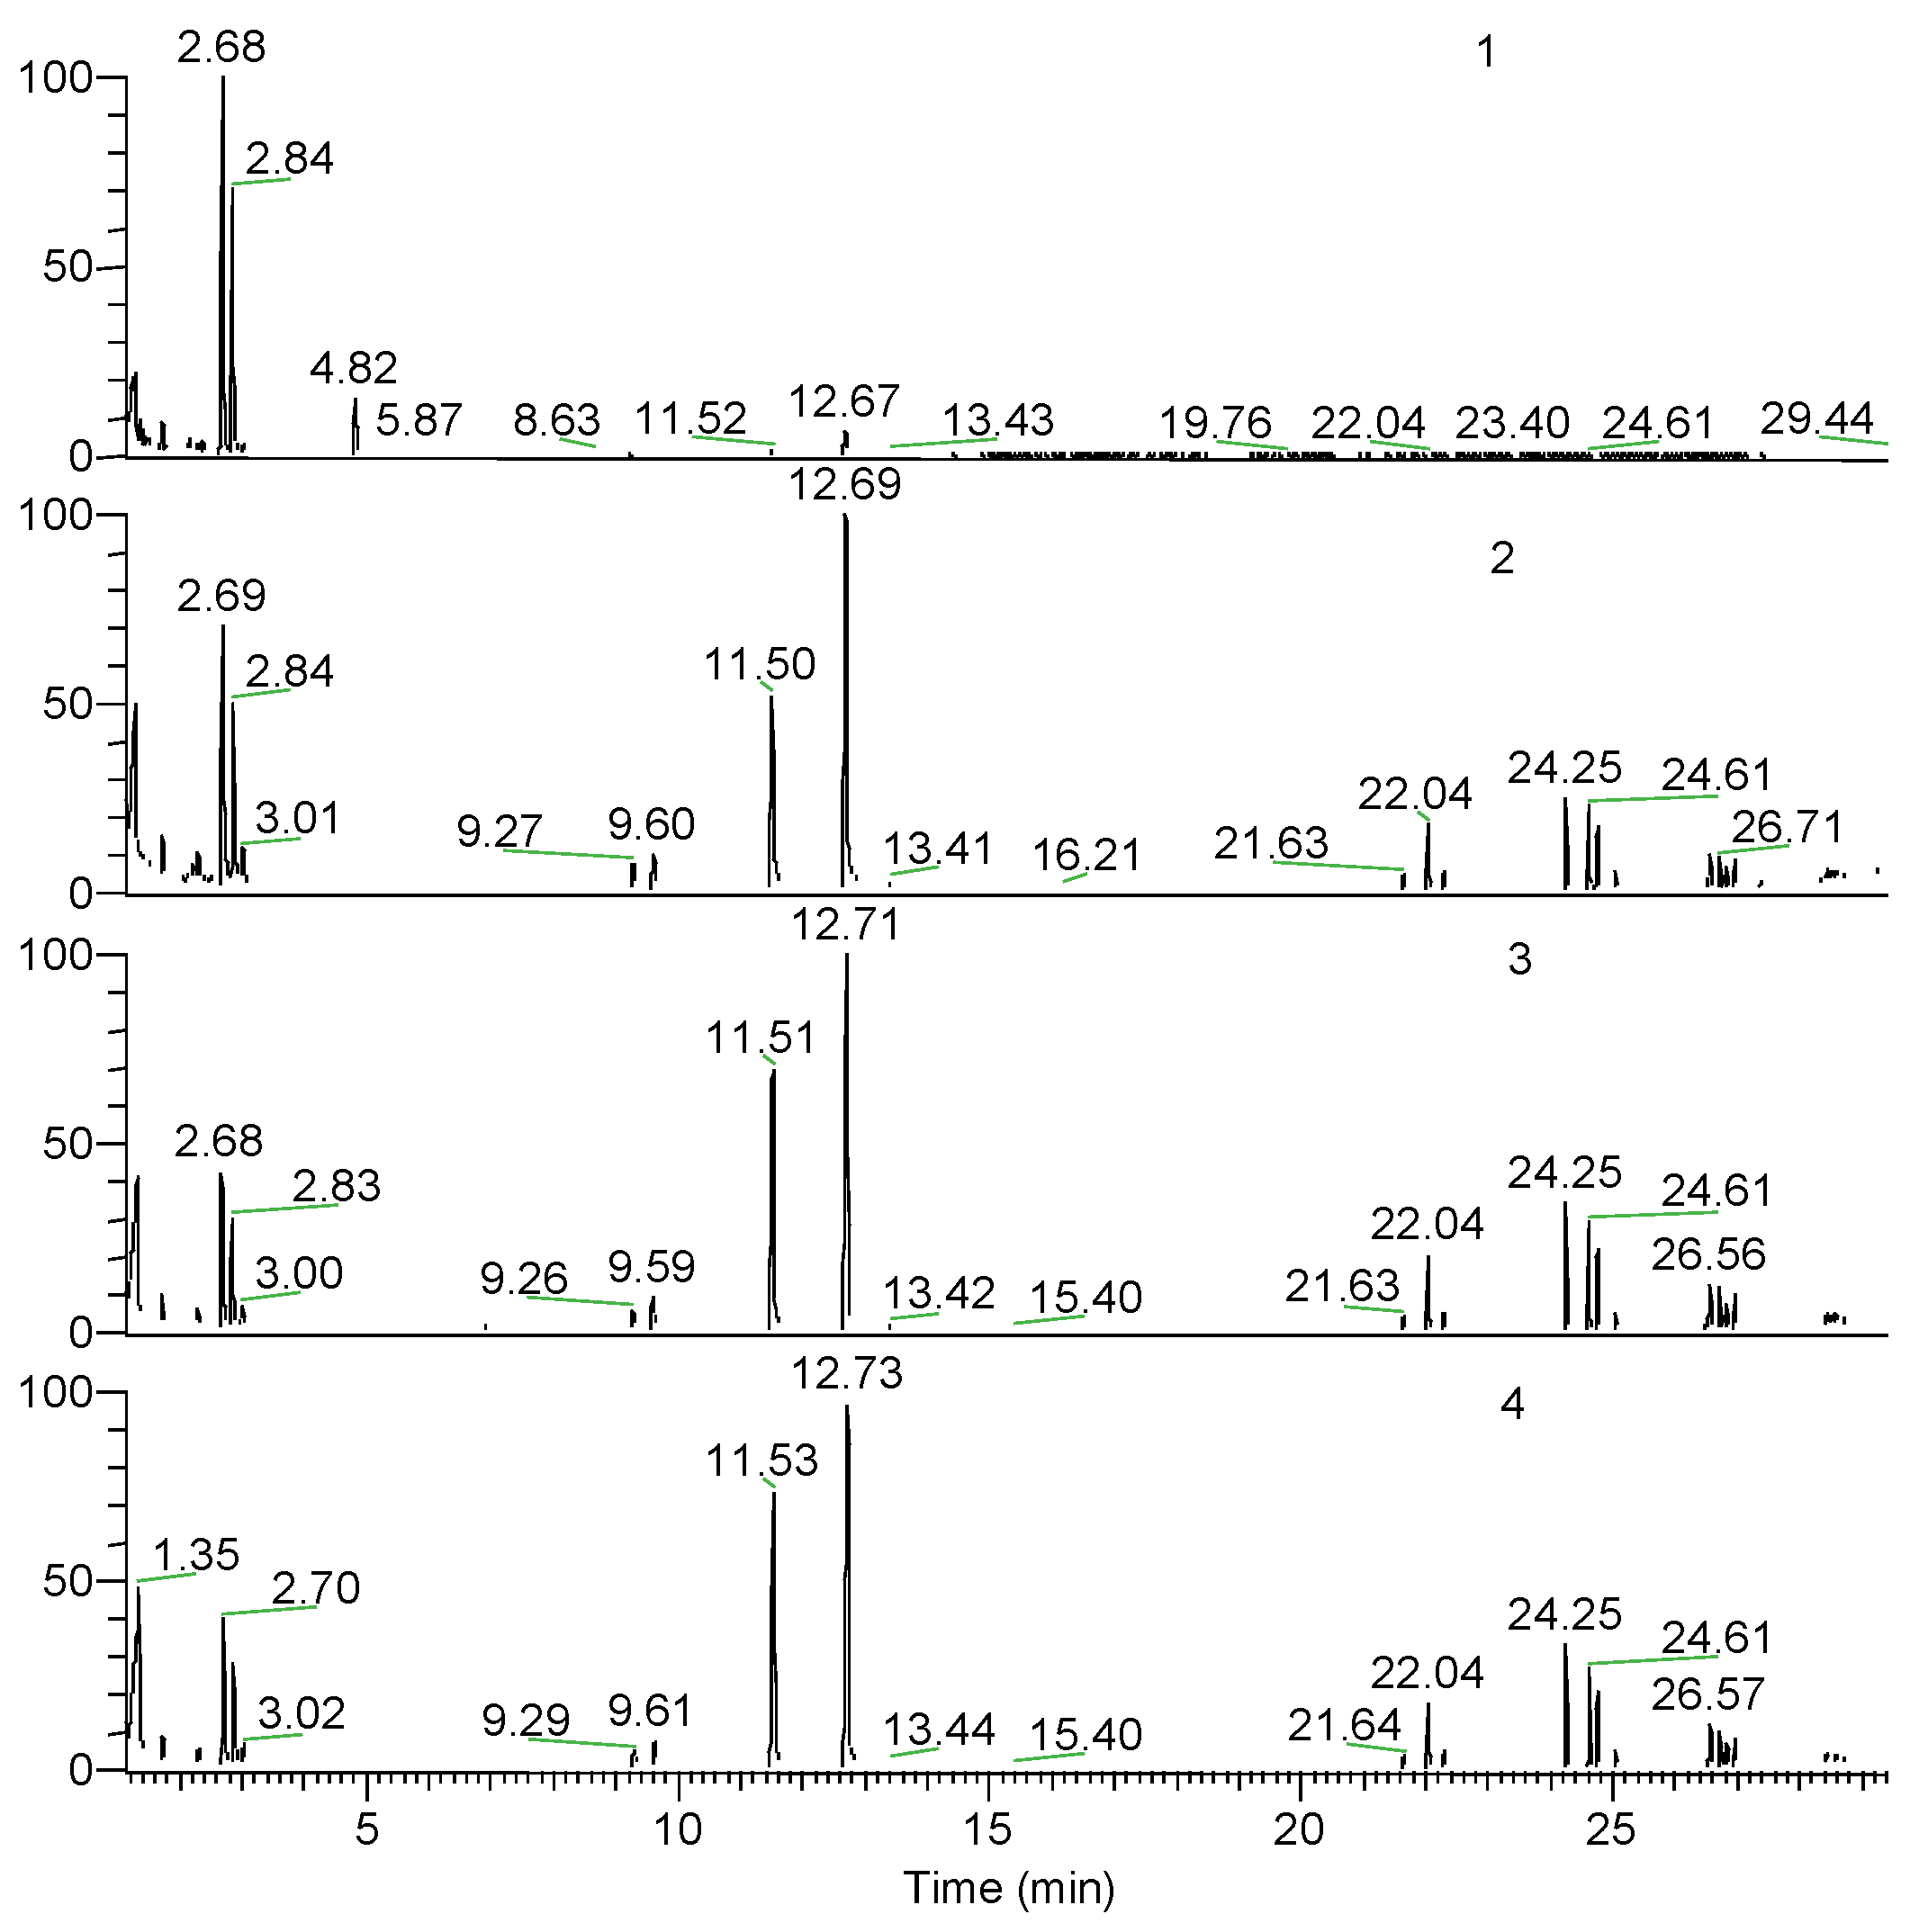

Table 3.
The content of pyrolysis products (PAi) of PLA and PLA/Na-MMT with a filler content of 1, 5 and 10 wt.%, respectively.
Table 3.
The content of pyrolysis products (PAi) of PLA and PLA/Na-MMT with a filler content of 1, 5 and 10 wt.%, respectively.
| Retention time (min) | Pyrolysis products | PAi (wt.%) | |||
| 0 | 1 | 5 | 10 | ||
| 1.32 | Acrylic acid | 9.10 | 8.90 | 8.00 | 9.83 |
| 2.15 | Vinylacetic acid | 1.48 | 0.80 | 0.36 | 0.23 |
| 2.65 | cis-1,3-dimethyldioxolan-4-one | 49.03 | 15.29 | 9.18 | 8.99 |
| 2.8 | trans-1,3-dimethyldioxolan-4-one | 34.60 | 10.65 | 6.45 | 6.09 |
| 11.48 | meso-lactide | 0.85 | 11.29 | 15.54 | 16.92 |
| 12.69 | D,L-lactide | 2.85 | 21.87 | 22.04 | 22.06 |
| 21.6 ÷ 22.2 | Trimer (n=3) | 0.45 | 5.23 | 6.32 | 5.54 |
| 24.2 ÷ 24.7 | Tetrame (n=4) | 0.54 | 13.56 | 18.64 | 18.30 |
| 26.5 ÷ 26.9 | Pentamer (n=5) | 0.00 | 5.88 | 8.34 | 7.56 |
| Unidentified compounds | 1.11 | 6.52 | 5.12 | 4.47 | |
Figure 7.
Chromatograms of pyrolysis products for PLA (1), PLA/GnP 1 wt.% (2), PLA/GnP 5 wt.% (3) and PLA/GnP 10 wt.% (4).
Figure 7.
Chromatograms of pyrolysis products for PLA (1), PLA/GnP 1 wt.% (2), PLA/GnP 5 wt.% (3) and PLA/GnP 10 wt.% (4).
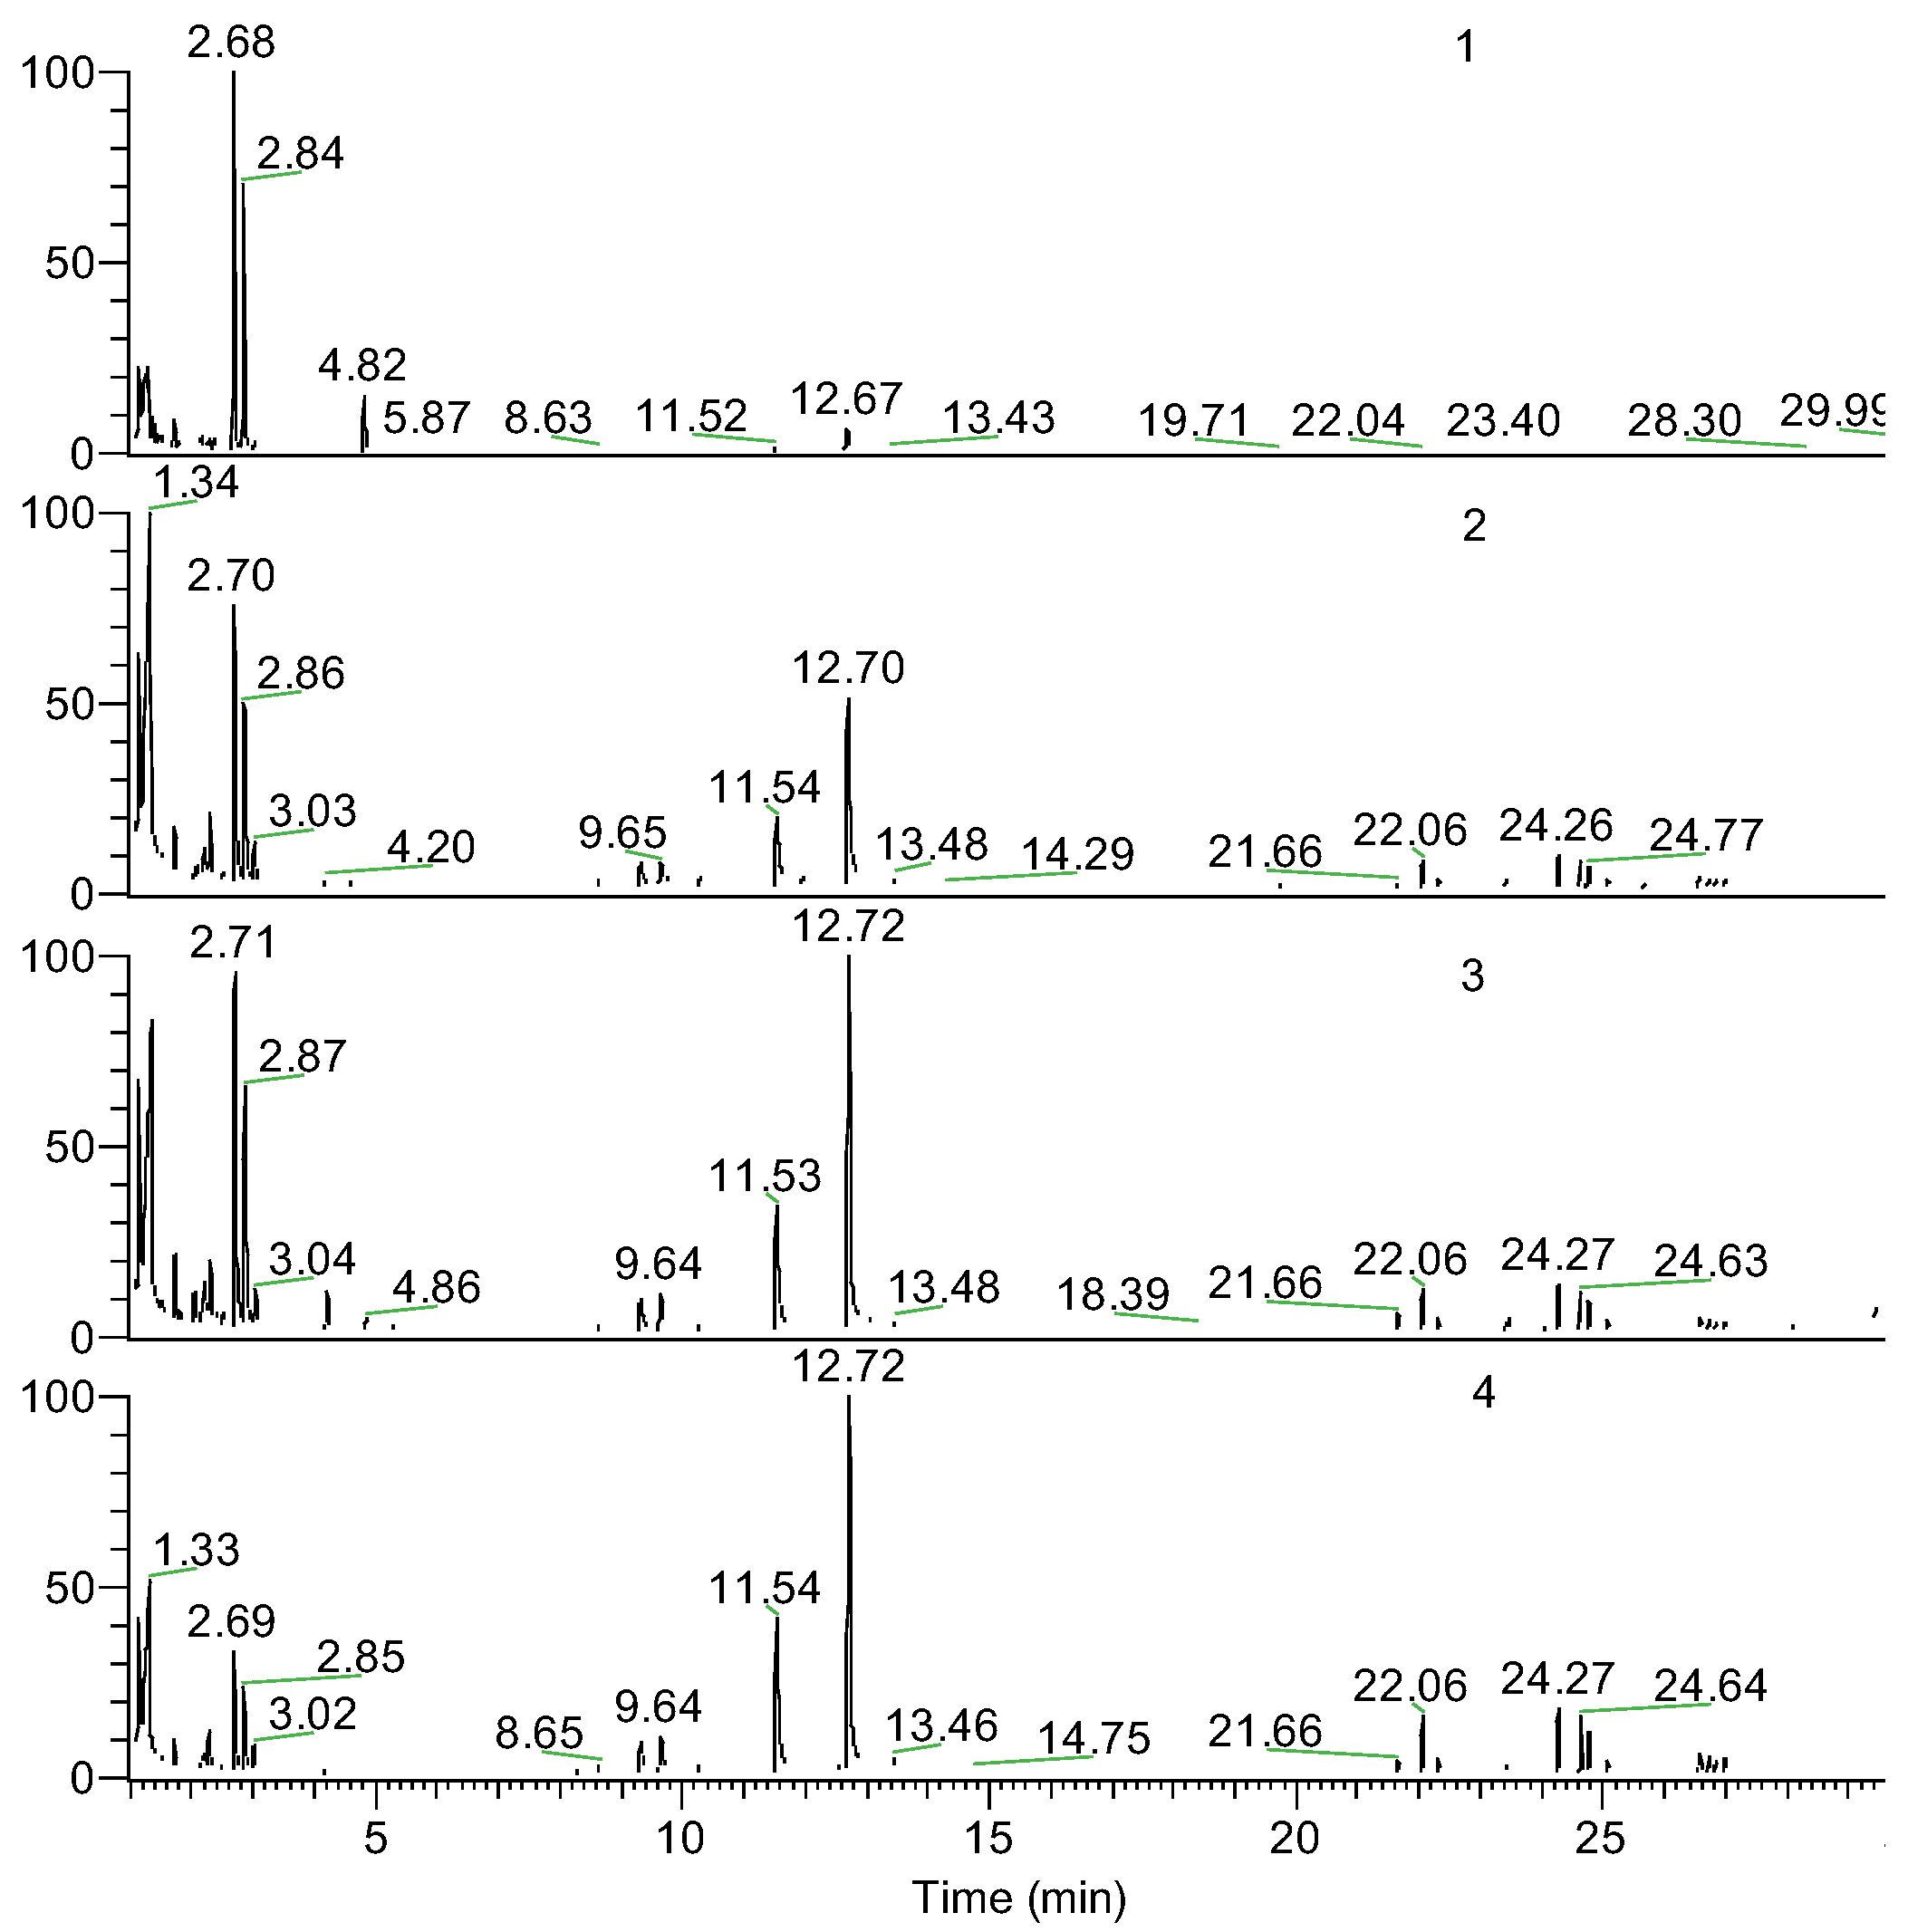
Table 4.
The content of pyrolysis products (PAi) of PLA and PLA/ GnP with a filler content of 1, 5 and 10 wt.%, respectively.
Table 4.
The content of pyrolysis products (PAi) of PLA and PLA/ GnP with a filler content of 1, 5 and 10 wt.%, respectively.
| Retention time (min) | Pyrolysis products | PAi (wt.%) | |||
| 0 | 1 | 5 | 10 | ||
| 1.36 | Acrylic acid | 9.10 | 25.91 | 16.39 | 13.33 |
| 2.19 | Vinylacetic acid | 1.48 | 2.13 | 2.25 | 1.06 |
| 2.7 | cis-1,3-dimethyldioxolan-4-one | 49.03 | 21.70 | 20.86 | 9.14 |
| 2.85 | trans-1,3-dimethyldioxolan-4-one | 34.60 | 14.01 | 14.10 | 6.43 |
| 11.53 | meso-lactide | 0.85 | 5.26 | 7.21 | 11.78 |
| 12.71 | D,L-lactide | 2.85 | 14.56 | 21.72 | 28.40 |
| 21.6÷22.2 | Trimer (n=3) | 0.45 | 3.06 | 3.78 | 6.17 |
| 24.2÷24.7 | Tetrame (n=4) | 0.54 | 6.23 | 6.34 | 12.36 |
| 26.5÷26.9 | Pentamer (n=5) | 0.00 | 2.20 | 1.91 | 4.33 |
| Unidentified compounds | 1.11 | 4.95 | 5.43 | 6.98 | |
According to the previous study [27] thermal degradation of PLA, primarily results in the formation of two types of cyclic compounds: five-membered 1,3-dimethyldioxolan-4-ones and six-membered lactides.
Proposed thermal degradation mechanism of PLA is schematically represented in Figure 8. The figure illustrates: (A) the unzipping depolymerization (designated 1) and (B) intermolecular reactions featuring end groups (designated 2) route to cyclic lactides [19]; and a pathway leading to five-membered cyclic 1,3-dimethyldioxolan-4-ones (3) [22].
The content analysis of PLA composite pyrolysis products (Table 5 and Figure 9) revealed that increasing fillers concentration (Na-MMT, GnP) in PLA composites alters the ratio of primary thermal degradation products. Specifically, in both PLA/Na-MMT and PLA/GnP systems, the proportion of five-member cyclic 1,3-dimethyldioxolan-4-ones decreases, while that of six-member cyclic lactides increases. Notably, the elevating lactide levels in thermal degradation products and the varying the (A):(B) proportion is considerably stronger in PLA/Na-MMT than PLA/GnP composites. The layered aluminosilicate Na-MMT appears to exert catalytic influence on the PLA degradation process. When filler concentration increases to 10 wt. %, the quantitative (A):(B) relationship becomes nearly equivalent in both composite types. This equalization is presumably due to the hindering of PLA macromolecules mobility induced by the fillers’ layered configuration [27].
3.5. Kinetic Analysis of Thermal Degradation for PLA, PLA/Na-MMT and PLA/GnP Compositions
Nonlinear kinetic modeling of thermal degradation is a crucial aspect in understanding the stability and decomposition behavior of polymers such as polylactic acid (PLA) and its composites. This modeling approach involves analyzing how these materials break down under heat, which is essential for applications requiring thermal resistance and for optimizing processing conditions. The study typically compares experimental thermogravimetric analysis (TGA) data with theoretical model predictions to validate the kinetic parameters and degradation mechanisms. In the context of PLA, PLA/MMT, and PLA/GnP, the analysis provides insights into how different fillers influence thermal stability.
MMT (montmorillonite) and GnP (graphene nanoplates) are commonly used to enhance the properties of PLA, including its thermal resistance. The comparison between experimental data (represented by dots) and model results (depicted by firm lines) at various heating rates allows researchers to evaluate the accuracy of the kinetic models and understand the degradation pathways. The kinetic models often involve complex mathematical equations that describe the rate of thermal degradation as a function of temperature and material composition. These models help in predicting the behavior of materials under different thermal conditions, which is vital for designing materials with specific performance criteria. The analysis also aids in identifying the activation energy and reaction mechanisms involved in the degradation process. Understanding the thermal degradation behavior through nonlinear kinetic modeling is essential for developing more durable and thermally stable polymer composites. It also contributes to the advancement of sustainable materials by optimizing their processing and end-use performance. Overall, this approach provides a comprehensive understanding of the thermal stability of PLA-based materials and their composites, guiding future research and industrial applications.
Research into the kinetics of material degradation dates back many years and has led to the development of numerous data analysis approaches. In practice, thermogravimetric analysis (TGA) is commonly used to collect experimental data for kinetic modelling — this technique was also adopted in the present study.
It is generally accepted that the degradation of materials follows the base equation (1) [41]:
where: t - time, T - temperature, co - initial concentration of the reactant, and cf - concentration of the final product.
dc/dt = - F(t,T co cf),
Mathematically, the right-hand term of the equation F(t,T,co,cf) decomposes into two independent functions: a temperature dependent term k(T) and a concentration dependent term f(co,cf):
F(t,T,co,cf) = k[T(t)·f(co,cf)],
Arrhenius equation (4) will be assumed to be valid for the following:
where: A is the pre-exponential factor and E is the activation energy.
k(T) = A·exp(-E/RT),
Therefore:
dc/dt= - A·exp(-E/RT)·f(co,cf ),
All possible reactions fall into two main categories: classical homogeneous reactions and typical solid-state reactions, which are summarized in Table 6. The analytical results of thermal kinetic analysis should demonstrate a good fit to experimental data obtained under various temperature profiles using a unified kinetic model.
Kinetic analysis of thermal degradation of PLA, PLA/Na-MMT 10 wt.%, and PLA/GnP 10 wt.% at heating rates of 5, 10, and 20 K/min was accomplished using the interactive model-based nonlinear regression fitting approach in accordance with a formalism proposed earlier [35]. Regression values were calculated using the 5th-degree Runge-Kutta method for approximate solutions for ordinary differential equations (ODEs) with the built-in Prince-Dormand formula for automatic optimization of the number of significant digits using the NETZSCH Thermokinetic 3 software.
In order to assess the activation energy for development of a reasonable model for kinetic analysis of PLA, PLA/Na-MMT and PLA/GnP thermal degradation processes, a few evaluations by model-free Ozawa analysis have been done as the starting point [42].
Since in these studies of the composites thermal degradation a dependence of the residual mass on the heating rate was observed (Figure 1, Figure 2 and Figure 3), a model of branched type reactions was proposed.
Further, nonlinear model fitting procedure for PLA, PLA/Na-MMT and PLA/GnP TGA-curves has led to the following two-stage model scheme of completive reactions (Figure 10).
Thermal degradation of PLA and PLA/Na-MMT was also assumed to follow first-order kinetics across all competitive stages, as secondary processes are unlikely at ~350°C (peak of maximum degradation temperature; Table 2).
With best fidelity, the undertaken nonlinear model two-stage model scheme of reactions wherein a general first-order (F1) reactions were used for PLA thermal degradation, first-order autocatalysis reactions (C1) were used for PLA/Na-MMT and two completive Avrami-Erofeev (An) type’s reactions for PLA/GnP thermal degradation.
This model can be expressed through a system of two differential equations.
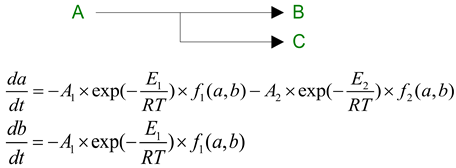
Where f1 (a,b) and f2 (a,b) – reaction types corresponding to F1 (first-order reaction), C1 (first-order reaction with autocatalysis) and An (n-dimensional nucleation, AVRAMI-EROFEEV) reaction models equations;
Figure 11, Figure 12 and Figure 13 show the graphical outcomes of applying nonlinear fitting model to PLA, PLA/Na-MMT and PLA/GnP thermal degradation. All the figures display experimental thermogravimetric analysis (TGA) results as discrete data points (dots), alongside the corresponding model predicted curves (solid lines) for three different heating rates: 5 K/min, 10 K/min, and 20 K/min.
Table 7 contains the principal kinetic parameters for the composite’s thermal degradation process, namely activation energies and pre-exponential factors.
Model Step 1 refers to the reaction pathway yielding 1,3-dimethyldioxalan-4-ones, whereas Model Step 2 denotes the reaction leading to lactide formation (see Figure 10).
Data analysis revealed that activation energies and pre-exponential factors at Model Step 1 are lower than those in the Model Step 2 stage of yielding lactides. For pristine PLA, activation energy rises notably between stages: E₁ = 176.8 kJ/mol (Model Step 1) and E₂ = 229.3 kJ/mol (Model Step 2).
Table 7 shows similar trends for PLA/Na-MMT and PLA/GnP: activation energies increase from Model Step 1 to Model Step 2, though the rise is less pronounced than for pure PLA. This finding aligns with PyGCMS data (Figure 11), which demonstrate a shift in the lactide-to-1,3-dimethyldioxolan-4-one ratio (A:B) toward higher lactide concentrations in the total volatile degradation products compared to neat PLA.
In the present work, isothermal degradation simulations (predictions) at a constant temperature of 400 °C were conducted for PLA, PLA/Na-MMT 10% wt. and PLA/GnP 10%wt. These predictions were obtained by solving the forward kinetics problem using the input kinetic parameters obtained from the model kinetic analysis presented in Table 7. These calculations were conducted to establish a correlation between the quantitative PYGCMS results and the calculated values obtained from the kinetic accumulation curves of the five-membered cyclic 1,3-dimethyldioxolan-4-ones and six-membered cyclic lactides formed during sample pyrolysis at 400°C.
The graphical representation in Figure 14 provides quantitative data on the kinetic behavior of thermal degradation processes at 400°C, with separate curves depicting: the consumption kinetics of PLA (kinetic curve A), the accumulation dynamics of 1,3-dimethyldioxolan-4-ones (kinetic curve B) and the formation kinetics of lactides (kinetic curve C).
Numerical validation of the computed isothermal kinetic parameters was performed by cross-referencing them with the experimental PYGCMS dataset (the concentrations of five-membered cyclic 1,3-dimethyldioxolan-4-ones and six-membered cyclic lactides formed during sample pyrolysis at 400°C), as presented in Tables 3, and Figure 9.
Fair agreement between model-predicted kinetics results and Py-GC-MS experimental data strongly supports the validity and practical utility of the proposed kinetic modeling approach.
4. Conclusions
An in-depth study employing TGA, DSC, PyGC/MS, AFM, thermokinetic modelling and prediction methods were conducted on PLA, PLA/Na MMT, and PLA/GnP composites. The results provide valuable insights into the impact of graphene and clay fillers on the structural properties, thermal stability, and thermal degradation mechanisms of PLA composites leading to several important finding:
- Morphological analysis using AFM showed successful incorporation of fillers into the PLA matrix. Na-MMT demonstrated intercalation and exfoliation processes, while GnP formed interconnected layers with preferential orientation.
-
Thermal behavior investigation via DSC revealed that:Both fillers Na-MMT and GnP acted as nucleating agents, increasing PLA crystallinity;Na-MMT showed more significant nucleating effect on crystallinity of PLA than GnP (up to 39.7%);
-
Thermal stability assessment using TGA demonstrated:Na-MMT decreased thermal stability with increasing concentration by catalytical effect of Na-MMT on PLA depolymerization through an unzipping mechanism; In contrast to Na-MMT GnP improved thermal stability of PLA composition (growth of Ton and Tmax) due to the formation of a physical barrier by GnP particles that hinders mass transfer, ultimately reducing material loss by volatilizing of degradation products during thermal decomposition.
-
Degradation mechanism study by PYGCMS showed:Formation of lactides and dioxalanones as main degradation products; Change in product ratio depending on filler type and concentration; Different effects of Na-MMT and GnP on degradation pathways of PLA.
-
Kinetic modeling has successfully described the thermal degradation behavior of PLA-based materials through formal scheme of two-stage competing reactions where:The first stage produces 1,3-dimethyldioxalan-4-ones; The second stage leads to lactide formation; PLA follows first-order kinetics; PLA/Na-MMT exhibits first-order autocatalytic reactions; PLA/GnP shows Avrami-Erofeev type kinetics;GnP and Na-MMT fillers modify the degradation mechanism;Both fillers influence the ratio of degradation products;
-
The developed kinetic model provides:Accurate prediction of thermal degradation behavior; Quantitative description of reaction mechanisms; Insight into the influence of fillers on degradation processes.
Validation results confirm the reliability of the model, providing good agreement between theoretical predictions and experimental data of PYGCMS, as evidenced by high values of correlation coefficients (up to 0.999889) and consistent Durbin-Watson statistics.
The results obtained offer a solid foundation for designing thermally stable PLA-based materials with tailored degradation properties for specific applications.
Author Contributions
Conceptualization, S.L.; Data curation, S.R.; Funding acquisition, A.I. and V.S.; Investigation, E.K., S.U., N.S., A.K. and N.E.; Methodology, A.I.; Project administration, A.B.; Supervision, A.B.; Validation, O.K.; Visualization, O.K.; Writing—original draft, S.L.; Writing—review and editing, S.L., V.S. and A.I. All authors have read and agreed to the published version of the manuscript.
Funding
This work was performed under financial support of the Ministry of Education and Science of the Russian Federation (contracts no. 122041300207-2 and 125012200641-2).
Institutional Review Board Statement
Not applicable.
Data Availability Statement
Data Availability Statement: The data presented in this study are available on request from the corresponding author.
Conflicts of Interest
The authors declare no conflict of interest.
References
- Lee, T.S.; Bee, S.T. Polylactic Acid. A Practical Guide for the Processing, Manufacturing, and Applications of PLA. In A volume in Plastics Design Library, 2nd ed.; Elsevier Inc., 2019, 422 p. [CrossRef]
- Nofar, M.; Sacligil, D.; Carreau, P.J.; Kamal, M.R.; Heuzey, M.-C. Poly (lactic acid) blends: Processing, properties and applications. Journal of Biological Macromolecules 2019, 125, 307–360. [CrossRef]
- Murariu, M.; Dubois, P. PLA composites: From production to properties. Advanced Drug Delivery Reviews 2016, 107, 17–46. [CrossRef]
- Abu-Zurayk, R.; Khalaf, A.; Alnairat, N.; Waleed, H.; Bozeya, A.; Abu-Dalo, D.; Rabba’a, M. Green polymer nanocomposites: bridging material innovation with sustainable industrial practice. Frontiers in Materials 2025, 12, 12:1701086. [CrossRef]
- Scaffaro, R.; Maio, A.; Gammino, M. Hybrid biocomposites based on polylactic acid and natural fillers from Chamaerops humilis dwarf palm and Posidonia oceanica leaves. Adv Compos Hybrid Mater 2022, 5, 1988–2001. [CrossRef]
- Scaffaro, R.; Maio, A.; Gammino, M. Electrospun polymeric nanohybrids with outstanding pollutants adsorption and electroactivity for water treatment and sensing devices. Adv Compos Hybrid Mater 2024, 7, 13. [CrossRef]
- Ibrahim, N.; Jollands, M.; Parthasarathy R. Mechanical and thermal properties of melt processed PLA/organoclay nanocomposites. In Proceedings of the IOP Conference Series: Materials Science and Engineering, 2nd International Conference on Mining, Material and Metallurgical Engineering, Bangkok, Thailand, 17–18 March 2017. [CrossRef]
- Kontou, E.; Niaounakis, M.; Panayiotis, G. Comparative study of PLA nanocomposites reinforced with clay and silica nanofillers and their mixtures. J Appl. Polym. Sci. 2011, 122, 1519–1529. [CrossRef]
- Botta, L.; Scaffaro, R.; Sutera, F.; Mistretta, M.C. Reprocessing of PLA/Graphene Nanoplates Nanocomposites. Polymers 2018, 10, 18. [CrossRef]
- Sinha Ray, S.; Bousmina, M. Biodegradable polymers and their layered silicate nanocomposites: In greening the 21st century materials world. Progress in Materials Science 2005, 50 (8), 962–1079. [CrossRef]
- Singha, S.; Hedenqvist, M. S. A Review on Barrier Properties of Poly(LacticAcid)/Clay Nanocomposites. Polymers 2020, 12(5), 1095. [CrossRef]
- Kalendova, A.; Smotek, J.; Stloukal, P.; Kracalik, K.M.; Slouf, M.; Laske, S. Transport Properties of PLA/Clay Nanocomposites. Polym. Eng. Sci. 2019, 59, 2498–2501. [CrossRef]
- Lai, S.-M.; Wub, S.-H.; Lin, G.-G.; Don, T.-M. Unusual mechanical properties of melt-blended poly(lactic acid) (PLA)/clay nanocomposites. Eur. Polym. J. 2014, 52, 193–206. [CrossRef]
- Kuruma, M.; Bandyopadhyay, J.; Sinha Ray, S. Thermal Degradation Characteristic and Flame Retardancy of Polylactide-Based Nanobiocomposites. Molecules, 2018, 23(10). [CrossRef]
- Angelova, P. Mechanical and thermal properties of PLA based nanocomposites with graphene and carbon nanotubes. Journal of Theoretical and Applied Mechanics 2019, 49, 241–256. [CrossRef]
- Maio, A.; Pibiri, I.; Morreale, M.; La Mantia, F.P.; Scaffaro, R. An Overview of Functionalized Graphene Nanomaterials for Advanced Applications. Nanomaterials 2021, 11(7), 1717. [CrossRef]
- Gulino, E.F.; Citarrella, M.C.; Maio, A.; Scaffaro R. An innovative route to prepare in situ graded crosslinked PVA graphene electrospun mats for drug release. Composites Part A: Applied Science and Manufacturing 2022, 155, 106827. [CrossRef]
- Scaffaro, R.; Maio, A.; Gulino, E.F.; Morreale, M.; La Mantia, F.P. Effects of Nanoclay on the Mechanical Properties, Carvacrol Release and Degradation of a PLA/PBAT Blend. Materials 2020, 13(4), 983. [CrossRef]
- Rucinska, K.; Florjanczyk, Z.; Debowski, M.; Gołofit, T.; Malinowski, R. New Organophilic Montmorillonites with Lactic Acid Oligomers and Other Environmentally Friendly Compounds and Their Effect on Mechanical Properties of Polylactide (PLA). Materials 2021, 14, 6286. [CrossRef]
- Bourbigot, S.; Fontaine, G. Flame retardancy of polylactide: an overview. Polym. Chem. 2010, 1, 1413–1422. [CrossRef]
- Tsuji, H.; Fukui, I.; Daimon, H.; Fujie, K. Poly(l-lactide) XI. Lactide formation by thermal depolymerisation of poly(L-lactide) in a closed system. Polymer Degradation and Stability 2003, 81, 501–509. [CrossRef]
- Fan, Y.J.; Nishida, H.; Shirai, Y.; Tokiwa, Y.; Endo, T. Thermal degradation behaviour of poly(lactic acid) stereocomplex. Polymer Degradation and Stability 2004, 86, 197–208. [CrossRef]
- Mori, T.; Nishida, H.; Shirai, Y.; Endo T. Effects of chain end structures on pyrolysis of poly(L-lactic acid) containing tin atoms. Polymer Degradation and Stability 2004, 84, 243–251. [CrossRef]
- McNeill, I.C.; Leiper H.A. Degradation studies of some polyesters and polycarbonates-2. Polylactide: degradation under isothermal conditions, thermal degradation mechanism and photolysis of the polymer. Polym. Degrad. Stab. 1985, 11, 309–326. [CrossRef]
- Kopinke, F.D.; Mackenzie, K. Mechanistic aspects of the thermal degradation of poly(lactic acid) and poly(β-hydroxybutyric acid). J. Anal. Appl. Pyrol. 1997, 40–41, 43–53. [CrossRef]
- Arrieta, M.P.; Parres, F.; Lopez, J.; Jimenez A. Development of a novel pyrolysis-gas chromatography/mass spectrometry method for the analysis of poly(lactic acid) thermal degradation products. Journal of Analytical and Applied Pyrolysis 2013, 101, 150–155. [CrossRef]
- Usachev, S.V.; Lomakin, S.M.; Koverzanova, E.V.; Shilkina, N.G.; Prut, E.V.; Rogovina, S.Z.; Berlin, A.A.; Levina, I.I. Thermal degradation of various types of polylactides research. The effect of reduced graphite oxide on the composition of the PLA4042D pyrolysis products. Thermochimica Acta 2022, 712, 179227. [CrossRef]
- Carrasco, F.; Perez-Maqueda, L.A.; Sanchez-Jimenez, P.E.; Perejon, A.; Santana, O.O.; Maspoch, M.Ll. Enhanced general analytical equation for the kinetics of the thermal degradation of poly(lactic acid) driven by random scission. Polymer Testing 2013, 32 (5), 937–945. [CrossRef]
- Shanshan, Lv.; Zhang, Y.; Tan, H. Thermal and thermo-oxidative degradation kinetics and characteristics of poly (lactic acid) and its composites. Waste Management 2019, 87, 335–344. [CrossRef]
- Chrissafis, K. Detail kinetic analysis of the thermal decomposition of PLA with oxidized multi-walled carbon nanotubes. Thermochimica Acta 2010, 511, 163–167. [CrossRef]
- Vyazovkin, S.; Burnham, A.K.; Criado, J.; Perez-Maqueda, L.; Popescu, C.; Sbirrazzuoli, N. ICTAC Kinetics Committee recommendations for performing kinetic computations on thermal analysis data. Thermochim Acta 2011, 520 (1–2), 1–19. [CrossRef]
- Vyazovkin, S. Isoconversional methods: The many uses of variable activation energy. Thermochimica Acta 2024, 733, 179701. [CrossRef]
- Bayon, R.; Garcia-Rojas, R.; Rojas, E.; Rodriguez-Garcia, M.M. Assessment of isoconversional methods and peak functions for the kinetic analysis of thermogravimetric data and its application to degradation processes of organic phase change materials. J. Therm. Anal. Calorim. 2024, 149, 13879–13899. [CrossRef]
- Shrivastava, D.K.; Singh, A.K.; Chakraborty, J.P. Model-free isoconversional methods to determine the intrinsic kinetics and thermodynamic parameters during pyrolysis of boiled banana peel: influence of inorganic species. Bioresource Technology Reports 2023, 24, 101676. [CrossRef]
- Budrugeac, P.; Segal, E. Application of isoconversional and multivariate non-linear regression methods for evaluation of the degradation mechanism and kinetic parameters of an epoxy resin. Polymer Degradation and Stability 2008, 93 (6), 1073–1080. [CrossRef]
- Lomakin, S.; Brevnov, P.; Koverzanova, E.; Usachev, S.; Shilkina, N.; Novokshonova, L.; Krasheninnikov, V.; Berezkina, N.; Gajlewicz, I.; Lenartowicz-Klik, M. The effect of graphite nanoplates on the thermal degradation and combustion of polyethylene. Journal of Analytical and Applied Pyrolysis 2017, 128, 275–280. [CrossRef]
- Lomakin, S.M.; Rogovina, S.Z.; Grachev, A.V.; Prut, E.V.; Alexanyan, Ch.V. Thermal degradation of biodegradable blends of polyethylene with cellulose and ethylcellulose. Thermochimica Acta 2011, 521 (1–2), 66–73. [CrossRef]
- Fischer, E.W.; Sterzel, H.J.; Wegner, G. Investigation of the structure of solution grown crystals of lactide copolymers by means of chemical reactions. Kolloid-Zeitschrift und Zeitschrift für Polymere 1973, 251, 980–990. [CrossRef]
- Magonov, S.N.; Whangbo, M.-H. Surface Analysis with STM and AFM: Experimental and Theoretical Aspects of Image Analysis. Wiley-VCH, Germany, 2008, 335.
- Lomakin, S.; Mikheev, Y.; Usachev, S.; Rogovina, S.; Zhorina, L.; Perepelitsina, E.; Levina, I.; Kuznetsova, O.; Shilkina, N.; Iordanskii, A.; Berlin, A. Evaluation and Modeling of Polylactide Photodegradation under Ultraviolet Irradiation: Bio-Based Polyester Photolysis Mechanism. Polymers 2024, 16, 985. [CrossRef]
- Opfermann, J. Kinetic Analysis Using Multivariate Non-linear Regression. I. Basic concepts. Journal of Thermal Analysis and Calorimetry 2000, 60, 641–658. [CrossRef]
- Ozawa, T. Applicability of Friedman plot. Journal of Thermal Analysis 1986, 31, 547–551. [CrossRef]
Figure 1.
Phase AFM images of PLA/Na-MMT 5% wt. composite at different magnifications: (a) – 5 x 5 µm; (b) and (c) – 1 x 1 µm.
Figure 1.
Phase AFM images of PLA/Na-MMT 5% wt. composite at different magnifications: (a) – 5 x 5 µm; (b) and (c) – 1 x 1 µm.
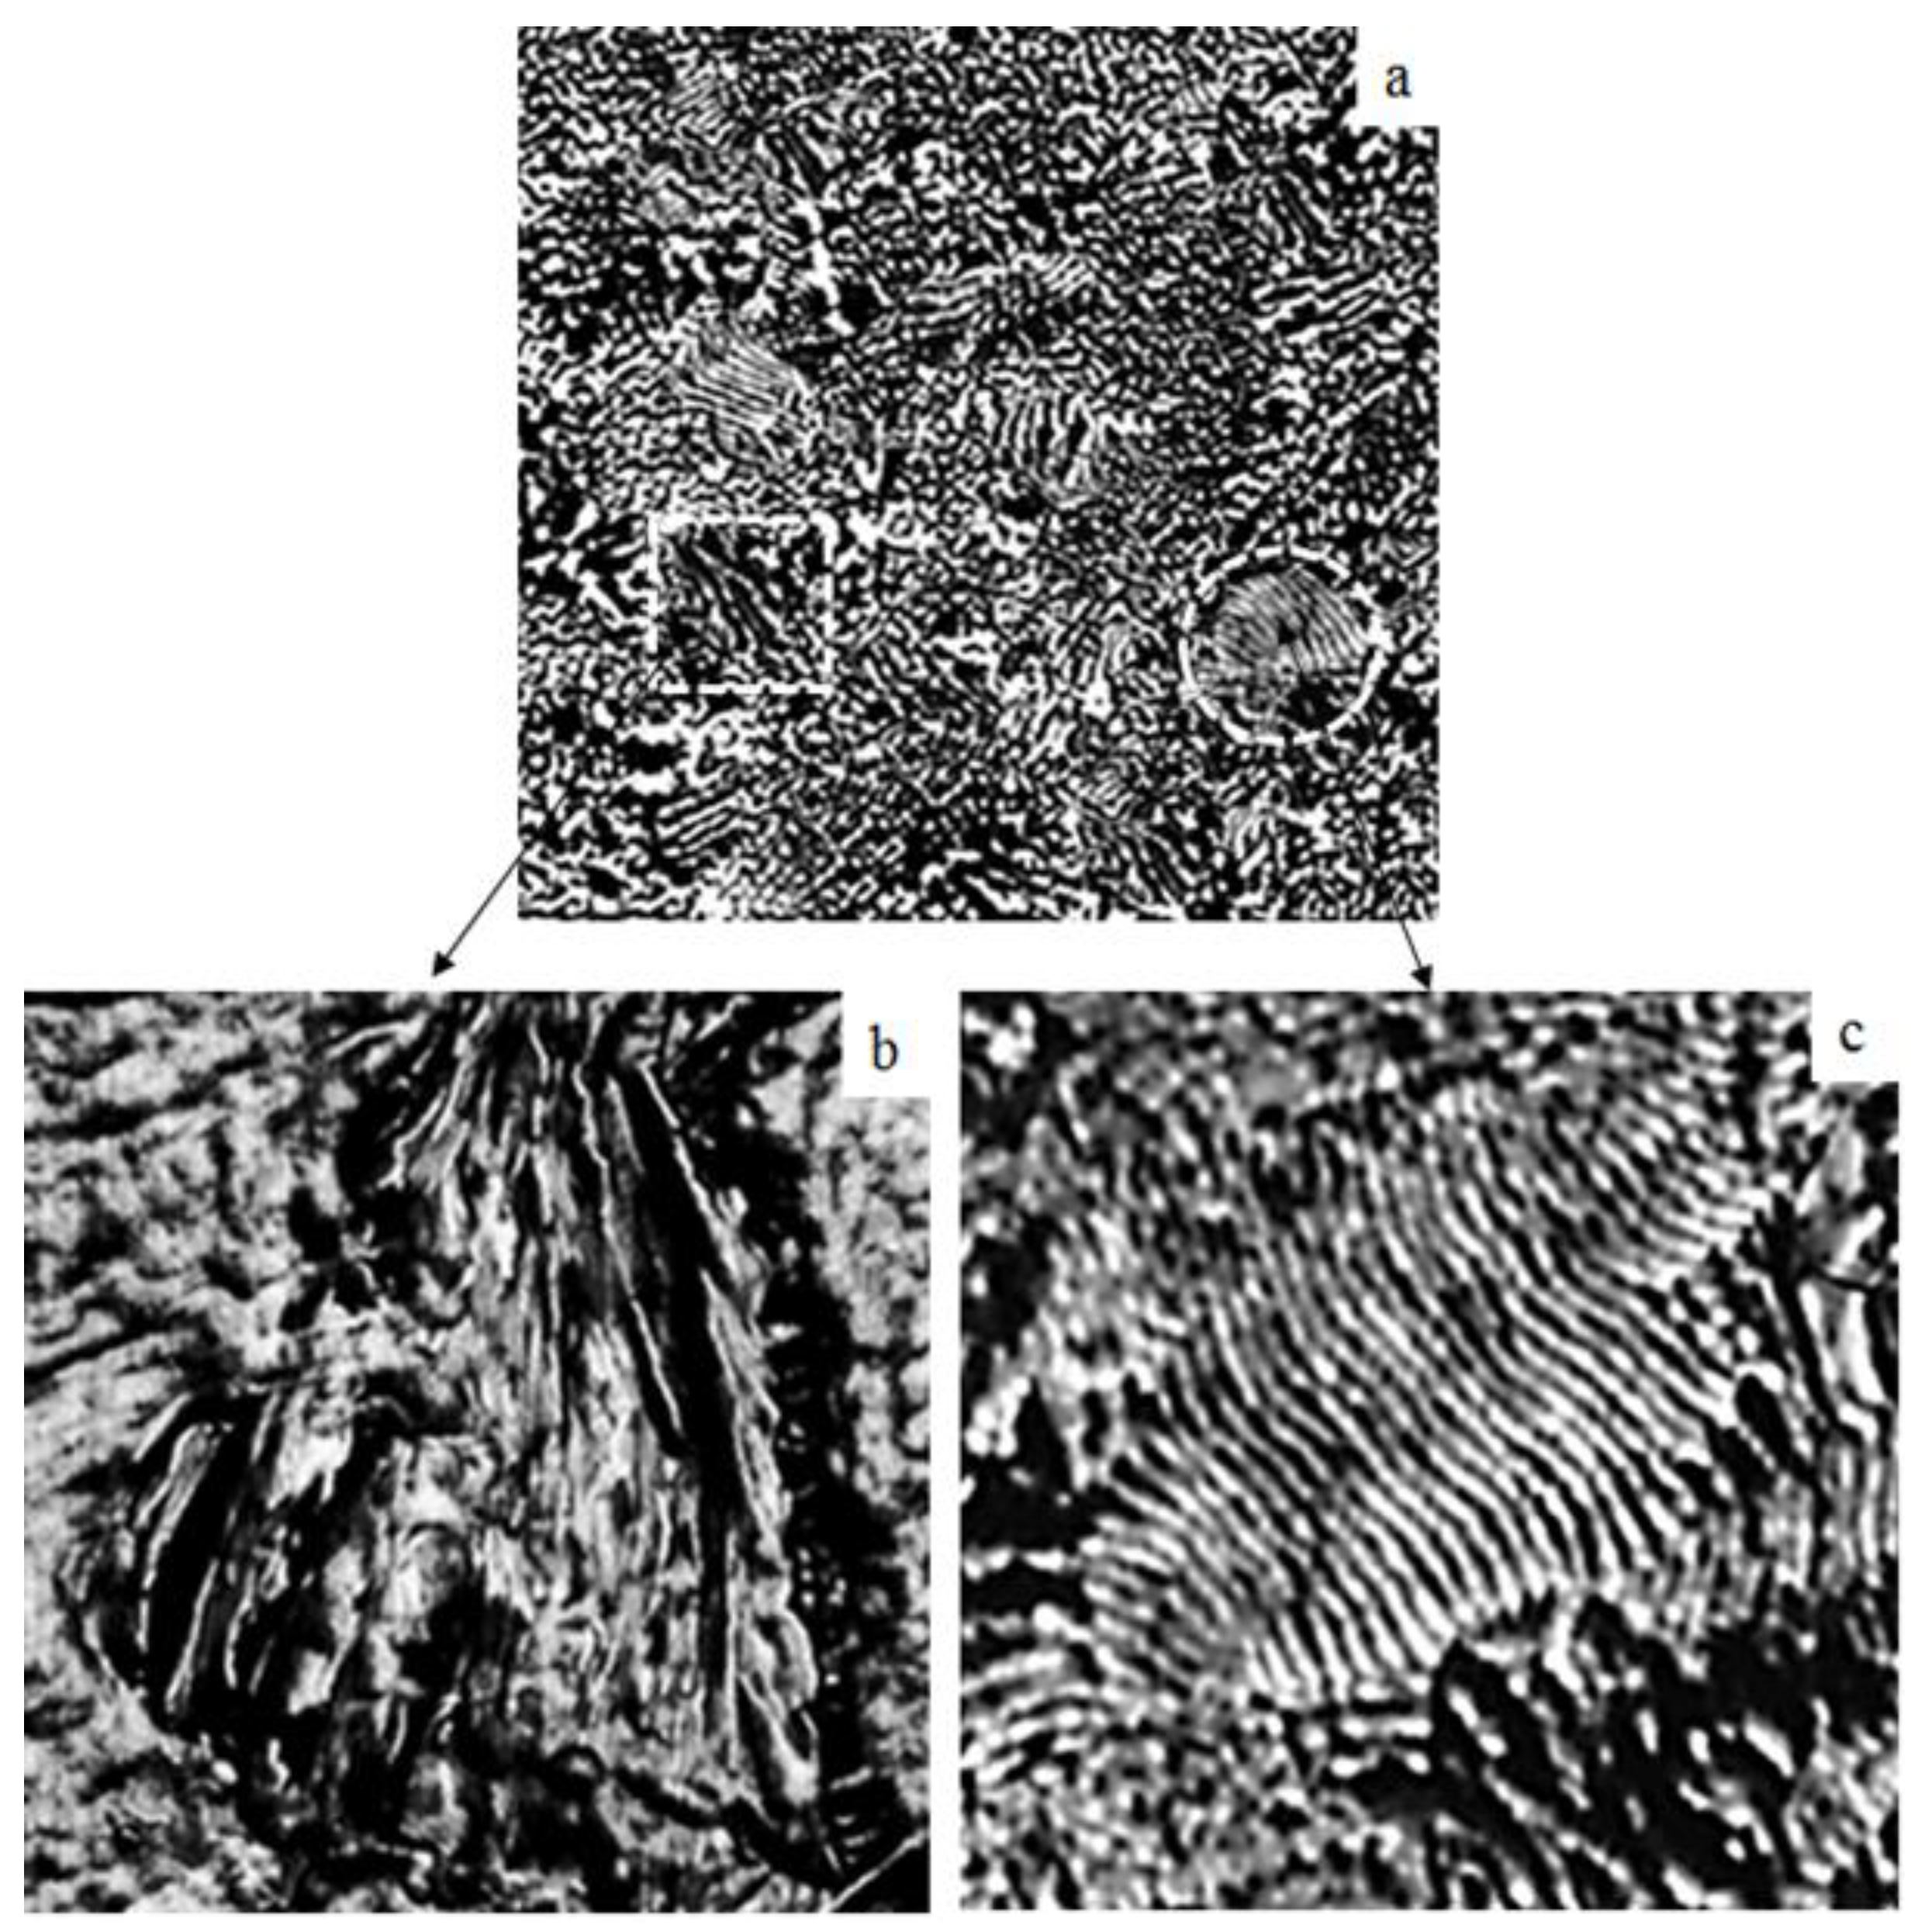
Figure 2.
Image (1x1 µm) of PLA/GNP composite.
Figure 3.
The DSC thermograms depicting both primary and secondary heating for two composite systems: PLA/GNP (a), ( b) and PLA/Na-MMT (c), (d). The curves correspond to the following samples: 1 — neat PLA; 2 — PLA containing 1 wt.% of either Na-MMT or GNP; 3 — PLA with 5 wt.% of Na-MMT or GNP; 4 — PLA with 10 wt.% of Na-MMT or GNP.
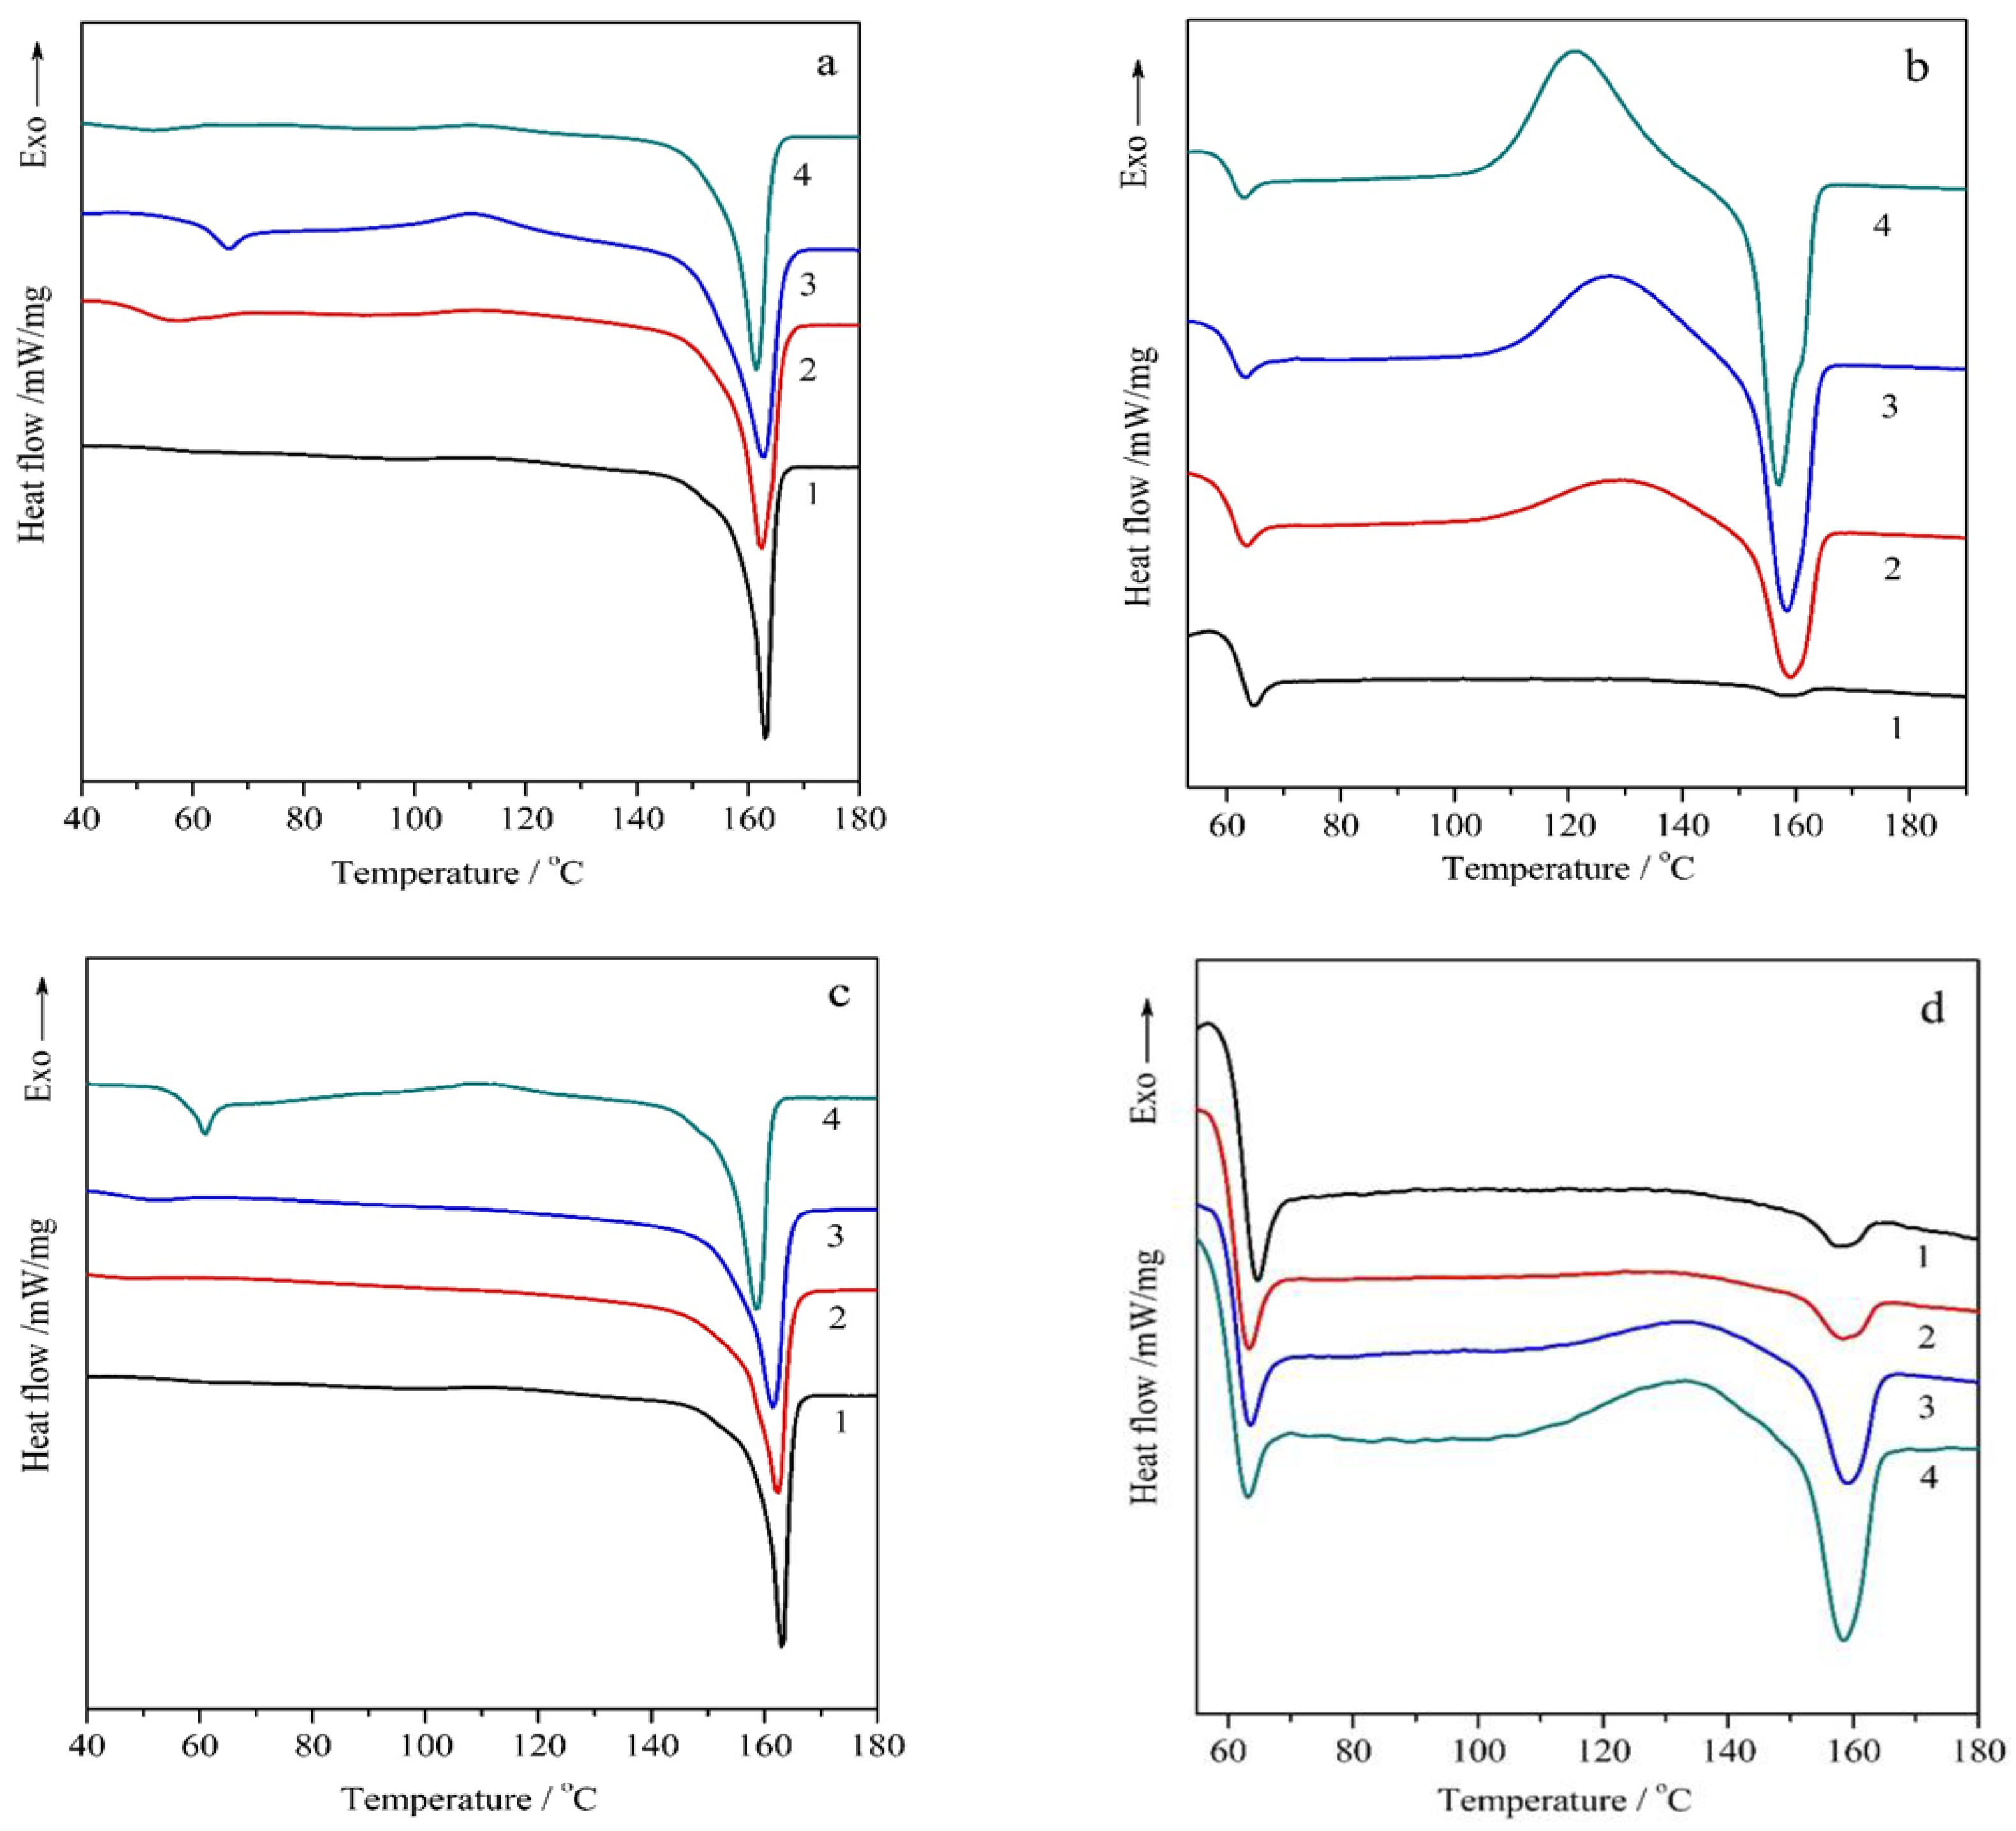
Figure 4.
Thermogravimetric analysis representing TG (a) and DTG curves (b) for PLA/GnP compositions, as well as TG (c) and DTG curves (d) for PLA/Na-MMT ones where: 1 — neat PLA; 2 — PLA containing 1 wt.% of Na-MMT or GnP; 3 — PLA with 5 wt.% of Na-MMT or GnP; 4 — PLA with 10 wt.% of Na-MMT or GnP.
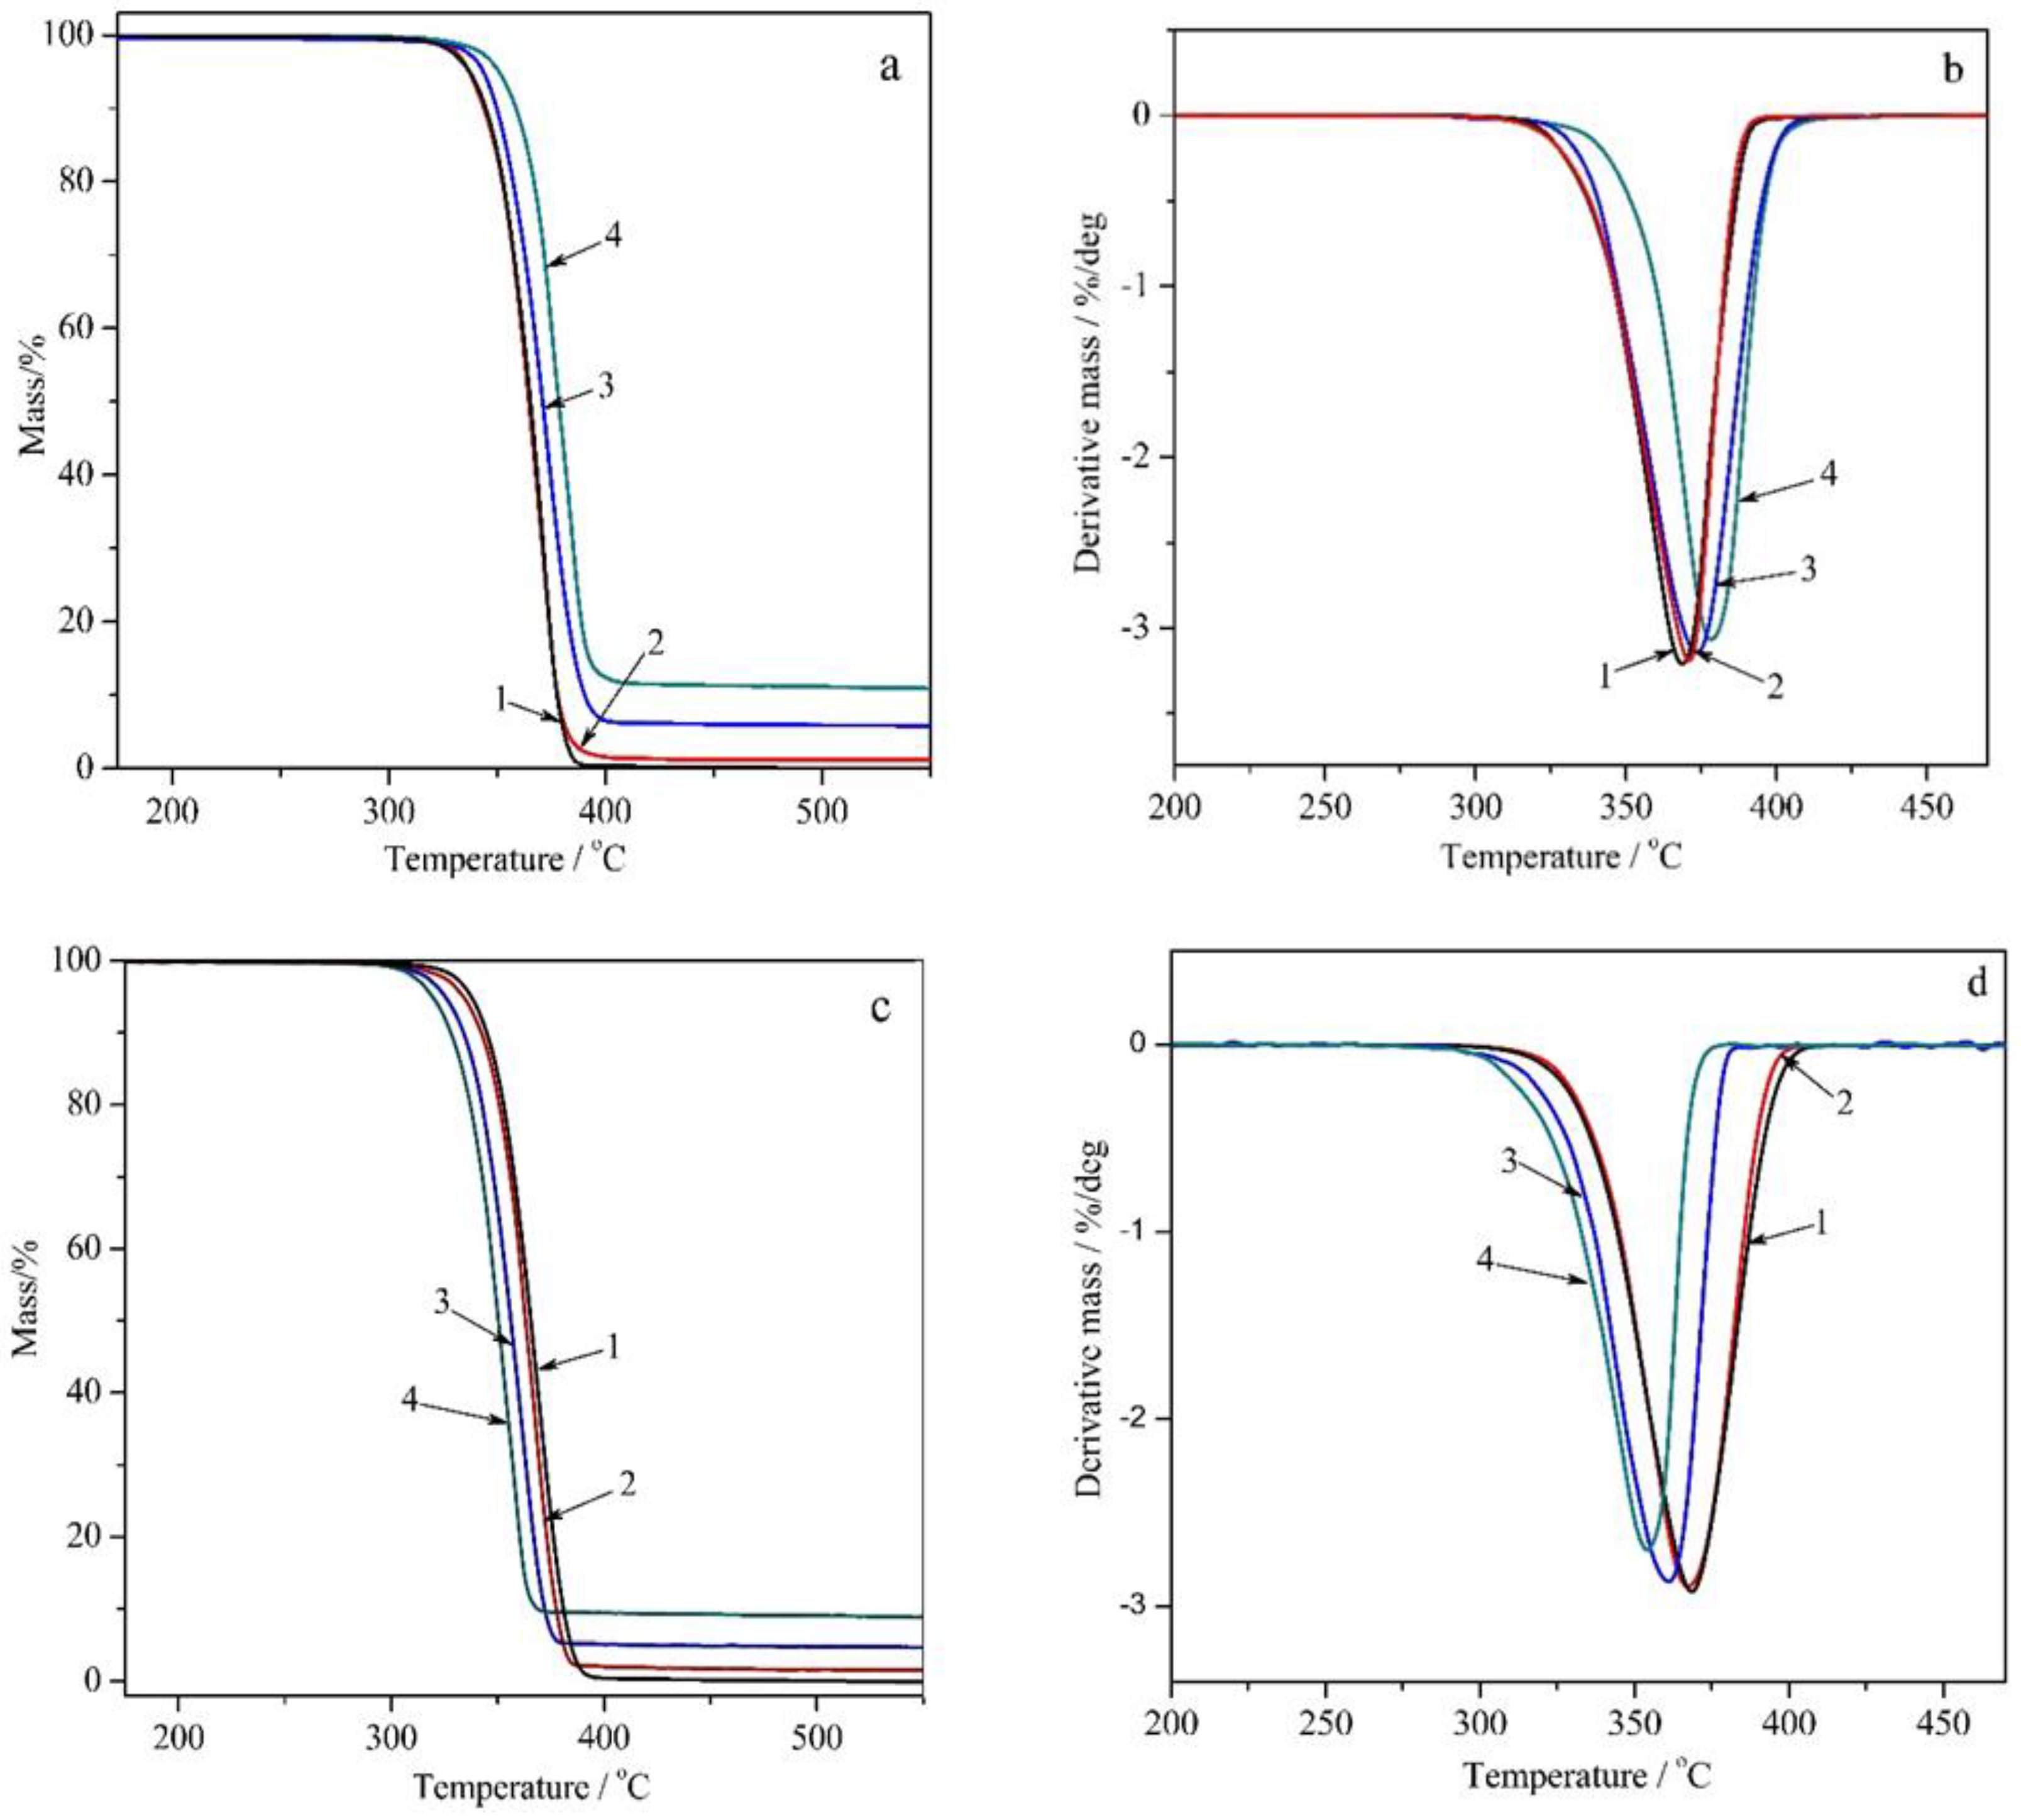
Figure 5.
Concentration-dependent variation of experimental onset temperature (Ton) and peak temperature (Tmax) for pristine PLA and PLA-based composites containing GnP or Na-MMT fillers.
Figure 5.
Concentration-dependent variation of experimental onset temperature (Ton) and peak temperature (Tmax) for pristine PLA and PLA-based composites containing GnP or Na-MMT fillers.
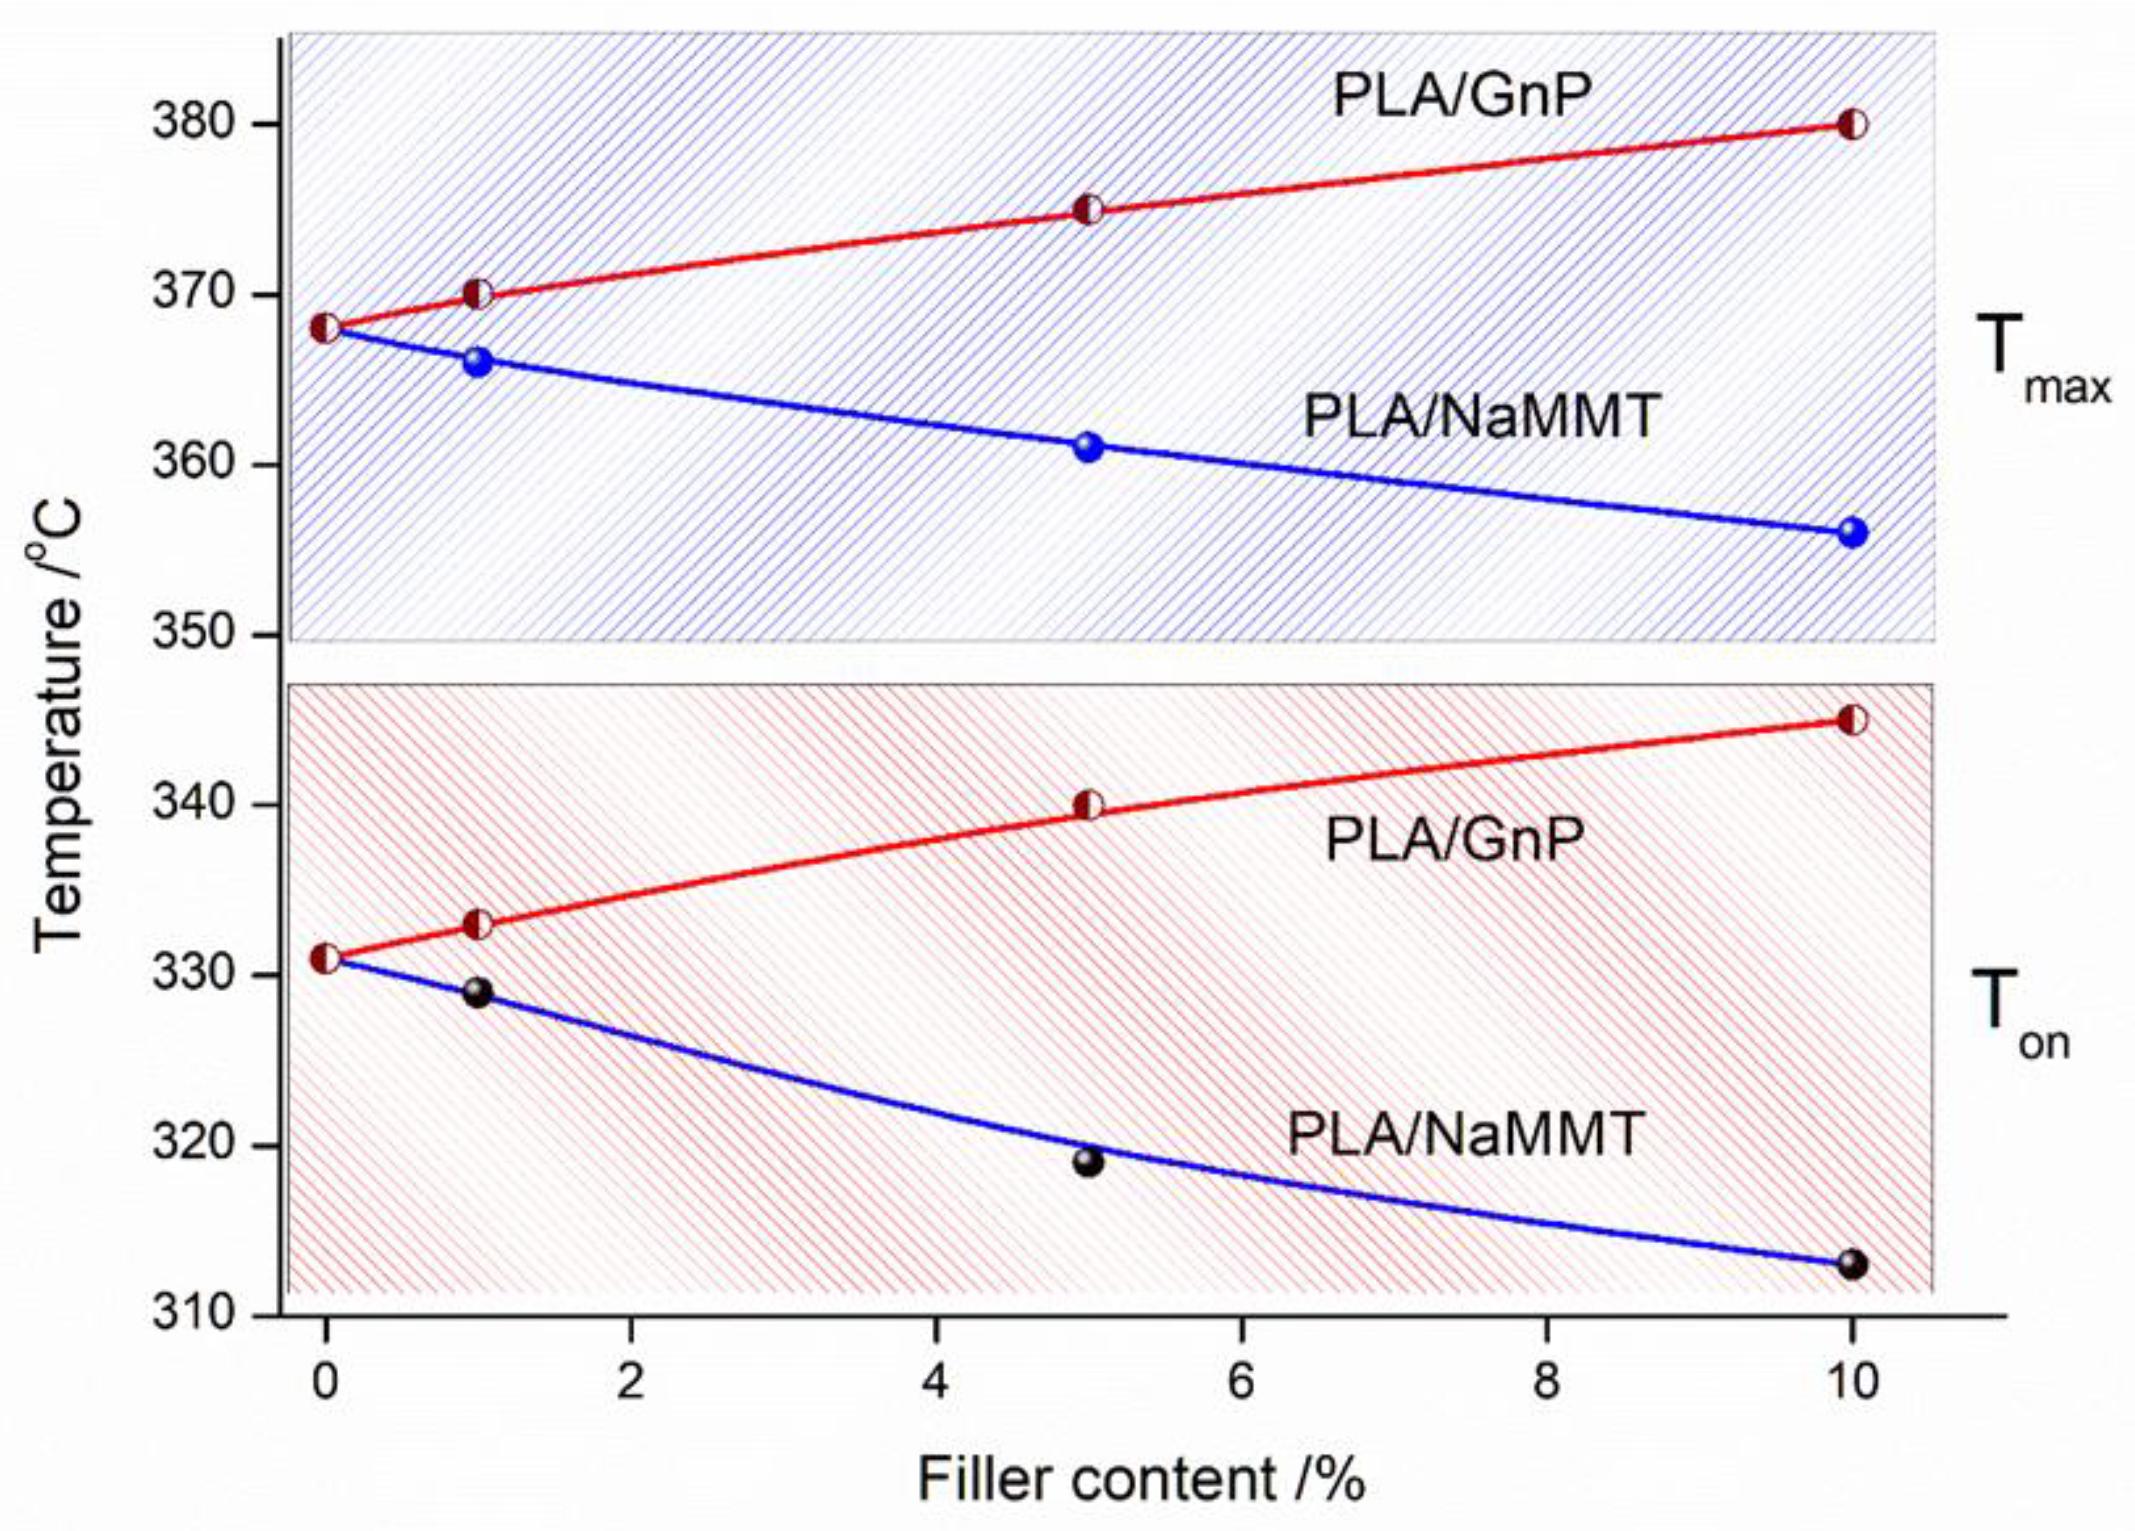
Figure 8.
Formal schemes of the formation of lactides and cis-, trans-1,3-dimethyldioxalan-4-ones.
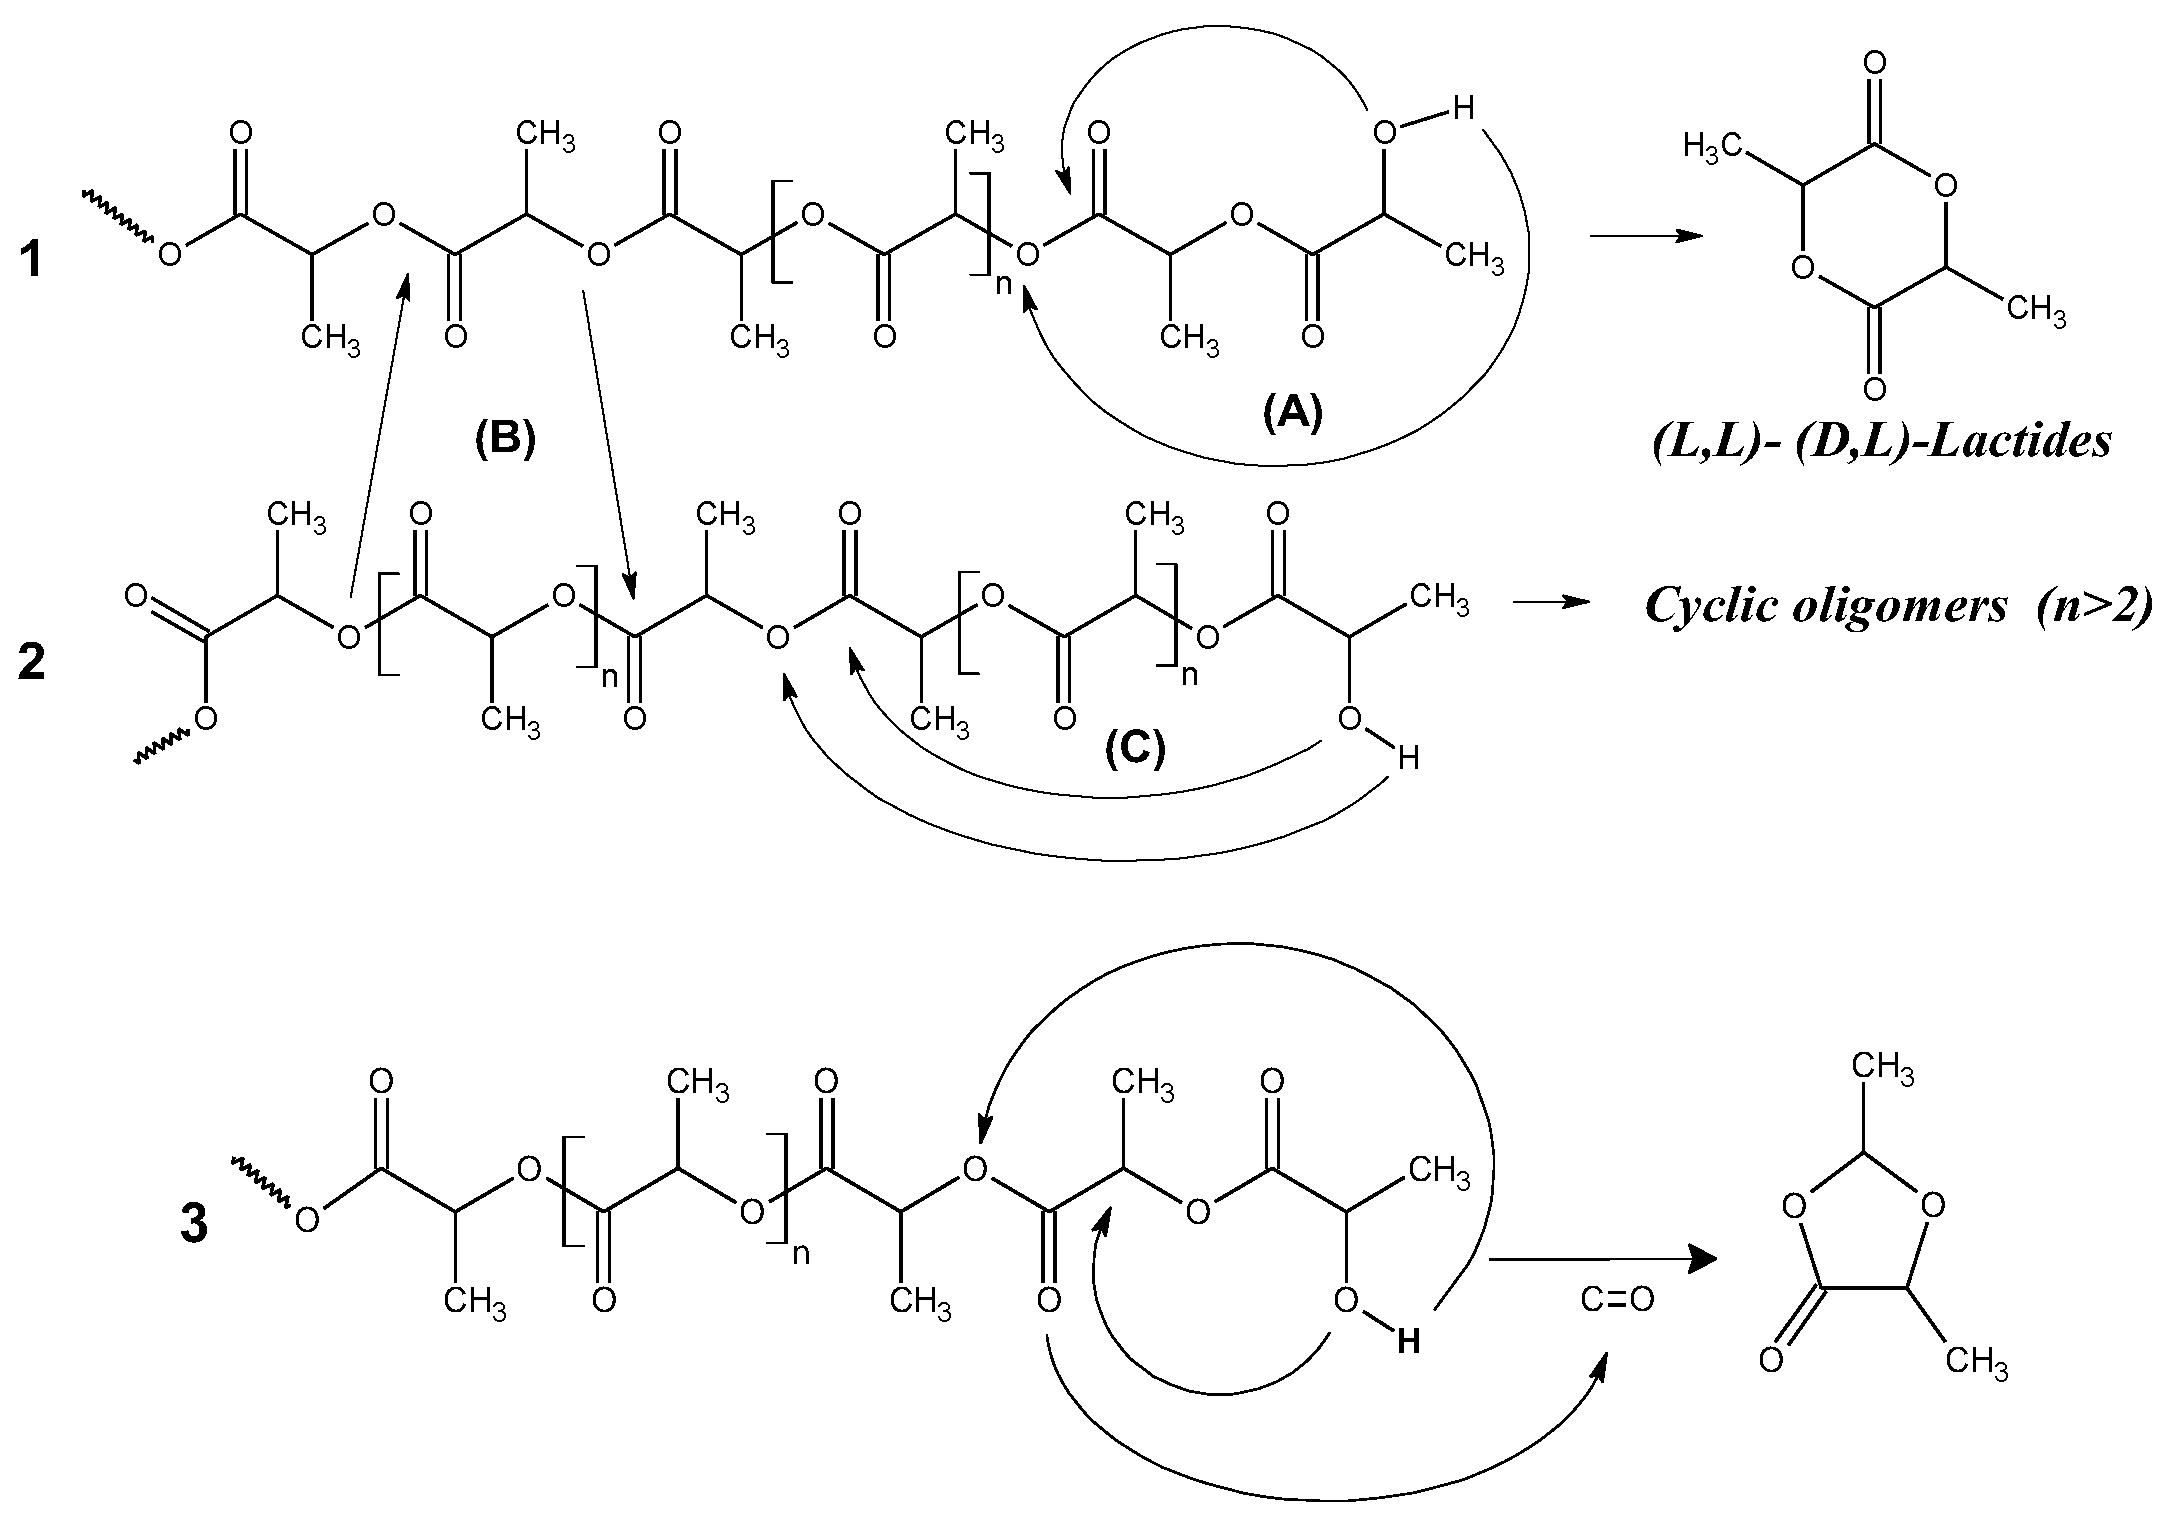
Figure 9.
The quantitative relationship of lactides (a) to 1,3-dimethyldioxolan-4-ones (b).
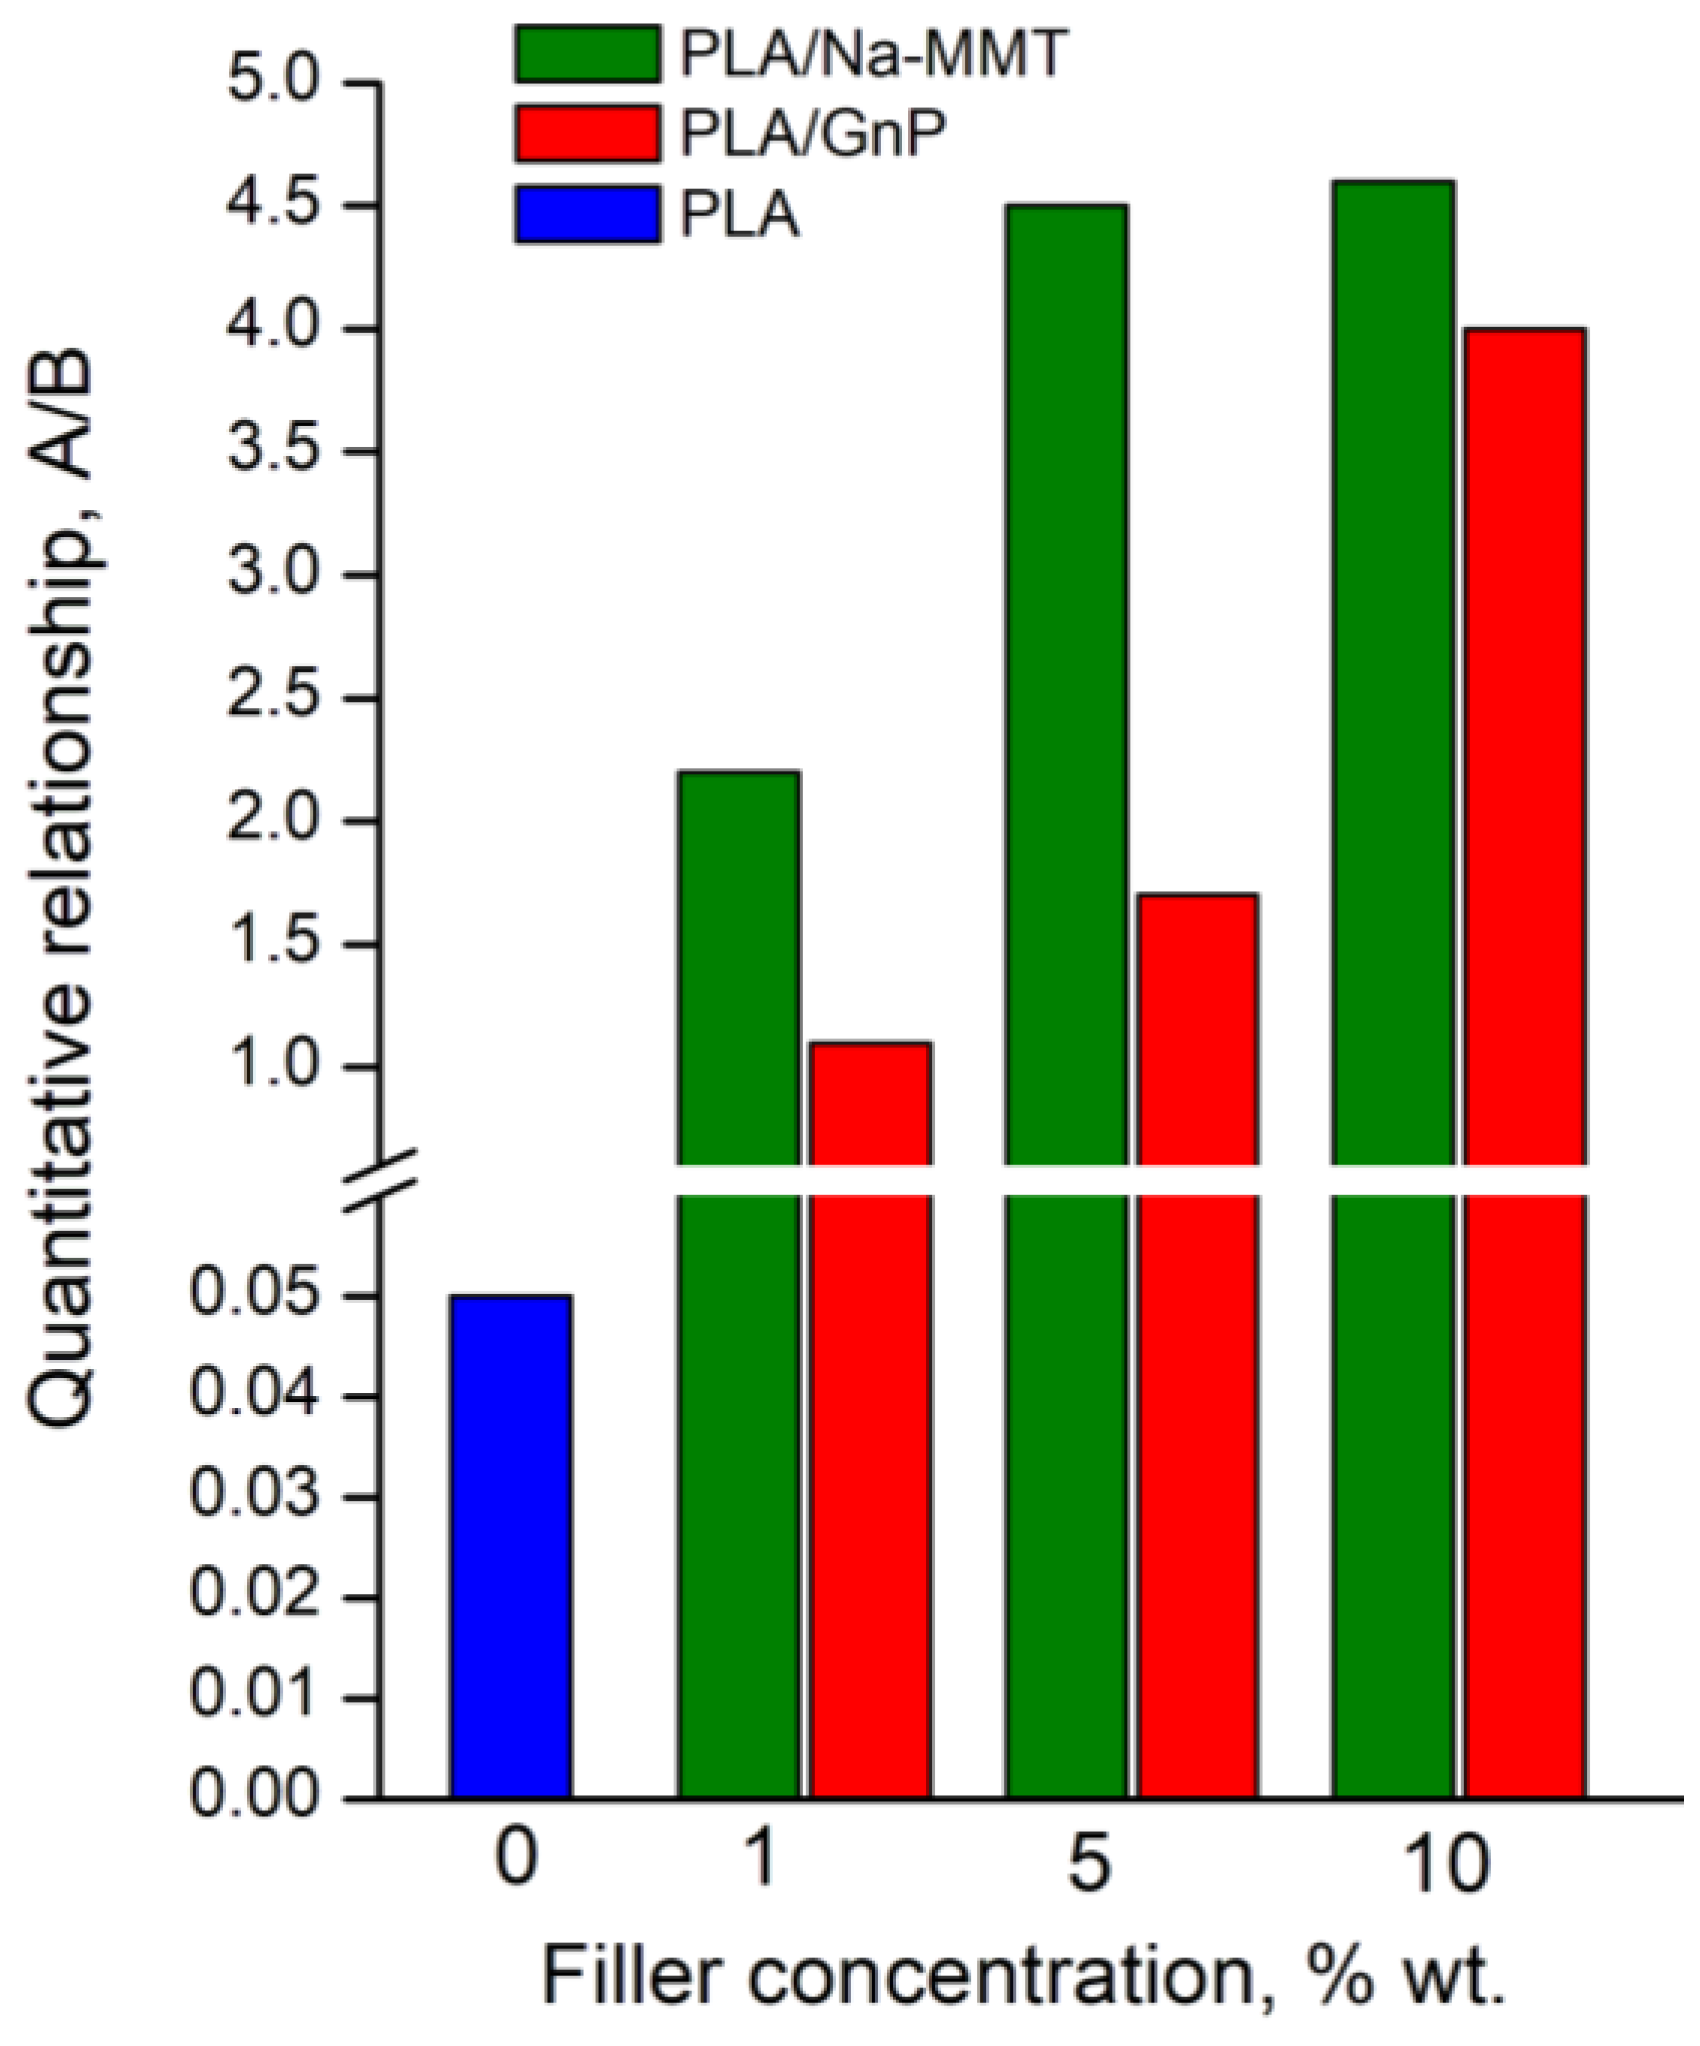
Figure 10.
Model kinetic scheme of PLA, PLA/Na-MMT and PLA/GnP thermal degradation.
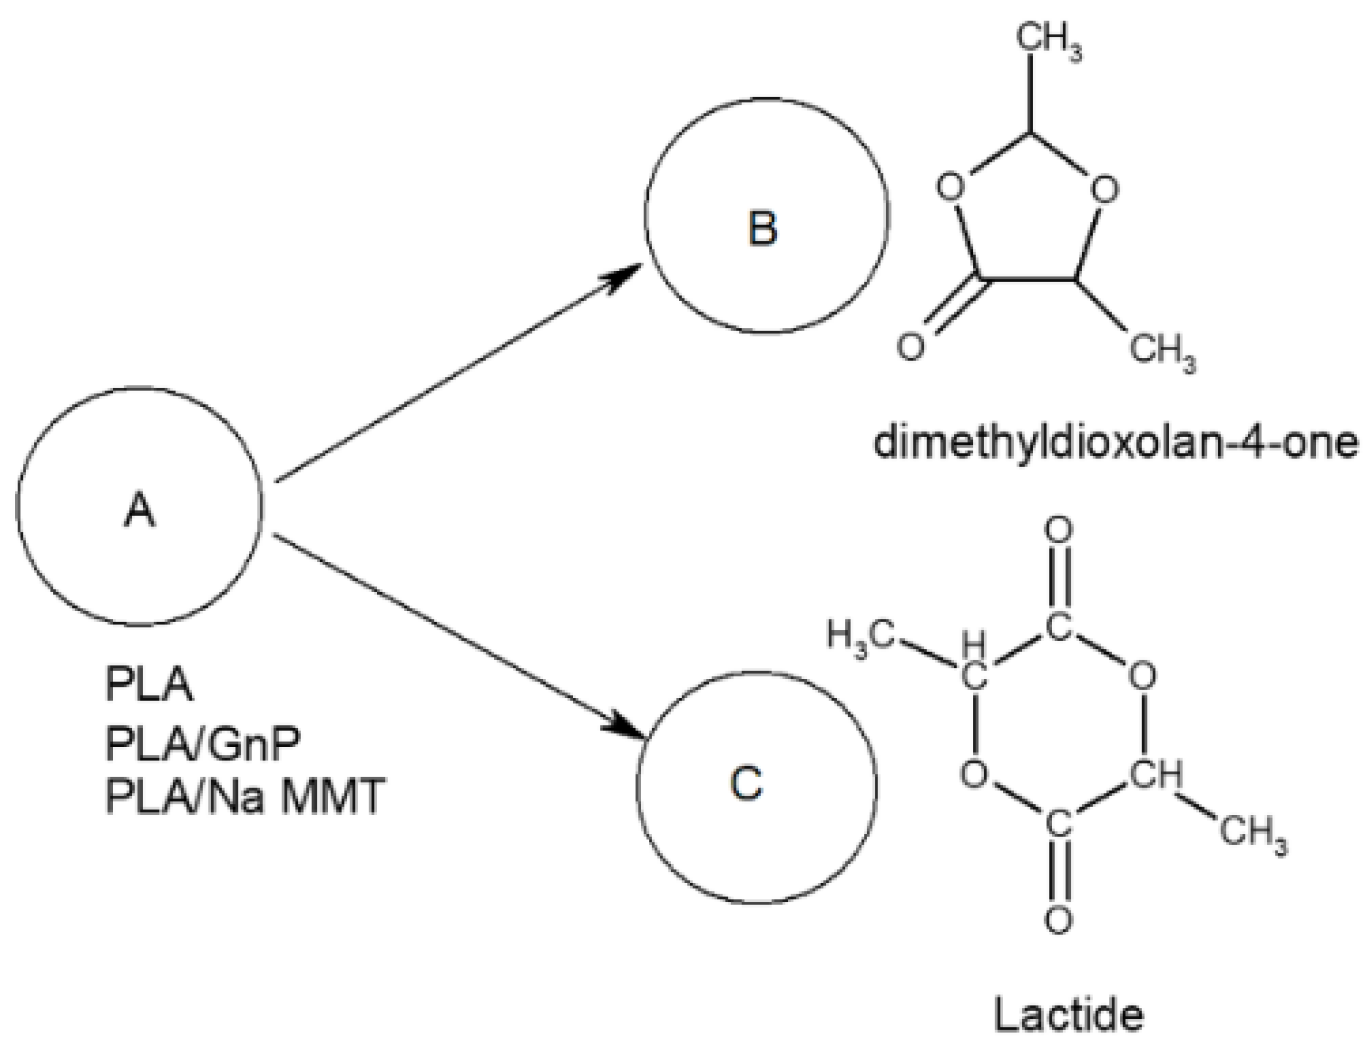
Figure 11.
Nonlinear fitting results from multiple models for PLA. Experimental TGA data (dots) are compared with model predictions (solid lines) at heating rates of 5, 10, and 20 K/min.
Figure 11.
Nonlinear fitting results from multiple models for PLA. Experimental TGA data (dots) are compared with model predictions (solid lines) at heating rates of 5, 10, and 20 K/min.
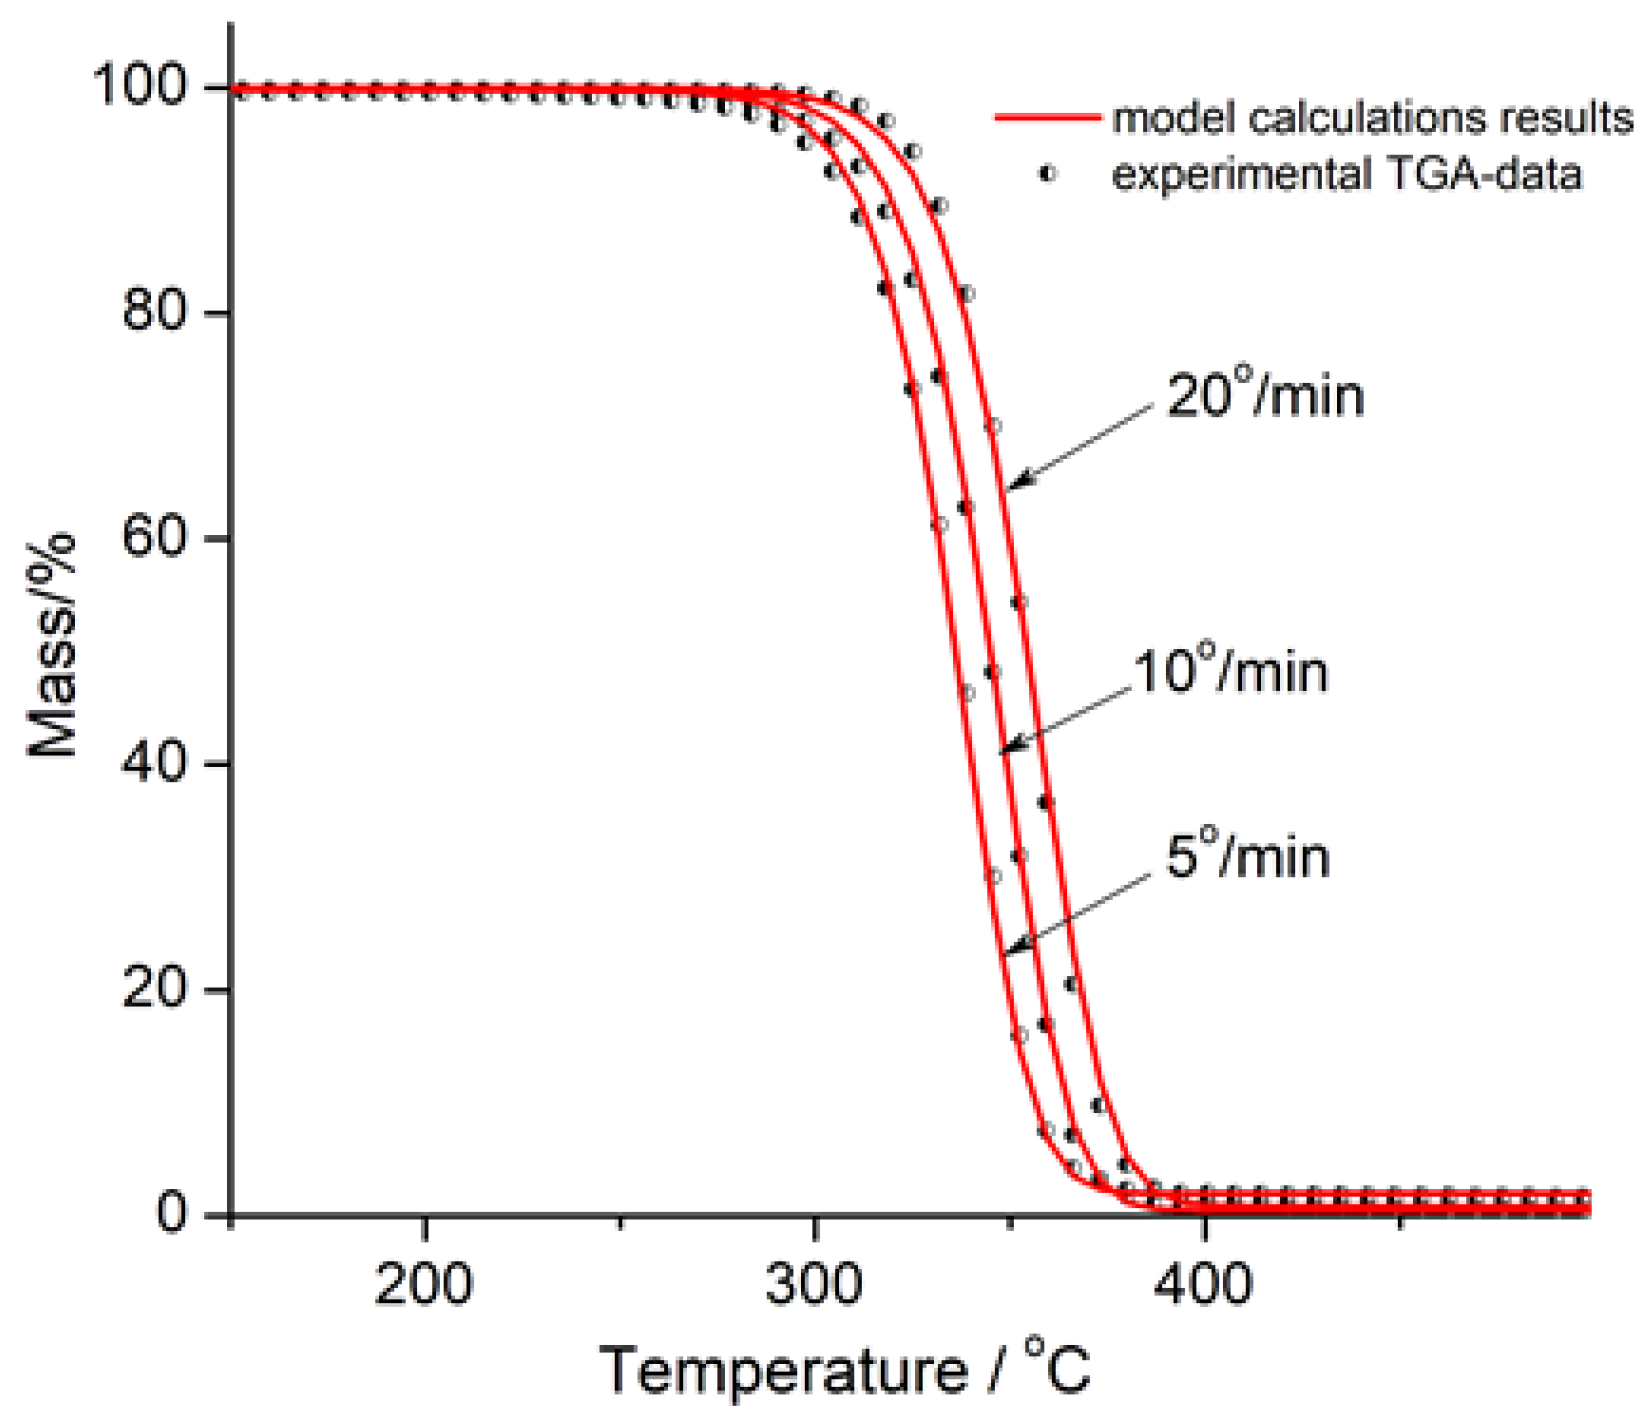
Figure 12.
Nonlinear fitting results from multiple models for PLA/Na-MMT 10 wt.%. Experimental TGA data (dots) are compared with model predictions (solid lines) at heating rates of 5, 10, and 20 K/min.
Figure 12.
Nonlinear fitting results from multiple models for PLA/Na-MMT 10 wt.%. Experimental TGA data (dots) are compared with model predictions (solid lines) at heating rates of 5, 10, and 20 K/min.
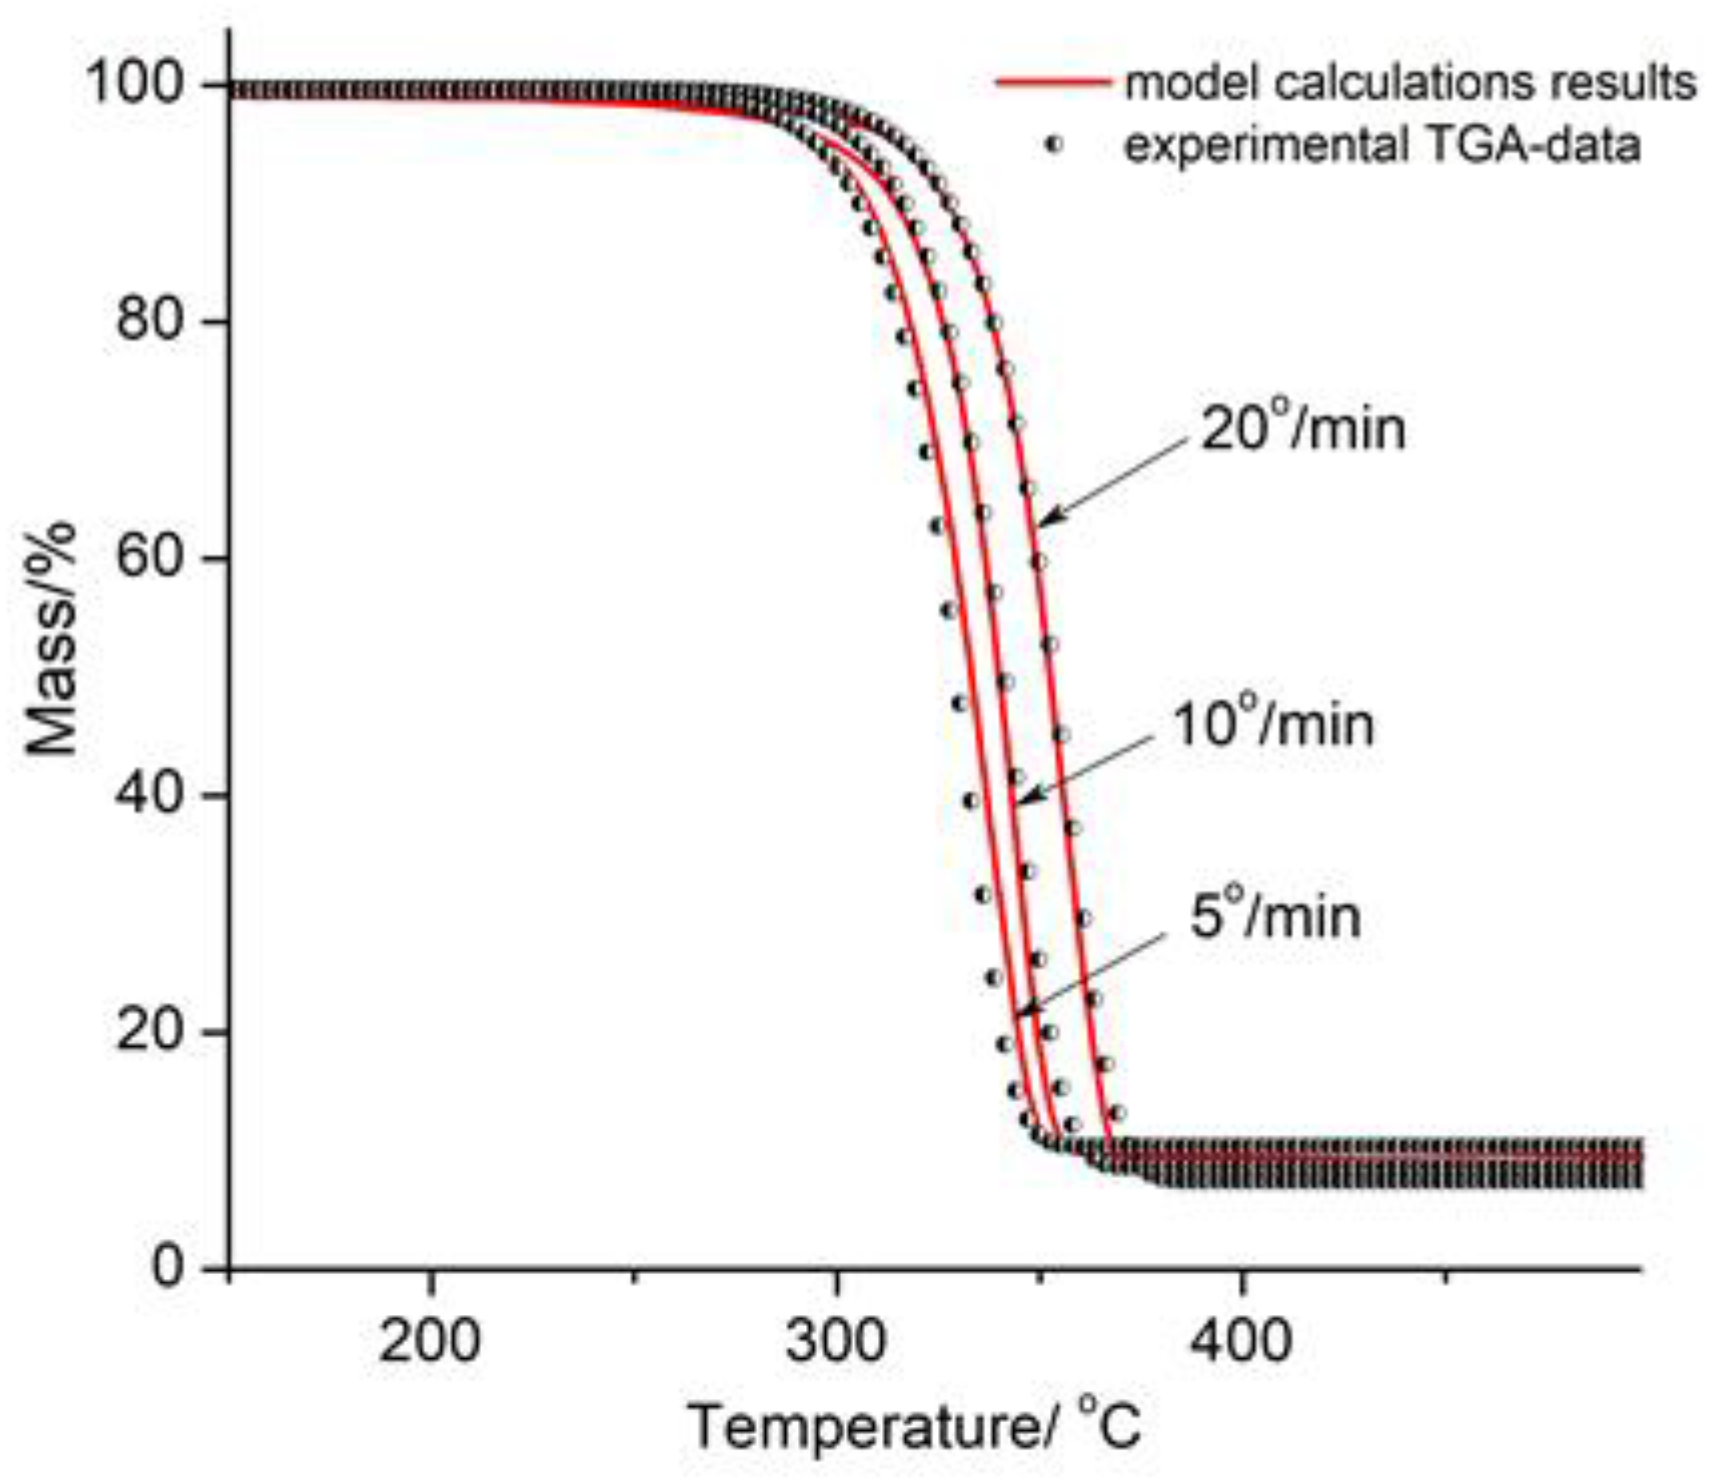
Figure 13.
Nonlinear fitting results from multiple models for PLA/GnP 10% wt. Experimental TGA data (dots) are compared with model predictions (solid lines) at heating rates of 5, 10, and 20 K/min.
Figure 13.
Nonlinear fitting results from multiple models for PLA/GnP 10% wt. Experimental TGA data (dots) are compared with model predictions (solid lines) at heating rates of 5, 10, and 20 K/min.
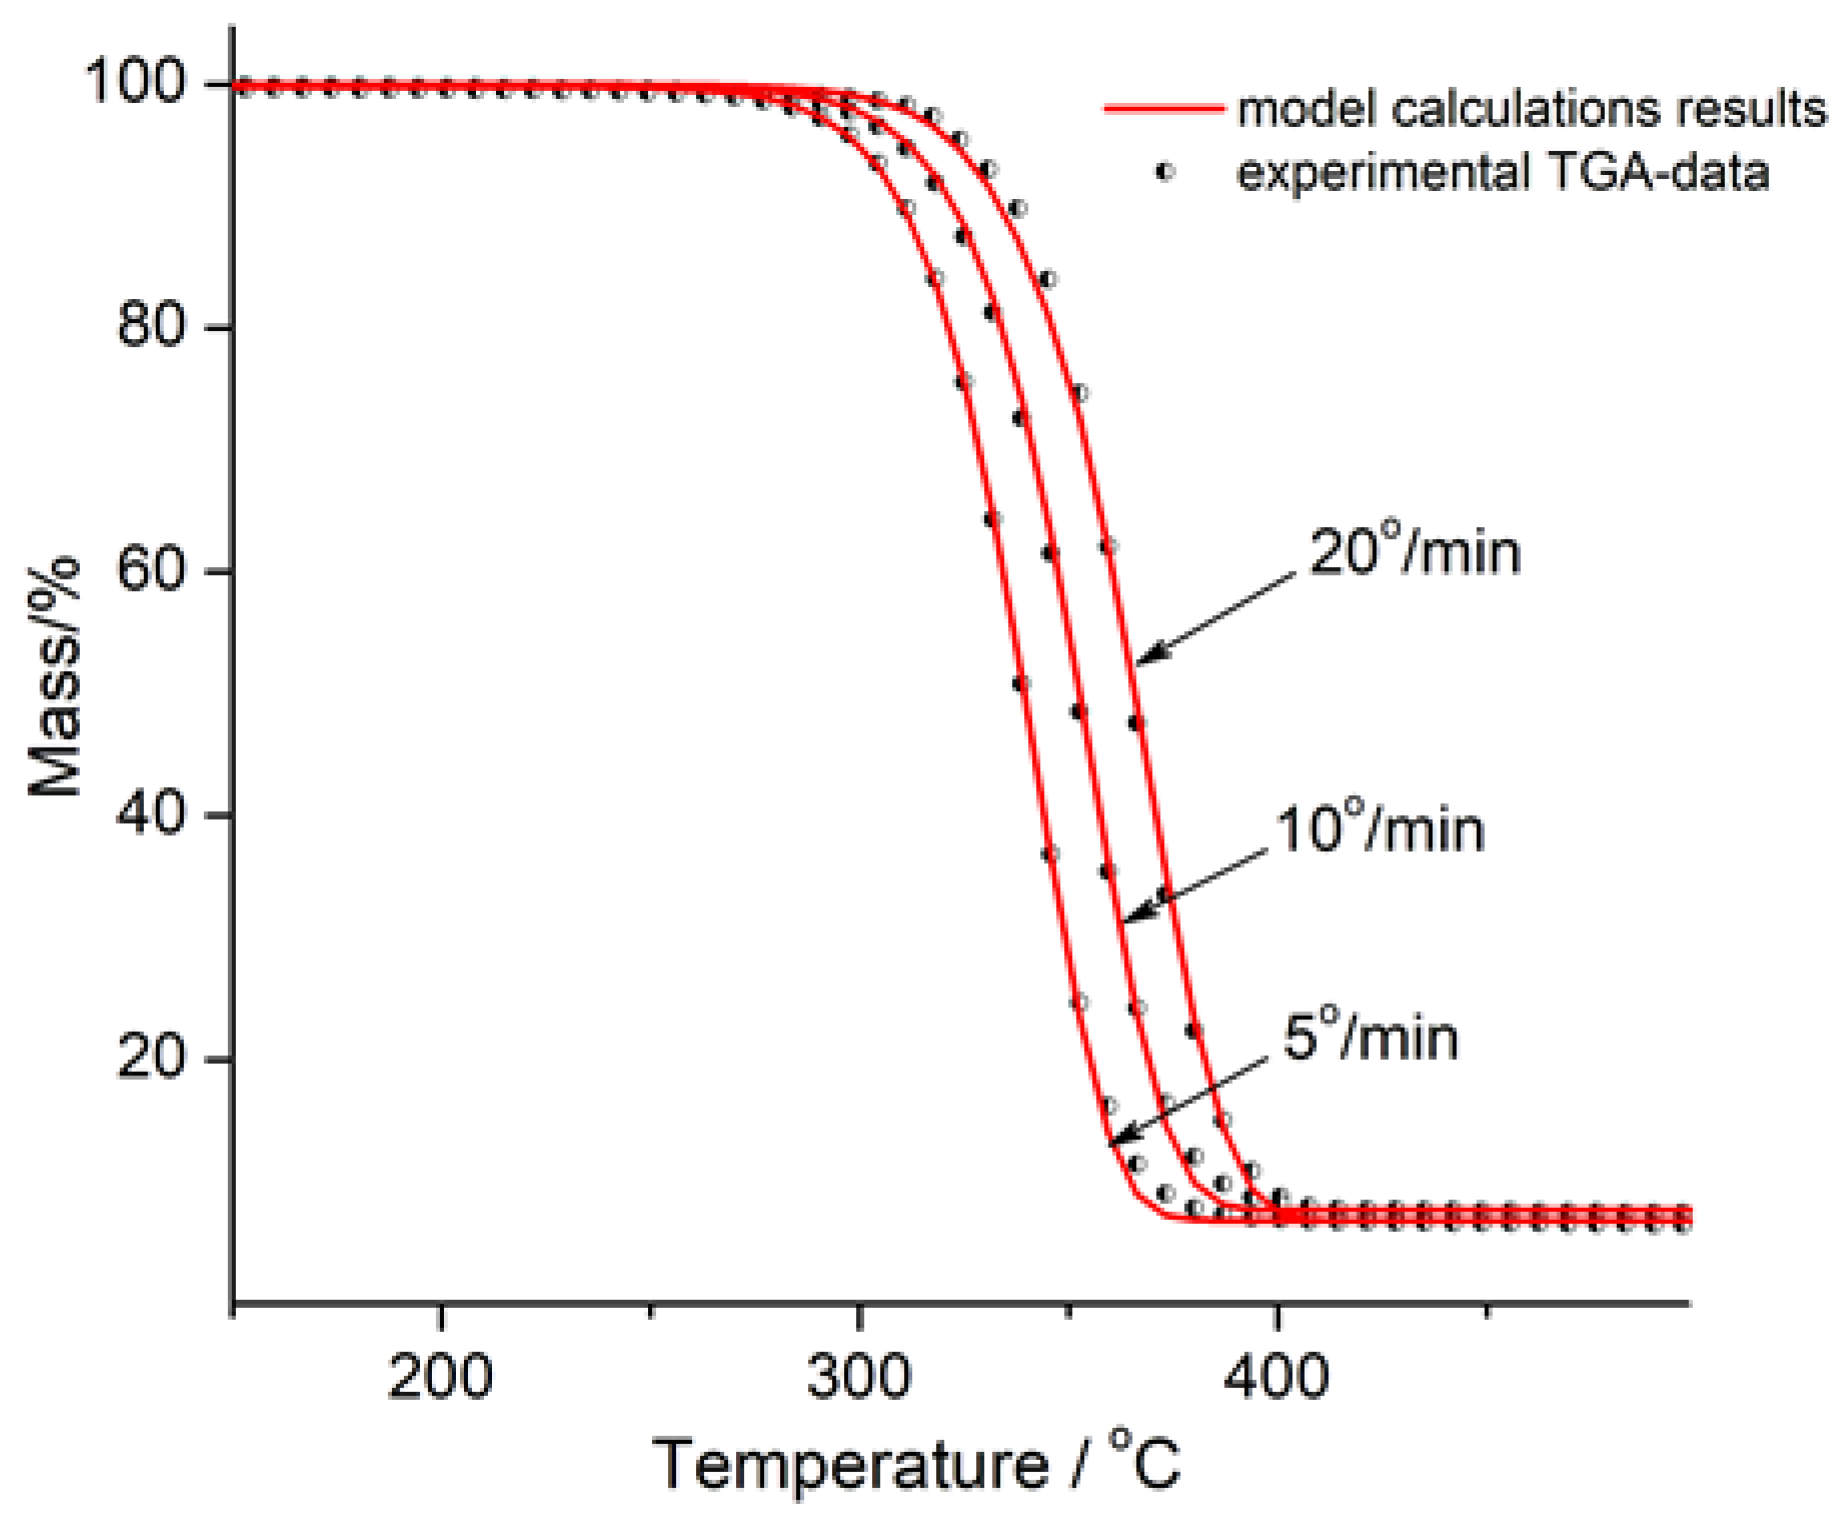
Figure 14.
Calculated kinetic curves of consumption and accumulation under isothermal pyrolysis conditions at 400°C for PLA (a), PLA/Na-MMT 10 wt.% (b) and PLA/GnP 10 wt.% (c), where: PLA – A, 1,3-dimethyldioxolan-4-ones – B and lactides – C.
Figure 14.
Calculated kinetic curves of consumption and accumulation under isothermal pyrolysis conditions at 400°C for PLA (a), PLA/Na-MMT 10 wt.% (b) and PLA/GnP 10 wt.% (c), where: PLA – A, 1,3-dimethyldioxolan-4-ones – B and lactides – C.
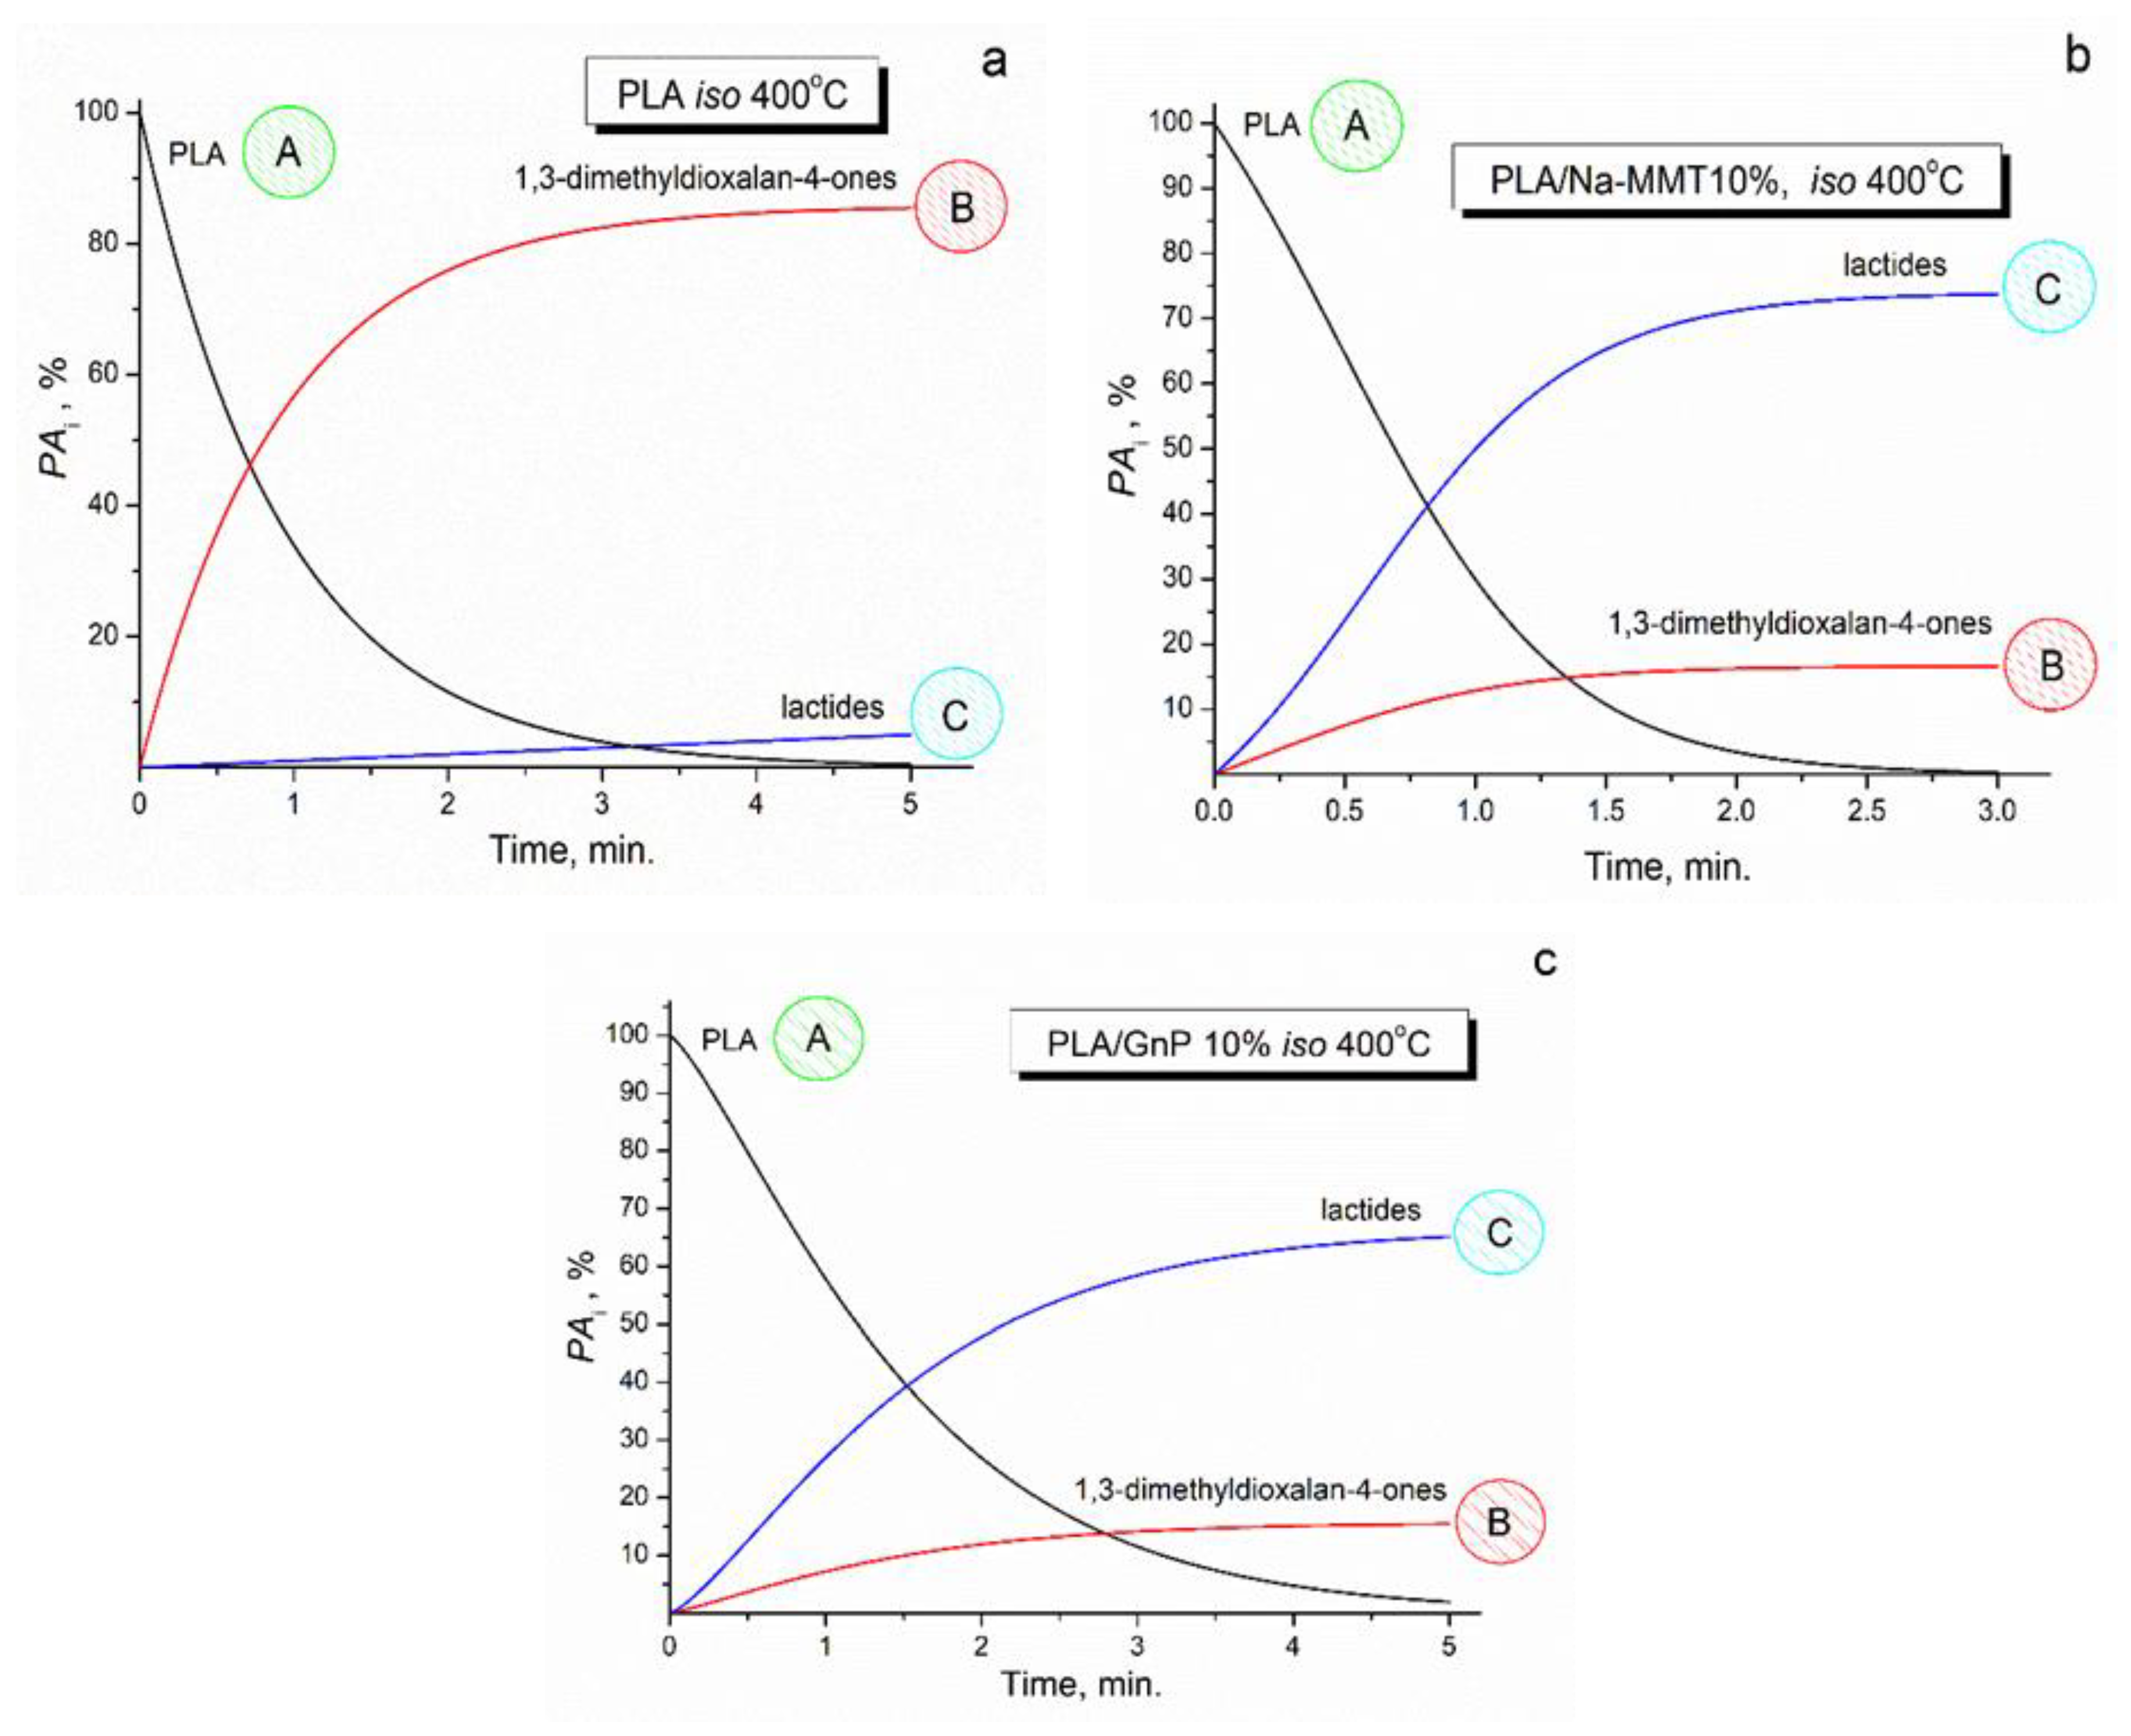
Table 1.
Calorimetric data derived from primary and secondary heating of PLA, PLA/Na-MMT and PLA/GNP composites.
Table 1.
Calorimetric data derived from primary and secondary heating of PLA, PLA/Na-MMT and PLA/GNP composites.
| Sample | Heating | Tg (°C) | Tcc (°C) | Tm (°C) | ΔHcc (J/g) | ΔHm (J/g) | χ (%) |
|---|---|---|---|---|---|---|---|
| PLA | first | 56.6 | 114 | 163.2 | 2.0 | -30.8 | 30.8 |
| second | 61.3 | n/a | 158 | n/a | -0.6 | 0.7 | |
| PLA/GnP 1 wt.% |
first | 54.5 | 113.1 | 162.4 | 1.8 | -31.8 | 32.2 |
| second | 61.3 | 128.6 | 159.0 | 7.1 | -10.9 | 4.0 | |
| PLA/GnP 5 wt.% |
first | 64.6 | 110.5 | 162.8 | 5.8 | -31.6 | 27.7 |
| second | 61.1 | 127.1 | 158.5 | 16.5 | -23.4 | 7.8 | |
| PLA/GNP 10 wt.% | first | 53.9 | 113.2 | 162.2 | n/a | -32.1 | 34.2 |
| second | 62.0 | 121.3 | 157/162* | 25.5 | -32.2 | 3.9 | |
| PLA/MMT 1 wt.% | first | 51.7 | n/a | 163.5 | n/a | -36.8 | 39.7 |
| second | 61.2 | n/a | 158.3 | n/a | -0.8 | 0.9 | |
| PLA/MMT 5 wt.% | first | 51.0 | n/a | 159.1 | n/a | -35.5 | 39.0 |
| second | 61.1 | 133.2 | 159.1 | 0.4 | -2.0 | 1.9 | |
| PLA/MMT 10 wt.% | first | 66.4 | 113.9 | 160.8 | 2.7 | -27.2 | 29.0 |
| second | 60.8 | 132.8 | 158.1 | 0.9 | -3.4 | 3.0 |
1 refer to the α′-limit disordered (hexagonal) crystalline forms of PLA.
Table 2.
ТГА results of PLA, PLA/Na-MMT and PLA/GnP compositions.
| Sample | Тon (°C) | Тmax (°C) |
|---|---|---|
| PLA | 331 | 368 |
| PLA/GnP 1 wt.% | 333 | 372 |
| PLA/GnP 5 wt.% | 340 | 375 |
| PLA/GnP 10 wt.% | 345 | 380 |
| PLA/Na-MMT 1 wt.% | 329 | 366 |
| PLA/ Na-MMT 5 wt.% | 319 | 361 |
| PLA/ Na-MMT 10 wt.% | 313 | 356 |
Table 5.
The quantitative relationship of lactides (A) to 1,3-dimethyldioxolan-4-ones (B).
| Composition | The quantitative relationship (A) : (B) |
|---|---|
| PLA | 1.0 : 18.0 |
| PLA/Na-MMT 1 wt.% | 2.2 : 1.0 |
| PLA/ Na-MMT 5 wt.% | 4.5 : 1.0 |
| PLA/ Na-MMT 10 wt.% | 4.6 : 1.0 |
| PLA/GnP 1 wt.% | 1.1 : 1.0 |
| PLA/GnP 5 wt.% | 1.7 : 1.0 |
| PLA/GnP 10 wt.% | 4.0 : 1.0 |
Table 6.
Reaction types and corresponding reaction equations, dc/dt= - A·exp(-E/RT)·f(co,cf ).
| Name | f(co,cf) | Reaction type |
|---|---|---|
| F1 F2 Fn R2 R3 D1 D2 D3 D4 B1 Bna C1-X Cn-X A2 A3 An |
c c2 cn 2 · c1/2 3 · c2/3 0.5/(1 - c) -1/ln(c) 1.5 · e1/3(c-1/3 - 1) 1.5/(c-1/3 - 1) co · cf con · cfa c · (1+Kcat · X) cn · (1+Kcat · X) 2 · c · (-ln(c))1/2 3 · c · (-ln(c))2/3 N · c · (-ln(c))(n-1)/n |
first-order reaction second-order reaction nth-order reaction two-dimensional phase boundary reaction three-dimensional phase boundary reaction one-dimensional diffusion two-dimensional diffusion three-dimensional diffusion (Jander's type) three-dimensional diffusion (Ginstling-Brounstein type) simple Prout-Tompkin’s equation expanded Prout-Tompkin’s equation (na) first-order reaction with autocatalysis through the reactants, X. X = cf nth-order reaction with autocatalysis through the reactants, X two-dimensional nucleation three-dimensional nucleation n-dimensional nucleation/nucleus growth according to Avrami/Erofeev |
Table 7.
Results of the multiple-curve kinetic analysis for thermal degradation of PLA, PLA/Na-MMT and PLA/GnP in accordance with the reaction model (2).
Table 7.
Results of the multiple-curve kinetic analysis for thermal degradation of PLA, PLA/Na-MMT and PLA/GnP in accordance with the reaction model (2).
| Composition | Model Reaction | Parameter | Value | Statistics |
|---|---|---|---|---|
| PLA | Model Step 1: first-order reaction |
lgA1, s-1 E1, kJ/mol |
10.7 176.8 |
Correlation coefficient: 0.999388 Durbin-Watson Value: .357 |
| Model Step 2: first-order reaction |
lgA2, s-1 E2, kJ/mol |
16.9 229.3 |
||
| PLA/Na-MMT 10 wt.% |
Model Step 1: first-order reaction with autocatalysis |
lgA1, s-1 E1, kJ/mol lgKcat |
11.1 170.1 0.5 |
Correlation coefficient: 0.999402 Durbin-Watson Value: 0.081 |
| Model Step 2: first-order reaction with autocatalysis |
lgA2, s-1 E2, kJ/mol lgKcat |
11.7 198.0 0.8 |
||
| PLA/GnP 10 wt.% |
Model Step 1: n-dim. Avrami-Erofeev |
lgA1, s-1 E1, kJ/mol dimention1 |
9.5 142.3 1.20 |
Correlation coefficient: 0.999889 Durbin-Watson Value: 0.272 |
| Model Step 2: n-dim. Avrami-Erofeev |
lgA2, s-1 E2, kJ/mol dimention2 |
12.5 178.6 1.13 |
Disclaimer/Publisher’s Note: The statements, opinions and data contained in all publications are solely those of the individual author(s) and contributor(s) and not of MDPI and/or the editor(s). MDPI and/or the editor(s) disclaim responsibility for any injury to people or property resulting from any ideas, methods, instructions or products referred to in the content. |
© 2025 by the authors. Licensee MDPI, Basel, Switzerland. This article is an open access article distributed under the terms and conditions of the Creative Commons Attribution (CC BY) license (http://creativecommons.org/licenses/by/4.0/).
Copyright: This open access article is published under a Creative Commons CC BY 4.0 license, which permit the free download, distribution, and reuse, provided that the author and preprint are cited in any reuse.


