Submitted:
11 December 2025
Posted:
17 December 2025
You are already at the latest version
Abstract
SARS-COV-2 infection has emerged worldwide. To reduce the number of cases and limit the transmission of the virus, health, and local authorities have implemented several strategies. Mass screening is a key strategy for mitigating the damage caused by this pandemic. This strategy is based on the use of qRT-PCR and pooling to diagnose SARS-COV-2 infection. The present work explores the performance and limitations of this strategy for the molecular diagnosis of SARS-CoV-2 infection. Three important technical aspects were retained: the comparison of two commercial extraction kits (BIGFISH & BIOER), the simulation of a non-compliant nasopharyngeal swab, and the evaluation of the pooling strategy. 97 SARS-CoV-2 positive nasopharyngeal samples were used. The comparison of the two extraction kits was based on threshold cycles (Ct) values. The results showed a significant difference (IC=95%) in Ct of the nucleocapsid gene (N; p= 0.0000384) and RNA-dependent RNA polymerase (RdRp; p=0.0254). However, no significant difference was observed between the Internal Control gene (IC; p= 0.0723) and Envelope gene (E; p = 0.150). The Ct values resulting from BIGFISH extraction kit were generally lower than those obtained from BIOER. In terms of sensitivity, the RT-qPCR technique allows for the detection of viral RNA up to 10-3 as a dilution factor. This study demonstrated that the pooling strategy is an effective diagnostic technique. Positive samples remained detectable even in pools of 1000 or even 10000 samples. However, the size of the pool under diagnostic conditions should not exceed a limit that must be dynamically adapted to prevalence to ensure economic and analytical viability.
Keywords:
molecular diagnosis
; pandemic
; RT-qPCR
; SARS-CoV2
Introduction
In the last two decades, the world has experienced two episodes of coronavirus-related epidemics, beginning with SARS-CoV in 2003 in China and the second wave in 2012 related to MERS-CoV, which has spread out in the Middle East region [1]. In December 2019, in Wuhan, Hubei province, Republic of China, a new coronavirus (SARS-CoV-2) was identified in a group of patients with pneumonia, which was almost identical to that caused by SARS-CoV [2,3]. In March 2020, the World Health Organization (WHO) declared SARS-CoV2 infection a global pandemic and named it Covid19 (Coronavirus disease 2019) [2]. SARS-CoV2 is a single-stranded RNA virus with positive polarity [4,5]. It is a highly pathogenic virus with animal origin. It has tropism for various cells, mainly lung cells (type II pneumocytes), where it causes more damage[6]. Its rapid human-to-human transmission [7], pathogenicity, high case fatality, and transmission rates have allowed it to spread rapidly worldwide [8], causing severe damage [9,10]. States, health authorities, and international agencies have made significant efforts to control the rapid spread and mitigate the consequent damage caused by this pandemic. Human, material, and financial resources have been mobilized to face the Covid-19 pandemic wave [7,11]. The diagnosis of this disease is based on three main components: clinical, radiological and biological [12,13]. Biological diagnosis plays a major role among these three components. It is mainly based on RT-qPCR for the detection and identification of SARS-CoV-2 viral genes in human nasopharyngeal swabs (NPS). RT-qPCR is one of the most specific and sensitive techniques in biology [14]. According to the WHO, SARS-CoV2 RT-qPCR must allow the identification of three viral genes: the nucleocapsid gene (N), envelope gene (E), and RNA-dependent RNA polymerase gene (Rdrp) [15]. To achieve optimal control of the pandemic, the diagnostic system must evolve dynamically to meet the high demand for tests. The purpose of this work is to evaluate the performance of mass screening for the diagnosis of SARS-CoV-2 infection in Souss-Massa region. This was conducted along the three main axes. The first part will involve a comparison of two extractors/kits of nucleic acid extraction performances used for molecular diagnostics in the Laboratory of Virology- Regional Hospital Center (RHC), Agadir. In the second section, we will address a frequent issue encountered during the pre-analytical phase, namely non-compliant samples, as well as the simulation of low viral load resulting from improper sampling techniques. The final section focuses on the technical and economic assessment of the pooling approach, which is frequently used in pandemics to increase the number of tests while saving time and resources.
Material and Methods
The study was conducted between 23/08/20 and 02/09/20 at the Virology Laboratory of the Regional Hospital Center (Hassan II) Agadir, Sous-Massa region, Morocco. Human nasopharyngeal swab samples were collected in 3 ml of viral transport medium (VTM) as part of a mass screening of SARS-CoV-2 in this region.
Ethical Approval
Ethical approval was granted by the Research Ethics Committee (REC) of the Moroccan Association of Research and Ethics to gather human swabs from the Virology Laboratory of the Regional Hospital Center (Hassan II) located in Agadir, Sous-Massa region, Morocco.
Sampling
A total of 97 samples from patients who tested positive for the three viral genes (E, N, and Rdrp) of SARS-CoV2 were pre-selected. Selection was performed from the laboratory database of patients tested during the sampling period (Figure 1).
After statistical analysis of the Ct values for the 97 selected samples in Microsoft Excel 2016 and R-Studio 1.2.1335, five samples with Ct values as described in Table 1 were retained for the experimental study based on the following criteria:
- Time between sampling and analysis not exceeding 48h
- Each of the five samples was positive for all the three genes (E, N, and Rdrp).
- Five samples showed the lowest Ct values among the four genes tested.
- The type of transport medium was identical for all selected samples.
Samples Preparation and Pooling
Samples Dilution
Sample dilution was carried out using the "GUANGDONG ARDENT BIOMED Co, Ltd" transport medium. A volume of 3 ml contained in each tube was mixed in a sterile RNase-free flask, and the dilution procedure was performed in a laminar flow PCR hood “ESCO class II BSC, AirStream®”. Sterile 1.5 ml tubes previously identified were used to prepare the different dilutions. Both primary and diluted samples were kept in an ice bath to avoid nucleic acid degradation during the process. The dilution protocol is illustrated in Figure 2.
Pooling Strategies
Different pooling strategies were tested (pools of 5, 10, 100, 1000, and 10000 samples). Pooling was prepared using a pool of samples already tested negative for all the viral genes of SARS-CoV2 (negative pool). Pooled samples were prepared by diluting the five selected positive samples using negative pool. The pool of negative samples had a Ct value of 28.99 for the internal control gene.
Nucleic Acid Extraction
Nucleic acid extraction was conducted in a biosecurity level-2 (BSL-2) virology laboratory. The extraction was performed using two kits of 96 deep-well plates. Both kits are based on the magnetic bead extraction method: «GenePure Pro, NPA-32P, BIOER Technology » and « BIGFISH, Biological technology”. A total of 60 samples (5 NPS samples × 5 dilutions and 5 pooling strategies) were subjected to extraction.
For each sample, extraction was performed using both extraction kits. For the BIGFISH extraction Kit, 200µl of the NPS sample was needed for the extraction process while 300µl with 10µl of proteinase K as a proteolytic agent was required for the BIOER kit. To compare the extraction kits, we used the same NPS sample volume for both kits (200µl), in addition to 100µl of VTM for the BIOER Kit to reach the extraction volume of 300µl recommended by the manufacturer.
SARS-CoV2 RNA Detection by RT-qPCR
After nucleic acid extraction, RT-qPCR was performed for the detection of SARS-CoV2 RNA. We used a multiplex kit (GeneFinder™ COVID-19 Plus RealAmp Kit) provided by the company OSANG Healthcare Co, Ltd. This Kit allows the detection of three viral genes (N, E and Rdrp), in addition to the internal control of ribonuclease P (RNase P) for the optimal detection of SARS-CoV2 in human specimens. Primers and probes used in this kit have 100% homology with 3079/3080 SARS-CoV2 sequences published in NCBI and GISAID databases [16,17]. The reaction Mixture (MasterMix) was prepared in a PCR laminar flow hood using the following proportions: 10µl of Reaction Mixture + 5µl of Probes and primer mixture. 15µl of MasterMix was distributed into a 100µl 96-Wells PCR plate, 5µl of purified RNA from extracted human samples was added to the MasterMix using a multichannel pipette.
Reactions were carried out in an automated amplification system (Thermo Fisher QuantStudio 5, Applied Biosystems) according the following thermal profile: reverse transcription (50℃-20 min-1 cycle), pre-denaturation (95℃-5 min-1 cycle), and then 45 cycles of amplification: denaturation (95℃ for-15 sec) and annealing (58℃ for 60 sec). Fluorescence was measured using specific dyes (Table 2).
Statistical Analysis
Statistical analysis was performed using R-Studio Version 1.2.1335. Ct values of each target were compared using the parametric ANOVA test for means comparison after a verification of normality and homogeneity (Bartlett test) using the package Rcmdr V2.7-0. Statistical significance was set at p < 0.05. The online software (Shiny App for Pooled Testing) [18] was used to simulate the economic efficiency of different pools tested according to prevalence circumstances.
Results
Comparing Extraction Kits
The real-time amplification results showed amplification curves for the three viral genes (E, N, and Rdrp) specific to SARS-CoV2 as well as the internal control (RNase P) for all undiluted samples extracted with both kits. Both BIGFISH and BIOER have shown typical amplification curves (sigmoidal curve), with significant fluorescence levels for all tested samples. Figure 3 illustrates amplification curves for simple N°1.
The mean Ct values of IC, E, N, and Rdrp genes were respectively; 26.82±1.17; 16.75±1.21 ; 17.85±0.80 ; 19.32±0.50 (Figure 4).
One way ANOVA test results (P-values) showed that there is a significant difference between extraction kits, based on N (0.0000384) and Rdrp (0.0254) genes. However, no significant difference was observed for the E (0.150) and IC (0.0723) genes.
Both extraction kits presented satisfying results. BIGFISH had 96.67% (29/30) positive percent agreement (PPA), and 3,33% (1/30) invalid result (no amplification for IC target). BIOER had 86,67% (26/30) PPA, and 3,67% (2/30) invalid results and 3,67% (2/30) negative results. All false negative and invalid results have been recorded on high dilution rates (>102). Table 3 summarized final RT-qPCR results for both extraction kits.
Simulation of a Non-Compliant Nasopharyngeal Swab Sample
GeneFinder™ COVID-19 Plus RealAmp Amplification Kit has a multiplex of 4 genes, the RNase-P gene as an Internal Reaction Control. This target controls the process of sampling, extraction, and amplification performances. We used a ratio of the Ct values of viral genes and the Ct of RNase P gene to normalize SARS-CoV2 RT-PCR results taking on consideration the preanalytical process of sampling. Figure 5 illustrates Ct (viral genes) / Ct (internal control) Ratio for tested simples in different dilutions. Results demonstrate that the ratio remained stable between different dilutions of five positive samples.
The coefficients of variation (CV) of ratios across dilutions varied between (1.9 and 4.3%), (4.1 and 7.6%), (2.5 and 6.5%) for the E, N and Rdrp genes respectively. Those results suggested that there is no significant difference between ratios (Table 4).
Impact of Pooling Strategy on SARS-CoV2 RT-qPCR Results
Technical Evaluation of Pooling Strategy
Different pooling strategies were tested. A correlation between Mean Ct values and pool size was performed to illustrate the variation of Ct values in different pools. Based on R2, there is a strong positive correlation between Ct values and pool size. Ct value increases with the pool volume (Figure 6).
The difference between the Ct values “ΔCt” for primary samples and different Pools tested vary between (2.566 - 13.78), (2.364 - 12.596) and (2.377 - 14.657) for the three genes (E, N, Rdrp).
For an assessment of the impact of pooling, an ANOVA test was performed to compare different strategies tested for all included samples.
For the internal control Ct; the mean Ct value of different pools was 29.95 (CV=0.0507), the p-values vary between 0.679 and 1.00. This result suggested that there is no significant difference between pools.
For viral genes, the mean Ct values of different Pools are; 25.60, 26.18 and 27.88 for E, N, Rdrp genes respectively. p-values obtained from ANOVA test comparing Ct from pools (P5, P10) with primary samples suggest no significant difference (p>0.05). On the other hand, Ct values resulting from Pools of 100 to 10000 are statistically different from primary samples (p-values*** <0,05). Table 5 summarized ANOVA test comparing different pooling strategies.
Economic Evaluation of Pooling Strategy
The analysis on the online software (Shiny App for Pooled Testing), demonstrates that the application of pooling approach requires consideration of the particularities of each region in terms of prevalence and workflow. For instance, in a population with a prevalence of 0.1%, the pool of 10 samples can offer a test saving rate up to 88% (120 tests/1000 samples). However, in populations with a prevalence of 20%, the saving rate will not exceed 5%, which is negligible in view of the additional burden of individual tests arising from positive Pools, the risk of contamination and the extra time caused by delays (Table 6).
Discussion
This study aims to evaluate the performance of SARS-CoV-2 mass screening approach in the Souss-Massa region of Morocco. Given the unprecedented wave of the Covid-19 pandemic and the emergence of novel detection kits, there exists a need for a systematic evaluation of their effectiveness. In this context, the RT-qPCR-based assay has been introduced as a routine diagnostic tool for the detection of SARS-CoV-2 genome in infected patients. However, a comprehensive assessment of its performance in the context of mass screening is lacking. Thus, this study seeks to fill this knowledge gap and contribute to the existing literature. Furthermore, it is noteworthy that a few recent publications have examined the efficacy of the SARS-CoV-2 RT-qPCR method, thus providing valuable insights into its diagnostic capabilities [19,20,21].
The comparison of both extraction kits showed a significant difference between the Ct values for the Rdrp and N gene (p<0.05), while no significant difference was observed for IC and E genes (p>0.05). Amplification curves of different samples extracted by BIGFISH Kit recorded generally lower Ct values than the BIOER Kit. The mean Ct values recorded for BIGFISH and BIOER respectively are; 30.40 versus 28. 37 for IC gene, 23.47 versus 29.79 for N gene, 25.69 versus 27.95 for E gene and 25.23 versus 28.42 for Rdrp gene. Two comparative studies were conducted to assess the efficacy of different extraction techniques. The first investigation compared the magnetic bead-based extraction technique (MagMax™) with the Phenol-Chloroform method (TRIzol™) and the column extraction method (Mini Spin Plus Biopur®). The findings revealed no statistically significant difference in cycle threshold (Ct) values among the tested methods (P>0.05) [22,23].
Another study by Chu et al. (2020) examined the effectiveness of an extraction method combining Proteinase-K and heat versus a method relying solely on heat, using various sample types such as saliva and nasopharyngeal swabs (NPS). The results indicated that the combined Proteinase-K and heat method yielded more favorable outcomes, with earlier Ct values, compared to the heat-only method [24]. These findings contradict our own study results, which suggest that the BIGFISH Kit produces slightly superior results compared to the BIOER kit, which utilizes Proteinase-K.
Following the interpretation of the final results, it was observed that BIGFISH kit exhibited a superior positive rate of 96.6% in comparison to the BIOER, which demonstrated a positive rate of 86.6%. The false negative rate for the BIGFISH kit was 0%, while the BIOER kit displayed a false negative rate of 6.6%. Regarding invalid results, the BIGFISH kit yielded a rate of 3.3%, whereas the BIOER kit showed a higher rate of 6.6%.
Both kits demonstrated invalid and negative results when tested with a 10-4 dilution. These findings indicate that both methods possess a 100% predictive capacity for detecting positive samples with low viral loads, specifically up to 10-3 times the load of the primary sample. These outcomes align with the findings of a study conducted by Chu et al. (2020), which explored a duplex Kit targeting Rdrp and N genes. The study revealed a detection capacity of up to 10-3 dilution for Rdrp and 10-4 dilution for the N gene [14].
The importance of the sampling step in the pre-analytical process cannot be overstated, as it exerts a profound influence on the quality of the subsequent analytical results [25,26]. Despite advancements in the analytical performance of molecular tests, the potential for erroneous outcomes due to pre-analytical errors persists. Such errors may arise from improper sample collection, suboptimal transportation, and inadequate storage conditions [27,28]. To shed light on the pre-analytical and analytical vulnerabilities inherent in the molecular diagnosis of SARS-CoV-2, a recent study conducted by G. Lippi et al. in 2020 provides valuable insights and proposes practical guidelines and recommendations to mitigate the risk of errors [29].
The identification of low quantities of viral RNA plays a pivotal role in the identification of individuals who are in the early stages of infection and those who carry the virus without exhibiting any symptoms. In accordance with the technical guidelines provided by the supplier of the Kit, a CT value surpassing the specified threshold (CT=35) or yielding an indeterminate outcome for the internal reference control gene of RNase-P signifies an inconclusive result. Such cases necessitate either the repetition of the test or the acquisition of a secondary sample. The detection of limited amounts of viral RNA assumes utmost significance for the identification of early positive patients and asymptomatic carriers who possess meager viral loads, particularly during the period of recuperation.
Given that the quality of the sampling technique directly influences the Ct value of the internal control, it is crucial for the swab to reach the nasopharyngeal cavity to collect an adequate quantity of epithelial cells. In addition to the classic interpretation proposed by the amplification kit manufacturer, FDA, and CDC, which primarily relies on Ct values of viral genes to estimate viral load, we used the ratio of Ct (viral gene)/Ct (IC gene). This ratio allows normalization and comparison of SARS-CoV2 qPCR between different samples. A smaller ratio corresponds to a higher viral load. For the tested samples in this study, we observed that the Ct (viral gene)/Ct (IC gene) ratio remained stable across the tested dilutions, with minimal variation coefficients (CV) ranging from 1.9% to 4.3% for the E gene, 4.1% to 7.6% for the N gene, and 2.5% to 6.5% for the Rdrp gene, respectively. The stability of this ratio across different diluted samples proposes its use to compare viral load, considering the quality of the sampling process to avoid false negative results.
The concept of pooling samples was first introduced by Dorfman, 1943 [30]. This approach has been previously utilized for the detection of the human immunodeficiency virus (HIV) and viral hepatitis B and C in blood donors [31], and it has also been extensively employed during the current pandemic to increase the efficiency of reverse transcription quantitative polymerase chain reaction (RT-qPCR) testing and optimize the consumption of reagents. Several recent studies have described and evaluated pooling strategies for SARS-CoV-2 screening, employing various approaches [32,33,34,35]. In our study, we conducted experiments to test multiple pooling strategies as outlined in the experimental protocol. We practically demonstrate the usefulness of pooled sampling and its ability to detect viral presence even in highly diluted samples.
Regarding the internal control gene, the mean Ct value across different pools was 29.95 with 0.679 <p< 1.00. For the three viral genes, the results of the analysis of variance (ANOVA) test reveal that pooling strategies involving five (P5) up to ten samples (P10) shows no significant difference compared to the primary samples (p > 0.05). However, for other pooling tested strategies (P102-P104), statistically significant differences were observed compared to the primary samples.
Based on the results of comparison tests and the strong positive correlation observed between CT values and pool volume (R2~1), the pooling increases the Ct values of viral genes. The average ΔCT for the E, N, and Rdrp genes were 2.76, 2.52, and 2.93, respectively. The ranges of ΔCT between different pools and the primary sample were 2.566 to 13.78 for the E gene, 2.364 to 12.596 for the N gene, and 2.377 to 14.657 for the Rdrp gene. Those results align with previous studies that have evaluated various pooling strategies (2 to 64 samples) for different SARS-CoV-2 targets [32,33,35,36,37].
Our results suggest that positive samples can still be detected in large pools up to a size of 104, as evidenced by a positive rate of 29 out of 30 (96.7%) among the tested samples. However, it is important to note that the limitation of ΔCT, which can reach up to a 14.6-cycle difference from the primary sample, can lead to false negative results. Considering these findings, large pooling strategies are only applicable to samples with high viral loads, as supported by recent studies that have evaluated samples with varying viral loads (low, medium, and high). These studies have reported that low viral load samples may not be detectable in large pools consisting of more than five samples [33,33,38]. For instance, a study by Wacharapluesadee et al. (2020) indicated a false negative rate of 13.3% for samples with low viral loads [39].
Although pooling has demonstrated positive impacts in terms of increasing the number of tests conducted and optimizing time and resources, several considerations need to be taken into account. These include the potential loss of sensitivity associated with using large pool sizes, the need for concentration and precision during sample handling, and the high risk of contamination. The efficiency of pooling is directly influenced by the prevalence of the disease and the desired economic aspects. In situations with higher prevalence rates, the additional workload of sorting and individually testing samples from large positive pools becomes impractical [32].
To assess the economic efficiency of pooling under different prevalence scenarios, we utilized an online analysis software called Shiny App for Pooled Testing [18]. Simulation results showed that when the prevalence is 0.1%, pooling strategies involving 5 to 10 samples can achieve more than 88% cost savings (120 tests out of 1000 samples). However, when the prevalence increases to 20%, the cost savings do not exceed 5%.
Another important aspect to consider is the necessity of optimal monitoring of the preanalytical process, particularly during the sampling stage. Improperly collected positive samples that are pooled with negative samples can result in false negative results, even if the internal control CT value (RNase-P of other samples) appears valid. Thus, careful attention must be given to the sampling process to avoid such issues.
Conclusion
This study highlights many aspects of the molecular diagnostic of SARS-CoV2 in pandemic circumstances, and reveals the importance of proper sample collection to ensure an adequate diagnostic. Pooling approach in diagnostic testing has shown potential benefits in terms of increased efficiency, resource optimization, and cost savings. While it can be a valuable tool, careful consideration of its limitations and appropriate implementation is necessary for optimal results in diagnostic testing.
Funding
This work has received funding from the National Center for Scientific and Technical Research (CNRST): GRANT_NUMBER: Cov/2020/33, “Host-Pathogen Interaction in COVID-19 /SARS-CoV-2: Clinical and Genetic Study”.
Declaration of Competing Interests
The authors declare that they have no financial or commercial ties that could be construed as a potential conflict of interest.
Sequence Information
Not applicable.
References
- Luk, H.K.H.; Li, X.; Fung, J.; Lau, S.K.P.; Woo, P.C.Y. Molecular epidemiology, evolution and phylogeny of SARS coronavirus. Infect. Genet. Evol. J. Mol. Epidemiol. Evol. Genet. Infect. Dis. 2019, 71, 21–30. [Google Scholar] [CrossRef]
- Khan, S.; Ali, A.; Siddique, R.; Nabi, G. Novel coronavirus is putting the whole world on alert. J. Hosp. Infect. 2020, 104, 252–253. [Google Scholar] [CrossRef]
- Zhou, P.; Yang, X.-L.; Wang, X.-G.; Hu, B.; Zhang, L.; Zhang, W.; Si, H.-R.; Zhu, Y.; Li, B.; Huang, C.-L.; et al. A pneumonia outbreak associated with a new coronavirus of probable bat origin. Nature 2020, 579, 270–273. [Google Scholar] [CrossRef]
- Khailany, R.A.; Safdar, M.; Ozaslan, M. Genomic characterization of a novel SARS-CoV-2. Gene Rep. 2020, 19, 100682. [Google Scholar] [CrossRef]
- Malik, Y.A. Properties of Coronavirus and SARS-CoV-2. Malays. J. Pathol. 2020, 42, 3–11. [Google Scholar]
- Hoffmann, M.; Kleine-Weber, H.; Schroeder, S.; Krüger, N.; Herrler, T.; Erichsen, S.; Schiergens, T.S.; Herrler, G.; Wu, N.-H.; Nitsche, A.; et al. SARS-CoV-2 Cell Entry Depends on ACE2 and TMPRSS2 and Is Blocked by a Clinically Proven Protease Inhibitor. Cell 2020, 181, 271–280.e8. [Google Scholar] [CrossRef] [PubMed]
- Lotfi, M.; Hamblin, M.R.; Rezaei, N. COVID-19: Transmission, prevention, and potential therapeutic opportunities. Clin. Chim. Acta Int. J. Clin. Chem. 2020, 508, 254–266. [Google Scholar] [CrossRef]
- Bonny, V.; Maillard, A.; Mousseaux, C.; Plaçais, L.; Richier, Q. COVID-19: physiopathologie d’une maladie à plusieurs visages. Rev. Médecine Interne 2020, 41, 375–389. [Google Scholar] [CrossRef] [PubMed]
- Coronavirus Disease (COVID-19) Situation Reports. Available online: https://www.who.int/emergencies/diseases/novel-coronavirus-2019/situation-reports (accessed on Sep 15, 2020).
- Dong, E.; Du, H.; Gardner, L. An interactive web-based dashboard to track COVID-19 in real time. Lancet Infect. Dis. 2020, 20, 533–534. [Google Scholar] [CrossRef]
- Wilder-Smith, A.; Freedman, D.O. Isolation, quarantine, social distancing and community containment: pivotal role for old-style public health measures in the novel coronavirus (2019-nCoV) outbreak. J. Travel Med. 2020, 27. [Google Scholar] [CrossRef] [PubMed]
- Marca, A.L.; Capuzzo, M.; Paglia, T.; Roli, L.; Trenti, T.; Nelson, S.M. Testing for SARS-CoV-2 (COVID-19): a systematic review and clinical guide to molecular and serological in-vitro diagnostic assays. Reprod. Biomed. Online 2020, 41, 483–499. [Google Scholar] [CrossRef] [PubMed]
- Cascella, M.; Rajnik, M.; Cuomo, A.; Dulebohn, S.C.; Di Napoli, R. Features, Evaluation, and Treatment of Coronavirus (COVID-19). In StatPearls; StatPearls Publishing: Treasure Island (FL), 2020. [Google Scholar]
- Chu, D.K.W.; Pan, Y.; Cheng, S.M.S.; Hui, K.P.Y.; Krishnan, P.; Liu, Y.; Ng, D.Y.M.; Wan, C.K.C.; Yang, P.; Wang, Q.; et al. Molecular Diagnosis of a Novel Coronavirus (2019-nCoV) Causing an Outbreak of Pneumonia. Clin. Chem. 2020, 66, 549–555. [Google Scholar] [CrossRef] [PubMed]
- Zhang, W.; Du, R.-H.; Li, B.; Zheng, X.-S.; Yang, X.-L.; Hu, B.; Wang, Y.-Y.; Xiao, G.-F.; Yan, B.; Shi, Z.-L.; et al. Molecular and serological investigation of 2019-nCoV infected patients: implication of multiple shedding routes. Emerg. Microbes Infect. 2020, 9, 386–389. [Google Scholar] [CrossRef]
- Gard, L.; Fliss, M.A.; Bosma, F.; ter Veen, D.; Niesters, H.G.M. Validation and verification of the GeneFinderTM COVID-19 Plus RealAmp kit on the ELITe InGenius® instrument. J. Virol. Methods 2022, 300, 114378. [Google Scholar] [CrossRef] [PubMed]
- Health, C. for D. and R. qRT-PCR Emergency Use Authorizations for Medical Devices. Available online: https://www.fda.gov/medical-devices/emergency-situations-medical-devices/emergency-use-authorizations-medical-devices (accessed on Sep 30, 2020).
- Brianna, D.H.; Christopher, B.; Joshua, T.; Christopher, M. Pooled Testing. Available online: https://bilder.shinyapps.io/PooledTesting/ (accessed on Jul 6, 2023).
- Wang, X.; Yao, H.; Xu, X.; Zhang, P.; Zhang, M.; Shao, J.; Xiao, Y.; Wang, H. Limits of Detection of 6 Approved RT–PCR Kits for the Novel SARS-Coronavirus-2 (SARS-CoV-2). Clin. Chem. 2020, 66, 977–979. [Google Scholar] [CrossRef]
- Chan, J.F.-W.; Yip, C.C.-Y.; To, K.K.-W.; Tang, T.H.-C.; Wong, S.C.-Y.; Leung, K.-H.; Fung, A.Y.-F.; Ng, A.C.-K.; Zou, Z.; Tsoi, H.-W.; et al. Improved Molecular Diagnosis of COVID-19 by the Novel, Highly Sensitive and Specific COVID-19-RdRp/Hel Real-Time Reverse Transcription-PCR Assay Validated In Vitro and with Clinical Specimens. J. Clin. Microbiol. 2020, 58. [Google Scholar] [CrossRef]
- Yelin, I.; Aharony, N.; Shaer-Tamar, E.; Argoetti, A.; Messer, E.; Berenbaum, D.; Shafran, E.; Kuzli, A.; Gandali, N.; Hashimshony, T.; et al. Evaluation of COVID-19 RT-qPCR test in multi-sample pools. medRxiv 2020, 2020.03.26.20039438. [Google Scholar] [CrossRef]
- Eisen, A.K.A.; Demoliner, M.; Gularte, J.S.; Hansen, A.W.; Schallenberger, K.; Mallmann, L.; Hermann, B.S.; Heldt, F.H.; Almeida, P.R. de; Fleck, J.D.; et al. Comparison of Different Kits for SARS-CoV-2 RNA Extraction Marketed in Brazil. bioRxiv 2020, 2020.05.29.122358. [Google Scholar] [CrossRef]
- Eichhoff, O.M.; Bellini, E.; Lienhard, R.; Stark, W.J.; Bechtold, P.; Grass, R.N.; Bosshard, P.P.; Levesque, M.P. Comparison of RNA extraction methods for the detection of SARS-CoV-2 by RT-PCR 2020, 2020.08.13.20172494. [CrossRef]
- Chu, A.W.-H.; Chan, W.-M.; Ip, J.D.; Yip, C.C.-Y.; Chan, J.F.-W.; Yuen, K.-Y.; To, K.K.-W. Evaluation of simple nucleic acid extraction methods for the detection of SARS-CoV-2 in nasopharyngeal and saliva specimens during global shortage of extraction kits. J. Clin. Virol. Off. Publ. Pan Am. Soc. Clin. Virol. 2020, 129, 104519. [Google Scholar] [CrossRef]
- Alcantara, J.C.; Alharbi, B.; Almotairi, Y.; Alam, M.J.; Muddathir, A.R.M.; Alshaghdali, K. Analysis of preanalytical errors in a clinical chemistry laboratory: A 2-year study. Medicine (Baltimore) 2022, 101, e29853. [Google Scholar] [CrossRef] [PubMed]
- Diagnostic samples: from the patient to the laboratory ; the impact of preanalytical variables on the quality of laboratory results, Guder, W.G., Ed.; 4., updated ed.; Wiley-Blackwell: Weinheim, 2014; ISBN 978-3-527-32307-4. [Google Scholar]
- Falasca, F.; Sciandra, I.; Di Carlo, D.; Gentile, M.; Deales, A.; Antonelli, G.; Turriziani, O. Detection of SARS-COV N2 Gene: Very low amounts of viral RNA or false positive? J. Clin. Virol. 2020, 133, 104660. [Google Scholar] [CrossRef]
- Basso, D.; Aita, A.; Navaglia, F.; Franchin, E.; Fioretto, P.; Moz, S.; Bozzato, D.; Zambon, C.-F.; Martin, B.; Prà, C.D.; et al. SARS-CoV-2 RNA identification in nasopharyngeal swabs: issues in pre-analytics. Clin. Chem. Lab. Med. CCLM 2020, 58, 1579–1586. [Google Scholar] [CrossRef] [PubMed]
- Lippi, G.; Simundic, A.-M.; Plebani, M. Potential preanalytical and analytical vulnerabilities in the laboratory diagnosis of coronavirus disease 2019 (COVID-19). Clin. Chem. Lab. Med. 2020, 58, 1070–1076. [Google Scholar] [CrossRef]
- Dorfman, R. The Detection of Defective Members of Large Populations. Ann. Math. Stat. 1943, 14, 436–440. [Google Scholar] [CrossRef]
- Mathur, A.; Shah, J.; Shah, R.; Shah, P.; Harimoorthy, V.; Choudhury, N.; Tulsiani, S. A study on optimization of plasma pool size for viral infectious markers in Indian blood donors using nucleic acid amplification testing. Asian J. Transfus. Sci. 2012, 6, 50–52. [Google Scholar] [CrossRef]
- Chong, B.S.W.; Tran, T.; Druce, J.; Ballard, S.A.; Simpson, J.A.; Catton, M. Sample pooling is a viable strategy for SARS-CoV-2 detection in low-prevalence settings. Pathology (Phila.) 2020, 52, 796–800. [Google Scholar] [CrossRef]
- Garg, J.; Singh, V.; Pandey, P.; Verma, A.; Sen, M.; Das, A.; Agarwal, J. Evaluation of sample pooling for diagnosis of COVID-19 by real time-PCR: A resource-saving combat strategy. J. Med. Virol. 2021, 93, 1526–1531. [Google Scholar] [CrossRef]
- Chen, F.; Geng, Z.; Wang, J.; Liuchang, W.; Huang, D.; Xu, Y.; Wang, Z.; Wang, L. Comparing two sample pooling strategies for SARS-CoV-2 RNA detection for efficient screening of COVID-19. J. Med. Virol. 2021, 93, 2805–2809. [Google Scholar] [CrossRef] [PubMed]
- Ben-Ami, R.; Klochendler, A.; Seidel, M.; Sido, T.; Gurel-Gurevich, O.; Yassour, M.; Meshorer, E.; Benedek, G.; Fogel, I.; Oiknine-Djian, E.; et al. Large-scale implementation of pooled RNA extraction and RT-PCR for SARS-CoV-2 detection. Clin. Microbiol. Infect. 2020, 26, 1248–1253. [Google Scholar] [CrossRef]
- Chhikara, K.; Kanta, P.; Ghosh, A.; Prakash, R.C.; Goyal, K.; Singh, M.P. Validation of SARS CoV-2 detection by real-time PCR in matched pooled and deconvoluted clinical samples before and after nucleic acid extraction: a study in tertiary care hospital of North India. Diagn. Microbiol. Infect. Dis. 2021, 99, 115206. [Google Scholar] [CrossRef] [PubMed]
- Health, C. for D. and R. Pooled Sample Testing and Screening Testing for COVID-19. FDA 2020. [Google Scholar]
- Gupta, E.; Padhi, A.; Khodare, A.; Agarwal, R.; Ramachandran, K.; Mehta, V.; Kilikdar, M.; Dubey, S.; Kumar, G.; Sarin, S.K. Pooled RNA sample reverse transcriptase real time PCR assay for SARS CoV-2 infection: A reliable, faster and economical method. PLOS ONE 2020, 15, e0236859. [Google Scholar] [CrossRef] [PubMed]
- Wacharapluesadee, S.; Kaewpom, T.; Ampoot, W.; Ghai, S.; Khamhang, W.; Worachotsueptrakun, K.; Wanthong, P.; Nopvichai, C.; Supharatpariyakorn, T.; Putcharoen, O.; et al. Evaluating the efficiency of specimen pooling for PCR-based detection of COVID-19. J. Med. Virol. 2020, 92, 2193–2199. [Google Scholar] [CrossRef] [PubMed]
Figure 1.
Cycle Threshold (Ct) values of included positive samples (97).
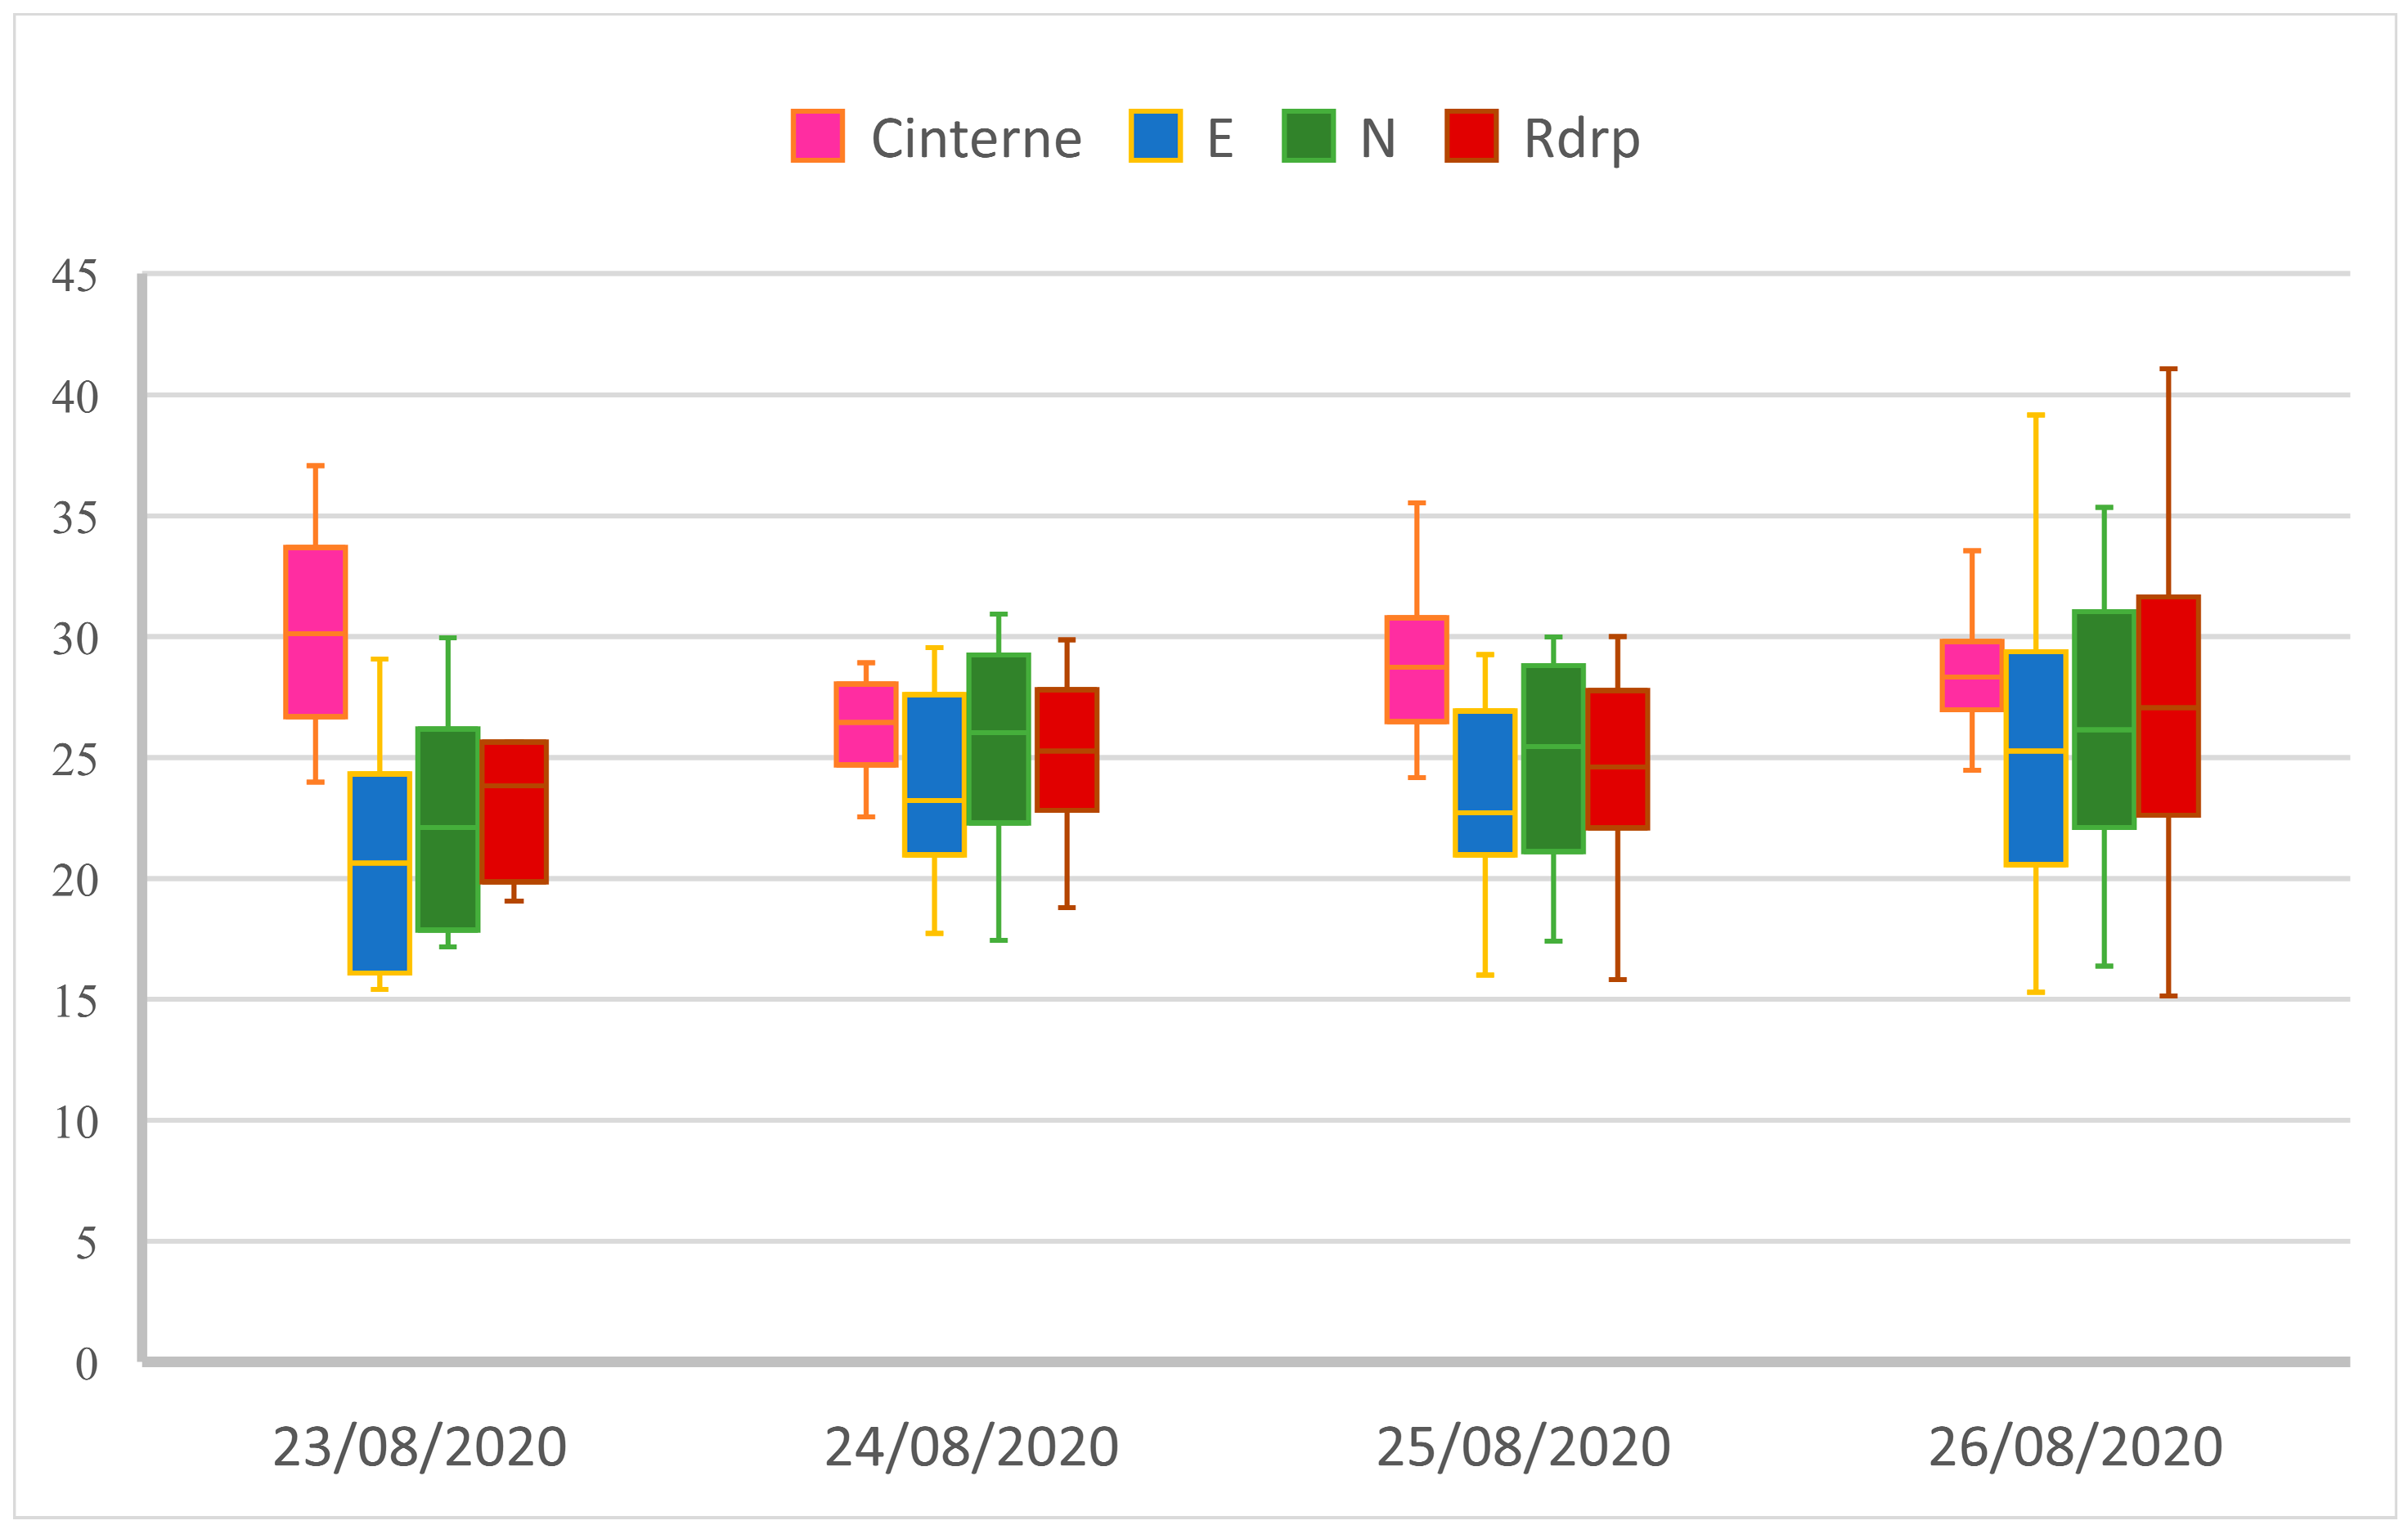
Figure 2.
Samples preparation protocol (Dilution prepared by VTM).
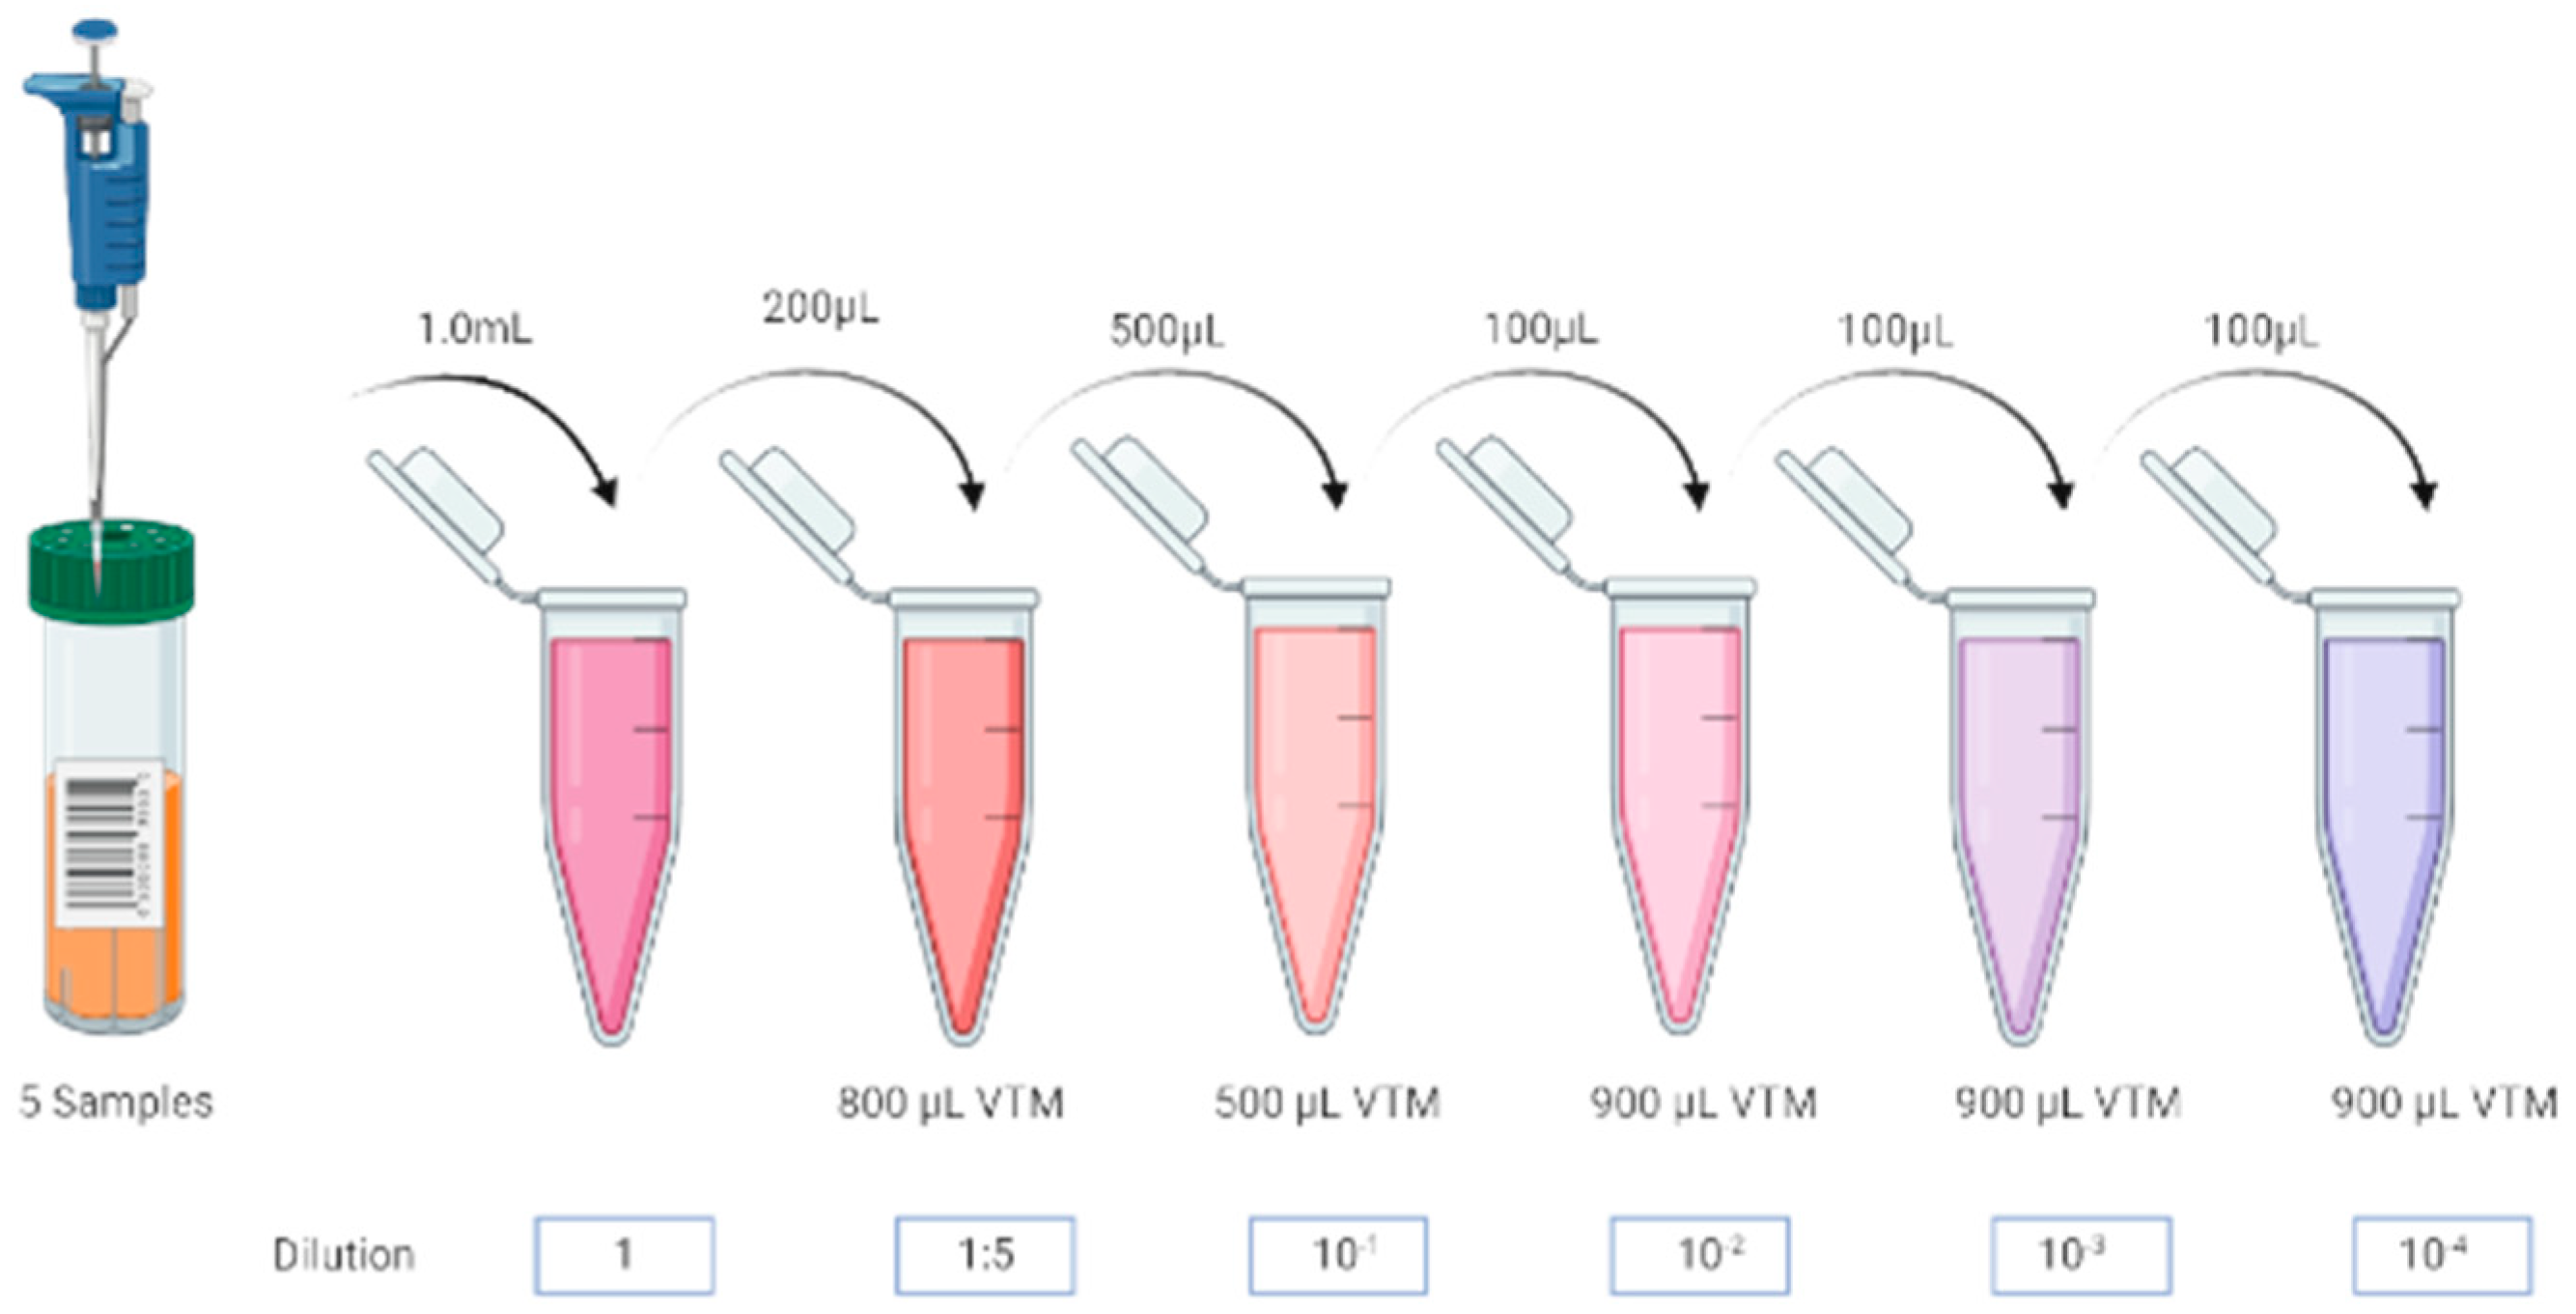
Figure 3.
Amplification curves for sample N°1 for both kits BIOER (A) and BIGFISH (B).
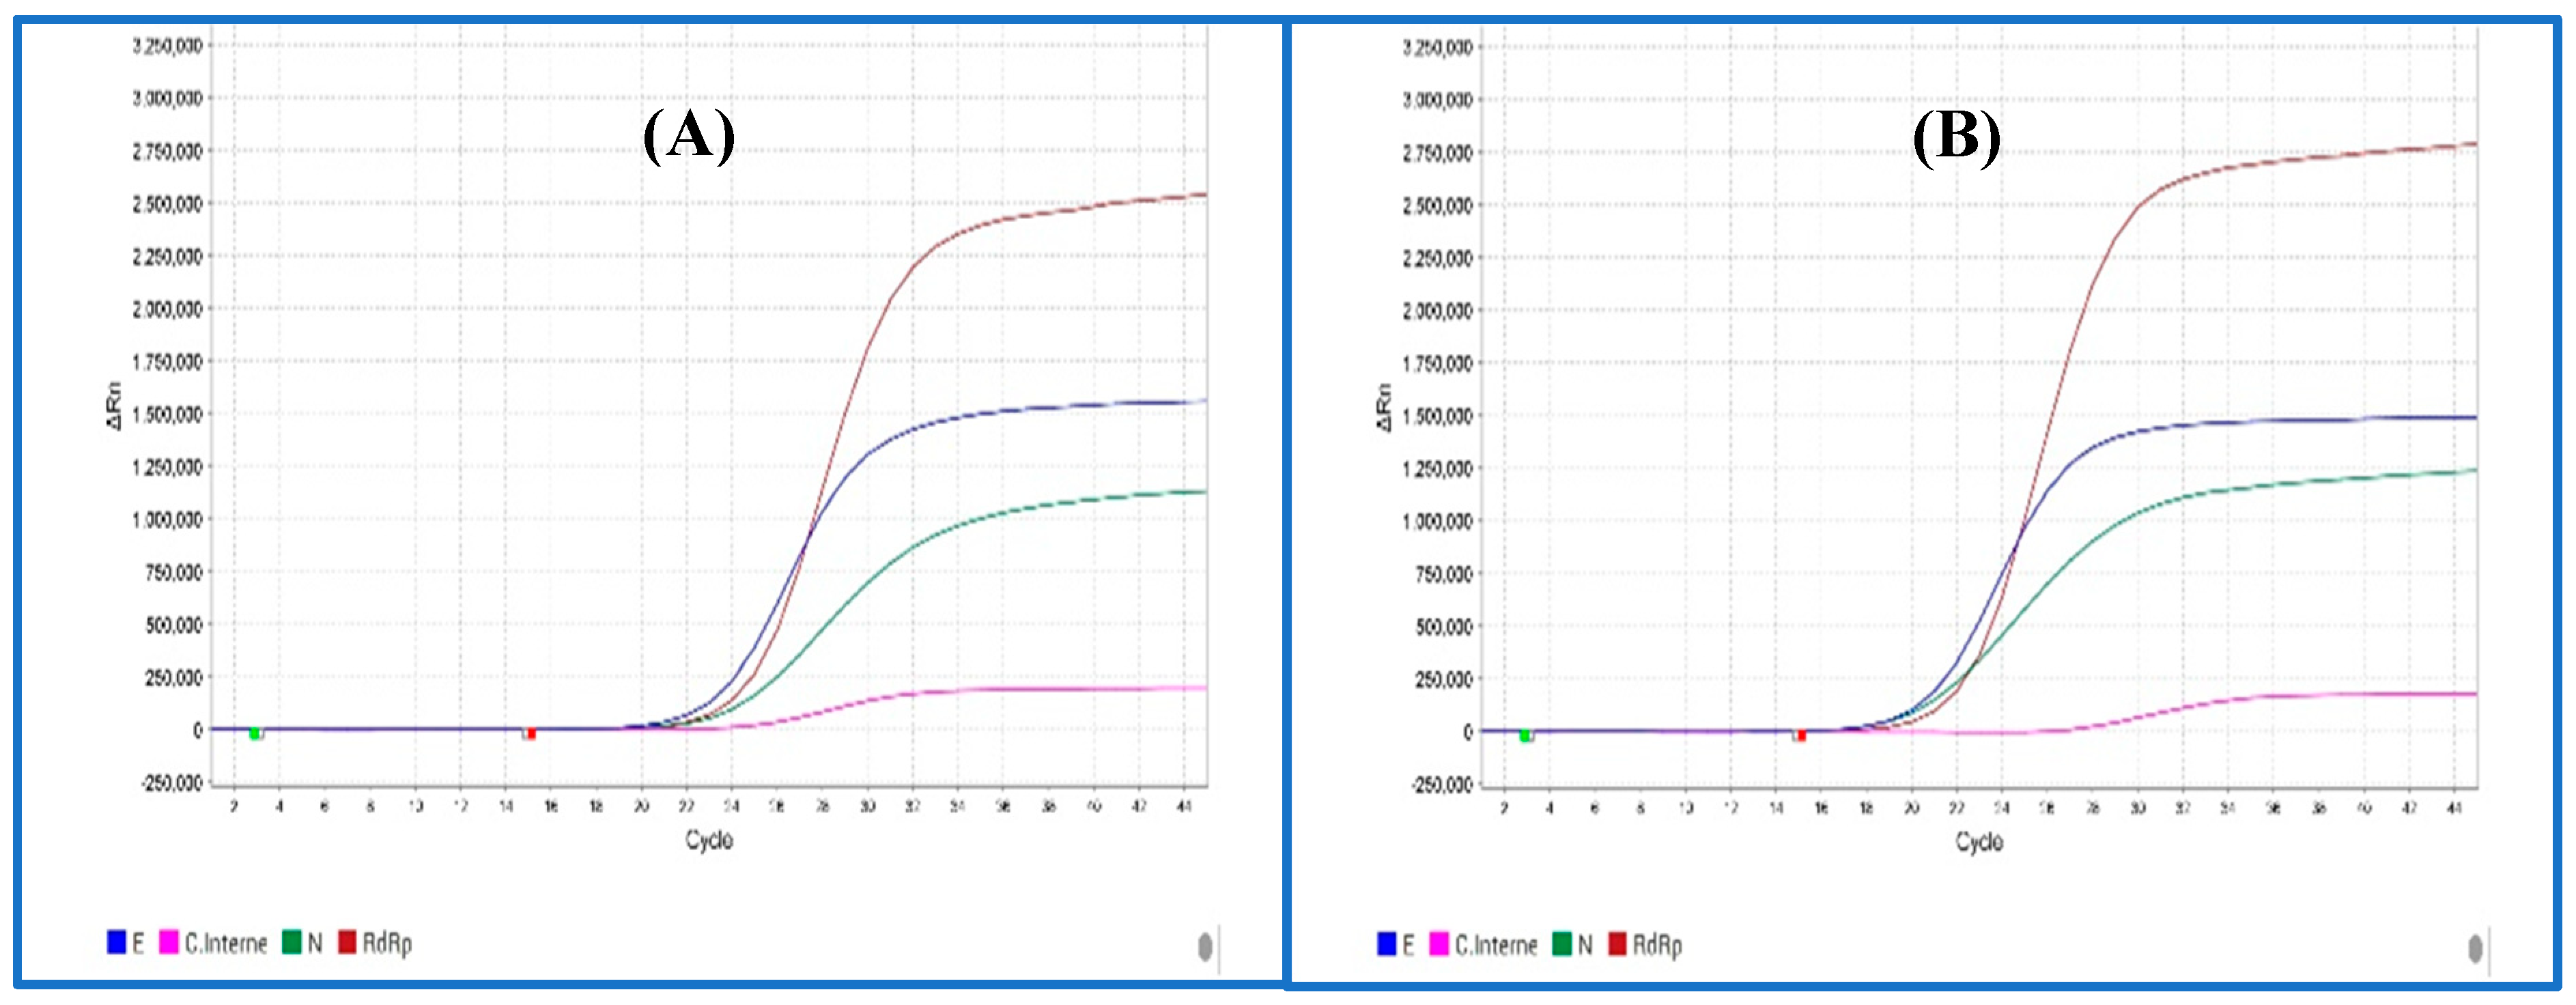
Figure 4.
Correlation between means Ct values with dilution factors for BIGFISH (A) and BIOER (B) kits.
Figure 4.
Correlation between means Ct values with dilution factors for BIGFISH (A) and BIOER (B) kits.
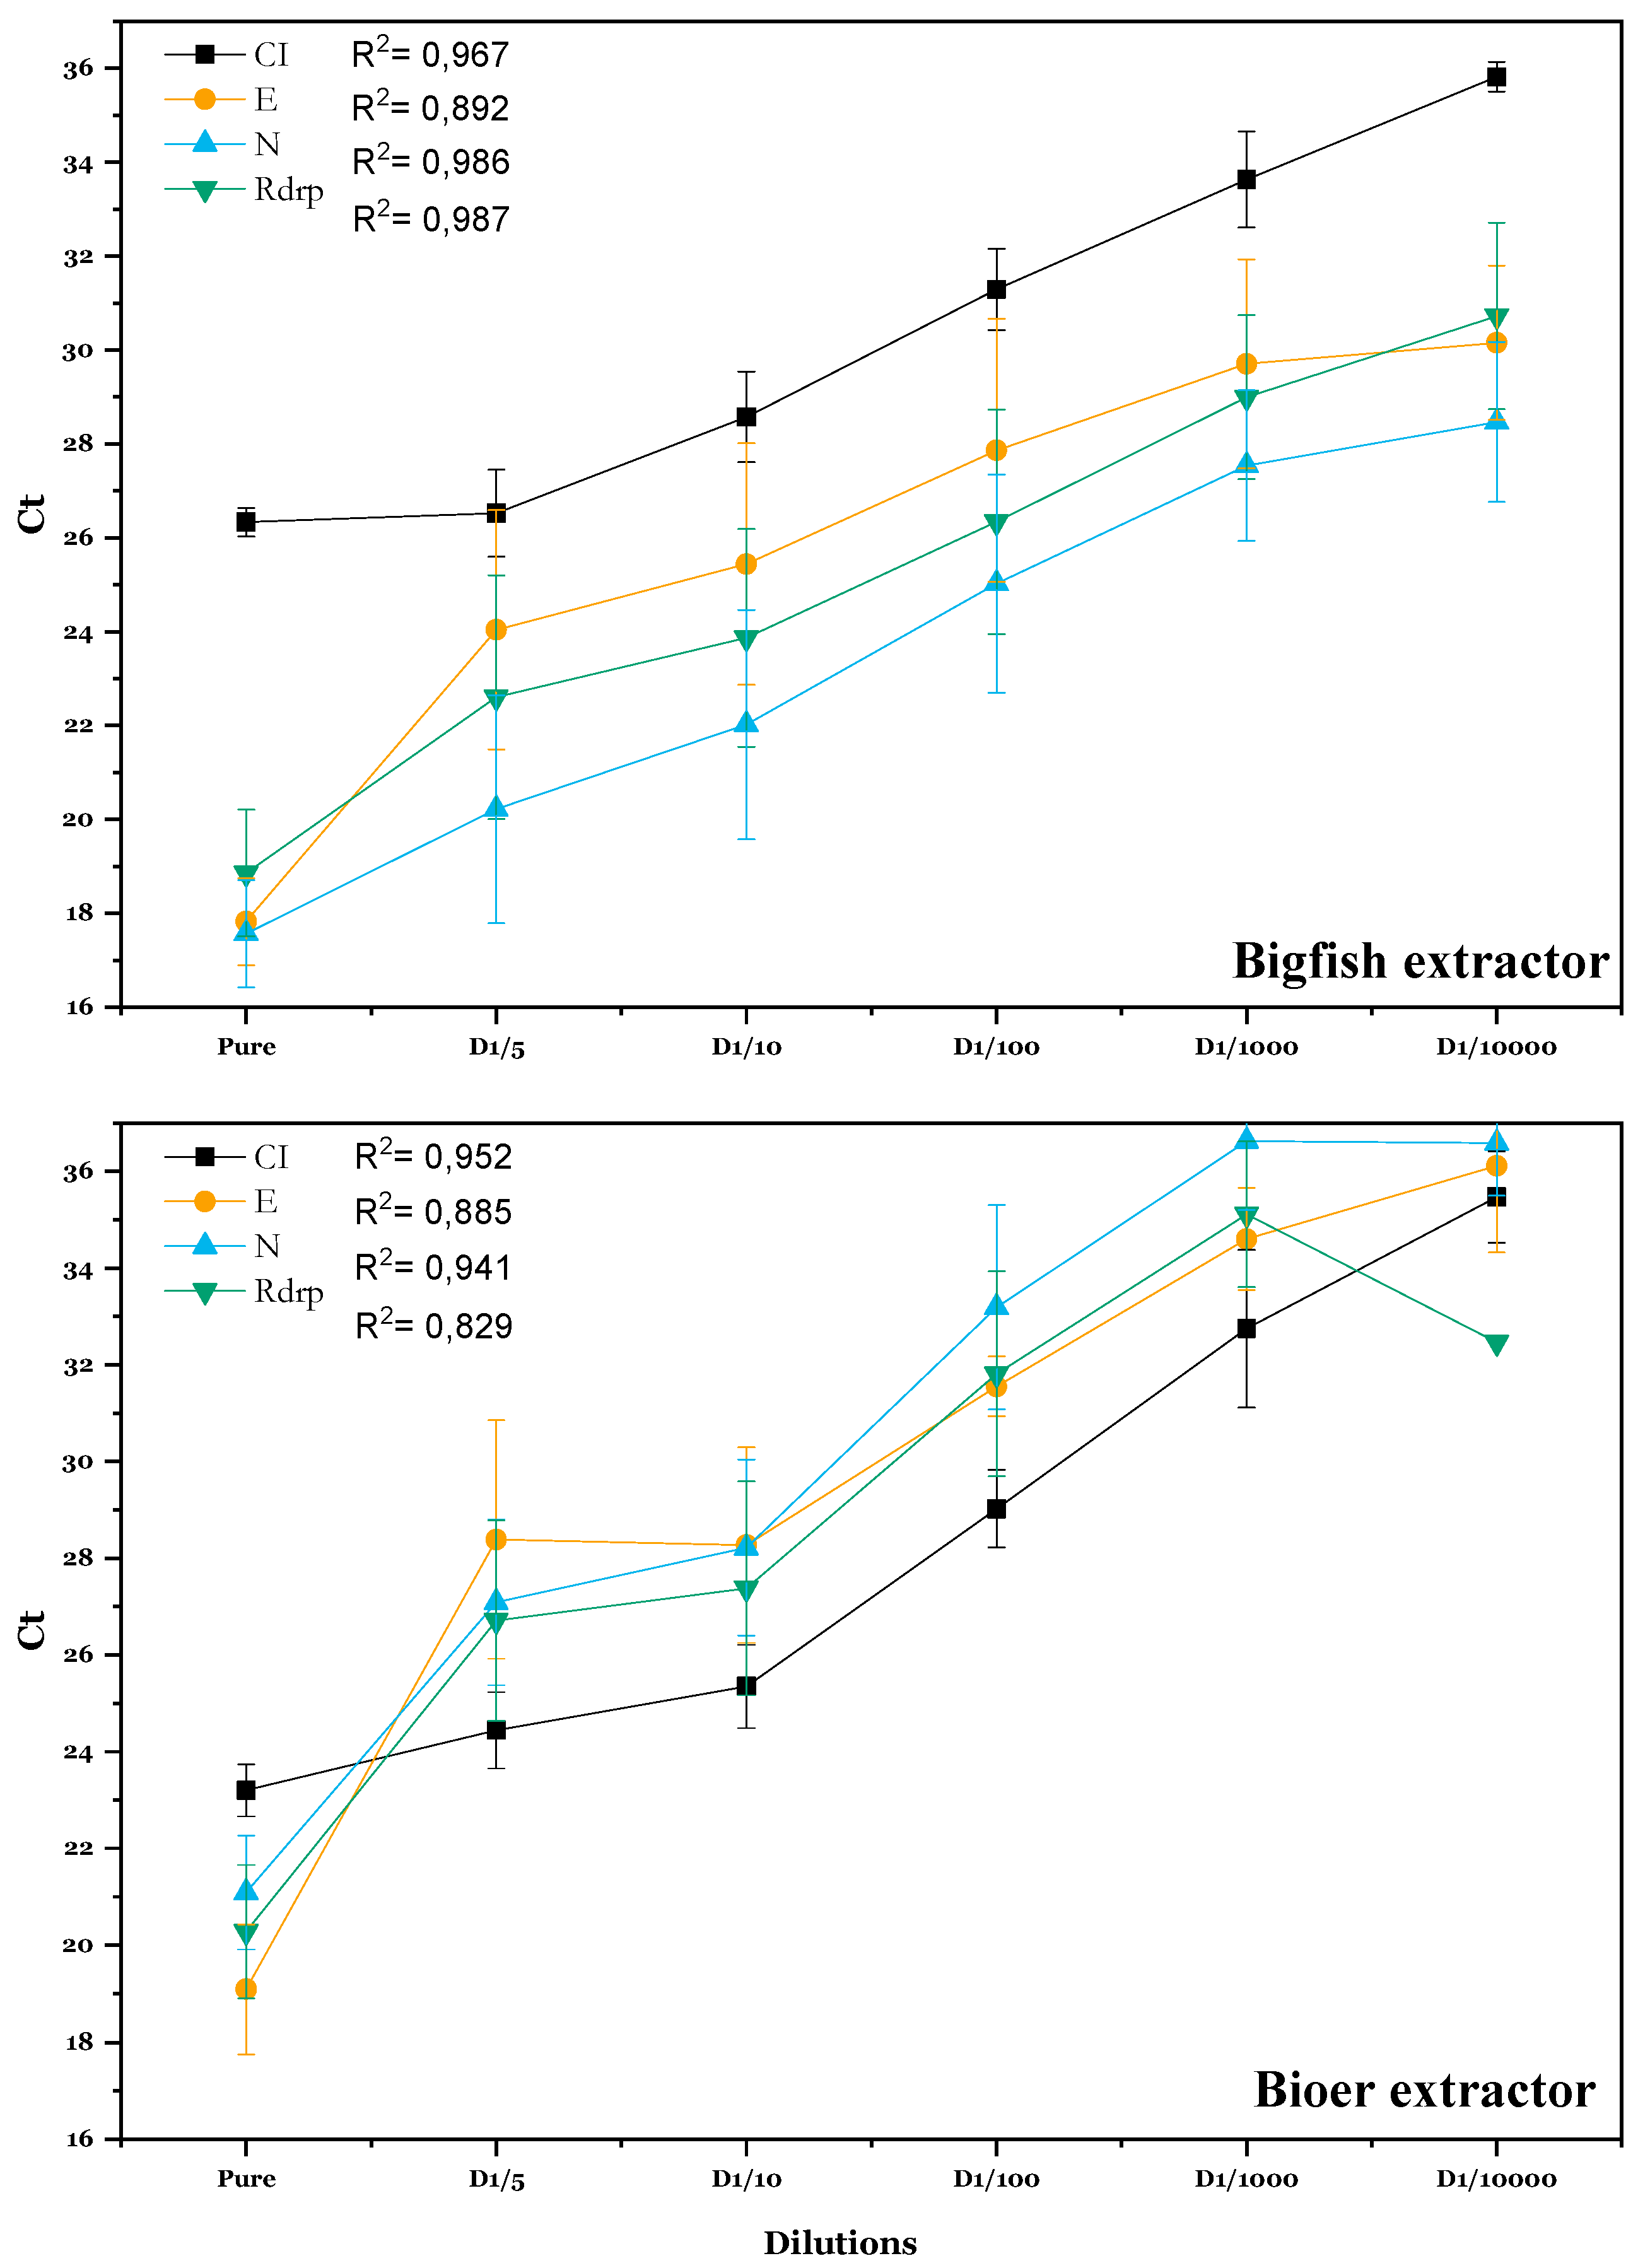
Figure 5.
Evolution of CT (viral genes)/ CT (internal control) across dilutions.
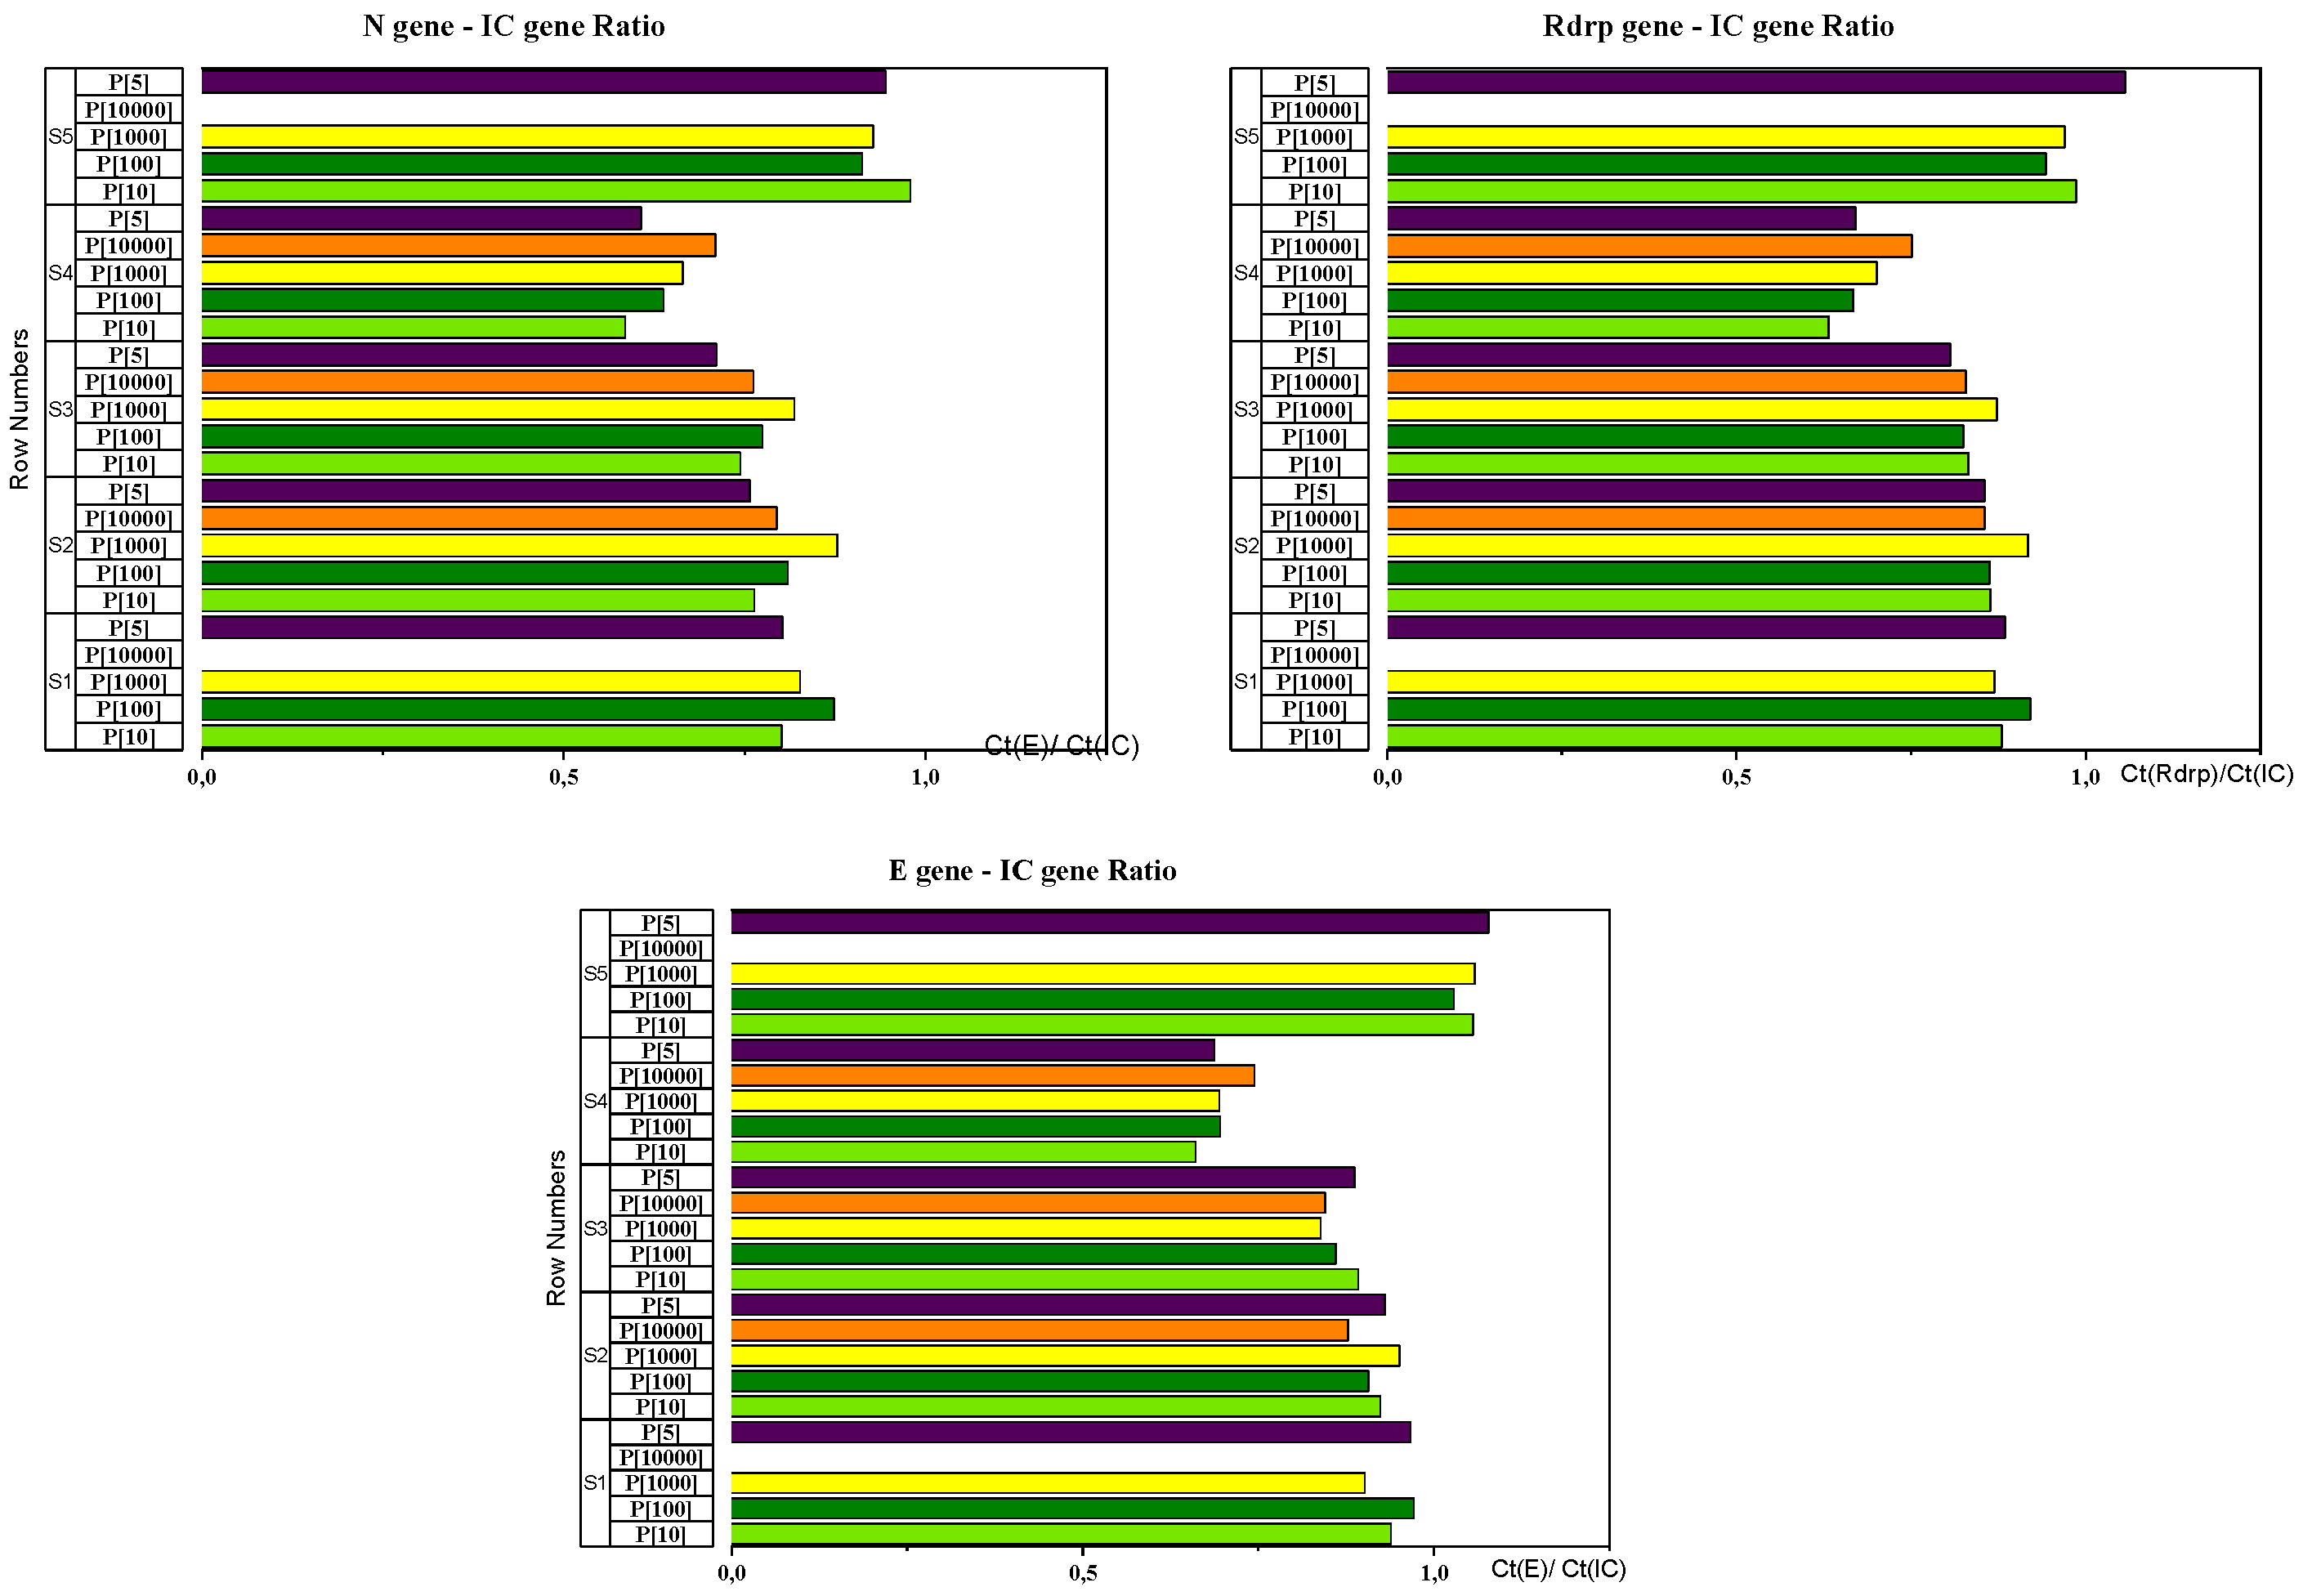
Figure 6.
Correlation between means Ct values with different Pool strategies tested.
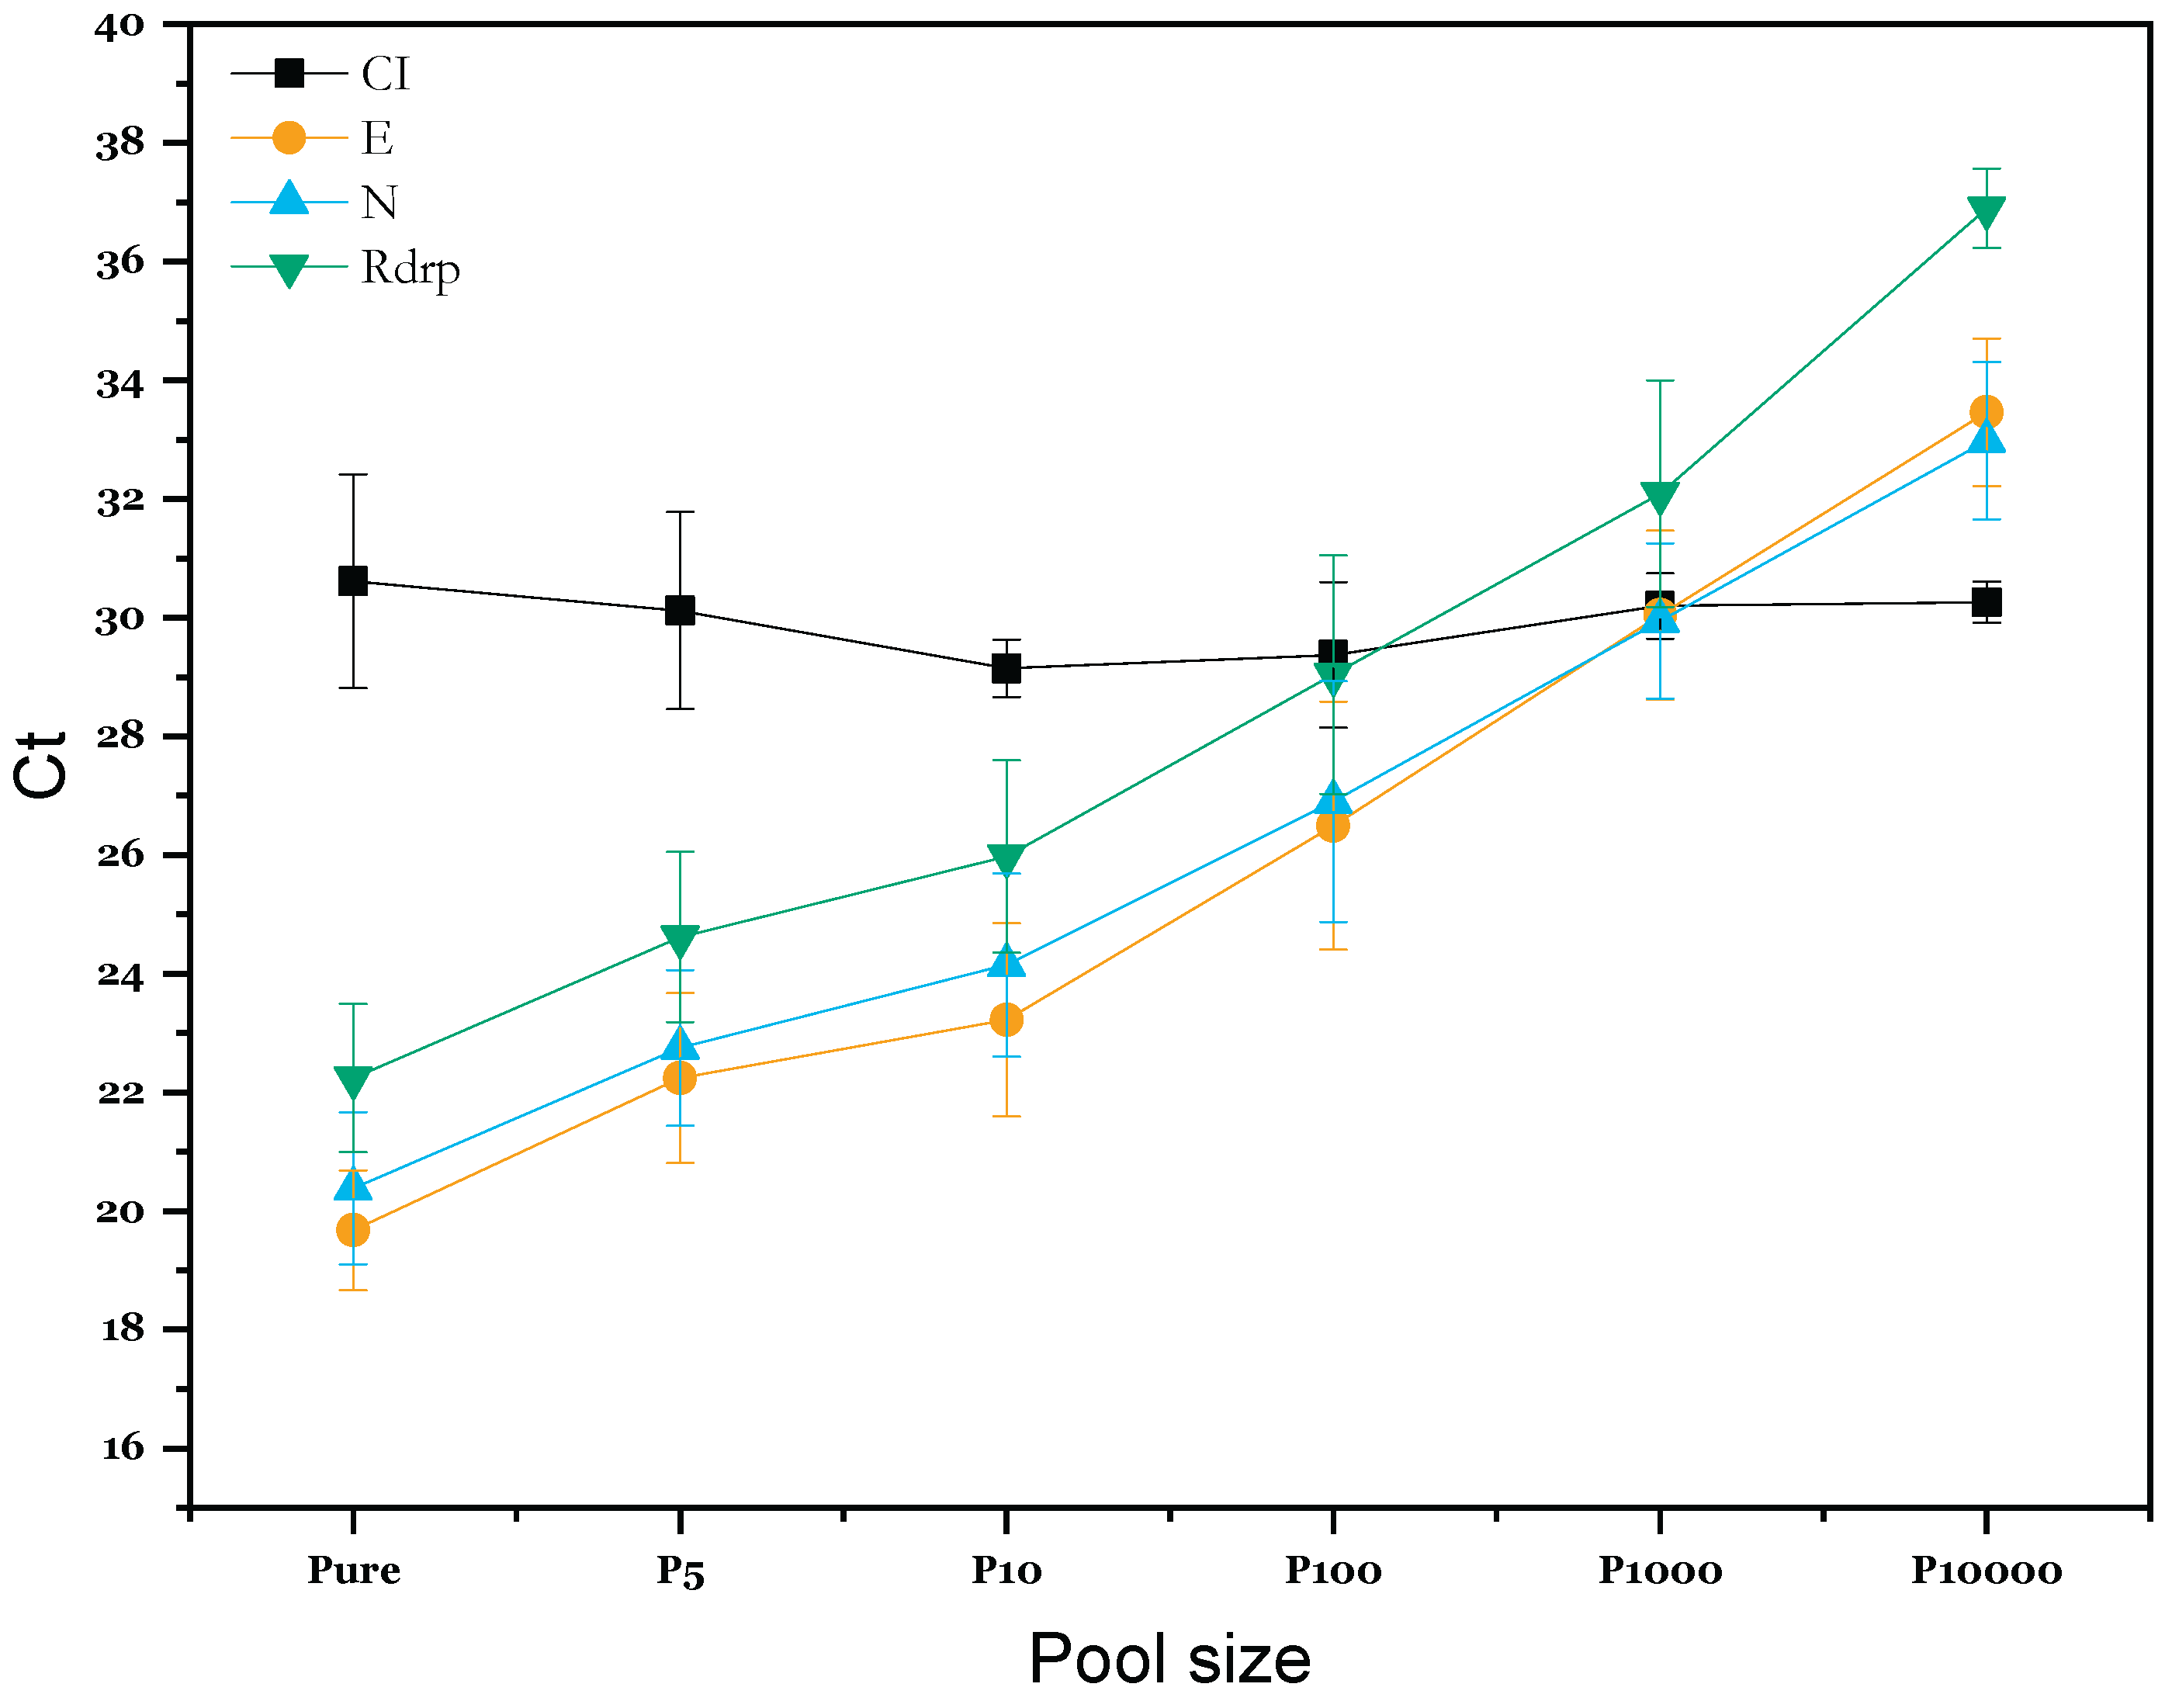

Table 1.
Descriptive statistics of Ct for the five included samples for the experimental study.
| Target | CI | E | N | Rdrp |
|---|---|---|---|---|
| Mean | 26,82 | 16,75 | 17,85 | 19,32 |
| SD | 1,17 | 1,21 | 0,80 | 0,50 |
| CV | 0,04 | 0,07 | 0,04 | 0,03 |
| Median | 27,58 | 16,31 | 17,44 | 19,20 |
| Max | 27,71 | 18,29 | 19,14 | 20,12 |
| Min | 25,29 | 15,42 | 17,17 | 18,79 |
| (n) | 5 | 5 | 5 | 5 |
Table 2.
Targets and fluorescence channels setting.
| Targets | Fluorescence (Reporter dye) |
|---|---|
| Rdrp | FAM (C21H12O7) |
| N | JOE (C27H17Cl2NO11) |
| E | Texas Red (C31H29ClN2O6S2) |
| CI | Cy5 (C32H39CN2O2) |
Table 3.
Positive rates of 4 genes for both extraction kits.
| BIGFISH | BIOER | |
|---|---|---|
| CI Gene | 29/ 30 | 30/ 30 |
| E Gene | 29/ 30 | 22/30 |
| N Gene | 30/30 | 27/30 |
| Rdrp Gene | 30/30 | 26/30 |
| Positive rate | 29/30 (96.67%) | 26/30 (86,67%) |
| Negative rate | 0/30 (0%) | 2/30 (6,67%) |
| Invalids | 1/30 (3,33%) | 2/ 30 (6,67%) |
Table 4.
Means CV values for CT (viral genes)/ CT (internal control) Ratios of different genes in tested samples.
Table 4.
Means CV values for CT (viral genes)/ CT (internal control) Ratios of different genes in tested samples.
| CT (gène E) /CT(CI) Ratio | CT (gène N) /CT(CI) Ratio | CT (gène Rdrp) /CT(CI) Ratio | ||||
|---|---|---|---|---|---|---|
| Mean | CV | Mean | CV | Mean | CV | |
| Sample 1 | 0,944 | 0,034 | 0,826 | 0,041 | 0,888 | 0,025 |
| Sample 2 | 0,918 | 0,030 | 0,800 | 0,061 | 0,871 | 0,030 |
| Sample 3 | 0,865 | 0,028 | 0,762 | 0,052 | 0,833 | 0,029 |
| Sample 4 | 0,696 | 0,044 | 0,640 | 0,076 | 0,684 | 0,065 |
| Sample 5 | 1,055 | 0,019 | 0,928 | 0,041 | 0,985 | 0,043 |
Table 5.
ANOVA test results for different pool strategy.
| P-Value | ||||
| Compared Pool strategies | CI | E | N | Rdrp |
| P100 - P10 | 1.000 | 0.1394 | 0.2336 | 0.2166 |
| P1000 - P10 | 0.892 | <0.001 *** | <0.001 *** | 0.0014 ** |
| P10000 - P10 | 0.868 | <0.001 *** | <0.001 *** | <0.001 *** |
| P5 - P10 | 0.919 | 0.9685 | 0.8474 | 0.8971 |
| Pure - P10 | 0.679 | 0.0911 | 0.0450 * | 0.0825 |
| P1000 - P100 | 0.957 | 0.0911 | 0.1524 | 0.2194 |
| P10000 - P100 | 0.943 | <0.001 *** | <0.001 *** | <0.001 *** |
| P5 - P100 | 0.972 | 0.0279 * | 0.0218 * | 0.0275 * |
| Pure - P100 | 0.805 | <0.001 *** | <0.001 *** | <0.001 *** |
| P10000 - P1000 | 1.000 | 0.1504 | 0.1546 | 0.0420 * |
| P5 - P1000 | 1.000 | <0.001 *** | <0.001 *** | <0.001 *** |
| Pure - P1000 | 0.998 | <0.001 *** | <0.001 *** | <0.001 *** |
| P5 - P10000 | 1.000 | <0.001 *** | <0.001 *** | <0.001 *** |
| Pure - P10000 | 0.999 | <0.001 *** | <0.001 *** | <0.001 *** |
| Pure - P5 | 0.996 | 0.3546 | 0.3861 | 0.4707 |
Table 6.
Simulation of economic viability of different pooling strategies.
| Prevalence % | Pool of 3 samples | Pool of 4 samples | Pool of 5 samples | Pool of 10 samples | ||||
|---|---|---|---|---|---|---|---|---|
| Number of PCR tests | Economy | Number of PCR tests | Economy | Number of PCR tests | Economy | Number of PCR tests | Economy | |
| 0,1 | 350 | 65% | 260 | 74% | 210 | 79% | 120 | 88% |
| 0,2 | 350 | 65% | 270 | 73% | 220 | 78% | 130 | 87% |
| 0,5 | 360 | 64% | 280 | 72% | 230 | 77% | 160 | 84% |
| 1 | 370 | 63% | 300 | 70% | 260 | 74% | 200 | 80% |
| 2 | 400 | 60% | 330 | 67% | 300 | 70% | 280 | 72% |
| 5 | 480 | 52% | 430 | 57% | 420 | 58% | 490 | 51% |
| 8 | 550 | 45% | 530 | 47% | 530 | 47% | 640 | 36% |
| 10 | 600 | 40% | 580 | 42% | 590 | 41% | 720 | 28% |
| 15 | 710 | 29% | 710 | 29% | 730 | 27% | 860 | 14% |
| 20 | 800 | 20% | 810 | 19% | 840 | 16% | 950 | 5% |
Disclaimer/Publisher’s Note: The statements, opinions and data contained in all publications are solely those of the individual author(s) and contributor(s) and not of MDPI and/or the editor(s). MDPI and/or the editor(s) disclaim responsibility for any injury to people or property resulting from any ideas, methods, instructions or products referred to in the content. |
© 2025 by the authors. Licensee MDPI, Basel, Switzerland. This article is an open access article distributed under the terms and conditions of the Creative Commons Attribution (CC BY) license (http://creativecommons.org/licenses/by/4.0/).
Copyright: This open access article is published under a Creative Commons CC BY 4.0 license, which permit the free download, distribution, and reuse, provided that the author and preprint are cited in any reuse.


