

Submitted:
12 December 2025
Posted:
15 December 2025
You are already at the latest version
Abstract
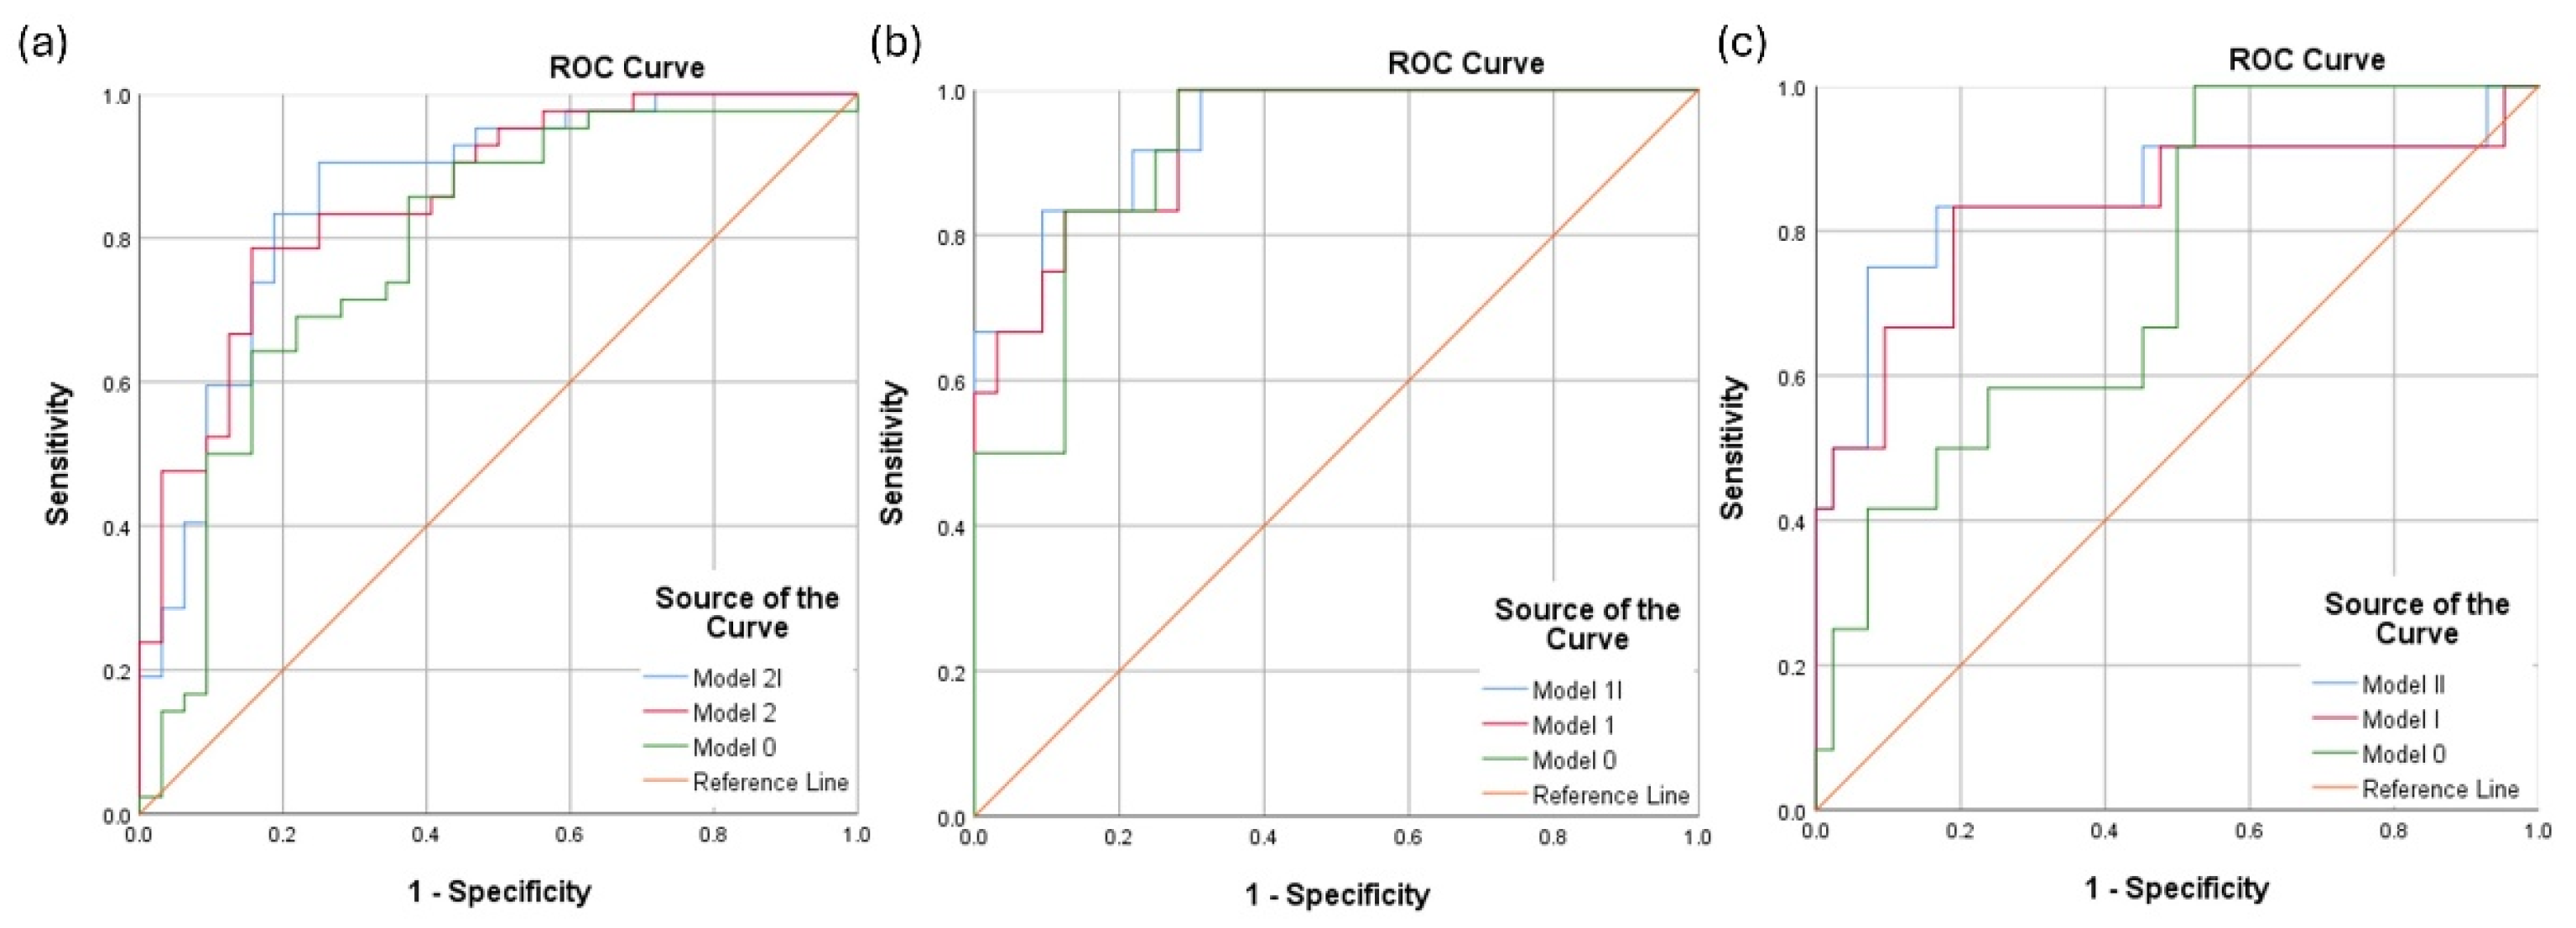
OBJECTIVES: To evaluate the diagnostic performance of Spectralis optical coherence tomography (OCT) parameters for mild cognitive impairment (MCI) and mild dementia in an Asian population from Taiwan. METHODS: This retrospective cross-sectional study evaluated 43 patients with MCI (mean deviation [MD]: −5.05 ± 4.25 dB), 13 patients with mild dementia (MD: −9.03 ± 6.66 dB), and 32 healthy controls (MD: −2.50 ± 2.12 dB). The diagnostic sensitivity in identifying individuals with cognitive impairment of the Spectralis OCT parameters—such as those of the optic nerve head and macula—was compared across these groups. The area under the receiver operating characteristic curve (AUC) for each parameter was calculated to assess its sensitivity in differentiating between healthy eyes and those of individuals with MCI or mild dementia. RESULTS: Among the parameters evaluated, the Bruch’s membrane opening minimum rim width (BMO-MRW) nasal inferior region (ACU = 0.720) was the optimal parameter for distinguishing individuals with MCI from healthy controls. However, the highest AUC of 0.861 was achieved through a combination of five parameters. In distinguishing individuals with mild dementia from healthy controls, the BMO-MRW temporal superior region (ACU = 0.764) was the optimal parameter, with an AUC of 0.940 after adjusting for age and MD. Moreover, the condition of the macular nerve fiber layer outer inferior parameter moderately predicted disease progression (AUC = 0.713). CONCLUSIONS: Our real-world data demonstrate that Spectralis OCT measurements can detect MCI and mild dementia and predict disease progression.
Keywords:
1. Introduction
2. Materials and Methods
2.1. Study Design
2.2. Spectralis OCT Imaging
2.3. Statistical Analysis
3. Results
3.1. Demographic and Clinical Data

| Subtypes | Parameters included | AUC (95% CI) |
|---|---|---|
| MCI vs Normal |
Model 2I: Age, PSD, MD, MRW (Nasal inferior), PPAA (RAT_16) | 0.861 (0.773, 0.949) |
| Model 2: Age, PSD, MRW (Nasal inferior), PPAA (RAT_16) | 0.856 (0.771, 0.941) | |
| Model 0: Age, Refraction, PSD, MD | 0.785 (0.675, 0.895) | |
| Mild dementia vs Normal |
Model 1I: Age, MD, MRW (Temporal superior) | 0.940 (0.870, 1.000) |
| Model 1: Age, MD, MRW (Temporal superior), PPAA (RAT_41) | 0.932 (0.858, 1.000) | |
| Model 0: Age, Refraction, PSD, MD | 0.914 (0.832, 0.997) | |
| MCI vs Mild dementia | Model II: Age, Refraction, MD, Hypertension, GCL (Inner nasal), RETINA (Outer temporal) | 0.851 (0.696, 1.000) |
| Model I: Age, MD, Hypertension, GCL (Inner nasal), RETINA (Outer temporal) | 0.831 (0.671, 0.992) | |
| Model 0: Age, Refraction, PSD, MD | 0.744 (0.597, 0.891) |
| Features | With progression (n = 12) |
Without progression (n = 39) |
|
|---|---|---|---|
| mean ± SD | mean ± SD | P | |
| Age (years) | 74.42 ± 5.93 | 75.92 ± 4.84 | 0.217 |
| Sex (male : female) | 4 : 8 | 22 : 17 | 0.087 |
| Hypertension, No. (%) | 50.00% | 58.97% | 0.303 |
| Diabetes mellitus, No. (%) | 66.67% | 28.21% | 0.014 |
| Education (years) | 5.58 ± 3.68 | 6.79 ± 4.12 | 0.172 |
| MMSE | 13.38 ± 2.97 | 19.40 ± 5.50 | 0.001 |
| CDR | 1.33 ± 0.49 | 0.55 ± 0.15 | < 0.001 |
| Disease progress, No. (%) | 100% | 0% | < 0.001 |
| Refraction (D) | 0.02 ± 1.27 | 0.26 ± 1.52 | 0.298 |
| IOP | 13.79 ± 3.47 | 13.24 ± 3.84 | 0.321 |
| Axial length | 23.53 ± 1.58 | 23.62 ± 0.95 | 0.423 |
| ACD | 3.33 ± 0.88 | 3.45 ± 0.95 | 0.343 |
| WTW | 11.48 ± 0.37 | 11.49 ± 0.79 | 0.467 |
| MD (dB) | -8.63 ± 6.88 | -5.55 ± 4.38 | 0.084 |
| PSD (dB) | 5.49 ± 2.04 | 4.40 ± 2.19 | 0.066 |
| Scan | Best parameter | Thickness (µm) (mean ± SD) |
P* | AUC (95% CI) |
Sensitivity at 95% specificity (%) | Sensitivity at 80% specificity (%) | |
|---|---|---|---|---|---|---|---|
| With progression | Without progression | ||||||
| RNFL | Temporal-superior (TS) | 140.71 ± 14.98 | 133.24 ± 21.15 | 0.093 | 0.641 (0.476, 0.806) | 10.3 | 20.5 |
| BMO-MRW | Nasal (N) | 272.13 ± 49.31 | 280.97 ± 51.74 | 0.299 | 0.573 (0.389, 0.756) | 0.0 | 16.7 |
| ETDRS | |||||||
| RETINA | Inner inferior (I1) | 323.50 ± 34.42 | 328.90 ± 23.90 | 0.310 | 0.670 (0.468, 0.871) | 8.3 | 8.3 |
| NFL | Outer inferior (I2) | 26.04 ± 13.37 | 38.35 ± 6.42 | 0.447 | 0.713 (0.521, 0.904) | 8.3 | 33.3 |
| GCL | Outer inferior (I2) | 33.04 ± 6.74 | 30.41 ± 5.51 | 0.118 | 0.653 (0.433, 0.872) | 2.6 | 2.6 |
| IPL | Outer inferior (I2) | 27.38 ± 4.75 | 25.64 ± 4.84 | 0.142 | 0.641 (0.427, 0.855) | 2.6 | 2.6 |
| PPAA | RAT_23 | 0.261 ± 0.02 | 0.254 ± 0.02 | 0.136 | 0.628 (0.438, 0.818) | 5.1 | 2.6 |
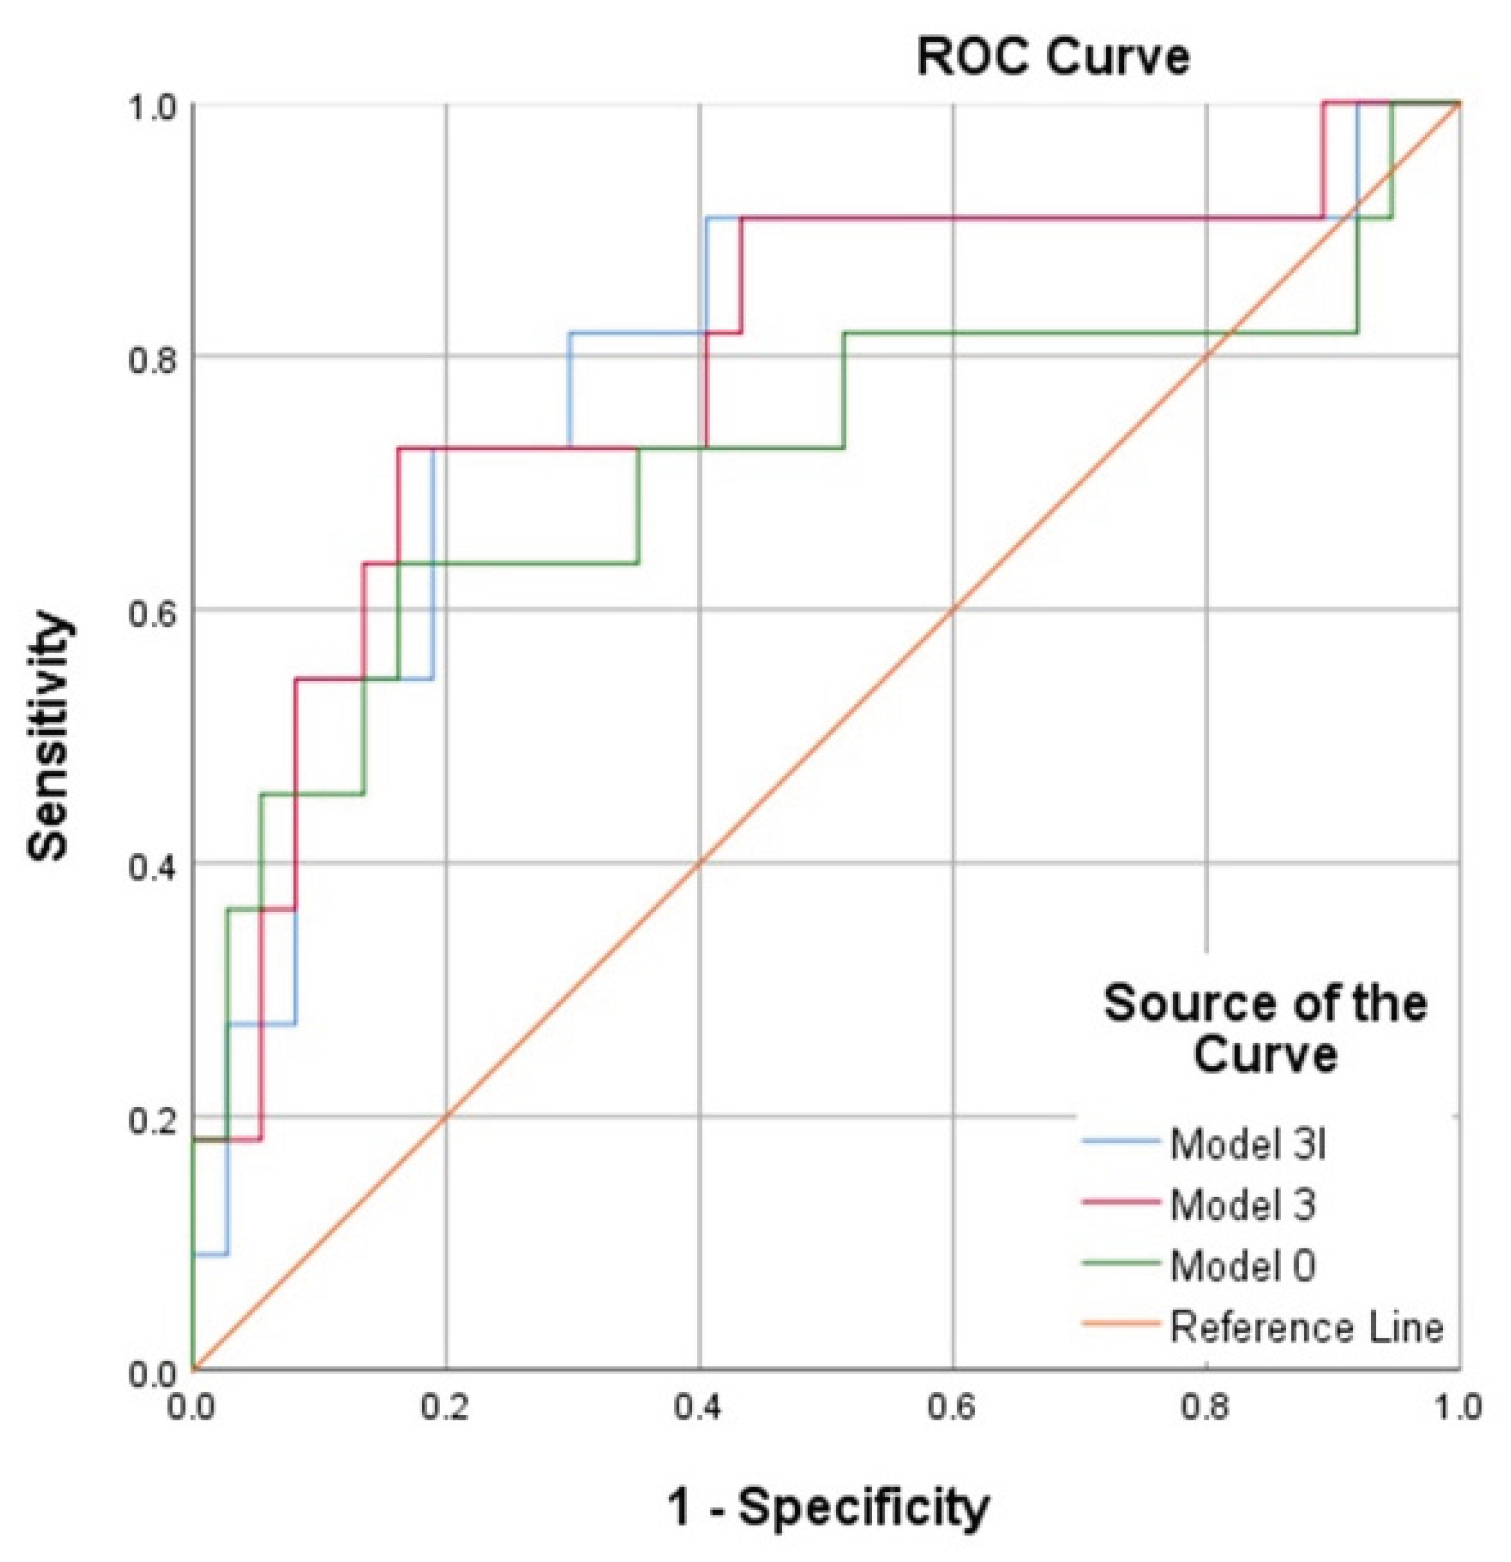
| Parameters included | AUC (95% CI) |
|---|---|
| Model 3I: Age, Refraction, MD, Hypertension, Diabetes mellitus | 0.791 (0.624, 0.958) |
| Model 3: Age, PSD, MD, Diabetes mellitus, NFL (Outer inferior), RETINA (Inner inferior) | 0.791 (0.624, 0.958) |
| Model 0: Age, Refraction, PSD, MD | 0.715 (0.505, 0.925) |
4. Discussion
5. Conclusions
Supplementary Materials
Author Contributions
Funding
Institutional Review Board Statement
Informed Consent Statement
Data Availability Statement
Acknowledgments
Conflicts of Interest
References
- Patnode, CD; Perdue, LA; Rossom, RC; Rushkin, MC; Redmond, N; Thomas, RG; Lin, JS. Screening for Cognitive Impairment in Older Adults: Updated Evidence Report and Systematic Review for the US Preventive Services Task Force. JAMA 2020, 323, 764–785. [Google Scholar] [CrossRef]
- Janelidze, S; Mattsson, N; Palmqvist, S; Smith, R; Beach, TG; Serrano, GE; Chai, X; Proctor, NK; Eichenlaub, U; Zetterberg, H. Plasma P-tau181 in Alzheimer’s disease: relationship to other biomarkers, differential diagnosis, neuropathology and longitudinal progression to Alzheimer’s dementia. Nature medicine 2020, 26, 379–386. [Google Scholar] [CrossRef] [PubMed]
- Hampel, H; Hardy, J; Blennow, K; Chen, C; Perry, G; Kim, SH; Villemagne, VL; Aisen, P; Vendruscolo, M; Iwatsubo, T. The amyloid-β pathway in Alzheimer’s disease. Molecular psychiatry 2021, 26, 5481–5503. [Google Scholar] [CrossRef] [PubMed]
- Langa, KM; Levine, DA. The diagnosis and management of mild cognitive impairment: a clinical review. Jama 2014, 312, 2551–2561. [Google Scholar] [CrossRef]
- Holtzman, DM; Morris, JC; Goate, AM. Alzheimer’s disease: the challenge of the second century. Science translational medicine 2011, 3, 77sr71–77sr71. [Google Scholar] [CrossRef] [PubMed]
- Kasper, S; Bancher, C; Eckert, A; Förstl, H; Frölich, L; Hort, J; Korczyn, AD; Kressig, RW; Levin, O; Palomo, MSM. Management of mild cognitive impairment (MCI): the need for national and international guidelines. The World Journal of Biological Psychiatry 2020, 21, 579–594. [Google Scholar] [CrossRef]
- Albert, MS; DeKosky, ST; Dickson, D; Dubois, B; Feldman, HH; Fox, NC; Gamst, A; Holtzman, DM; Jagust, WJ; Petersen, RC. The diagnosis of mild cognitive impairment due to Alzheimer’s disease: recommendations from the National Institute on Aging-Alzheimer’s Association workgroups on diagnostic guidelines for Alzheimer’s disease. Alzheimer’s & dementia 2011, 7, 270–279. [Google Scholar]
- Sachdev, PS; Blacker, D; Blazer, DG; Ganguli, M; Jeste, DV; Paulsen, JS; Petersen, RC. Classifying neurocognitive disorders: the DSM-5 approach. Nature Reviews Neurology 2014, 10, 634–642. [Google Scholar] [CrossRef]
- Armstrong, RA. Alzheimer’s disease and the eye. Journal of Optometry 2009, 2, 103–111. [Google Scholar] [CrossRef]
- Hinton, DR; Sadun, AA; Blanks, JC; Miller, CA. Optic-nerve degeneration in Alzheimer’s disease. New England Journal of Medicine 1986, 315, 485–487. [Google Scholar] [CrossRef]
- Chan, VTT; Sun, Z; Tang, S; Chen, LJ; Wong, A; Tham, CC; Wong, TY; Chen, C; Ikram, MK; Whitson, HE; Lad, EM; Mok, VCT; Cheung, CY. Spectral-Domain OCT Measurements in Alzheimer’s Disease: A Systematic Review and Meta-analysis. Ophthalmology 2019, 126, 497–510. [Google Scholar] [CrossRef]
- Katzman, R; Zhang, MY; Ouang Ya, Q; Wang, ZY; Liu, WT; Yu, E; Wong, SC; Salmon, DP; Grant, I. A Chinese version of the Mini-Mental State Examination; impact of illiteracy in a Shanghai dementia survey. J Clin Epidemiol. 1988, 41, 971–978. [Google Scholar] [CrossRef]
- Wu, C-W; Chen, H-Y; Chen, J-Y; Lee, C-H. Glaucoma detection using support vector machine method based on spectralis OCT. Diagnostics 2022, 12, 391. [Google Scholar] [CrossRef]
- Li, A; Thompson, AC; Asrani, S. Impact of Artifacts From Optical Coherence Tomography Retinal Nerve Fiber Layer and Macula Scans on Detection of Glaucoma Progression. Am J Ophthalmol. 2021, 221, 235–245. [Google Scholar] [CrossRef]
- Yankner, BA. Mechanisms of neuronal degeneration in Alzheimer’s disease. Neuron 1996, 16, 921–932. [Google Scholar] [CrossRef]
- Zabel, P; Kałużny, JJ; Wiłkość-Dębczyńska, M; Gębska-Tołoczko, M; Suwała, K; Kucharski, R; Araszkiewicz, A. Peripapillary Retinal Nerve Fiber Layer Thickness in Patients with Alzheimer’s Disease: A Comparison of Eyes of Patients with Alzheimer’s Disease, Primary Open-Angle Glaucoma, and Preperimetric Glaucoma and Healthy Controls. Med Sci Monit. 2019, 25, 1001–1008. [Google Scholar] [CrossRef]
- Ascaso, FJ; Cruz, N; Modrego, PJ; Lopez-Anton, R; Santabárbara, J; Pascual, LF; Lobo, A; Cristóbal, JA. Retinal alterations in mild cognitive impairment and Alzheimer’s disease: an optical coherence tomography study. J Neurol. 2014, 261, 1522–1530. [Google Scholar] [CrossRef]
- Jiang, H; Liu, Y; Wei, Y; Shi, Y; Wright, CB; Sun, X; Rundek, T; Baumel, BS; Landman, J; Wang, J. Impaired retinal microcirculation in patients with Alzheimer’s disease. PLoS One 2018, 13, e0192154. [Google Scholar] [CrossRef] [PubMed]
- Jiang, H; Wei, Y; Shi, Y; Wright, CB; Sun, X; Gregori, G; Zheng, F; Vanner, EA; Lam, BL; Rundek, T; Wang, J. Altered Macular Microvasculature in Mild Cognitive Impairment and Alzheimer Disease. J Neuroophthalmol. 2018, 38, 292–298. [Google Scholar] [CrossRef] [PubMed]
- Li, C; Zhu, X; Yang, K; Ju, Y; Shi, K; Xiao, Y; Su, B; Lu, F; Cui, L; Li, M. Relationship of retinal capillary plexus and ganglion cell complex with mild cognitive impairment and dementia. Eye (Lond) 2023, 37, 3743–3750. [Google Scholar] [CrossRef] [PubMed]
- Gao, L; Liu, Y; Li, X; Bai, Q; Liu, P. Abnormal retinal nerve fiber layer thickness and macula lutea in patients with mild cognitive impairment and Alzheimer’s disease. Arch Gerontol Geriatr. 2015, 60, 162–167. [Google Scholar] [CrossRef] [PubMed]
- Kirbas, S; Turkyilmaz, K; Anlar, O; Tufekci, A; Durmus, M. Retinal nerve fiber layer thickness in patients with Alzheimer disease. J Neuroophthalmol. 2013, 33, 58–61. [Google Scholar] [CrossRef]
- Mathew, S; WuDunn, D; Mackay, DD; Vosmeier, A; Tallman, EF; Deardorff, R; Harris, A; Farlow, MR; Brosch, JR; Gao, S; Apostolova, LG; Saykin, AJ; Risacher, SL. Association of Brain Volume and Retinal Thickness in the Early Stages of Alzheimer’s Disease. J Alzheimers Dis. 2023, 91, 743–752. [Google Scholar] [CrossRef] [PubMed]
- Casaletto, KB; Ward, ME; Baker, NS; Bettcher, BM; Gelfand, JM; Li, Y; Chen, R; Dutt, S; Miller, B; Kramer, JH; Green, AJ. Retinal thinning is uniquely associated with medial temporal lobe atrophy in neurologically normal older adults. Neurobiol Aging 2017, 51, 141–147. [Google Scholar] [CrossRef]
- Garcia-Martin, E; Bambo, MP; Marques, ML; Satue, M; Otin, S; Larrosa, JM; Polo, V; Pablo, LE. Ganglion cell layer measurements correlate with disease severity in patients with Alzheimer’s disease. Acta Ophthalmol. 2016, 94, e454–459. [Google Scholar] [CrossRef]
- Bayhan, HA; Aslan Bayhan, S; Celikbilek, A; Tanık, N; Gürdal, C. Evaluation of the chorioretinal thickness changes in Alzheimer’s disease using spectral-domain optical coherence tomography. Clin Exp Ophthalmol. 2015, 43, 145–151. [Google Scholar] [CrossRef] [PubMed]
- Polo, V; Garcia-Martin, E; Bambo, MP; Pinilla, J; Larrosa, JM; Satue, M; Otin, S; Pablo, LE. Reliability and validity of Cirrus and Spectralis optical coherence tomography for detecting retinal atrophy in Alzheimer’s disease. Eye (Lond) 2014, 28, 680–690. [Google Scholar] [CrossRef]
- Chan, VT; Sun, Z; Tang, S; Chen, LJ; Wong, A; Tham, CC; Wong, TY; Chen, C; Ikram, MK; Whitson, HE. Spectral-domain OCT measurements in Alzheimer’s disease: a systematic review and meta-analysis. Ophthalmology 2019, 126, 497–510. [Google Scholar] [CrossRef]
- Uzun, S; Pehlivan, E. Spectral-domain optical coherence tomography as a potential biomarker in Huntington’s disease. Mov Disord. 2016, 31, 1762. [Google Scholar] [CrossRef]
- Murueta-Goyena, A; Del Pino, R; Reyero, P; Galdós, M; Arana, B; Lucas-Jiménez, O; Acera, M; Tijero, B; Ibarretxe-Bilbao, N; Ojeda, N; Peña, J; Cortés, J; Gómez-Esteban, JC; Gabilondo, I. Parafoveal thinning of inner retina is associated with visual dysfunction in Lewy body diseases. Mov Disord. 2019, 34, 1315–1324. [Google Scholar] [CrossRef]
- Murueta-Goyena, A; Del Pino, R; Galdós, M; Arana, B; Acera, M; Carmona-Abellán, M; Fernández-Valle, T; Tijero, B; Lucas-Jiménez, O; Ojeda, N; Ibarretxe-Bilbao, N; Peña, J; Cortes, J; Ayala, U; Barrenechea, M; Gómez-Esteban, JC; Gabilondo, I. Retinal Thickness Predicts the Risk of Cognitive Decline in Parkinson Disease. Ann Neurol. 2021, 89, 165–176. [Google Scholar] [CrossRef]
- Kim, BJ; Irwin, DJ; Song, D; Daniel, E; Leveque, JD; Raquib, AR; Pan, W; Ying, GS; Aleman, TS; Dunaief, JL; Grossman, M. Optical coherence tomography identifies outer retina thinning in frontotemporal degeneration. Neurology 2017, 89, 1604–1611. [Google Scholar] [CrossRef] [PubMed]
- Parisi, V; Pierelli, F; Coppola, G; Restuccia, R; Ferrazzoli, D; Scassa, C; Bianco, F; Parisi, L; Fattapposta, F. Reduction of optic nerve fiber layer thickness in CADASIL. Eur J Neurol. 2007, 14, 627–631. [Google Scholar] [CrossRef] [PubMed]
- Alten, F; Motte, J; Ewering, C; Osada, N; Clemens, CR; Kadas, EM; Eter, N; Paul, F; Marziniak, M. Multimodal retinal vessel analysis in CADASIL patients. PLoS One 2014, 9, e112311. [Google Scholar] [CrossRef]
- Szegedi, S; Dal-Bianco, P; Stögmann, E; Traub-Weidinger, T; Rainer, M; Masching, A; Schmidl, D; Werkmeister, RM; Chua, J; Schmetterer, L; Garhöfer, G. Anatomical and functional changes in the retina in patients with Alzheimer’s disease and mild cognitive impairment. Acta Ophthalmol. 2020, 98, e914–e921. [Google Scholar] [CrossRef]
- Shin, JY; Choi, EY; Kim, M; Lee, HK; Byeon, SH. Changes in retinal microvasculature and retinal layer thickness in association with apolipoprotein E genotype in Alzheimer’s disease. Sci Rep. 2021, 11, 1847. [Google Scholar] [CrossRef]
- Armstrong, GW; Kim, LA; Vingopoulos, F; Park, JY; Garg, I; Kasetty, M; Silverman, RF; Zeng, R; Douglas, VP; Lopera, F; Baena, A; Giraldo, M; Norton, D; Cronin-Golomb, A; Arboleda-Velasquez, JF; Quiroz, YT; Miller, JB. Retinal Imaging Findings in Carriers With PSEN1-Associated Early-Onset Familial Alzheimer Disease Before Onset of Cognitive Symptoms. JAMA Ophthalmol. 2021, 139, 49–56. [Google Scholar] [CrossRef] [PubMed]
- Cheung, CY; Ong, YT; Hilal, S; Ikram, MK; Low, S; Ong, YL; Venketasubramanian, N; Yap, P; Seow, D; Chen, CL; Wong, TY. Retinal ganglion cell analysis using high-definition optical coherence tomography in patients with mild cognitive impairment and Alzheimer’s disease. J Alzheimers Dis. 2015, 45, 45–56. [Google Scholar] [CrossRef]
- Ito, Y; Sasaki, M; Takahashi, H; Nozaki, S; Matsuguma, S; Motomura, K; Ui, R; Shikimoto, R; Kawasaki, R; Yuki, K; Sawada, N; Mimura, M; Tsubota, K; Tsugane, S. Quantitative Assessment of the Retina Using OCT and Associations with Cognitive Function. Ophthalmology 2020, 127, 107–118. [Google Scholar] [CrossRef]
- Kesler, A; Vakhapova, V; Korczyn, AD; Naftaliev, E; Neudorfer, M. Retinal thickness in patients with mild cognitive impairment and Alzheimer’s disease. Clin Neurol Neurosurg. 2011, 113, 523–526. [Google Scholar] [CrossRef]
- Shen, Y; Liu, L; Cheng, Y; Feng, W; Shi, Z; Zhu, Y; Wu, W; Li, C. Retinal nerve fiber layer thickness is associated with episodic memory deficit in mild cognitive impairment patients. Current Alzheimer Research 2014, 11, 259–266. [Google Scholar] [CrossRef]
- Mejia-Vergara, AJ; Restrepo-Jimenez, P; Pelak, VS. Optical Coherence Tomography in Mild Cognitive Impairment: A Systematic Review and Meta-Analysis. Front Neurol. 2020, 11, 578698. [Google Scholar] [CrossRef]
- Wu, C-W; Chang, Y-C; Chen, H-Y. Early detection of primary open angle, angle closure, and normal tension glaucoma in an Asian population using optical coherence tomography. Journal of Glaucoma 2023, 32, 195–203. [Google Scholar] [CrossRef]
- Liu, D; Zhang, L; Li, Z; Zhang, X; Wu, Y; Yang, H; Min, B; Zhang, X; Ma, D; Lu, Y. Thinner changes of the retinal nerve fiber layer in patients with mild cognitive impairment and Alzheimer’s disease. BMC Neurol. 2015, 15, 14. [Google Scholar] [CrossRef] [PubMed]
- Sánchez, D; Castilla-Marti, M; Rodríguez-Gómez, O; Valero, S; Piferrer, A; Martínez, G; Martínez, J; Serra, J; Moreno-Grau, S; Hernández-Olasagarre, B; De Rojas, I; Hernández, I; Abdelnour, C; Rosende-Roca, M; Vargas, L; Mauleón, A; Santos-Santos, MA; Alegret, M; Ortega, G; Espinosa, A; Pérez-Cordón, A; Sanabria, Á; Ciudin, A; Simó, R; Hernández, C; Villoslada, P; Ruiz, A; Tàrraga, L; Boada, M. Usefulness of peripapillary nerve fiber layer thickness assessed by optical coherence tomography as a biomarker for Alzheimer’s disease. Sci Rep. 2018, 8, 16345. [Google Scholar] [CrossRef] [PubMed]
- Oktem, EO; Derle, E; Kibaroglu, S; Oktem, C; Akkoyun, I; Can, U. The relationship between the degree of cognitive impairment and retinal nerve fiber layer thickness. Neurol Sci. 2015, 36, 1141–1146. [Google Scholar] [CrossRef] [PubMed]
- Choi, SH; Park, SJ; Kim, NR. Macular Ganglion Cell -Inner Plexiform Layer Thickness Is Associated with Clinical Progression in Mild Cognitive Impairment and Alzheimers Disease. PLoS One 2016, 11, e0162202. [Google Scholar] [CrossRef]
- Cunha, JP; Proença, R; Dias-Santos, A; Almeida, R; Águas, H; Alves, M; Papoila, AL; Louro, C; Castanheira-Dinis, A. OCT in Alzheimer’s disease: thinning of the RNFL and superior hemiretina. Graefes Arch Clin Exp Ophthalmol. 2017, 255, 1827–1835. [Google Scholar] [CrossRef]
- Berisha, F; Feke, GT; Trempe, CL; McMeel, JW; Schepens, CL. Retinal abnormalities in early Alzheimer’s disease. Invest Ophthalmol Vis Sci. 2007, 48, 2285–2289. [Google Scholar] [CrossRef]
- Polo, V; Rodrigo, MJ; Garcia-Martin, E; Otin, S; Larrosa, JM; Fuertes, MI; Bambo, MP; Pablo, LE; Satue, M. Visual dysfunction and its correlation with retinal changes in patients with Alzheimer’s disease. Eye (Lond) 2017, 31, 1034–1041. [Google Scholar] [CrossRef]
- Asrani, S; Rosdahl, JA; Allingham, RR. Novel software strategy for glaucoma diagnosis: asymmetry analysis of retinal thickness. Archives of ophthalmology 2011, 129, 1205–1211. [Google Scholar] [CrossRef]
- Larrosa, JM; Garcia-Martin, E; Bambo, MP; Pinilla, J; Polo, V; Otin, S; Satue, M; Herrero, R; Pablo, LE. Potential new diagnostic tool for Alzheimer’s disease using a linear discriminant function for Fourier domain optical coherence tomography. Invest Ophthalmol Vis Sci. 2014, 55, 3043–3051. [Google Scholar] [CrossRef]
- Chua, J; Li, C; Ho, LKH; Wong, D; Tan, B; Yao, X; Gan, A; Schwarzhans, F; Garhöfer, G; Sng, CCA; Hilal, S; Venketasubramanian, N; Cheung, CY; Fischer, G; Vass, C; Wong, TY; Chen, CL; Schmetterer, L. A multi-regression framework to improve diagnostic ability of optical coherence tomography retinal biomarkers to discriminate mild cognitive impairment and Alzheimer’s disease. Alzheimers Res Ther. 2022, 14, 41. [Google Scholar] [CrossRef]
- Mutlu, U; Colijn, JM; Ikram, MA; Bonnemaijer, PWM; Licher, S; Wolters, FJ; Tiemeier, H; Koudstaal, PJ; Klaver, CCW; Ikram, MK. Association of Retinal Neurodegeneration on Optical Coherence Tomography With Dementia: A Population-Based Study. JAMA Neurol. 2018, 75, 1256–1263. [Google Scholar] [CrossRef]
- Kivipelto, M; Ngandu, T; Laatikainen, T; Winblad, B; Soininen, H; Tuomilehto, J. Risk score for the prediction of dementia risk in 20 years among middle aged people: a longitudinal, population-based study. The Lancet Neurology 2006, 5, 735–741. [Google Scholar] [CrossRef]
- Leibson, CL; Rocca, WA; Hanson, V; Cha, R; Kokmen, E; O’brien, P; Palumbo, P. Risk of dementia among persons with diabetes mellitus: a population-based cohort study. American journal of epidemiology 1997, 145, 301–308. [Google Scholar] [CrossRef] [PubMed]
- Marquié, M; Castilla-Martí, M; Valero, S; Martínez, J; Sánchez, D; Hernández, I; Rosende-Roca, M; Vargas, L; Mauleón, A; Rodríguez-Gómez, O; Abdelnour, C; Gil, S; Santos-Santos, MA; Alegret, M; Espinosa, A; Ortega, G; Pérez-Cordón, A; Sanabria, Á; Roberto, N; Moreno-Grau, S; de Rojas, I; Simó, R; Ciudin, A; Hernández, C; Orellana, A; Monté-Rubio, G; Benaque, A; Ruiz, A; Tárraga, L; Boada, M. Visual impairment in aging and cognitive decline: experience in a Memory Clinic. Sci Rep. 2019, 9, 8698. [Google Scholar] [CrossRef] [PubMed]
- Leung, CK-S; Mohamed, S; Leung, KS; Cheung, CY-L; Chan, SL-w; Cheng, DK-y; Lee, AK-c; Leung, GY-o; Rao, SK; Lam, DSC. Retinal nerve fiber layer measurements in myopia: an optical coherence tomography study. Investigative ophthalmology & visual science 2006, 47, 5171–5176. [Google Scholar]
- Lee, SH; Lee, WH; Lim, HB; Jo, YJ; Kim, JY. Thicknesses of central macular, retinal nerve fiber, and ganglion cell inner plexiform layers in patients with hypertension. Retina 2019, 39, 1810–1818. [Google Scholar] [CrossRef] [PubMed]
- Oshitari, T; Hanawa, K; Adachi-Usami, E. Changes of macular and RNFL thicknesses measured by Stratus OCT in patients with early stage diabetes. Eye 2009, 23, 884–889. [Google Scholar] [CrossRef]
- Parikh, RS; Parikh, SR; Sekhar, GC; Prabakaran, S; Babu, JG; Thomas, R. Normal age-related decay of retinal nerve fiber layer thickness. Ophthalmology 2007, 114, 921–926. [Google Scholar] [CrossRef]
- Gardiner, SK; Ren, R; Yang, H; Fortune, B; Burgoyne, CF; Demirel, S. A method to estimate the amount of neuroretinal rim tissue in glaucoma: comparison with current methods for measuring rim area. American journal of ophthalmology 2014, 157, 540–549. e542. [Google Scholar] [CrossRef]
- Chauhan, BC; Burgoyne, CF. From clinical examination of the optic disc to clinical assessment of the optic nerve head: a paradigm change. American journal of ophthalmology 2013, 156, 218–227. e212. [Google Scholar] [CrossRef] [PubMed]
- Chauhan, BC; Danthurebandara, VM; Sharpe, GP; Demirel, S; Girkin, CA; Mardin, CY; Scheuerle, AF; Burgoyne, CF. Bruch’s membrane opening minimum rim width and retinal nerve fiber layer thickness in a normal white population: a multicenter study. Ophthalmology 2015, 122, 1786–1794. [Google Scholar] [CrossRef] [PubMed]
- Tian, J; Varga, B; Tatrai, E; Fanni, P; Somfai, GM; Smiddy, WE; Debuc, DC. Performance evaluation of automated segmentation software on optical coherence tomography volume data. Journal of biophotonics 2016, 9, 478–489. [Google Scholar] [CrossRef]
- Pazos, M; Dyrda, AA; Biarnés, M; Gómez, A; Martín, C; Mora, C; Fatti, G; Antón, A. Diagnostic accuracy of spectralis SD OCT automated macular layers segmentation to discriminate normal from early glaucomatous eyes. Ophthalmology 2017, 124, 1218–1228. [Google Scholar] [CrossRef]
| Features | Healthy Controls (n = 32) |
MCI (n = 43) |
Mild Dementia (n = 13) |
|
|---|---|---|---|---|
| mean ± SD | mean ± SD | mean ± SD | P | |
| Age (years) | 71.00 ± 4.49 | 74.56 ± 4.94 | 76.92 ± 6.34 | 0.003 |
| Sex (male : female) |
13 : 19 | 27 : 16 | 3 : 10 | 0.021 |
| Hypertension, No. (%) |
34.4% | 43.00% | 72.92% | 0.034 |
| Diabetes mellitus, No. (%) |
31.3% | 43.00% | 53.85% | 0.355 |
| MMSE (*AD-8) | (*) | 18.85 ± 5.78 | 16.29 ± 5.06 | 0.112+ |
| Refraction (D) | -0.10 ± 2.43 | 0.31 ± 1.64 | -0.41 ± 1.18 | 0.405 |
| IOP | 12.21 ± 4.21 | 13.02 ± 3.53 | 14.12 ± 4.06 | 0.322 |
| Axial length | 23.59 ± 1.21 | 23.68 ± 1.14 | 23.45 ± 0.71 | 0.773 |
| ACD | 3.28 ± 0.88 | 3.28 ± 0.82 | 3.72 ± 1.07 | 0.258 |
| WTW | 11.59 ± 0.46 | 11.51 ± 0.75 | 11.53 ± 0.44 | 0.891 |
| MD (dB) | -2.50 ± 2.12 | -5.05 ± 4.25 | -9.03 ± 6.66 | < 0.001 |
| PSD (dB) | 2.69 ± 1.49 | 4.19 ± 2.04 | 5.54 ± 2.36 | < 0.001 |
| MCI vs. Health controls | |||||||
|---|---|---|---|---|---|---|---|
| Scan | Best parameter | Thickness (µm) (mean ± SD) |
P* | AUC (95% CI) |
Sensitivity at 95% specificity (%) | Sensitivity at 80% specificity (%) | |
| RNFL | Nasal-superior (NS) | 124.01 ± 20.19 | 116.95 ± 22.78 | 0.289 | 0.603 (0.469, 0.736) | 9.4 | 18.8 |
| BMO-MRW | Nasal-inferior (NI) | 309.28 ± 58.39 | 354.19 ± 54.93 | 0.086 | 0.720 (0.604, 0.836) | 2.3 | 7.0 |
| ETDRS | |||||||
| RETINA | Outer inferior (I2) | 275.70 ± 16.32 | 279.19 ± 17.73 | 0.154 | 0.606 (0.427, 0.711) | 2.3 | 14.0 |
| NFL | Inner nasal (N1) | 24.70 ± 13.42 | 20.21 ± 2.46 | 0.272 | 0.610 (0.483, 0.738) | 0.0 | 3.1 |
| GCL | Central (C) | 17.38 ± 9.58 | 14.53 ± 5.46 | 0.050 | 0.585 (0.454, 0.716) | 0.0 | 12.5 |
| IPL | Outer inferior (I2) | 26.09 ± 4.84 | 26.79 ± 3.97 | 0.214 | 0.584 (0.451, 0.716) | 2.3 | 11.6 |
| PPAA | RAT_16 | 0.274 ± 0.02 | 0.285 ± 0.02 | 0.014 | 0.653 (0.525, 0.781) | 2.3 | 4.7 |
| Mild dementia vs. Health controls | |||||||
| RNFL | Temporal (T) | 84.08 ± 39.78 | 75.03 ± 14.24 | 0.317 | 0.659 (0.467, 0.850) | 0.0 | 7.7 |
| BMO-MRW | Temporal-superior (TS) | 246.85 ± 40.02 | 293.06 ± 47.27 | 0.002 | 0.764 (0.623, 0.905) | 0.0 | 0.0 |
| ETDRS | |||||||
| RETINA | Outer inferior (I2) | 274.50 ± 22.68 | 279.19 ± 17.73 | 0.230 | 0.667 (0.494, 0.840) | 15.4 | 23.1 |
| NFL | Outer nasal (N2) | 45.69 ± 12.49 | 18.35 ± 2.81 | 0.455 | 0.597 (0.418, 0.777) | 7.7 | 15.4 |
| GCL | Inner nasal (N1) | 44.65 ± 8.86 | 31.74 ± 4.31 | 0.360 | 0.633 (0.444, 0.832) | 7.7 | 15.4 |
| IPL | Outer inferior (I2) | 25.73 ± 4.02 | 26.79 ± 3.97 | 0.191 | 0.626 (0.438, 0.815) | 0.0 | 15.4 |
| PPAA | RAT_41 | 0.244 ± 0.02 | 0.253 ± 0.02 | 0.223 | 0.708 (0.528, 0.888) | 7.7 | 7.7 |
| Mild dementia vs. MCI | |||||||
| RNFL | Temporal-inferior (TI) | 159.27 ± 23.96 | 142.97 ± 20.92 | 0.020 | 0.695 (0.531, 0.859) | 2.3 | 4.7 |
| BMO-MRW | Temporal (T) | 172.08 ± 23.28 | 189.80 ± 31.98 | 0.019 | 0.659 (0.508, 0.810) | 0.0 | 0.0 |
| ETDRS | |||||||
| RETINA | Outer temporal (T2) | 268.54 ± 19.63 | 278.91 ± 19.77 | 0.056 | 0.707 (0.528, 0.885) | 7.7 | 15.4 |
| NFL | Inner nasal (N1) | 22.35 ± 11.60 | 24.70 ± 13.42 | 0.272 | 0.662 (0.494, 0.830) | 7.7 | 7.7 |
| GCL | Inner nasal (N1) | 44.65 ± 8.86 | 48.36 ± 5.41 | 0.087 | 0.723 (0.532, 0.914) | 7.7 | 15.4 |
| IPL | Inner nasal (N1) | 39.31 ± 8.09 | 40.52 ± 3.51 | 0.304 | 0.697 (0.497, 0.897) | 7.7 | 23.1 |
| PPAA | RAT_52 | 0.273 ± 0.03 | 0.281 ± 0.03 | 0.191 | 0.693 (0.507, 0.880) | 7.7 | 15.4 |
Disclaimer/Publisher’s Note: The statements, opinions and data contained in all publications are solely those of the individual author(s) and contributor(s) and not of MDPI and/or the editor(s). MDPI and/or the editor(s) disclaim responsibility for any injury to people or property resulting from any ideas, methods, instructions or products referred to in the content. |
© 2025 by the authors. Licensee MDPI, Basel, Switzerland. This article is an open access article distributed under the terms and conditions of the Creative Commons Attribution (CC BY) license (http://creativecommons.org/licenses/by/4.0/).


