1. Introduction
Tourism is one of the world’s most dynamic and expanding economic sectors. It has multifaceted impacts across economic, social, and cultural aspects. Before the COVID pandemic, global tourist arrivals reached nearly 1.5 billion in 2019 (OECD, 2020). Improvements in transportation, digitalisation, visa liberalisation, and active global marketing have propelled sustained growth (Buhalis & Law, 2008; Gössling & Hall, 2006).
Beyond its contributions to economic development, tourism promotes mutual understanding, cross-country cultural exchange, and destination branding (Anholt, 2007; Pike, 2016; Telfer & Sharpley, 2015). Especially for emerging economies, tourism catalyses economic diversification and entrepreneurship, which in turn attracts investment in the destination countries (Ashley et al., 2007; Torres, 2002). Leading global tourist destinations such as Thailand, Malaysia, and Vietnam are the standing proof of these tourism-based economic developments (Dwyer et al., 2004; Lim, 1997).
India holds a tally of more than forty UNESCO World Heritage Sites across cultural and natural resources. With this, the substantial infrastructural growth across rail, road and civil aviation enables India to attract tourists globally for experiential and heritage travel (Government of India, 2020; Timothy & Boyd, 2006). However, India’s share of the global tourist market remains poor compared to its regional peers. In 2019, while China, Thailand and Malaysia received 65.7 million, 39.8 million and 26.1 million international tourists respectively, India attracted 10.9 million only (World Tourism Organisation (UNWTO), 2021). This gap signals the need for a deeper understanding of underlying competitiveness and sectoral challenges.
Infrastructure, governance, cultural management, and creative policy frameworks are all intertwined with the growth of tourism (M. C. Hall et al., 2011; Prideaux, 2000). High standard destination quality, institutional capacity, event-based global visibility, and external diseconomies such as global shocks and economic volatility, determine the growth of the tourism sector (Nunkoo & Ramkissoon, 2011; Wut et al., 2021). India launched an international tourism campaign, ‘Incredible India,’ in 2002 through streamlined e-visa programs and strategic mega-events to promote the country's rich history, diverse culture, spirituality, and varied geography. Despite measurable progress, the sector’s vulnerability to external disruptions and persistent regional disparities underscores the need for robust empirical evidence to inform targeted and sustainable destination management strategies (World Tourism Organisation (UNWTO), 2021).
Traditionally, econometric modelling, especially with the panel data method, was widely used to examine tourism demand factors such as income, infrastructure, price, and heritage assets (Crouch, 1994; Song et al., 2010). However, the empirical research on tourism in India is still dispersed and primarily descriptive. The use of sophisticated econometric techniques to capture intersectoral relationships, diminishing returns, and nonlinear behaviour is very much limited. When nonlinear or interaction terms are added, standard econometric models struggle to handle multicollinearity and model complex relationships (Wooldridge, 2010). Modern approaches—including ridge regression and tree-based machine learning—offer potential for greater explanatory power and managerial insight, yet remain largely unexplored within Indian and emerging economy contexts (Hastie et al., 2009; James et al., 2013).
This study addresses these critical empirical and methodological gaps by making use of an interpretable machine learning framework to identify the determinants of foreign tourist arrivals to India and their impact patterns. The study applies XGBoost regression with cooperative game theory-based Shapely Additive Explanation (SHAP) and Accumulated Local Effects (ALE) plots to identify the nonlinear impacts, threshold effects, and complex interactions among the determinants of foreign tourists' arrivals. In this context, the analysis addresses four principal questions:
What are the effects of heritage sites, hotel capacity, and source country income on India’s foreign tourist arrivals?
How do nonlinearities, including diminishing returns and thresholds, shape these relationships?
To what extent do governance and mega-events influence arrivals?
Does interpretable machine learning (XGBoost) enhance explanatory robustness and policy relevance compared to conventional models?
Cross-country comparisons clarify India’s development challenges and opportunities. Effective strategies in Thailand, Malaysia, and Singapore focus on integrated infrastructure, strategic marketing, and supportive governance to enhance tourism quality (M. C. Hall et al., 2011). In contrast, India’s concentration of foreign tourists’ arrivals in a few states and institutional limitations underscore the policy imperative for greater inclusiveness and destination competitiveness (Ministry of Tourism, 2021).
Tourism demand modelling has changed its shape along with the growth of the sector and social change. Early economic studies used basic data analysis to show the tourists' movement and used cross-sectional and time-series econometric methods to explain tourists’ inflow proportionally based on source-country income level and inversely with the higher travelling cost, inflation and unfavourable exchange rates (Crouch, 1994; Lim, 1997; Song & Li, 2008).
Building on this intuition, panel and gravity-type models were increasingly used to explain tourism flows as functions of origin-country income, relative prices between origin and destination, and additional supply-side attributes such as purpose of visit and nationality (Cortés-Jiménez & Blake, 2011). The large-scale availability of panel data, especially in Western developed nations, facilitated the use of fixed and random effects models and to capture the heterogeneity across destinations and time dynamics (Dogan & Zhang, 2023; Song & Li, 2008).
However, these panel-data methods deploy straightforward linear approaches, unless specified exclusively, to capture the simple linear effects of the predictors on the tourists’ inflow. It failed to capture the nonlinear, threshold-driven relationships that characterise tourism demand in complex real-world scenarios. It has been empirically found that visitors' reactions to economic factors such as income growth, infrastructural development and other destination characteristics often show saturation effects and diminishing marginal returns with respect to certain key threshold levels (Guan et al., 2022; Saayman & Botha, 2017; Wu et al., 2022).
Mega-events like international festivals and global sports events certainly provide a temporary surge in international tourist arrivals in the host country. However, its long-term impacts depend on factors such as infrastructure readiness, governance quality, and long-term destination management (Black & Van Der Westhuizen, 2004; Gursoy et al., 2017; Matheson, 2006).
These non-linear and threshold effects can be captured directly by the linear models through polynomial and interaction terms. But this approach faces a severe multicollinearity problem, which eventually leads to unstable coefficient estimates (Wooldridge, 2010). Multicollinearity is particularly problematic in tourism demand modelling, since macro-economic variables such as income, prices, and infrastructure often interact in complex ways (Song et al., 2023; Wasiaturrahma & Rohmawati, 2021).
Tree-based machine learning and penalised regression techniques can stabilise coefficient estimates and enhance out-of-sample prediction. In fact, they have been widely adopted in many economic modelling but remain underutilised in tourism demand studies in emerging economies (Hastie et al., 2009; James et al., 2013). This methodological gap limits the robustness and applicability of many empirical findings.
India is also no exception, with
India is also no exception, as empirical research on tourism demand has focused primarily on classical econometric and time-series approaches. In recent times, Shah et al. (Shah et al., 2022) have used the augmented gravity-based model on a panel fixed-effects setup and shown that the importance of origin-country income, exchange rates, distance, and cultural proximity are shaping inbound tourism. In another state-level panel analysis, a similar set of features, such as infrastructure, accessibility, and amenities, significantly affect foreign tourist arrivals but with greater heterogeneity among the states (Suresh et al., 2015). Time-series and cointegration approaches also reveal both short-run and long-run effects of macroeconomic variables on tourism demand (Devi et al., 2024; Sharma et al., 2023). Using linear model frameworks, these studies provide valuable insights, but none of these works focus on the more complex relationship and threshold values. This indicates both the availability of rich panel data and the methodological opportunities for more robust and flexible modelling of tourism demand for India. In fact, recent research highlights the growing use of artificial intelligence and machine learning methods for predicting tourism inflow and hospitality-sector revenue guidance (Henriques et al., 2024). Recent research also highlights the importance of digital infrastructure and ICT in tourism demand (Gössling, 2021; Xia et al., 2024).
Finally, over the last decade, a growing number of researchers have identified the importance of governance and administrative quality as an important driver of tourism demand. Seminal works by Hall (C. M. Hall, 2011) and Bramwell & Lane (Bramwell & Lane, 2011) mention the importance of collaborative and multi-level governance in developing the resilient tourism sector. Later, this has been empirically observed both across OECD countries and emerging countries (OECD, 2022; Rasoolimanesh et al., 2024). These works underscore how governance, infrastructure investment, and digital transformation together can strengthen the resilience and competitiveness of the tourism sector.
After synthesising these literature, we identify the following three key gaps:
Limited nonlinear and interaction modelling of economic, infrastructural, mega-events, and governance quality in shaping tourism demand in India;
Underuse of machine learning methods for resolving highly correlated multi-dimensional modelling in tourism demand;
Integration of governance and institutional quality alongside traditional drivers in the policy-making context.
This study addresses these gaps through a nonlinear, interpretable machine learning framework to analyse India’s foreign tourist arrivals quantitatively and comparatively.
2. Materials and Methods
This study conceptualises foreign tourist arrivals as outcomes of multifaceted determinants spanning economic, infrastructural, cultural, event, and institutional domains. The framework is built on the gravity-based tourism-demand theory. Among the economic variables, per capita income in origin countries primarily determines travel affordability and demand. However, its marginal returns diminish beyond certain thresholds due to market saturation and diversification (Nguyen, 2021). In a fully specified gravity model, prices would ideally be represented by bilateral relative prices or real exchange rates between each source country and India. However, due to a lack of reliable and consistent all-source-country CPI, we have treated India’s consumer price inflation as a destination-side proxy for relative prices.
From the infrastructure side, hosting the tourists in quality hotels and offering end-to-end transportation are the most important variables to predict tourism demand. We have proxied these two variables by the total number of hotel rooms at the macro level and aircraft flown both internationally and domestically. Cultural and heritage assets such as UNESCO sites, festivals, and historical landmarks act as a stimulus to attract foreign tourists. India having a rich heritage of culture and geographical landscape to count on. Though these assets generate destination uniqueness, they are subject to the risk of overcrowding effects, which may diminish marginal benefits at high levels (Kordej-De Villa & Šulc, 2021; Kutlu et al., 2024). We have considered UNESCO World Heritage Sites due to continuous additions of sites over the years and a high global ranking (current 6th).
India did host several mega events over the years, including sports, political and religious events. All these mega events are considered both in terms of short-term and event-lag-wise. Finally, the recent literature also strongly to considering the institutional quality in terms of governance, safety, and regulatory efficiency. We have conceptualised that all these will have an impact on the international tourism inflow. Conceptually, we hypothesise nonlinear effects (diminishing returns, thresholds) and synergistic interactions
The dataset is structured as a panel data indexed by source country c (1,…,61) over years t (2002,…,2024). While the dependent variable (tourists inflow) varies by country-year, several key regressors (e.g., infrastructure, heritage assets, CPI growth, institutional quality, events) vary only by year and apply uniformly across source countries. The dependent variable is log-transformed for stabilising variance and interpreting coefficients as elasticities.
The log-transformed real Gross Domestic Product (GDP) per capita of the source country (in constant 2015 US dollars) was taken as a demand-side proxy for tourism inflow to India. Due to data limitations, the price competitiveness is proxied by India’s Consumer Price Index (CPI), which acts as an indicator of inflation in the destination market. As mentioned earlier, the destination infrastructure is captured by two proxy variables - the total number of classified and approved hotel rooms available at the macro level and the counts of both international and domestic aircraft movements. Cultural appeal is measured by the number of UNESCO heritage sites.
To account for temporary shocks of mega events, we have considered through binary variable indicating major event hosting (such as the Commonwealth Games, cricket World Cup, or G20 Summit) in a year. We have also considered a lagged event indicator to capture the persistence impacts of the event beyond the year of occurrence.
Institutional quality is measured by three governance metrics - Rule of Law (RL), Political Stability (PV), and Government Effectiveness (GE). These variables capture legal, political, and administrative dimensions that may influence international travellers’ perceptions and decisions about the destination. A simple average of these three variables (pvgerl) was used in the study. All this information was gathered from the Reserve Bank of India database, OECD database and World Bank’s Worldwide Governance Indicators.
Building on the gravity-based tourism demand model, foreign tourist arrivals from origin i to India in year t can be viewed as:
= natural log of tourist inflow from source country c in year t; = log real GDP per capita (2015 US$) of origin country c in year t(demand side); = India’s CPI (or CPI growth) in year t; = log total classified/approved hotel rooms in India in year t; = log domestic aircraft movements in India in year t; = log domestic aircraft movements in India in year t; = count of UNESCO heritage sites (India) in year t; = indicator for a major event in year t(1 = yes, 0 = no); Is it one-year lag; = simple average of Political Stability, Government Effectiveness and Rule of Law in year t; = country (source) fixed effect capturing time-invariant origin characteristics; = idiosyncratic error term.
We initially employed classical panel data regression models, including pooled Ordinary Least Squares (OLS), fixed effects (FE), and random effects (RE) estimations. With the objective to account for nonlinearities and interaction effects, we extended the baseline linear model by incorporating polynomial terms and interaction variables. Model selection tests (F-test, Breusch-Pagan LM test, and Hausman test) indicated that the Fixed Effects model was the preferred specification, given the unobserved country-specific heterogeneity.
However, the addition of polynomial and interaction terms introduced substantial multicollinearity and resulted in unstable coefficient estimates and inflated standard errors. To mitigate this problem, we have tried all types of regularisation (L1, L2 and elastic net) to apply. However, due to strong multicollinearity, none of these regularization method produced the optimal desired results, including non-linear and interaction terms. Due to space constraints, these results are not included in the main manuscript but are available from the authors on request.
Consequently, this study employed Extreme Gradient Boosting (XGBoost), a machine learning ensemble method capable of intrinsically modelling complex nonlinearities and interactions without requiring pre-specification of polynomial terms or interaction variables. The model uses a squared-error loss function with a learning rate of 0.1, a maximum tree depth of eight, subsampling and column-subsampling rates of 0.8, four parallel threads, and a fixed random seed of 123, allowing up to 500 boosting iterations with early stopping after 20 rounds without improvement in root mean squared error. To respect the panel structure and avoid temporal leakage, custom time–entity cross-validation folds are constructed by sorting each source country’s observations by year and splitting them into three contiguous blocks. These are then rotated as training and validation sets. This time-aware cross-validation procedure ensures that reported performance reflects genuine out-of-sample prediction across countries and years and that the accumulated local effect (ALE) plot-based interpretation is based on a fully specified and reproducible XGBoost training design. SHapley Additive exPlanations (SHAP) values and ALE plots were used to achieve model interpretation.
3. Results
3.1. Summary Statistics of Key Variables
The key variables used in the analysis include both source country-level time-variant variables and India-level time-variant and time-invariant aggregates.
Table 1 presents descriptive statistics for the variables at the macro level.
The foreign tourist arrivals average 100,341 per source country-year, with a median of 34,360 and a range extending from 530 to over 2.5 million arrivals. This clearly reflects the heterogeneity in tourism flows across diverse source countries and over time. Time-similar heterogeneity is observed in the economic conditions of the source countries, where GDP per capita of source countries shows substantial variation both among the countries and over time. With an average inflation rate of 6%, the data shows mild inflation, which in turn proves to be modestly price-competitive. a mean accommodation capacity of 99,045 rooms, with modest variability, reflects steady growth over time. There is a wide gap in aircraft movement between domestic and international levels. In recent years, due to the Government of India's flagship initiatives (UDAN, launched in 2016) there have been better growth in domestic aircraft movement, compared with the international movement. World Bank’s World Governance Indicators (in standardised form) hovers around zero with minor fluctuations. This suggests that relative governance stability over the years. Thus, there are wide variations both in the demand and supply sides of international tourists inflow to India.
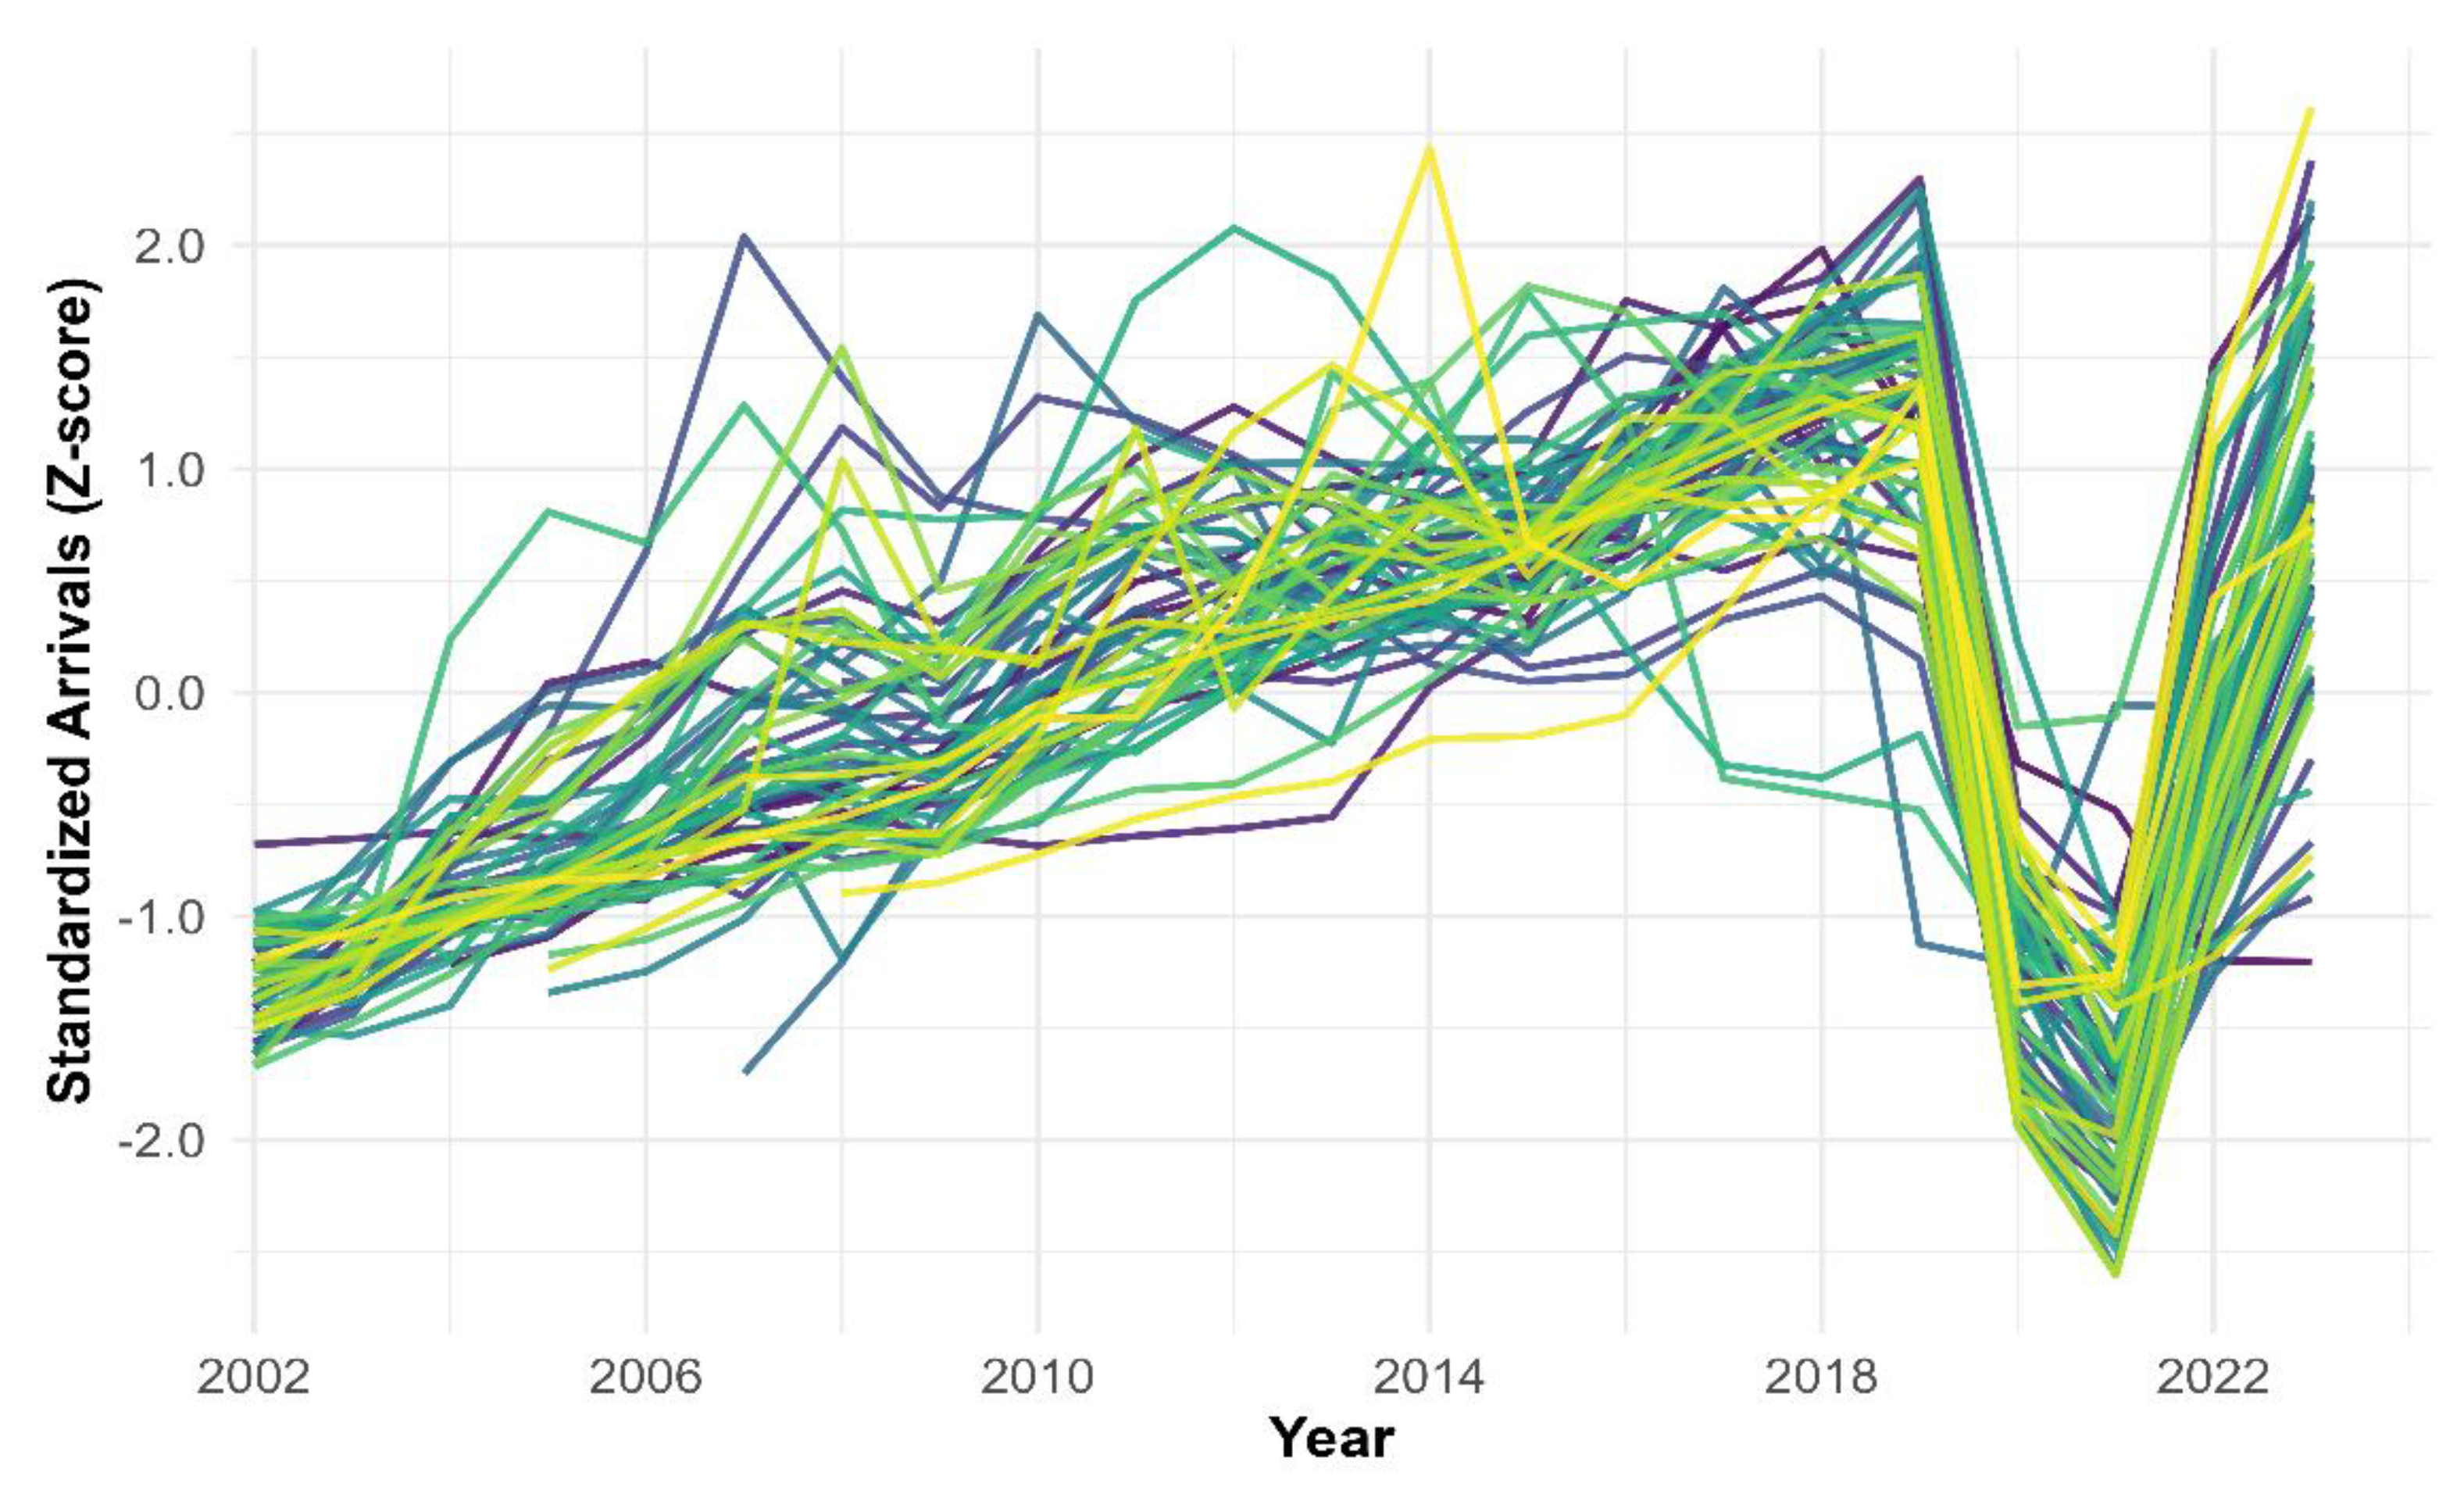
3.2. Trend of Foreign Tourists Arriving in India
Figure 1 depicts the inbound foreign tourist arrivals to India from multiple source countries over the period 2002–2024. We have standardised the inbound tourist inflow from the respective source country to compare the growth dynamics, ignoring the volume of arrivals. The plot reveals three dominant features: (1) A general upward trend in arrivals for most countries from 2002 to 2019; 2) a sharp and synchronised contraction in 2020–2021 due to the COVID-19 pandemic; and (3) a marked post-pandemic rebound starting in 2022. This pattern indicates the resilience of international tourism demand and persistent cross-country heterogeneity in shock exposure and recovery.
3.3. XGBoost Model Performance
An XGBoost regression model is estimated to predict log(foreign tourist arrivals) with origin–year observations linked to a set of already specified predictors. Among the regressors, source country income is log transformed along with the destination country’s hotel rooms, heritage sites, and aircraft flown domestically and internationally. Other regressors (event, event count, CPI growth and pvgerl) are kept at their level form. We have dropped the lagged values of the tourist inflow to have an autoregressive temporal effects free estimation for checking the real predictive power of the regressors. Even without the lagged dependent variable, the model performed well - an out-of-sample Root Mean Squared Error (RMSE) of approximately 0.752 and an R-squared (R²) of 0.59. So, although the lagged outcomes contribute to improved fit, the model robustly explains variation in tourist arrivals through economic, infrastructure, event, and governance features alone.
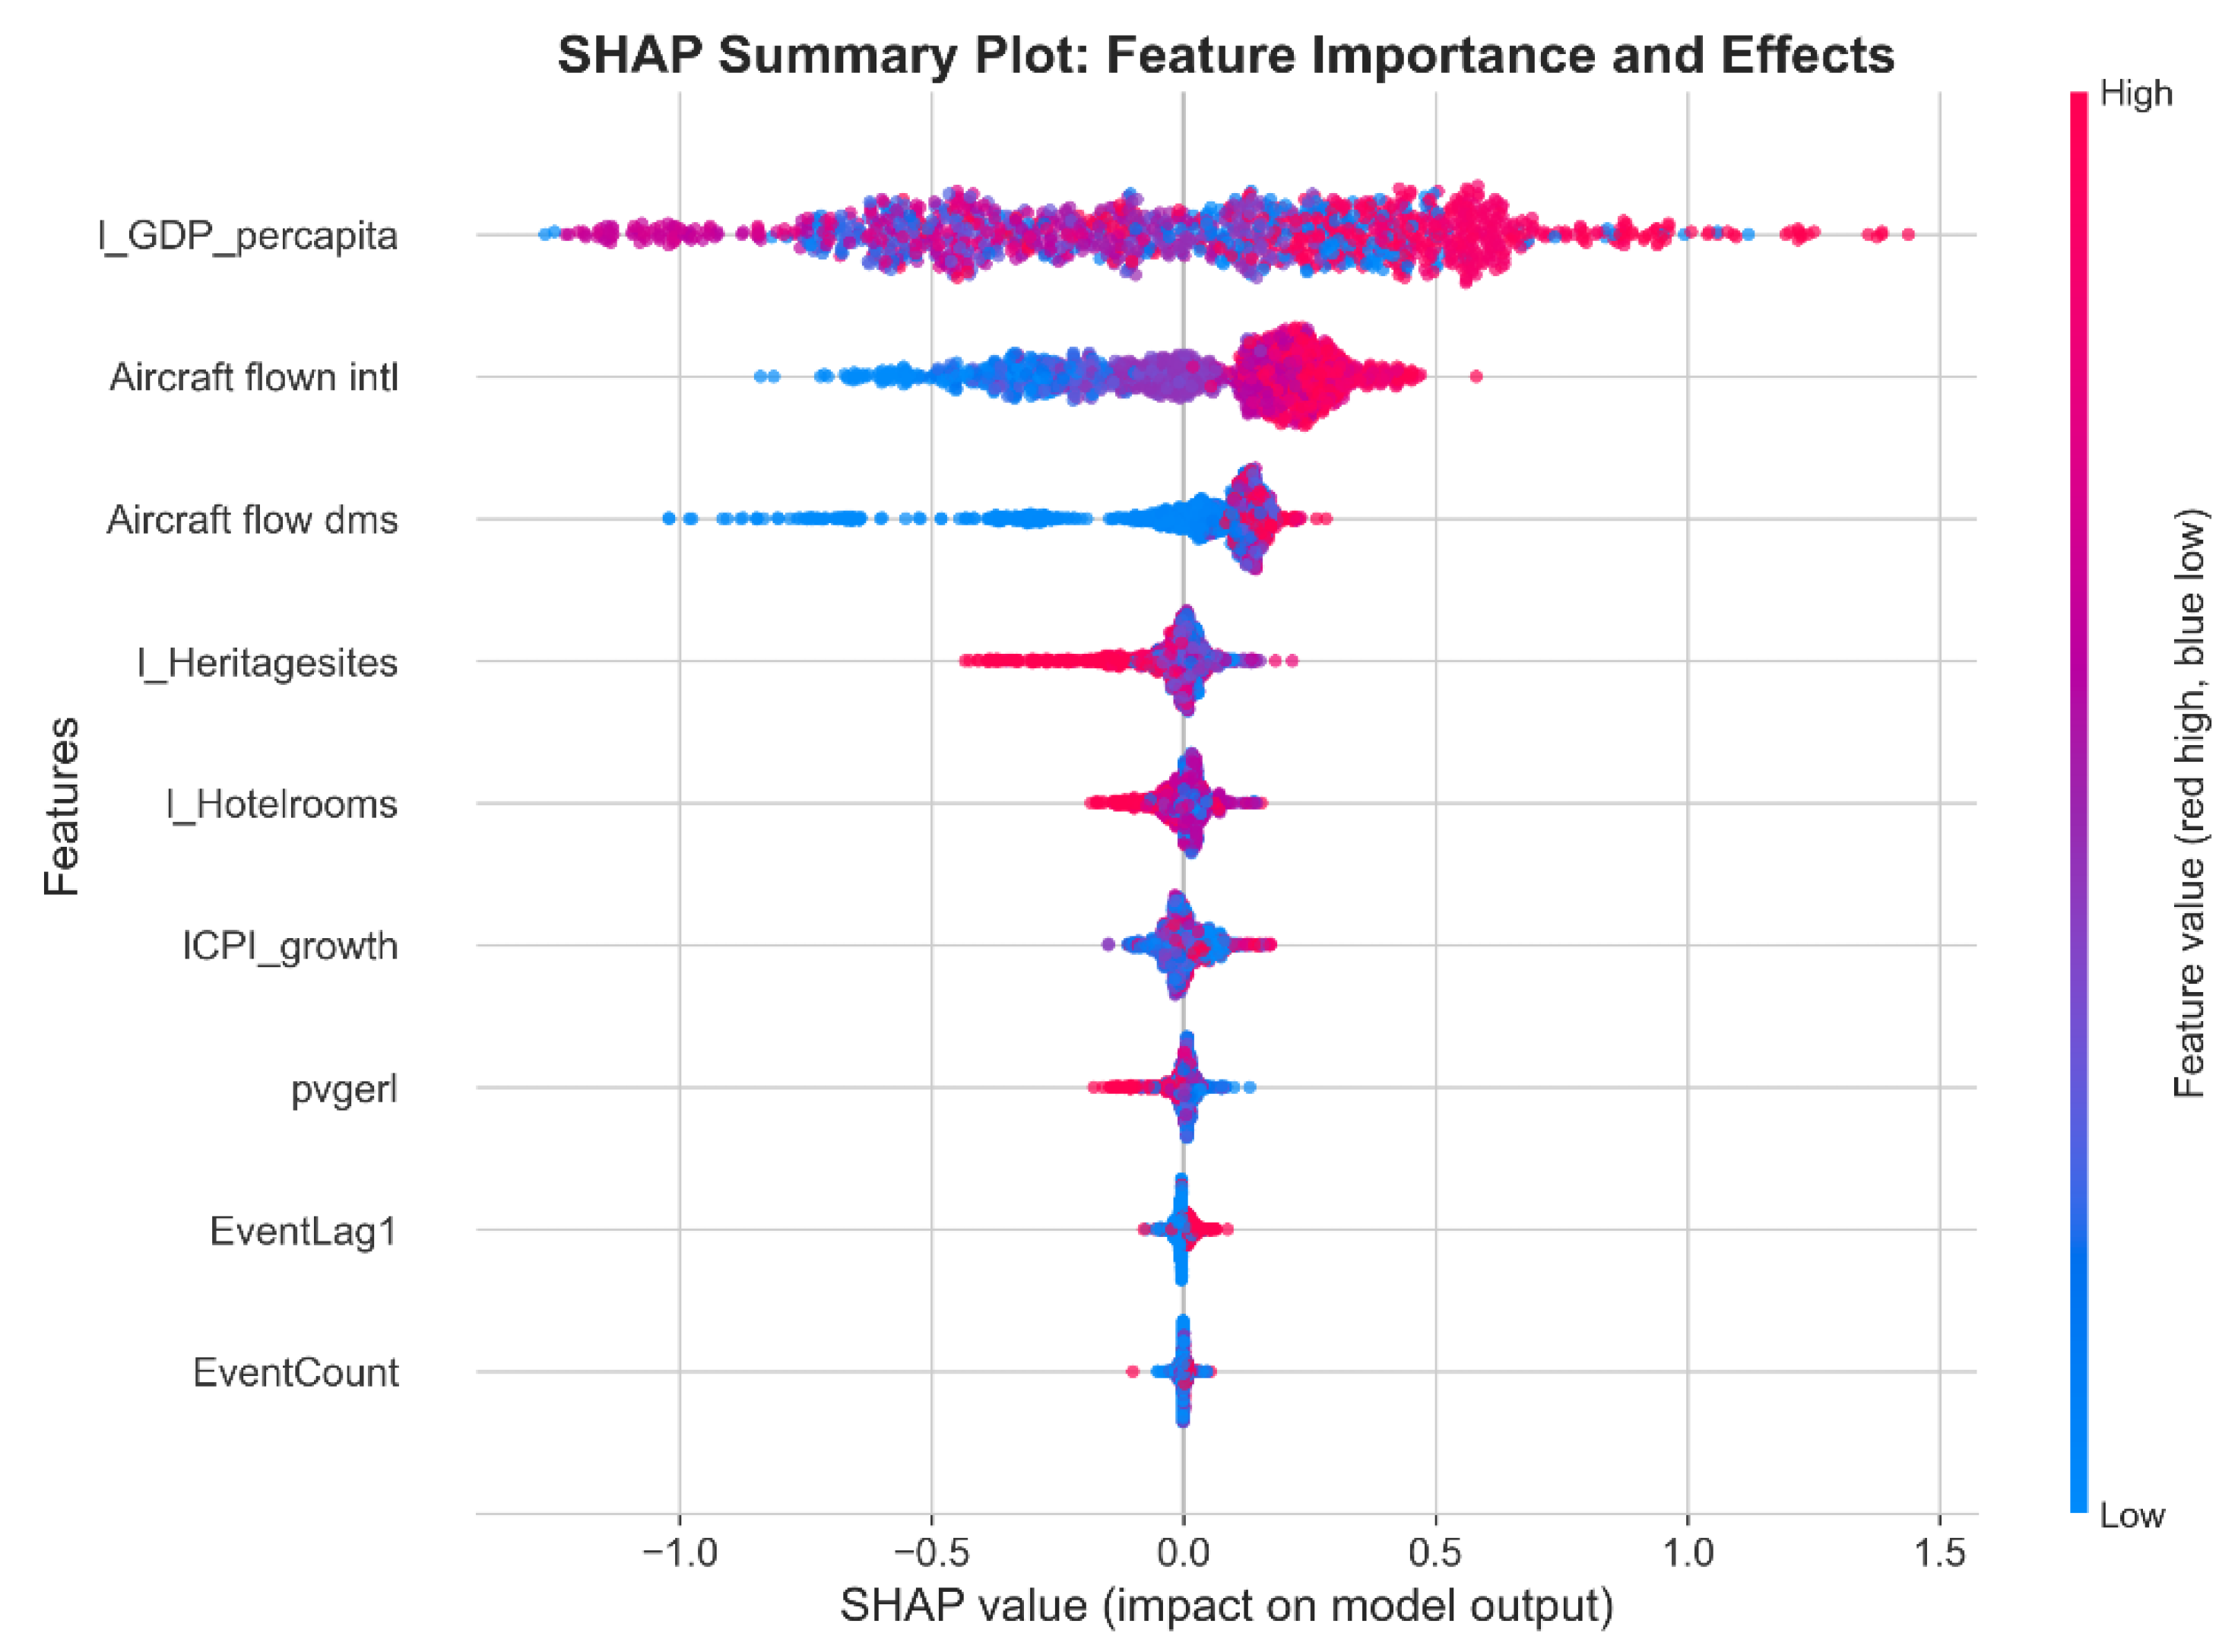
3.4. SHAP Summary Plot: Global Feature Importance and Value Effects
To further explore the pattern through which key regressors influence foreign tourist arrivals, we leveraged Shapley Additive exPlanations (SHAP) values to assess the feature values impact model output. The SHAP summary plot in
Figure 2 globally ranks all predictors' contribution to the model’s predictive output for inbound tourism. The figure shows not only which drivers are most influential but also how the features modulate their predictive power on tourism inflow. The SHAP plot uses a colour gradient from blue-red (“low-high”) to reveal not just the rank of importance of the regressors but also the directionality and conditionality of each feature’s effect. Features that move from blue (low value, negative effect) to red (high value, positive effect) are policy levers with direct, scalable benefits. Conversely, negative movement of high values (e.g., inflation) highlights risk points and the necessity for economic stability. Air traffic movement (both international and domestic) is the next most vital determinant. This affirms that reductions in spatial frictions (lowering time, cost, and uncertainty of travel) robustly expand India’s effective tourist catchment area. The positive SHAP value range for both international aircraft count (“Aircraft flown intl”) and domestic count (“Aircraft flow dms”) empirically supports the hypothesis that boosting international air connectivity and robust domestic networks generates nontrivial, systemic gains in foreign tourists arrivals in India.
The prominence of log heritage sites reinforces the growing literature on differentiation and experience-driven tourism. However, most of the SHAP values are clustered near zero on the positive side. This implies that the gains in tourism inflow are limited compared to the earlier two important regressors. The same is true for log of hotel rooms. More hotel rooms to accommodate more tourists, boost potential inflow; however, the effect size is limited compared to income and civil aviation infrastructure impact. SHAP values for governance (pvgerl) are tightly clustered near zero, slightly on the positive side, implying that governance has a modest direct marginal effect on tourist inflows – but not at the scale of income and aviation infrastructure.
The SHAP values of the CPI growth are clustered around zero, with most of them skewed towards the negative values. This essentially implies that higher destination inflation will lead to higher real travel costs, which in turn lead to less foreign tourist inflow. Finally, the near-zero clustered SHAP values of mega events and their lag impact indicate that hosting a major event produces at best a small and inconsistent short-run boost to tourist inflows, with no strong systematic impacts over the subsequent time periods.
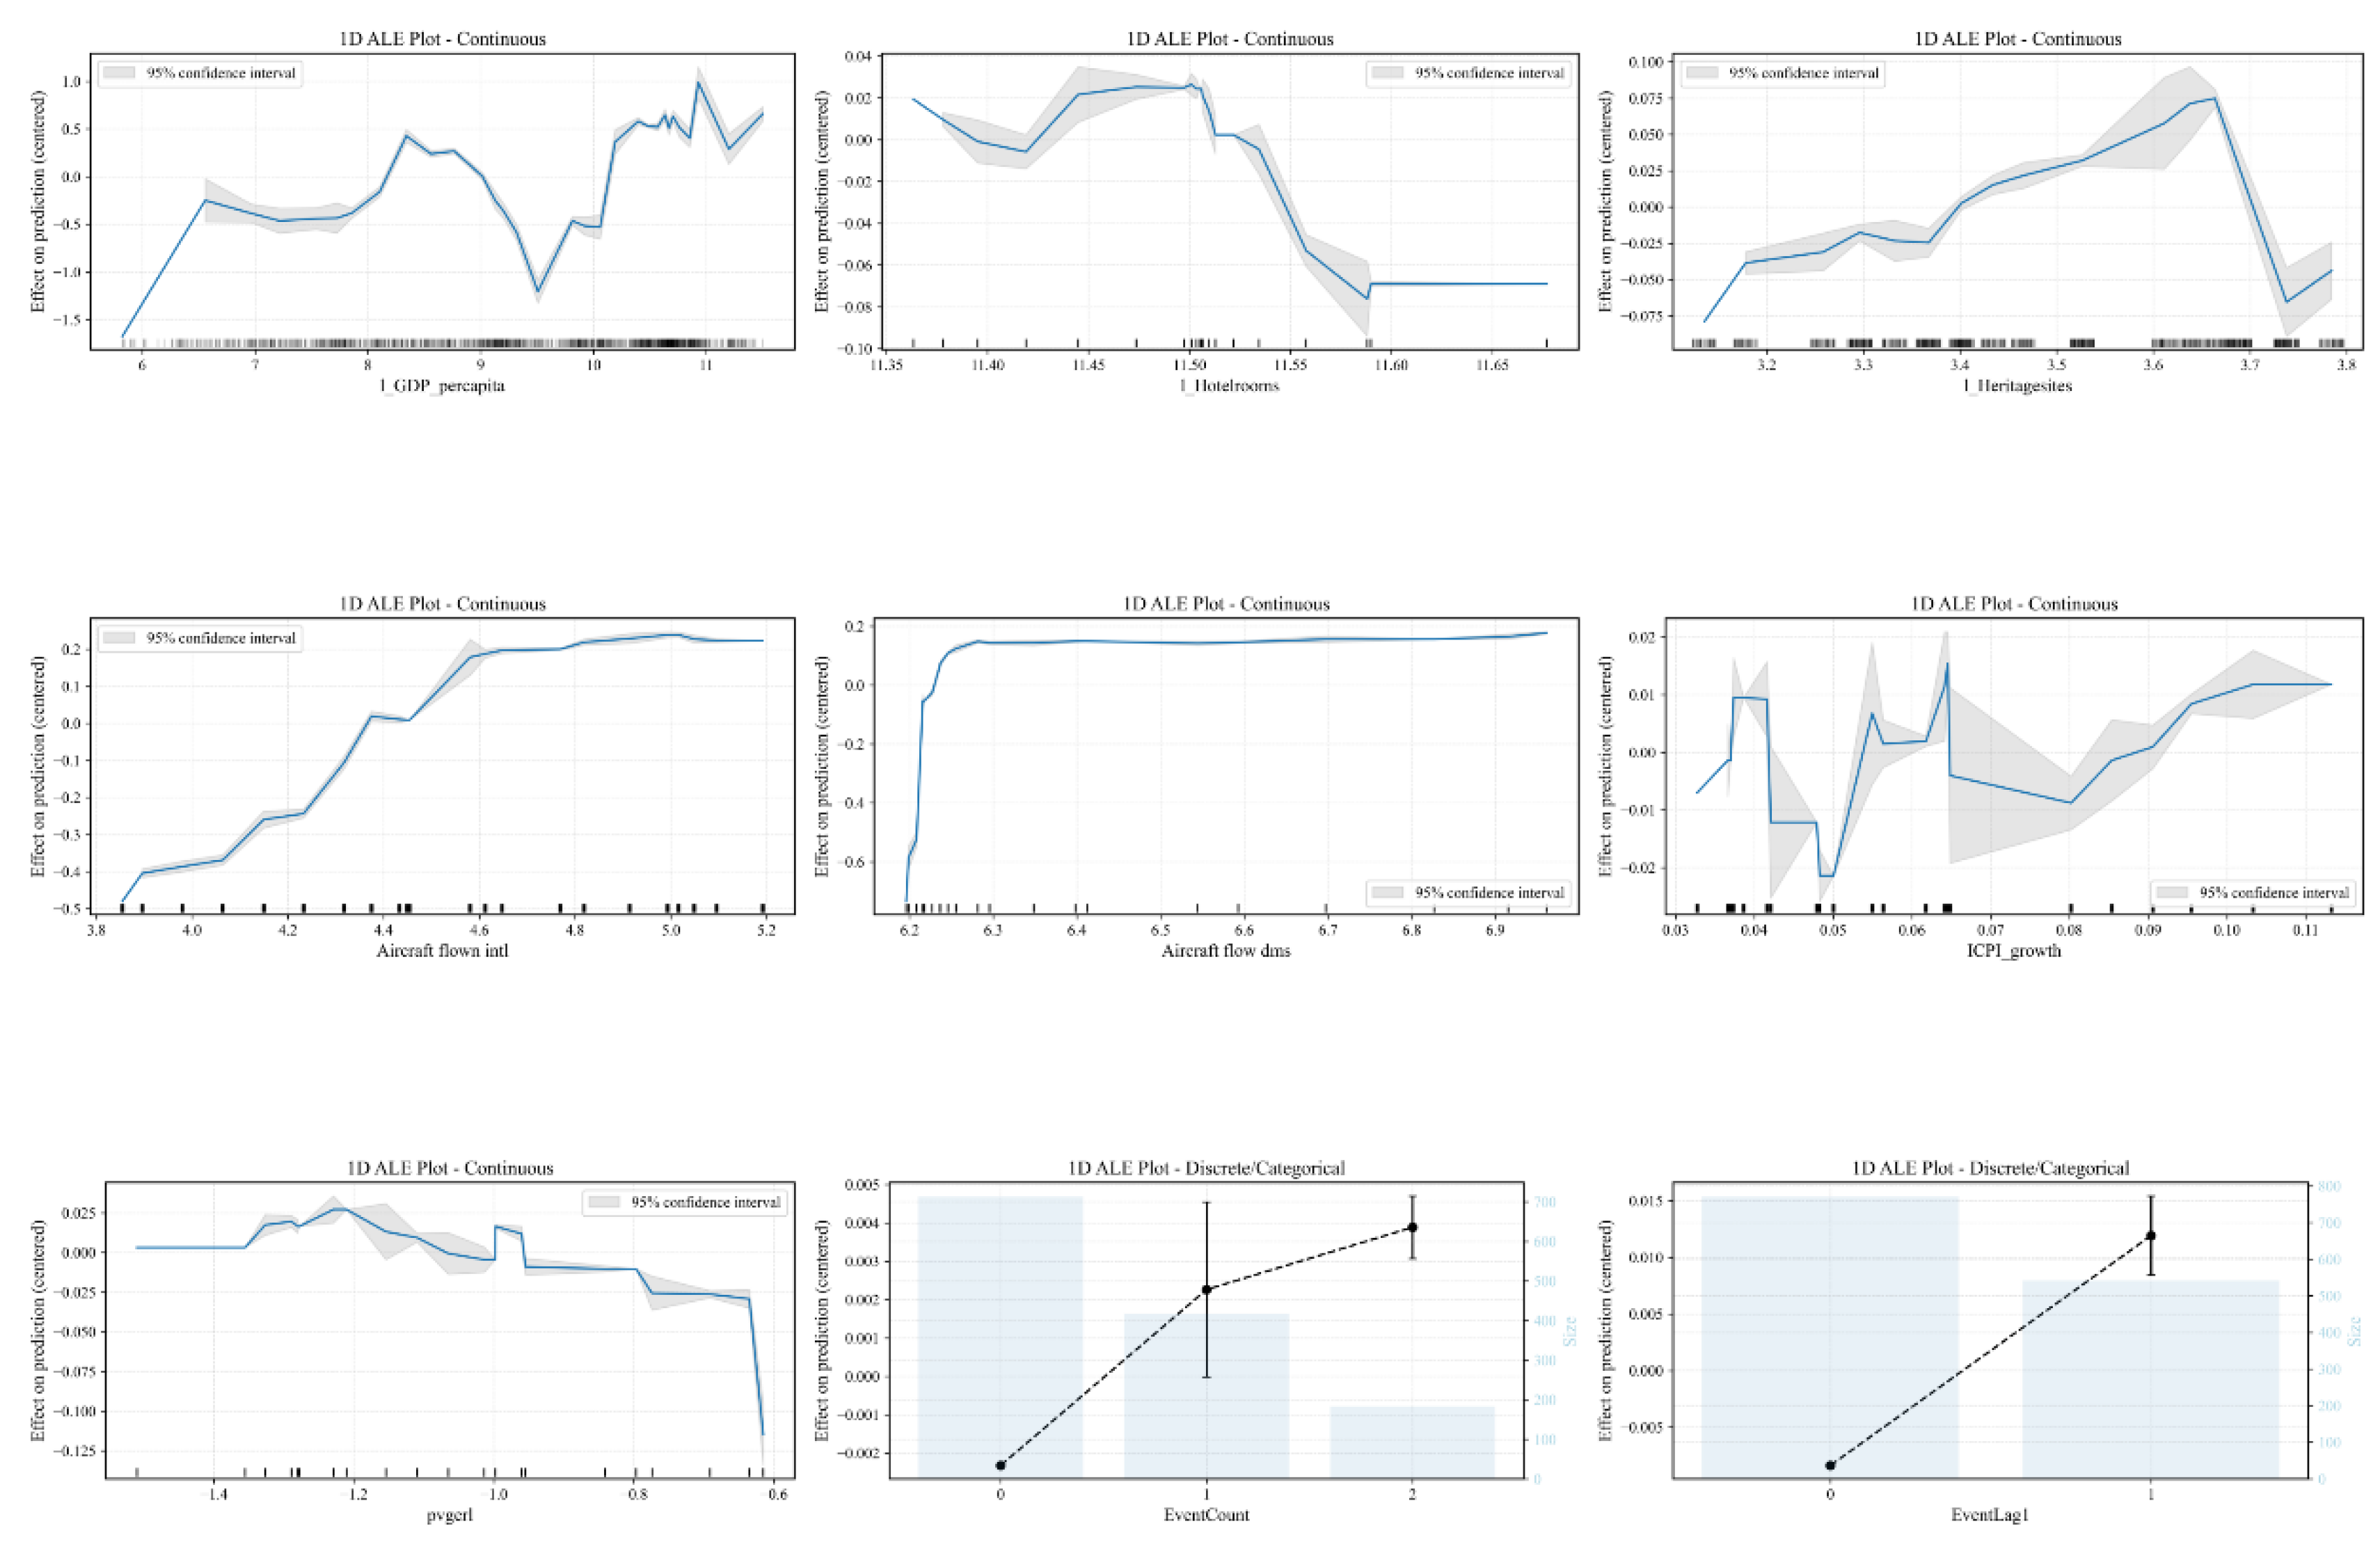
3.5. ALE Plots: Feature Interactions and Economic Intuition
One limitation of the SHAP values is their sensitivity to collinearity among the regressors. As our model exhibits strong collinearity, we apply an ALE plot to get unbiased, model-consistent interpretations under strong multicollinearity and nonlinear interactions.
Figure 3 presents one-dimensional Accumulated Local Effects (ALE) plots for all key determinants of international tourists’ inflow to India. The ALE profile for log per capita GDP of source countries displays a nonlinear and partially cyclical trajectory. At lower levels of per capita GDP of source countries, an increase generates strong positive marginal gains in predicted tourist arrivals in the destination. However, this momentum is lost substantially beyond a mid-income threshold; it exhibits brief reversals and rises again at the highest income levels. There can be multiple reasons for this – initially outbound tourism market matures at a certain income level and then at a further higher income level, outbound travel diversifies and thereby distributes the demand across multiple destinations.
The ALE curve for the log of heritage sites shows a strictly concave and diminishing return pattern. In the beginning, developing a few heritage sites gives a huge boost to tourism inflow. But beyond the threshold level, the addition of new sites brings in fewer extra visitors. This clearly indicates India already ranks 6th in the UNESCO heritage list, and hits the maximum carrying capacity. Any addition to the heritage list will not provide any substantial gain in attracting foreign tourists. Now what matters is managing the service quality at the heritage sites and their worldwide marketing to keep tourists coming back.
Among the infrastructure-related regressors, the log of hotel rooms clearly indicates that India has reached the threshold level. When the number of hotel rooms was low, any addition to it made the tourists stay and yielded a positive impact. As the hotel rooms increased further, the extra rooms helped, but their incremental benefits became weaker, and eventually they started to fall. In this situation of saturation, what really matters is the expansion of air connectivity, which actually emerges as the second most important driver behind the income of the source countries. The ALE plots of both intentional and domestic air connectivity have shown steep rising slopes and then flattening at high levels, without any signs of south direction. This is indicative of a positive impact but with diminishing returns – no signs of downward impact at higher levels.
Institutional quality exhibits a non-linear pattern and eventually a negative relationship with the inflow of foreign tourists. At low to moderate values of institutional quality, the effect on the model prediction was low to slightly positive, which implies a very less incremental gain is associated with it in terms of attracting foreign visitors. After a mid-threshold level, the ALE curve for institutional quality moves slowly in a downward direction. This is possibly due to India’s relatively low score in institutional quality; the marginal changes in governance quality may not necessarily reflect in international tourism gains. Finally, the inflationary situation in India has a mild negative impact on inbound tourism.
Overall, the ALE plots show that, along with source countries’ economic development, India’s rich collection of heritage sites and growing air connectivity are pulling the foreign visitors in a non-linear fashion, while the impacts of domestic inflation and institutional quality are mild to negative. Also, most of the key drivers, except air connectivity, have shown a saturated status.
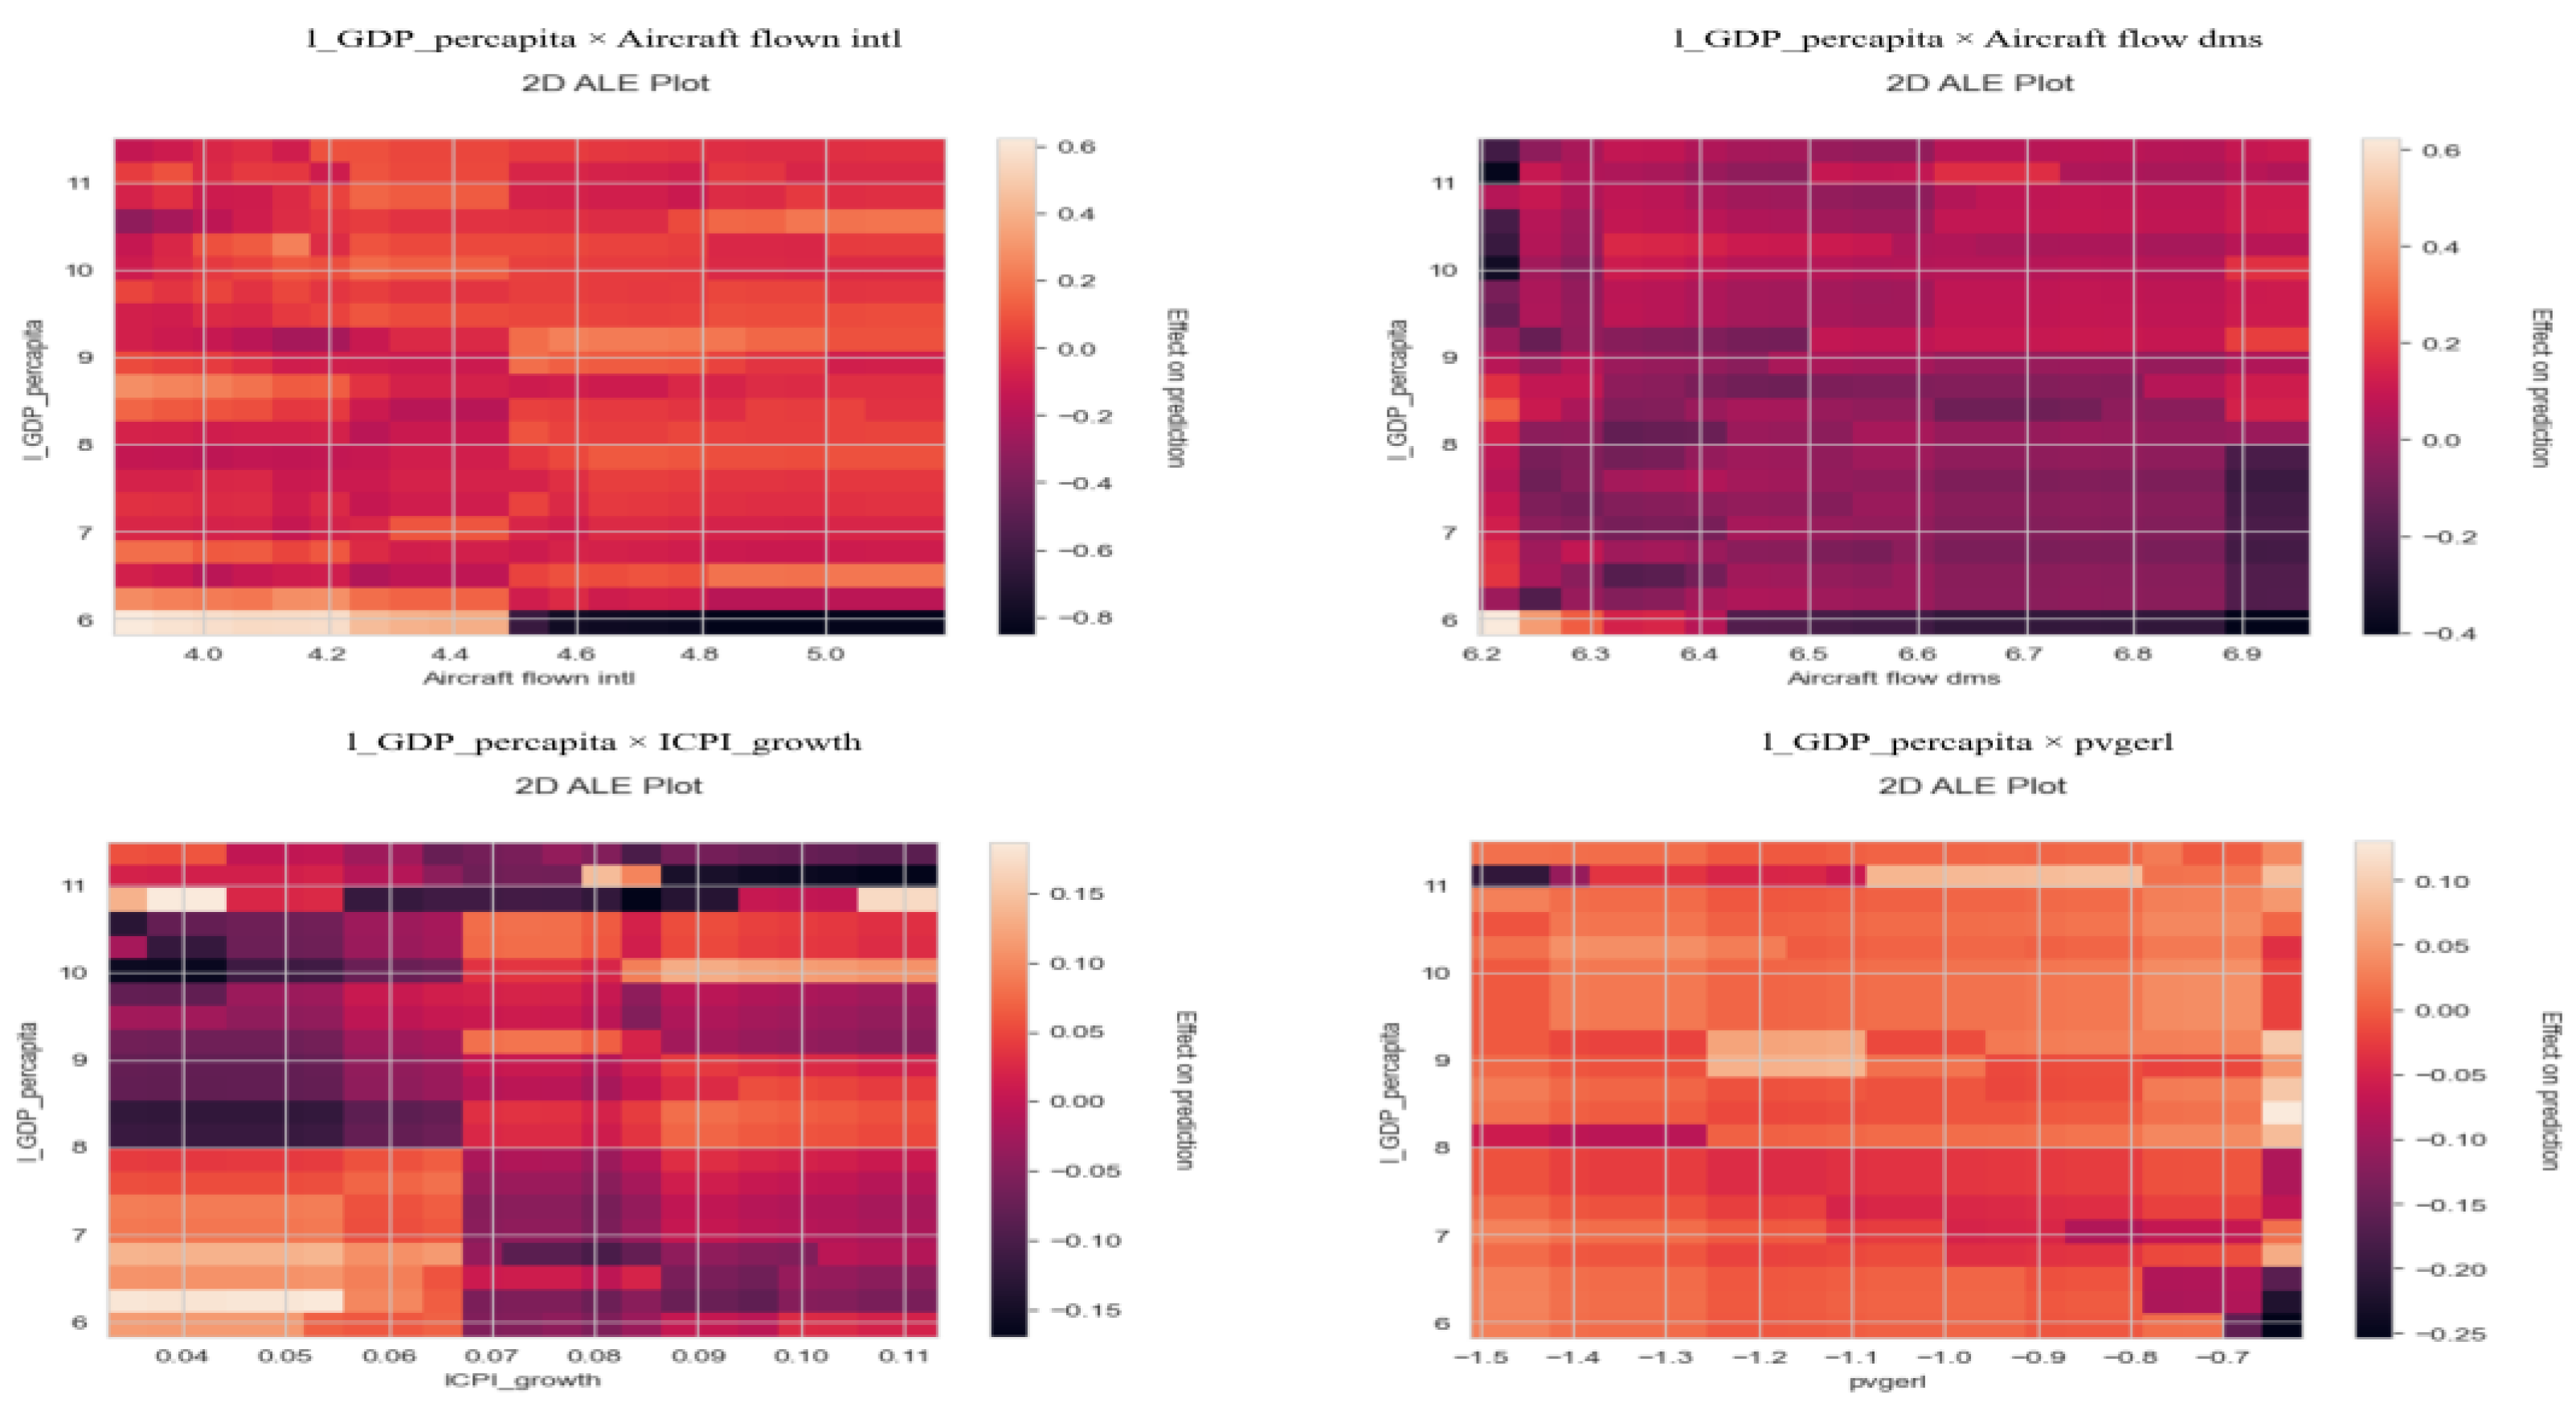
3.6. Finding Feature Interactions
We have utilised the pairwise SHAP values for finding the possible interaction among the features, and the top interacting features based on their aggregate mean absolute values are reported in
Table 2 below.
The magnitudes of interactions clearly show that mostly the interactions are anchored around the source countries’ economic affluence (
l_GDP_percapita). This confirms that economic affluence of the source countries does not operate in isolation; rather, it amplifies the tourism inflow to India through interacting with the supply-side factors. Taking the top four pairwise interaction factors anchoring around the economic affluence of sources, we further estimate the interaction mechanism using a 2D ALE plot and as shown in
Figure 4 below:
To understand the 2D ALE plot, we must know the colour gradient. The colour gradient reflects how different combinations of the two features increase (lighter colours) or decrease (darker colours) the model’s prediction relative to its average. The strongest interactions are between source countries’ economic affluence and international air connectivity to India. The 2D ALE plot clearly shows that international connectivity amplifies the foreign tourists’ inflow to India from the middle-income countries. At the highest income level and highest international connectivity, the tourist inflow to India diminishes. This is probably due to the saturation of demand or the highest affluent foreign tourists diversifying their travel patterns to other destinations. The same is true for domestic air connectivity, as it strengthens foreign tourists up to a certain threshold level, and after that, it serves internal mobility. The interaction between the economic affluence of the source country and India’s inflation reveals a non-linear price elasticity of foreign tourists' demand. Tourists from low and middle-income countries show high sensitivity to India’s domestic inflation. On the other hand, tourists from high-income countries show muted and heterogeneous responses due to their relatively high tolerance of higher inflation and destination diversification at higher income levels. However, this was not sufficient to compensate for the loss arising from the high price-sensitive tourists from low and middle-income countries. Finally, the interaction plot of institutional quality in India and source countries’ economic affluence shows that economically rich tourists are more sensitive to institutional quality than the budget-driven low and middle-income foreign tourists.
3.6. SHAP-Based Elasticities: Translating Model Interpretability into Economic Magnitudes
To provide policymakers and researchers with actionable insights, we translate the SHAP values into elasticities for estimating the percentage change in foreign tourist arrivals associated with a one per cent change in key predictors.
Table 3 presents these elasticities along with 95% bootstrap confidence intervals.
We have estimated two complementary SHAP-based elasticity measures. First, we compute the average absolute SHAP values to measure the impact magnitude of the predictors on the foreign tourists' arrivals to India. Secondly, the signed elasticities are estimated from the average SHAP values for the continuous predictors and for level predictors, SHAP values by the predictor mean. These second-class estimates provide the net average direction of the marginal effect over the sample range.
Based on the mean absolute elasticity, inflation in India, source countries’ per capita income, India’s heritage sites, and hosting mega-events by India exert the largest average influence on tourists' arrival in India. The signed elasticities confirm the visual plots – SHAP summary plot and 1D ALE plot. Adding more heritage sites exhibits a small but statistically significant negative elasticity. This further confirms our earlier observation in the 1D ALE plot.
Inflation in India shows a very small positive elasticity (a narrow confidence interval). So, this implies a mild positive SHAP contribution towards tourist arrivals in India when the inflation is at a moderate level. However, when inflation hits a higher level, it will certainly have a negative impact on tourists' arrival in India. For hosting mega events and air connectivity infrastructure, the signed elasticities are estimated near zero, despite the substantial absolute mean SHAP elasticities. This is due to the fact that their marginal elasticities are positive in some ranges of their values and negative in other ranges, which eventually cancel each other out.
4. Discussion
Log GDP per capita of the source country stands out as the overwhelmingly dominant factor. This validates the economic gravity model expectations and the central factor of international tourism demand, that is, the travellers’ ability and willingness to pay increases with rising affluence (see Song & Li, 2008; Stabler et al., 2010). The horizontal spread and concentration of high-value (red) points on the positive SHAP side imply disproportionately strong marginal impacts at higher income levels. Tourism being a luxury good, rising income levels boost tourism sentiments, reflecting a positive income elasticity since both are measured on a logarithmic scale.
Air traffic movement, both international and domestic, ranks as the next most vital determinant after source-country income. This aligns with prior findings that enhanced air connectivity reduces spatial frictions and expands destination accessibility, as seen in panel analyses of Asian tourism flows (Shah et al., 2022). The positive SHAP range for both aircraft counts supports systematic gains from international links and domestic networks. However, ALE plots reveal saturated returns at high levels. This is a contrasting finding from linear assumptions in classical gravity models (Crouch, 1994).
Accommodation infrastructure (hotel rooms) shows limited positive SHAP clustering around zero. This is also indicative of saturation effects beyond threshold values. Regarding the growing networks of hotel accommodation, we differ from the early infrastructure studies assuming constant returns (Suresh et al., 2015). In the current study, the hotel capacity reaches a plateau where further expansion yields falling benefits.
Similarly, the heritage assets also show a saturation condition (limited positive SHAP clustering near zero). The concave ALE curve for UNESCO sites confirms diminishing marginal returns for India (6th globally), echoing overcrowding risks in heritage tourism (Kordej-De Villa & Šulc, 2021; Kutlu et al., 2024).
Governance quality (pvgerl) exhibits modest positive but near-zero SHAP values, with ALE turning negative post-threshold—suggesting limited appeal at India's scores. This partially supports governance as a resilience factor (Hall, 2011; Rasoolimanesh et al., 2024) but highlights its secondary role versus economic drivers, unlike OECD emphasis (OECD, 2022). Inflation (CPI growth) skews negative in SHAP, with a mild overall impact, aligning with price sensitivity in emerging markets (Nguyen, 2021) yet showing nonlinearity absent in linear panels (Song et al., 2023). Mega-events yield near-zero SHAP effects, which is clearly indicative of inconsistent short-run boosts without long-term persistence—tempering optimistic legacy views (Gursoy et al., 2017; Matheson, 2006) and underscoring infrastructure preconditions (Black & Van Der Westhuizen, 2004).
Methodologically, the setup of XGBoost plus SHAP/ALE resolves both multicollinearity (arising from inclusion of polynomial extensions of fixed-effects models) (Wooldridge, 2010; Wasiaturrahma & Rohmawati, 2021) and capturing nonlinearities and interaction effects (e.g., income-air connectivity) better than traditional linear econometric approaches (Saayman & Botha, 2017; James et al., 2013). Interactions centered on source affluence amplify supply-side effects for middle-income markets, informing targeted policies over broad strategies
5. Conclusions
This study uses interpretable machine learning methods to provide a data-driven perspective on the determinants of foreign tourist arrivals to India. It tries to reveal the interplay between economic, infrastructure, governance, and event-driven factors for India’s tourism demand in the global market. The empirical findings show that the economic affluence of source countries is the single most influential driver of arrivals. However, this alone cannot determine the demand. It’s interaction with domestic inflation, connectivity and quality of governance. Also, in most cases, the predictors show diminishing marginal returns, indicating market maturity levels. This convex response indicates the continuing necessity of tailoring marketing and market development efforts towards emerging middle-income segments, which seems to be more promising for India since highly affluent foreign tourists are diversifying their destination portfolios.
Air connectivity emerges as a crucial infrastructure pillar. Both international and domestic aircraft movement feature among the top predictors. Both reveal strong and mostly linear positive relationships with inbound tourism, with no sign of downward movement. So, direct international links with more middle-income foreign cities to Indian airports and systemically bridging the domestic flight network will help in the greater dispersal of arrivals.
The study also reaffirms the power of cultural and heritage assets. However, due to the saturation, any further addition to the list will not provide a substantial gain to India’s tourism demand. Rather, the maintenance of the sites’ service quality and the effective worldwide marketing to the specific target audience will be strategically more crucial. The same strategy applies to another infrastructure ingredient, that is, hotel rooms, where a clear saturation state is visible. Thus, instead of aggressive expansion of hotel networks, the focus should be on the qualitative improvements.
Institutional quality exhibits a non-linear pattern and eventually a negative relationship with the inflow of foreign tourists. There is ample room for improvement in this field. As India scores at relatively lower levels, only significant jumps in institutional quality will attract sensitive foreign tourists. Finally, the inflationary situation in India has a mild negative impact on the inbound tourism, especially for the low-middle-income foreign tourists, due to increased difficulty in economic affordability. However, as long as India’s long-term inflation remains under RBI’s suggestive band, there is no significant worry from this side.
Finally, event strategies are empirically validated for their enduring tourism stimulus. Mega-events not only provide immediate influxes but also produce persistent gains in subsequent years. However, finding supports small impacts on tourism demand, judicious selection, preparation, and legacy planning for major events is of utmost importance. Such mega-events must be aligned with sustainable practices and destination branding goals.
Institutional Review Board Statement
Not applicable to the current study as it uses completely secondary data.
Informed Consent Statement
Not applicable
Data Availability Statement
The final compiled data and Python/R codes are available on request.
Acknowledgements
The entire manuscript was conceptualised, analysed and written by the author. However, GenAI (Grammarly) has been used for final proofreading and fine-tuning of languages.
Conflicts of Interest
There is no conflict of interest.
References
- Anholt, S. Competitive identity: The new brand management for nations, cities and regions; Palgrave Macmillan, 2007. [Google Scholar]
- Ashley, C.; De Brine, P.; Lehr, A.; Wilde, H. The role of the tourism sector in expanding economic opportunity (Corporate Social Responsibility Initiative). In Harvard Kennedy School; 2007; Available online: https://ashleyinsight.co.uk/wp-content/uploads/2020/04/tourism-in-expanding-economic-opportunity.pdf.
- Black, D.; Van Der Westhuizen, J. The allure of global games for 'semi-peripheral' polities and spaces: A research agenda. Third World Q. 2004, 25, 1195–1214. [Google Scholar] [CrossRef]
- Bramwell, B.; Lane, B. Critical research on the governance of tourism and sustainability. J. Sustain. Tour. 2011, 19, 411–421. [Google Scholar] [CrossRef]
- Buhalis, D.; Law, R. Progress in information technology and tourism management: 20 years on and 10 years after the Internet—The state of eTourism research. Tour. Manag. 2008, 29, 609–623. [Google Scholar] [CrossRef]
- Cortés-Jiménez, I.; Blake, A. Tourism Demand Modeling by Purpose of Visit and Nationality. J. Travel Res. 2010, 50, 408–416. [Google Scholar] [CrossRef]
- Crouch, G.I. The Study of International Tourism Demand: A Survey of Practice. J. Travel Res. 1994, 32, 41–55. [Google Scholar] [CrossRef]
- Devi, R.; Agrawal, A.; Dhar, J.; Misra, A. Forecasting of Indian tourism industry using modeling approach. MethodsX 2024, 12, 102723. [Google Scholar] [CrossRef]
- Dogan, E.; Zhang, X. A nonparametric panel data model for examining the contribution of tourism to economic growth. Econ. Model. 2023, 128. [Google Scholar] [CrossRef]
- Dwyer, L.; Forsyth, P.; Spurr, R. Evaluating tourism's economic effects: new and old approaches. Tour. Manag. 2004, 25, 307–317. [Google Scholar] [CrossRef]
- Gössling, S. Tourism, technology and ICT: a critical review of affordances and concessions. J. Sustain. Tour. 2021, 29, 733–750. [Google Scholar] [CrossRef]
- Gössling, S.; Hall, C.M. Uncertainties in Predicting Tourist Flows Under Scenarios of Climate Change. Clim. Chang. 2006, 79, 163–173. [Google Scholar] [CrossRef]
- Government of India. India tourism statistics (Tourism Statistics). In Ministry of Tourism, Government of India; 2020. [Google Scholar]
- Guan, B.; Silva, E.S.; Hassani, H.; Heravi, S. Forecasting tourism growth with State-Dependent Models. Ann. Tour. Res. 2022, 94. [Google Scholar] [CrossRef]
- Gursoy, D.; Yolal, M.; Ribeiro, M.A.; Netto, A.P. Impact of Trust on Local Residents’ Mega-Event Perceptions and Their Support. J. Travel Res. 2016, 56, 393–406. [Google Scholar] [CrossRef]
- Hall, C.M. A typology of governance and its implications for tourism policy analysis. J. Sustain. Tour. 2011, 19, 437–457. [Google Scholar] [CrossRef]
- Hall, M. C.; Gössling, S.; Scott, D. Tourism and Sustainability: An Introduction. In The Routledge Handbook of Tourism and Sustainability; Routledge, 2011. [Google Scholar]
- Hastie, T.; Tibshirani, R.; Friedman, F. The Elements of Statistical Learning: Data Mining, Inference, and Prediction, 2nd ed.; Springer, 2009. [Google Scholar]
- Henriques, H.; Pereirsa, L.N. Hotel demand forecasting models and methods using artificial intelligence: A systematic literature review. Tour. Manag. Stud. 2024, 20, 39–51. [Google Scholar] [CrossRef]
- James, G.; Witten, D.; Hastie, T.; Tibshirani, R. An introduction to statistical learning: With applications in R; Springer. Springer, 2013. [Google Scholar]
- Kordej-De Villa, Ž., & Šulc, I. (2021). Cultural Heritage, Tourism and the UN Sustainable Development Goals: The Case of Croatia. In M. B. Andreucci, A. Marvuglia, M. Baltov, & P. Hansen (Eds.), Rethinking Sustainability Towards a Regenerative Economy (Vol. 15, pp. 341–358). Springer International Publishing. [CrossRef]
- Kutlu, D.; Zanbak, M.; Soycan, S.; Kasalak, M.A.; Çimen, Z.A. The Influence of World Heritage Sites on Tourism Dynamics in the EU 27 Nations. Sustainability 2024, 16, 9090. [Google Scholar] [CrossRef]
- Lim, C. Review of international tourism demand models. Ann. Tour. Res. 1997, 24, 835–849. [Google Scholar] [CrossRef]
- Matheson, V. Mega-Events: The effect of the world’s biggest sporting events on local, regional, and national economies. In College of the Holy Cross, Department of Economics; 2006; Available online: https://hcapps.holycross.edu/hcs/RePEc/hcx/HC0610-Matheson_MegaEvents.pdf.
- Nguyen, Q.H. Tourism Demand Elasticities by Income and Prices of International Market Regions: Evidence Using Vietnam’s Data. Economies 2021, 10, 1. [Google Scholar] [CrossRef]
- Nunkoo, R.; Ramkissoon, H. Developing a community support model for tourism. Ann. Tour. Res. 2011, 38, 964–988. [Google Scholar] [CrossRef]
- OECD. OECD Tourism Trends and Policies 2020. Organisation for Economic Co-operation and Development. 2020. Available online: https://www.oecd.org/content/dam/oecd/en/publications/reports/2020/03/oecd-tourism-trends-and-policies-2020_7cfc4549/6b47b985-en.pdf.
-
OECD OECD Tourism Trends and Policies 2022; Organisation for Economic Co-Operation and Development (OECD): Paris, France, 2022; ISBN 9789264377509.
- Pike, S. Destination marketing essentials, 2nd ed.; Routledge, 2016. [Google Scholar]
- Prideaux, B. The role of the transport system in destination development. Tour. Manag. 2000, 21, 53–63. [Google Scholar] [CrossRef]
- Rasoolimanesh, S.M.; Wang, M.; Ragavan, N.A.; Poulain. [PubMed]
- Saayman, A.; Botha, I. Non-linear models for tourism demand forecasting. Tour. Econ. 2015, 23, 594–613. [Google Scholar] [CrossRef]
- Shah, I.A.; Nengroo, T.A.; Haq, I.U. Determinants of International Tourism Demand in India: An Augmented Gravity Model Approach. Stud. Univ. „Vasile Goldis” Arad – Econ. Ser. 2022, 32, 102–115. [Google Scholar] [CrossRef]
- Sharma, M.; Mohapatra, G.; Giri, A.K. The Determinants of Inbound Tourism Demand in India: New Evidence from ARDL Co-Integration Approach. Bus. Perspect. Res. 2023. [Google Scholar] [CrossRef]
- Song, H.; Li, G. Tourism demand modelling and forecasting—A review of recent research. Tour. Manag. 2008, 29, 203–220. [Google Scholar] [CrossRef]
- Song, H.; Li, G.; Witt, S.F.; Fei, B. Tourism Demand Modelling and Forecasting: How Should Demand Be Measured? Tour. Econ. 2010, 16, 63–81. [Google Scholar] [CrossRef]
- Song, H.; Qiu, R.T.; Park, J. Progress in tourism demand research: Theory and empirics. Tour. Manag. 2022, 94. [Google Scholar] [CrossRef]
- Suresh, M.; Bid, K.; Sangeetha, G.; Krishnan, N. Inbound international tourism development in India: A panel data analysis on its affecting factors. IEEE International Conference on Computational Intelligence and Computing Research, 2015; Available online: https://www.scopus.com/inward/record.uri?eid=2-s2.0-84965072205&partnerID=40&md5=c78f7a2b853471055ca3ac5b7713a9a0.
- Telfer, D.J.; Sharpley, R. Tourism and Development in the Developing World; Taylor & Francis: London, United Kingdom; ISBN, 2015. [Google Scholar]
- Timothy, D.J.; Boyd, S.W. Heritage Tourism in the 21st Century: Valued Traditions and New Perspectives. J. Heritage Tour. 2006, 1, 1–16. [Google Scholar] [CrossRef]
- Torres, R. Cancun’s tourism development from a Fordist spectrum of analysis. Tour. Stud. 2002, 2, 87–116. [Google Scholar] [CrossRef]
- Wasiaturrahma, W.; Rohmawati, H. Multicollinearity in Tourism Demand Model: Evidence from Indonesia. Econ. Dev. Anal. J. 2021, 10, 54–69. [Google Scholar] [CrossRef]
- Wooldridge, J. M. Econometric Analysis of Cross Section and Panel Data; MIT Press, 2010. [Google Scholar]
- World Tourism Organization (UNWTO). International Tourism Highlights, 2020 Edition; 2021. [Google Scholar] [CrossRef]
- Wu, Y.; Jia, Z.; Yu, T. Tourism and Green Development: Analysis of Linear and Non-Linear Effects. Int. J. Environ. Res. Public Heal. 2022, 19, 15907. [Google Scholar] [CrossRef]
- Wut, T.M.; Xu, J. (.; Wong, S.-M. Crisis management research (1985–2020) in the hospitality and tourism industry: A review and research agenda. Tour. Manag. 2021, 85, 104307–104307. [Google Scholar] [CrossRef]
- Xia, H.; Muskat, B.; Karl, M.; Li, G.; Law, R. Destination competitiveness research over the past three decades: a computational literature review using topic modelling. J. Travel Tour. Mark. 2024, 41, 726–742. [Google Scholar] [CrossRef]
|
Disclaimer/Publisher’s Note: The statements, opinions and data contained in all publications are solely those of the individual author(s) and contributor(s) and not of MDPI and/or the editor(s). MDPI and/or the editor(s) disclaim responsibility for any injury to people or property resulting from any ideas, methods, instructions or products referred to in the content. |
© 2025 by the authors. Licensee MDPI, Basel, Switzerland. This article is an open access article distributed under the terms and conditions of the Creative Commons Attribution (CC BY) license (http://creativecommons.org/licenses/by/4.0/).