
Submitted:
09 December 2025
Posted:
11 December 2025
You are already at the latest version
Abstract
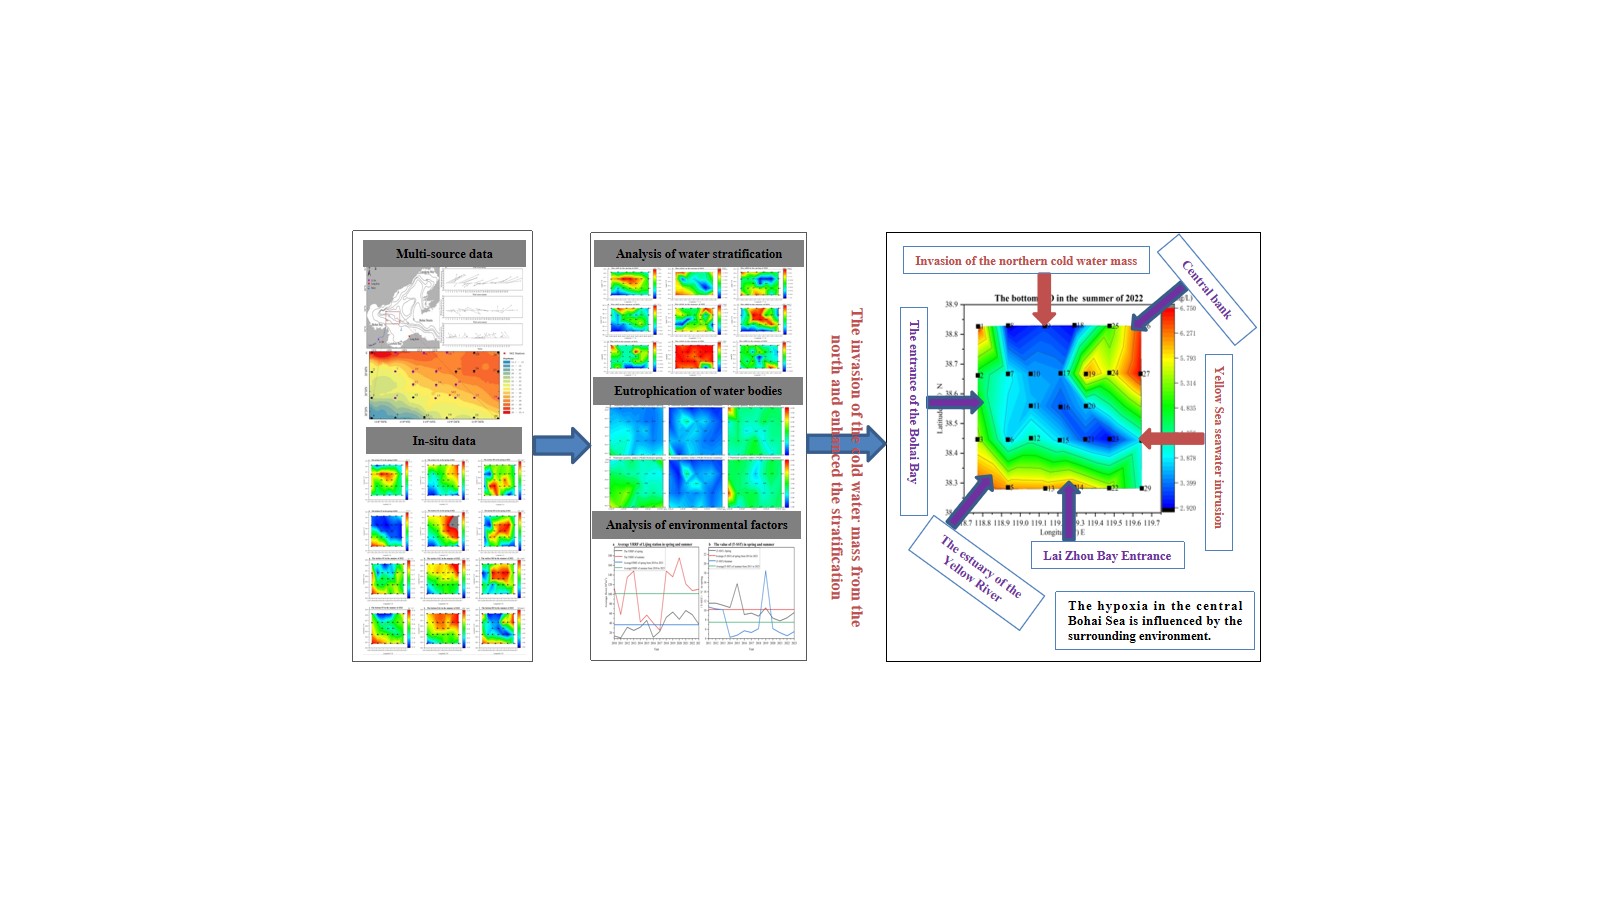
The central Bohai Sea (CBS) serves as a distribution center and wintering ground for the migration of economically important species of fish, shrimp, and crabs from the Yellow Sea and the BS. The frequency of hypoxia has gradually increased, posing a threat to the ecology of the CBS. Data from an on-site investigation of the cold water mass coverage area in the southern part of the BS in the spring, summer, and autumn of 2022 were an-alyzed to determine the relevant factors using stratification data and the nutritional status quality index. The results indicated that stratification was the leading cause of hypoxia. The 'boot-shaped' distribution of hypoxia in summer was primarily the result of the intrusion of cold and highly saline water in the northern part of the study area, as well as the intrusion of high-temperature and low-salinity water from the Yellow River estuary and the high salinity water in the northeast corner of the study area. The study found that the cold water mass in the northern part of the Bohai Sea invades the cold water mass in the southern part. This study provides novel insights into the formation and distribution of hypoxia in the CBS.
Keywords:
dissolved oxygen
; stratification
; sea temperature
; salinity
; hypoxia
; the central Bohai Sea
1. Introduction
Dissolved oxygen (DO) in seawater is not only the foundation for the growth and reproduction of marine organisms but also a crucial factor in biogeochemical cycles and a significant physical and chemical aspect of water bodies. DO is also an important indicator of environmental health. Hypoxia occurs when the rate of oxygen consumption in seawater exceeds the rate at which it is replaced. Many marine organisms are adversely affected when the DO concentration in seawater drops below 3–4 mg/L. At DO concentrations below 3 mg/L, fish begin to die, and the number of benthic organisms is significantly reduced. When the DO is completely consumed, i.e., oxygen-free or hypoxia, most marine life cannot survive [1,2,3,4,5,6,7,8,9].
Since the 1960s, the number of global oxygen-depleted zones has doubled each decade [3]. Over the past decade, at least six low-oxygen events have occurred in the BS during the summer. Frequent hypoxic events threaten the ecological environment of the BS.
The Bohai Sea (BS) is an internal sea of China, encircled on three sides by Liaoning Province, Hebei Province, Tianjin Municipality, and Shandong Province. The BS is connected to the Yellow Sea through the Bohai Strait. It receives a large amount of organic matter carried from the land by seven major river systems, including the Yellow River and the Haihe River, making it a natural fishery rich in seafood such as shrimp, crabs, and croakers. The central deep-water area of the BS is both a gathering place for economically important marine species migrating between the Yellow Sea and the BS and the wintering grounds for local fish and shellfish. With the rapid economic development of the Bohai Rim region and urban expansion, the flux of land-based pollutants entering the sea has increased. The construction and rapid growth of coastal ports have gradually expanded maritime trade capacity, while ship transportation has increased the risk of oil spills. Thus, the rapid development of the coastal economy has brought pressure on the environment of the central BS.
The BS is a representative semi-enclosed bay. Clarifying the causes and mechanisms of hypoxia generation in this area is important for prevention, control, and early warning. Currently, studies of the mechanisms of hypoxic production generally focus on seawater stratification, eutrophication, freshwater inflow, and seabed topography. These mechanisms may vary among regions; the main arguments regarding the mechanisms of the BS are primarily concentrated on seawater stratification and biochemical processes, such as biological degradation and mineralization.
In a 2000 study, Bao et al. [10] observed two dual-center cold-water masses at the bottom layer formed in the north and south depressions of the shallow banks in the CBS during summer. Zu et al. [11] found that these dual-center cold-water masses were characterized by low temperature, high salinity, and low DO compared with the surrounding areas. The authors found that over the nearly 20 years from 1978 to 2000, the salinity (SAL) of the BS demonstrated an upward trend, while the DO content showed a downward trend. Li et al. [12] found a small (60–80 km2) hypoxic zone at the mouth of the Daliao River. Zhai et al. [4] surveyed DO and pH at 20–23 stations in and around the central BS. The results showed a significant decrease in DO, as well as acidification, at the bottom layer of an area, with a water depth of 20–35 m near the shore in the northwestern and northern regions. The lowest DO value was 3.3–3.6 mg/L near the shore in the north. During summer surveys of the BS in 2014, Zhang et al. and Jiang et al. [13,14] found that the total areas of the double-center cold-water masses with DO less than 3 mg/L were approximately 4.2×10³ km2 and 1.2×10³ km2, with the lowest value reaching 2.3 mg/L. The authors concluded that the physical mechanism of stratification was the main cause of the hypoxic conditions. Wei et al. [15] analyzed 30 years (1976–2006) of climatic DO data and found that the DO levels in the double-center cold-water masses at the low-lying areas of the BS were lower than those in the surrounding areas. Wei et al. [16] utilized a national marine standard profile measurement dataset (1978–2018) at the station near Liaodong Bay to analyze the characteristics of the sea in August. The variation in DO from 1978 to 2005 ranged from 4.67 to 7.46 mg/L, with an average of 6.08 ± 0.74 mg /L. Severe oxygen depletion occurred from 2006 to 2018, where the DO varied from 2.88 to 6.88 mg/L, with an average value of 4.42±1.02 mg/L. This average value was 1.66 mg/L lower than that from 1978 to 2005. Through analysis of observational data from the summers of 2014 and 2019, Li et al. [17] discovered that the area experiencing hypoxia in 2019 had expanded from the shallow region on the west side of the shoal in 2014 to the areas outside the Yellow River estuary and the mouth of Laizhou Bay. In the summer of 2020, Cao et al. [18] observed a hypoxic area of approximately 1.3×10³ km2 in the northeastern bottom sea area (38°N) of the Yellow River estuary. Guo et al. [19] analyzed survey data from the CBS over several years, finding that June was the optimal time to predict hypoxic events and that August was the most convenient time to observe hypoxic events in the CBS. The stations where hypoxic events occurred in August of the same year were successfully predicted using the water stratification threshold measured in June.
In conclusion, the DO level in the BS has gradually decreased with rising temperatures. Hypoxic areas often occur in the areas covered by the dual-center cold-water masses of the BS and are continuously expanding. Many researchers believe that stratification of water bodies is one of the most important causes of hypoxia in the BS. The mineralization and degradation of organic matter contribute to the formation of hypoxia [13,14,20].
To examine the occurrence mechanisms of hypoxia in the central BS, we set up 29 stations in the cold-water mass areas in the southern part of the central BS in 2022 to analyze seasonal variation in DO and stratification factors. We focused on analyzing the distribution characteristics of hypoxia in summer, exploring its influencing factors and the cause of the phenomenon. Our analysis provides data and methodological support for protecting the wintering grounds of the distribution centers for the migratory movement of economically important fish, shrimp, and crabs in the Yellow Sea and BS.
2. Materials and Methods
2.1. Materials
The 2022 survey was conducted around station M2 in the CBS (Figure 1a), where hypoxic events have frequently occurred [13], with 29 stations arranged in dense and sparse patterns. In the dense area, the horizontal interval between stations was 7.5 nautical miles, and the vertical interval was 6.5 nautical miles (Figure 1c), while the average interval for other stations was about 10 nautical miles. Water quality parameters (surface, middle, and bottom layers) were measured at all stations, along with sediment, biological, and ecological parameters at 23 stations (Figure 1c and Table 1). The survey range was expanded by 20 nautical miles to the left and right and more than 10 nautical miles up and down compared with the location of the hypoxic area in the CBS surveyed by Jiang et al. [14] in 2014. The study area is adjacent to the Bohai Gulf to the west and the Laizhou Gulf to the south. The southwest corner of the study area (Figure 1) was near the Yellow River estuary; the northeast corner was near the central bank; the east faced the Bohai Strait; and the north was near the cold-water mass in the northern BS. In Figure 1a, the blue flag in the lower right corner of the study area indicates the buoy location, and the purple-red and red markers represent the positions of Lijin Station and Longkou Station, respectively.
The sea temperature (ST), SAL, DO, and pH values observed at the 29 stations in the spring, summer, and autumn of 2022 were obtained using a multi-parameter water quality analyzer (YSI, Inc., Yellow Springs, OH, USA). SAL was calibrated using standard seawater before each voyage. The water pH was calibrated using a standard buffer solution, and the DO was calibrated using the water-saturated air method. The density (Den) of seawater was calculated using the UNESCO 1983 (EOS 80) polynomial [21].
Chemical oxygen demand (COD) was measured via titration with acidic potassium permanganate. Phosphate (DIP), nitrite, and chlorophyll-a (Chl-a) were determined using spectrophotometry [22]. The ammonium salt concentration was determined using the sodium hypobromate oxidation method. Nitrate was determined using the C reduction method. Nitrite, nitrate, and ammonia nitrogen were combined into dissolved inorganic nitrogen (DIN).
The wind field data were taken from the hourly average data of buoys in the adjacent survey area in the central BS. The air temperature (T) data were taken from Longkou Meteorological Station, while the monthly flux of the Yellow River into the sea was from the Lijin Hydrological Station of the Yellow River. The water depth data in the study area were obtained from ship observations (echo sounder).
According to the national water quality testing standard (Seawater Water Quality Standard 1546974673), when DO is less than 4 mg/L, the seawater reaches Class IV, which is considered severely polluted. In this study, a DO level of ≤ 4 mg/L was used as the threshold for determining the occurrence of hypoxia in the central BS.
2.2. Methods
Stratification is a phenomenon where water bodies form apparent layers in the vertical direction due to factors such as ST, SAL, and Den. Water stratification can thus hinder the exchange of material between the upper and lower layers of water bodies. Therefore, we described the size of the stratification using the ST difference (△ST) between the surface and bottom layers, the SAL difference (△SAL), and the Den difference (△Den). The degree of acidification was measured by the magnitude of △pH.
The Nutritional Status Quality Index (NQI) was calculated based on the concentrations of chemical oxygen demand (COD), dissolved inorganic nitrogen (DIN), dissolved inorganic phosphorus (DIP), and chlorophyll a (Chl-a) in the water.
3. Results
3.1. Analysis of Water Quality Survey Data in the Spring, Summer, and Autumn of 2022
In 2022, investigations of water quality (SAL, ST, DO, pH) were conducted in the spring, summer, and autumn at 29 stations in the study area (Figure 1).
The analysis of seawater SAL revealed that the overall salinity trends in the surface, middle, and bottom layers were consistent, with SAL in spring > summer > autumn (Figure 2a–c).
ST demonstrated the following order: summer > spring > autumn. The overall order of the middle ST was summer > spring > autumn, and that of the bottom ST was summer > autumn > spring (Figure 2d–f).
The DO level in surface water was relatively high in spring, followed by summer, and the lowest in autumn (Figure 2g). The DO levels in the middle and bottom layers of the water body were the highest in spring, followed by autumn, and the lowest in summer (Figure 2h–j).
Due to the abnormally high pH values measured at stations 12, 15, 21, 22, 23, 28, and 29 during summer, the average pH of the three layers was the highest in summer. If these abnormal pH values are excluded, the overall pH value of the surface water body tends to be higher in summer, followed by spring, and slightly lower in autumn. The pH value in the middle layer was slightly higher in spring, followed by summer, and slightly lower in autumn. The pH value at the bottom layer was basically the same in spring and autumn and lower in summer.
3.2. Analysis of Surface and Bottom Water Quality Parameters in the Spring and Summer of 2022
Spring and summer surveys were conducted in the CBS from May 28 to June 6, 2022, and from August 28 to September 4, 2022. Strong winds passed through on September 1 and 2, during which ships took refuge in ports. The locations of the survey stations before and after the strong winds are shown in Figure 1c. The “~” symbol below the stations indicates observation stations after strong winds, while its absence indicates observation stations before the strong winds. The water depth in the study area ranged from 14 to 34 meters, gradually increasing from the southwest corner to the central region. The results of the water quality investigation are listed in Table 1.
The changes in the stratification factors △ST, △SAL, and△Den in Figure 3 show that stratification was the strongest in spring, followed by summer. This is because the investigation period took place from the end of August to the beginning of September, and stratification was in a weakening phase at that time. The stratification in autumn disappears because of the break-up of the seasonal thermocline [25]. The △pH changes shown in Figure 3d show that the greatest changes occurred in summer, with the bottom of the water body becoming acidic, followed by spring; in autumn, stratification disappeared, and the pH values at the surface and bottom were basically the same.
In the spring, the surface water in the central part of the study area displayed higher temperatures, with warm water from Bohai Bay entering the center of the study area (Figure 4a). Warm water invasions of the bottom layer occurred in areas near the Yellow River estuary, the mouth of Laizhou Bay, and the northeastern corner (Figure 4d). The SAL levels of the surface water at the Yellow River estuary and the mouth of Laizhou Bay were below 30.7 psu, while the levels in other areas were higher. However, the SAL levels of the surface water at stations 26 and 27 were significantly higher than 32 psu (Figure 4b). The SAL distribution at the bottom was similar to that at the surface, but the water entering from stations 26 and 27 was higher in SAL (>32.5 psu), and more stations were affected (Figure 4e). Except for stations 2, 3, 7, and 22, with 6.5 mg/L < DO < 7 mg/L, the other stations had DO values above 7.5 mg/L in the surface layer, and the high DO values were clearly from the mouth of Laizhou Bay (Figure 4c). The DO values > 8.7 mg/L were more densely distributed in the middle part of the bottom layer and higher than the values in the central part of the surface layer (Figure 4f).
The surface and the bottom ST levels were both derived from the intrusion of cold water from the north in summer (Figure 4g, j). The bottom temperature was more pronounced. The surface seawater in the central part of the study area was compressed by the warm waters from the entrance to Bohai Bay, the Yellow River estuary, the entrance of Laizhou Bay, and water from the northeastern corner (Figure 4g). The colder water was in the middle of the study area, and a significant intrusion of 24.5°C water came from the Bohai Strait direction at station 28 on the surface (Figure 4g). The bottom water also originated from cold water in the north and was compressed by the surrounding warm water, eventually moving toward station 28 (Figure 4j). The surface and bottom SAL levels were lower at the Yellow River estuary in summer (Figure 4h, k). High-SAL intrusions came from the northern part and northeast corners, extending from the northern part to station 28 (Figure 4k,j). The bottom intrusion was more pronounced, forming 50% high SAL area in the study area (Figure 4k). In the summer, the high DO (>8.5 mg/L) of the surface occurred in the northcentral region (Figure 4i).
In comparison, the low DO (< 4 mg/L) of the bottom from the northern part extended to station 28 (Figure 4l). The data indicate 14 stations with DO ≤4 mg/L, among which stations 8, 18, and 23 had DO < 3 mg/L, and stations 6, 7, 9, 10, 11, 15, 16, 17, 20, 21, and 28 were within the range of 3 mg/L < DO < 4 mg/L.
3.3. Comparison of Stratification Factors Before and After Hypoxia
The highest △ST values (△ST ≥7.4°C) were at stations 7, 10, 16, 17, 19, and 20 (Figure 5a), and the lowest △SAL values (< −0.57 psu) were at stations 7, 17, 20, 21, 23, and 28 (Figure 5b), all in the middle of the study area and the area covered by the summer hypoxic zone (2.92 mg/L < DO <3 .93 mg/L), except for the station 19. In summer, station 19 is not only affected by the water from the central bank of BS but also by the influence of strong winds passing through. The SAL at the bottom layer in spring was significantly higher than that at the surface layer, especially in the middle (Figure 5b). The bottom layer DO in the central area was higher than at the surface layer (Figure 5c). The highest △ST value in summer was in the northern part of the study area, with △ST >1.5°C (Figure 5d), and the trend was similar to that of the bottom layer DO (Figure 4l). There were lower △SAL values at stations 3, 6, 11, and 28, while there were high △SAL values from the directions of stations 1 and 26, as well as the mouth of the Yellow River and Laizhou Bay, moving toward the middle of the BS (Figure 5e). Hypoxia occurred at stations 8, 9, 11, and 18 in summer because the temperature and salinity stratification both intensified during this period. Stations 3 and 6 show intensified salinity stratification, but the temperature stratification is relatively weak. The high value of △DO > 4mg/L in summer was consistent with the distribution of hypoxia at the bottom during summer (Figure 5f). The △ST (△SAL) values in autumn were very low
(high), and stratification disappeared (Figure 5g, h). The DO level of the surface layer was higher than that of the bottom layer, and the △DO was smaller in autumn (Figure 5i). The △pH values in spring were relatively small. Essentially, the pH value of the surface layer was higher than that of the bottom layer (except for stations 1, 4, 5, 8, and 29; Figure 5j). The △pH values in summer were the largest among the three seasons.
Stations with △pH ≥ 2.4 were all located in the area affected by hypoxia, indicating that hypoxia caused acidification in the local bottom layer, consistent with the study by Zhai et al. [4]. However, the △pH value at station 12 was the lowest in summer (Figure 5k). This indicates that station 12 was relatively weak in terms of oxygen consumption during the organic matter mineralization and degradation processes. This also explains why station 12 did not experience hypoxia in the summer of 2022, even though stations 6, 12, and 15 are adjacent. In autumn, the pH value at the bottom layer recovered significantly, and the values at the surface and bottom layers gradually converged. The pH value at the surface layer was higher than that at the bottom layer (except for stations 6, 10, and 16; Figure 5l).
4. Discussion
4.1. Analysis of Eutrophication
This study adopted the Nutritional Status Quality Index (NQI) to analyze the degree of eutrophication in the study area.
In spring, the NQI values of the surface layer ranged from 1.63 to 2.72, except for at station 4 (3.41), and the values of the bottom layer ranged from 2.20 to 4.71 (Figure 6a,d). There were 14 stations with NQI ≥ 3, indicating a eutrophic state; furthermore, the NQI values of other stations were in the range of 2 < NQI < 3, indicating a moderately trophic state in spring. In summer, the NQI values of the surface layer ranged from 1.14 to 2.70, except for station 4 (3.31), and the NQI values of the bottom layer ranged from 1.11 to 2.88 (Figure 6b,e). There were 21 stations with an NQI less than 2. This indicates that the NQI values of the study areas in summer do not reach a state of eutrophication, and the seawater remains in an oligotrophic state. In autumn, the NQI values of the surface layer ranged from 2.31 to 5.74, while the values of the bottom layer ranged from 2.05 to 5.77 (Figure 6c, f). There were eight stations with NQI ≥ 3, indicating a eutrophic state, and 21 stations with 2 < NQI < 3, indicating a moderate trophic state in the surface. However, there were 16 stations with 2 < NQI < 3, indicating a moderate trophic state, and 13 stations with NQI ≥ 3, indicating a eutrophic state in the bottom layer.
In the summer of 2022, hypoxic events occurred in the study area; however, no eutrophication was observed in either the surface or bottom layers. In the spring of the same year, no eutrophication occurred on the surface layer, and only 14 stations at the bottom layer experienced eutrophication. In the autumn, eutrophication occurred at stations 8 and 13, respectively, at the surface and bottom layers.
In the three seasons of 2022, neither the percentage of stations in which the surface water showed eutrophication nor those on the seabed exceeded 50%, while there was no eutrophication in the bottom layer in the summer. This may be related to the government's implementation of the “Key Sea and Comprehensive Governance Campaign Plan” in 2022 (including the Bohai Sea). If pollution in the two bays and the Yellow River estuary becomes severe, this will inevitably affect the eutrophication in the central BS and aggravate the degree of hypoxia.
4.2. Analysis of Environmental Factors
The study area is influenced by the Yellow River runoff (YRRF), wind field, sea surface temperature (SST), and air temperature (T). Analysis of the data shown in Figure 1b revealed that the wind speed was lowest in the summer of 2022, followed by autumn, and highest in the spring. Figure 7a indicates that the YRRF values in spring and summer 2022 were higher than the multi-year average. However, compared with 2018–2023, the YRRF in 2022 was relatively low both in spring and summer, indicating that its influence on the study area was relatively average in 2022. Figure 7b illustrates the difference between air temperature and sea surface temperature (T-SST) in spring and summer from 2011 to 2023, with the SST derived from buoy data (processed by the Yantai Marine Center of the Ministry of Natural Resources) and the T from the Longkou Meteorological Station. The T-SST values in spring and summer 2022 were lower than the multi-year average. Compared with 2018–2023, the T-SST in 2022 was relatively low in both spring and summer, suggesting that the study area was less affected by abnormal climate in the spring and summer of 2022.
The analysis in §3.3 demonstrates that the high (low) values of △ST (△SAL) in the spring of 2022 could accurately predict the stations where hypoxia occurred in August of the same year. The stations where unexpected hypoxia occurred were those affected by the cold-water masses from northern stations (for example, stations 8, 9, and 18; hypoxia) and the warm high-SAL water from the central bank during summer (stations 19, 24, 25, 26, and 27, with observations after the passage of a strong wind; no hypoxia). This also provides a reasonable explanation for the accuracy of the prediction made in [19] regarding the occurrence of hypoxia in the central part of the Bohai Sea in the summer of 2022. In Figure 5k, the small red “boot-shaped” area represents the region with stronger acidification, meaning that the organic matter has undergone mineralization or degradation, and the oxygen consumption is relatively high. Seven stations were observed in this area after strong winds (9, 10, 11, 16, 17, 18, 20; Figure 1c), but they still experienced hypoxia.
5. Conclusions
Analysis of data from the 2022 spring, summer, and autumn surveys demonstrated that the order of SAL magnitude for both the surface and bottom layers was spring > summer > autumn. The order of ST magnitude for the surface layer was summer > spring > autumn, and for the bottom layer, it was summer > autumn > spring. The order of DO level for the surface layer was spring > summer > autumn, and for the bottom layer, it was spring > autumn > summer.
The hypoxic event in the summer of 2022 occurred in the deep-water area (22–31 m) in the middle of the study area, forming an area "in the shape of a boot," a pattern related to water being squeezed from Bohai Bay, the Yellow River estuary, Laizhou Bay, and the northeastern corner into the study area. The primary cause of the "boot-shaped" hypoxic zone was the influx of cold, highly SAL water from the north and cold water from the Yellow Sea,which enhanced the stratification effect of the region. This suggests a connection between the cold-water masses in the northern and southern parts of the BS during summer. This connection supports the formation and distribution of the hypoxic areas in the southern cold-water mass in the BS, contributing to the formation of the hypoxic zone in the central BS in 2022.
Research has confirmed that stratification data from the late spring and early summer can be used to predict the areas where hypoxia will occur in August of the same year[19]. The invasion of a northern cold-water mass in summer and changes in the surrounding environment can affect the accuracy of the prediction, but the main areas can be predicted accurately.
However, based on the literature and data from previous years, it remains unclear whether the northern cold-water mass has continuously invaded the southern cold-water mass of the central BS in summer. Whether such an invasion has any impact on the hypoxia of the northern cold-water mass should be addressed in future studies.
Author Contributions
Hansen Yue: writing—original draft preparation and methodology; Jie Guo: writing—review and editing, conceptualization, and resources; Chawei Houw: formal analysis and investigation; Yong Jin: data curation and validation. All authors have approved the final version.
Funding
This research was funded by the National Foundation of China (No. U2106211 and No. 42076197).
Institutional Review Board Statement
Not applicable for studies not involving humans or animals.
Data Availability Statement
The datasets used for this research are included in this study and are available upon request at https://www.scidb.cn/.
Acknowledgments
We thank LetPub (www.letpub.com.cn) and MDPI author services for its linguistic assistance during the preparation of this manuscript.
Conflicts of Interest
The authors declare no conflicts of interest.
Abbreviations
The following abbreviations are used in this manuscript:
| CBS | Central Bohai Sea |
| DO | Dissolved oxygen |
| BS | Bohai Sea |
| SAL | Salinity |
| ST | Sea temperature |
| Den | Density of seawater |
| COD | Chemical oxygen demand |
| DIP | Phosphate |
| Chl-a | Chlorophyll-a |
| DIN | Dissolved inorganic nitrogen |
| T | Air temperature |
| △ST | The ST difference between the surface and the bottom layers |
| △SAL | The SAL difference between the surface and the bottom layers |
| △Den | The Den difference between the surface and the bottom layers |
| △pH | The pH difference between the surface and the bottom layers |
| △DO | The DO difference between the surface and the bottom layers |
| NQI | Nutritional Status Quality Index |
| SST | Sea surface temperature |
| YRRF | Yellow River runoff |
References
- Diaz, R. J. Overview of hypoxia around the World. Journal of Environmental Quality 2001, Volume 30 (2), pp. 275–281. [CrossRef]
- Wu, R. S. S. Hypoxia: from molecular responses to ecosystem responses. Marine Pollution Bulletin 2002, Volume 45 (1–12), pp. 35–45. [CrossRef]
- Vaquer-Sunyer, R. C.; Duarte, M. Thresholds of hypoxia for marine biodiversity. Proceedings of the National Academy of Sciences of the United States of America 2008, Volume 105 (40), pp. 15452–15457. [CrossRef]
- Zhai, W. D.; Zhao, H. D.; Zheng N.; Xu, Y. Oxygen consumption and acidification of the bottom layer in the north - western and northern coastal waters of the Bohai Sea in summer 2011. Chinese Science Bulletin (in Chinese) 2012, Volume 57 (9), pp. 753–758. [CrossRef]
- Zhang, J.; Gilbert, D.; Gooday, A. J.; Levin, L.; Naqvi, S. W. A.; Middelburg, J. J.; Scranton, M.; Ekau, W.; Pena, A.; Dewitte, B.; Oguz, T.; Monteiro, P. M. S.; Urban, E.; Rabalais, N. N.; Ittekkot, V.; Kemp, W. M.; Ulloa, O.; Elmgren, R.; Escobar-Briones, E.; Van der Plas, A. K. Natural and human-induced hypoxia and consequences for coastal areas: synthesis and future development. Biogeosciences 2010, Volume 7, pp. 1443–1467. [CrossRef]
- Xie, X. W.; Yuan, H. M.; Song, J. M.; Duan, L. L.; Liang, X. M.; Wang, Q. D. ; Ren, C. Z. ; Wang,Y. Q. Response of redox sensitive elements to changes of sedimentary environment in core sediments of seasonal low-oxygen zone in East China Sea. Acta Oceanologica Sinica 2020, Volume 42, pp. 30–43. http:// doi: 10.3969/j.issn.0253-4193.2020.02.004.
- Skagseth, Ø.; Oppedal, F.; SØiland, H.; Hvas, M. Measured oxygen levels in Norwegian waters and implications for future offshore Atlantic salmon aquaculture.Scientific Report 2025,Volumn 15,pp. 29416 . [CrossRef]
- Piehl, S.; Carstensen, J.; Neumann, T.; Vock, C.Predicting historical oxygen deficiency areas in the western Baltic Sea: A multi-model approach. Marine Pollution Bulletin 2025, Volumn 221,pp.118464 . [CrossRef]
- Wolf, S.; Jayawickrama, C.; Carlson, C.A.; Deutsch, C.; Davis, E.W.; Daniels, B.N.; Chan, F.; Giovannoni, S.J. Microbial carbon oxidation in seawater below the hypoxic threshold.Scientific Report 2025, Volum 15, pp.2838. [CrossRef]
- Bao, X. W.; Wan, X. Q.; Wu, D. X.; Guo, X. S. Hydrologic characteristics of the end summertime in 2000 and early wintertime in 2001 in the Bohai Sea. Acta Oceanologica Sinica 2004, Volume 26(1), pp. 14–24. https://qikan.cqvip.com/Qikan/ Article/Detail?id=9146497.
- Zu, T. T.; Bao, X. W.; Xie, J. Distribution and variation trends of the environmental factors in the central section of the Bohai Sea. Periodical of Ocean University of China (in Chinese) 2005, Volume 35(6), pp 889–894. https://lib.cqvip.com/Qikan/Article/ Detail?id=20638405.
- Li, Y. Y.; Wang, Z. M. The Relation among Dissolution Oxygen (DO) to COD, Inorganic Nitrogen, Reactive Phophat and Primary Yied-Power in the Liaodong Gulf and Seaport of Daliaobe. Enviromental Monitoring in China 2006, Volume 22(3), pp.70–72. https://lib.cqvip.com/Qikan/Article/Detail?id=22344484.
- Zhang, H.; Li, Y. F.; Tang, C.; Zou, T.; Yu, J.; Guo, K. Spatial characteristics and formation mechanisms of bottom hypoxia zone in the Bohai Sea during summer. Chinese Science Bulletin 2016, Volume 61 (14), pp. 1612 – 1620. [CrossRef]
- Jiang, T. Y.; Xu, C.; Liu, X.; Zhang, Y.; Ding,D. S.; Sun, X. M.; Chen, J. F.; Chen, B. J.; Zhao, J.; Qu, K. M. Report on the occurrence of hypoxia in the central Bohai Sea. Progress in Fishery Sciences 2016, Volume 37(4), pp. 1-6. [CrossRef]
- Wei, Q. S.; Wang, B. D.; Yao, Q. Z.; Liang, X.;. Sun, J. C; Ming, X.; Yu, Z.G. Spatiotemporal variations in the summer hypoxia in the Bohai Sea (China) and controlling mechanisms. Martine Pollution Bulletin 2019, Volume 138 (2019), pp. 125 -134. [CrossRef]
- Wei, H.; Zhao, L.; Zhang, H. Y.; Lu,Y. Y.; Yang, W.; Song, G. S. Summer hypoxia in Bohai Sea caused by changes in phytoplankton community. Canadian Science Anthropocene Coasts 2021, Volume 4(1), pp. 77-86. dx.doi.org/10.1139/ anc-2020-0017.
- Li, Z. C.; Wei, H.; Zhang, H. Y.; Zhang, H. D.; Zheng, N.; Song, G. S. The Interannual Difference in Summer Bottom Oxygen Deficiency in Sea. Oceanologia ET Limnologia Sinica 2021, Volume 53 (3), pp. 601-613. http://doi:10.11693/hyhz20200800227.
- Cao, J.; Wang, Y.; Liu, X. Y. ; Zhou, Y. R.; Liu, Y. L.; Yuan, Y. Analysis on the causes of hypoxia in the bottom of the central Bohai Sea in summer 2020. Marine Environmental Science 2023, Volume 42(2), pp. 254–261. https://qikan.cqvip.com/Qikan/ Article/Detail?id=7109441951.
- Guo, J.; Ji, D. S.; Zheng, X. Y.; Li, Y. F.; Tang, H. T.; Hou, C. W. Stratification in central Bohai Sea and how it has shaped hypoxic events in summer. Acta Oceanologica Sinica 2024, Volume 43(9), pp. 93–104.
- Guo, J.; Jin, Y. ; Liu, S. W.; Li, T.; Ji, D. S.; Hou, C. W.; Tang, H. T. Investigation of the causes and mechanisms of hypoxia in the central Bohai Sea in the summer of 2022. Marine Pollution Bulletin 2024, Volume 206, pp. 116710. [CrossRef]
- Fofonoff, C. N.; Millard, Jr. R. C. Algorithms for computation of fundamental properties of seawater. UNESCO Technical Papers in Marine Science 1983, Volume 44, pp,1-53. Paris, France: Unesco, 53.
- Haberer, J. L.; Brandes, J. A. A high sensitivity, low volume HPLC method to determine soluble reactive phosphate in freshwater and saltwater. Marine Chemistry 2003, Volum 82(3-4), pp. 185–196. [CrossRef]
- Chen, Y. W.; Wang, X.; Cai, M. H. Meizhou bay marine nutrition status evaluation. Marine Environmental Science 1999, Volume 18(3), pp. 39-42. https://max.book118.com/html/2017/0530/110506660.shtm.
- Bian, J. Y.; Yuan, L.; Wang, Q.; Jiang, J. M.; Li, J. Y.; Zhuang, Y. ; Xue, J. Z.; Wu, H. X. Analysis of the trend of water quality and eutrophication in the deep waters bay of Yangshan. Marine Science Bulletin 2013, Volume 32(1), pp. 107-112. https://d.wanfangdata.com.cn/periodical/hytb201301016.
- Kuss, J.; Gräwe, U.; Cahill, B.; Mohrholz, V.; Naumann, M.; Mars, R.; Krüger, S.; Schulz-Bull, D.E.; Waniek, J.J. Highly variable bottom water oxygen concentration in the shallow Arkona Basin (Baltic Sea). Journal of Marine Systems 2025, Volum252, pp.104134. [CrossRef]
Figure 1.
(a) Survey location in the central BS in 2022. (b) A wind vector map for spring, summer, and autumn in the study area. (c) Study area and real-time observation stations. The triangles represent the 29 water quality element stations; the circles represent water quality, sediment, and biological/ecological elements, involving 23 stations; purple represents stations with hypoxia in summer; black represents stations without hypoxia; and “~” below the stations indicates observation stations after strong winds, while no “~” below the stations indicates observation stations before strong winds. The red star represents the M2 station.
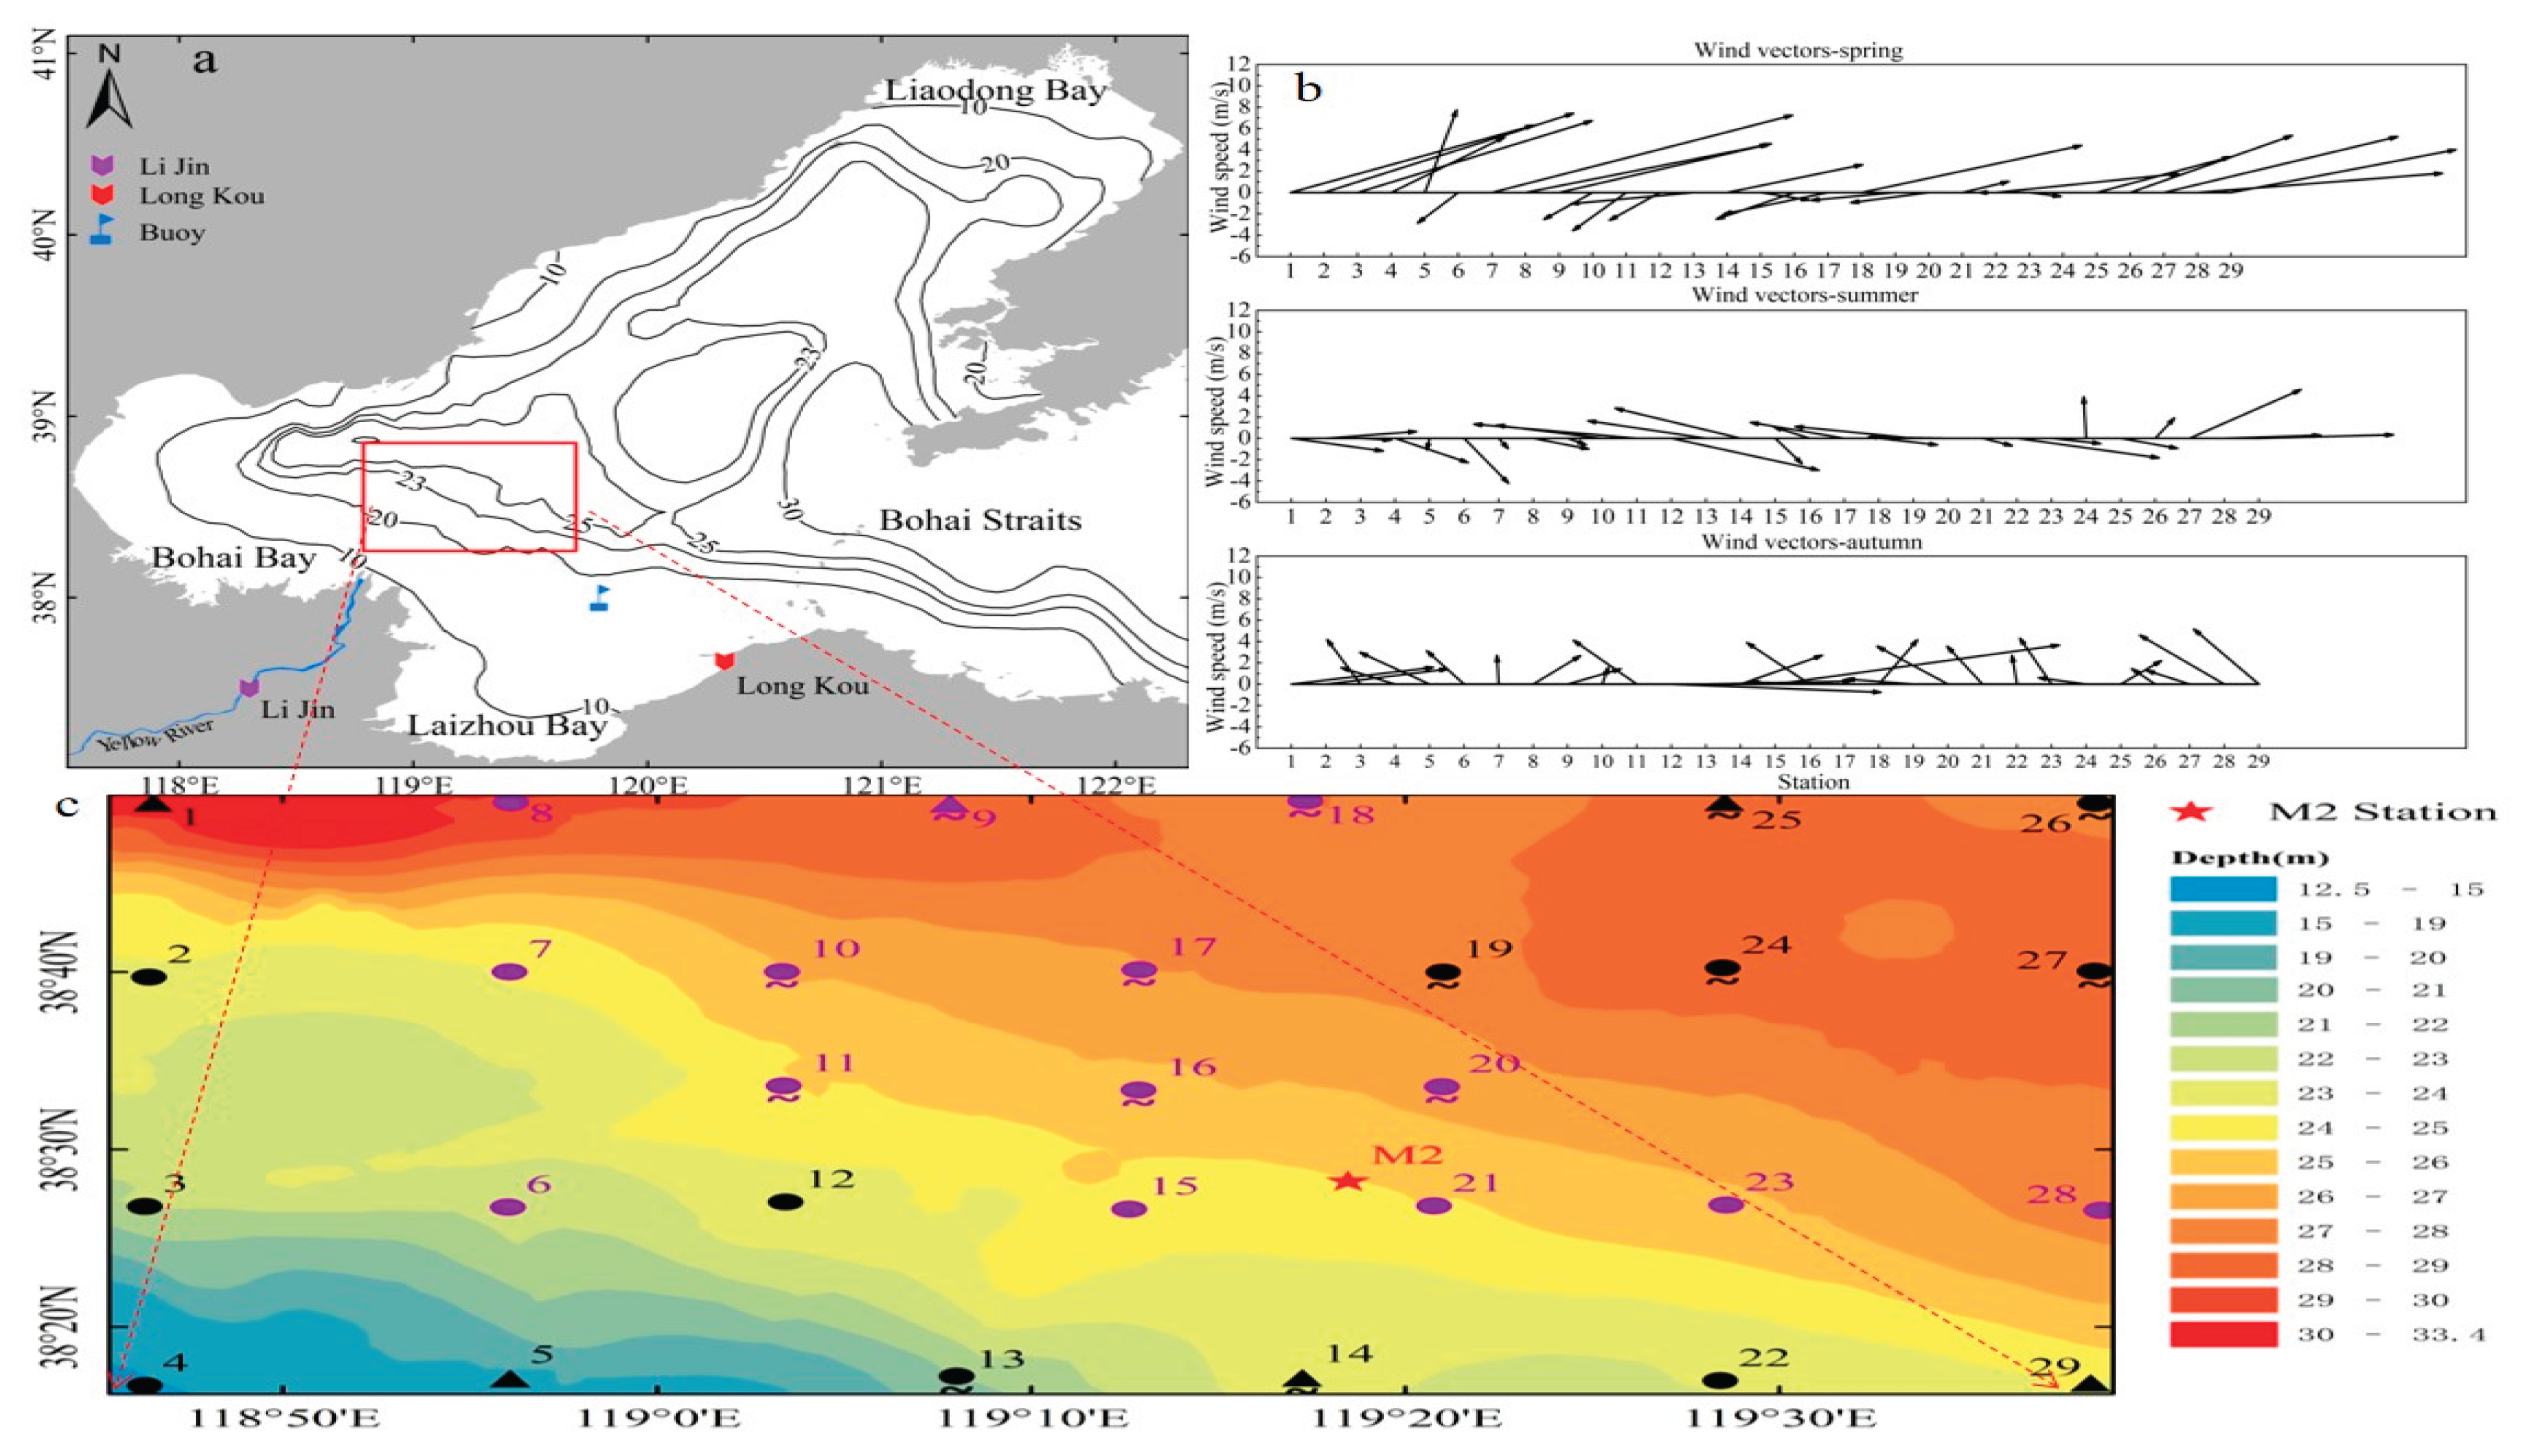
Figure 2.
A comparison of water quality data in spring, summer, and autumn of 2022. (a–c) Comparison of SAL in the surface, middle, and bottom layers; (d–f) comparison of ST in the surface, middle, and bottom layers; (g–i) comparison of DO in the surface, middle, and bottom layers; (j–l) comparison of pH in the surface, middle, and bottom layers.
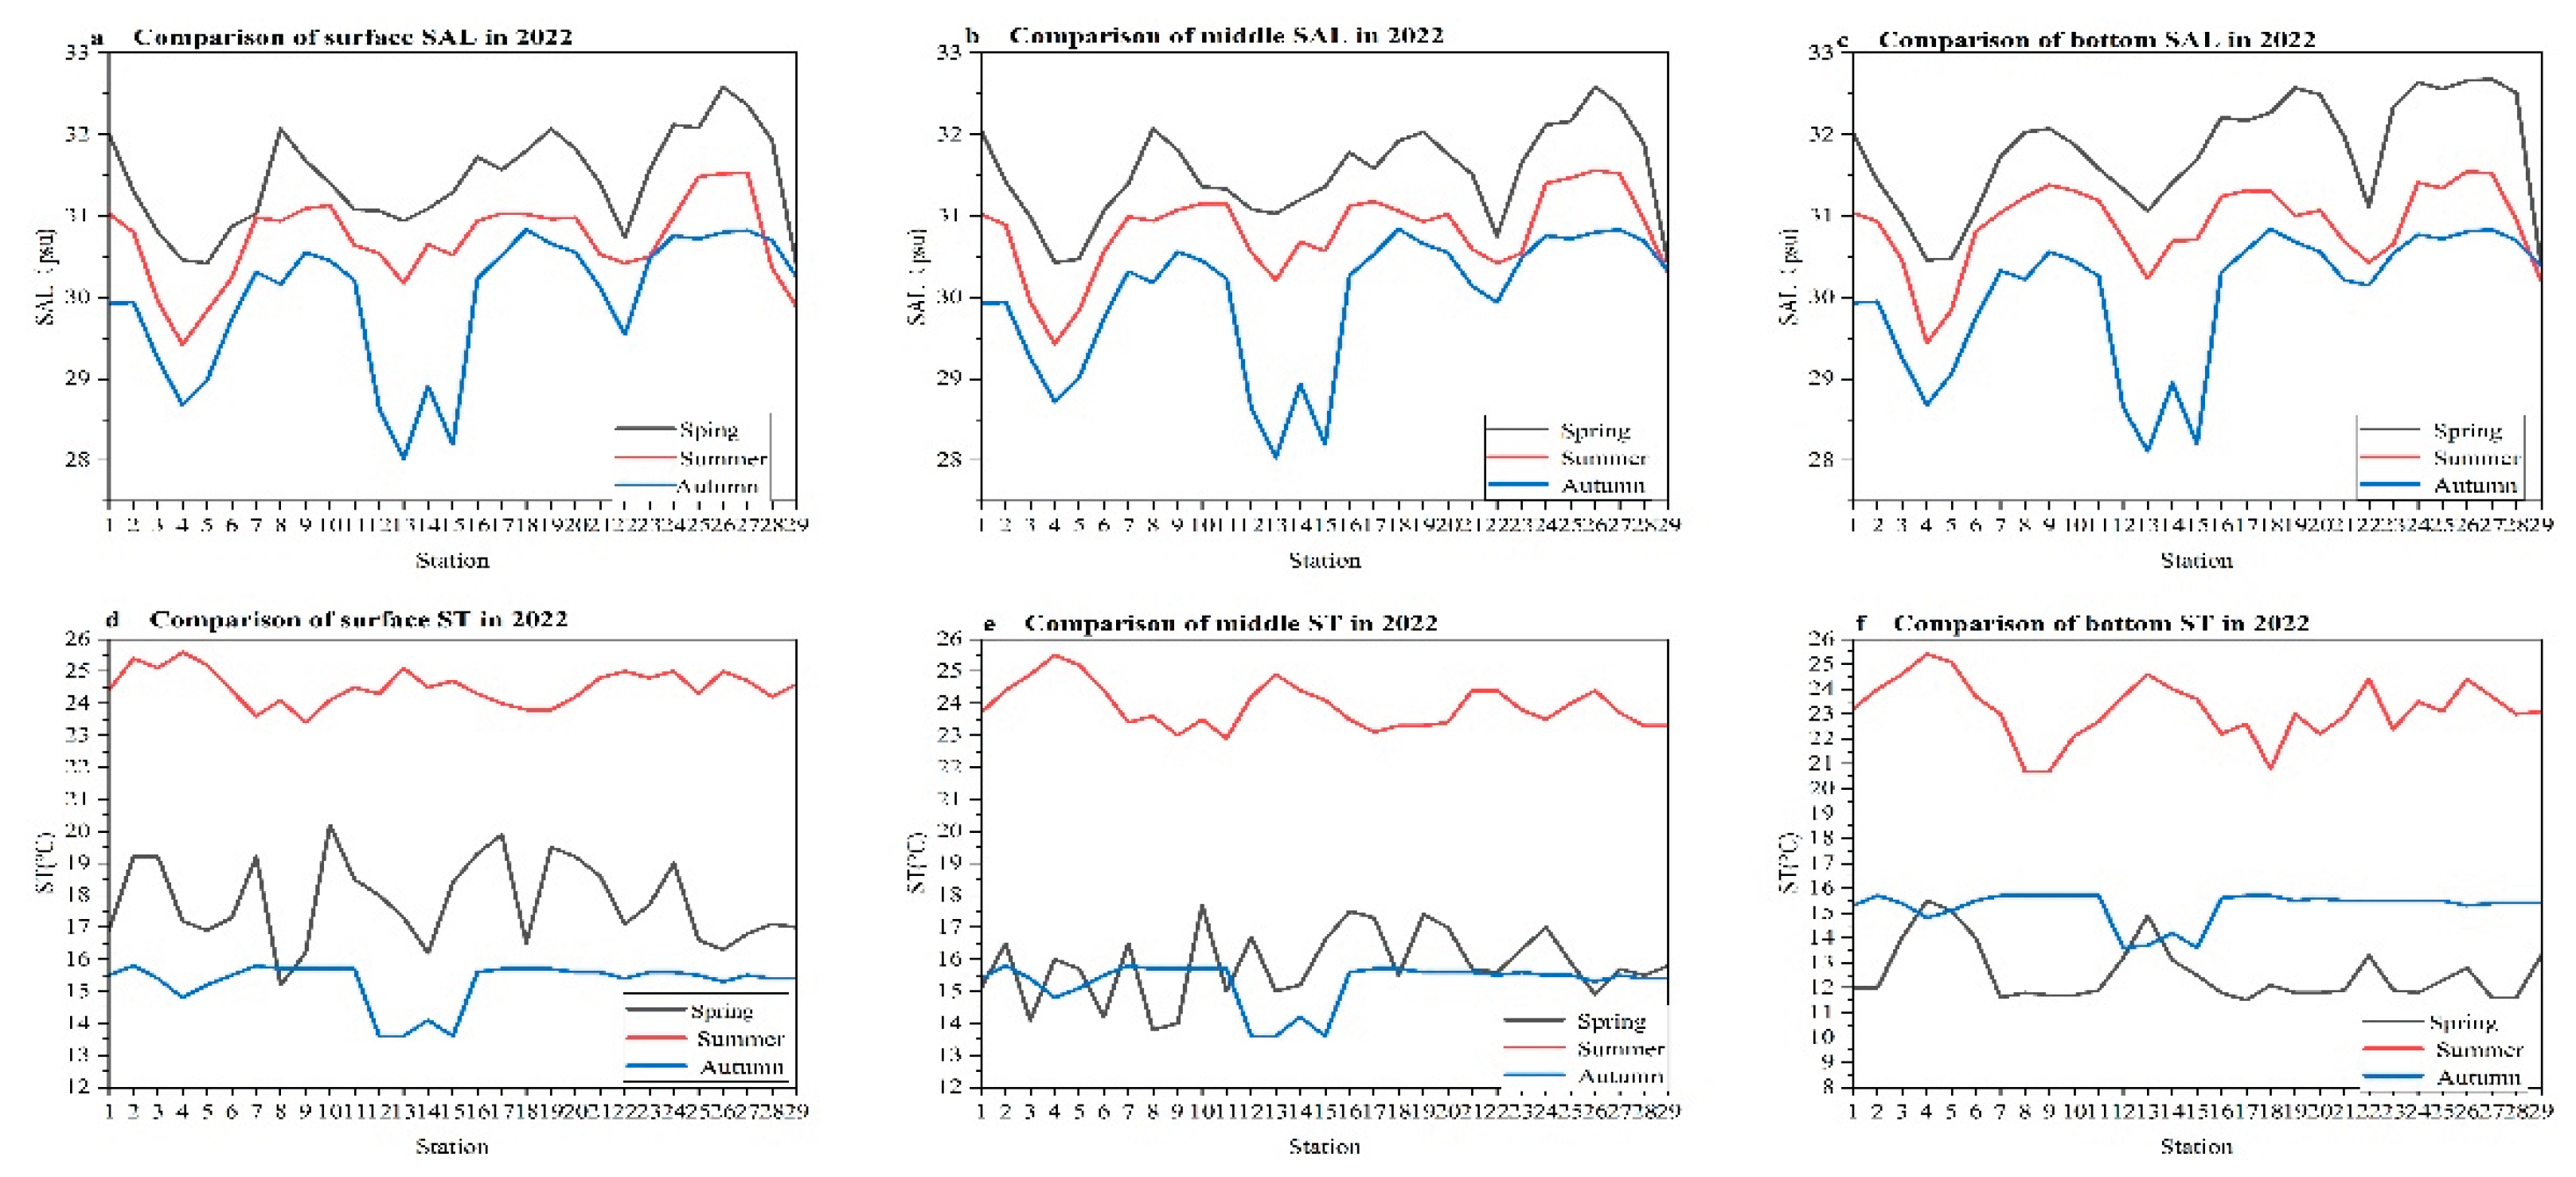
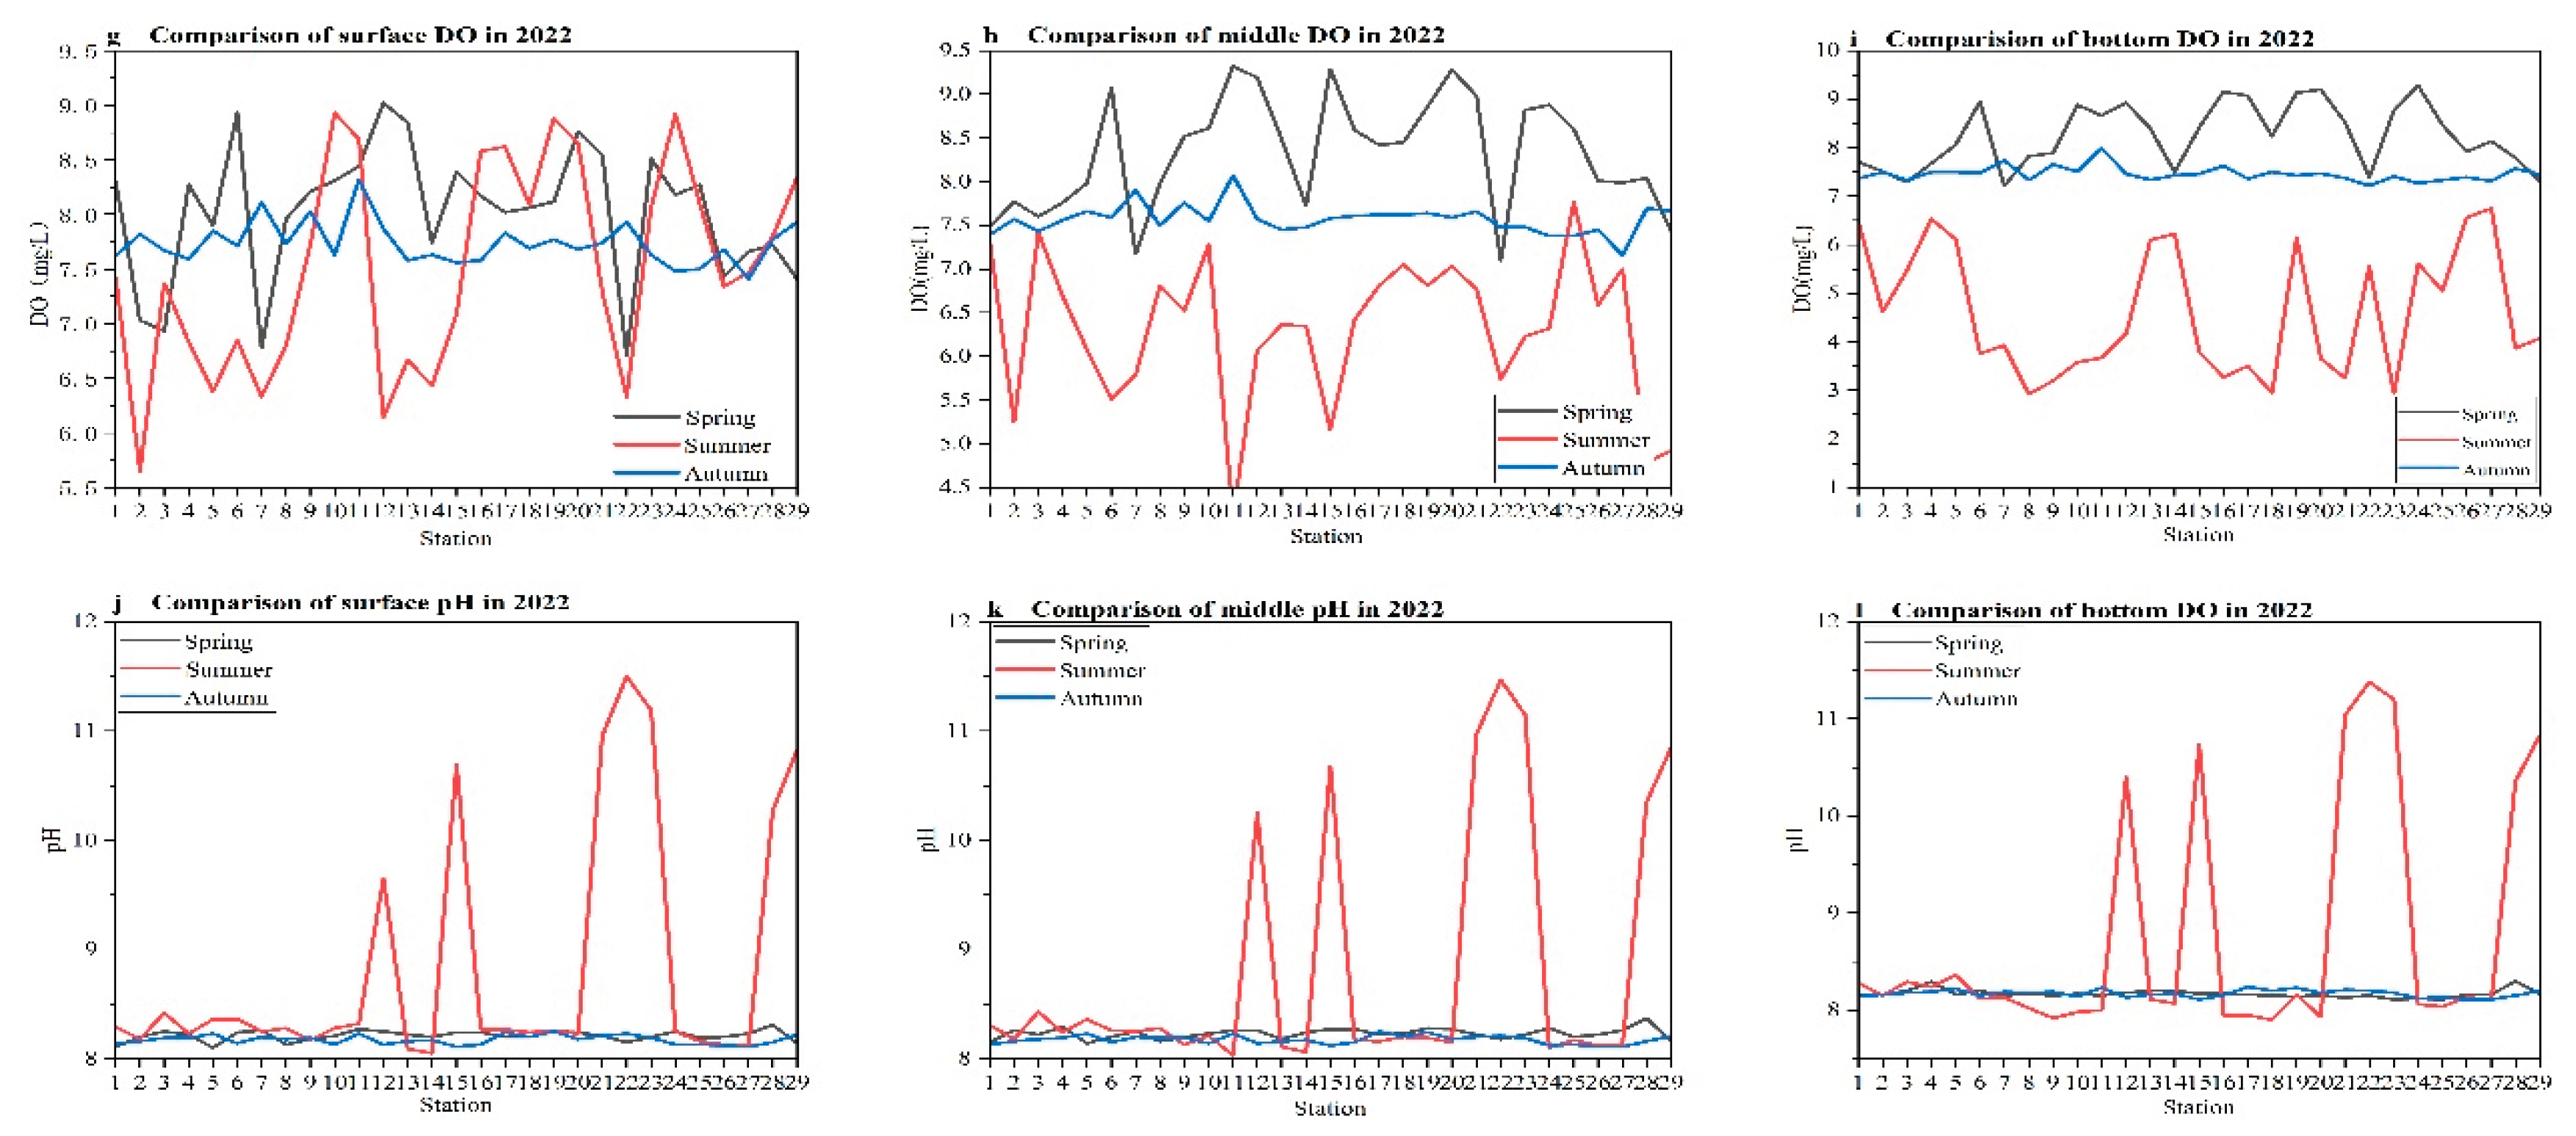
Figure 3.
Comparison of △ST, △SAL, △Den, and △pH in spring, summer, and autumn.
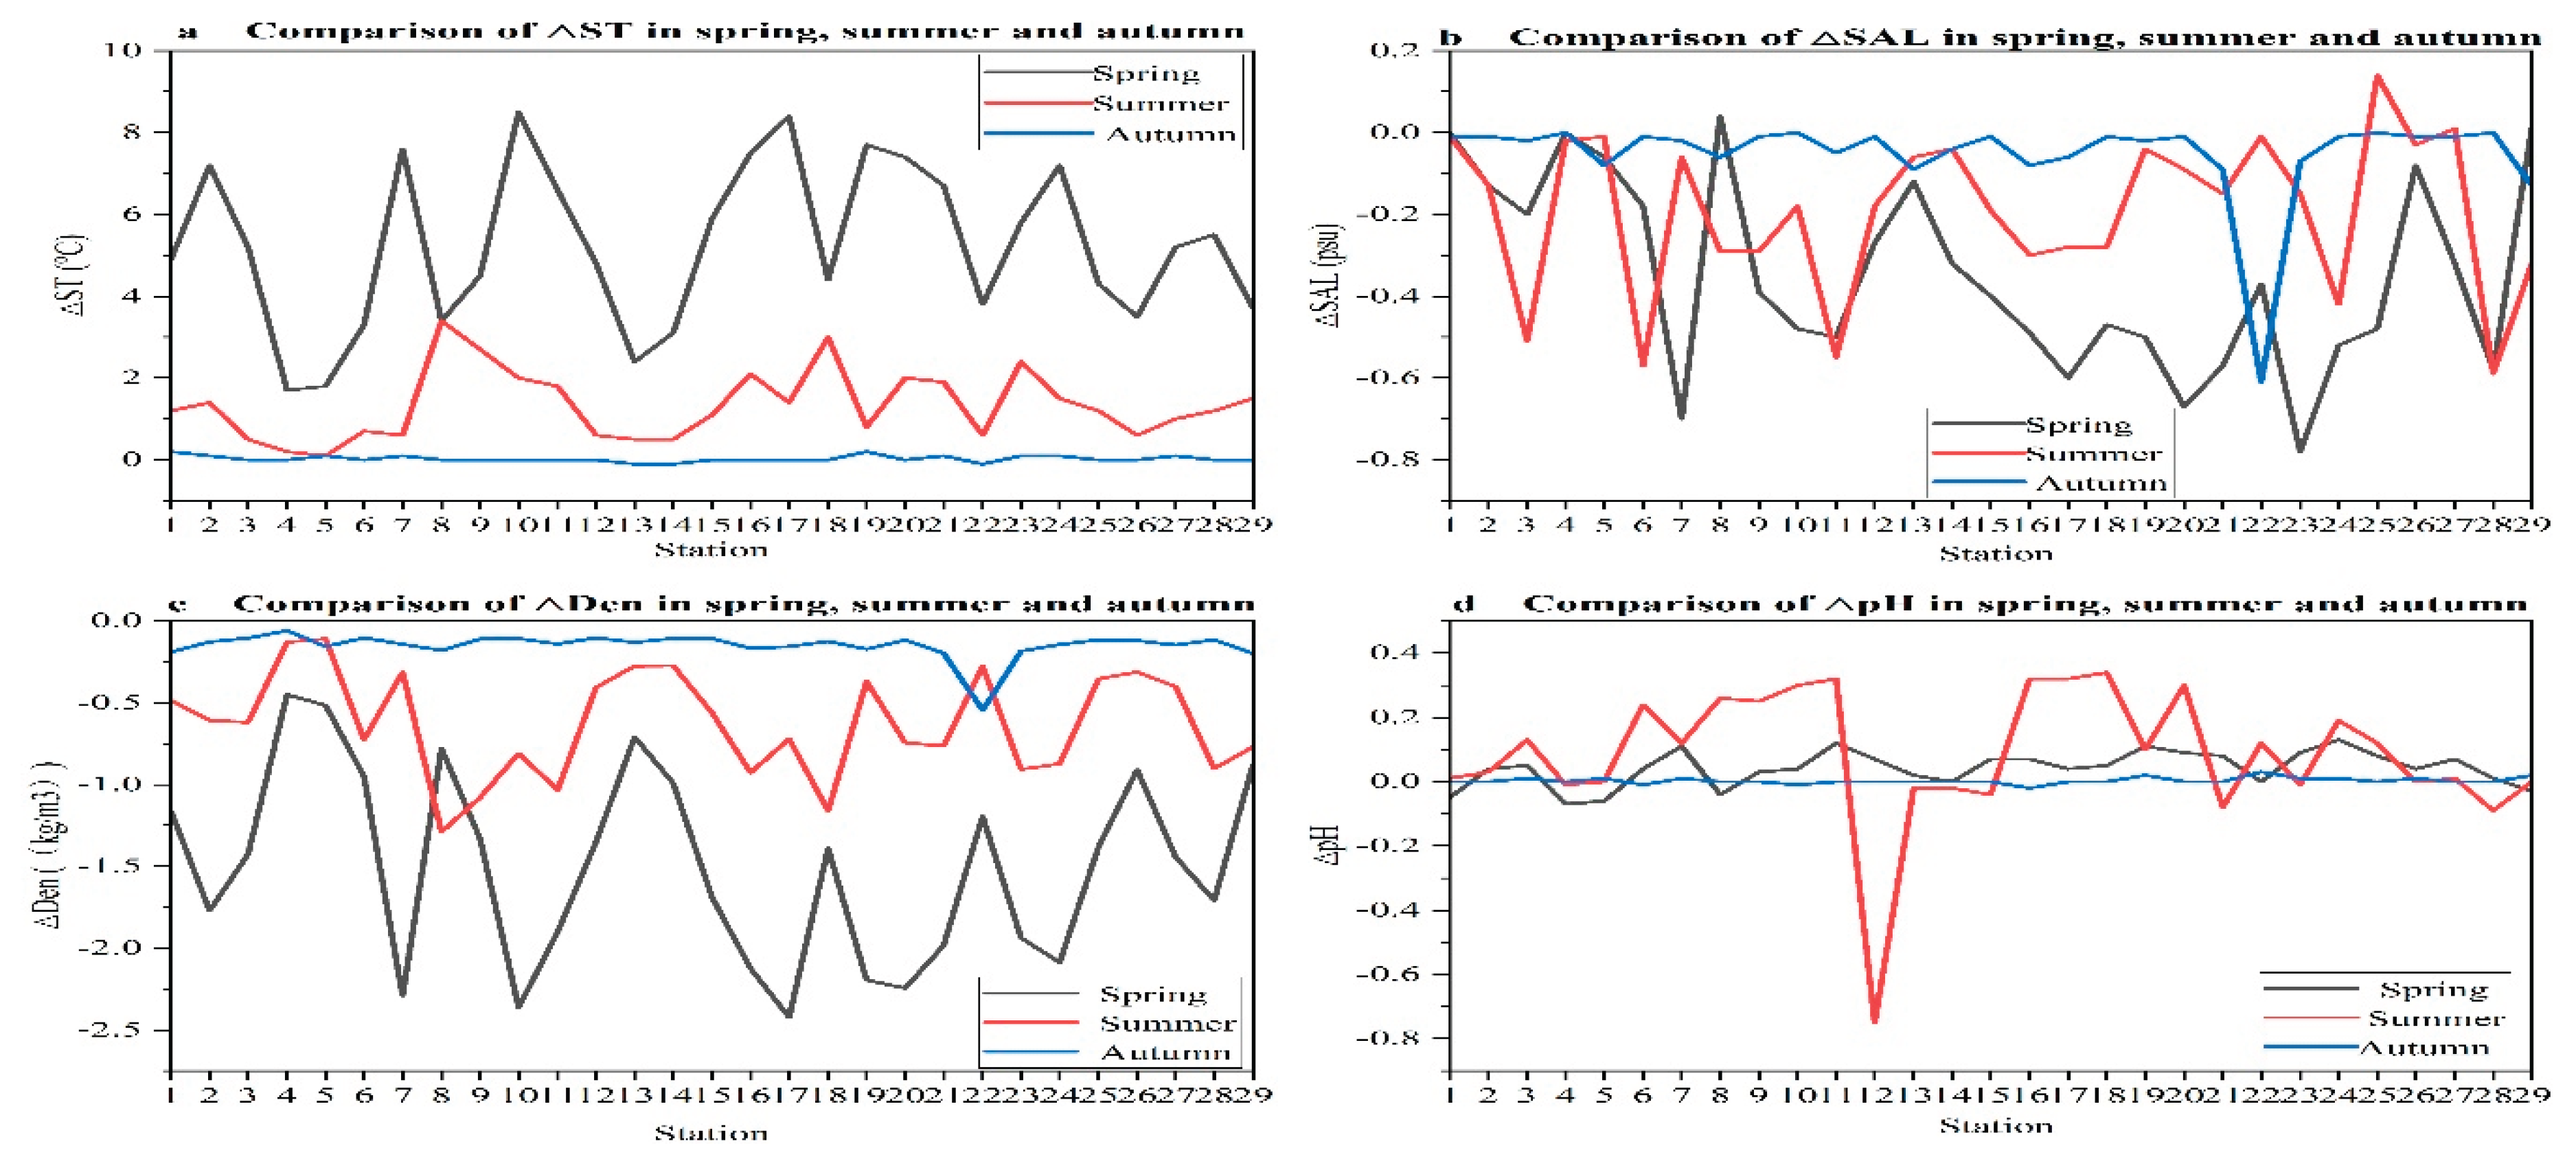
Figure 4.
Distribution of the surface and bottom layer ST, SAL, and DO values in spring and summer 2022. (a–c) Distribution of surface in spring; (d–f) distribution of bottom in spring; (g–i) distribution of surface in summer; (j–l) distribution of bottom in summer.
Figure 4.
Distribution of the surface and bottom layer ST, SAL, and DO values in spring and summer 2022. (a–c) Distribution of surface in spring; (d–f) distribution of bottom in spring; (g–i) distribution of surface in summer; (j–l) distribution of bottom in summer.
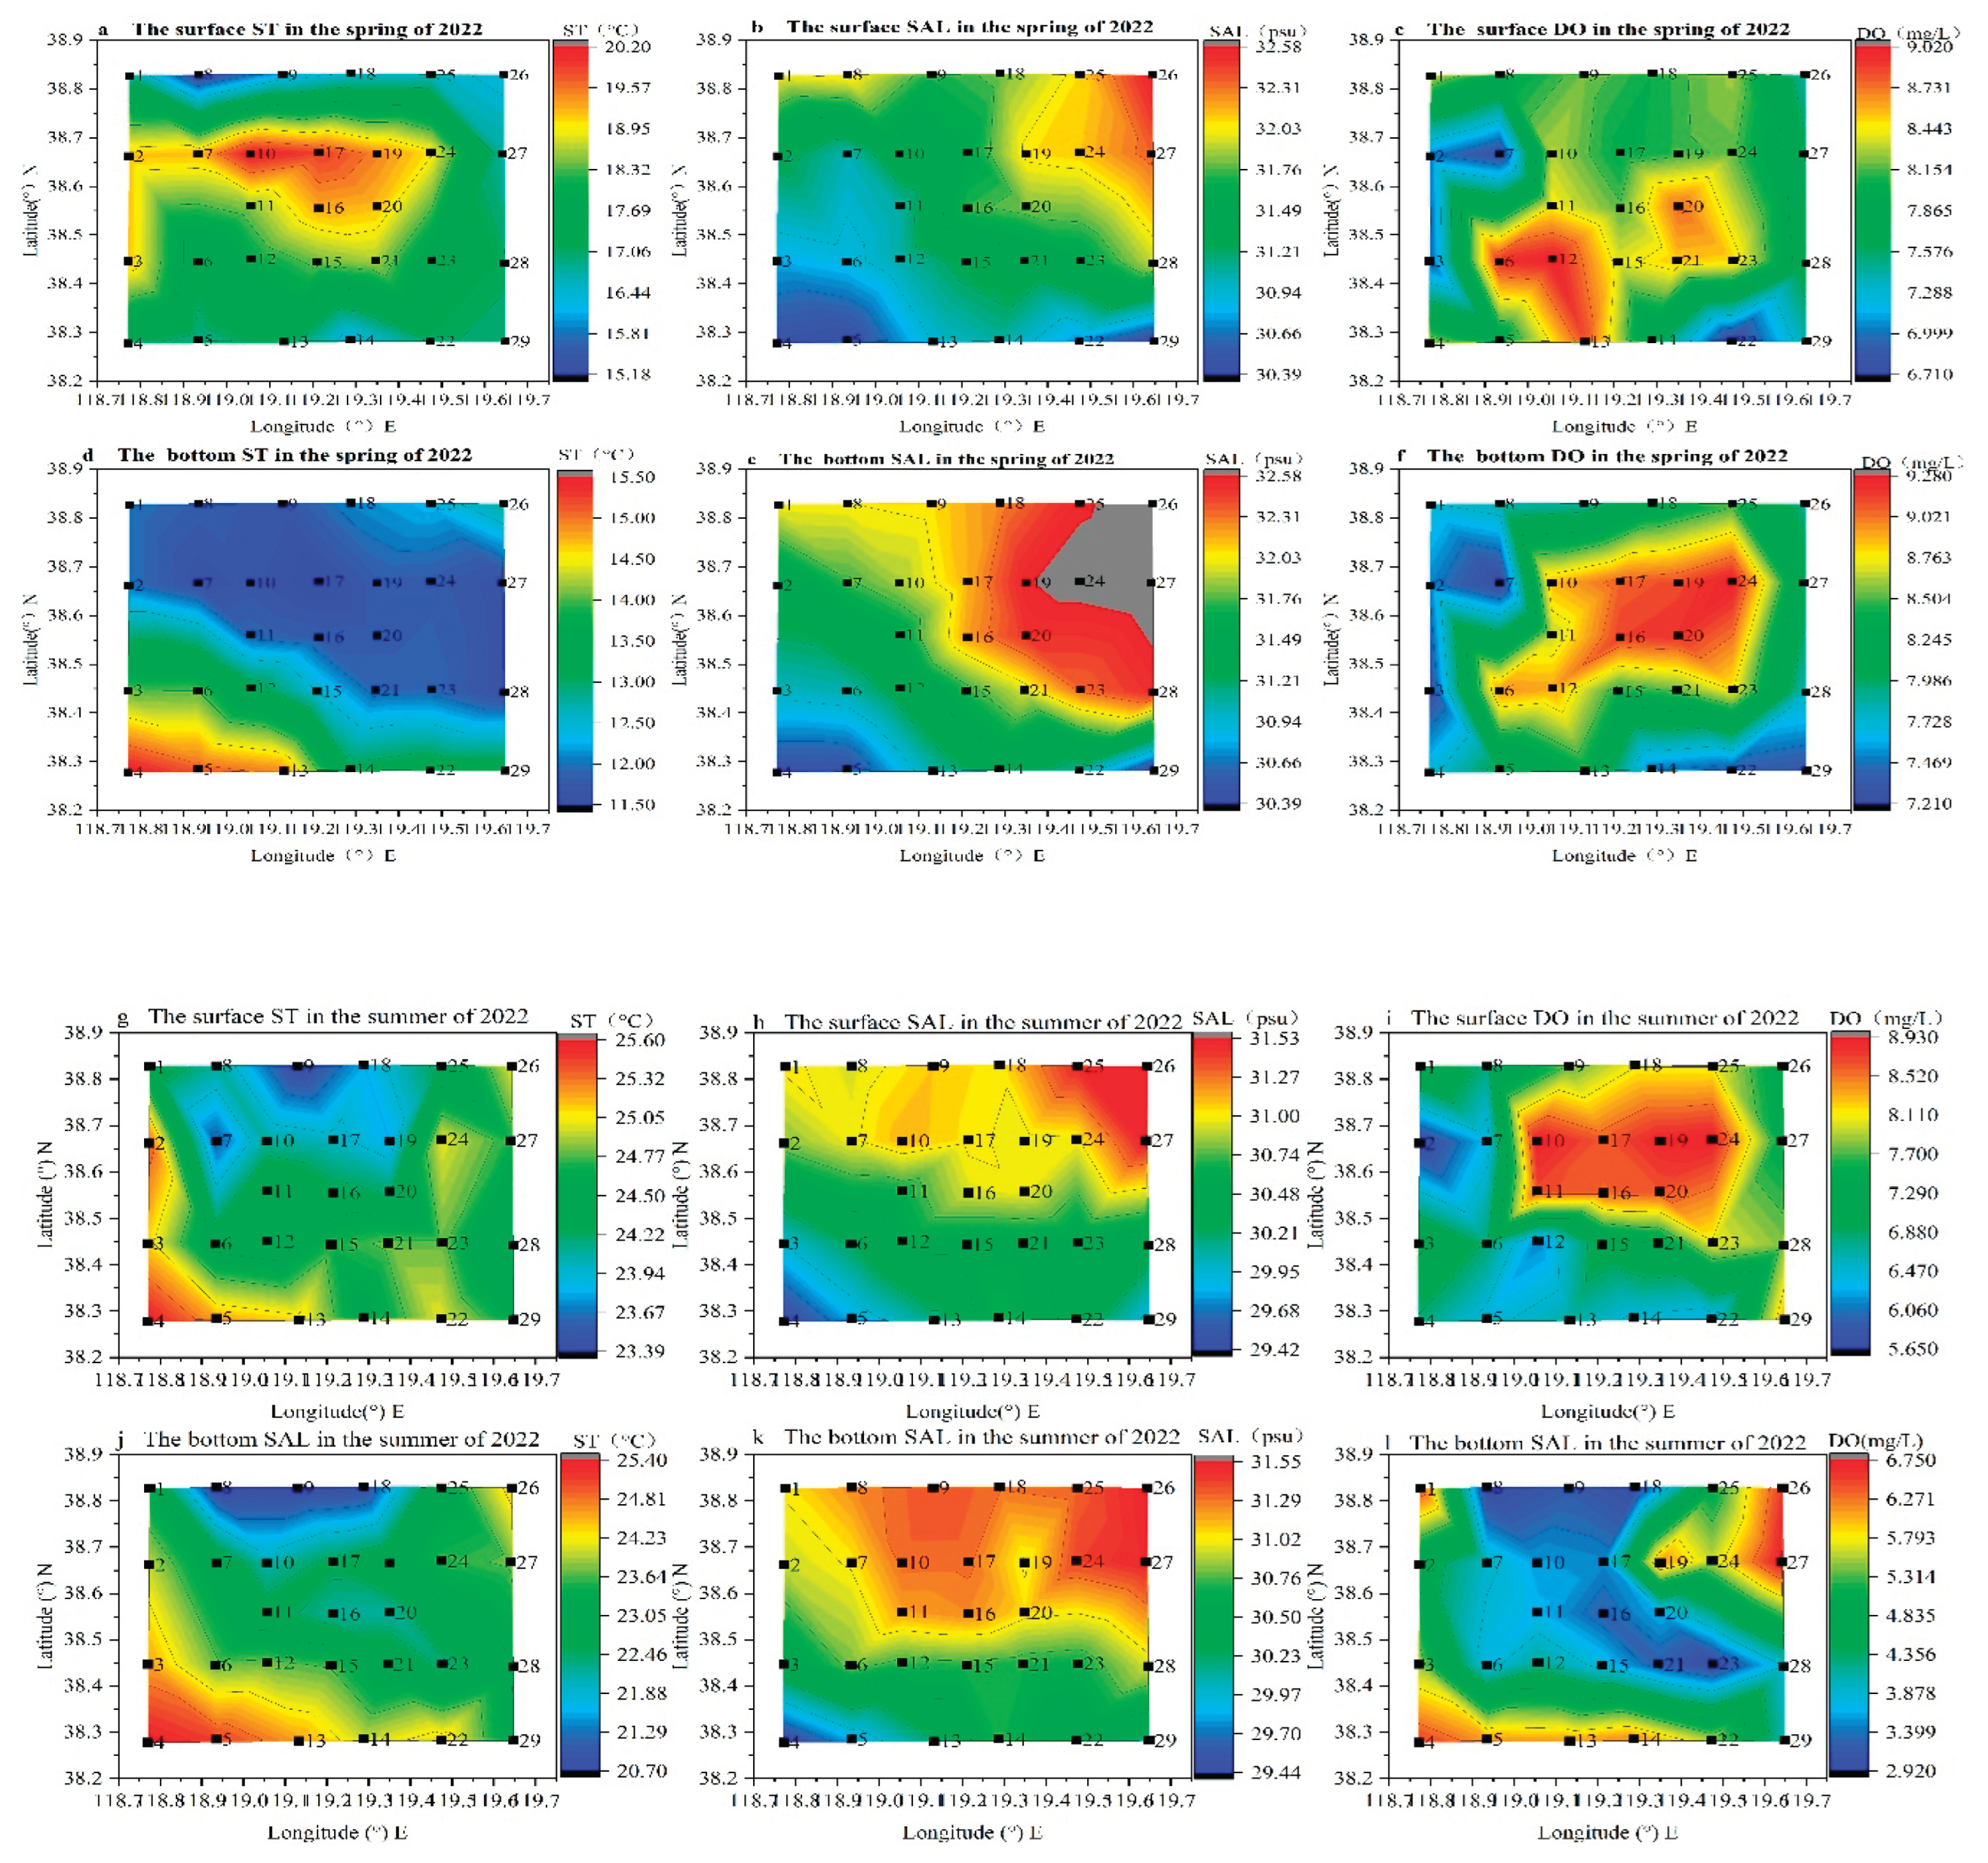
Figure 5.
Comparison of the △ST, △ SAL, and △DO: (a–c) spring; (d–f) summer; (g–i) autumn; (j–l) △pH in spring, summer, and autumn.
Figure 5.
Comparison of the △ST, △ SAL, and △DO: (a–c) spring; (d–f) summer; (g–i) autumn; (j–l) △pH in spring, summer, and autumn.
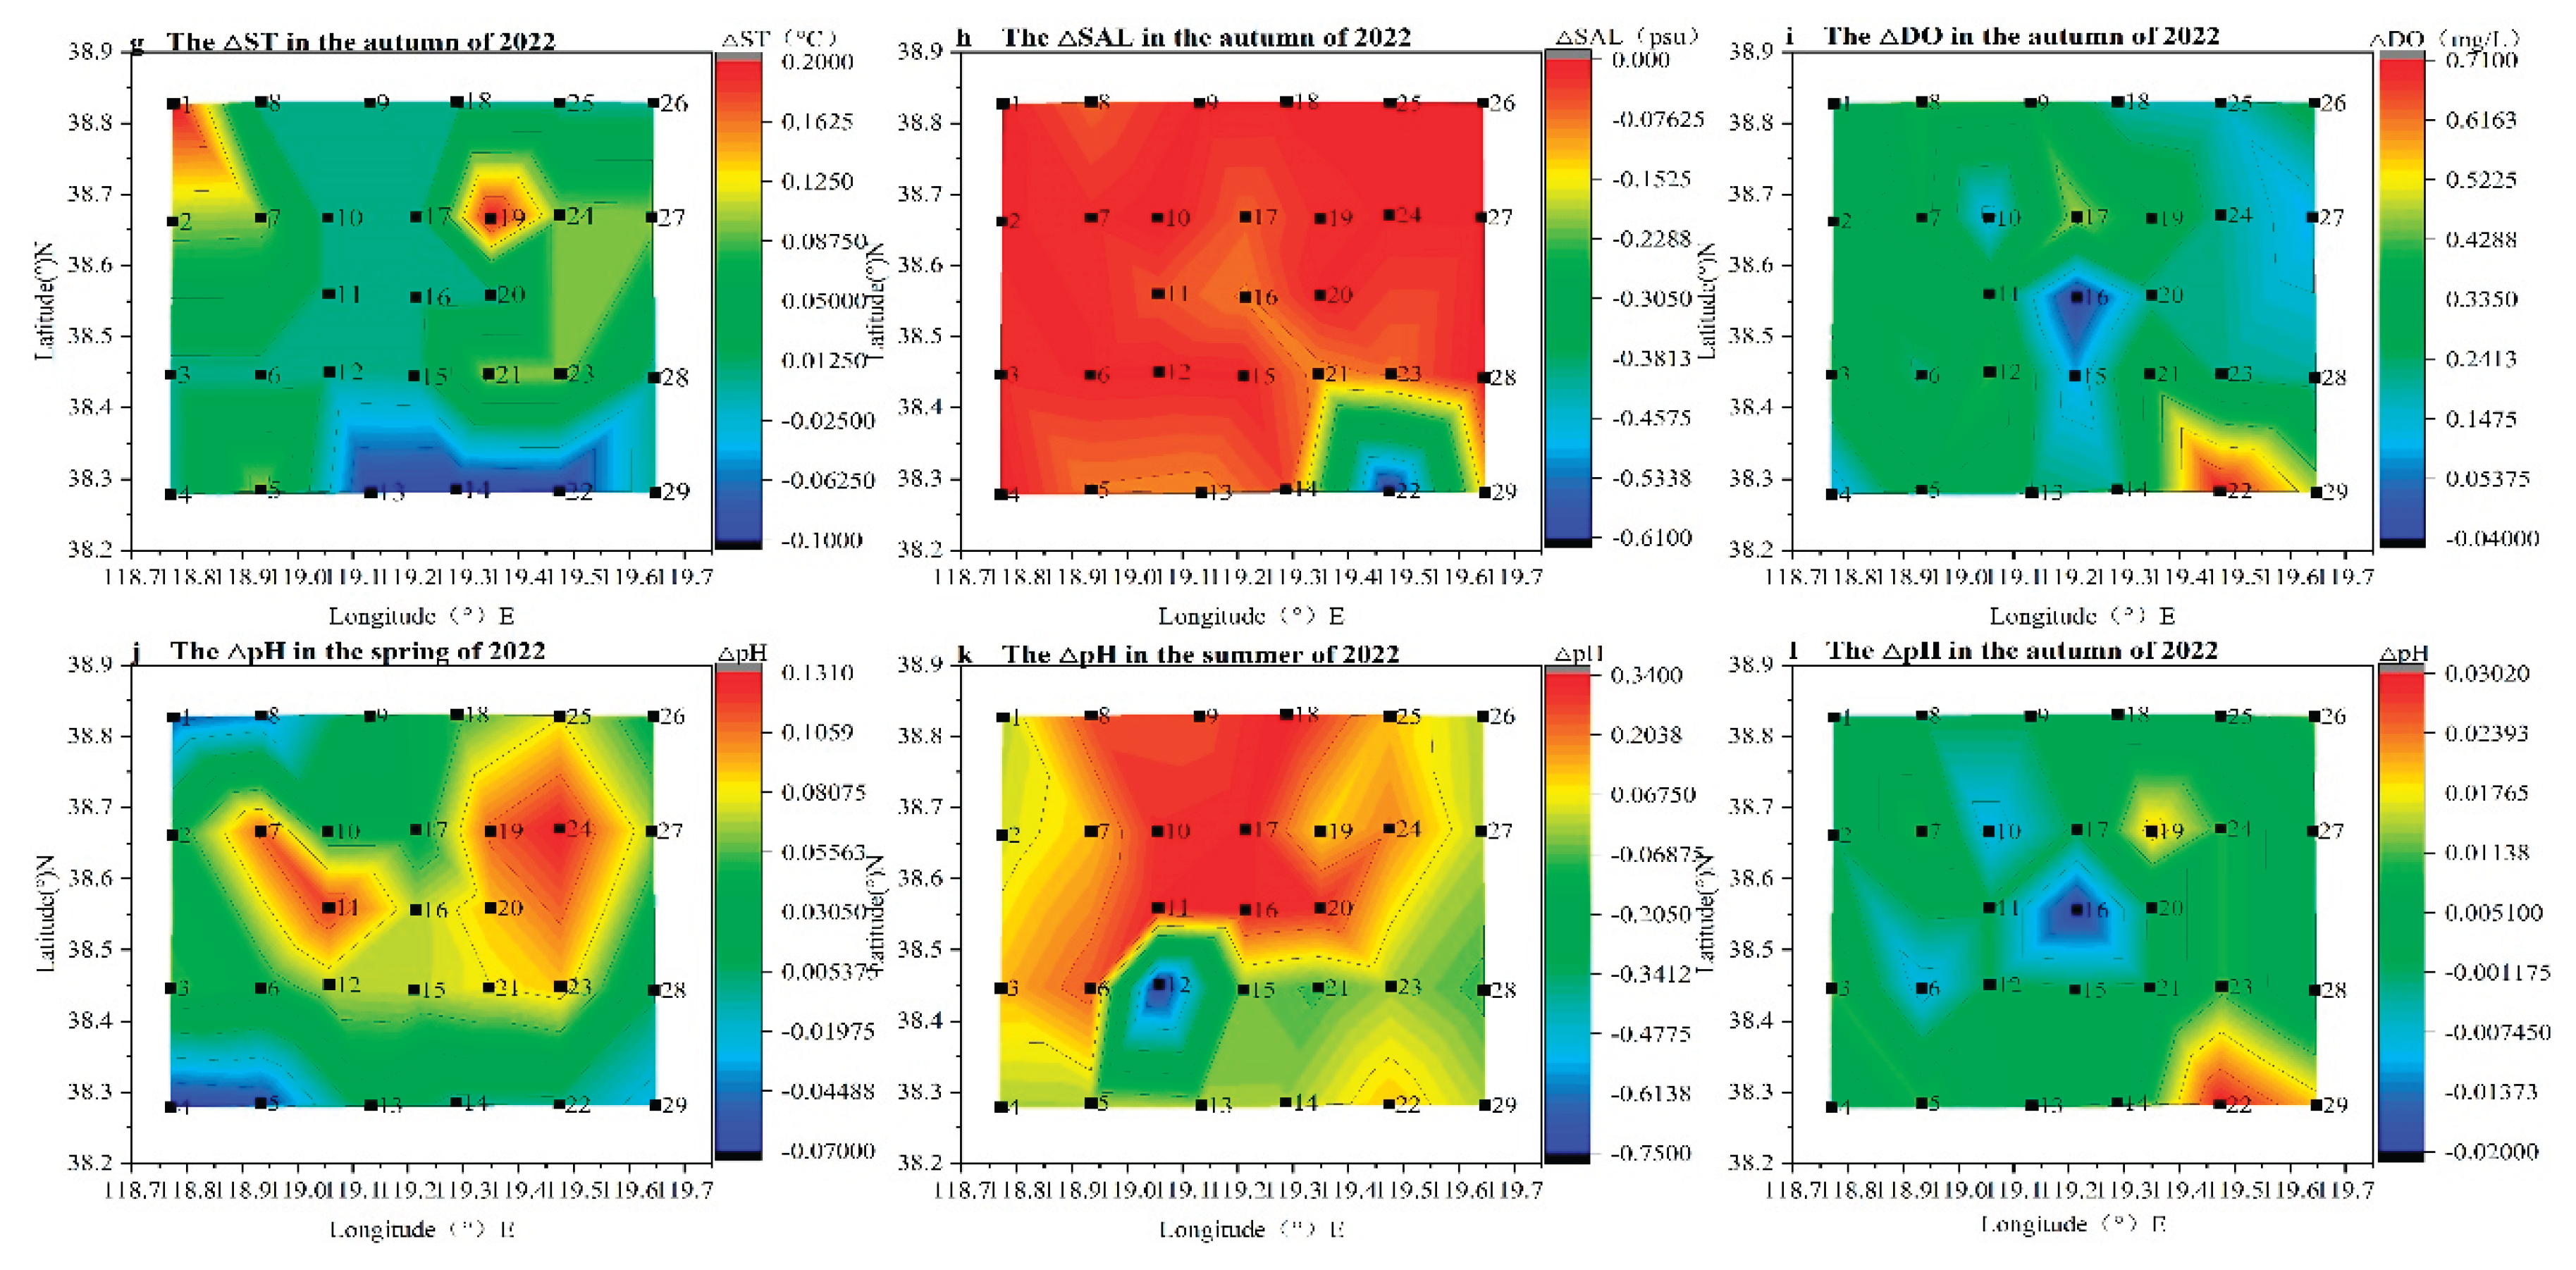
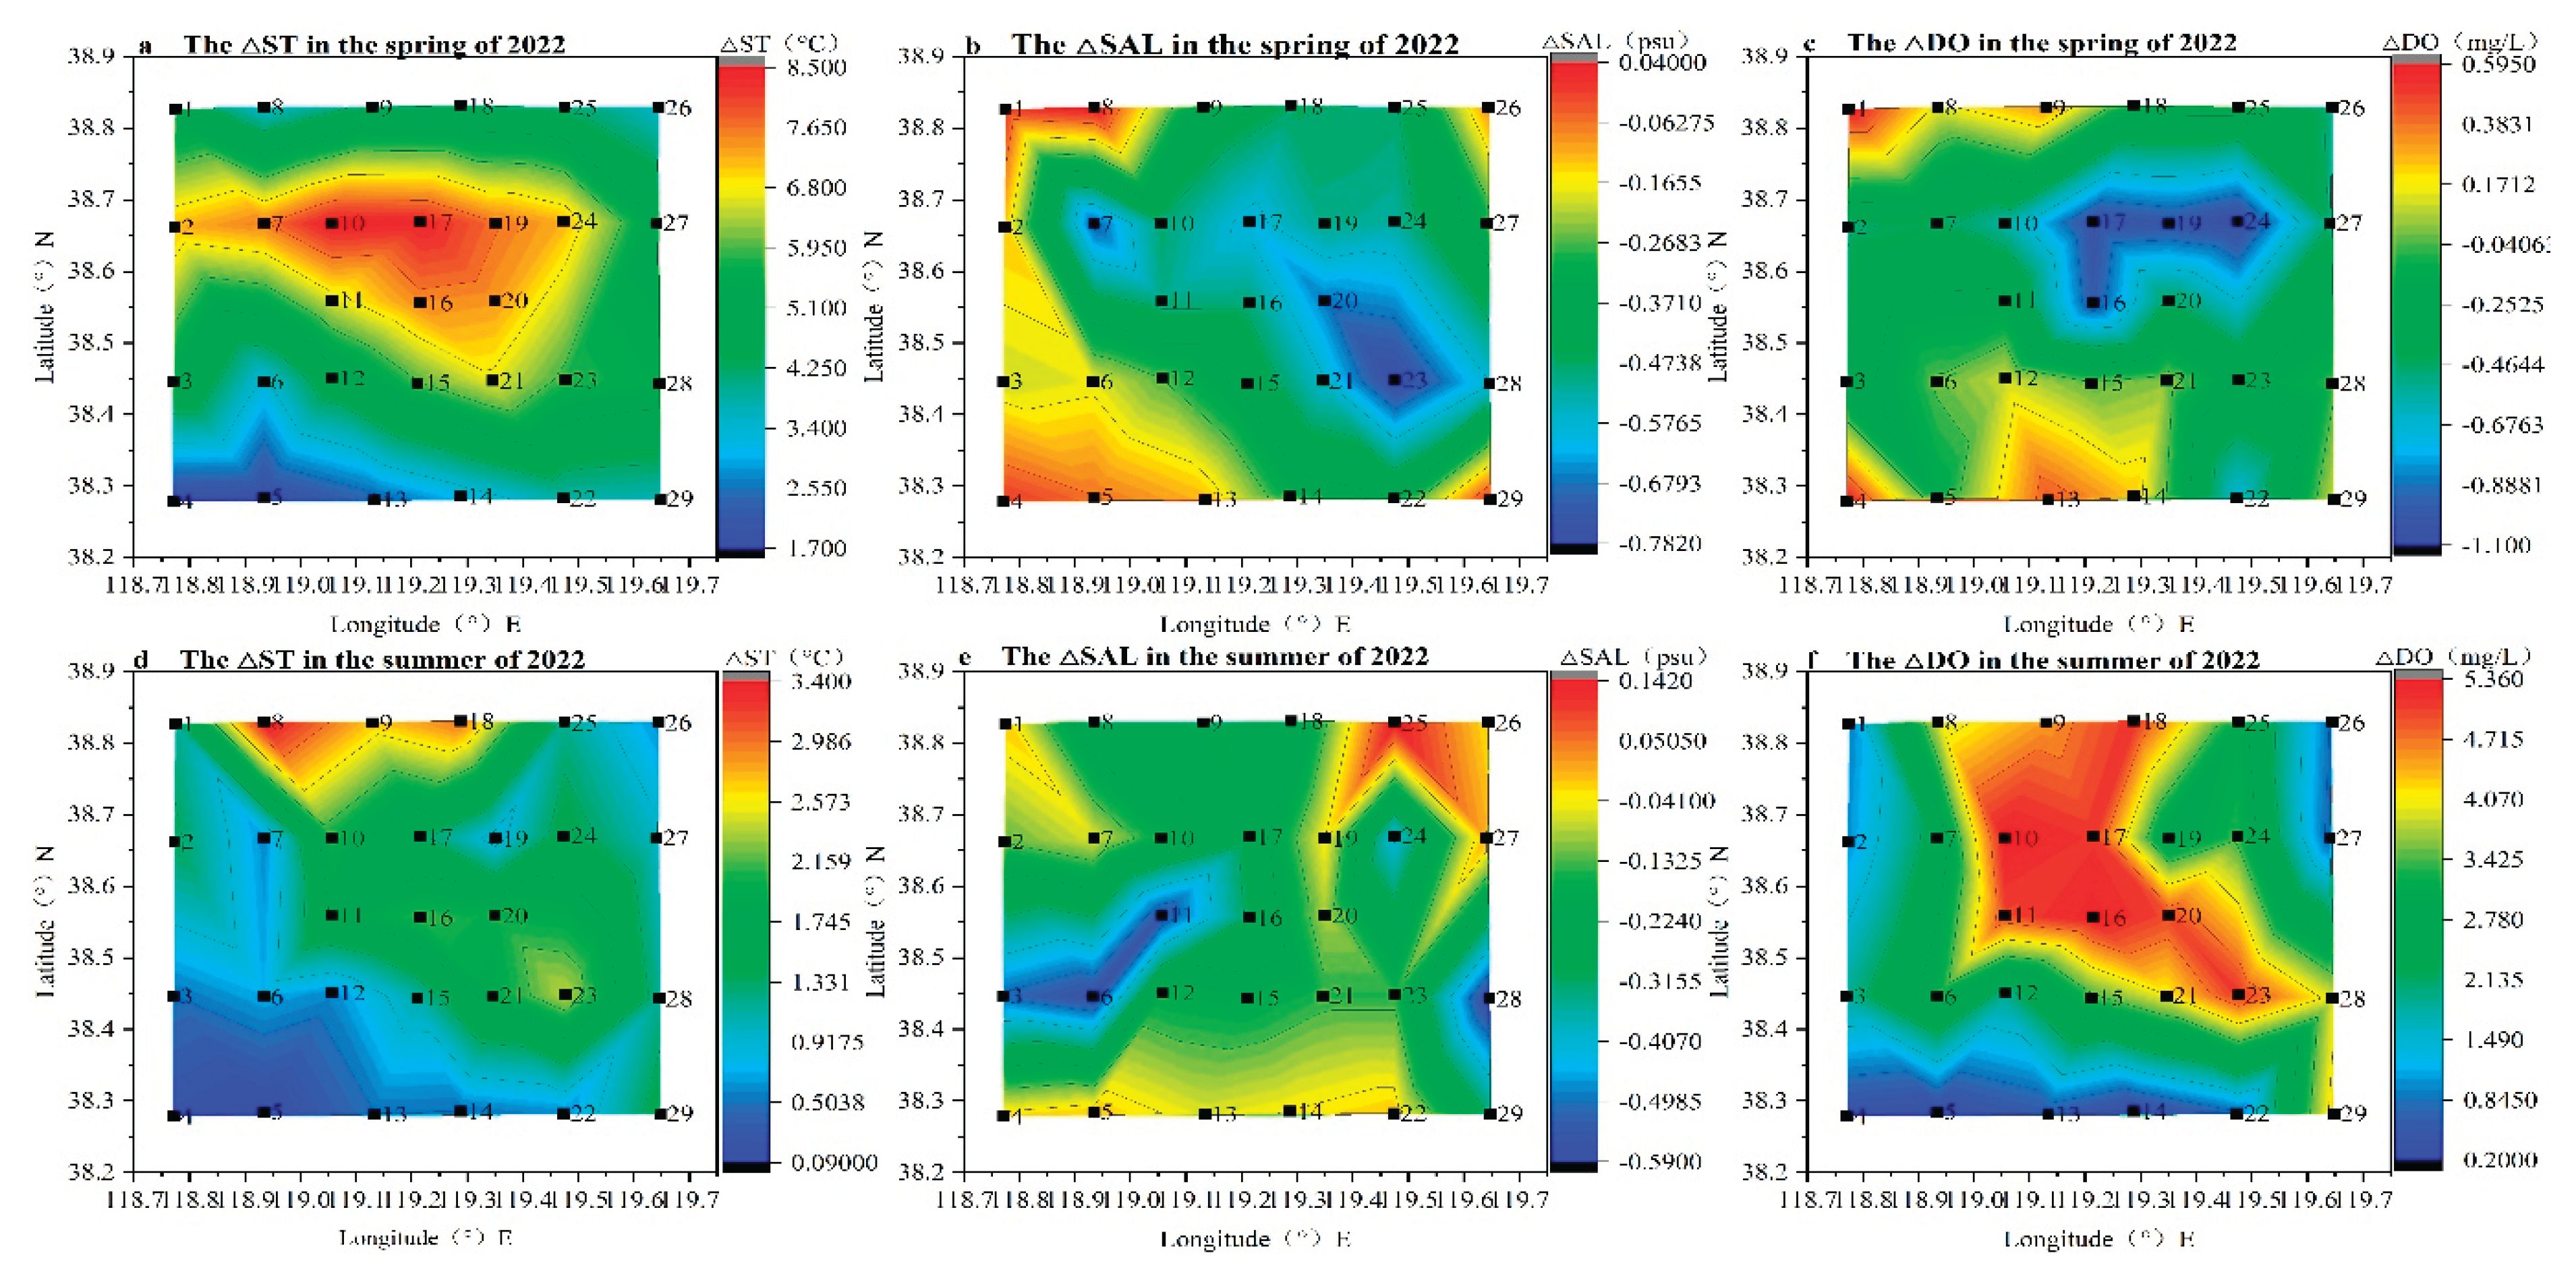
Figure 6.
NQI of surface and bottom layers in the study area (a, d) in spring; (b, e) summer; and (c, f) autumn in 2022.
Figure 6.
NQI of surface and bottom layers in the study area (a, d) in spring; (b, e) summer; and (c, f) autumn in 2022.
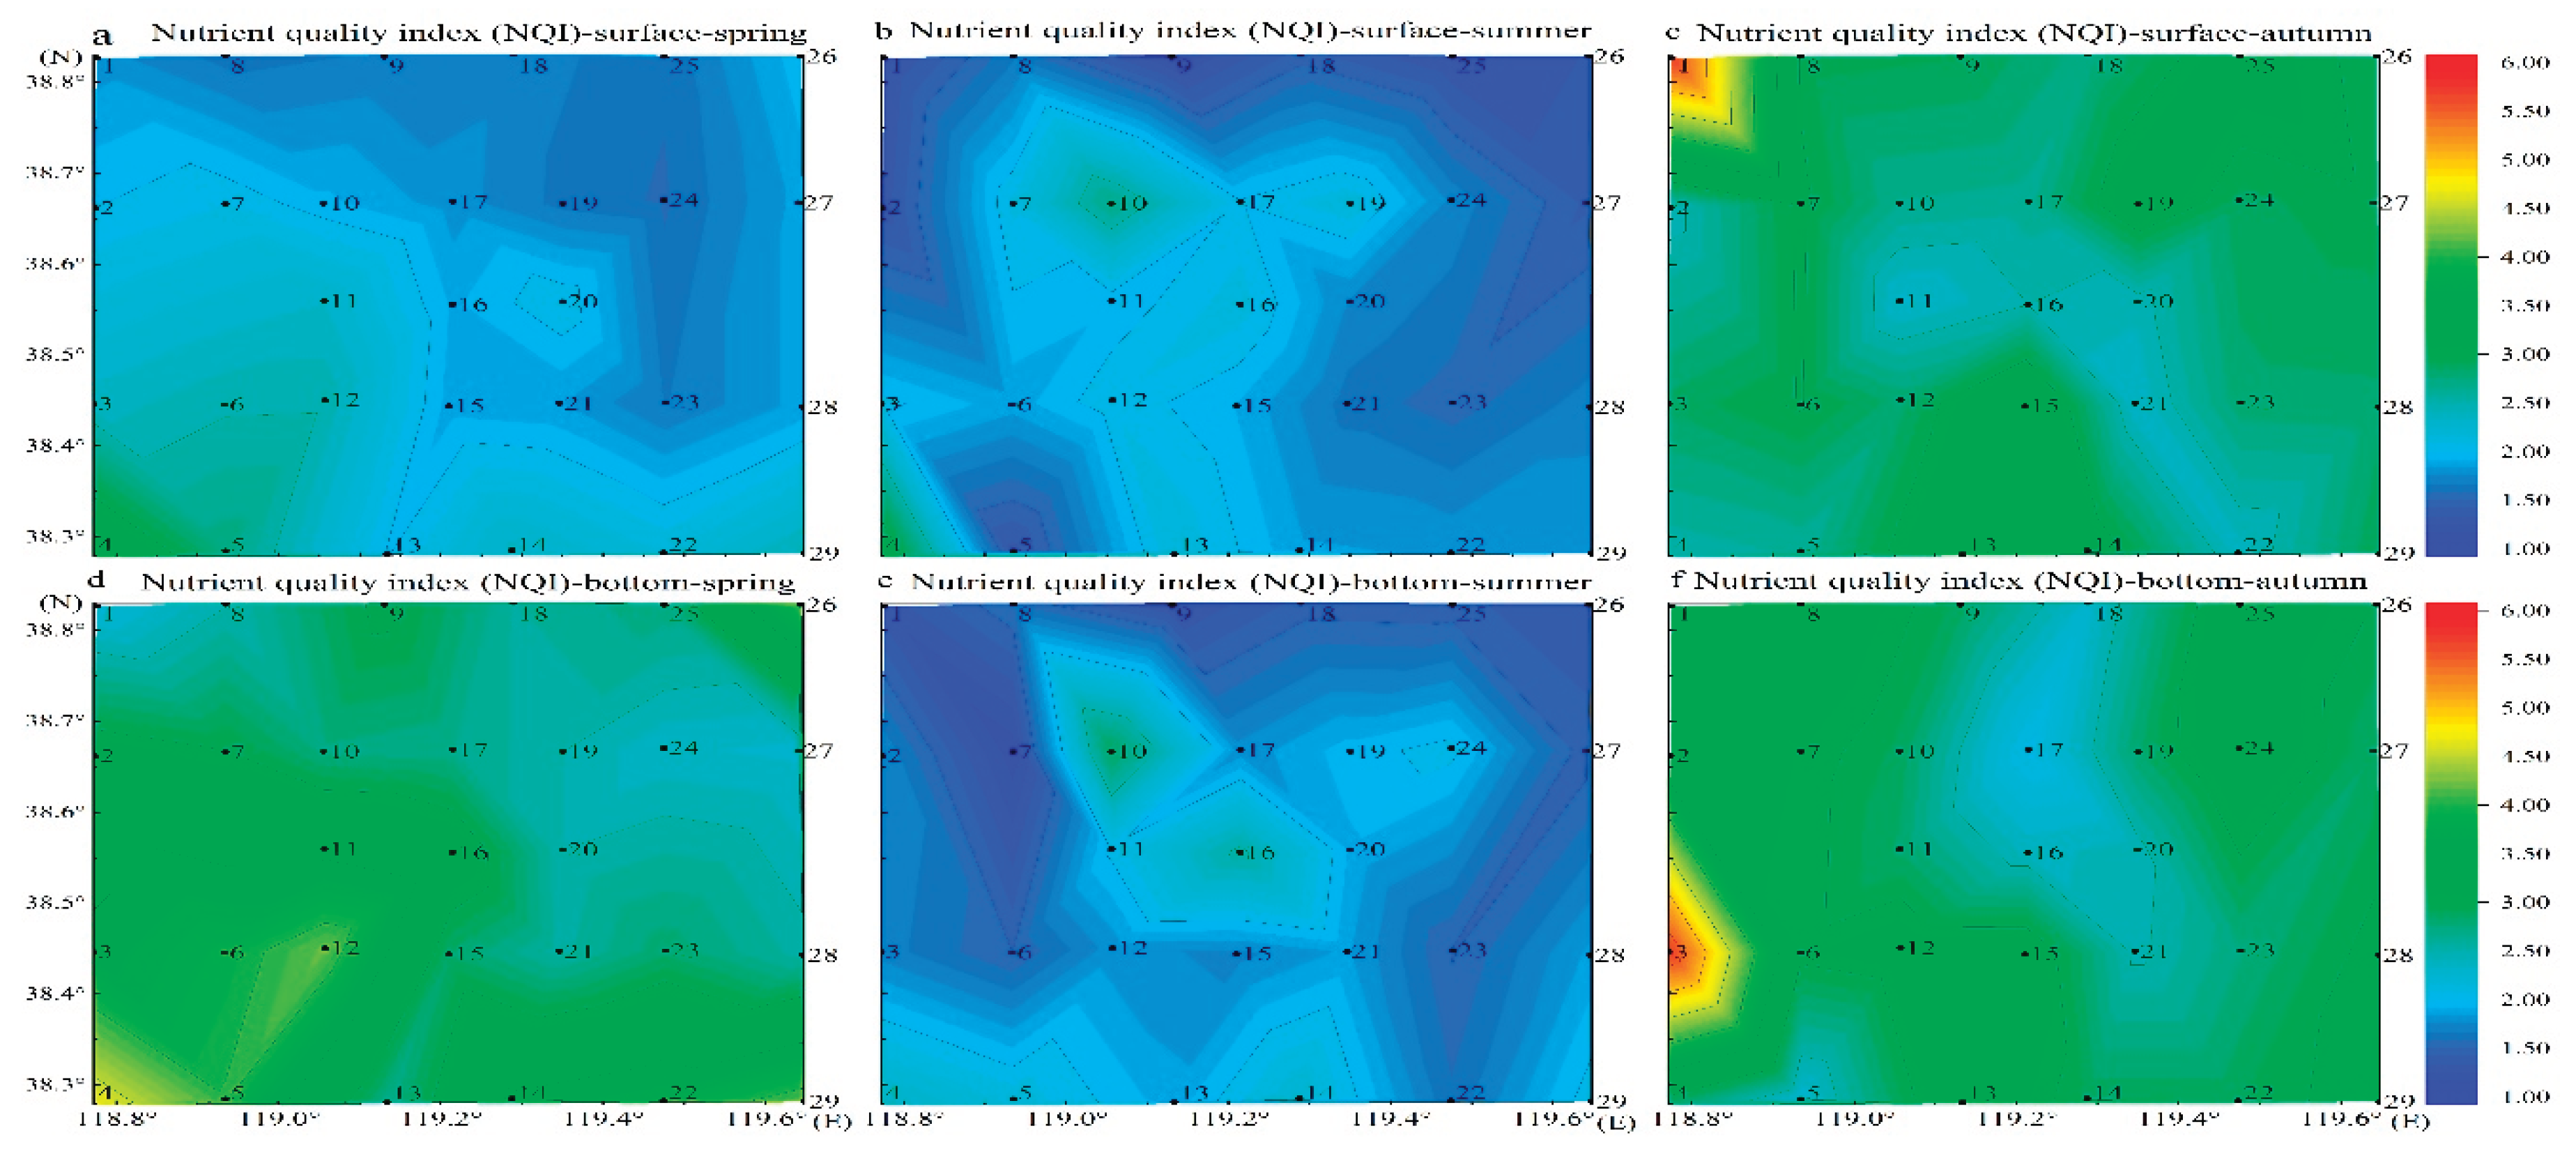
Figure 7.
Comparison of YRRF at Lijin Station and (T-SST) with multi-year values: (a) YRRF in spring and summer at Lijin Station from 2010 to 2023; (b) difference between T at Longkou Station and SST at the buoy in the CBS in spring and summer from 2011 to 2022.
Figure 7.
Comparison of YRRF at Lijin Station and (T-SST) with multi-year values: (a) YRRF in spring and summer at Lijin Station from 2010 to 2023; (b) difference between T at Longkou Station and SST at the buoy in the CBS in spring and summer from 2011 to 2022.
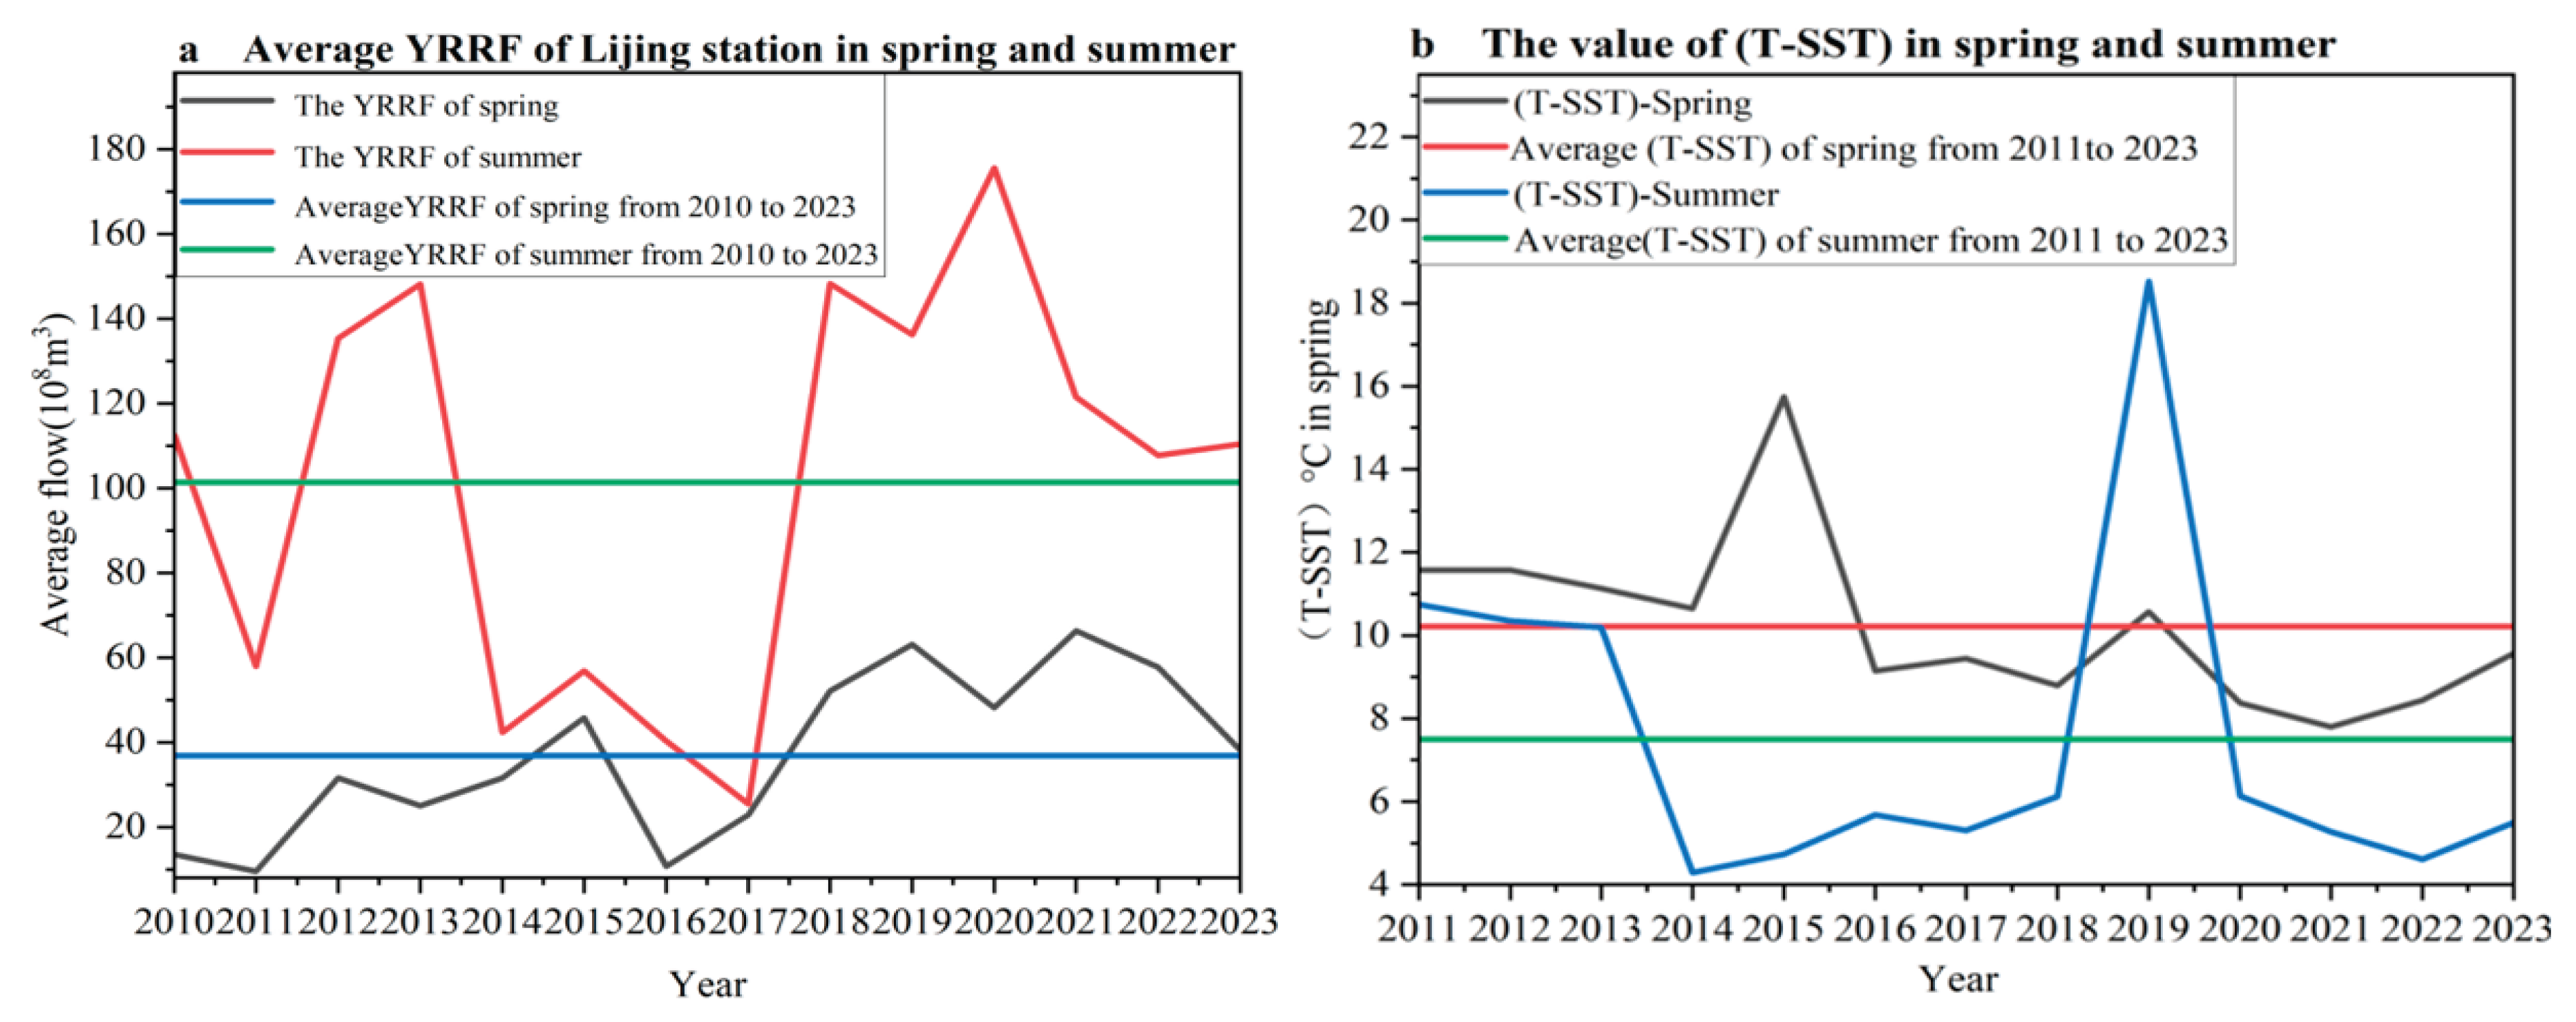

Table 1.
Survey time and content for spring, summer, and autumn in 2022.
| Season | Station | Time | Survey Content |
|---|---|---|---|
| Spring | 29 | 2022.05.28–06.02 | ST, SAL, pH, DO, COD, DIP, DIN, Chl-a |
| Spring | 23 | 2022.05.28–06.02 | Sediments, organisms |
| Summer | 29 | 022.08.29–09.04 | ST, SAL, pH, DO, COD DIP, DIN, Chl-a |
| Summer | 23 | 022.08.29–09.04 | Sediments, organisms |
| Autumn | 29 | 2022.11.08–11.15 | ST, SAL,pH, DO, COD DIP, DIN, Chl-a |
| Autumn | 23 | 2022.11.08–11.15 | Sediments, organisms |
Disclaimer/Publisher’s Note: The statements, opinions and data contained in all publications are solely those of the individual author(s) and contributor(s) and not of MDPI and/or the editor(s). MDPI and/or the editor(s) disclaim responsibility for any injury to people or property resulting from any ideas, methods, instructions or products referred to in the content. |
© 2025 by the authors. Licensee MDPI, Basel, Switzerland. This article is an open access article distributed under the terms and conditions of the Creative Commons Attribution (CC BY) license (http://creativecommons.org/licenses/by/4.0/).
Copyright: This open access article is published under a Creative Commons CC BY 4.0 license, which permit the free download, distribution, and reuse, provided that the author and preprint are cited in any reuse.


