
Submitted:
09 December 2025
Posted:
10 December 2025
You are already at the latest version
Abstract
Using daily data ranging from January 2020 to June 2023 we aim to investigate the interconnectedness between the crude oil price and the exchange rate price. As first step we use the impulse response function to measure the interaction between both variables within a shock occurred on one of the studied variables. The findings justify that a shock occurred within the price of the crude oil has a direct effect to exchange rate variability. At the second step we use the VAR-DCC-GARCH to employ the time frequency correlation between both variables. Our funding proof dependency of the Japanese yen , the mexico pesos , the Canadian dollar as well as the indian rupee to the volatility of the price of crude oil. The Russian rubble show great resistance to twards the volatility of the price of crude oil. Our findings suggest that the dollarization of world economy tend to influence significantly the volatility of foreign exchange market on the crude oil price.
Keywords:
crude oil price
; exchange rate
; volatility
; impulse response function
; VAR-DCC-GARCH
1. Introduction
Within the reframe of the international trade law, the dollar become a main currencies for the transaction on specific commodities such energies, precious metals, etc. distinguishing the impact of the dollar on the energy sector has been treated differently and using several empirical approaches. Within the recent academic discussion, this topic is taken as the exchange rate and the fluctuation of the WTI, the crude oil. The WTI is the most important commodity in the energy sector and it is traded globally with great size taken daily. The interconnectedness between markets globally that exchanges the crude oil as importers and/or exporters was made through the dollar as within the new frame of international trade, it becomes the most significant currencies within the international trade. The inter-relation between the energy sector and the dollar has been referred as petrodollar , has significant effect on major currencies globally such as the British pound GBP, the Euro, the Japanese Yen.
The international trade system in the crude oil is divided into two sectors: the WTI and the FEM. According to krugman (1983) if an economy relies heavily on WTI in it’s tradable sector, it can be argued that an increase in oil prices will cause the domestic currency to lose value. However, the second, FEM, conduct pertains to how wealth is transmitted. Krugman (1983) add that rising oil prices cause wealth to shift from countries that import oil to those that export it. Within the same perspective, theoretically Bloomberg and Harris (1995) analyse the interlink with the following way: if we assume that oil is a product that is traded globally and has the same quality and if its priced in US dollars, then a decline in the value of the US dollar will lead to a decrease in oil prices. Umar et al (2023) the theoretical aspect might be revised, as within the financialisation of crude oil marked by the proliferation of innovative financial instruments, has significantly altered the landscape of oil markets and their relationship with exchange rates: the speculative activities in oil futures and derivatives amplify price volatility influencing currency values beyond traditional supply and demand dynamics. Within the same perspective (Kilian, 2009) differentiate between demand-driven, supply-driven, and speculative influences on oil prices is somehow very crucial to understand the nuanced and often non-linear interactions between oil prices and exchange rates. Wang et al (2023) add that analyse the link between WTI and exchange rate that within the growing globalization and fnancialization of WTI markets, the majority of investors have started incorporating WTI into their investment portfolios. The currencies which play a significant role in trading WTI and are extensively interconnected globally, are anticipated to encounter significant Spillover effect.
The first contribution of this study is to fill the gap on the research study treating the topic by providing a deep analysis of the previous studies treating the topic and encounter a literature review which is able to understand the topic clearly by providing a contextual viewpoint to the existing body of research. The second contribution rely on using a time high frequency data which allowed to understand the interlink between the fluctuation of oil price and currency markets. Within this research we analyse the correlation between the WTI and four major currencies such as: the Mexican pesos, the Canadian dollar, the Indian rupee, and the Japanese yen. For conducting this analysis we use a dataset consisting of high-frequency daily data ranging from January1, 2020, to October 08, 2023.
2. Literature Review
The literature review make interlink between the oil market and the foreign exchange markets, each study provide unique result following their employment of variety of techniques for different samples. Studying the impact oil price on the foreign exchange market bring important features through many studies . For instance demand and risk driven oil price shocks significantly contribute to variation in exchange rates ( Malik and Umar 2019) while impacts from oil supply side shocks are insignificant (Xu et al 2019) . At another oppository perspective jiang et al (2020) disclose that oil supply and oil specific demand shocks have negative and asymmetric effects. (Chkir et al 2020) , within the same perspective , find out a strong interlink between oil prices and the exchange rate for the selected economies within the period 1990 to 2017. However during the crises C19P and Russia-Ukraine, (Kyriazis and Corbet 2024) find out that the influence of major currencies on Latin American exchange rates decreased during that times. For example, the Argentinian and Uruguayan pesos mainly absorb shocks, however the Brazilian real and Peruvian soles are key sources of spillover. Within the same period, 2008 to 2020, (Asadi et al 2022) find out that there is generally a low level of interconnectivity between the energy and the currency markets. Within an earlier period from 2000-2015, Huang et al (2017) examine the oil-exchange rate nexus in china and Russia , find out that a decreasing exchange rate weakens the chinese oil-stock relationship but strengthens it in Russia. A diversity of methodologies are paying attention to interaction between the USA dollars and the prices of crude oil (Atems et al 2015; Jammazi et al 2015; Ji et al 2018). the Dollar is considered as the prime billing currency of oil trading. For that reason, the volatility of any currency in the dollar is taken as vital factor in fluctuations of the price of crude. Within the same perspective our paper is focusing on the volatility of the foreign exchange rate on the price of crude oil. Our findings suggest a dependence relation between the exchange rates and the oil market during the period of analysis. The rest of the paper proceeds as follow. In section 2 we describe the dataset as well as we introduce the mathematical background of the dependence modelling using the DCC-GARCH model. In Section 4, we present the result of the model, we conclude, discuss policy implications, and suggest further extensions of our work.
3. Data and Methods
To examine the impact of crude oil price volatility on the exchange rate we tend to select a very specific currencies as they have a tight relation with the crude oil industry. We select five currencies for this study as follow: Peso Mexican, Japanese yen, Ruble russian, Yuan Chinese, and Australian Dollar. We made analysis for the most interlinked currencies markets to the world wide energy sector. The analysis conducted at first step with impulse response function to measure the power interaction of each currencies within a shocks occurred on the price of crude oil by scrutinize daily price to unveil the nuanced relationships under varying market conditions. The Mexican economy is relying a lot on the energy sector which exhibit a pronounced sensitivity to the crude oil sector. The Australian economy is a rich and diversified economy which proof a varied interaction towards the crude oil shocks, indicating the complexity of underlying economic structures and trade relationships. The japan economy is relying a lot on oil imports that makes the yen particularly responsive to oil price dynamics. The Russian economy is a very interesting producer of crude oil that makes the international trade structure of crude oil with the volatility of dollar is highly sensitive. The Chinese economy is an well importer and exporter of crude oil, which exhibit a direct link to Chinese currency with US dollar. This analysis leveraging the impulse response function as first step and second step the VAR-DCC-GARCH approach highlight the differencial impact of oil price volatility on selected currency pairs and examine the interdependencies and the interconnection between the currencies markets in face of further energy commodity shocks. The empirical analysis relies on dataset spanning from 1/1/2020 to 08/10/2023. The studied period was characterised by upheavals and occurrences such as Asia crisis, subprime crisis, the Russian crisis.
3.1. Impulse Response Between the Exchange Rate and the Oil Price
Within the aim to assist properly the design of our analytical model reflecting the co- movement between the crude oil price and the exchange rate, the reason to study that is to enhance a new frame about the currency markets where the energy play as a catalyst role as well as the other commodities in commanding the international monetary system even we start our analysis of causal interactions between these variables. For this purpose, from BVAR51 system we derive impulse response function that show diffusion of lagged responses of individual variables to a Cholesky one- standard-deviation shock2 in each of these variables. We choose 10 lagged terms in the BVAR system. IRFs are calculated by first simulating the model with a series of draws of zero shocks for 100 periods. We then introduce a single shock and let the model gradually return to the stochastic steady state conditional on the series of draws of zero shocks. In Figure 1 we show accumulated of response of the currencies to a shock in the price of crude oil. The accumulated impulse response shown in the graph are for crude oil, exchange rate of USD/Japanese Yen, USD/Mexican Pesos, USD/ CADDollar, and USD/ IndianRuppee. Within the graph there is clear evidence that changes in exchange rates respond to shocks in the crude oil, the causal reaction are pronounced.
Our analysis shown opposite trend of response between the crude oil and the Mexican Pesos, the Canadian dollar, and the Indian rupee throughout the terms. The crude oil mark strong negative response to three mentioned exchanges rates which tends to be positive. Which means one positive standard deviation shock in crude oil tends to drive down the exchange rate with trend to be less down throughout the time until reaching the neutrality. However for the case of the three selected currencies , one positive standard deviation shock in one of them tends to drive down the crude oil prices with trend to be more down throughout the time. Our analysis prove that there is an opposite relationship between the oil and the selected currencies in commanding the international monetary system. The exchange rate USD/Jpanese Yen shown a strong and similar reaction as the crude oil price. This is confirming our reasonable features for using the proposed model to test the interactions between the the crude oil price and the exchange rates for the selected currencies.

3.2. VAR-DCC- GARCH Estimator
The GARCH estimator is commune use in the literature to study the volatility(Bollerslev, 1986), Introduced the ARCH model by (Engle, 1982). The empirical application for ARCH model is often avoid problems with negative variance parameter estimates a fixed lag structure is typically imposed (Engle, 1982), in that matter an extension to ARCH model class occurred to provide a longer memory and more flexible lag structure. The GARCH Process introduced by (Bollerslev, 1986) is given by:
For GARCH model a process for sufficient condition for existence of the 2mth moment is
where
,
The 2mth moment can be expressed by the recursive formula
The process for mean lag in the conditional variance equation is given by
And the median lag is found to be
If
And
The coefficient of the kurtosis is therefore
The specification of the GARCH model serve as the best-fit model to test the volatility of commodities. In our study, we use the DCC-GARCH model to estimate the dynamic volatility of crude oil price and the exchange rate. For that purpose, of cross correlation and autocorrelations, the returns are modelled through the VAR specifications with one lag. The VAR-DCC-GARCH allow us to estimate return and volatility spillover between both variables.
The specification of the VAR DCC-GARCH model is proposed by (Engle, 2002) as a standard benchmark to estimate the time varying covariances and variances. The conditional correlation between multi-random variables that each have mean zero is defined to be
In a multivariate context, the same must be used for all assets to ensure a positive definite correlation matrix. According to (Engle, 2002) Risk Meterics uses the value of .94 for for all the exchange rate and the crude oil price.
The conditional covariance matrix of returns is defining as follow:
The estimators can be expressed in matrix notation respectively:
and
Within the GARCH model, the full covariance matrix is constructed by assuming the conditional correlations are all zero. More precisely, is diagonal. By assuming that then, . The multivariate GARCH models are generalistion or modelling. (Bollerslev, 1986) VAR-DCC-GARCH model,
where
where R is a correlation matrix containing the conditional correlations, as can directly be seen from rewriting this equation as:
3.2.1. The Estimation of the VAR-DCC-GARCH Model
The mean equation is as follow:
3.2.2. Econometric Estimation Methodology
The GARCH estimator is commune use in the literature to study the volatility(Bollerslev, 1986), Introduced the ARCH model by Engel (1982). The empirical application for ARCH model is often avoid problems with negative variance parameter estimates a fixed lag structure is typically imposed(Engel 1982) , in that matter an extension to ARCH model class occurred to provide to provide a longer memory and more flexible lag structure. The GARCH Process is introduced by (Bollerslev, 1986). Within the literature which processed this model in asset prices an energy sector. Studying the volatility in the stock market or the energy sector can be studying in constant or real value process changing over time via the standard deviation of prices, or in time varying (non-constant) via the GARCH-type models (Bollerslev, 1986; Engle, 2002).
There are many varieties on GARCH for studying the volatility that varies both in time and across commodities. We employ the VAR-DCC-GARCH setting to model the volatility of the crude oil price and the exchange rate. The VAR setting allow us to determine how the oil price and the exchange rate evolve together for the studying period. And the DCC-GARCH model conclude how the dynamic volatility of these prices is related. Before detailing the DCC-GARCH we present the VAR model for crude oil price and the exchange rate.
3.2.3. VAR Model
The measurement of volatility is based on vector auto-regression VAR modes by focusing on the impact of prices in terms of intensity and duration between the oil price and the exchange rate. The VAR model used in this study is described as follow:
P is the number of currencies, k is the number of oil price, T is the time-period of the study.
is the price of the exchange rate in the period t, is the price of oil in the period t, is parameter matrix of lagged variables,
, , ,
As an efficient causal analysis method, impulse response function can be used to analyse the relationship between variables. Residual in VAR model reflects the impact from external system on system variables, the coefficient matrix in the moving average form, is also impulse response coefficient matrix as follow:
where and are coefficient matrixes, reflects the impact of on during the period of t-n. Therefore, the accumulative response of to is written as follow
3.2.4. VAR-DCC-Model
The DCC GARCH is introduced to solve this problem. The number f parameters to be estimated in the model increases linearly and not exponentially, which make this model deal the dimension and duration. The model decomposes the matrix where is triangular matrix representing the conditional variance –covariance matrix.
The model composes the matrix as follows: , , is the residual vector composed by the residues of all the markets, is the market information available at time t-1, is the dynamic condition covariance matrix, represent the diagonal matrix of time varying standard deviation of multivariate GARCH model with all three categories of volatiles variables returns, with on ith diagonal.
R has to definite positive and all the parameters should be equal to or less than one. In order to fulfil this condition, has been modelled as follow:
is a symmetric positive define matrix. is assumed to vary according to a GARCH process:
and are scalar parameters to capture the effects of the previous shocks and previous dynamic conditional correlation on current dynamic conditional correlation, are non negative and satisfy . is the unconditional variance between series k and p and follows a GARCH process, is the unconditional covariance between the series estimated in step 1. The parameters and are estimated by maximising the log-likelihood function. The log likelihood function is expressed as follow:
The modified model of (Cappiello et al., 2006) for incorporating the asymmetrical effect Allow the studied model VAR-DCC-GARCH to be written as follow :
4. Results
The fundings of the VAR-DCC-GARCH model is displayed within the graphics analysed below within this section and taking into account the specification of the model in the previous despcription for the studied sample within the selected period.
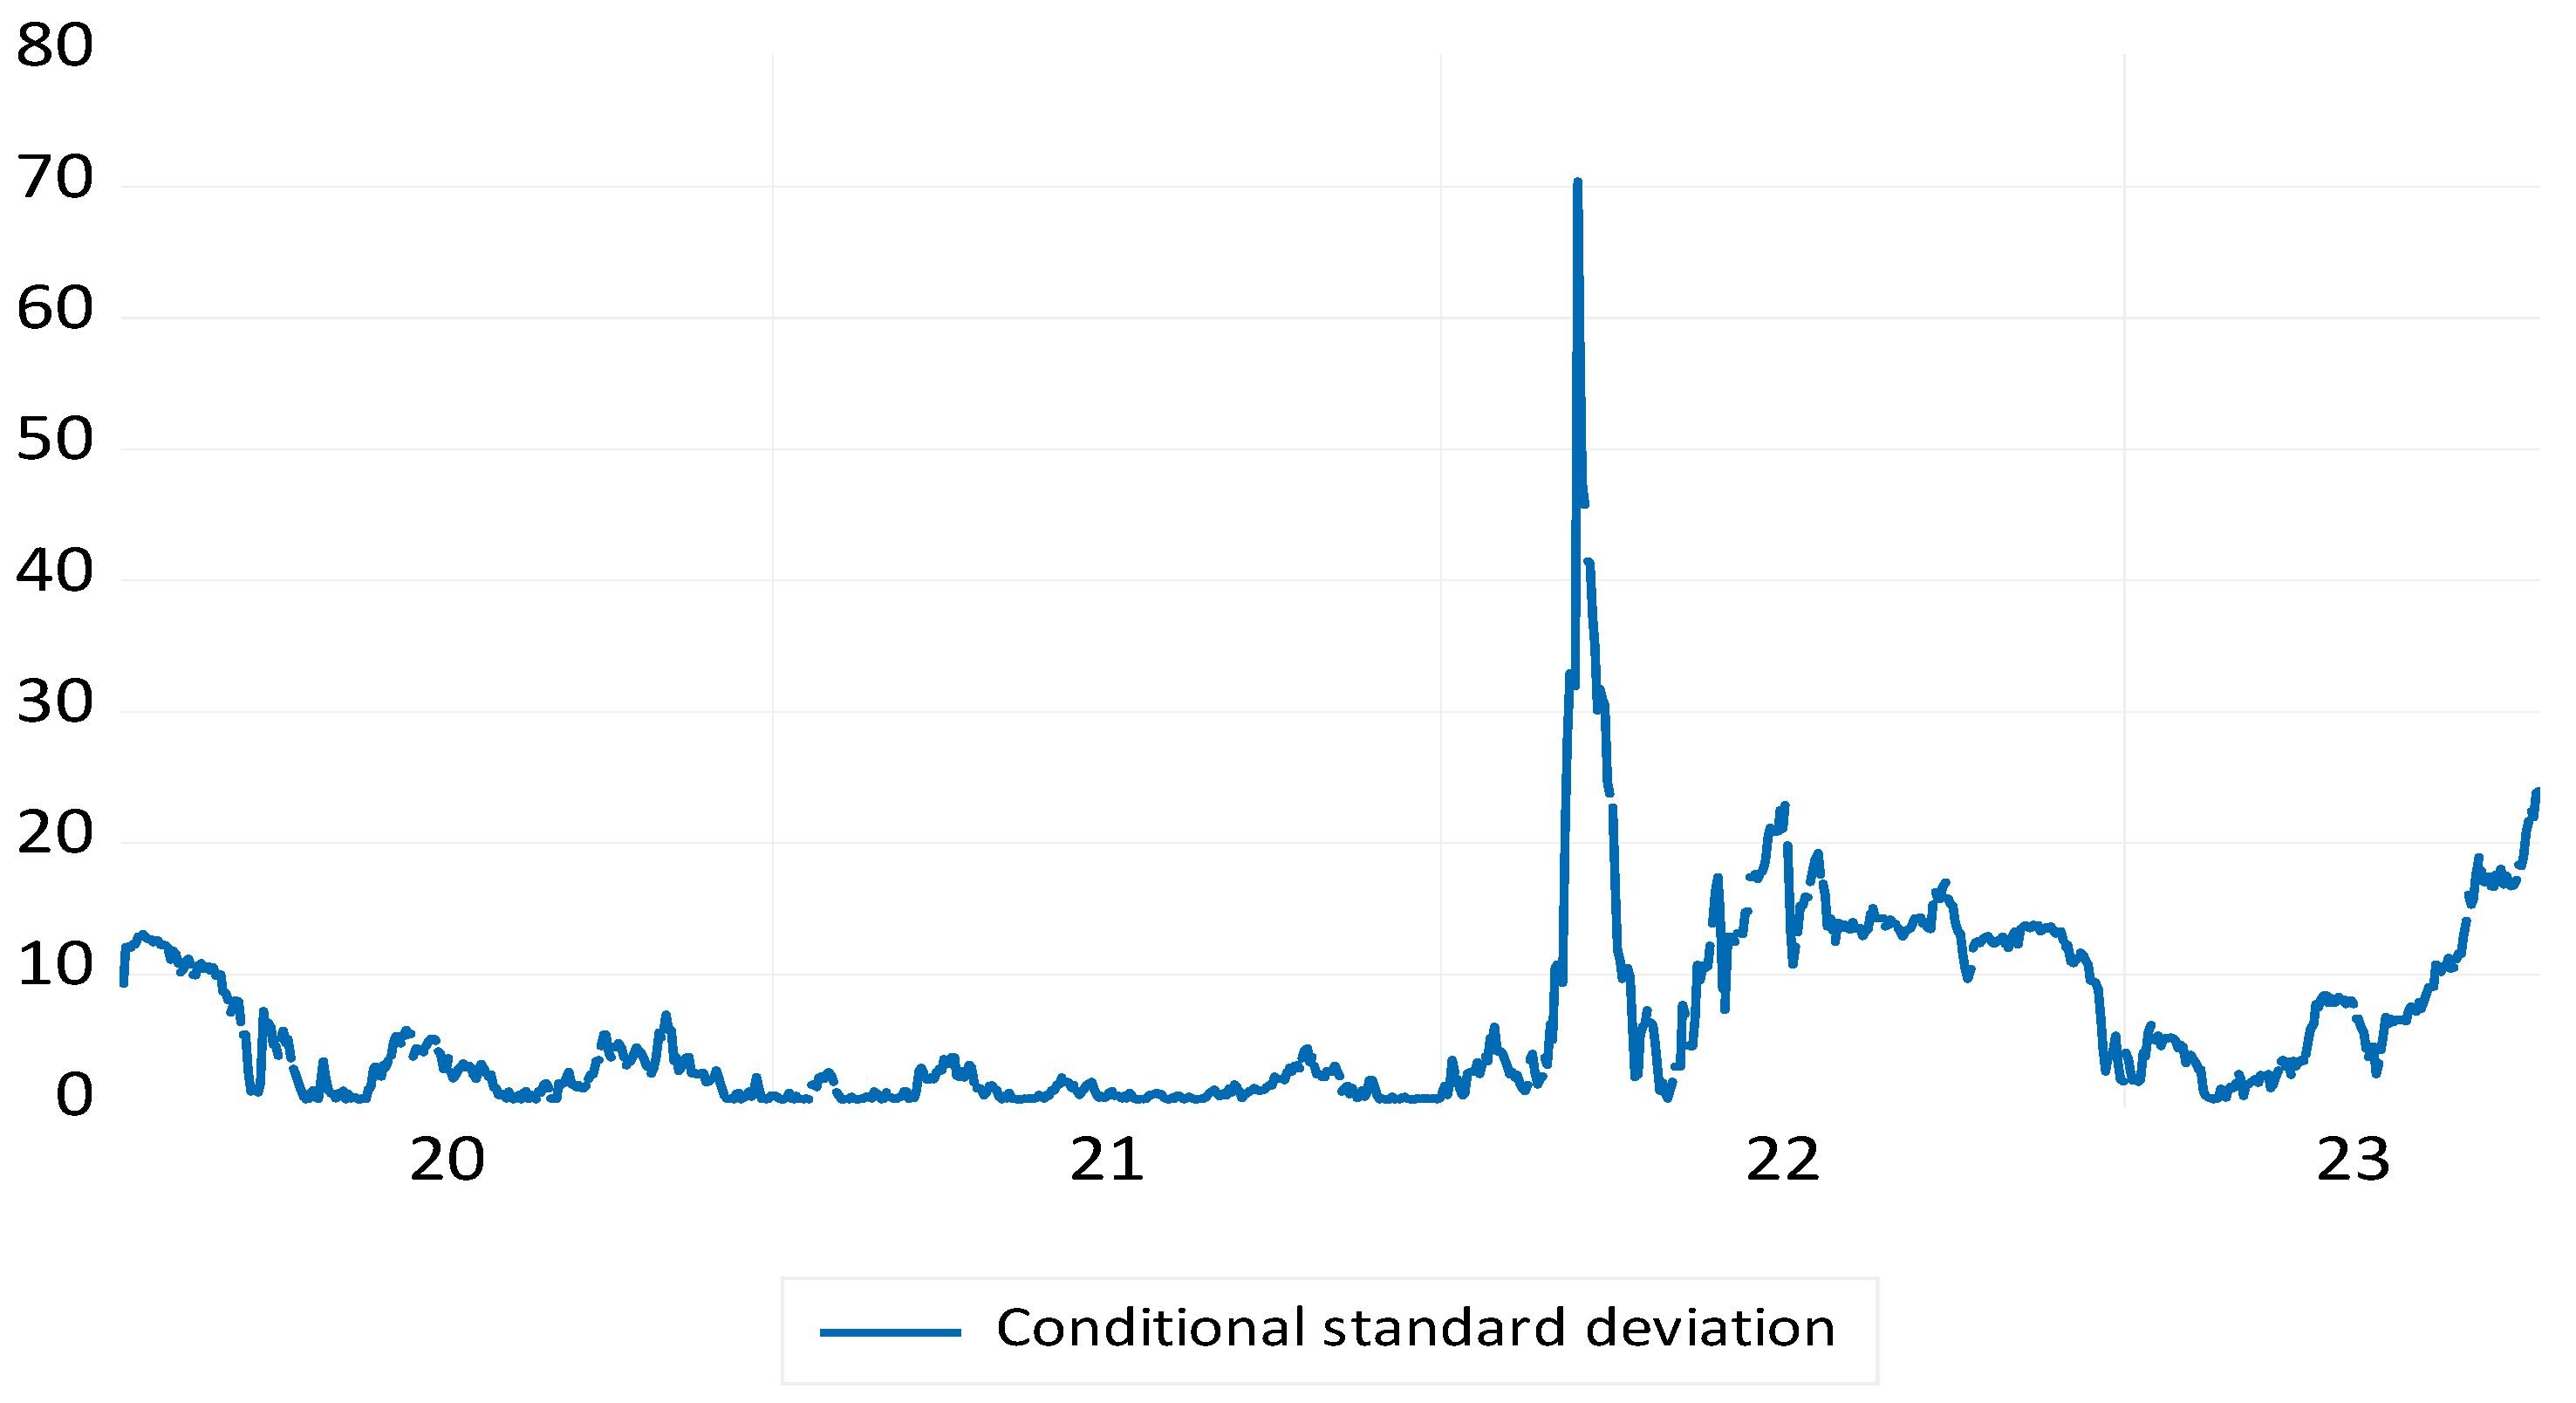
Graph 1.
DDC Conditional correlation between Japanese yen exchange rate and oil price. Source : Own Study.
Graph 1.
DDC Conditional correlation between Japanese yen exchange rate and oil price. Source : Own Study.
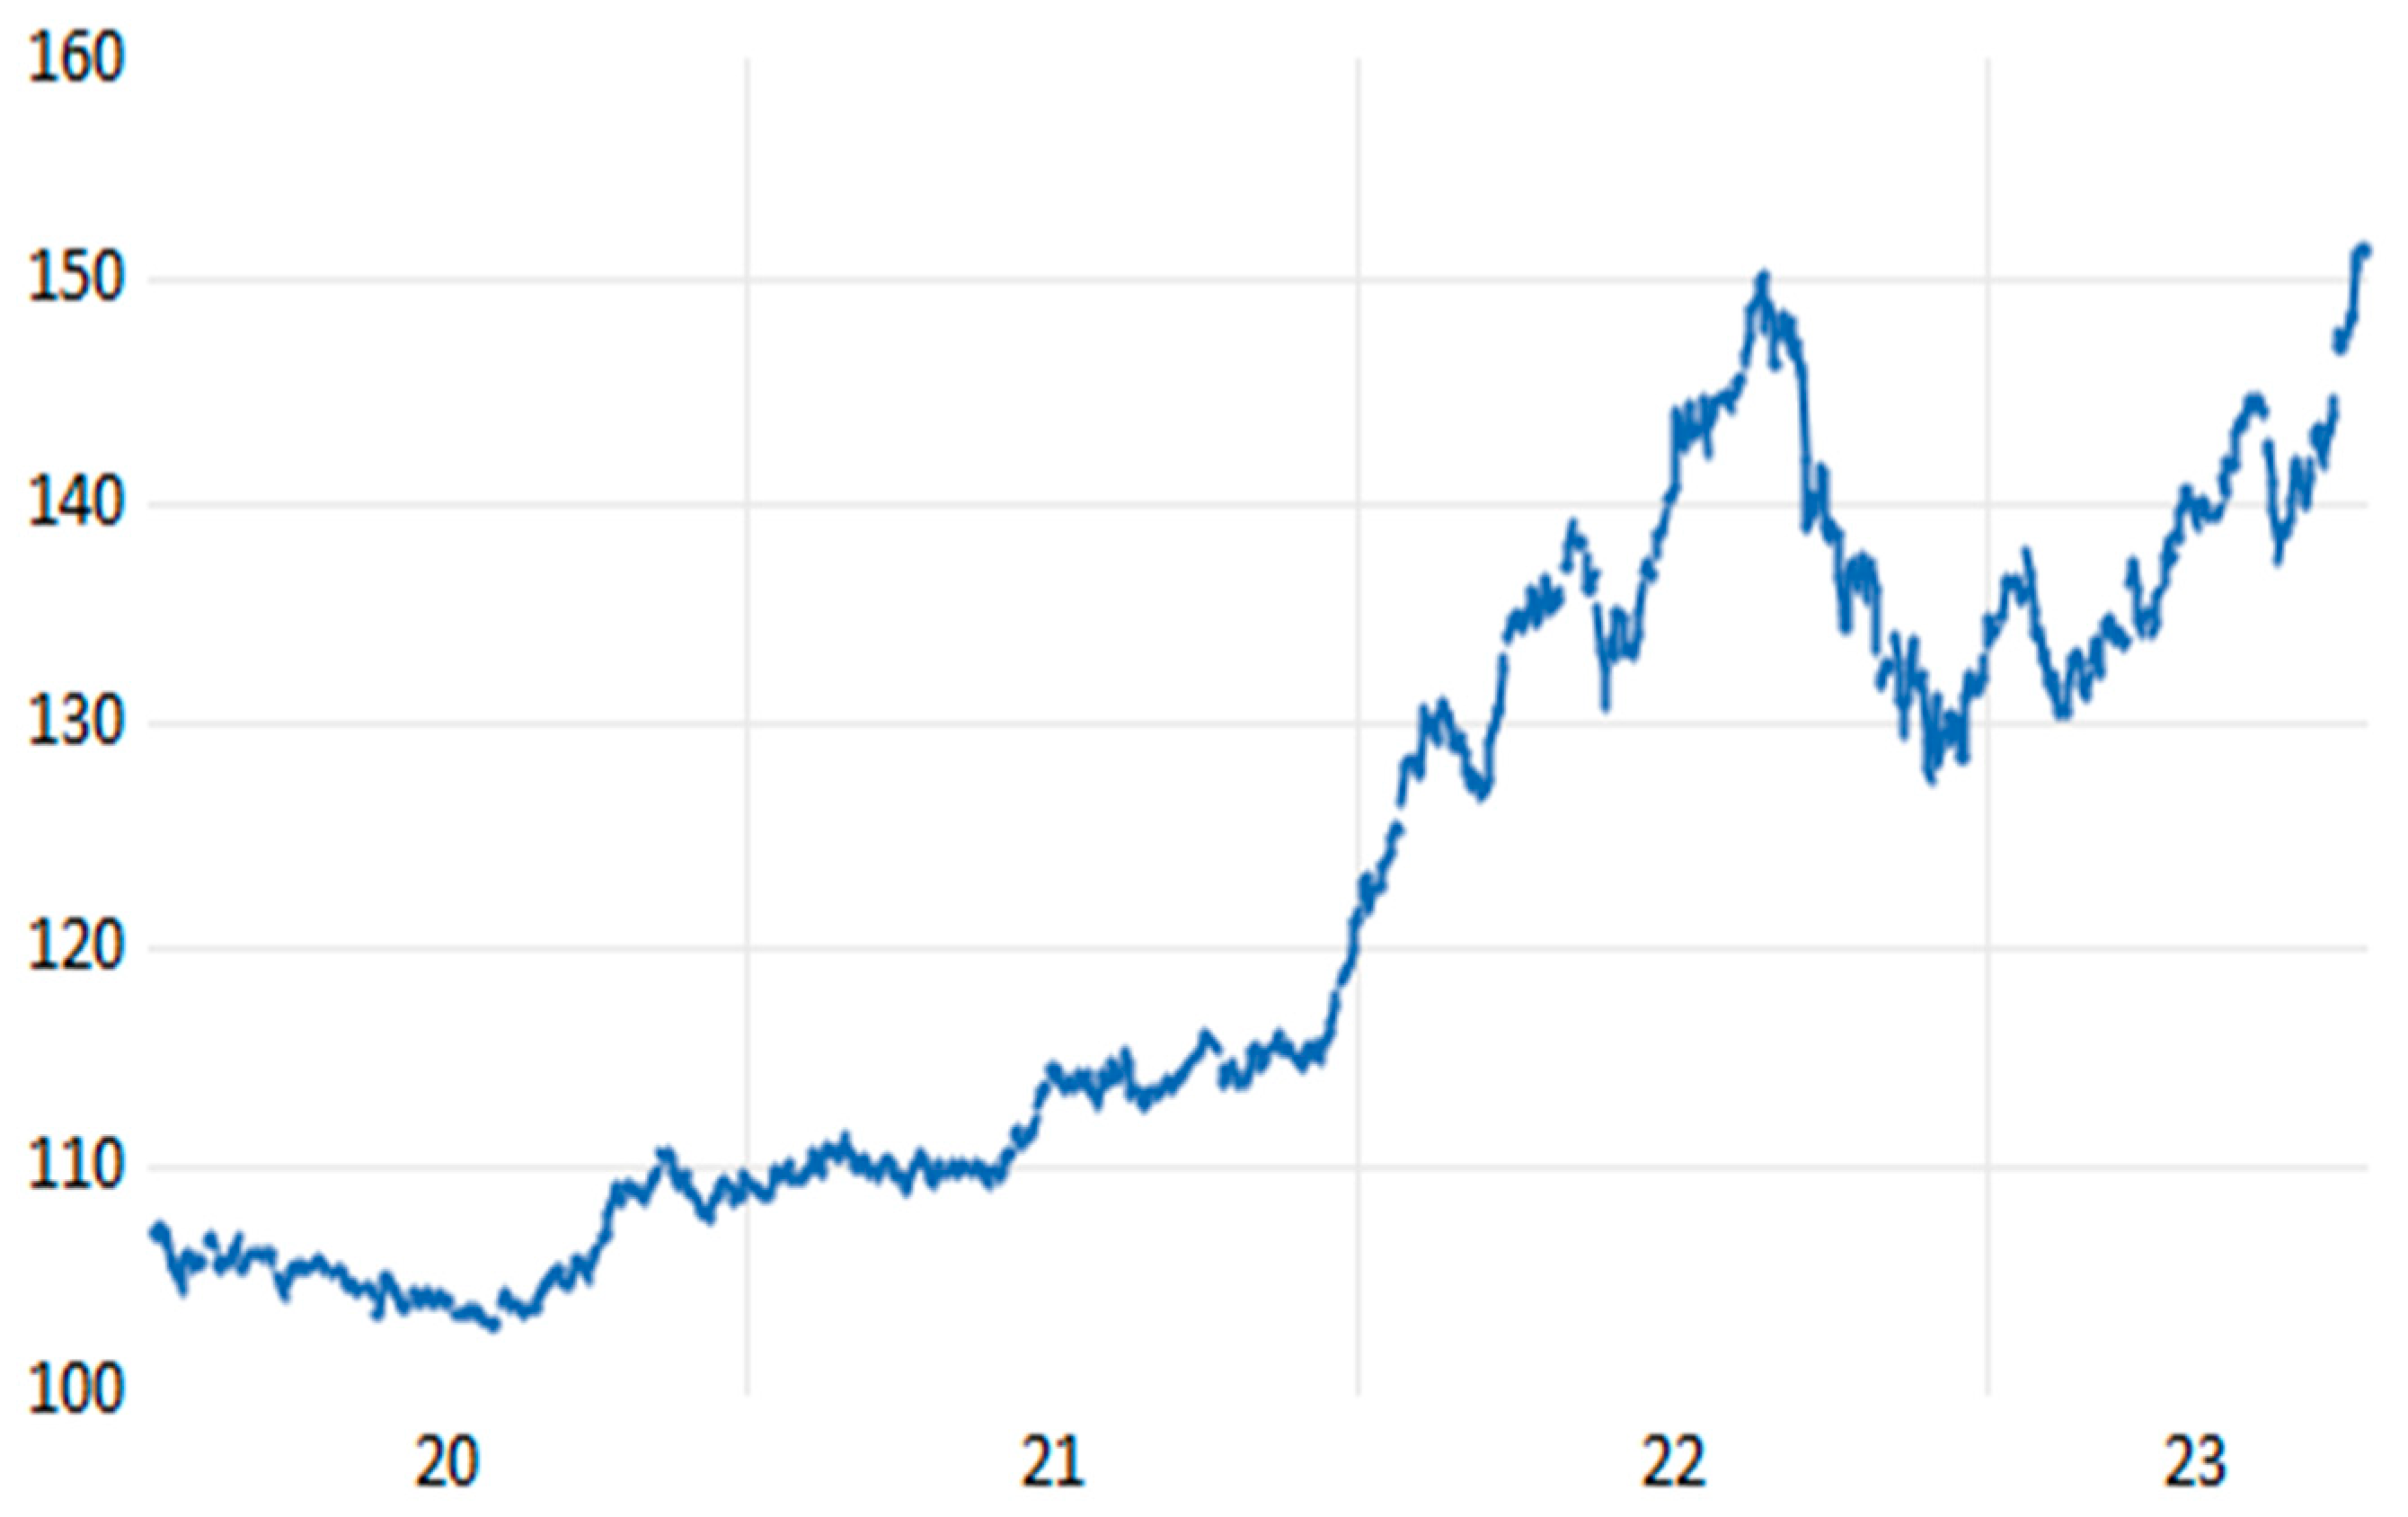
Japan is among the biggest importers of crude oil and it relies on their imports on the middle east. the patter of dependency is more important within the coming years due that fluctuation of the yen towards usa dollars is fierce especially within the first years of the studied period after the crisis of COVID19. The dollarization of the economic system by relying on USA dollar within the transactions make a tight relation between the exchange rate and the volatility of crude oil price.
Graph 2.
DDC Conditional correlation between Mexican peso exchange rate and oil price. Source : Own Study.
Graph 2.
DDC Conditional correlation between Mexican peso exchange rate and oil price. Source : Own Study.
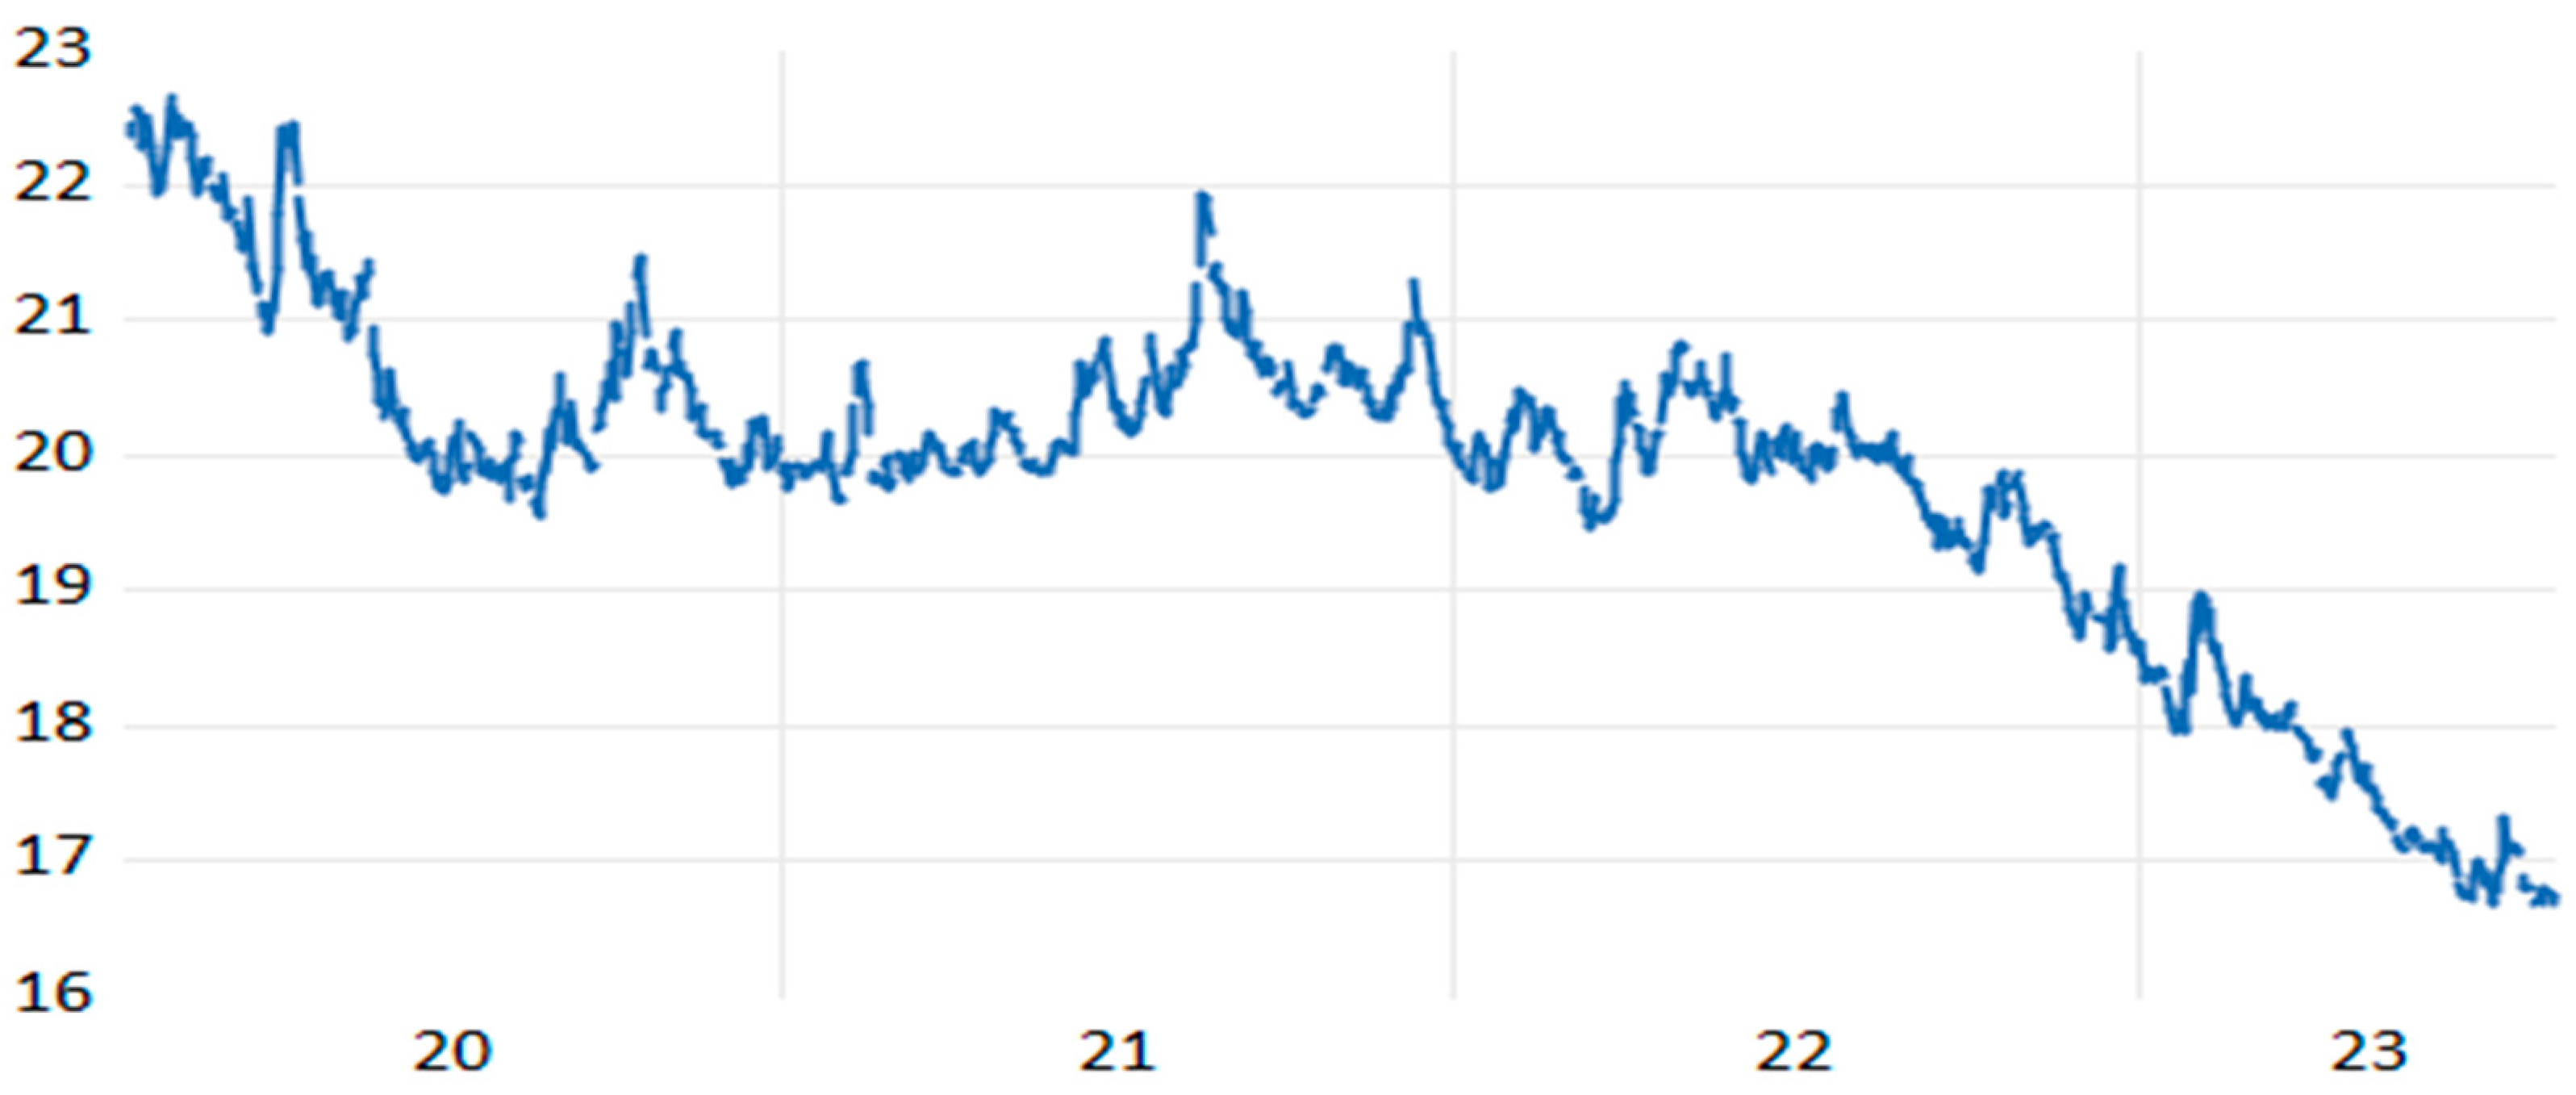
Mexico is among the largest producer of crude oil in the world. Despite that it is an important producer, mexico rely on the usa dollar within their imports which makes a tight dependency between the volatility of the crude oil and the exchange rate. The economic system of mexico is in tight dependency the the American economic system which make sense that the exports of crude oil are in made in dollar. For that reason the dollarization of the economic system for mexico make the exchange rate are in tight dependency with the volatility of crude oil price.
Graph 3.
DDC Conditional correlation between Canadian dollar exchange rate and oil price. Source : Own Study.
Graph 3.
DDC Conditional correlation between Canadian dollar exchange rate and oil price. Source : Own Study.
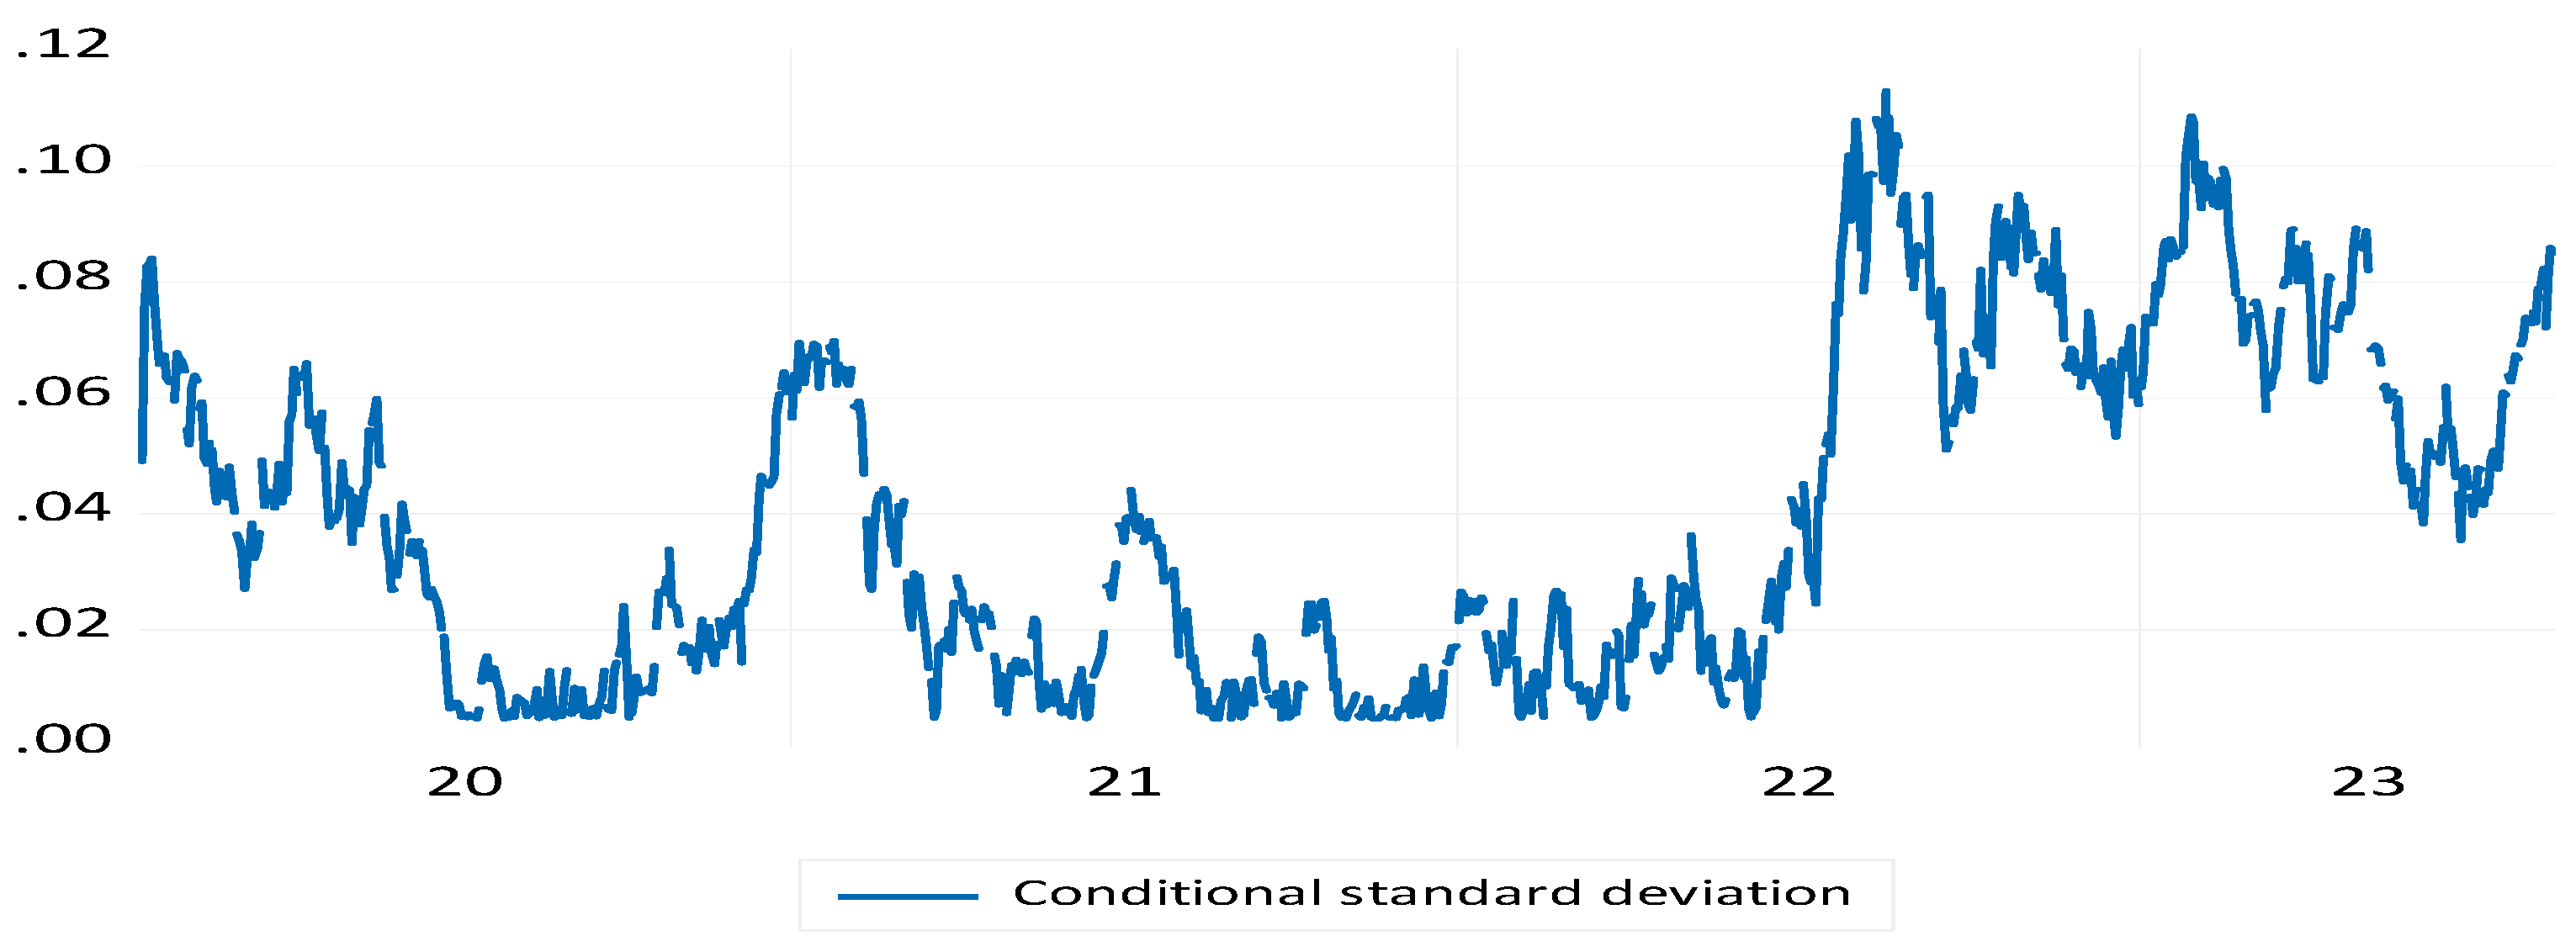
The Canadian dollar is somehow less powerful comparing to the other studied foreign exchange markets. Whithin the trend it is showed that the Canadian dollar is showing positive and stable impact toward the volatility of oil price within 2020 to 2021. However starting from 2022 to 2023 we see an important increase within the correlation between the oil price and the Canadian dollar . Such increase is explained by the new measures which has been taken international trade policies which are made in canada and USA which give the Canadian dollar more size within the foreign exchange markets all over the world. This is give another view for the Canadian dollar towards the dollar that the investors are still highly preferring the dollar towards Canadian dollar within the oil markets.
Graph 4.
DDC Conditional correlation between indian rupee exchange rate and oil price. Source : Own Study.
Graph 4.
DDC Conditional correlation between indian rupee exchange rate and oil price. Source : Own Study.
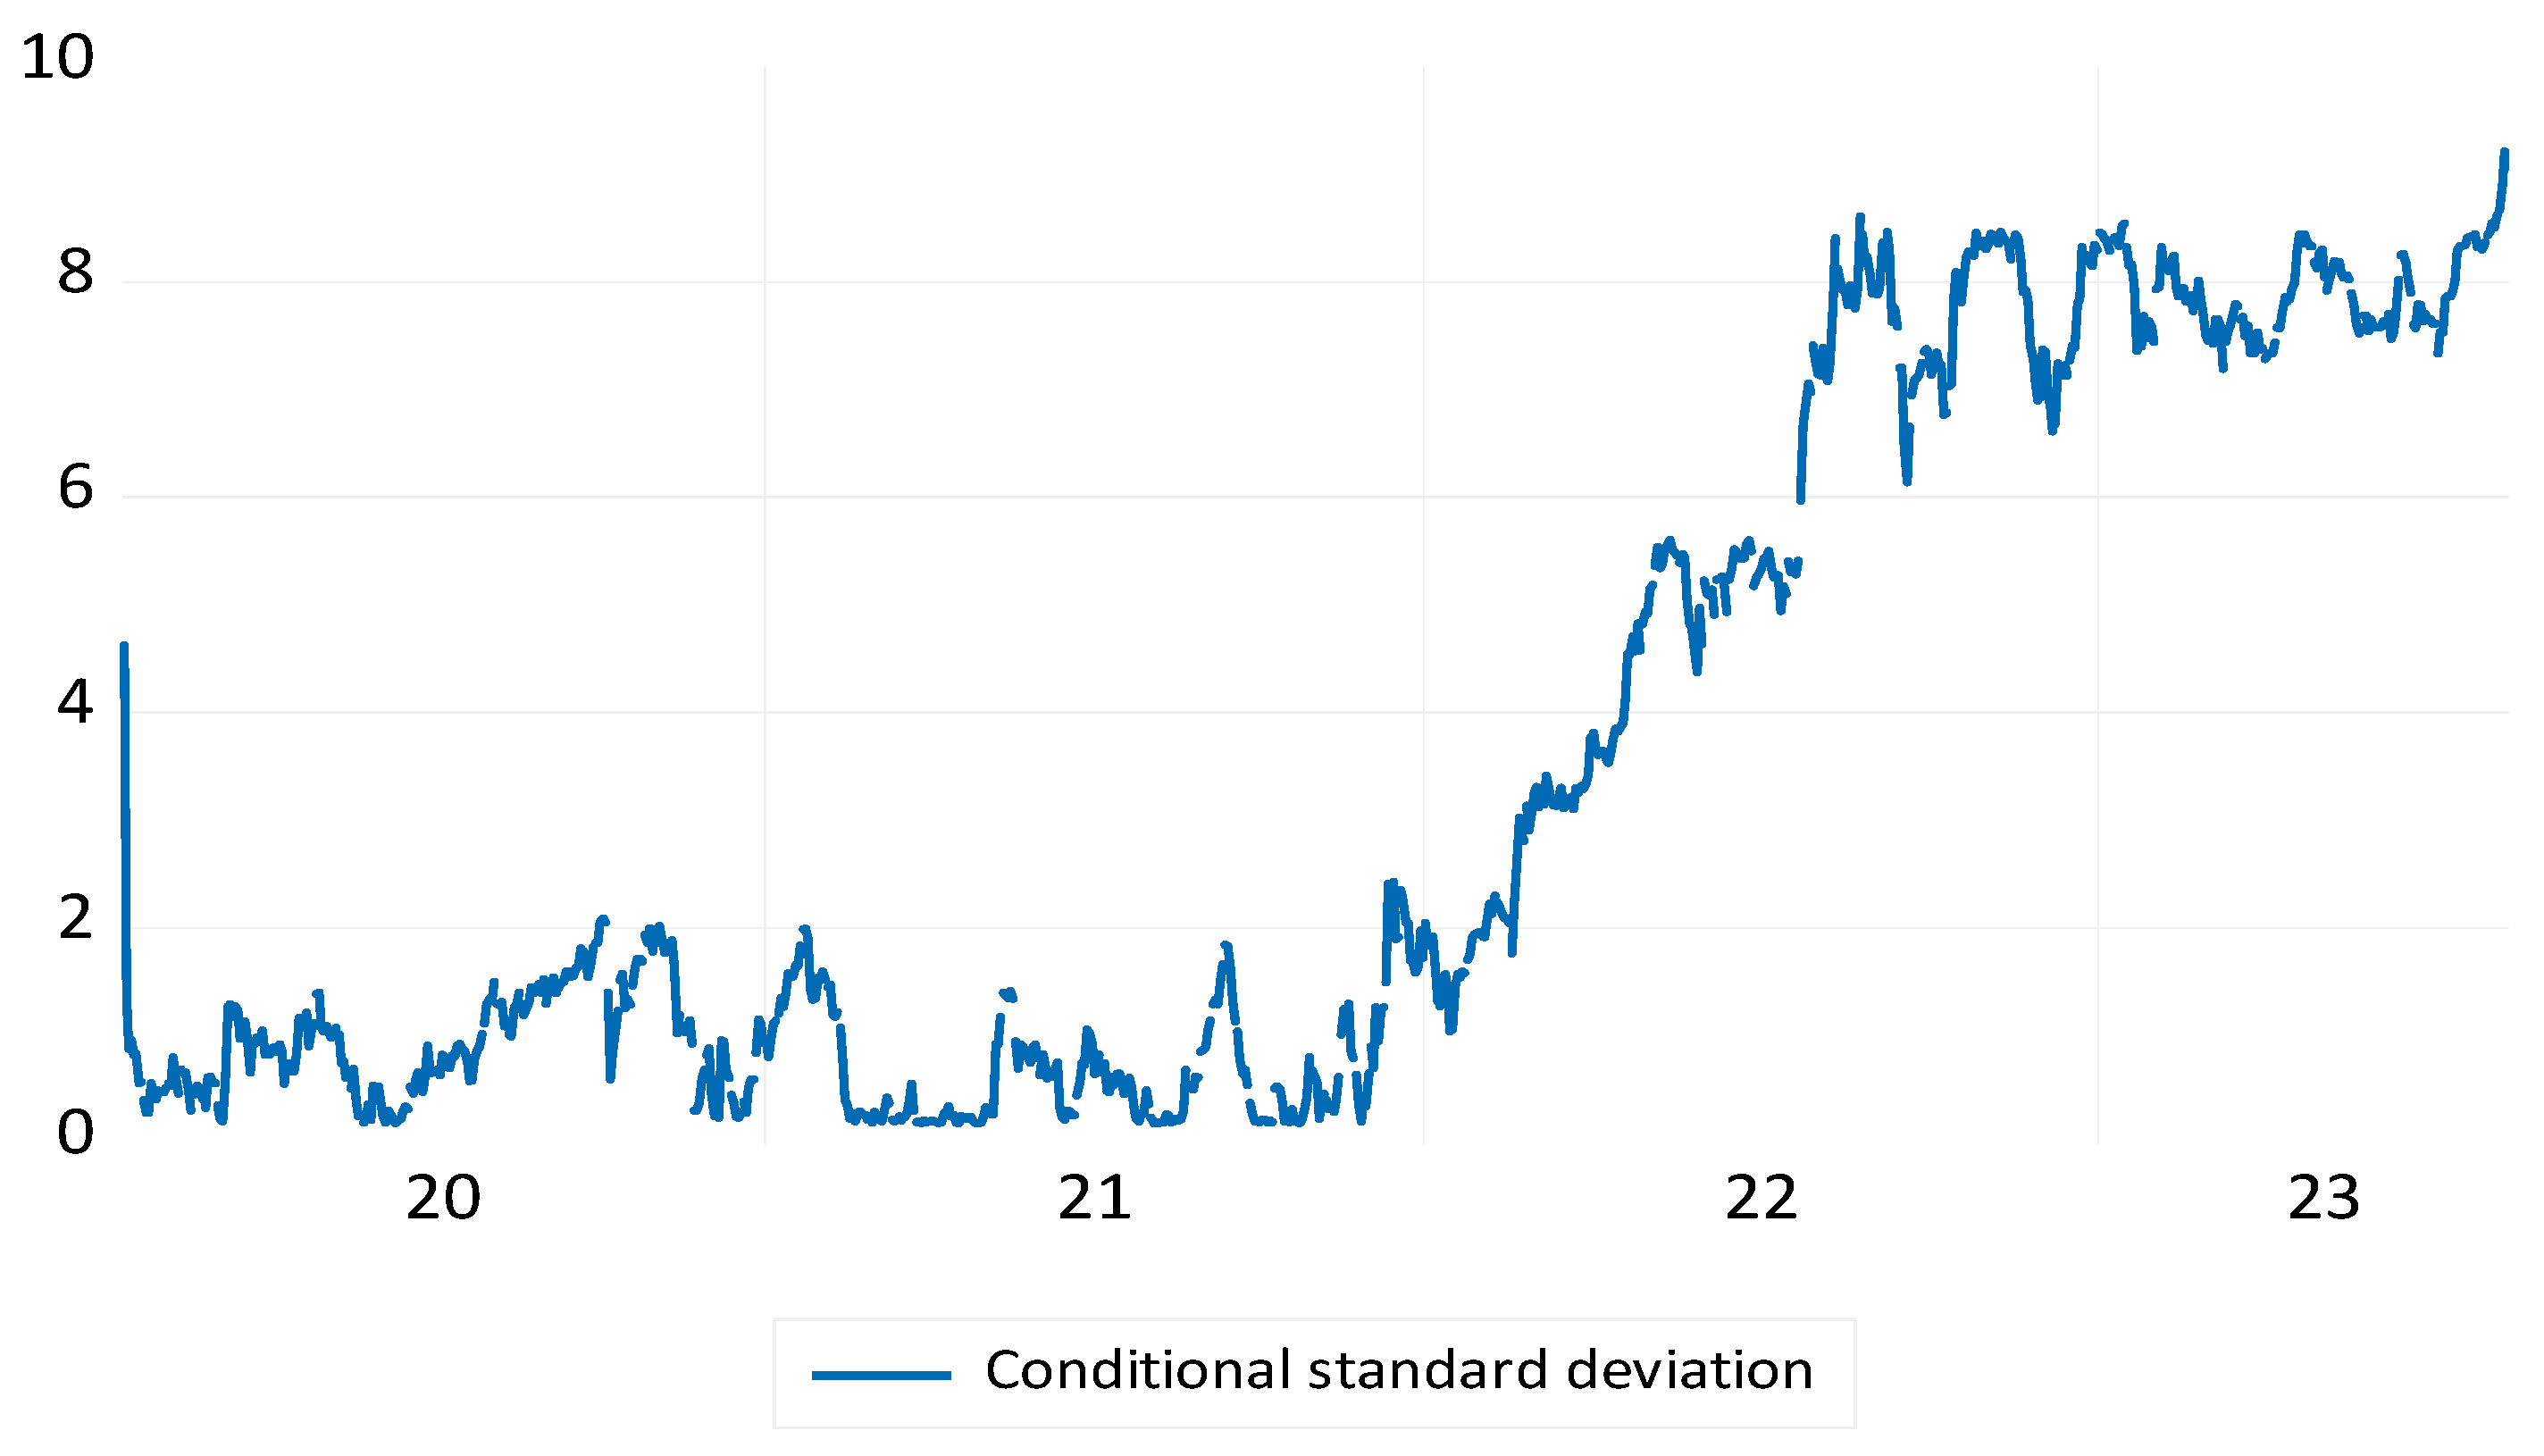
The indian rupee show constant positive correlation within 2020 and the half of the period 2021. However within the rest of the studied period the indian rupee show positive impact on the volatility of the oil price . this is proof that with sect part of the period the the investors show more interest for the dollar comparing to the rupee whithin the oil market. this can be transmitted as the indian marked are dollarized within the transaction of crude oil. India is know as the second importer of crude pol after china. This is confirming that the main operators the crude oil market is operating within the dollar more than the rupee which make indian rupee is highly dependent on the volatility of the oil price.
Graph 5.
DDC Conditional correlation between Russian rubble exchange rate and oil price. Source : Own Study.
Graph 5.
DDC Conditional correlation between Russian rubble exchange rate and oil price. Source : Own Study.
Russia is among the largest countries exporting crude oil in all over the world. Russia within their operation it is keep using the national money the Russian rubble while exporting the crude oil that is why we can see that the dollar didn’t influence their dependency towards the crude oil . the dollarization of the Russian foreign market didn’t take light within the selected period as long as Russia conduct a tight relation with the USA in the oil market. The world market of crude oil is relying on the most producers countries of oil within the volatility of the price which might explain why the rupee is not dependent to the oil market through the USA dollars however it is dependent for the volatility of the oil price as a main producer.
5. Conclusion and Policy Implications
Following the recent restructure of the main policies on the international trade , the oil market is well dominated the size of the international economy. Treating the impact of the volatility of foreign exchange rates on the oil markets bring for light the importance of dollarization within the world wide economy. Within that study we are using the five currencies such as the Japanese yen, the Mexican peso, the Canadian dollar, the indian rupee and the Russian rubble for the period stating from 2020 to 2023. An ongoing literature treating the subject for different exchange rates are interlinked by the dollarization of the foreign markets. The validity of this recent empirical drive has to do with the size of the country within the oil market as producer or importer. These leaving a puzzle which factors might interlink the volatility of foreign exchange rate to the oil price. This study focus on how the foreign exchange rates is influenced by the oil price volatility. The dollarization of the economic system lead the volatility of foreign exchange market the significant role of US dollar in driving the volatility of foreign exchange rate has influenced the majority of the studies currencies excepting the Russian rubble as it is the main leading currencies within the operating any transaction in crude oil outside Russia. Expectedly our findings show that there is a significant connectedness of oil marl price with the Japanese yen, the Canadian dollar, the Mexican peso and indian rupee. However the exchange rate of Russian rubble to usa dollar didn’t show any evidence connectedness with the volatility of oil price. Accordingly to these results, our fundings present opportunities for viable policy implications internationally. The dollarization of the world economy can be a quiete vigilent solution for the volatility of the oil price which might to a stability in the global business cycle and maintain the money value for each country at stable trend which lead to maintain a global inflation cycle controlled.
References
- Atems, B.; Kapper, D.; Lam, E. Do exchange rates respond asymmetrically to shocks in the crude oil market? Energy Econ. 2015, 49, 227–238. [Google Scholar] [CrossRef]
- Asadi, M.; Roubaud, D.; Tiwari, A.K. Volatility spillovers amid crude oil, natural gas, coal, stock, and currency markets in the US and China based on time and frequency domain connectedness. Energy Econ. 2022, 109. [Google Scholar] [CrossRef]
- Bloomberg, S.B.; Harris, E.S. The commodity-consumer price connection: fact or fable? Federal Reserve Board of New York. Economic Policy Review 1995, 21–38. [Google Scholar]
- Bollerslev, T. Generalized autoregressive conditional heteroskedasticity. J. Econ. 1986, 31, 307–327. [Google Scholar] [CrossRef]
- Cappiello, L.; Engle, R.F.; Sheppard, K. Asymmetric Dynamics in the Correlations of Global Equity and Bond Returns. J. Financial Econ. 2006, 4, 537–572. [Google Scholar] [CrossRef]
- Chkir, I.; Guesmi, K.; Ben Brayek, A.; Naoui, K. Modelling the nonlinear relationship between oil prices, stock markets, and exchange rates in oil-exporting and oil-importing countries. Res. Int. Bus. Finance 2020, 54, 101274. [Google Scholar] [CrossRef]
- Engle, R.F. Autoregressive Conditional Heteroscedasticity with Estimates of the Variance of United Kingdom Inflation. Econometrica 1982, 50, 987–1007. [Google Scholar] [CrossRef]
- Huang, S.; An, H.; Gao, X.; Wen, S.; Hao, X. Themultiscaleimpactofexchangerates ontheoil-stocknexus:evidencefromChinaandRussia. Appl. Energy 2017, 194, 667–678. [Google Scholar] [CrossRef]
- Ji, Q.; Liu, B.-Y.; Fan, Y. RiskDependenceofCoVaRandStructuralChangeBetweenOil PricesandExchangeRates:ATime-varyingCopulaModel. Energyeconomics 2018. [Google Scholar]
- Jiang, Y.; Feng, Q.; Mo, B.; Nie, H. Visiting the effects of oil price shocks on exchange rates: Quantile-on-quantile and causality-in-quantiles approaches. North Am. J. Econ. Finance 2020, 52. [Google Scholar] [CrossRef]
- Krugman, P. OilandtheDollar. In Economic InterdependenceandFlexibleExchangeRates; INBahandari, JS, Putnam, BH, Eds.; MITPress: Cambridge,MA, 1983. [Google Scholar]
- Kyriazis, N.; Corbet, S. The role of international currency spillovers in shaping exchange rate dynamics in Latin America. Q. Rev. Econ. Finance 2024, 94, 1–10. [Google Scholar] [CrossRef]
- Umar, Z.; Aziz, M.I.A.; Zaremba, A.; Tran, D.K. Modelling dynamic connectedness between oil price shocks and exchange rates in ASEAN+3 economies. Appl. Econ. 2023, 55, 2676–2693. [Google Scholar] [CrossRef]
- Xu, Y.; Han, L.; Wan, L.; Yin, L. Dynamic link between oil prices and exchange rates: A non-linear approach. Energy Econ. 2019, 84. [Google Scholar] [CrossRef]
- Wang, Y.; Chen, J.; Ren, X. Asymmetric effects of crude oil prices and USD exchange rate on precious metals returns:Evidence from pre and during COVID-19 outbreak. Heliyon 2023, 9, e21996. [Google Scholar] [CrossRef] [PubMed]
Figure 1.
Source: Own study.
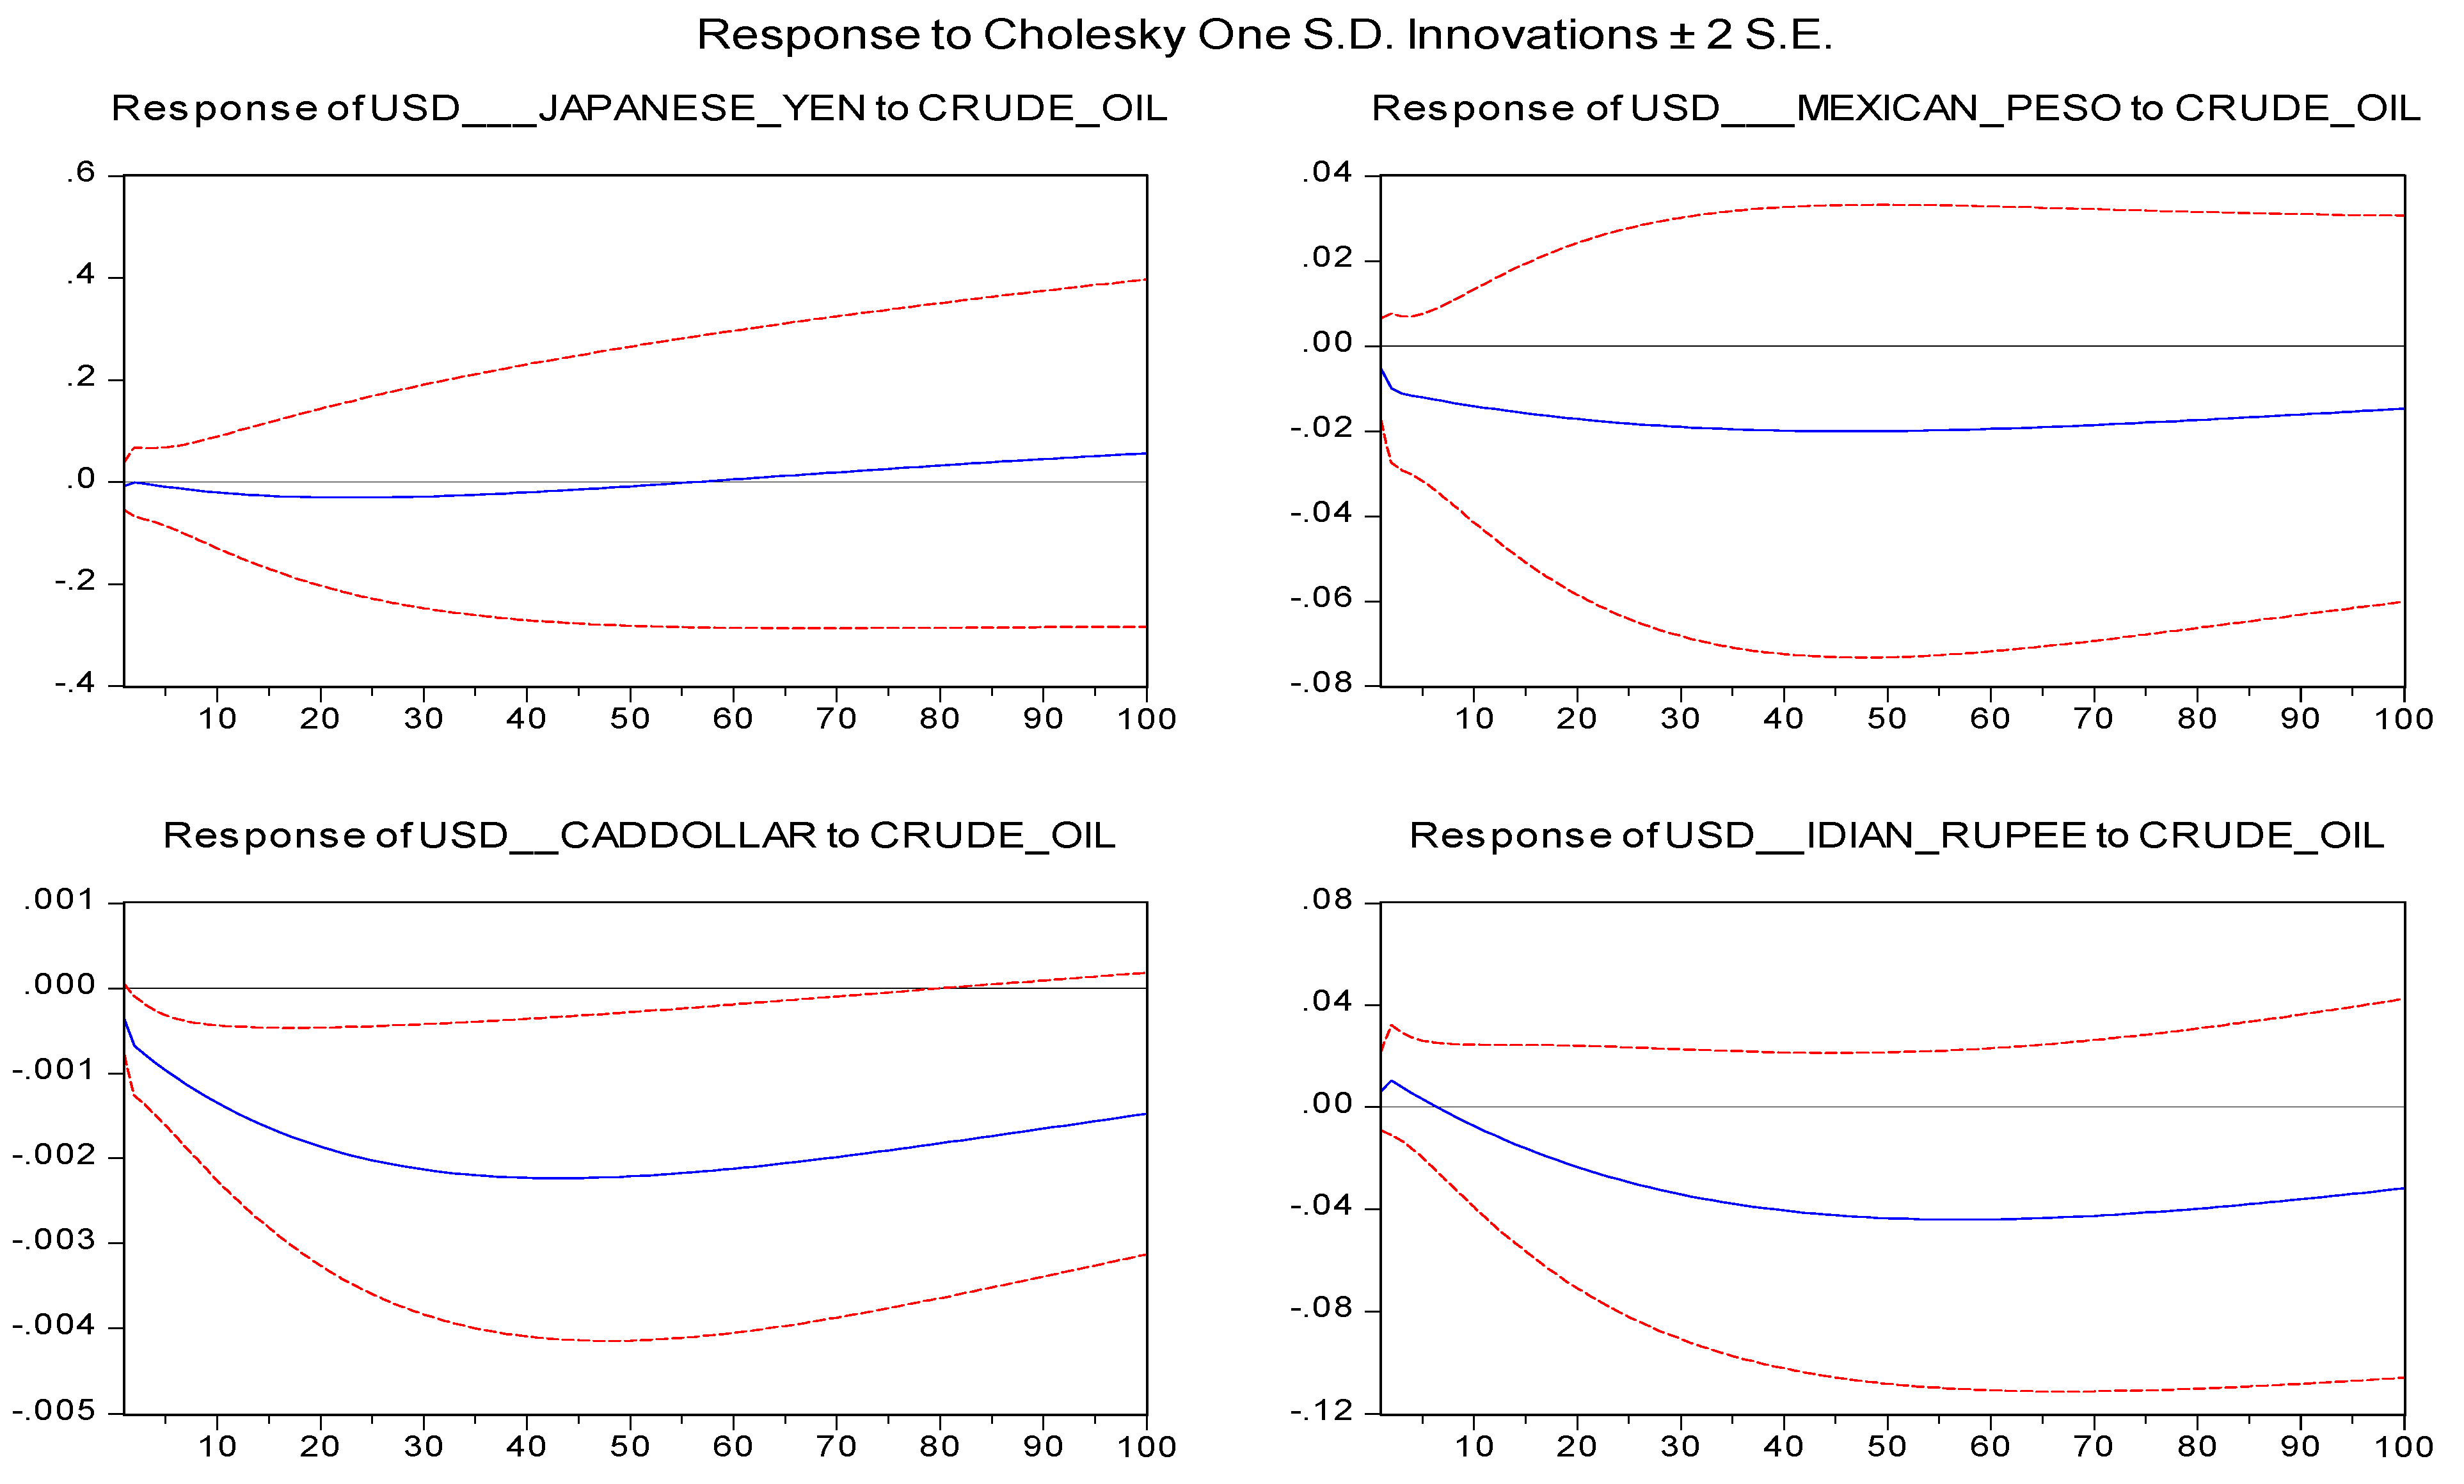
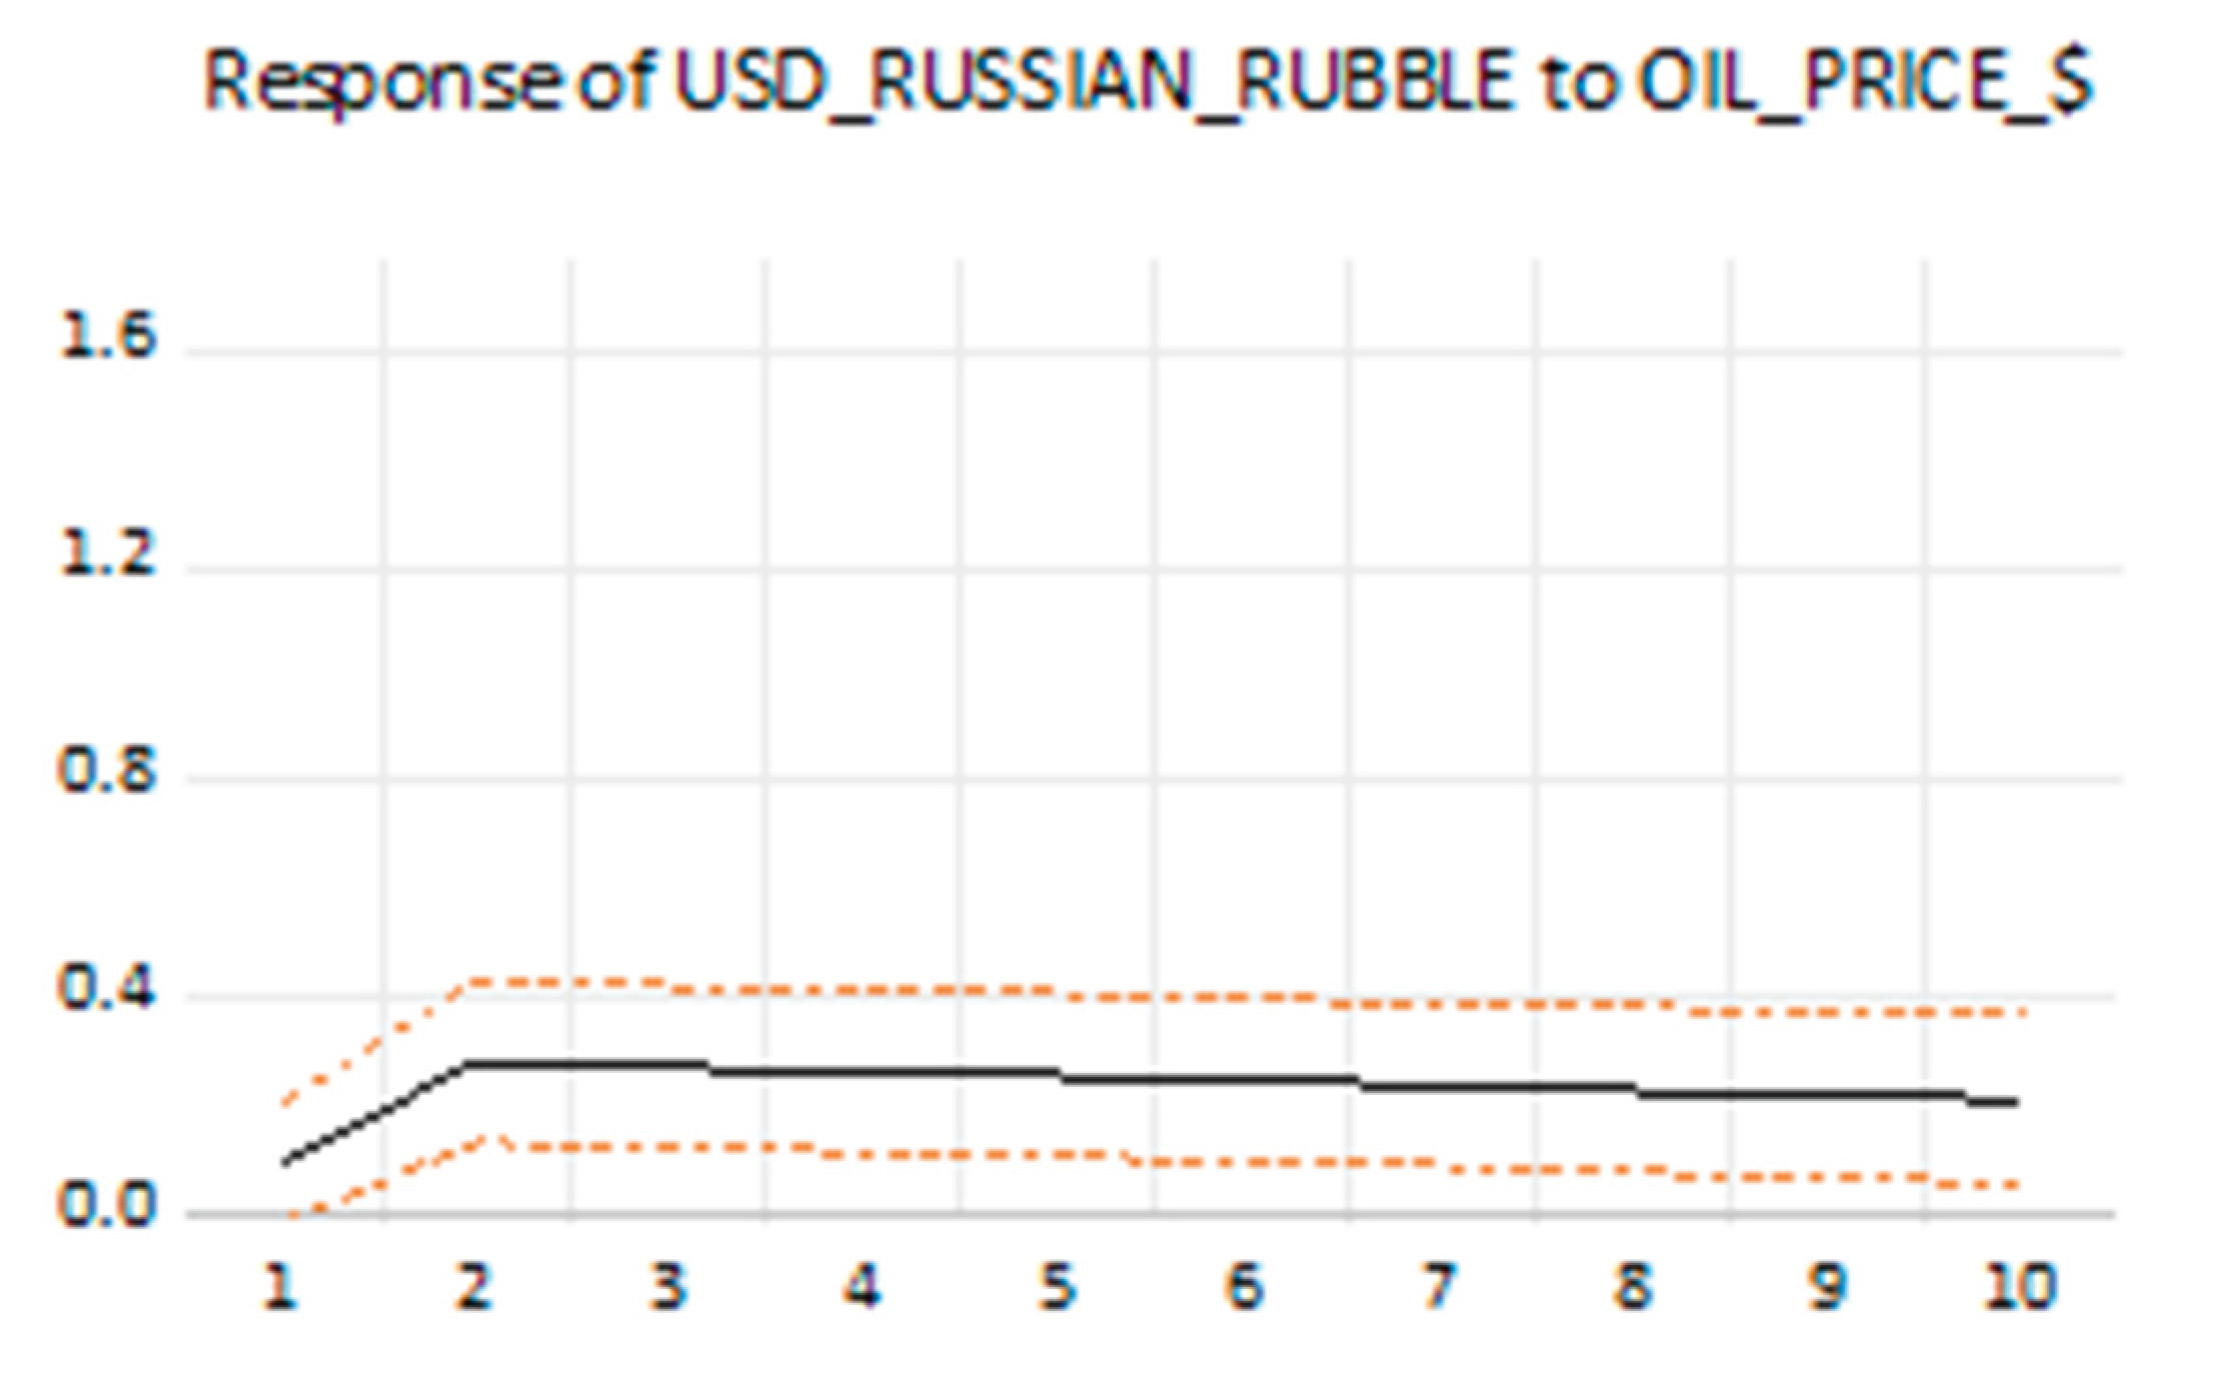

Table 1.
Descriptive Data.
| Data | Description |
| Energy | Crude oil price in US Dollar per Barrel |
| Mexican | Peso Mexican to US $ |
| Japanese yen | Japanse Yen to US $ |
| Russian | Ruble Russian to US $ |
| Chinese | Yuan Chinese to US$ |
| Australian | Australian dollar to US $ |
Table 2.
Summary Statistics.
| Crude oil | USD/Japanese Yen | USD/Mexican Pesos | USD/Canadian Dollar | USD/Indian Rupee | USD/Russian Rubble | |
| Mean | 72.35074 | 118.6943 | 20.28068 | 1.305822 | 76.49582 | 73.04935 |
| Median | 74.49000 | 111.4400 | 20.10270 | 1.301000 | 75.13100 | 73.66030 |
| Maximum | 133.1800 | 150.3200 | 25.11300 | 1.462200 | 83.03700 | 143.0000 |
| Minimum | 9.120000 | 102.8300 | 17.08000 | 1.203900 | 70.80800 | 51.45000 |
| Std. Dev. | 24.96555 | 13.60424 | 1.454220 | 0.049583 | 3.529688 | 9.239425 |
| Skewness | -0.056550 | 0.651157 | 0.658737 | 0.264079 | 0.620975 | 1.446933 |
| Kurtosis | 2.580234 | 1.889411 | 4.135947 | 2.409354 | 1.983891 | 10.34939 |
| Jarque-Bera | 7.173937 | 111.1962 | 114.8662 | 23.83080 | 97.73954 | 2511.115 |
| Probability | 0.027682 | 0.000000 | 0.000000 | 0.000007 | 0.000000 | 0.000000 |
Disclaimer/Publisher’s Note: The statements, opinions and data contained in all publications are solely those of the individual author(s) and contributor(s) and not of MDPI and/or the editor(s). MDPI and/or the editor(s) disclaim responsibility for any injury to people or property resulting from any ideas, methods, instructions or products referred to in the content. |
© 2025 by the authors. Licensee MDPI, Basel, Switzerland. This article is an open access article distributed under the terms and conditions of the Creative Commons Attribution (CC BY) license (http://creativecommons.org/licenses/by/4.0/).
Copyright: This open access article is published under a Creative Commons CC BY 4.0 license, which permit the free download, distribution, and reuse, provided that the author and preprint are cited in any reuse.


