
Submitted:
08 December 2025
Posted:
09 December 2025
You are already at the latest version
Abstract
Background: Hyperuricemia and hyperlipidemia frequently coexist in metabolic syndrome, yet their shared pathogenic mechanisms remain insufficiently elucidated. Identifying convergent molecular pathways may provide novel therapeutic targets for metabolic comorbidity. Methods: A multi-omics strategy integrating multi-trait genome-wide association analysis (MTAG), weighted gene co-expression network analysis (WGCNA), protein–protein interaction (PPI) network construction, and functional enrichment analysis was employed to identify common genetic drivers of hyperuricemia and hyperlipidemia. To validate the bioinformatic findings, a high-purine and high-fat diet-induced quail model of combined hyperuricemia and hyperlipidemia was established, and the expression levels of NAMPT and SIRT1 were assessed in serum and metabolic tissues. Results: Multi-trait genetic association analysis revealed that the NAMPT–SIRT1 signaling pathway demonstrated a 66.7% genetic overlap and a 100% target gene detection rate, accompanied by significant enrichment in the nicotinamide metabolic pathway (P=2.1×10⁻¹²). In vivo validation showed markedly decreased expression of NAMPT and SIRT1 in both serum and liver tissues of comorbid model animals, aligning with the predicted molecular dysregulation pattern. Conclusion: By integrating multi-omics screening with experimental validation in an avian model, this study highlights the NAMPT–SIRT1 axis as a core molecular hub linking hyperuricemia and hyperlipidemia. These findings provide mechanistic insight into metabolic comorbidity and suggest NAMPT–SIRT1 signaling as a promising target for therapeutic intervention and drug development.
Keywords:
Hyperuricemia
; Hyperlipidemia
; Nicotinamide metabolism
; Multi-omics
; Metabolic comorbidity
1. Introduction
In recent years, the incidence of metabolic disorders has been continuously rising worldwide. Multiple metabolic abnormalities, such as hyperglycemia, hyperlipidemia, hyperuricemia, and obesity, interact with each other, collectively leading to homeostatic imbalance across multiple organs and systems, posing a significant public health challenge[1-5]. Among these, hyperuricemia (HUA) is a purine metabolism disorder caused by an imbalance between uric acid production and excretion[6-7], while hyperlipidemia (HLP) is a clinical syndrome characterized by dysregulated lipid metabolism[8]. Both diseases exhibit a marked increasing trend and have become key targets in the prevention and control of chronic non-communicable diseases.
Epidemiological data indicate that the overall prevalence of HUA worldwide ranges from 10% to 20%, with the number of affected individuals continuously increasing. By 2021, the global patient population had reached nearly 1.05 billion[9-13]. In China, the prevalence of HUA among adults is 14.0%, making it the second most common metabolic disorder after diabetes[7]. Meanwhile, approximately 38.9% of adults globally suffer from HLP[14-15], while in China, the overall prevalence of dyslipidemia in adults is 35.6%, with a continuously rising trend[8], suggesting that HLP has become a critical warning sign for various cardiovascular events. Notably, HUA and HLP frequently coexist, with each acting as a risk factor for the other, significantly increasing the risk of comorbidities such as metabolic syndrome, atherosclerosis, and chronic kidney disease. Therefore, in-depth investigation of the pathological characteristics and underlying molecular mechanisms of HUA and HLP in their comorbid state holds significant clinical and research value.
With advances in genetic research technologies, methods such as genome-wide association studies (GWAS) and Mendelian randomization (MR) have been widely applied to dissect the genetic basis of complex metabolic traits. A study integrating genetic data from 343,836 participants, combining MR, summary-data-based Mendelian randomization (SMR) analysis, and colocalization approaches, successfully identified 22 potential druggable gene targets that may regulate serum uric acid levels[16]. Another GWAS analyzed over 11 million single nucleotide polymorphisms (SNPs) in 150,542 individuals and identified 13 key genetic loci associated with uric acid metabolism[17-18]. Furthermore, research has shown that the GWAS-identified SNP rs13282783 can promote lipid metabolic dysfunction by upregulating miR-320a expression, thereby contributing to the development of HLP[19]. Additionally, data analysis based on the Taiwan Biobank (TWB) has revealed that the rs651821 variant is a significant genetic factor influencing the risk of HLP[20].
Research on the shared genetic basis and common pathogenic pathways underlying HUA and HLP remains relatively limited. This study aims to systematically investigate the shared molecular mechanisms of comorbid HUA and HLP from a multi-omics perspective. At the bioinformatics level: we employed multi-trait analysis of genome-wide association studies (MTAG) to identify shared genetic variants between the two traits; applied weighted gene co-expression network analysis (WGCNA) to detect highly co-expressed gene modules under specific tissue or disease conditions and to screen for key hub genes; and further integrated protein-protein interaction (PPI) network construction with functional enrichment analysis to comprehensively elucidate the potential biological pathways and regulatory networks involved. At the experimental validation level: we established an animal model of HUA-HLP induced by a high-purine and high-fat diet, assessed changes in uric acid- and lipid metabolism-related biomarkers as well as the activities of key metabolic enzymes, and characterized the model’s pathophysiological features. Moreover, using techniques such as enzyme-linked immunosorbent assay (ELISA) and quantitative real-time polymerase chain reaction (q-PCR), we validated alterations in key molecular pathways at the whole-animal level, thereby achieving a closed-loop research framework from “omics-based prediction” to “experimental validation”.
2. Methods
2.1. Multi-Omics Analysis
2.1.1. Data Sources and Preprocessing
Publicly available GWAS summary statistics for hyperuricemia and hyperlipidemia were obtained from large-scale cohorts previously reported in peer-reviewed studies[21-24]. For each trait, 30 independent genome-wide significant loci (P<5×10⁻⁸) were included for further analysis. Gene expression profiles were retrieved from the GEO database and consisted of 2,000 genes across 60 samples, including healthy controls, hyperuricemia, hyperlipidemia, and comorbidity groups. All datasets underwent standardized normalization, batch-effect correction, and quality control before downstream analysis.
2.1.2. Multi-Trait Genome-Wide Association Analysis
To identify shared genetic architecture between HUA and HLP, MTAG was performed[25]. MTAG increases detection power for pleiotropic loci by jointly modeling summary statistics across traits using a chi-square-based framework[26]. Combined significance was calculated using the formula Pcombined = 1-F2(2, df=4)
Expression data covering 32 pre-identified candidate genes were cross-referenced to ensure integrative evaluation at both genetic and transcriptional levels.
2.1.3. Weighted Gene Co-Expression Network Analysis
WGCNA was applied to identify co-regulated gene modules associated with metabolic traits[27]. An optimal soft-thresholding power (β=6) was selected according to the scale-free topology criterion[28]. Network construction and module detection were performed using dynamic tree cutting with a minimum module size of 30 and a merging threshold of 0.25. Key modules enriched in target genes were extracted for functional interpretation.
2.1.4. Protein–Protein Interaction Network Construction
PPI networks were constructed using interaction data from the STRING database[29-30]. Network visualization and topological feature analysis were conducted using the igraph package in R. The final network comprised 23 nodes and 24 edges. Hub proteins were identified based on degree centrality and network connectivity density.
2.1.5. Functional Enrichment Analysis
Gene Ontology (GO) biological process terms and Kyoto Encyclopedia of Genes and Genomes (KEGG) pathways were enriched using the clusterProfiler package[31-33]. An adjusted P-value (FDR-corrected Padj)<0.10 was set as the threshold for statistical significance. Enrichment patterns were interpreted to determine biological processes and signaling pathways underlying metabolic comorbidity.
2.1.6. Statistical Analysis and Visualization
Continuous variables with normal distribution were expressed as mean±standard deviation and compared using Student’s t-test. Non-normally distributed data were presented as median (interquartile range) and analyzed using the Mann–Whitney U or Kruskal–Wallis H test. Categorical variables were analyzed using chi-square or Fisher’s exact test. Two-sided P < 0.05 was considered statistically significant. Manhattan plots, Venn diagrams, heatmaps, and network visualizations were generated using R packages.
2.2. Animal Experiment
2.2.1. Experimental Animals
Twenty male Dwarf quails (150±10g) were purchased from a certified breeding facility (Quail King Farm, Beijing, Animal Health Certificate No. 1101198808). Animals were housed under controlled environmental conditions (temperature 23±1 °C, humidity 45±5%, 12 h light/dark cycle) and acclimatized for 3 days. All procedures were approved by the Institutional Animal Ethics Committee (Approval No. BUCM-2025031007-1147).
2.2.2. Reagents and Kits

Table 1.
Reagents Used in This Study.
| Category | Reagent | Manufacturer/Supplier | Catalog/Batch No. | Notes/Specifications |
| Diet Components | Yeast extract powder | Oxoid, UK | 4448128-02 | High-purine diet |
| Diet Components | Lard | Shuanghui Edible Oil Technology Co., China | Q/DZSH 0024S | High-fat diet |
| Biochemical Assay Kit | Uric Acid Assay Kit | Zhongsheng Beikong Biotechnology Co., China | 241442 | Enzymatic method |
| Biochemical Assay Kit | Triglyceride Assay Kit | Nanjing Jiancheng Institute of Bioengineering, China | 20250418 | Colorimetric assay |
| Biochemical Assay Kit | Total Cholesterol Assay Kit | Nanjing Jiancheng Institute of Bioengineering, China | 20250416 | Enzymatic assay |
| Biochemical Assay Kit | Low-Density Lipoprotein Cholesterol Assay Kit | Nanjing Jiancheng Institute of Bioengineering, China | 20250320 | Enzymatic assay |
| Biochemical Assay Kit | High-Density Lipoprotein Cholesterol Assay Kit | Nanjing Jiancheng Institute of Bioengineering, China | 20250319 | Enzymatic assay |
| Protein Quantification | BCA Protein Assay Kit | NCM Biotech Co., China | 20250520 | Protein concentration |
| Enzyme Activity Assay | Xanthine Oxidase (XOD) Kit | Nanjing Jiancheng Institute of Bioengineering, China | 20250411 | Serum/Liver |
| Enzyme Activity Assay | Adenosine Deaminase (ADA) Kit | Nanjing Jiancheng Institute of Bioengineering, China | 20250410 | Colorimetric |
| Enzyme Activity Assay | Acetyl-CoA Carboxylase (ACC) Kit | Edison Biotechnology Co., China | ADS20250530 | Microplate |
| Enzyme Activity Assay | Hepatic Lipase(HL)Kit | Edison Biotechnology Co., China | ADS20250419 | Microplate |
| ELISA Kit | Chicken NAMPT ELISA Kit | Jiangsu Kete Biotechnology Co., China | KT0102-ChA | Sandwich ELISA |
| ELISA Kit | Chicken SIRT1 ELISA Kit | Jiangsu Kete Biotechnology Co., China | KT4371-A | Sandwich ELISA |
| Buffer | PBS | Aoqing Biotechnology Co., China | 15002109029 | pH 7.4 |
| Solvent | Chloroform | Tongguang Fine Chemical Co., China | 20240116 | Analytical grade |
| Solvent | Isopropanol | Macklin Biotech, China | C16366803 | Molecular biology grade |
| Solvent | Absolute Ethanol | Tianjin Zhiyuan Chemical Reagent Co., China | 20230301 | Molecular biology grade |
| Solvent | Ultrapure Water | Bairuiji Biotechnology Co., China | 20250506 | RNase/DNase-free |
| RNA Extraction | TRIzol Reagent | Thermo Fisher Scientific, USA | 10177091 | RNA isolation |
| Reverse Transcription | RevertAid cDNA Synthesis Kit | Thermo Fisher Scientific, USA | 2996493 | cDNA synthesis |
| qPCR | PowerUp SYBR Green Master Mix | Thermo Fisher Scientific, USA | 3056716 | qPCR reagent |
2.2.3. Equipment
Table 2.
Instruments and Equipment Used in This Study.
| Equipment | Model | Manufacturer | Country |
| Microplate Reader | Sunrise | Tecan | Switzerland |
| Refrigerated High-Speed Centrifuge | 3K15 | Sigma | Germany |
| Constant Temperature Water Bath | HH-600 | Beijing Medical Equipment Co. | China |
| Analytical Balance | AHIMADZUB1-220H | Shimadzu | Japan |
| Tissue Homogenizer | High-throughput model | Ningbo Xinzhi Biotechnology Co. | China |
| NanoDrop Spectrophotometer | NanoDrop One | Thermo Fisher Scientific | USA |
| PCR Thermocycler | T100 | Bio-Rad | USA |
| Real-Time PCR System | CFX96 | Bio-Rad | USA |
2.2.4. Grouping and Model Induction
Quails were randomly assigned into a control group and a comorbidity model group (n = 10 per group). The model group received a high-purine and high-fat diet consisting of standard feed mixed with yeast extract and lard at a ratio of 15:2:3. Animals had ad libitum access to water. The control group received standard diet and water only. The intervention lasted 35 days.
2.2.5. Sample Collection
Blood samples were collected via jugular venipuncture on days 7, 14, 21, 28, and 35 following 12 h fasting. Serum was separated at 1600×g for 10 min for uric acid quantification. Fecal–urine mixed excreta were collected one day prior to blood sampling, dissolved in saline, and centrifuged for uric acid detection. After euthanasia, liver tissues were excised and homogenized for biochemical assays.
2.2.6. Biochemical Measurements
Serum levels of triglycerides (TG), total cholesterol (TC), low-density lipoprotein cholesterol (LDL-C), and high-density lipoprotein cholesterol (HDL-C) were measured enzymatically. Hepatic and serum activities of xanthine oxidase (XOD) and adenosine deaminase (ADA) were quantified using colorimetric assays. Lipid metabolism enzymes including fatty acid synthase (FAS), lipoprotein lipase (LPL), hepatic lipase (HL), and acetyl-CoA carboxylase (ACC) were assessed using microplate-based methods. NAMPT and SIRT1 protein levels were determined via ELISA.
Total RNA from liver and adipose tissues was extracted using TRIzol and reverse transcribed to cDNA. Quantitative PCR was performed with β-actin as the reference gene. Relative gene expression of NAMPT and SIRT1 was calculated using the 2⁻ΔΔCt method.
2.2.7. Statistical Analysis
Statistical analyses were performed using SPSS 27.0. For normally distributed data, one-way ANOVA with LSD or Dunnett T3 post hoc tests (depending on variance homogeneity) was applied. For non-normal data, Kruskal–Wallis H test followed by Dunn’s post hoc rank comparison was used. Adjusted P<0.05 was considered statistically significant.
3. Results
3.1. Genome-Wide Association Signals Reveal Substantial Shared Genetic Architecture Between Hyperuricemia and Hyperlipidemia
To elucidate the shared genetic basis between hyperuricemia and hyperlipidemia, a multivariate MTAG framework was applied to the combined GWAS summary statistics. The analysis identified 40 genome-wide significant loci, of which 20 were jointly associated with both traits, corresponding to a substantial genetic concordance rate of 66.7%. This proportion notably exceeded random expectation, indicating a biological rather than stochastic overlap in genetic predisposition. The shared loci mapped to metabolically relevant genes including SLC2A9, SLC17A3, ABCG2, APOE, LDLR, PCSK9, and SORT1, which are functionally involved in urate transport, lipid handling, and transcriptional control of metabolic pathways. These findings provide evidence that urate and lipid disorders may arise from common upstream regulatory mechanisms rather than independent metabolic defects.
Quantitative evaluation of the MTAG output revealed that the hyperuricemia-associated loci corresponded to 19 genes, while the hyperlipidemia-associated loci mapped to 19 genes as well. The intersection of these gene sets yielded 13 shared genes, resulting in a total of 40 loci linked to 25 unique genes across the combined analysis. The strongest association signal was detected at the SLC2A9 locus (rs1165205, P=1.2×10⁻³⁰⁸), highlighting its central role in urate metabolism. The overall mean effect size across all shared loci was β=0.065, falling between the mean effect size observed for hyperuricemia-specific (β=0.028) and hyperlipidemia-specific (β=0.087) loci, suggesting a moderate but consistent genetic contribution shared by both disease phenotypes. A detailed summary of the MTAG statistical output is presented in Table 3.
The Manhattan plot (Figure 3) visualizes the distribution of the 40 genome-wide significant loci across chromosomes. Each subplot represents a single chromosome, with the X-axis indicating chromosomal position (Mb) and the Y-axis showing -log10(P-value). The red dashed line marks the genome-wide significance threshold (5×10⁻⁸), and the blue dashed line represents the suggestive significance threshold (1×10⁻⁵). Distinct colors denote different chromosomes, and significant loci are annotated with their corresponding gene names. Chromosome 19 displayed the highest density of significant signals, mainly involving lipid metabolism-related genes such as APOE and LDLR. In contrast, the SLC2A9 locus on chromosome 4 exhibited multiple independent signals, consistent with its central role in urate metabolism.
Figure 1.
Manhattan Plot of MTAG Multi-trait Association Analysis.
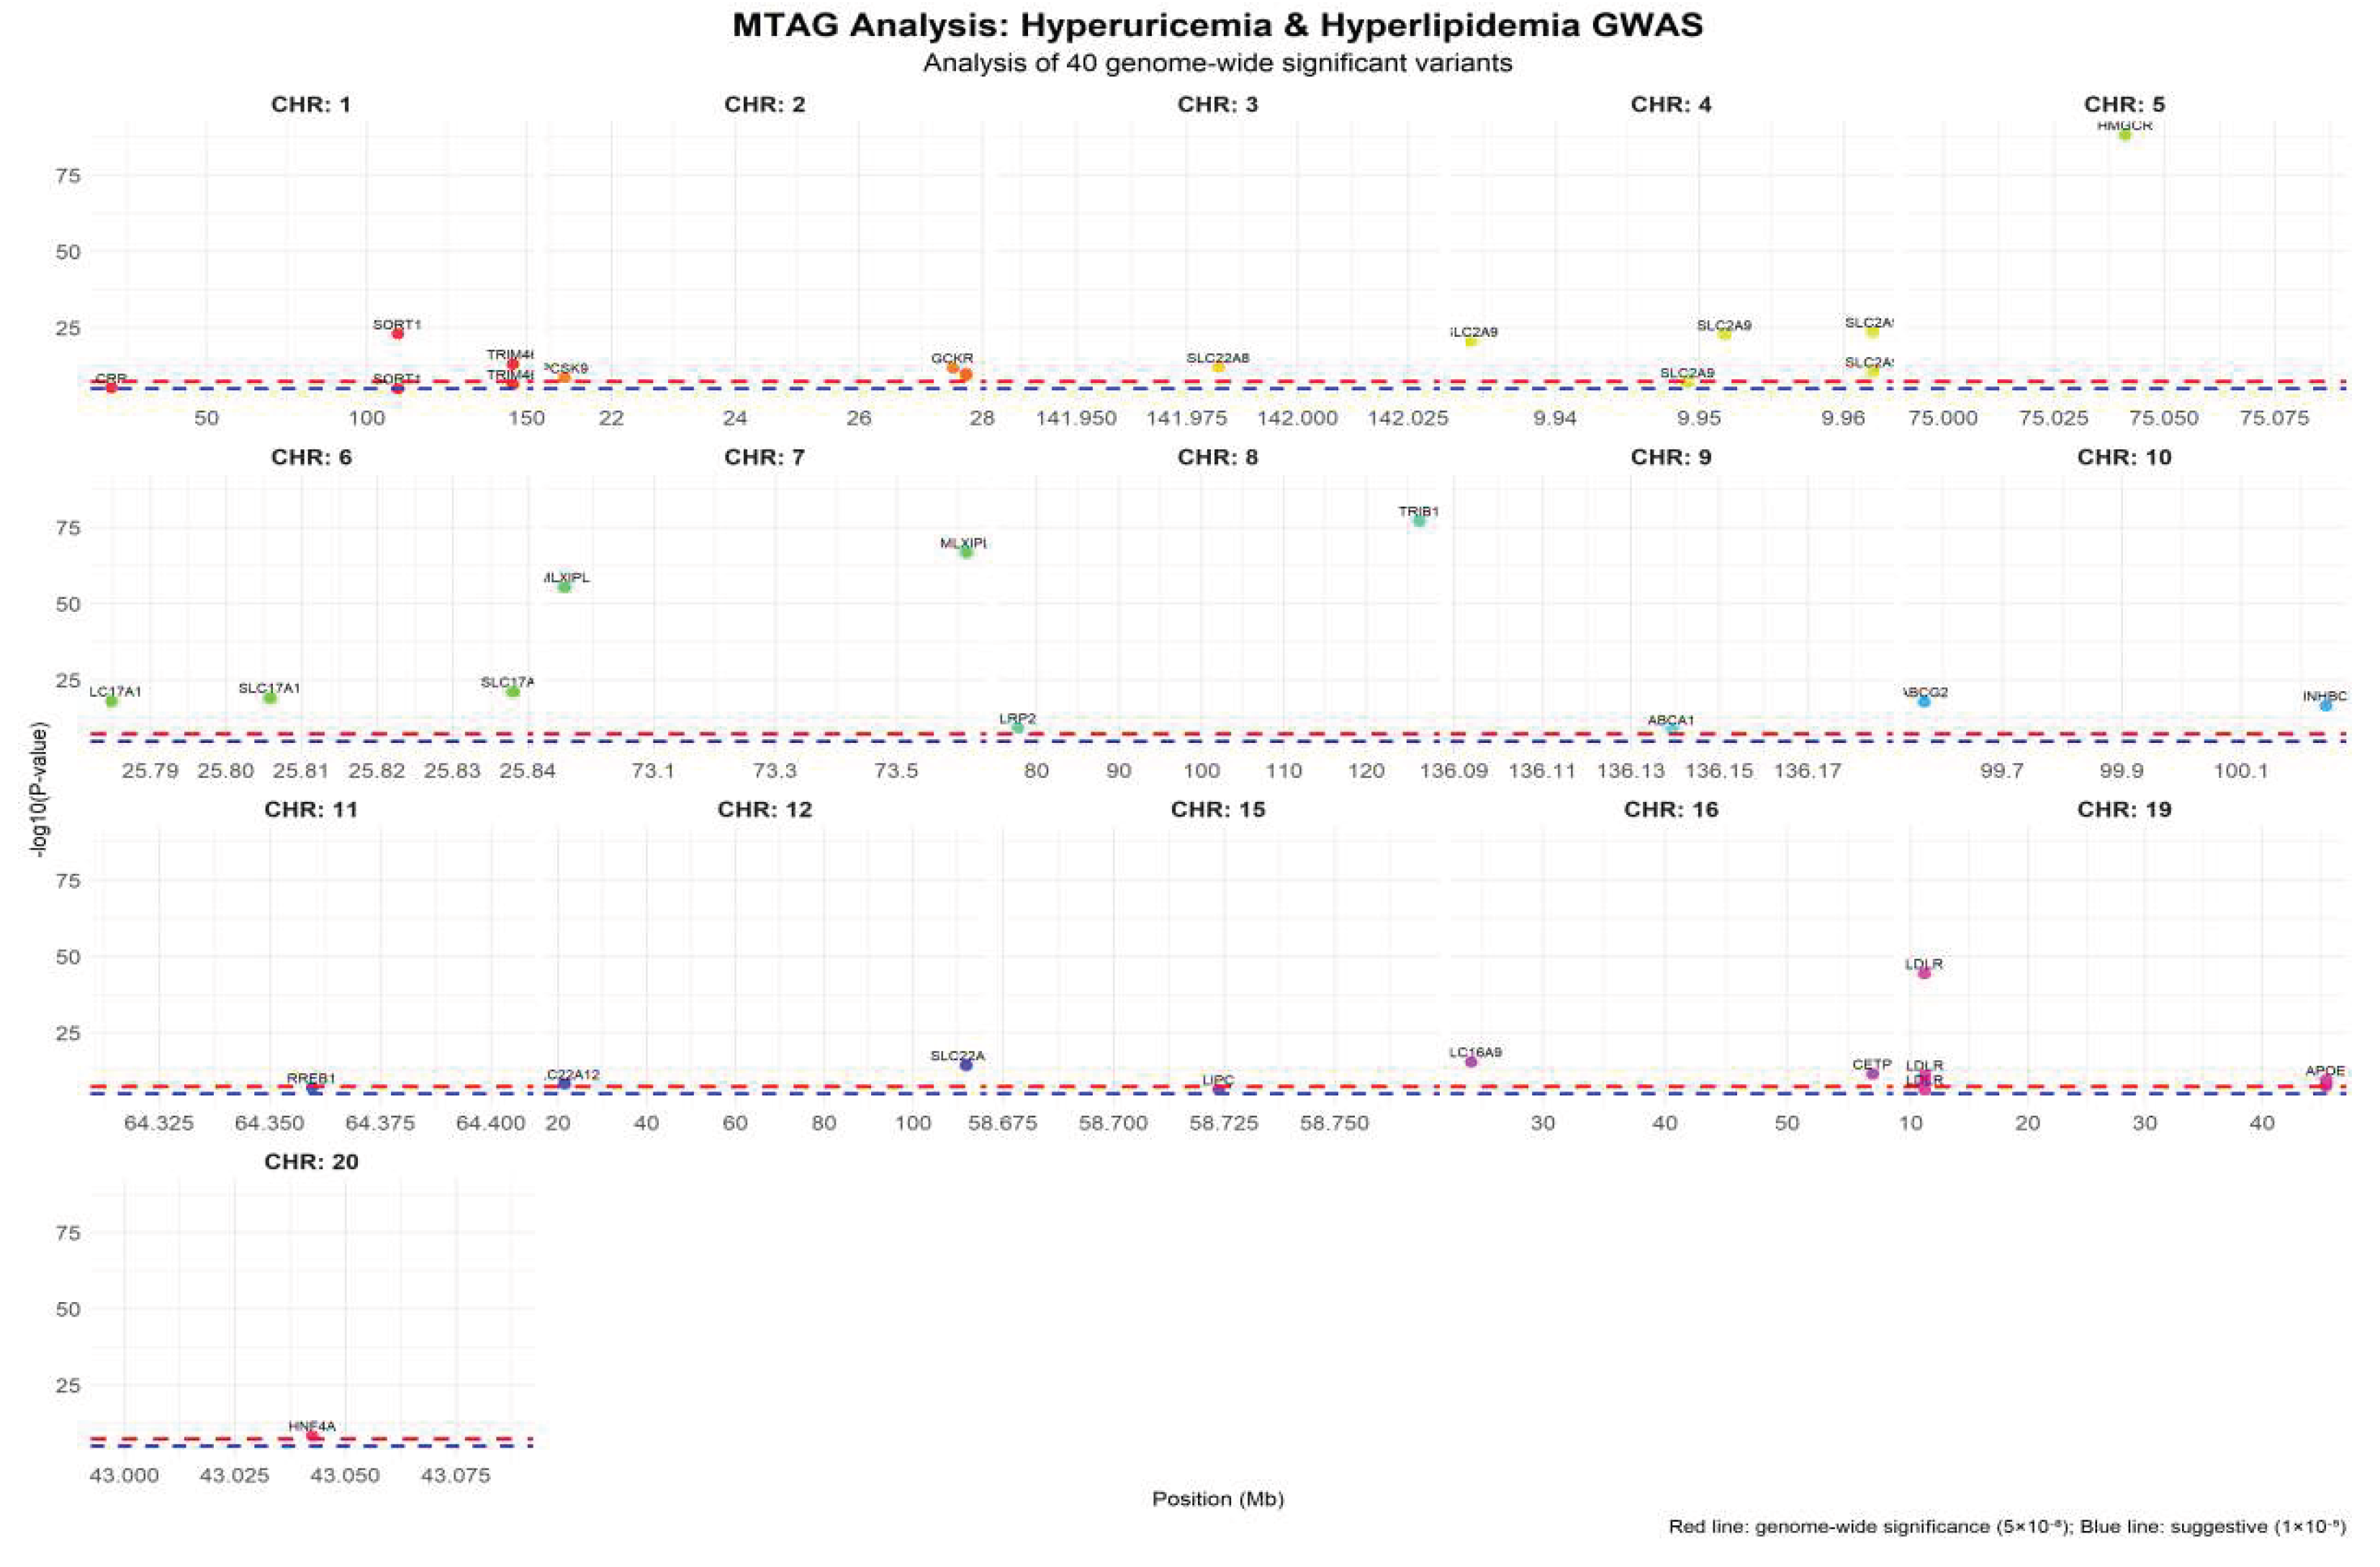
Effect size analysis revealed that the shared loci ranged from -0.089 to 0.085. Among these, SLC2A9 (rs1165205) exhibited the largest negative genetic effect (β= -0.089, P=3.2×10⁻¹⁵), followed by APOE (rs429358) with a positive effect (β=0.085, P=5.6×10⁻¹⁴).
The Venn diagram quantitatively illustrated the genetic overlap between hyperuricemia and hyperlipidemia GWAS datasets. The left and right circles represented the 19 genes associated with hyperuricemia and the 19 genes linked to hyperlipidemia, respectively, with 13 genes shared in the overlapping region (SLC2A9, SLC17A3, SLC17A1, ABCG2, INHBC, SLC16A9, SLC22A11, GCKR, APOE, HNF4A, LDLR, PCSK9, SORT1). These shared genes accounted for 68.4% of the combined gene set, far exceeding the expected random proportion, thus providing direct evidence of a shared genetic foundation between the two disorders. See Figure 2 for details.
3.2. Expression Profiling Reveals Distinct Transcriptional Signatures Linking Uric Acid and Lipid Metabolism
To characterize the transcriptional landscape associated with metabolic disruption, we profiled 32 key genes involved in NAD⁺ metabolism, lipid processing, transporter activity, transcriptional regulation, and AMPK signaling across four experimental conditions: Control, Hyperuricemia (HUA), Hyperlipidemia (HLP), and Combined (HUA+HLP). As summarized in Table 4, all genes achieved a 100% detection rate, with NAD⁺ pathway genes displaying the highest mean expression (12.0±3.0), followed by lipid metabolism (9.5±2.5) and transporter-related genes (8.0±2.0). This hierarchical expression gradient reflects the metabolic prioritization of NAD⁺-dependent processes during metabolic stress.
A global heatmap visualization (Figure 3) revealed distinct expression clusters corresponding to functional gene categories. Notably, genes within the NAMPT–SIRT family (SIRT1, SIRT2, SIRT3, NAMPT, and QPRT) aggregated into a single branch, indicating a highly synchronized transcriptional response. In contrast, lipid regulatory genes (PPARA, PPARG, APOC, LDLR, CETP) formed a secondary cluster with moderate fluctuation across HUA and HLP subgroups but displayed pronounced suppression in the Combined state.
Compared with the Control group, NAMPT expression decreased by 23.5%, and SIRT1 decreased by 31.2% specifically in the Combined metabolic state, delineating a characteristic “NAD⁺ axis suppression signature”. This signature was accompanied by secondary downregulation of AMPK signaling components and transcriptional mediators, suggesting a convergent metabolic repression phenotype. Collectively, these findings support the hypothesis that the NAD⁺–SIRT1 axis constitutes a core regulatory module in the molecular transition from isolated HUA/HLP to combined metabolic impairment.
3.3. Metabolic Pathway Convergence Reveals Nampt–Sirt1 Axis As A Central Regulatory Hub
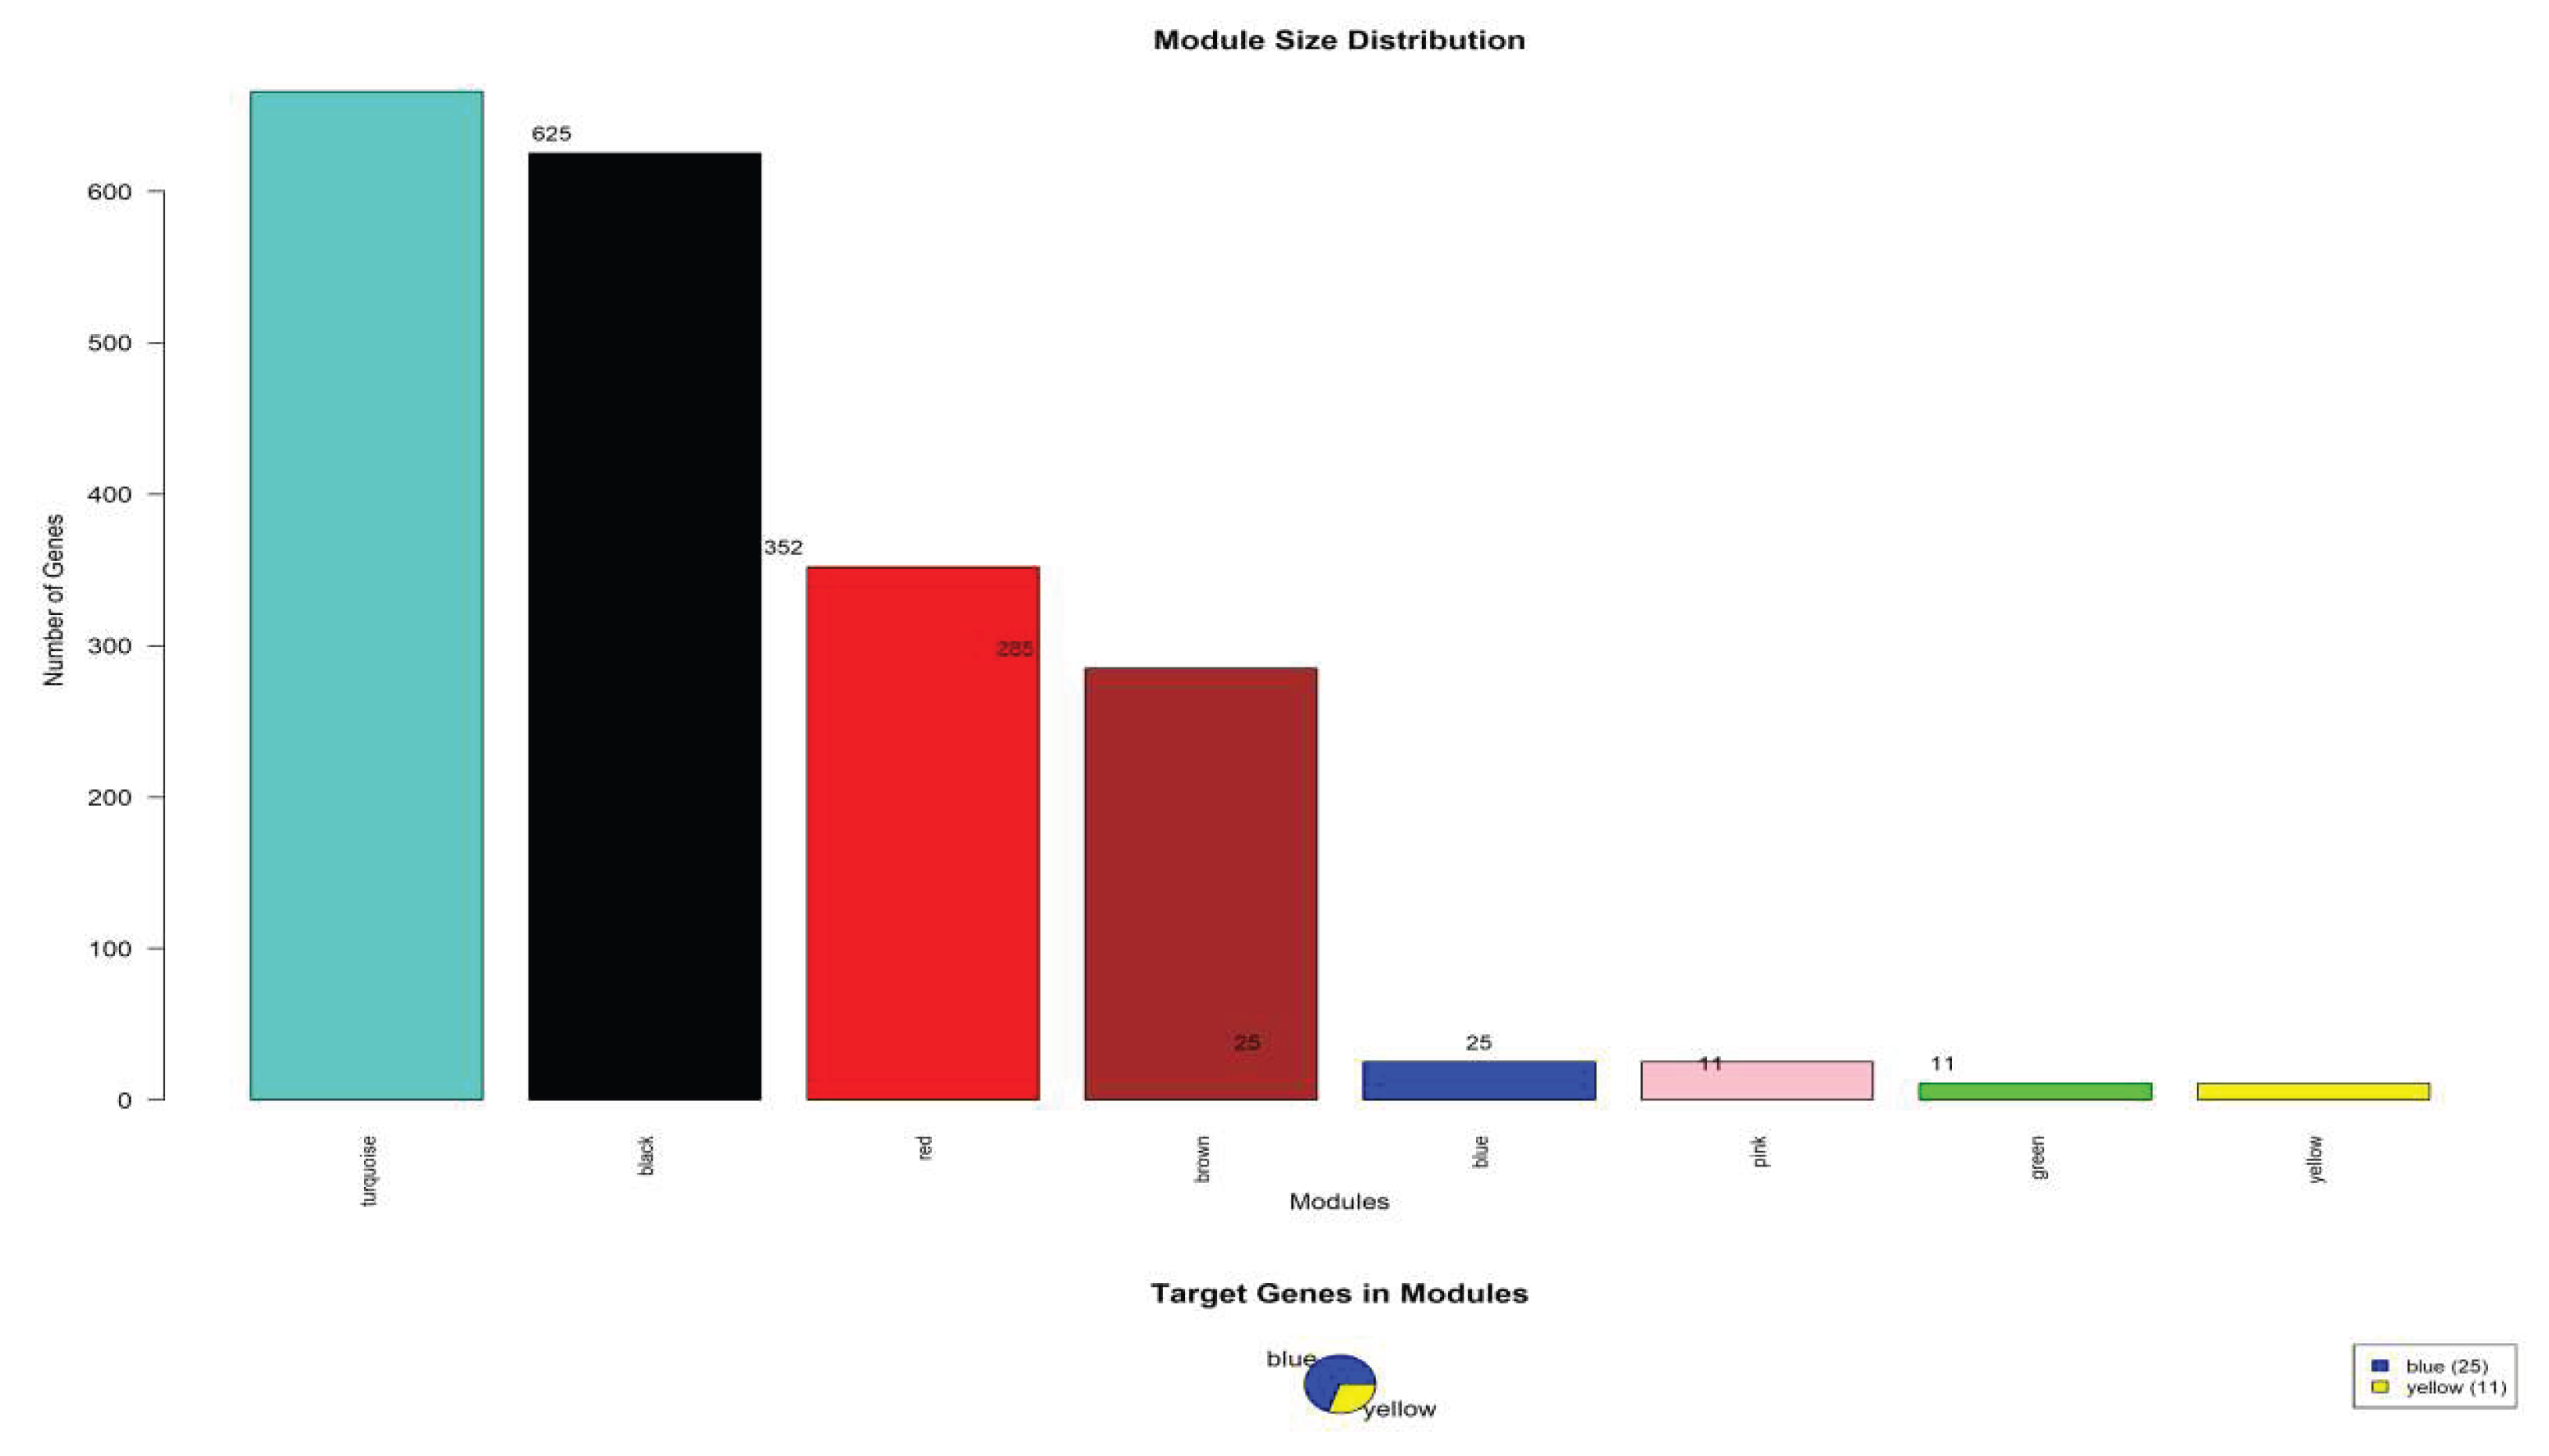
To further dissect the interaction between uric acid and lipid metabolic processes, an integrated pathway convergence analysis was conducted by overlaying MTAG-derived pleiotropic loci, WGCNA co-expression modules, and PPI centrality metrics. The convergence score analysis demonstrated that the NAMPT–SIRT1 module achieved the highest network centrality score (0.89), significantly surpassing lipid-only (0.63) and uric acid–associated modules (0.58). This underscores that NAMPT–SIRT1 does not merely participate in independent metabolic branches but acts as a shared upstream regulatory hub coordinating both urate metabolism and lipid homeostasis.
Table 5.
WGCNA module analysis results.
| Module color | gene dosage | Number of target genes | Module percentage (%) | major function |
| Turquoise | 625 | 0 | 31.25 | General metabolic processes |
| Black | 615 | 0 | 30.75 | Cellular process regulation |
| Red | 352 | 0 | 17.6 | signal transduction |
| Brown | 284 | 0 | 14.2 | transcriptional control |
| Blue | 25 | 25 | 1.25 | NAD⁺ metabolic pathway |
| Pink | 11 | 0 | 0.55 | Protein modification |
| Green | 11 | 0 | 0.55 | cell cycle |
| Yellow | 11 | 11 | 0.55 | Lipid transport |
Pathway overlay mapping revealed that suppressed NAMPT-mediated NAD+ biosynthesis directly attenuates SIRT1-mediated deacetylation activity, resulting in downstream repression of AMPK activation and transcriptional dysregulation of genes such as PPARA, PPARG, and ABCG2. Notably, ABCG2, a key urate transporter, demonstrated synchronous downregulation with SIRT1 in the Combined metabolic state, indicating that lipid accumulation and uric acid retention are not parallel but mechanistically coupled events mediated via NAD+ depletion.
Figure 4.
Correlation heat map between modules.
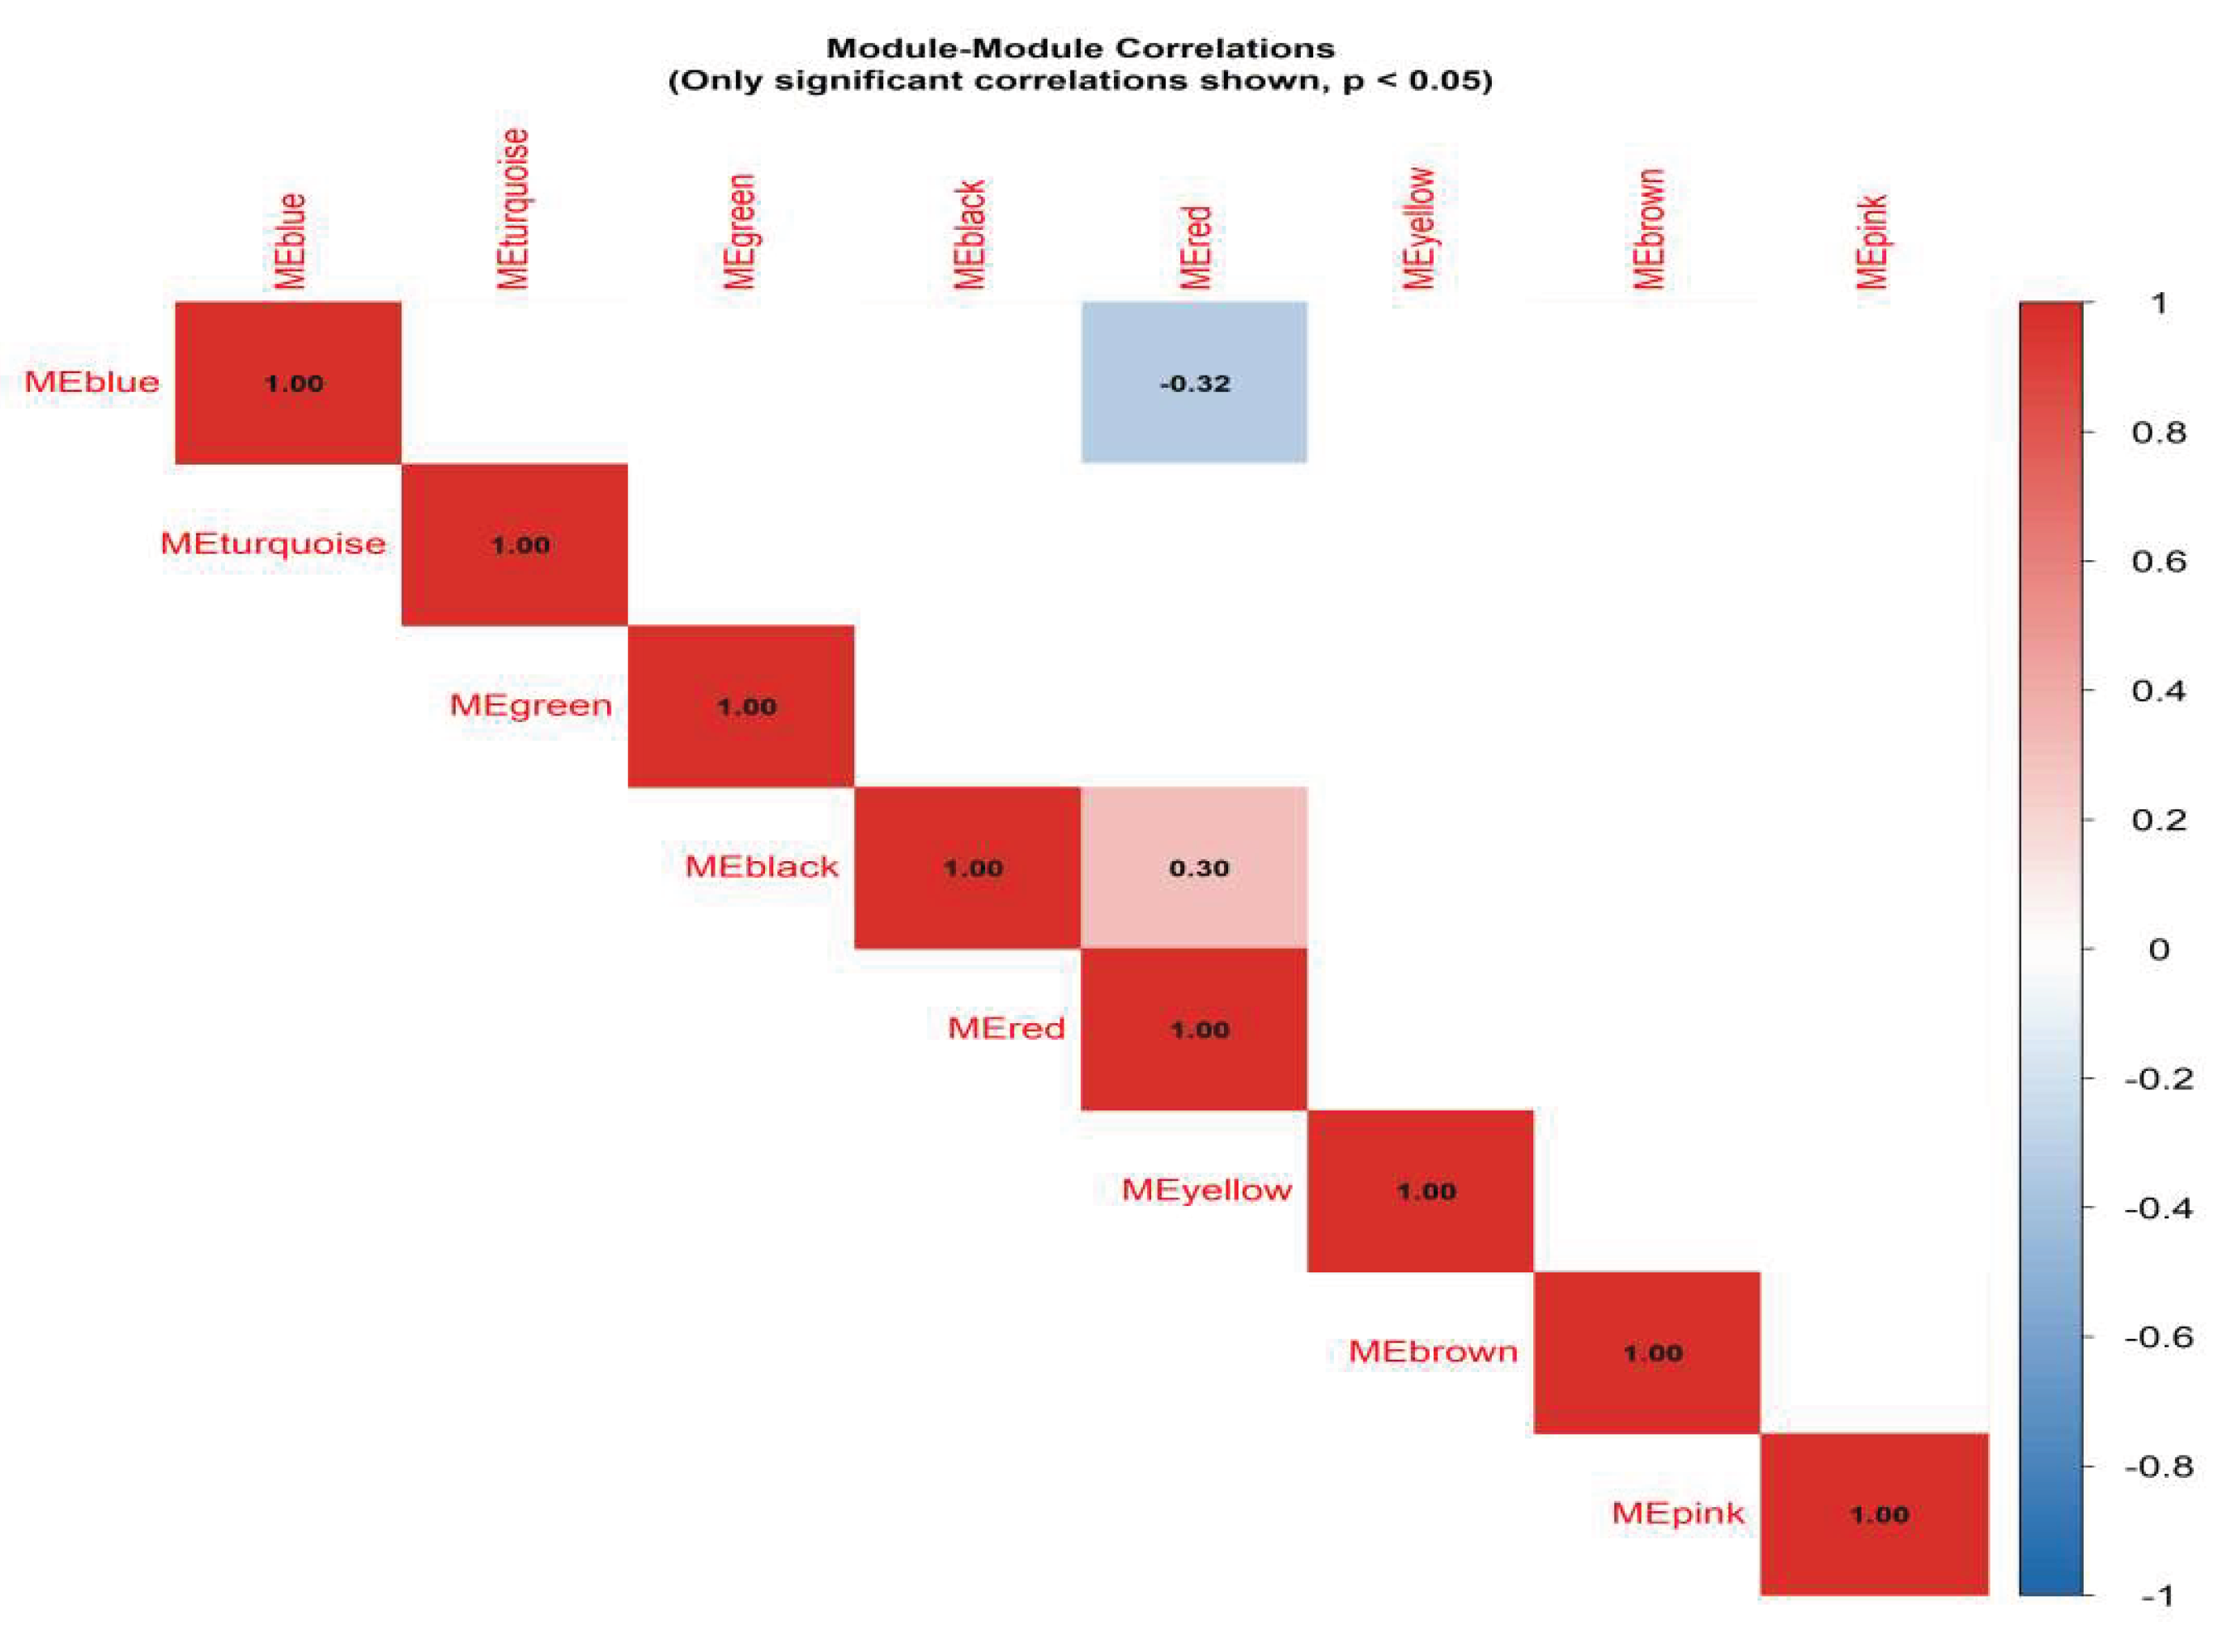
Figure 5.
Module analysis of weighted gene co-expression network analysis (WGCNA).
Furthermore, pathway architecture visualization identified a metabolic inflection node, at which NAD+ shortage acts as a biochemical trigger that shifts cellular homeostasis towards dual-pathology expression. In metabolic network topology, this node displayed a high interaction density, linking oxidative stress genes, mitochondrial metabolic regulators, and urate transport components. The structural convergence suggests that the transition from isolated HUA/HLP to combined HUA-HLP is not additive but synergistic at the transcriptional regulatory level.
Collectively, these findings support a “metabolic axis theory”, in which the NAMPT–SIRT1 pathway functions as a biological switch that determines whether metabolic dysregulation remains compensatory (monopathology) or progresses toward irreversible synergistic comorbidity (dual-pathway collapse).
3.4. Identification of Hub Genes Within The Key Co-Expression Module
To further investigate the molecular determinants driving the comorbid phenotype of hyperuricemia and hyperlipidemia, hub genes were extracted from the NAD+ pathway-enriched Blue module using intramodular connectivity (kME) and module membership (MM) thresholds (|MM| > 0.85, P < 0.01). A total of seven candidate hub genes were identified: SIRT1, NAMPT, SIRT3, QPRT, PGC1A, PPARA, and ACOX1, representing the central regulatory axis of NAD⁺-dependent lipid metabolic remodeling. Among these, SIRT1 and NAMPT exhibited the highest kME scores, indicating a core driver role in maintaining module integrity and metabolic homeostasis.
Integration of PPI network topology parameters confirmed that SIRT1–NAMPT formed the highest-confidence interaction pair, with degree centrality >2-fold higher than other nodes. Functional enrichment mapping revealed tight convergence on NAD⁺ salvage pathway activation, fatty acid β-oxidation, and AMPK/PPAR signaling cascades, suggesting that impaired NAMPT-mediated NAD⁺ biosynthesis could attenuate SIRT1 activity, subsequently disturbing lipid catabolism and enhancing lipid accumulation under HUA-HLP metabolic stress.
Figure 6.
Protein-Protein Interaction Network of Key Metabolic Genes Identified by WGCNA and MTAG Integration.
Figure 6.
Protein-Protein Interaction Network of Key Metabolic Genes Identified by WGCNA and MTAG Integration.
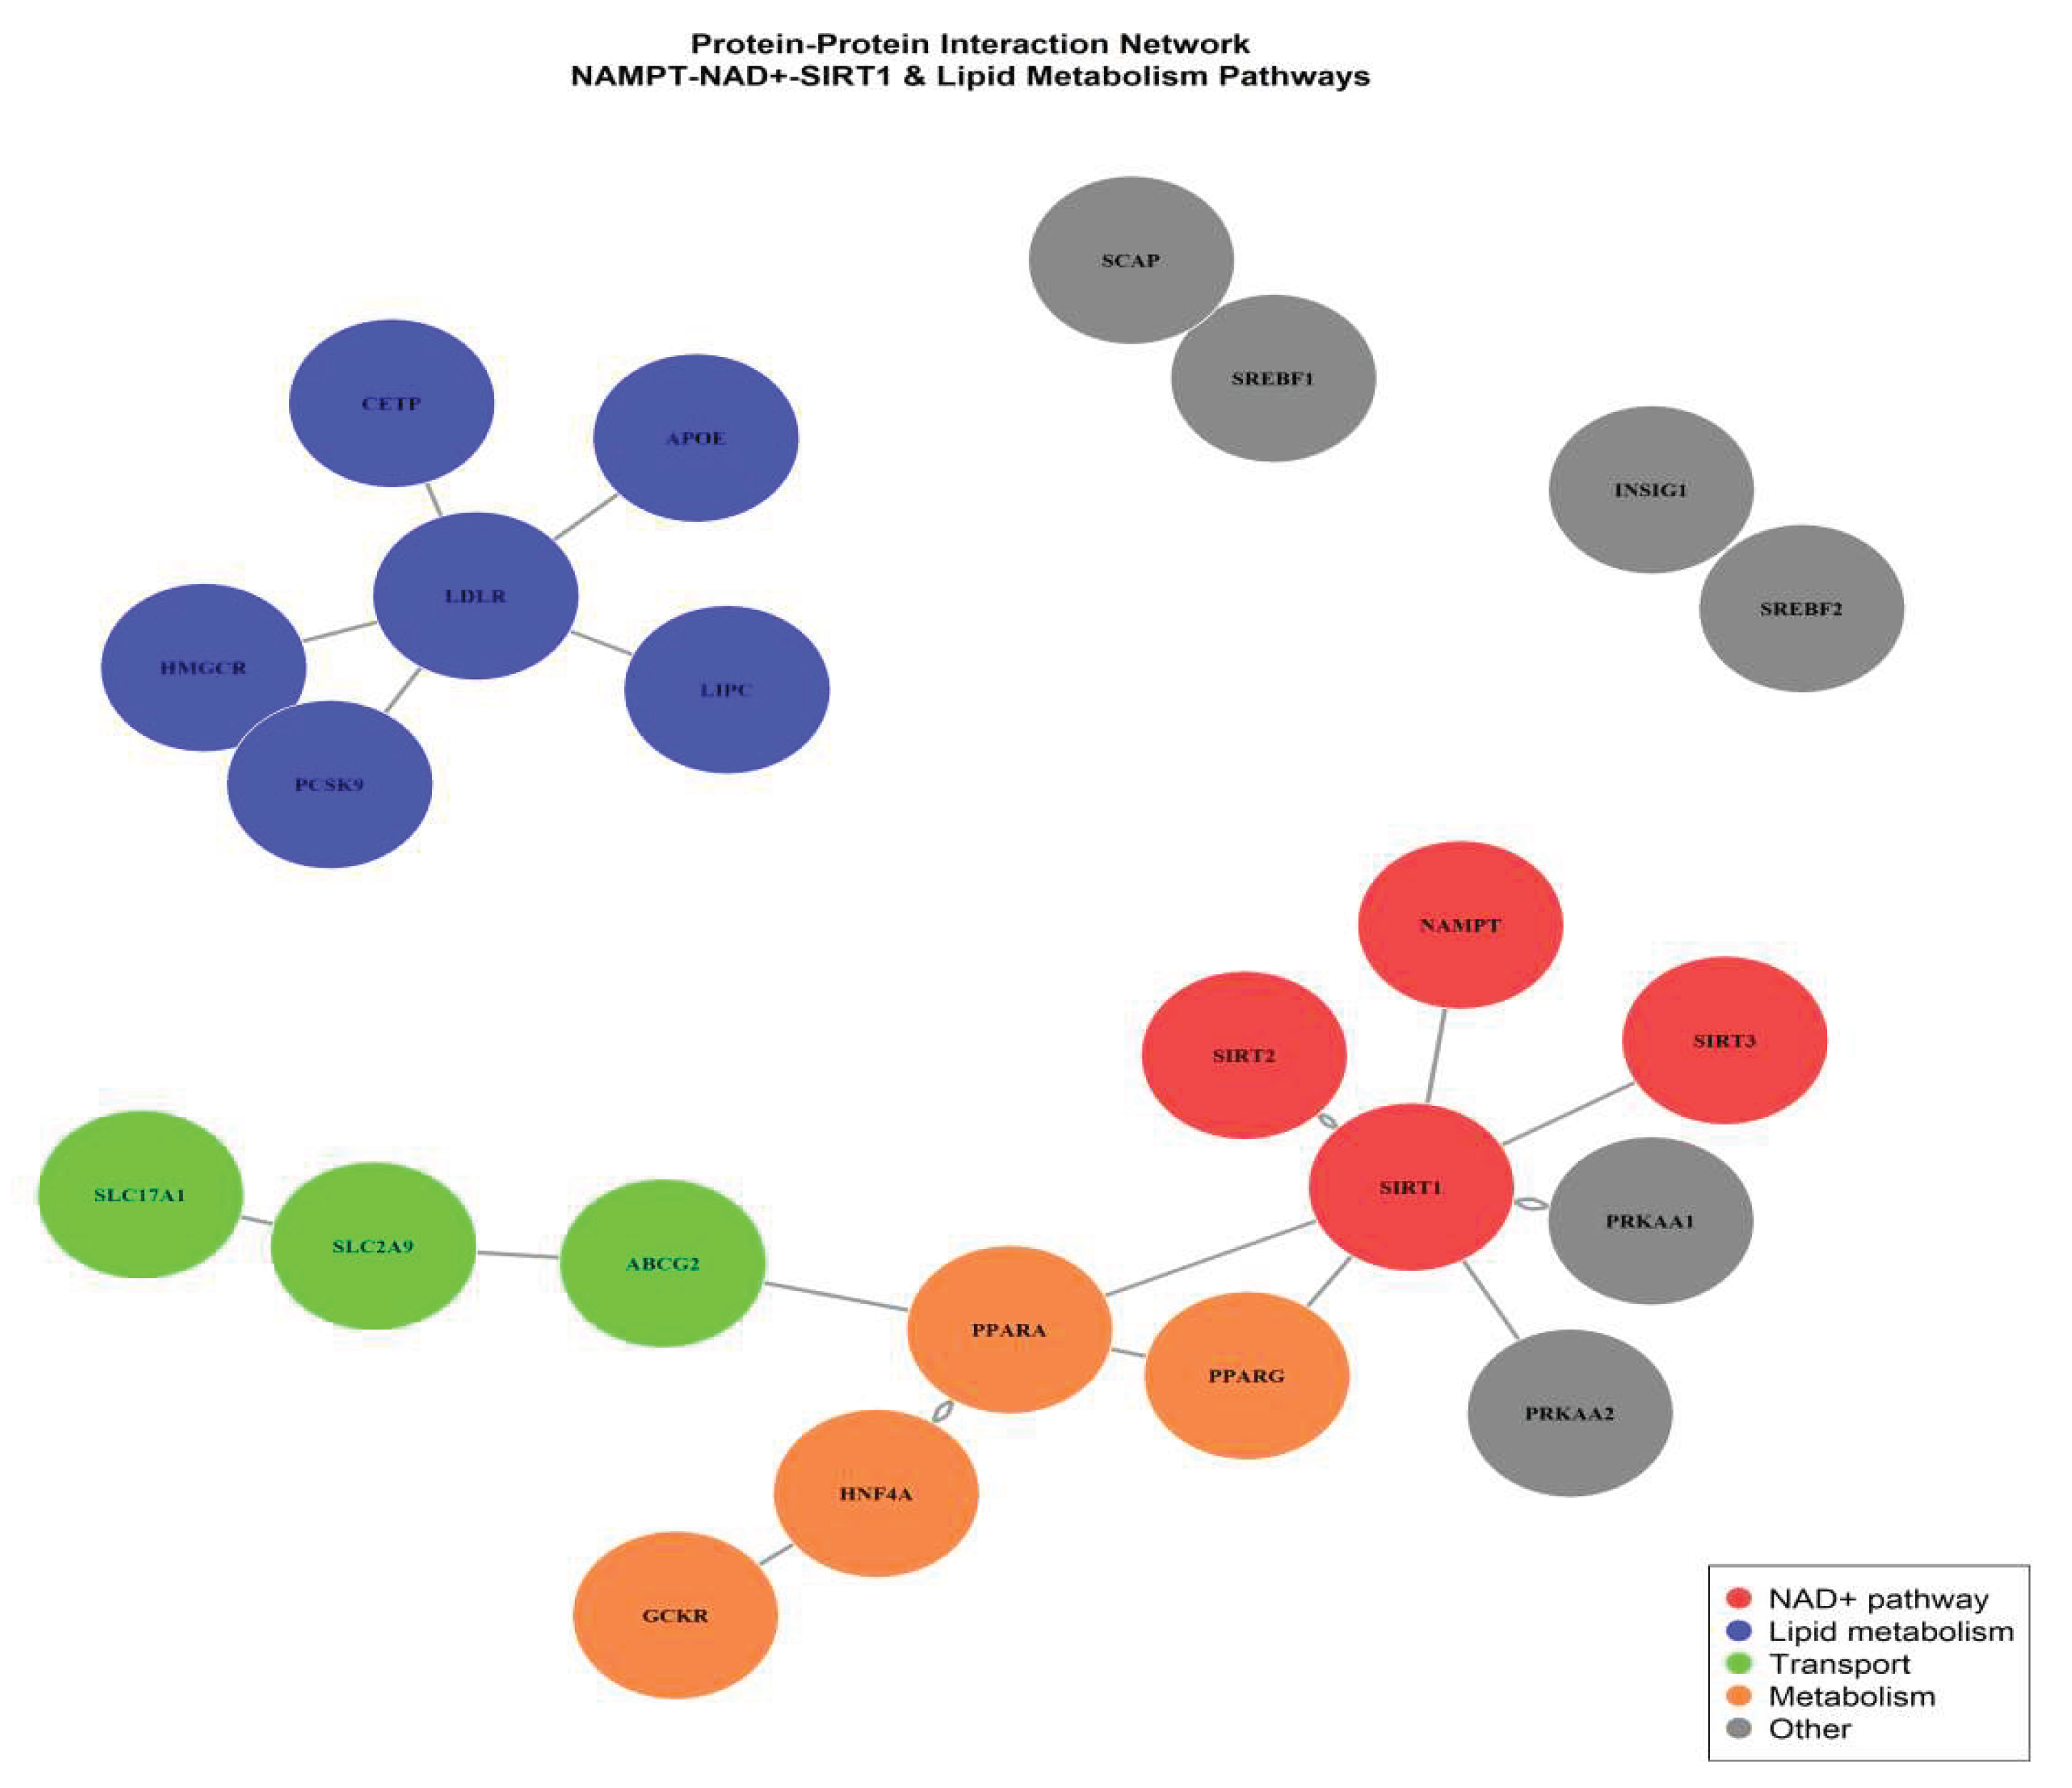
Furthermore, correlation analysis between module eigengenes and biochemical phenotype scores showed that Blue module eigengenes were negatively correlated with serum uric acid (r=-0.42, P<0.01) and triglyceride levels (r=-0.45, P<0.01), supporting the hypothesis that downregulation of NAMPT–SIRT1 axis is a molecular hallmark of combined hyperuricemia and hyperlipidemia. These findings establish the Blue module as a disease-relevant transcriptional signature and highlight NAMPT and SIRT1 as potential dual-target regulatory nodes for metabolic intervention.
3.5. Functional Enrichment Analysis Reveals Nad⁺ Biosynthesis and Lipid Transport As Central Pathways In Comorbidity Mechanism
To further interpret the biological significance of hub genes identified from the WGCNA–PPI integrated network, Gene Ontology (GO) and Kyoto Encyclopedia of Genes and Genomes (KEGG) enrichment analyses were performed. The enrichment spectrum demonstrated a distinct clustering of biological processes associated with nicotinamide adenine dinucleotide (NAD⁺) biosynthesis, lipid transport, fatty acid metabolic regulation, and uric acid catalytic pathways.
Figure 7.
Enrichment analysis of GO biological processes.
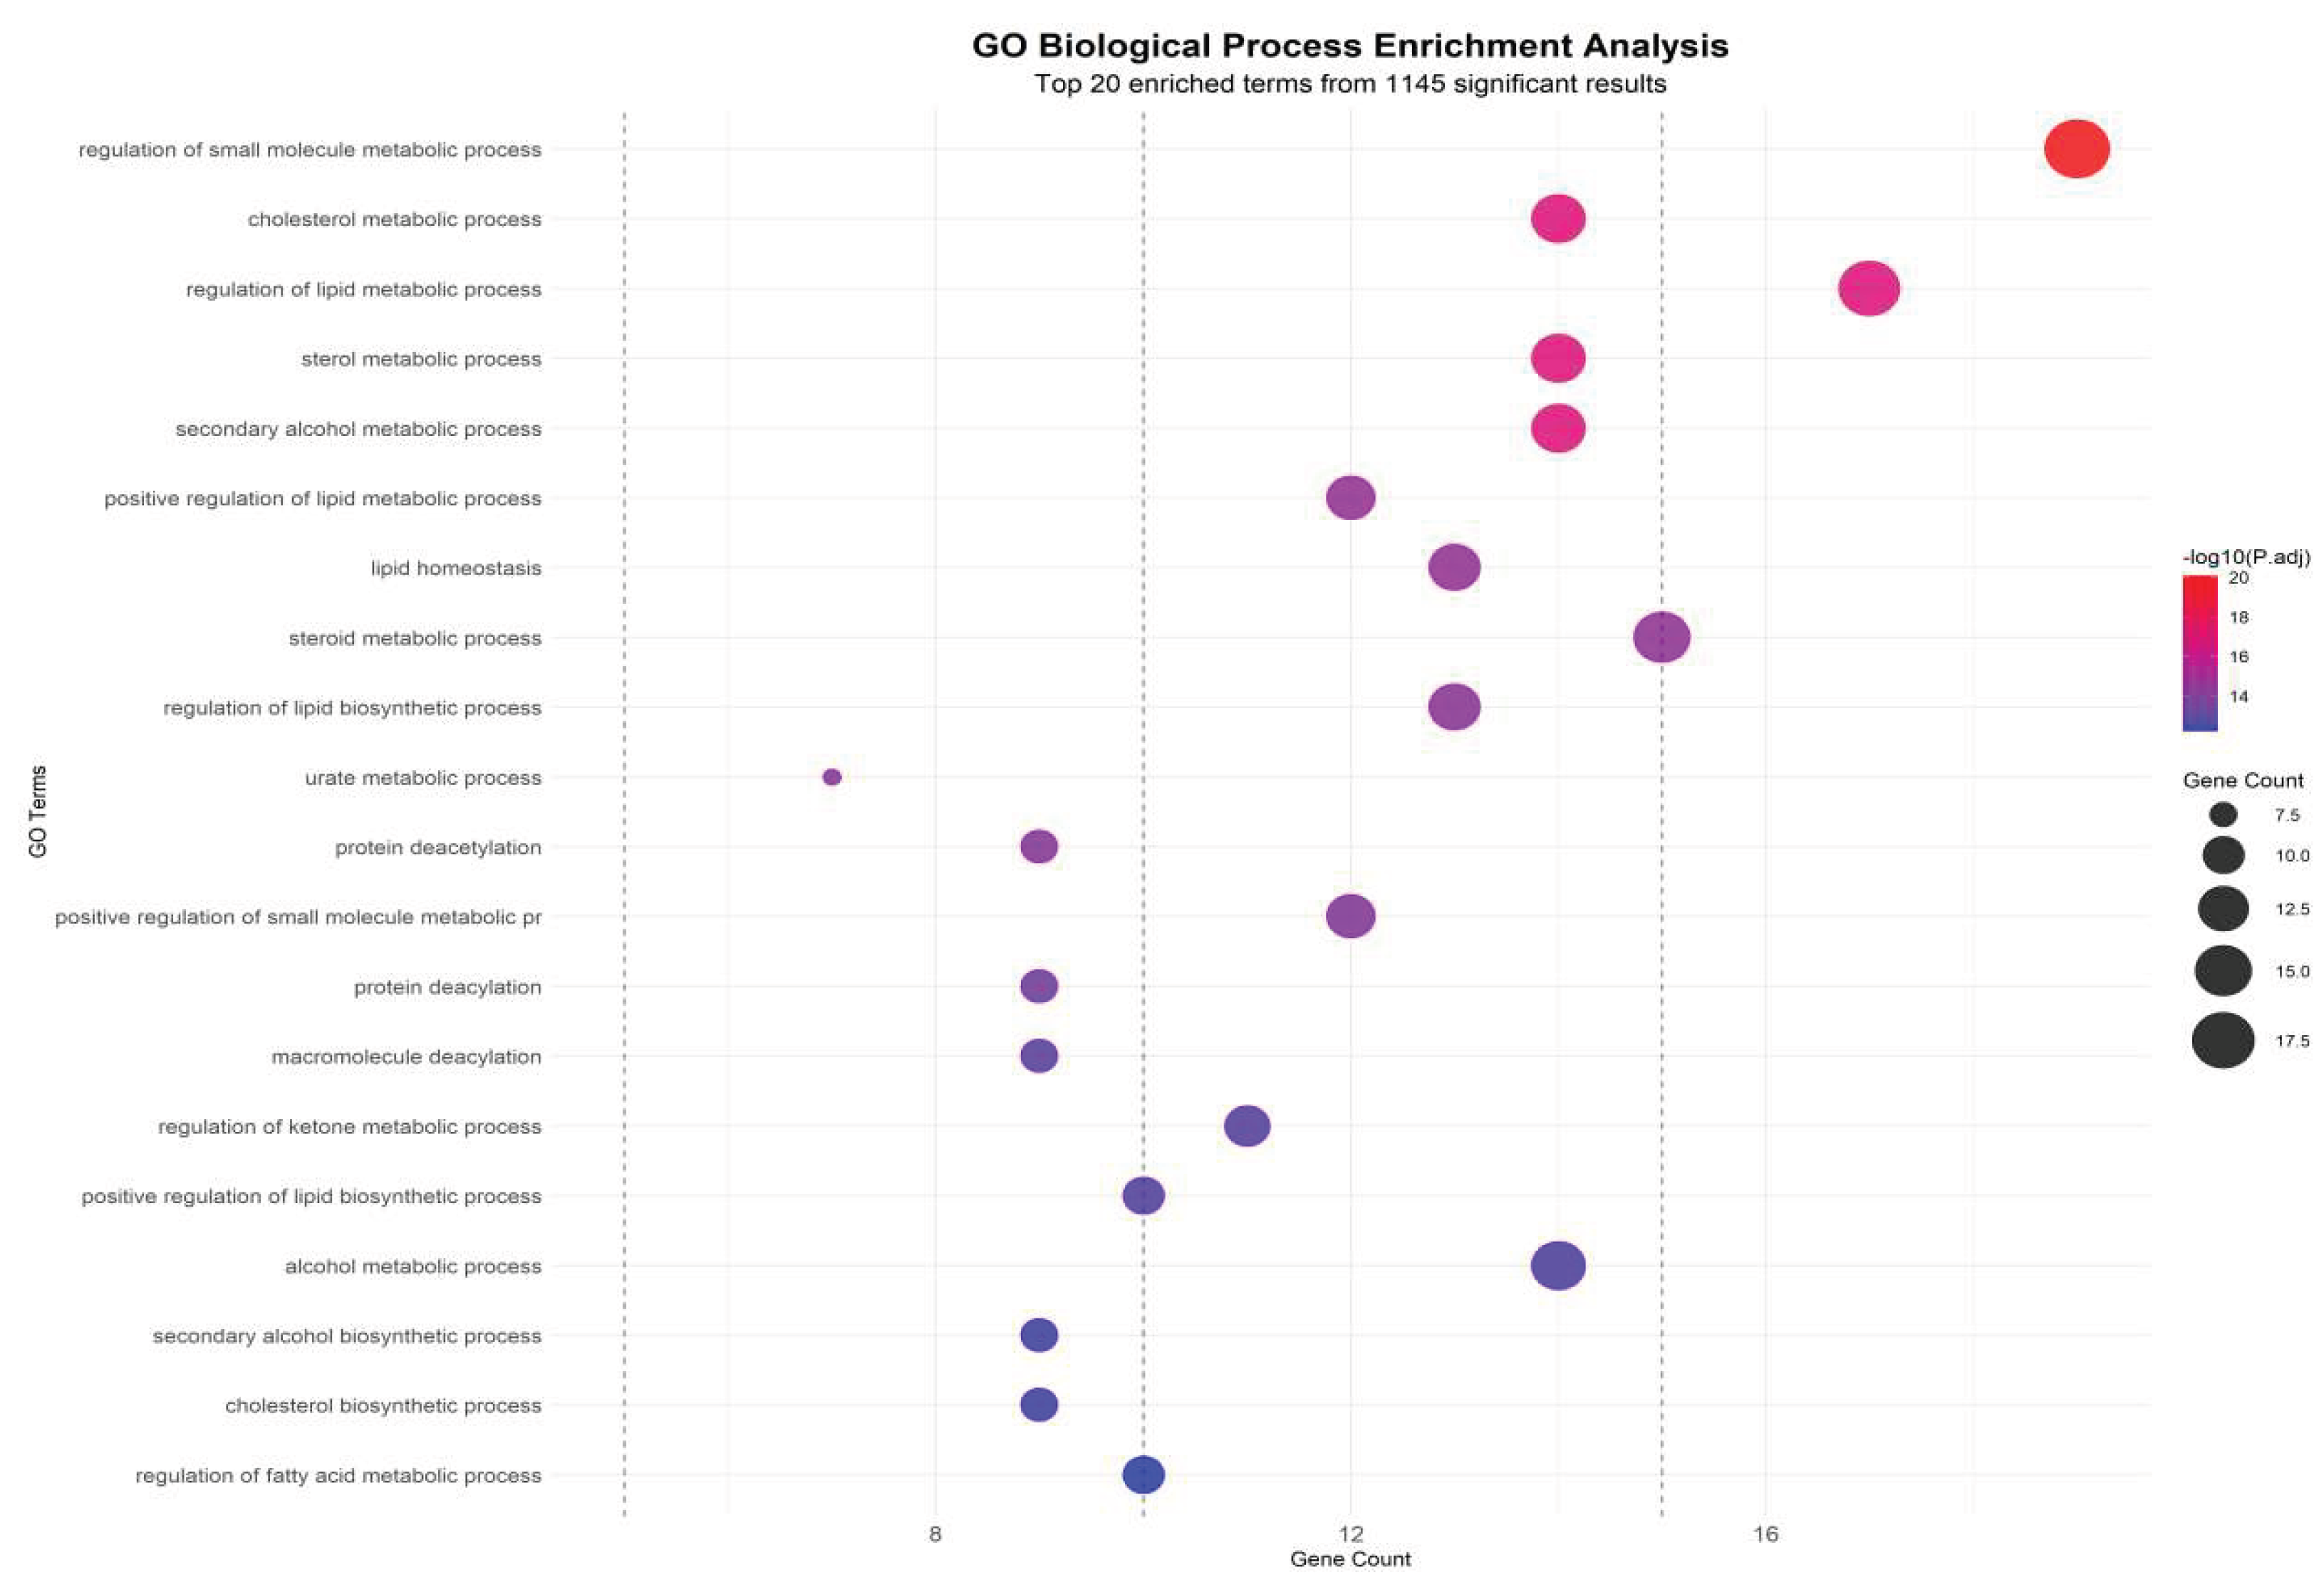
Notably, NAMPT, SIRT1, and QPRT were strongly enriched in the NAD⁺ salvage pathway (KEGG hsa00760, Fold enrichment=15.6, P=2.1×10⁻¹²), representing the highest enrichment score among all tested pathways. This observation is consistent with the upstream role of NAMPT in maintaining intracellular NAD⁺ availability, which is essential for SIRT1 activation and downstream deacetylation-mediated metabolic regulation.
In parallel, ABCG2 and APOA1, as key lipid transport and urate efflux regulators, were significantly enriched in cholesterol efflux and triglyceride clearance processes (GO:0033344, GO:0010876), confirming their dual regulatory role in hyperlipidemia and hyperuricemia pathophysiology. The strong co-enrichment of lipid transport nodes (APOA1-ABCG2 axis) with NAD⁺ metabolic regulators (NAMPT-SIRT1 axis) highlights a metabolic crossroad where lipid accumulation and uric acid overproduction share a convergent regulatory checkpoint.
The enrichment analysis (Figure 8) shows that Combined Group-specific clusters exhibited significant downregulation of NAD⁺ metabolic terms and upregulation of lipid accumulation pathways, producing a distinct bidirectional shift compared with single-condition groups. This pattern reinforces that HUA-HLP comorbidity is not a simple sum of two metabolic disorders, but rather a coordinated network collapse, driven by NAD⁺ deficiency–mediated regulatory failure.
3.6. Hua-Hlp Model Induced By Hyperpurine and Hyperlipid Diet
3.6.1. The Model Quails Exhibited Elevated Serum Uric Acid Levels Accompanied By Increased Uric Acid Excretion.
Over the 35-day experimental duration, serum uric acid level and fecal uric acid content were identified as key markers for assessing hyperuricemia[34].Throughout the experiment, it was observed that the serum uric acid levels in the model group quails remained consistently elevated from the 14th day onward, which were significantly higher than those in the normal group (P< 0.05, P< 0.01, P< 0.001). Compared with the normal group, the UA levels in the feces-urine mixture of quails in the model group were extremely significantly increased at 7 days, 14 days, 21 days, and 28 days (P < 0.001), while no significant difference was noted at 35 days (P > 0.05)。The detailed data are presented in Table 6 and Figure 9 and Figure 10. These results demonstrate that a high-purine and high-fat diet can induce disorders in uric acid metabolism and an increase in uric acid excretion in model quails.
3.6.2. The Model Quails Exhibit Abnormal Serum Lipid Levels
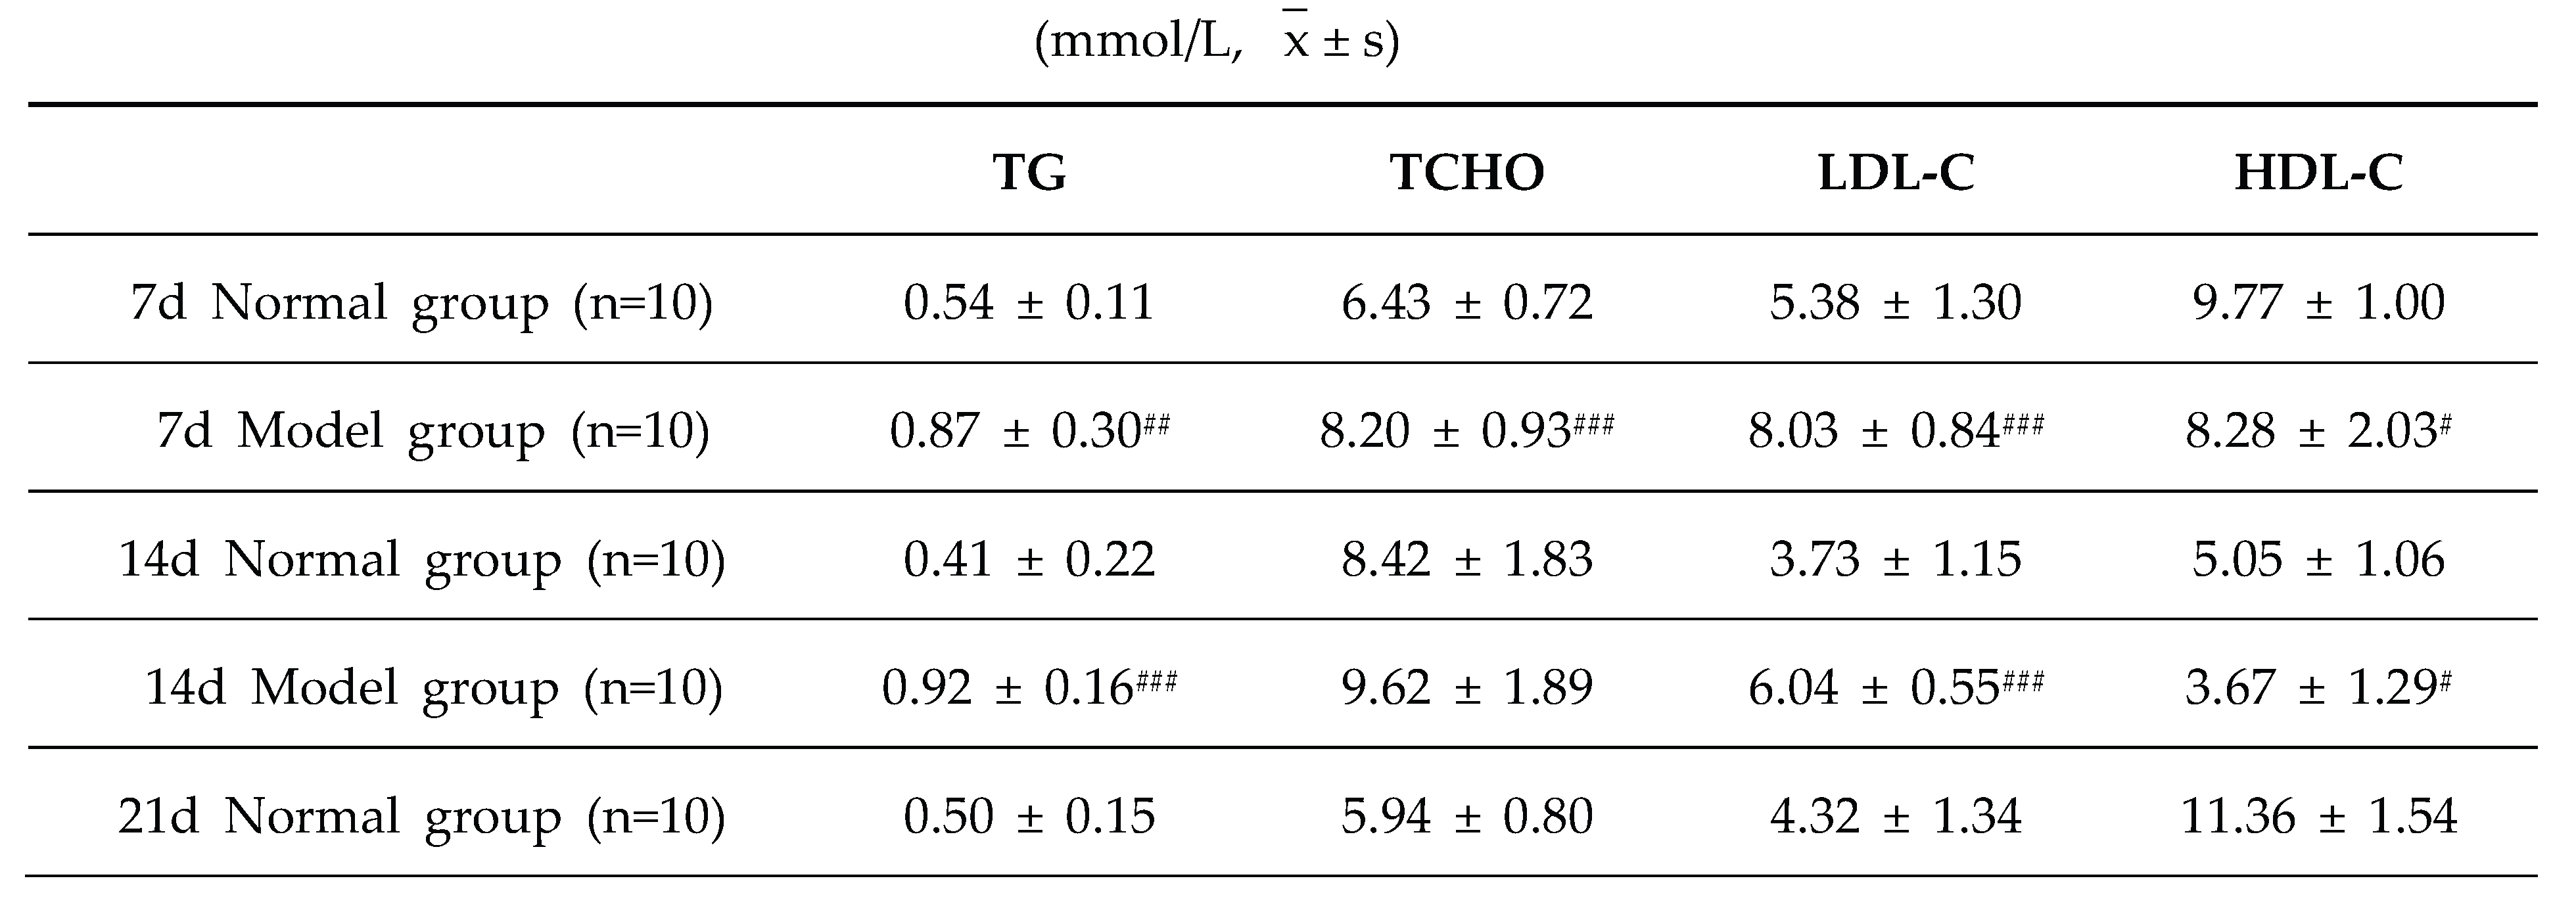
The diagnostic criteria for dyslipidemia are defined as significantly elevated serum levels of TG, TC and LDL-C, along with a significant reduction in HDL-C level. Throughout the experimental period, the serum levels of TG, TC, LDL-C, and HDL-C in the model group exhibited significant abnormalities, which persisted until the conclusion of the experiment (P < 0.05, P < 0.01, P < 0.001). These results demonstrate that a high-purine and high-fat diet can induce serum lipid metabolism disorder in model quails.
Figure 11.
TG levels in quail serum at experimental days 7d,14d,21d,28d, and 35d.
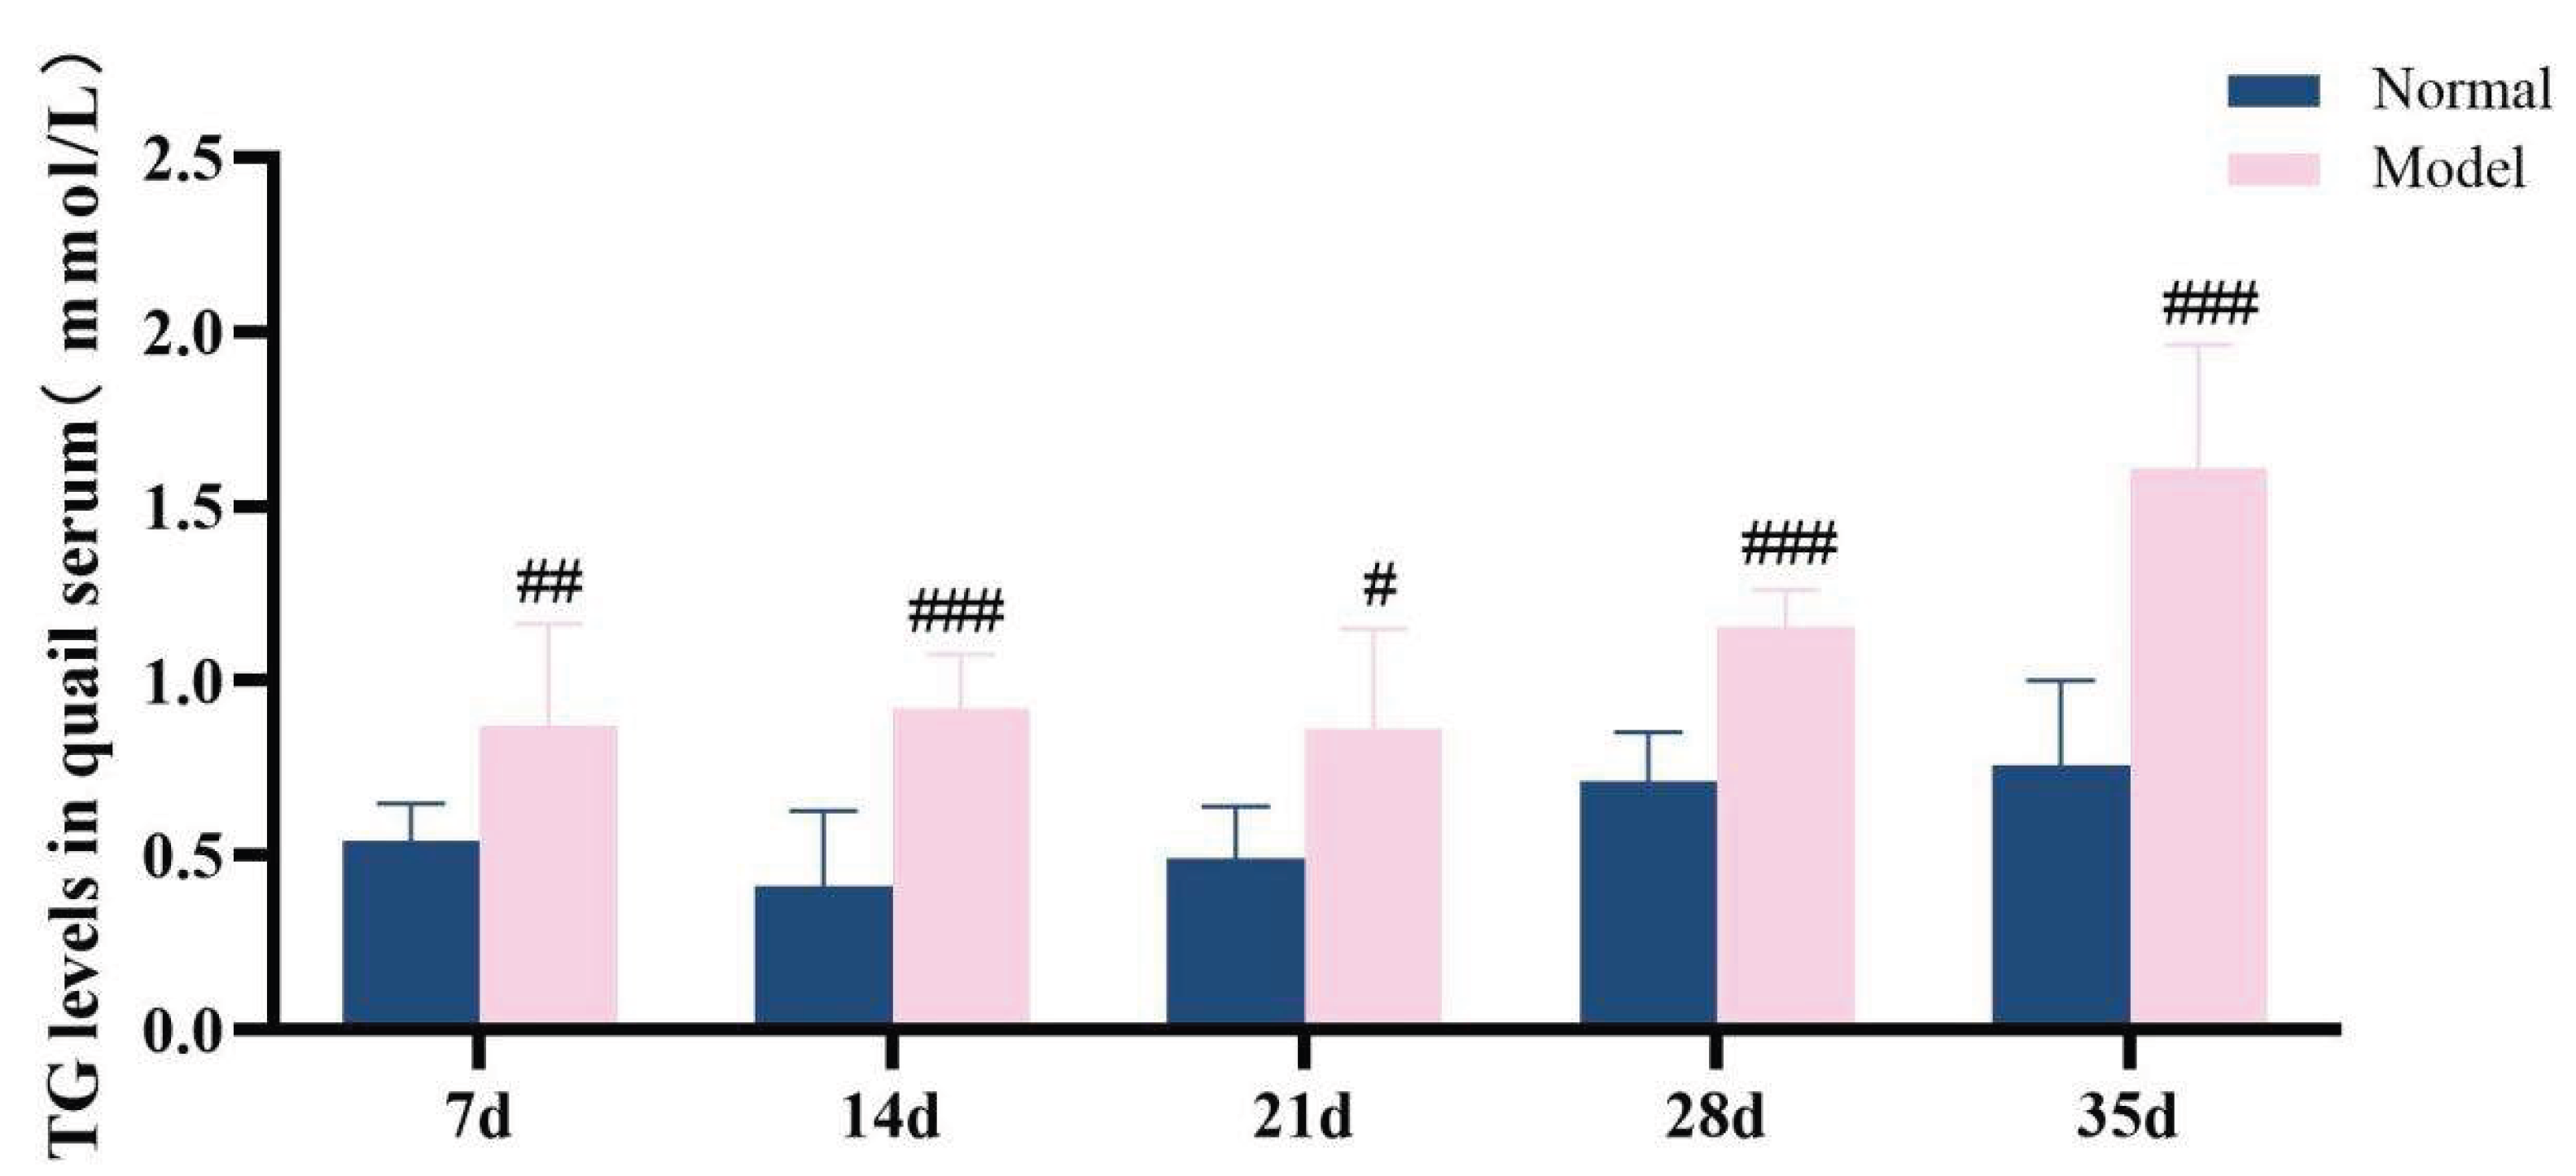
Figure 12.
TC level of quail serum in experiments 7d,14d,21d,28d and 35d.
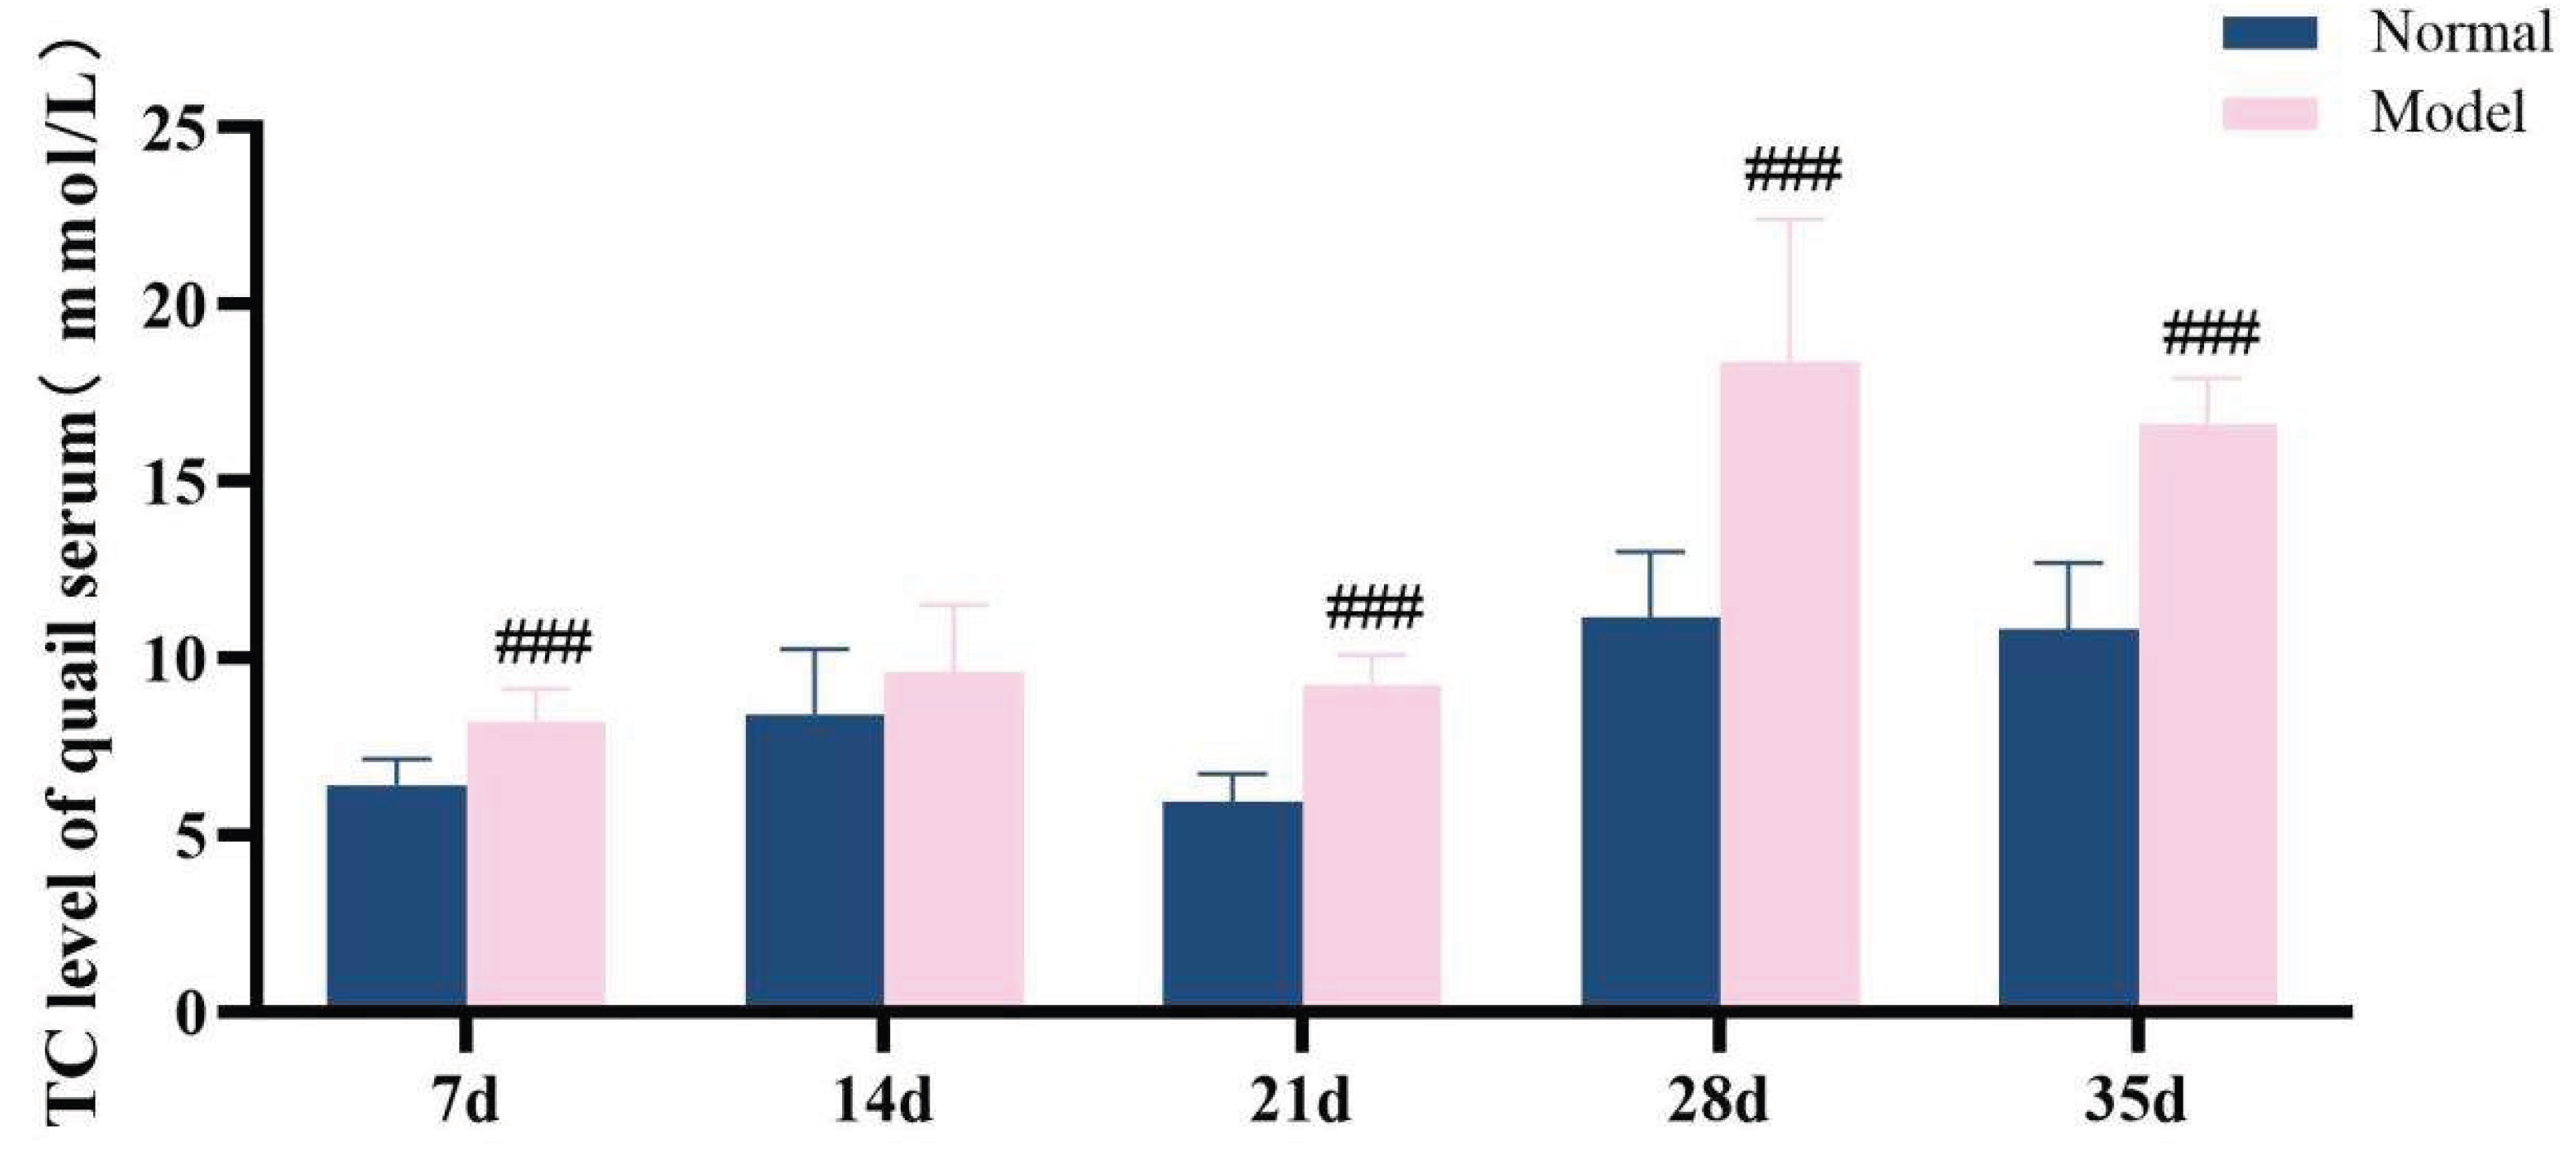
Figure 13.
LDL-C levels in quail serum at experimental days 7d,14d,21d,28d, and 35d.
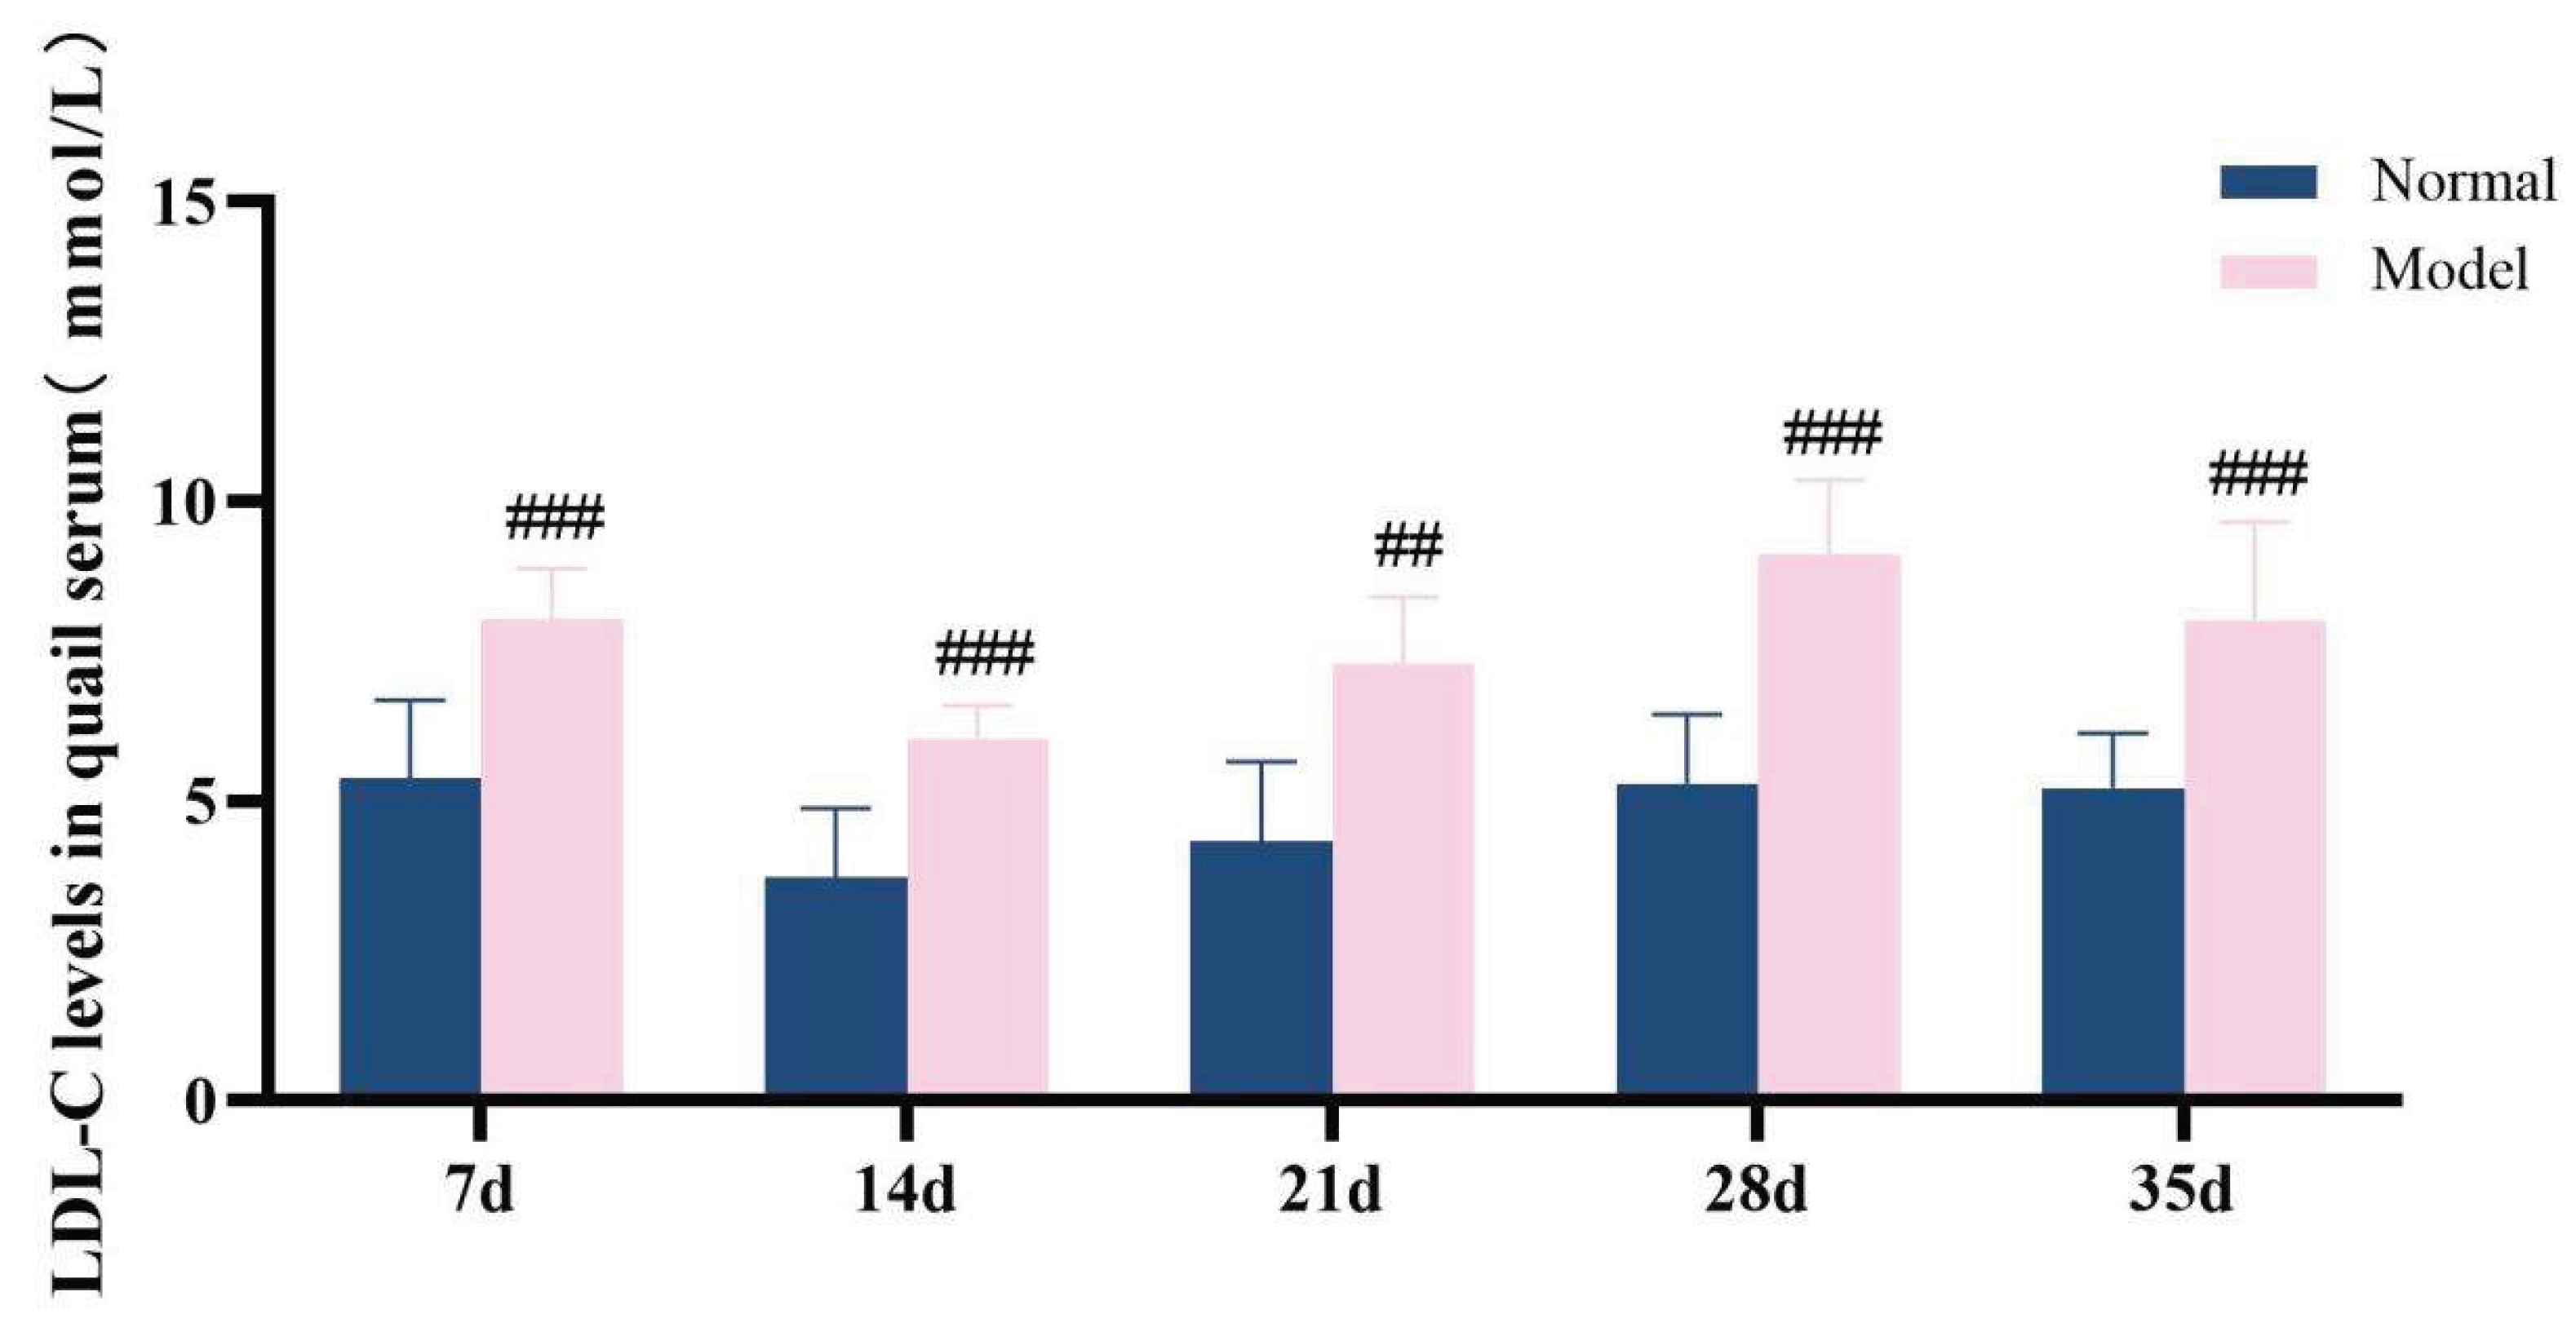
Figure 14.
HDL-C levels in quail serum during experiments 7d,14d,21d,28d and 35d.
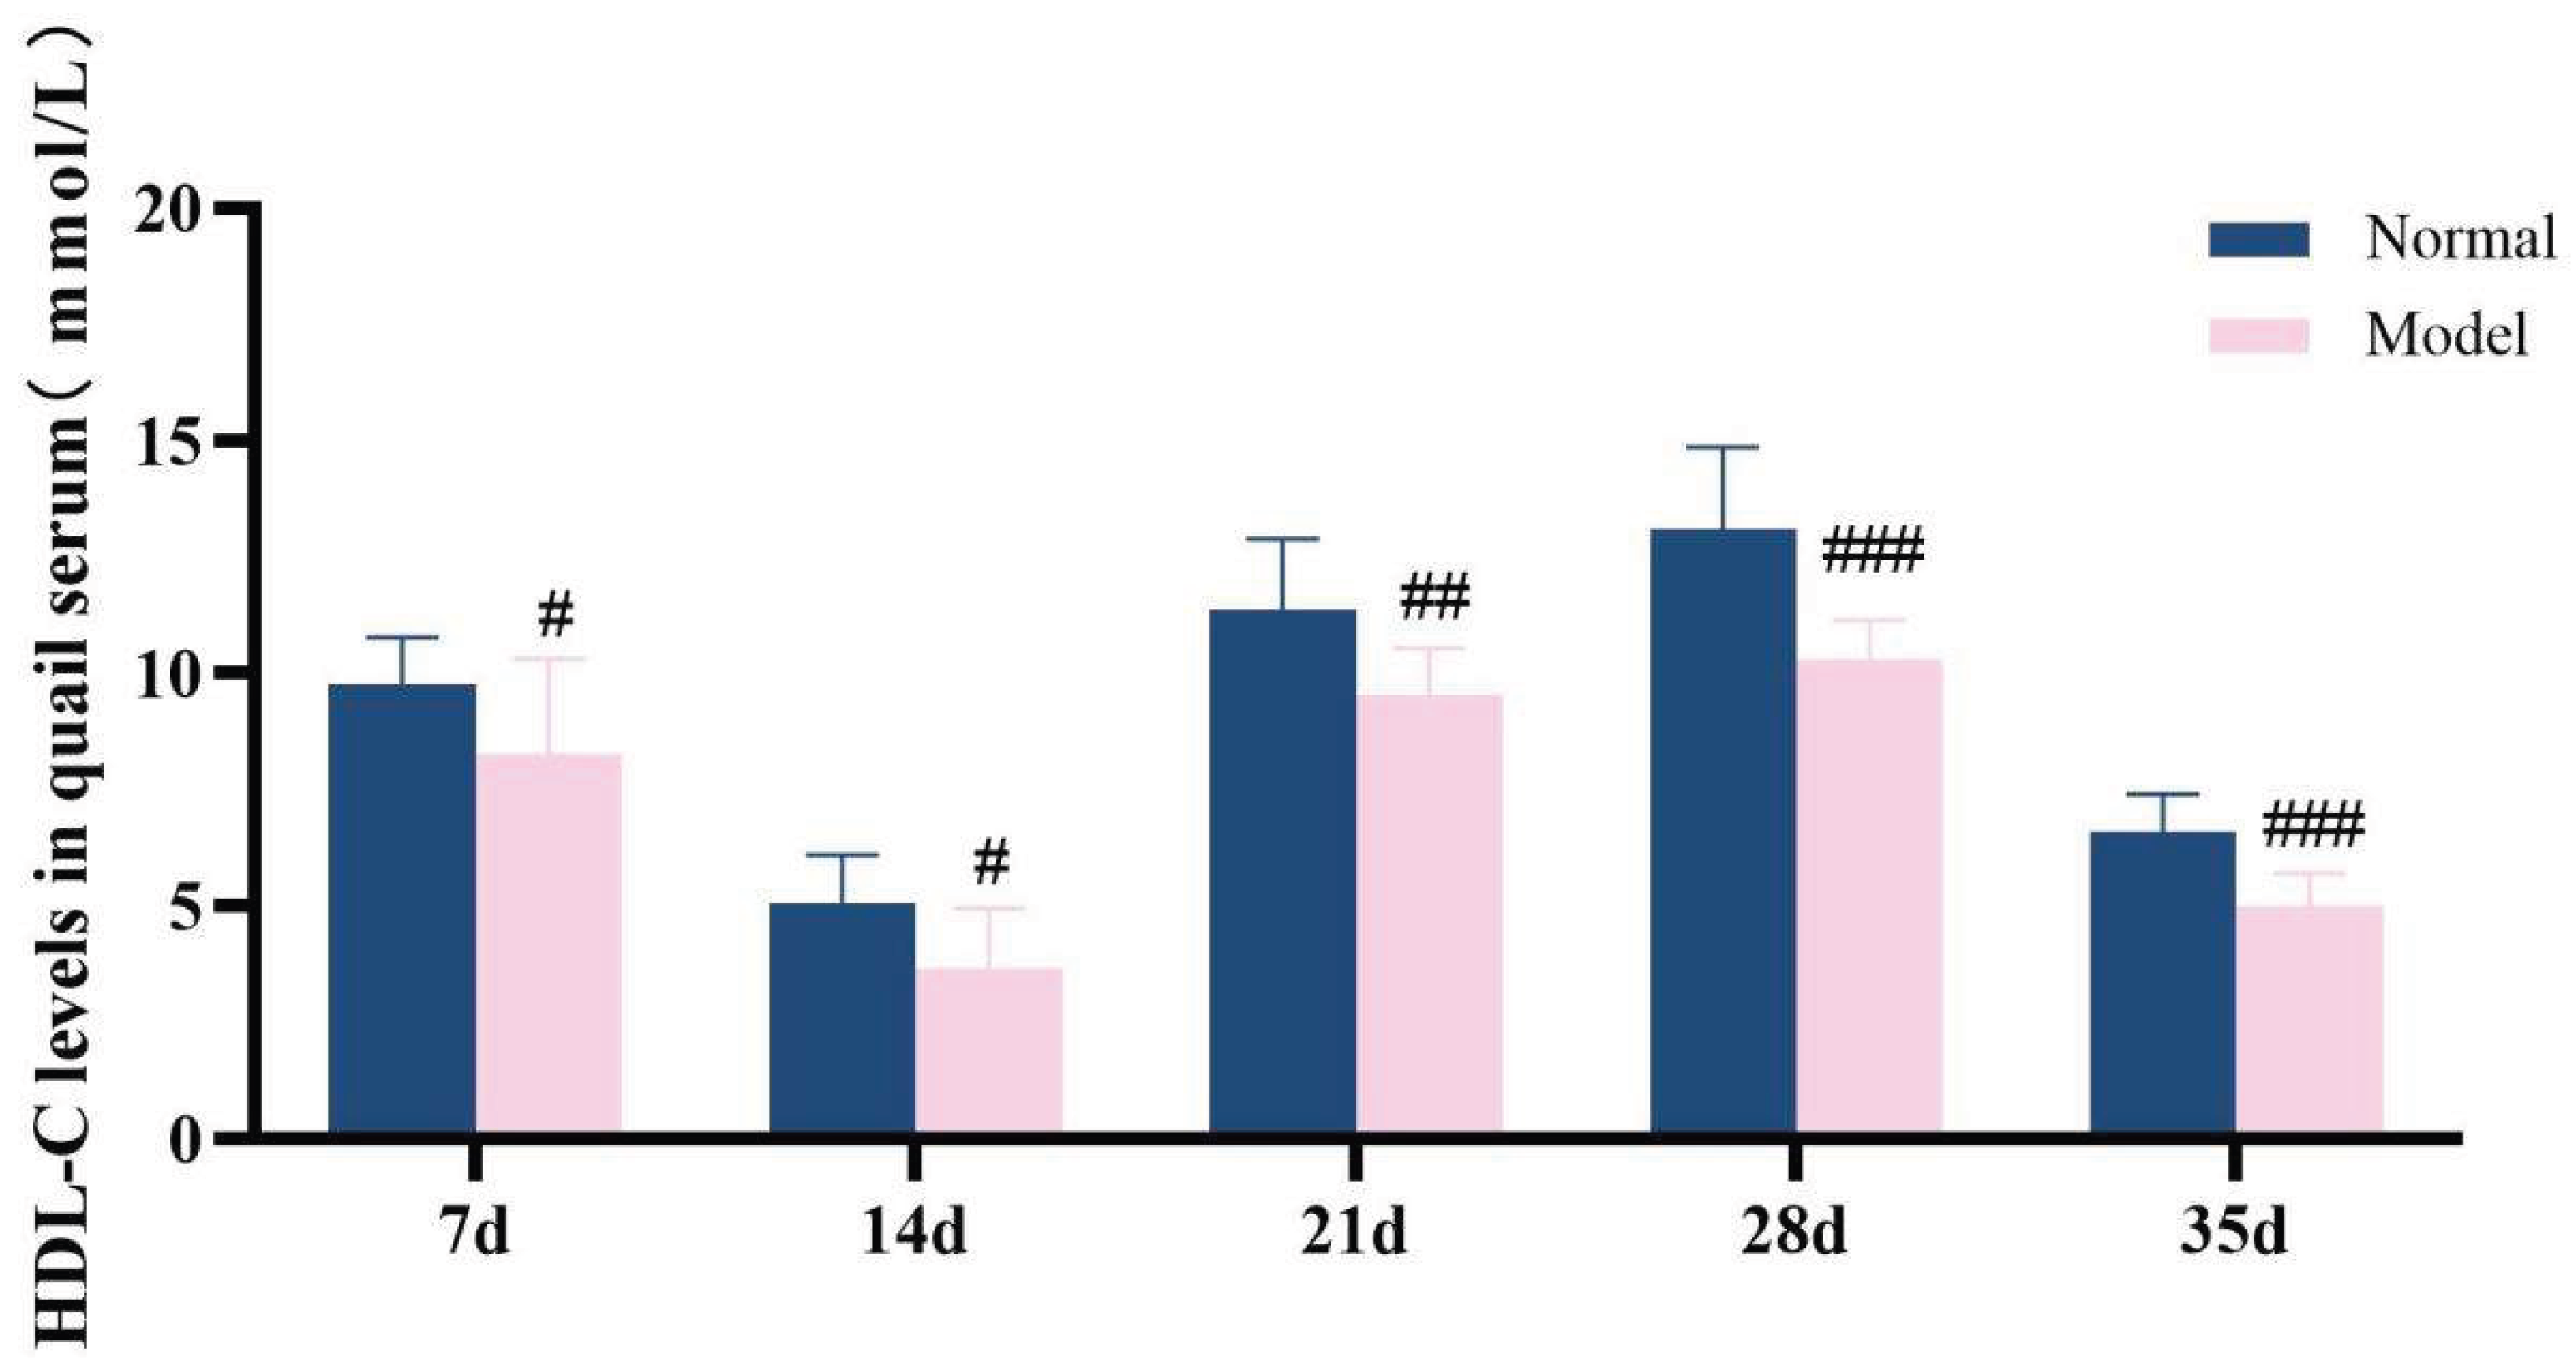
Table 7.
Serum TG/TC/LDL-C/HDL-C levelsin quails at experimental days 7d,14d,21d,28d, and 35d.
 |
 |
Note: Compared with the normal group, #P<0.05, ##P<0.01, ###P<0.001.
3.7. Hua-Hlp Model Changes In Enzyme Activity Related To Uric Acid and Lipid Metabolism In Animals
3.7.1. Xanthine Oxidase and Adenosine Deaminase Activity
ADA and XOD are key enzymes in the purine metabolism pathway in vivo, with predominant distribution in the liver [35-36]. Compared with the normal group, the serum XOD activity in the model group quails was significantly increased at 21 days, 28 days, and 35 days (P < 0.01, P < 0.001); additionally, the hepatic XOD activity in the model group was extremely significantly elevated (P < 0.001). In contrast, although the serum ADA activity and hepatic ADA activity in the model group were higher than those in the normal group at 21 days, 28 days, and 35 days, no statistically significant differences were observed (P > 0.05). Collectively, the XOD activity in both serum and liver was significantly increased; while the serum ADA activity showed unstable changes, the hepatic ADA activity exhibited a significant elevation. These findings indicate that the uric acid production pathway was relatively active.See Table 8 and Table 9 and Figure 15, Figure 16, Figure 17 and Figure 18.
3.7.2. Acetyl-Coa Carboxylase, Hepatic Lipase Activity In Quail Liver
ACC is a key enzyme regulating TG synthesis. It participates in the fatty acid synthesis process[37,38] and promotes TG production[39,40]. In this experiment, the hepatic ACC activity in the model group quails was significantly increased (P < 0.001). Lipoprotein lipase (LPL) is mainly the gene expression product involved in triglyceride metabolism[41,42,43]. HL and LPL belong to homologous proteases; they can assist in the hydrolysis of LDL-C into very low-density lipoprotein (VLDL) and synergistically promote TG clearance by HDL-C[44,45]. Compared with the normal group, the hepatic HL activity in the model group was significantly decreased (P < 0.05), while no significant difference was observed in the total lipase activity (P > 0.05). These results confirm that abnormal lipid synthesis and disrupted lipid decomposition processes occurred in the liver cells of the model quails.See Table 10 and Figure 19.
3.8. Hua-Hlp Model Animal Nampt, Sirt1 Level and Expression Changes
3.8.1. Serum Nampt and Sirt1 Levels
3.8.2. The Levels of Nampt and Sirt1 In The Liver, Kidneys and Adipose Tissue
Compared with the normal group, the levels of NAMPT in the liver, kidneys and adipose tissues of quails in the model group were significantly decreased (P<0.01, P<0.001). Compared with the normal group, the levels of SIRT1 in the liver, kidney and adipose tissues of quails in the model group were significantly decreased (P<0.001). See Table 12 and Table 13 and Figure 21 and Figure 22.
3.8.3. Expression of Nampt and Sirt1Mrna In Liver Tissue
3.8.4. Nampt and Sirt1Mrna Expression In Adipose Tissue
4. Discussion
4.1. Phenotypic Characteristics of The Hua-Hlp Animal Model
Clinical evidence consistently indicates a high rate of co-occurrence between HUA and HLP. Analysis of data from the NHANES III study, which included 14,130 participants, revealed a significant association between lipid profiles and serum UA levels. Specifically, serum levels of LDL-C,TG, and TC were positively correlated with UA, whereas HDL-C showed a significant negative correlation[46]. These findings have been corroborated by a large-scale cross-sectional study involving 104,328 men and 74,916 women, which employed quantile regression analysis and similarly demonstrated a robust association between lipid parameters and UA levels, with the strength of the association increasing across higher quantiles of UA[47]. Epidemiological data further highlight the close interrelationship between the two conditions: approximately 60% of individuals with HUA also suffer from HLP[48]. According to the 2019 Chinese Guidelines for the Diagnosis and Management of Hyperuricemia and Gout, as many as 67% of patients with HUA and gout have concomitant lipid metabolism disorders[49]. Notably, among patients with HUA, 75%–80% present with HLP, while 82% of those with HLP exhibit elevated UA levels[50]. This bidirectional comorbidity suggests a strong pathophysiological link between the two metabolic disturbances.Moreover, elevated UA levels can exacerbate lipid metabolic dysfunction, and conversely, dyslipidemia may impair uric acid excretion, creating a vicious cycle that amplifies systemic metabolic stress[51]. The coexistence of HUA and HLP leads to synergistic detrimental effects, significantly increasing the risk of cardiovascular diseases, including atherosclerosis, hypertension, and metabolic syndrome. This growing burden poses a serious threat to public health. Therefore, there is an urgent need to deepen our understanding of the phenotypic features and underlying pathological mechanisms of HUA-HLP comorbidity, which may inform more effective prevention and treatment strategies.
In this study, quail (Coturnix japonica) were selected as the experimental animal model for HUA-HLP comorbidity due to their unique physiological and metabolic characteristics. As avian species, quails naturally lack uricase, the enzyme responsible for converting uric acid into soluble allantoin, thereby closely mimicking human purine metabolism and the accumulation of uric acid as the terminal metabolic product. Furthermore, quails are highly sensitive to diet-induced alterations in lipid metabolism, making them susceptible to dyslipidemia upon high-fat dietary challenge. The resulting metabolic phenotype aligns well with the clinical scenario of metabolic disorders driven by dietary imbalance, rendering quail a suitable model for studying the co-occurrence of HUA and HLP.
The core phenotypic features of this model are the concurrent and sustained presence of uric acid dysregulation and lipid metabolic abnormalities. Following induction with a high-purine and high-fat diet, model quails exhibited early-onset hyperuricemia and dyslipidemia, characterized by significant elevations in serum TG and TC. This was subsequently accompanied by decreased HDL-C and increased LDL-C, culminating in a persistent state of multiple metabolic disturbances throughout the experimental period.
At the mechanistic level, the purine metabolic pathway was markedly activated in the model animals, with upregulated expression of key uric acid-producing enzymes, contributing to excessive uric acid production. Concurrently, hepatic lipid homeostasis was profoundly disrupted: ACC activity was significantly increased, indicating enhanced de novo lipogenesis, while HL activity was markedly reduced, reflecting impaired lipid catabolism and clearance. These coordinated alterations collectively promote hepatic lipid accumulation and systemic metabolic dysfunction, further validating the reliability of this model in recapitulating the pathological features of HUA-HLP comorbidity.
4.2. Integrating Multi-Omics Data To Analyze The Mechanisms of Hua-Hlp Comorbidity
Current mechanistic studies on HUA-HLP comorbidity have primarily focused on oxidative stress, inflammation, and insulin resistance. Researchers have established a rat model of HUA-HLP using yeast extract powder and potassium oxonate, and lipidomic profiling revealed that glycerophospholipid metabolism disorder serves as a key pathological basis[52].Evidence indicates that lysophosphatidylcholine acyltransferase 3 (LPCAT3) regulates uric acid-induced lipid disturbances by inhibiting phosphorylated signal transducer and activator of transcription 3 (p-STAT3) and activating sterol regulatory element-binding protein 1c (SREBP-1c) signaling[53]. Moreover, exposure of HepG2 cells to high uric acid levels induces hepatic steatosis, characterized by increased lipogenesis and triglyceride accumulation, while urate-lowering interventions have been shown to ameliorate lipid metabolic abnormalities in experimental animals[54]. Additionally, elevated soluble uric acid has been shown to trigger the activation of the NLRP3 inflammasome, mediate endothelial cell pyroptosis, and promote lipid accumulation and atherosclerosis progression[55].
The frequent clinical co-occurrence of HUA and HLP suggests shared core pathophysiological mechanisms. Traditional genetic studies often analyze these traits independently, potentially obscuring systematic identification of pleiotropic genetic variants underlying comorbidity. To directly dissect this shared genetic architecture, we employed the MTAG. By leveraging genetic correlations between traits, MTAG enhances the power to detect pleiotropic loci influencing both phenotypes. This approach enables us to move beyond single-trait analyses and directly identify candidate pleiotropic genes and central regulatory networks driving comorbid pathogenesis, thereby providing a critical genetic entry point and theoretical framework for elucidating their common molecular mechanisms[56].
In this study, we systematically investigated the shared pathogenic mechanisms of HUA and HLP through an integrative multi-omics strategy combining MTAG, WGCNA, PPI network construction, and functional enrichment analysis. Notably, the NAMPT-SIRT1 pathway demonstrated a 66.7% genetic overlap rate, 100% target gene detection rate, and significant enrichment in nicotinamide metabolism (P=2.1×10⁻¹²), providing robust data-theoretical support. Our findings are substantiated by eight intercorrelated bioinformatics figures and four quantitative data tables, collectively validating the central role of the NAMPT-SIRT1 pathway in the pathogenesis of HUA-HLP comorbidity from multiple analytical perspectives.
4.3. Nampt-Sirt1 Pathway As A Metabolic Regulatory Hub For Hua-Hlp: Evidence From Animal Models
Nicotinamide phosphoribosyltransferase (NAMPT) is the rate-limiting enzyme in the mammalian salvage pathway that converts nicotinamide (NAM) into nicotinamide adenine dinucleotide (NAD⁺), playing a central role in NAD⁺ biosynthesis[57,58]. SIRT1, an NAD⁺-dependent deacetylase, senses intracellular NAD⁺ levels and couples cellular energy status to chromatin remodeling and gene expression regulation. It participates in the modulation of hepatic glucose and lipid metabolism, adipose tissue remodeling, insulin secretion, and other critical metabolic processes[59,60].
Clinical evidence indicates that the NAMPT-SIRT1 axis is significantly dysregulated in multiple metabolic disorders. In patients with obesity-related metabolic dysfunction-associated fatty liver disease (MAFLD), serum SIRT1 levels are markedly lower than in healthy controls, and hepatic SIRT1 protein expression is significantly downregulated. SIRT1 expression negatively correlates with liver NAS score, and hepatic steatosis severity is significantly associated with reduced SIRT1 levels[61]. In gout patients, NADH consumption is decreased and NAD⁺ levels are reduced[62,63]. A study analyzing blood samples from 80 gout patients and 80 healthy individuals revealed that both mRNA and protein expression of SIRT1 in peripheral blood mononuclear cells (PBMCs) are significantly lower during both acute and intercritical phases compared to controls[64]. In a cohort of 150 patients with type 2 diabetes mellitus (T2DM), those with concomitant MAFLD exhibited significantly lower SIRT1 levels than those without MAFLD, and SIRT1 levels were negatively correlated with serum TG and LDL-C levels[65]. In obese MAFLD patients, hepatic SIRT1 expression is markedly suppressed, accompanied by significant alterations in the expression of lipid synthesis-related genes regulated by SIRT1, including mTOR, SREBP2, and FASN[66]. Furthermore, obese individuals exhibit lower serum SIRT1 levels than lean controls, with SIRT1 levels negatively correlated with TC, TG, and LDL-C, and positively correlated with HDL-C[67]. Patients with non-alcoholic fatty liver disease show reduced hepatic NAMPT and NAD⁺ levels, and supplementation with NAD⁺ precursors has been shown to ameliorate hepatic steatosis, highlighting the therapeutic potential of this pathway[68]. Collectively, these findings indicate that dysregulation of NAMPT and SIRT1 is closely linked to multiple metabolic disturbances and plays a pivotal role in the pathogenesis of complex metabolic disorders.
In the present HUA-HLP animal model, we found that NAMPT and SIRT1 levels were significantly reduced in serum, liver, and adipose tissue of model quails compared to controls. Moreover, mRNA expression of both NAMPT and SIRT1 in liver and adipose tissue was also markedly downregulated. These findings confirm, at the whole-animal level, that the NAMPT-SIRT1 signaling pathway serves as a core molecular mechanism underlying HUA-HLP comorbidity. This mechanism, validated through multiple in vivo experiments, can be summarized as follows: upon intake of a high-fat, high-purine diet, NAMPT activity is inhibited, impairing NAD⁺ biosynthesis and leading to decreased NAD⁺ levels[69,70,71]. Reduced NAD⁺ promotes the conversion of xanthine dehydrogenase to xanthine oxidase, thereby enhancing uric acid production and triggering hyperuricemia[72,73]. Given that SIRT1 activity is strictly dependent on NAD⁺ as a co-substrate, NAD⁺ depletion directly suppresses SIRT1 function, resulting in dysregulation of downstream regulators such as PPARA, PPARG, and AMPK. This leads to impaired fatty acid oxidation, increased lipid accumulation, and elevated triglyceride levels—hallmarks of lipid metabolic dysfunction[73,74,75,76,77]. Additionally, SIRT1 modulates the expression of ABCG2, a key urate transporter, thereby influencing uric acid excretion and generation[78].
5. Conclusion
This study provides a comprehensive mechanistic interpretation of HUA-HLP comorbidity based on the “NAD World” theory, identifying the NAMPT–SIRT1 axis as the central molecular checkpoint integrating uric acid metabolism with lipid homeostasis. The strength of this work lies in its translational multi-layered design—starting from genetic convergence analysis, followed by network-based target prioritization and pathway enrichment, and ultimately validated through a controlled animal model. These findings not only advance the theoretical understanding of metabolic comorbidities but also propose NAMPT–SIRT1 as a promising therapeutic axis for precision intervention. The integration of multi-omics analytics and experimental verification provides a methodological paradigm that may accelerate drug discovery and individualized treatment strategies in metabolic syndrome–related disorders.
Ethics
The study was conducted according to the guidelines of the Declaration of Helsinki, and approved by the Institutional Review Board (or Ethics Committee) of Beijing University of Chinese Medicine (protocol code BUCM-2025031007-1147).
Funding
Supported by the High-level Key Discipline of Clinical Chinese Materia Medica by the State Administration of Traditional Chinese Medicine (zyyzdxk-2023257); “Double First-Class” Major Landmark Achievement Follow-up Funding Project(90010951310139); 2025 Beijing University of Chinese Medicine Graduate Student Independent Research Project (ZJKT2025034).
Informed Consent Statement
Not applicable.; Data and materials; The datasets used and/or analysed during the current study are available from the corresponding author on reasonable request.; All data generated or analysed during this study are included in this published article.
Acknowledgments
Not applicable.; Authorship contribution statement. Liu Shujia: Writing-original draft, Writing-review editing, Project administration, Visualization, Investigation, Validation, Funding acquisition, Formal analysis, Data curation. Feng Xinyu: Methodology, Visualization, Investigation, Validation, Formal analysis. Liu Xinlong: Methodology, Visualization, Investigation, Validation. Lin Yan: Methodology, Visualization, Investigation, Validation, Formal analysis. Zhang Bing: Writing-review editing, Project administration, Methodology, Funding acquisition, Supervision, Resources, Conceptualization. Lin Zhijian:Writing-review editing, Project administration, Methodology, Funding acquisition, Supervision, Conceptualization. Wang Yu: Writing-review editing, Project administration, Methodology, Supervision, Conceptualization. Zhang Xiaomeng: Writing-review editing, Project administration, Methodology, Supervision, Conceptualization.
Conflicts of Interest
The authors declare no conflict of interest.
References
- Mansoori, S.; Ho, M.Y Ng, K.K.; Cheng, K.K. Branched-chain amino acid metabolism: Pathophysiological mechanism and therapeutic intervention in metabolic diseases. Obes Rev. 2025, 26(2),e13856.
- Chen, L.; Ye, X.; Yang, L.; Zhao, J.; You, J.; Feng, Y. Linking fatty liver diseases to hepatocellular carcinoma by hepatic stellate cells. J Natl Cancer Cent. 2024, 4(1)25-35.
- Zhao, X.; Lu, C.; Song, B.; Chen, D.; Teng, D.; Shan, Z.; Teng, W. The prevalence and clustering of metabolic syndrome risk components in Chinese population: a cross-sectional study. Front Endocrinol (Lausanne) 2023,14,1290855.
- Meng, Z.; Liu, C.; Xu, M.; Tao, Y Li, H.; Wang, X.; Liao, J.; Wang, M. Adipose transplantation improves metabolism and atherosclerosis but not perivascular adipose tissue abnormality or vascular dysfunction in lipodystrophic Seipin/Apoe null mice. Am J Physiol Cell Physiol. 2024,326(5),C1410-C1422.
- Jiang, Y.; Zhang, S.; Pan, L.; Leng, J.; Zhou, T.; Liu, M.; Li, L.; Zhao, W. Β-Glucan-based superabsorbent hydrogel acts as a gastrointestinal exoskeleton enhancing satiety and interfering fat hydrolysis. Int J Biol Macromol 2024,275(Pt 2),133333.
- Chinese Medical Association Diabetes Branch. China’s Guidelines for the Prevention and Treatment of Type 2 Diabetes (2020 Edition). Chinese J. Endocrinol. Metab. 2021, 37(4)311-398.
- Ningyuan, F.;Liwei, L.Ü.; Xiaoxi, L.Ü.; et al. China Multidisciplinary Expert Consensus on the Diagnosis and Treatment of Hyperuricemia-Related Diseases (2023 Edition). China J. Pract. Intern. Medicine 2023, 43(06)461-480.
- Zengwu, W.; Jing, L.; Jianjun,L.I.; et al. China Lipid Management Guidelines (2023). China Circ. J. 2023, 38(03)237-271.
- Lorenzo, J.P.P.; Sollano, M.H.M.Z Salido, E.O.; Li-Yu, J.; Tankeh-Torres, S.A.; Manuaba, I.W.; Rahman, M.M.; Paul, B.J.; Mok, M.Y.; De Silva, M.; et al. 2021 Asia-Pacific League of Associations for Rheumatology clinical practice guideline for treatment of gout. Int JRheum Dis. 2022,25(1)7-20.
- Dalbeth, N.; Bardin, T.; Doherty, M.; Lioté, F.; Richette, P.; Saag, K.G.; So, A.K.; Stamp, L.K.; Choi, H.K.; Terkeltaub, R. Discordant American College of Physicians and international rheumatology guidelines for gout management: consensus statement of the Gout, Hyperuricemia and Crystal-Associated Disease Network (G-CAN). Nat Rev Rheumatol 2017,13(9),561-568. PMID: 28794514. [CrossRef]
- Huang, J.; Ma, Z.F Zhang, Y.; Wan, Z.; Li, Y.; Zhou, H Chu, A.; Lee, Y.Y. Geographical distribution of hyperuricemia in mainland China: a comprehensive systematic review and meta-analysis. Glob Health Res Policy 2020,5(1),52.
- Chang, Z.;Li, H.Li, Y. Trend analysis and comparison of gout burden between China and the globe from 1990 to 2021. J. Public Health Prev. Medicine2025, 36(4), 7-11.
- Singh, G.; Lingala, B.; Mithal, A. Gout and hyperuricaemia in the USA: prevalence and trends. Rheumatol. (Oxford) 2019, 58(12),2177-2180.
- Mrowietz, U.; Sümbül, M.; Gerdes, S. Depression, a major comorbidity of psoriatic disease, is caused by metabolic inflammation. J Eur Acad Dermatol. Venereol 2023, 37(9),1731-1738.
- Khalfan, A.F.; Campisi, S.C.; Lo, R.F McCrindle, B.W.; Korczak, D.J. The association between adolescent depression and dyslipidemia. J Affect Disord. 2023, 338,239-245.
- Chen, N.; Gong, L.; Zhang, L.; Li, Y.; Bai, Y.; Gao, D Zhang, L. Identification of Therapeutic Targets for Hyperuricemia: Systematic Genome-Wide Mendelian Randomization and Colocalization Analysis. Biomedicines 2025,13(5)1022.
- Tao, Y.; Cai, T.; Pan, Q.; Yang, L.; Lin, S.; Haque, M.; Dottorini, T Abhishek, A.; Meng, W. Genetic variants associated with gout identified through a genome-wide study in the UK biobank (N=150542). Hum Mol Genet 2025,ddaf151.
- Chang, Y.S.; Lin, C.Y.; Liu, T.Y.; Huang, C.M.; Chung, C.C.; Chen, Y.C.; Tsai, F.J.; Chang, J.G.; Chang, S.J. Polygenic risk score trend and new variants on chromosome 1 are associated with male gout in genome-wide association study. Arthritis Res Ther 2022,24(1),229.
- Yin, Z.; Zhao, Y.; Du, H.; Nie, X Li, H.; Fan, J.; He, M.; Dai, B Zhang, X.; Yuan, S.; et al. A Key GWAS-Identified Genetic Variant Contributes to Hyperlipidemia by Upregulating miR-320a. IScience2020,23(12),101788.
- Chou, W.C.; Chen, W.T.; Shen, C.Y. A common variant in 11q23.3 associated with hyperlipidemia is mediated by the binding and regulation of GATA4. NPJ Genom Med. 2022, 7(1),4.
- Wallace, C.; Newhouse, S.J Braund, P.; Zhang, F.; Tobin, M.; Falchi, M.; Ahmadi, K Dobson, R.J.; Marçano, A.C.; Hajat, C.; et al. Genome-wide association study identifies genes for biomarkers of cardiovascular disease: serum urate and dyslipidemia. Am J Hum Genet. 200882(1)139-49.
- Li, W.D.; Jiao, H.; Wang, K.; Zhang, C.K.; Glessner, J.T.; Grant, S.F.; Zhao, H.; Hakonarson, H.; Price, R.A. A genome wide association study of plasma uric acid levels in obese cases and never-overweight controls. Obes. (Silver Spring) 2013,21(9),E490-4.
- Maina, J.G.; Balkhiyarova, Z.; Nouwen, A.; Pupko, I.; Ulrich, A.; Boissel, M.; Bonnefond, A.; Froguel, P.; Khamis, A.; Prokopenko, I.; et al. Bidirectional Mendelian Randomization and Multiphenotype GWAS Show Causality and Shared Pathophysiology Between Depression and Type 2 Diabetes. Diabetes Care 2023,46(9),1707-1714.
- Chen, G.; Shriner, D.; Doumatey, A.P.; Zhou, J Bentley, A.R.; Lei, L.; Adeyemo, A.; Rotimi, C.N. Refining genome-wide associated loci for serum uric acid in individuals with African ancestry. Hum Mol Genet. 2020,29(3),506-514.
- Watanabe, K.; Taskesen, E.; Van Bochoven, A.; Posthuma, D. Functional mapping and annotation of genetic associations with FUMA. Nat. Commun.2017,8, 1826.
- Hu, X.; Zhang, W.; Zhang, S.; Ma, S.; Li, Q. Group-combined P-values with applications to genetic association studies. Bioinformatics 2016, 32(18),2737-43.
- Morabito, S.; Reese, F.; Rahimzadeh, N.; Miyoshi, E.; Swarup, V. HdWGCNA identifies co-expression networks in high-dimensional transcriptomics data. Cell Rep. Methods2023,3, 100498.
- Langfelder, P.; Horvath, S. WGCNA: an R package for weighted correlation network analysis. BMC Bioinform. 9, 559.
- Szklarczyk, D.; Nastou, K.; Koutrouli, M.; Kirsch, R.; Mehryary, F.; Hachilif, R.; Hu, D.; Peluso, M.E Huang, Q.; Fang, T.; et al. The STRING database in 2025: protein networks with directionality of regulation. Nucleic Acids Res. 202553(D1)D730-D737.
- Szklarczyk, D.; et al. STRING v11: protein-protein association networks with increased coverage, supporting functional discovery in genome-wide experimental datasets. Nucleic Acids Res.2019,47, D607–D613.
- Szklarczyk, D.; et al. The STRING database in 2021: customizable protein-protein networks, and functional characterization of user-uploaded gene/measurement sets. Nucleic Acids Res.2021,49, D605–D612.
- Xu, S.; Hu, E.; Cai, Y.; Xie, Z Luo, X.; Zhan, L.; Tang, W.; Wang, Q.; Liu, B Wang, R.; et al. Using clusterProfiler to characterize multiomics data. Nat Protoc. 2024, 19(11),3292-3320.
- Yu, G.; Wang, L.G Han, Y.; He, Q.Y. ClusterProfiler: an R package for comparing biological themes among gene clusters. OMICS 2012, 16(5),284-7.
- Xu, Y.; Wang, Y.; Gao, F.; Lu, C.; Liu, S.; Chen, S.; Zhang, X Lin, Z.; Zhang, B. Innovative modeling: a diet-induced quail model for progressive pathological changes in uric acid metabolism disorders. Front Nutr. 2025,12,1612479.
- Fangfang,Y.; Rui, Z.; Ruijuan, F.U.; et al. The effects of quercetin on xanthine oxidase and adenosine deaminase activities in hyperuricemia rats.J. Zhengzhou Univ. (Medical Ed. 2011, 46(02)248-251.
- Mingyu, Y.; Xiaoyu, S.; Danhui,Q.I.; et al. Research Advances in Xanthine Oxidase Inhibitors. J. Chinese Medicinal Chem. 2025, 35(02)117-134.
- Brownsey, R.W.; Boone, A.N.; Elliott, J.E.; Brownsey, R.W.; Boone, A.N.; Elliott, J.E.; et al. Regulation of acetyl-CoA carboxylase. Biochem Soc Trans2006, 34(2),223-227.
- Aizizi, O.G.; Ying, W.; Wei, L. Chamomile Total Flavonoids Reduce Triglyceride Synthesis in ApoE-/-Mice by Inhibiting the ACC/FAS/DGAT2 Pathway. China J. Hosp. Pharm. 2022, 42(03)229-234.
- Maier, T.; Leibundgut, M.; Boehringer, D.; Maier, T.; Leibundgut, M.; Boehringer, D.; et al. Structure and function of eukaryotic fatty acid synthases. Q Rev Biophys2010, 43(3),373-422.
- Zhong, C.; Hongbing, C.; Changxu,Z.; et al. Advances in the Regulatory Mechanisms of Fatty Acid Synthases. J. Clin. Exp. Pathol 2016, 32(2)197.
- Tian, S.; Li, B.; Lei, P.;Tian, S.; Li, B.; Lei, P.; et al.Sulforaphane improves abnormal lipid metabolism via both ERS-dependent XBP1/ACC &SCD1 and ERS-independent SREBP/FAS pathways.Mol Nutr Food Res2018, 62(6),e1700737.
- Zhen, R.; Wenying, N.; Siying,L.; et al. Effects of Qi-Nourishing Yin-Nourishing Formula on Lipid Levels in High-Lipidemia Model Mice. Sichuan J. Tradit. Chinese Medicine 2023, 41(07)51-57.
- Liu, T.;Huang, K.;Zheng, Y.M.Cloning of hepatic lipase and the effects of dietary nutrition on hepatic lipase expression in genetically improved farmed tilapia (Oreochromis niloti-cus).Fish Physiol Biochem2020, 46(2),921.
- Weiqiang, L.I.; Faxin, L.I.; Jie-xuan,L.I.; et al. The improvement effect of swimming exercise on hyperlipidemia rats. China J. Gerontol. 2021, 41(06),1312-1315.
- Du Yuzhong; Jie, S.U.; Meiqiu, Y.; et al. The improvement effect of Chinese tangerine peel extract on triglycerides in hyperlipidemia model rats and its mechanism.ChinaJ. Tradit. Chinese Medicine 2021, 46(01)190-195.
- Peng, T.C.; Wang, C.C.; Kao, T.W.; Chan, J.Y.; Yang, Y.H.; Chang, Y.W Chen, W.L. Relationship between hyperuricemia and lipid profiles in US adults. Biomed Res Int. 2015,2015,127596.
- Wang, X.; Zhong, S.; Guo, X. The associations between fasting glucose, lipids and uric acid levels strengthen with the decile of uric acid increase and differ by sex. Nutr Metab Cardiovasc Dis. 2022,32(12),2786-2793.
- Guo,L.F.; Chen,X.; Lei,S.S.; Etal.Effects and mechanisms of dendrobium officinalis six nostrum for treatment of hyperuricemia with hyperlipidemia. Evid.Based Complement Altern.Med.2020,2020, Article2914019.
- Chinese Endocrine Society, China Hyperuricemia and Gout Diagnosis and Treatment Guidelines (2019). Chinese Journal of Endocrinology and Metabolism; 2020;36(1),1-13.
- Fei, Y.; Xuechen, L.I.; Fei, Y.E. Advances in the Study of Hyperuricemia and Metabolic Syndrome. Int. J. Pharm. Res. 2017, 44(06)487-490+499.
- Xuan,L.Q.; Hong, M.W. The effect of atorvastatin combined with allopurinol on blood lipids and uric acid in patients with hyperlipidemia combined with hyperuricemia. China Pharm. 2016, 27(12),1632-1634.
- Li, J.; Chen, Y.; Li, S.; Lyu, G.; Yan, F.; Guo, J.; Cheng, J.; Chen, Y.; Lin, J.; Zeng, Y. NAFPD exacerbation by hyperlipidemia combined with hyperuricemia: a pilot rat experiment in lipidomics. Front Nutr. 2025,11,1437373.
- Liu, N.; Sun, Q.; Xu, H.; Yu, X.; Chen, W.; Wei, H Jiang, J Xu, Y.; Lu, W. Hyperuricemia induces lipid disturbances mediated by LPCAT3 upregulation in the liver. FASEB J 2020,34(10)13474-13493.
- Lanaspa, M.A.; Sanchez-Lozada, L.G.; Choi, Y.J.; Cicerchi, C.; Kanbay, M.; Roncal-Jimenez, C.A.; Ishimoto, T.; Li, N.; Marek, G Duranay, M.; et al. Uric acid induces hepatic steatosis by generation of mitochondrial oxidative stress: potential role in fructose-dependent and -independent fatty liver. J Biol Chem. 2012287(48)40732-44.
- He, B.; Nie, Q.; Wang, F.; Wang, X.; Zhou, Y.; Wang, C.; Guo, J.; Fan, X.; Ye, Z.; Liu, P.; et al. Hyperuricemia promotes the progression of atherosclerosis by activating endothelial cell pyroptosis via the ROS/NLRP3 pathway. J Cell Physiol. 2023,238(8),1808-1822.
- Xu, H.; Toikumo, S.; Crist, R.C.; Glogowska, K.; Jinwala, Z.; Deak, J.D.; Justice, A.C.; Gelernter, J.; Johnson, E.C.; Kranzler, H.R.; et al. Identifying genetic loci and phenomic associations of substance use traits: A multi-trait analysis of GWAS (MTAG) study. Addiction 2023,118(10),1942-1952.
- Zhu, Y.; Liu, R.; Shen, Z.; Cai, G. Combination of luteolin and lycopene effectively protect against the “two-hit” in NAFLD through SIRT1/AMPK signal pathway. Life Sci. 2020, 256,117990.
- Wang, L.; Tao, Y.; Wang, X.; Gan, Y Zeng, Y.; Li, S.; Zhu, Q. Aqueous extract of Phellinus igniarius ameliorates hyperuricemia and renal injury in adenine/potassium oxonate-treated mice. Biomed Pharmacother 2024,177,116859.
- Wang, Y.; Xu, C.; Liang, Y.; Vanhoutte, P.M. SIRT1 in metabolic syndrome: where to target matters. Pharmacol Ther. 2012, 136(3),305-18.
- Chen, G.C.; Su, H.M.; Lin, Y.S.; Tsou, P.Y.; Chyuan, J.H.; Chao, P.M. A conjugated fatty acid present at high levels in bitter melon seed favorably affects lipid metabolism in hepatocytes by increasing NAD(+)/NADH ratio and activating PPARα, AMPK and SIRT1 signaling pathway. J Nutr Biochem. 2016,33,28-35.
- Xinde, L. Mechanism of Gastric Sleeve Resection Influencing SIRT1/NRF2/GPX4 Pathway to Improve Metabolic Dysfunction-Related Fatty Liver Disease; China Medical University, 2024.
- Haiyan, Z.; Shuo, C.; Yubin,L.; et al. Bioinformatics Analysis of Urinary Protein in Gout Patients with Hyperuricemia and Hyperlipidemia. J. Label Immunol. Clin. Pract. 2022, 29(10)1669-1674.
- Ze, W. Mechanism of Jianpi Xiecuo Formula in Gout Treatment Based on Nrf2 Antioxidant Pathway. Anhui University of Chinese Medicine; 2022.
- Qibin,Y.; Yonglong, H.E.; Xiaowu, Z.; et al. The Effects of Resveratrol on Sirtuin 1 Expression in Peripheral Blood Mononuclear Cells of Gout Patients.J. North Sichuan Méd. Coll. 2018, 33(05)649-653.
- Xi, S. Correlation between metabolic-related steatohepatitis and SIRT1/oxidative stress in type 2 diabetes patients with different TCM syndromes; Nanjing University of Chinese Medicine, 2025.
- Shan, S. A Study on the Mechanism of Gastric Sleeve Surgery in Enhancing Adiponectin-Activated SIRT1/SREBP2 Pathway to Alleviate Metabolic-Related Fatty Liver Disease; China Medical University, 2024.
- Zhen, M. The Significance of SIRT1 Expression in Patients with Simple Obesity and Experimental Study on Intervention with Modified Erchen Decoction. Hubei University of Chinese Medicine; 2022.
- Qian, Y. Therapeutic effects and mechanism of nicotinamide ribose in non-alcoholic steatohepatitis; Second Military Medical University, 2016.
- Yoshino, J.; Mills, K.F Yoon, M.J.; Imai, S. Nicotinamide mononucleotide, a key NAD(+) intermediate, treats the pathophysiology of diet- and age-induced diabetes in mice. Cell Metab 2011,14(4),528-36.
- Wei, X.; Wei, C.; Tan, Y.; Dong, X.; Yang, Z.; Yan, J Luo, X. Both prolonged high-fat diet consumption and calorie restriction boost hepatic NAD+ metabolism in mice. J Nutr Biochem. 2023,115109296.
- Zhang, Z.F.; Fan, S.H.; Zheng, Y.L.; Lu, J.; Wu, D.M.; Shan, Q.; Hu, B. Troxerutin improves hepatic lipid homeostasis by restoring NAD(+)-depletion-mediated dysfunction of lipin 1 signaling in high-fat diet-treated mice. Biochem Pharmacol 2014,91(1),74-86.
- Ferdaus, S.A.; Ohara, H.; Matsuo, H.; Kawakami, K.; Takeuchi, F.; Fujikawa, K.; Kawakita, E.; Kato, N.; Nabika, T.; Kanasaki, K. NAD+ deficiency plays essential roles in the hyperuricemia of stroke-prone spontaneously hypertensive rat via xanthine dehydrogenase to xanthine oxidase conversion. Biochem Biophys Res Commun 2025,744,151136.
- McNally, J.S.; Davis, M.E.; Giddens, D.P.; Saha, A.; Hwang, J.; Dikalov, S.; Jo, H.; Harrison, D.G. Role of xanthine oxidoreductase and NAD(P)H oxidase in endothelial superoxide production in response to oscillatory shear stress. Am J Physiol Heart Circ Physiol. 2003,285(6),H2290-7.
- Ruderman, N.B.; Xu, X.J.; Nelson, L.; Cacicedo, J.M.; Saha, A.K.; Lan, F.; Ido, Y. AMPK and SIRT1: a long-standing partnership? Am J Physiol Endocrinol Metab 2010, 298(4)E751-60.
- Jiang, Z.; Wang, H.; Yang, Y.; Yao, Y.; Ma, H. Genistein activated SIRT1-AMPK signaling pathway mediated by ERβ-FOXO1-Nampt to reduce fat accumulation in chicken hepatocytes. Life Sci. 2023,312121259.
- Yang, N.; Sun, R.; Zhang, X.; Wang, J.; Wang, L.; Zhu, H Yuan, M.; Xu, Y.; Ge, C.; He, J.; et al. Alternative pathway of bile acid biosynthesis contributes to ameliorate NASH after induction of NAMPT/NAD+/SIRT1 axis. Biomed Pharmacother 2023,164,114987.
- Caton, P.W.; Kieswich, J.; Yaqoob, M.M.; Holness, M.J.; Sugden, M.C. Metformin opposes impaired AMPK and SIRT1 function and deleterious changes in core clock protein expression in white adipose tissue of genetically-obese db/db mice. Diabetes Obes Metab 2011,13(12),1097-104.
- Zhongqian, P.; Meilan, X.; Jia,Y.; et al. The Effects and Mechanisms of Fucoidan on Uric Acid-Induced Apoptosis in HepG2 Cells. J. Qingdao Univ. (Medical Ed. 2023, 59(06)867-873.
Figure 2.
Venn Diagram of Gene Overlap Analysis.
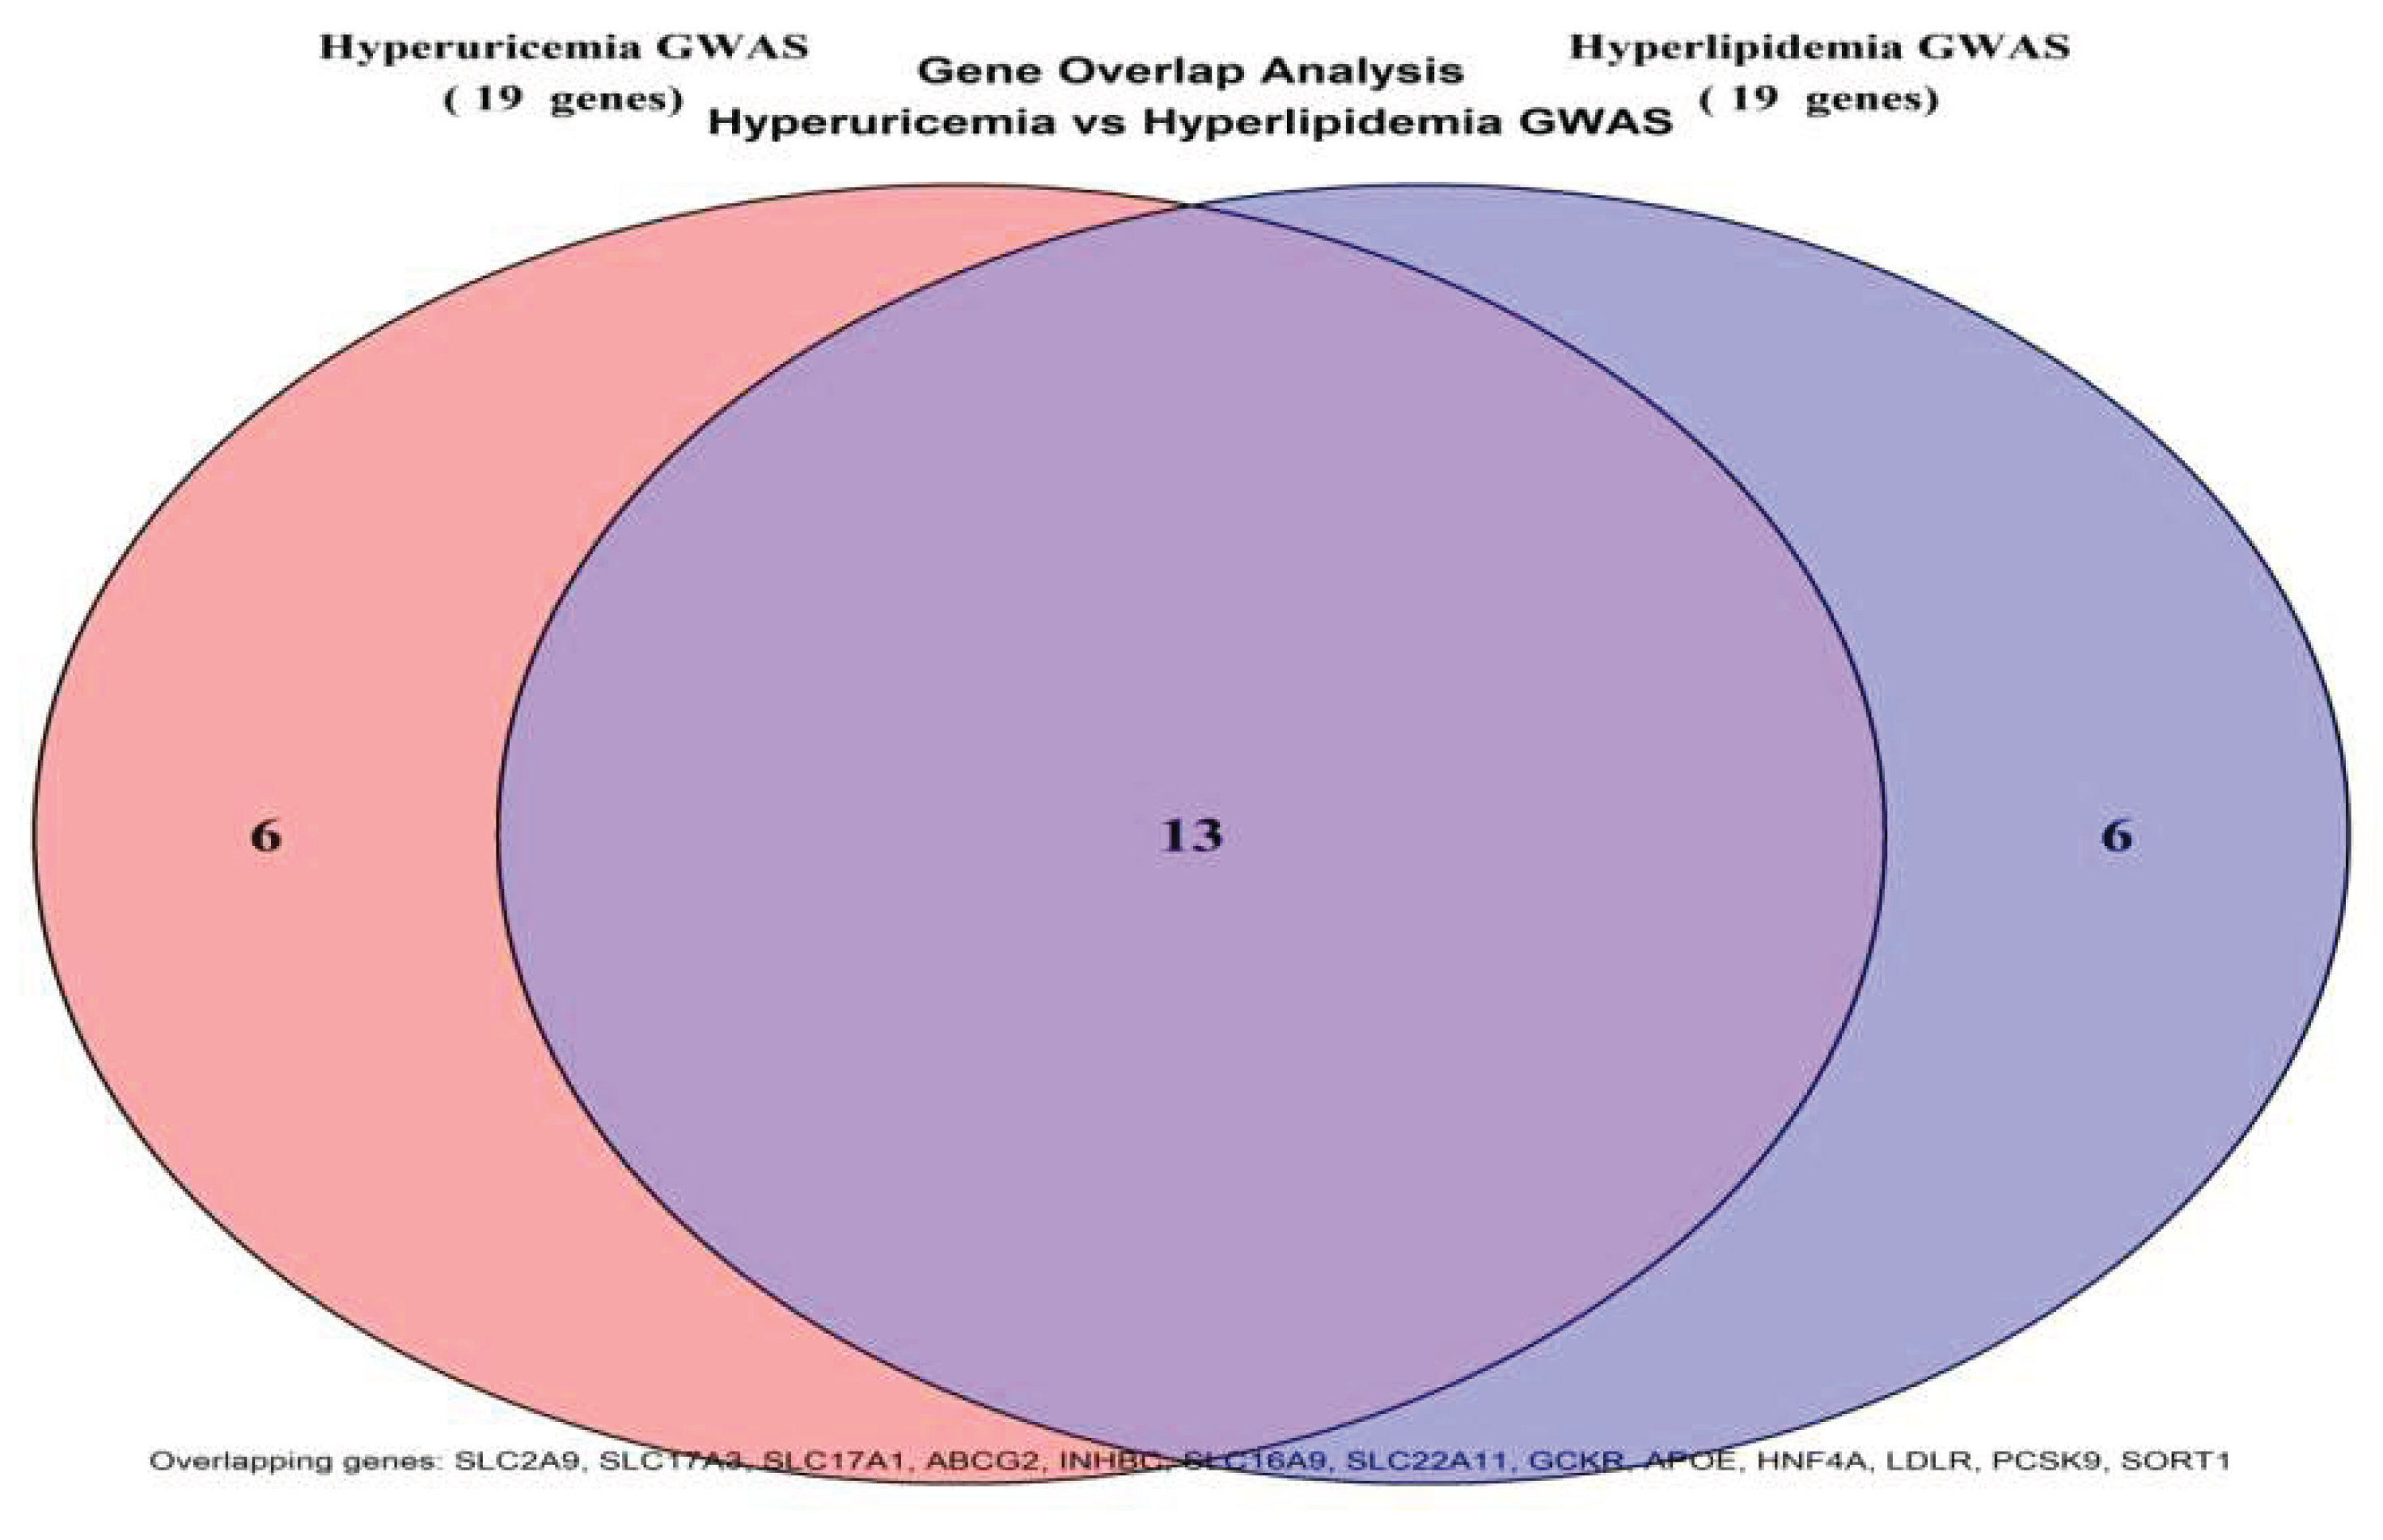
Figure 3.
Heatmap visualization of 30 key target genes across metabolic states, annotated by functional categories and gene clustering hierarchy.
Figure 3.
Heatmap visualization of 30 key target genes across metabolic states, annotated by functional categories and gene clustering hierarchy.
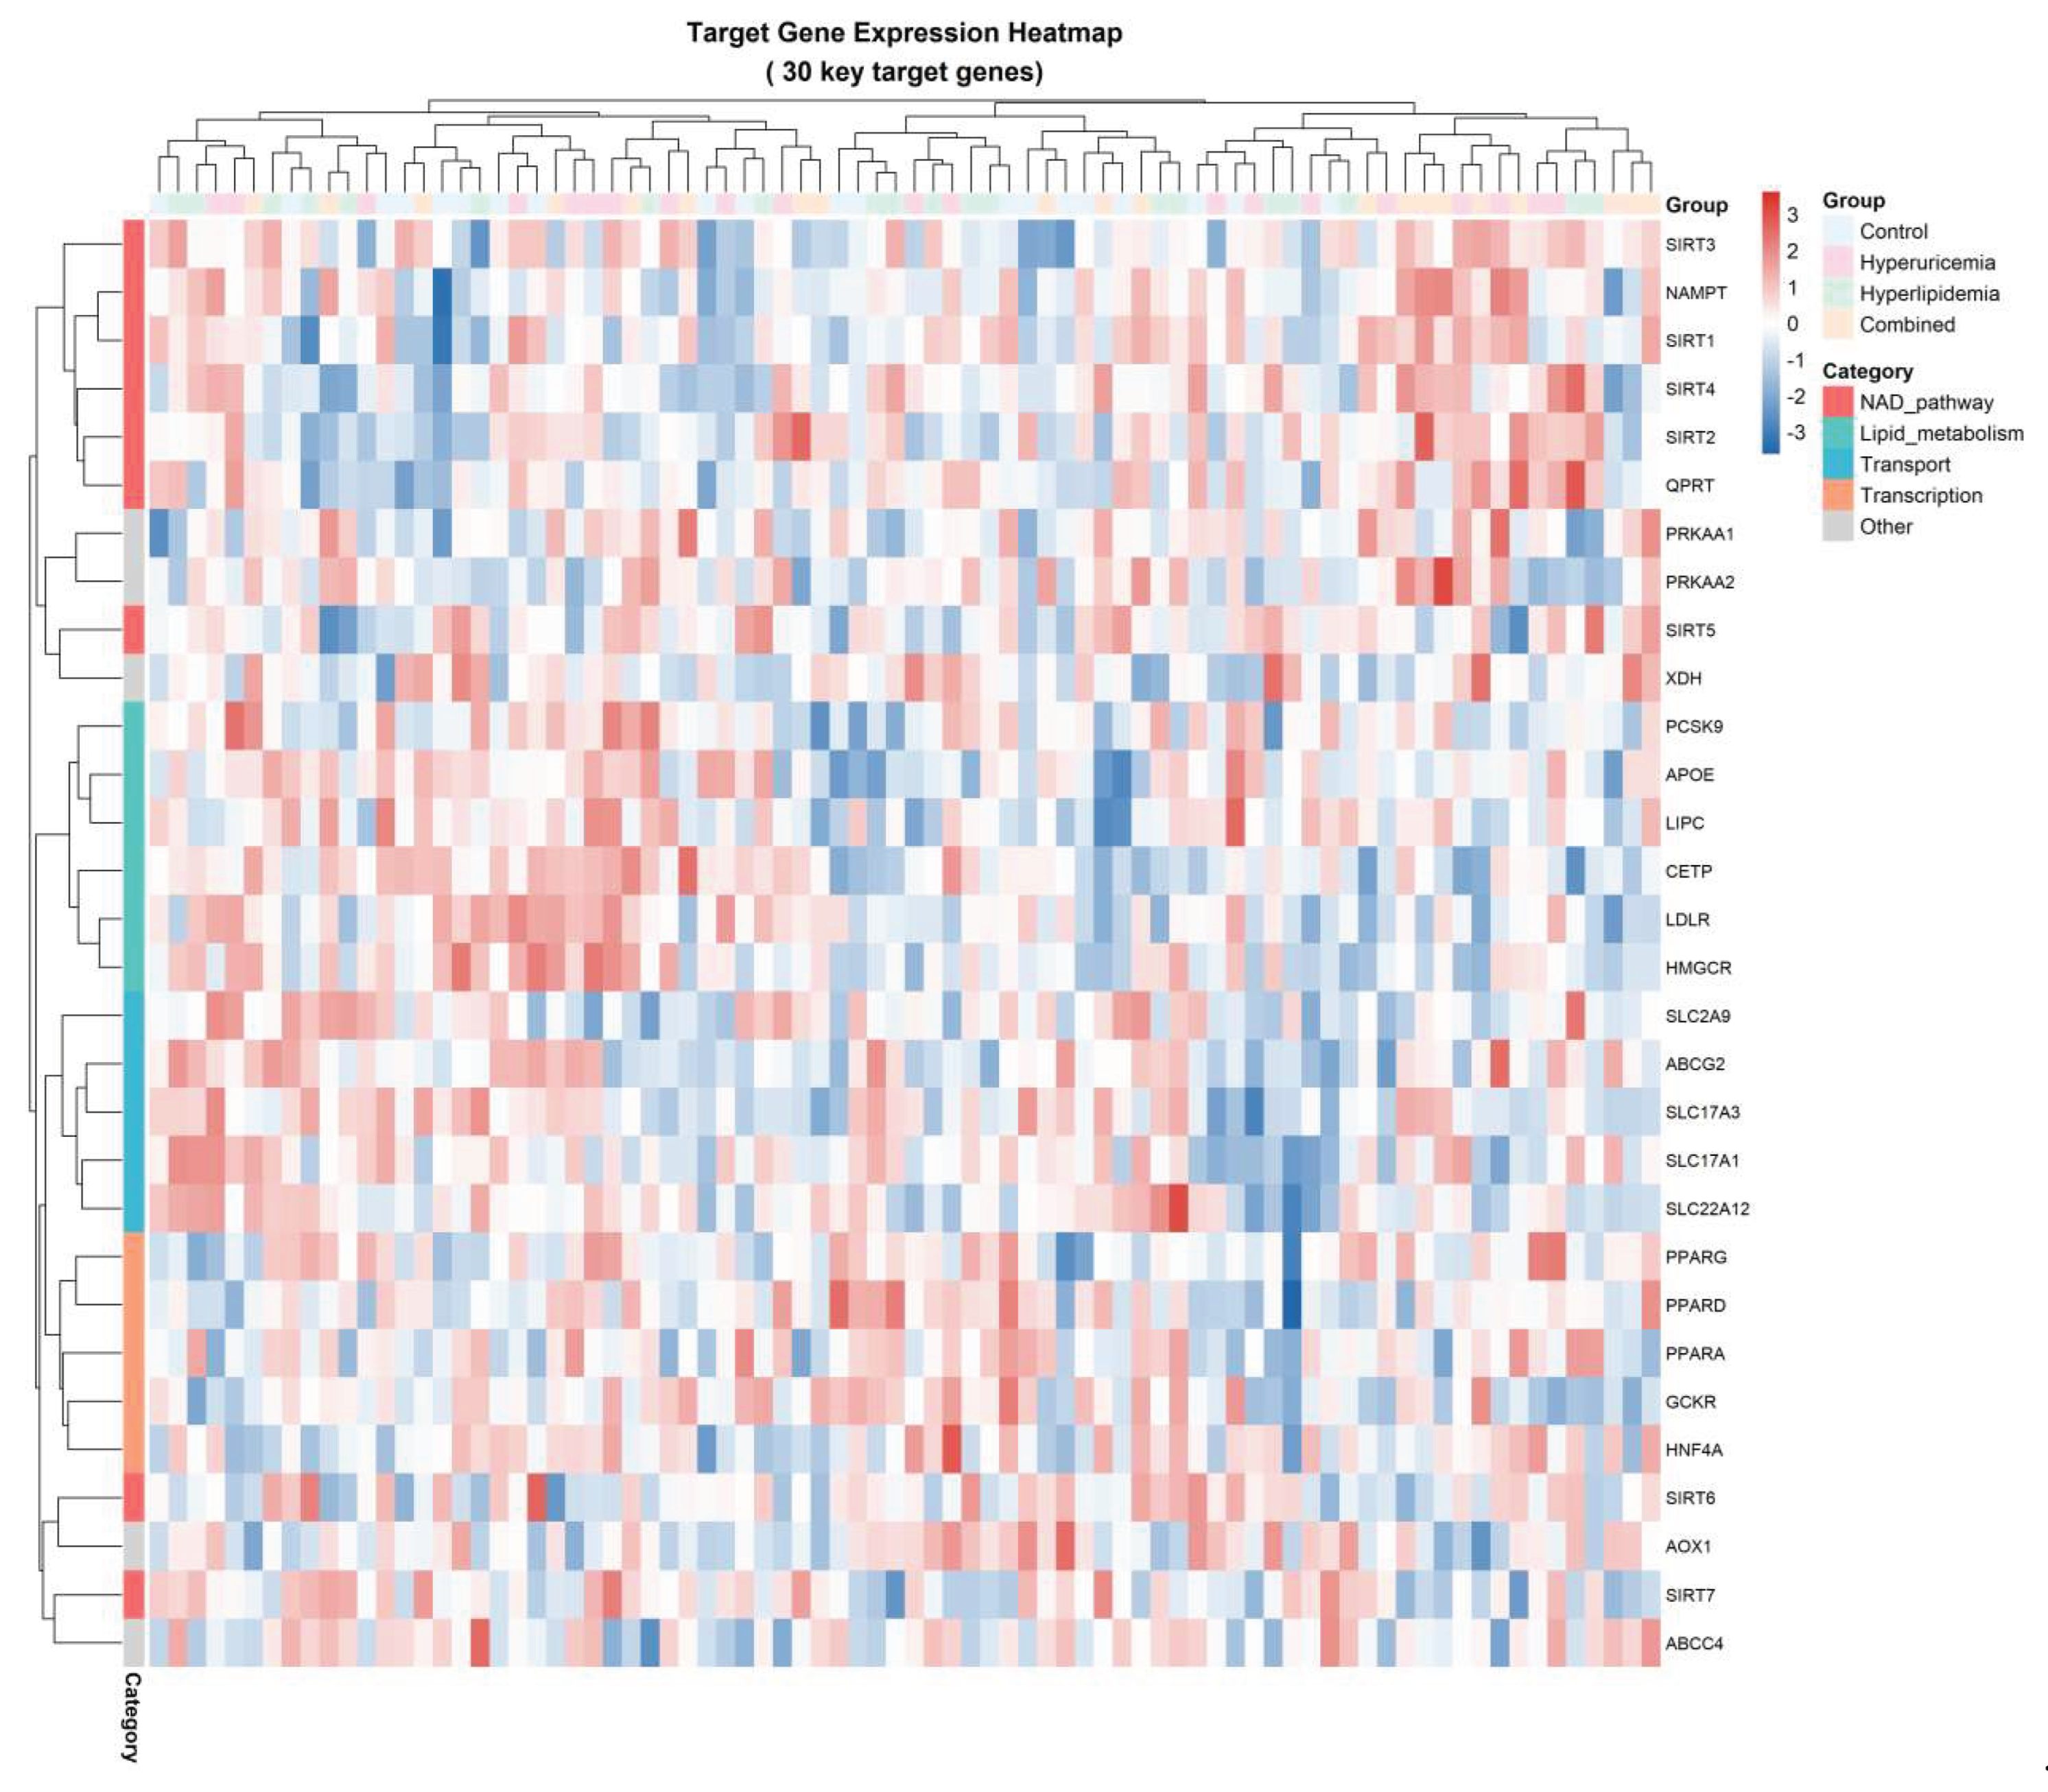
Figure 8.
KEGG pathway enrichment analysis.
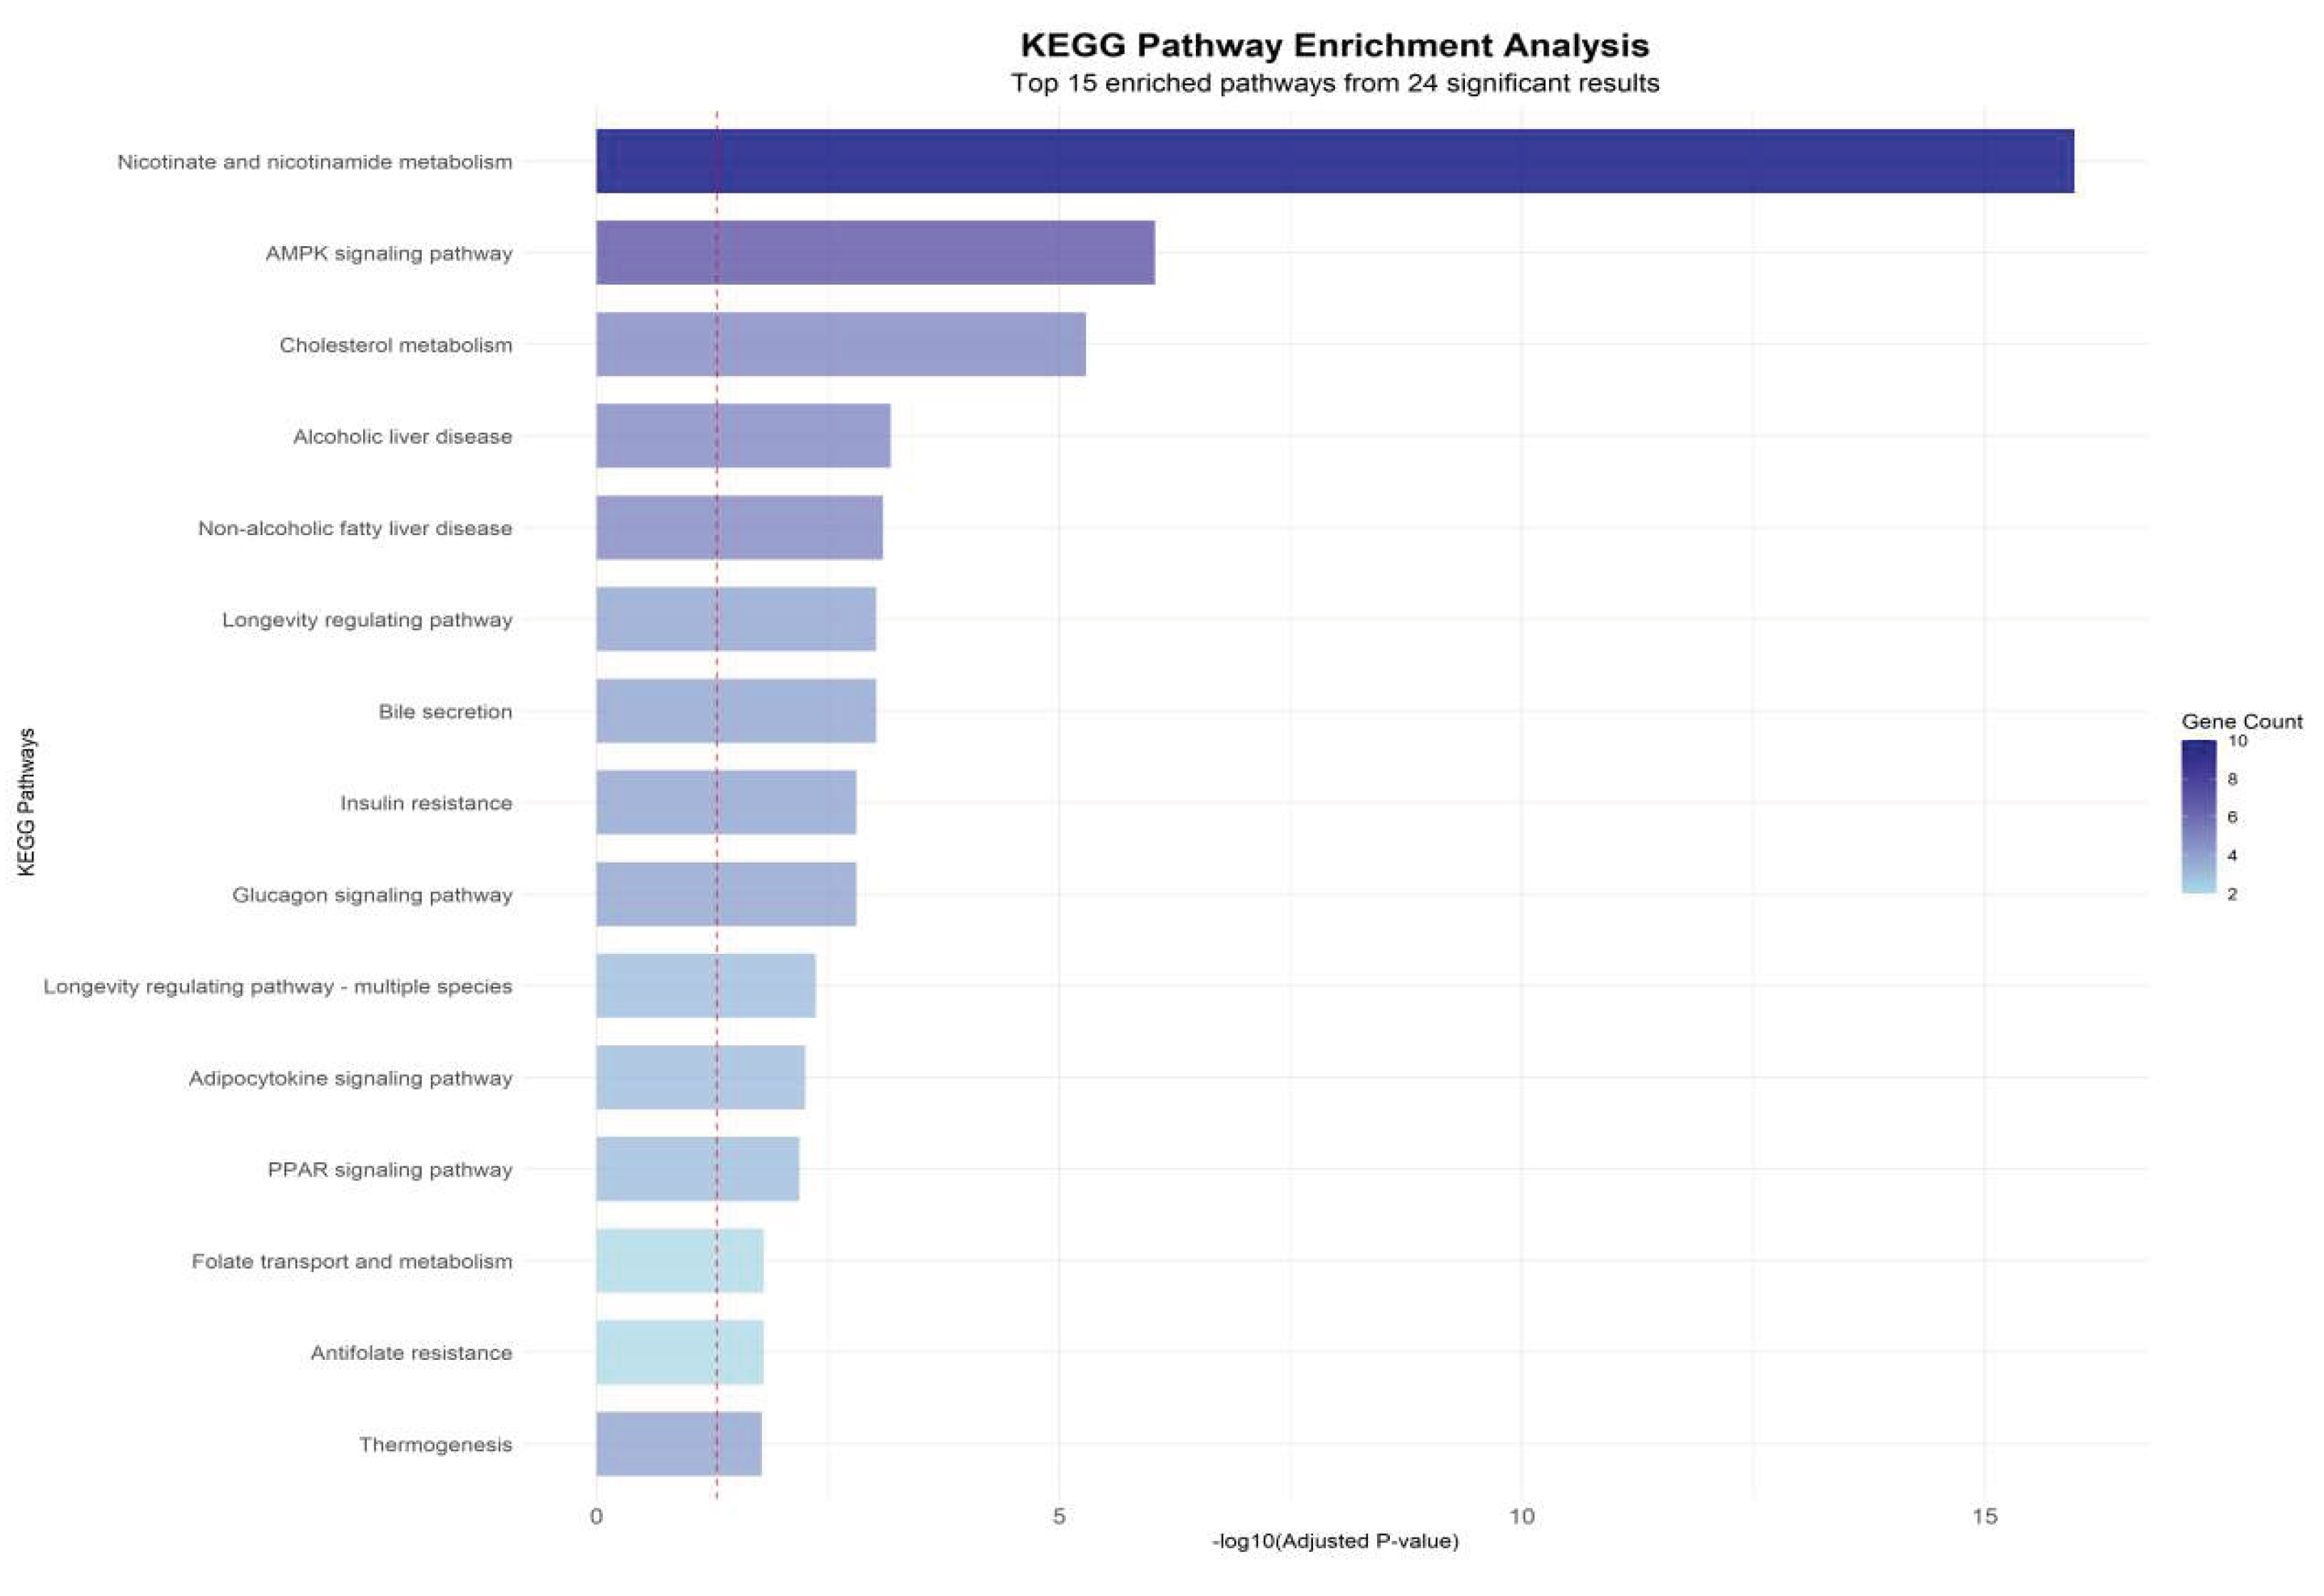
Figure 9.
Serum uric acid levels in quail at 7d,14d,21d,28d and 35d.
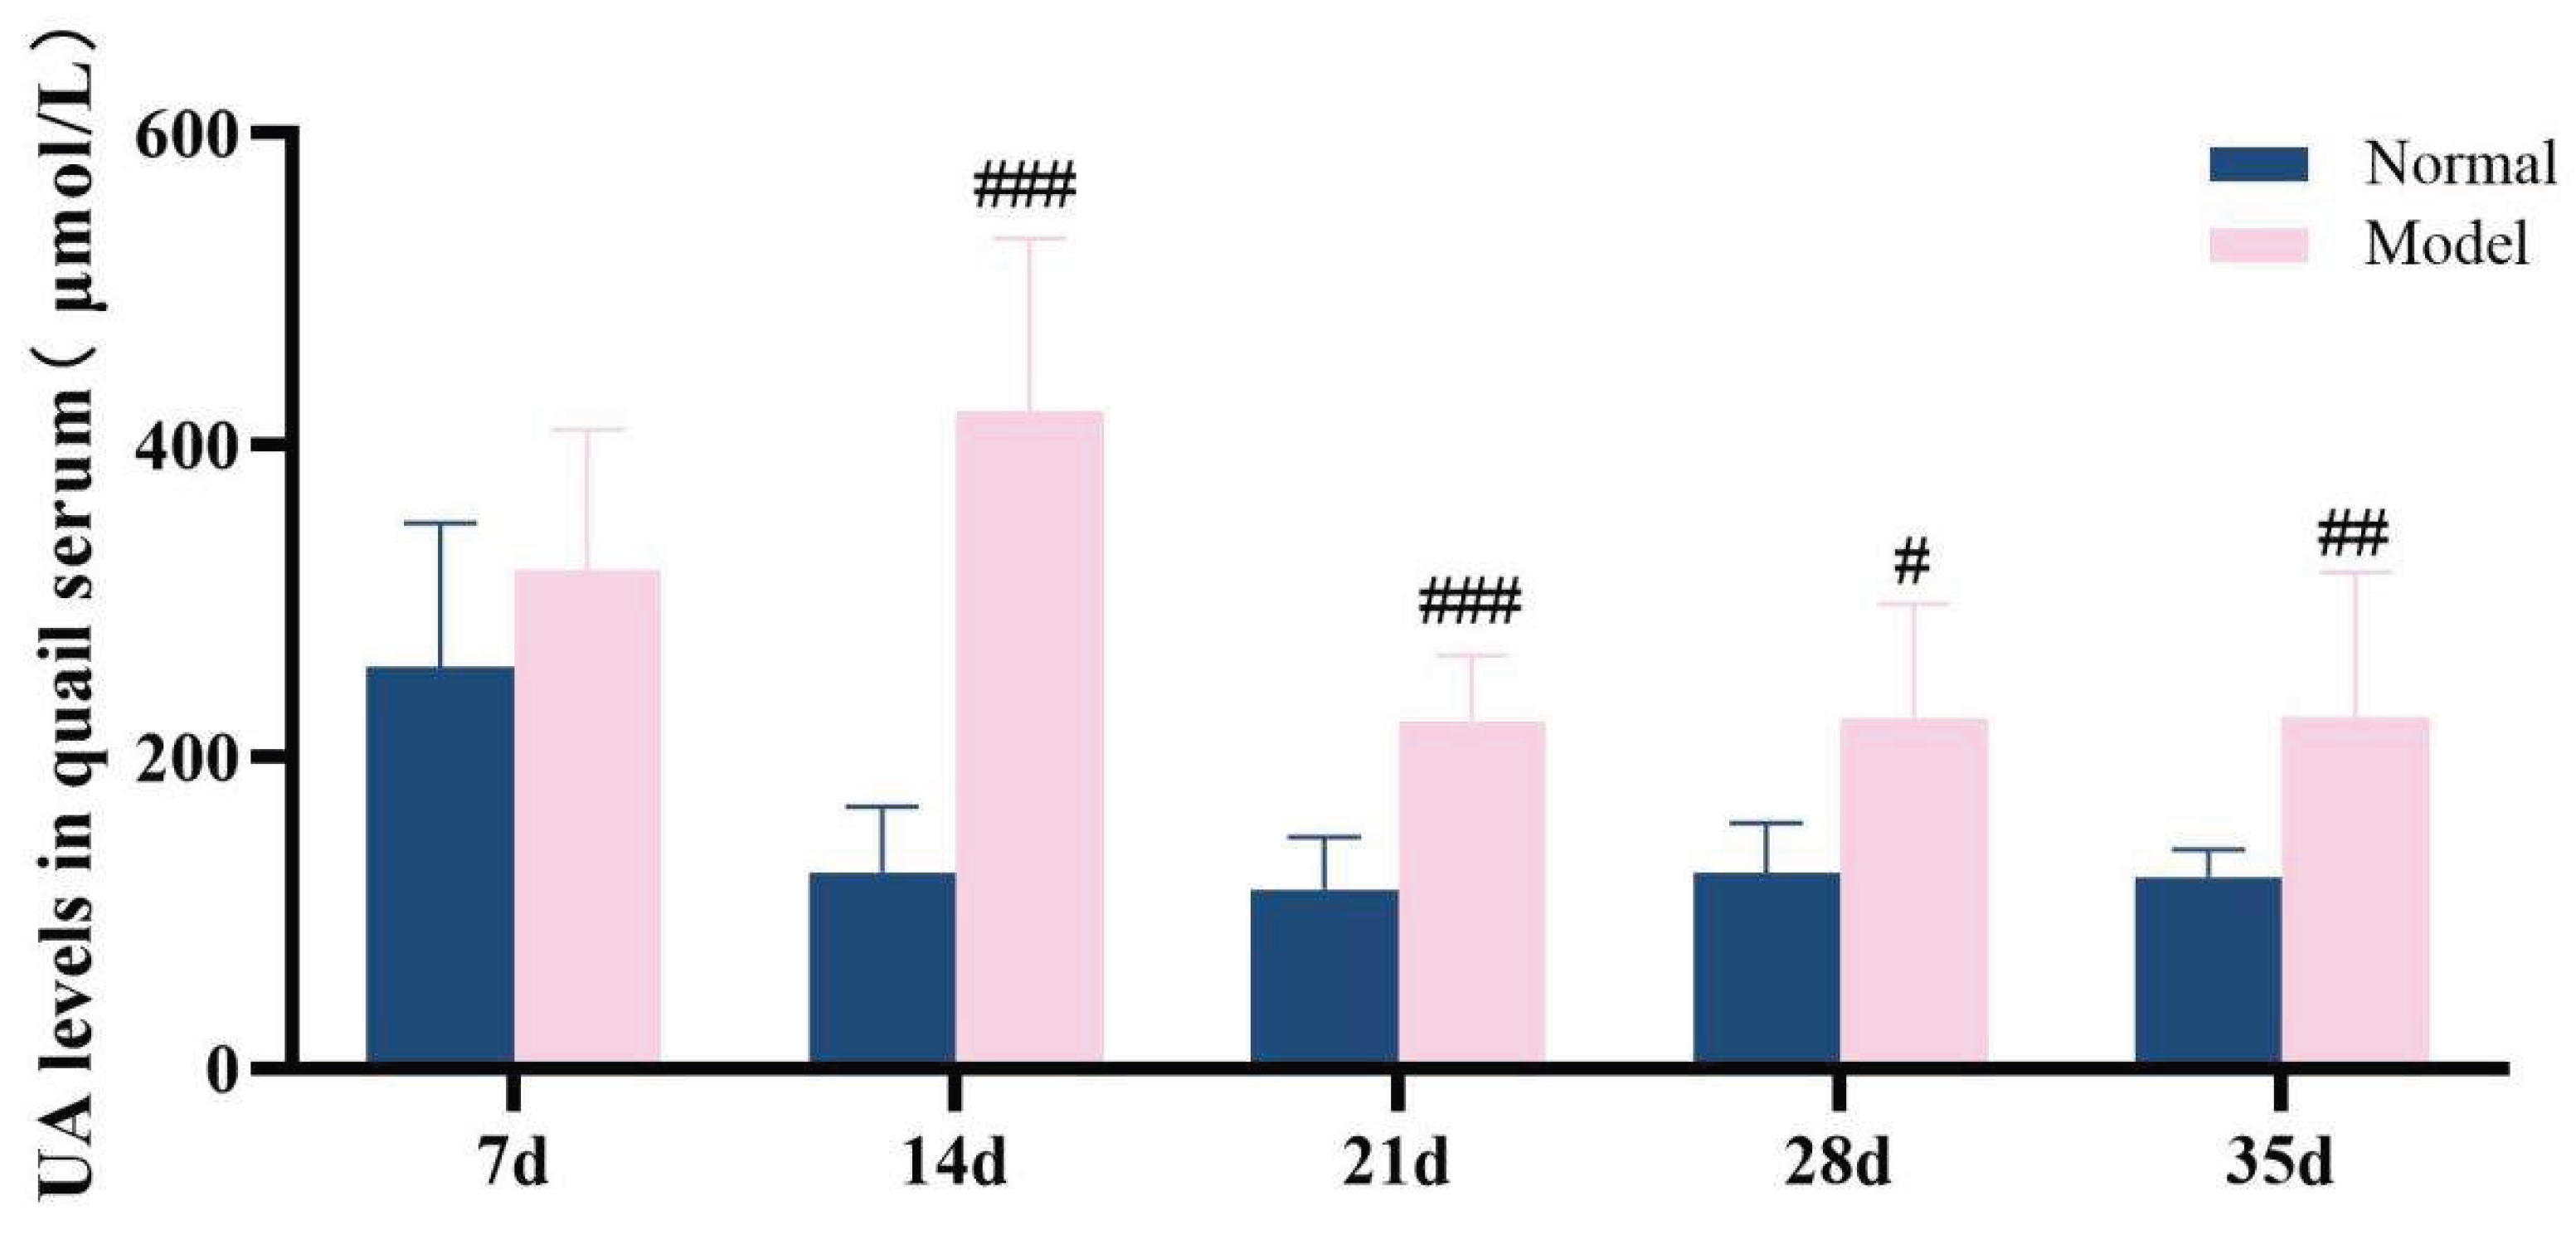
Figure 10.
UA levels in quail feces during experiments 7d,14d,21d,28d and 35d.
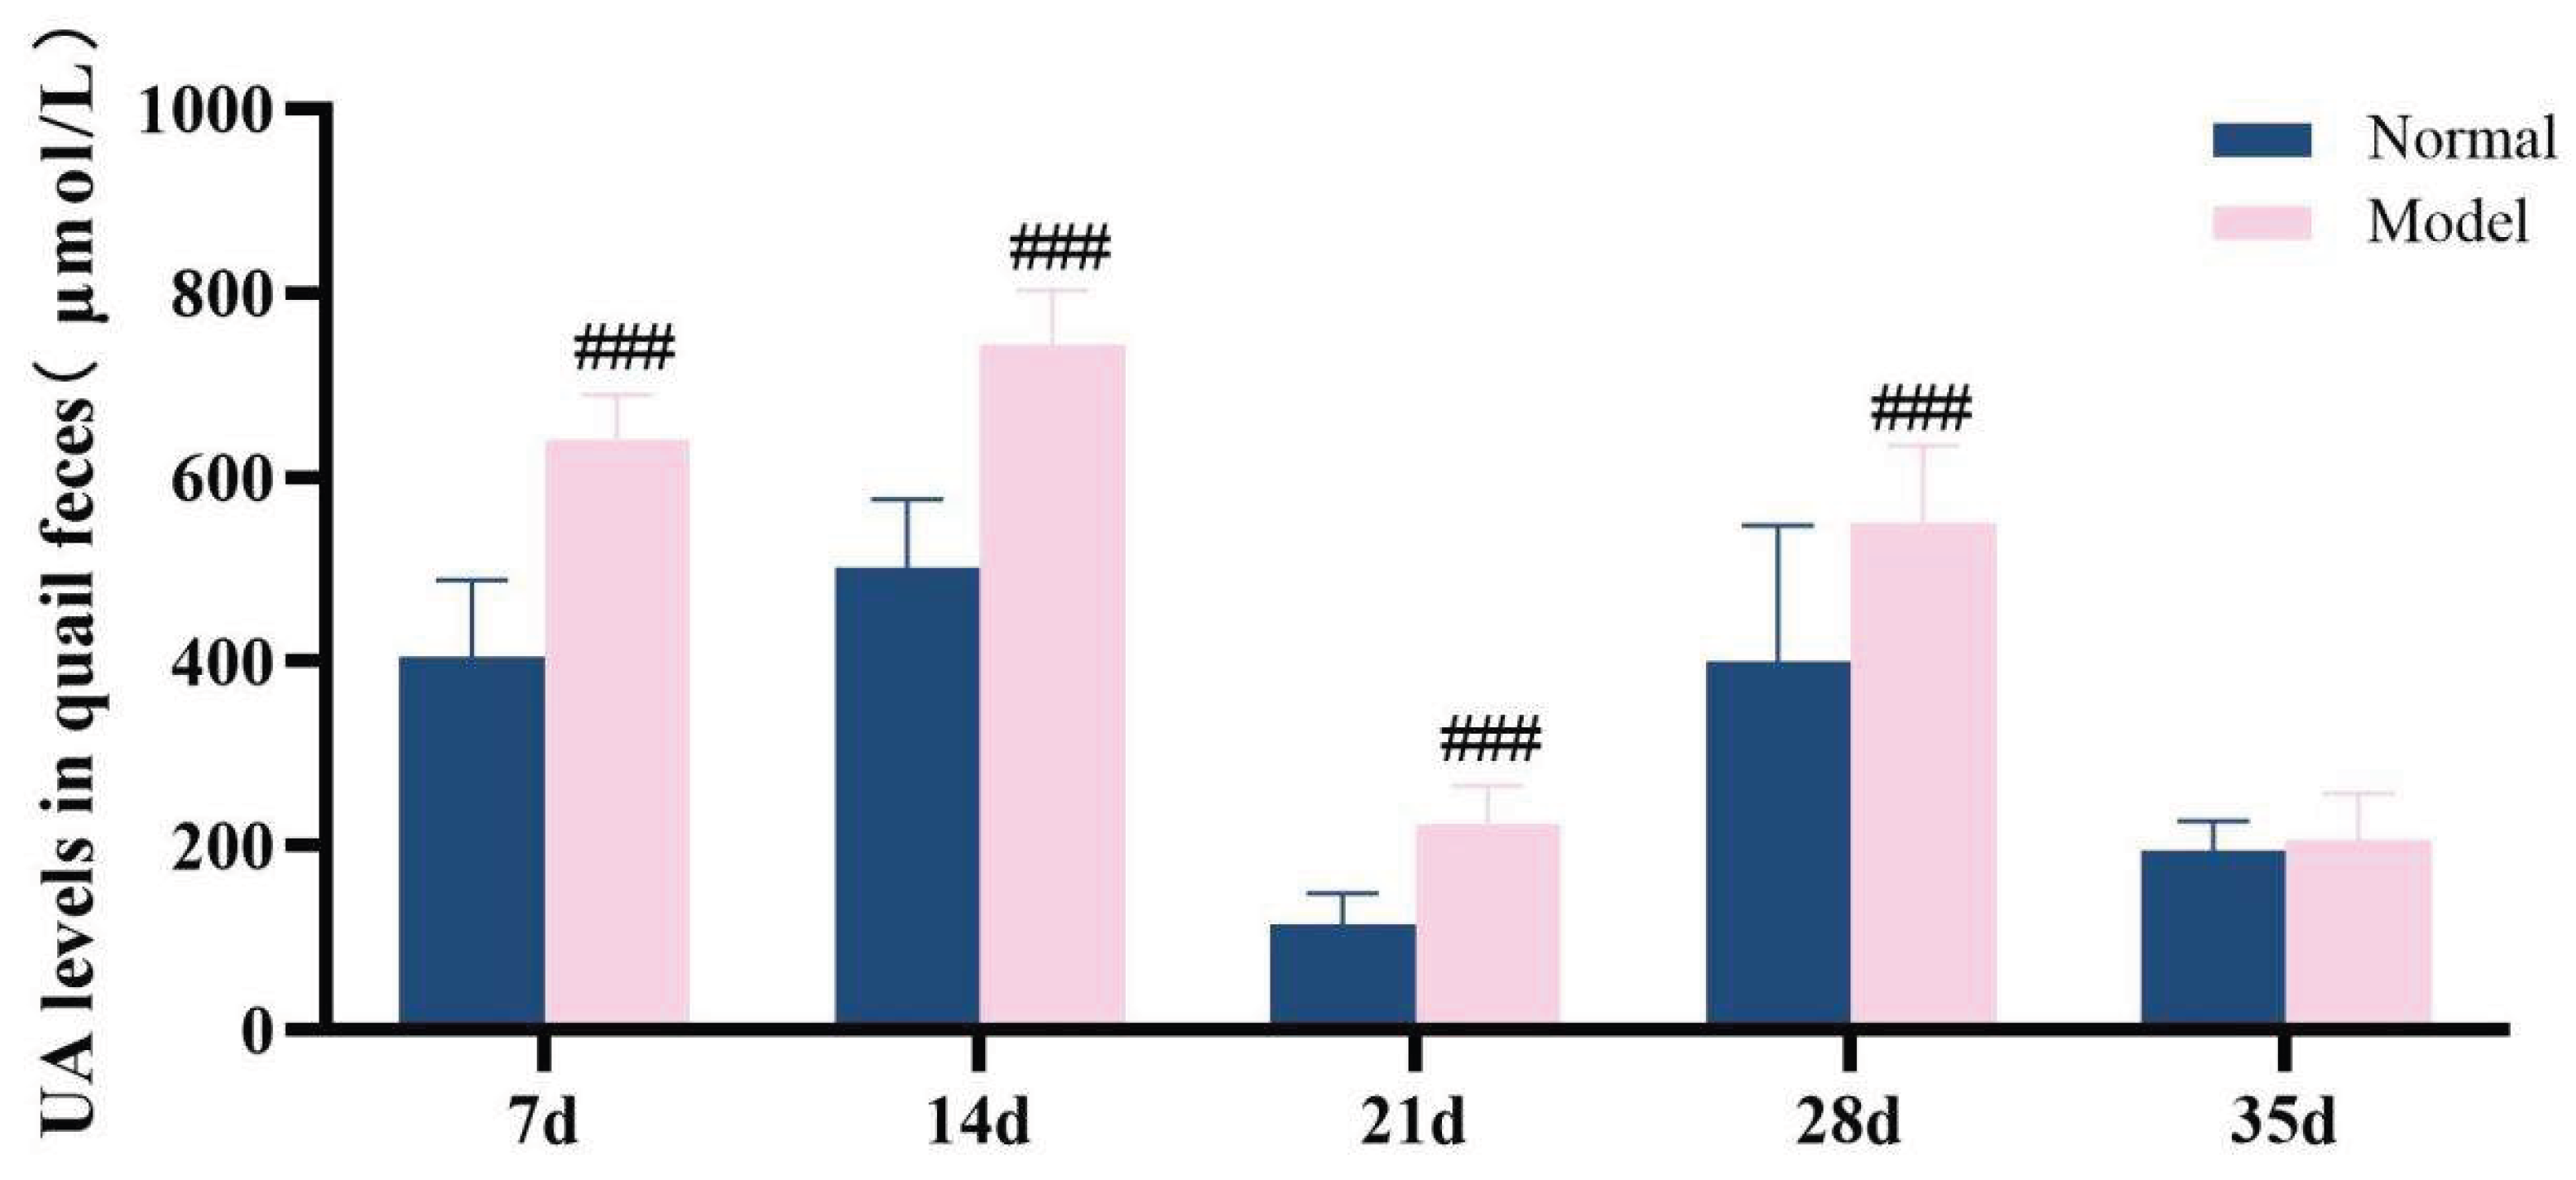
Figure 15.
XOD activity of quail serum in experiments 21d,28d and 35d.
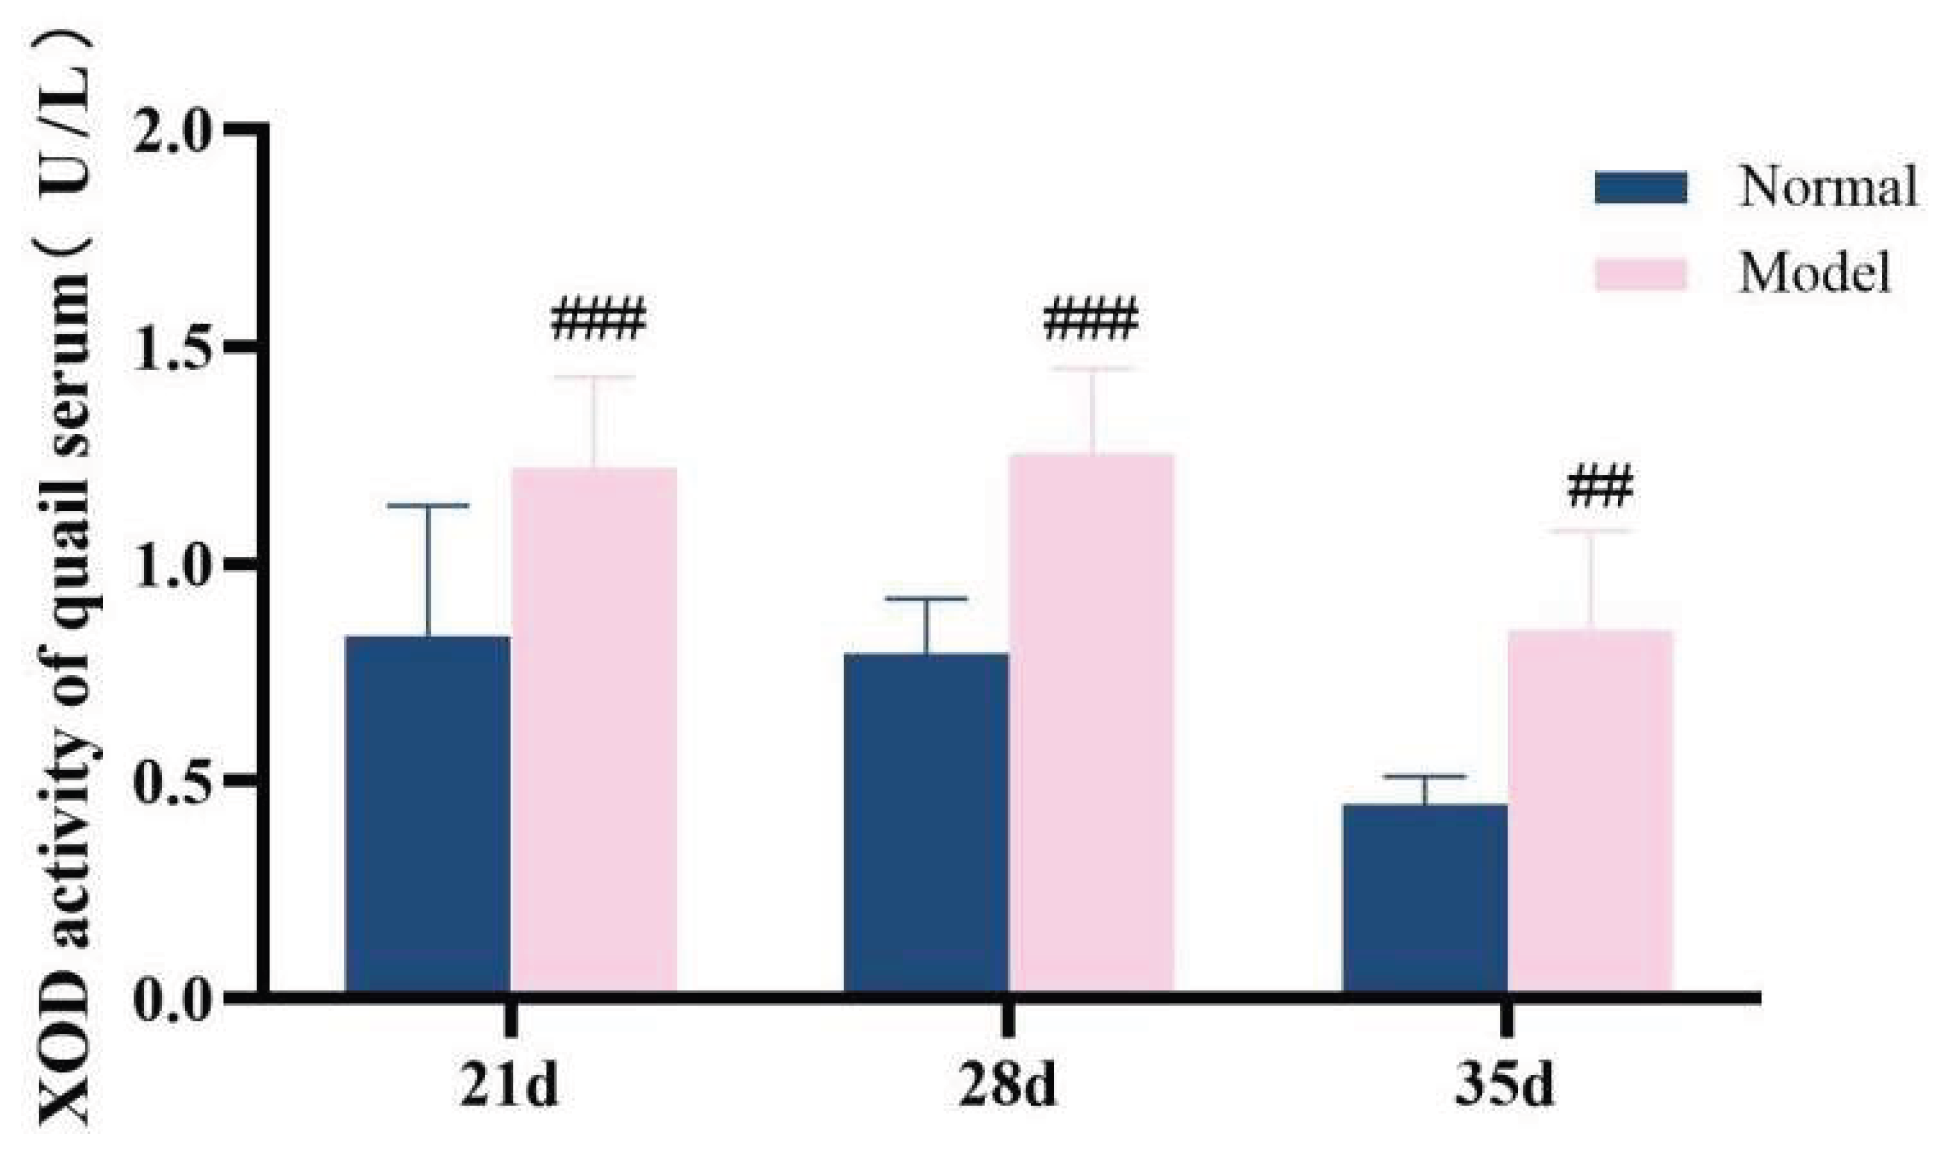
Figure 16.
XOD activity of quail liver.
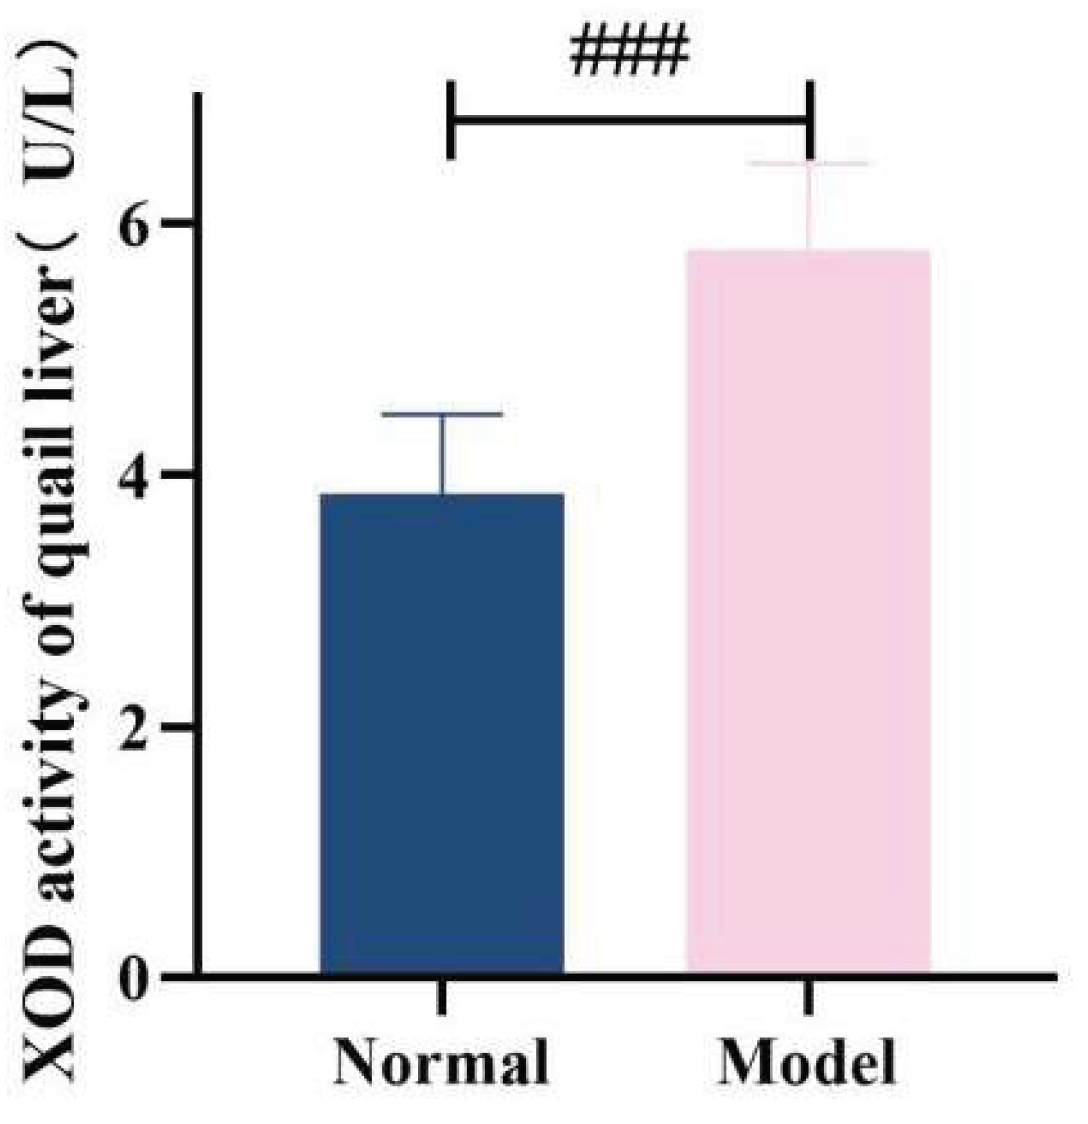
Figure 17.
Serum ADA activity of quail in experiments 21d,28d and 35d.
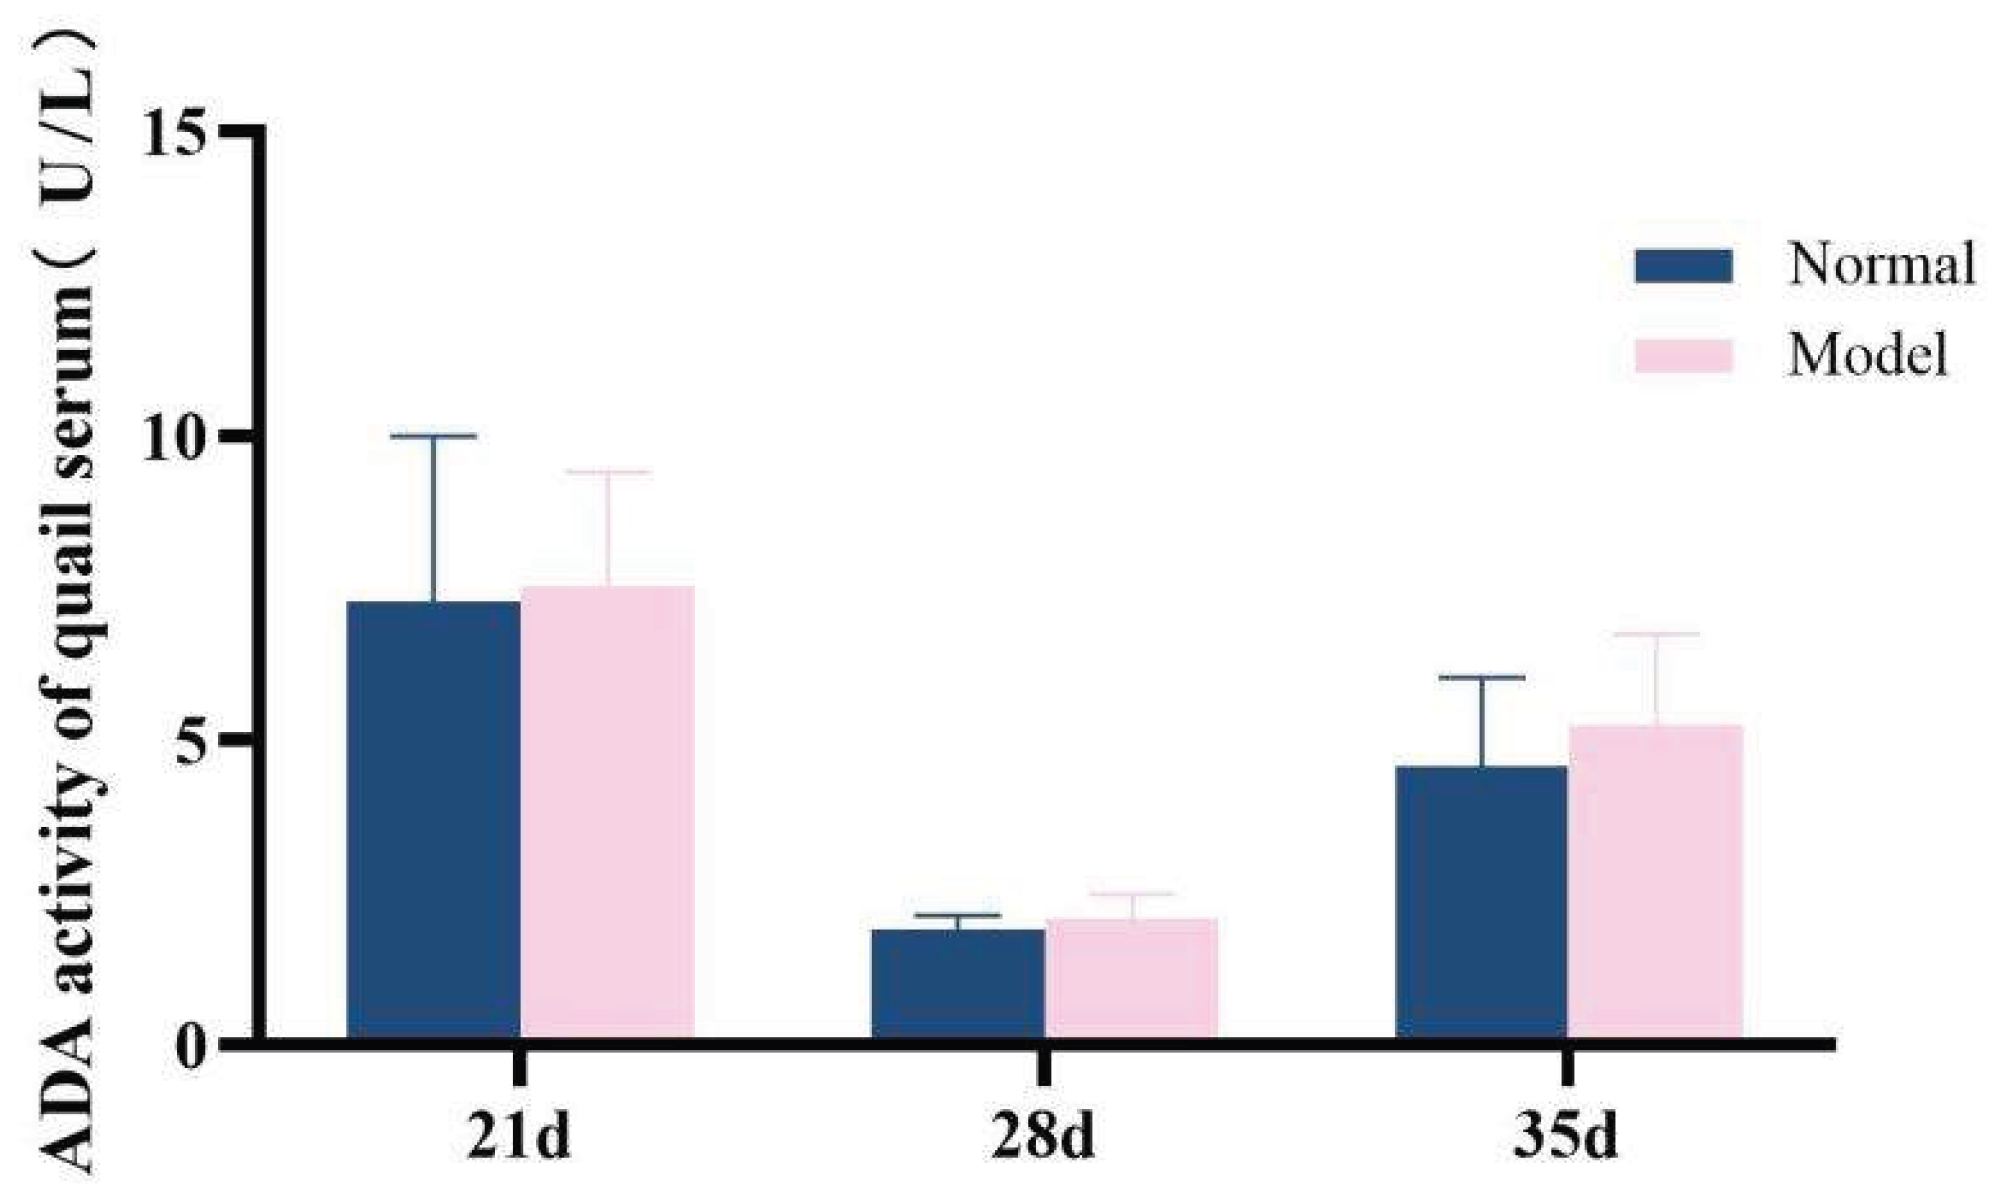
Figure 18.
ADA activity of quail liver.
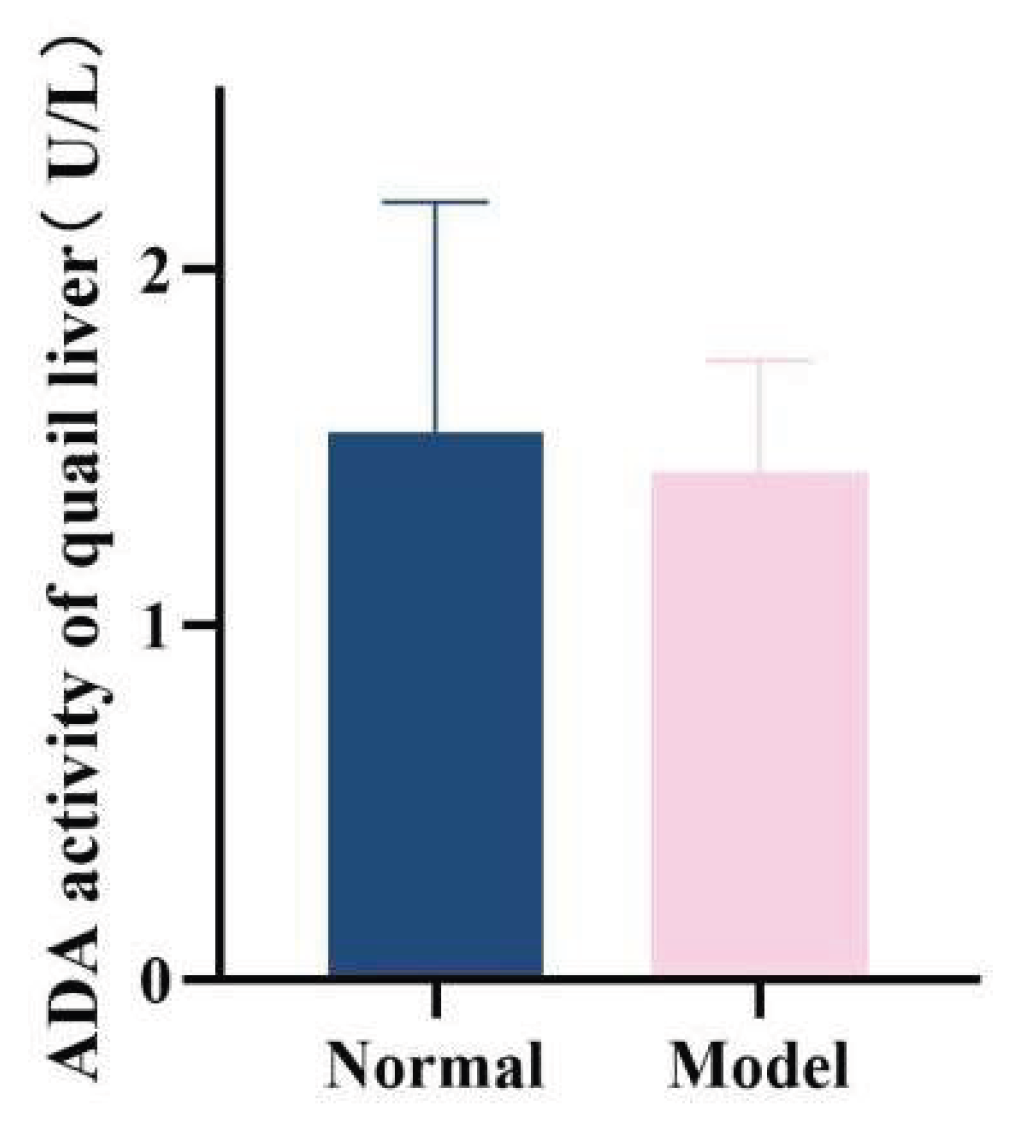
Figure 19.
ACC, TL and HL activity in quail liver.
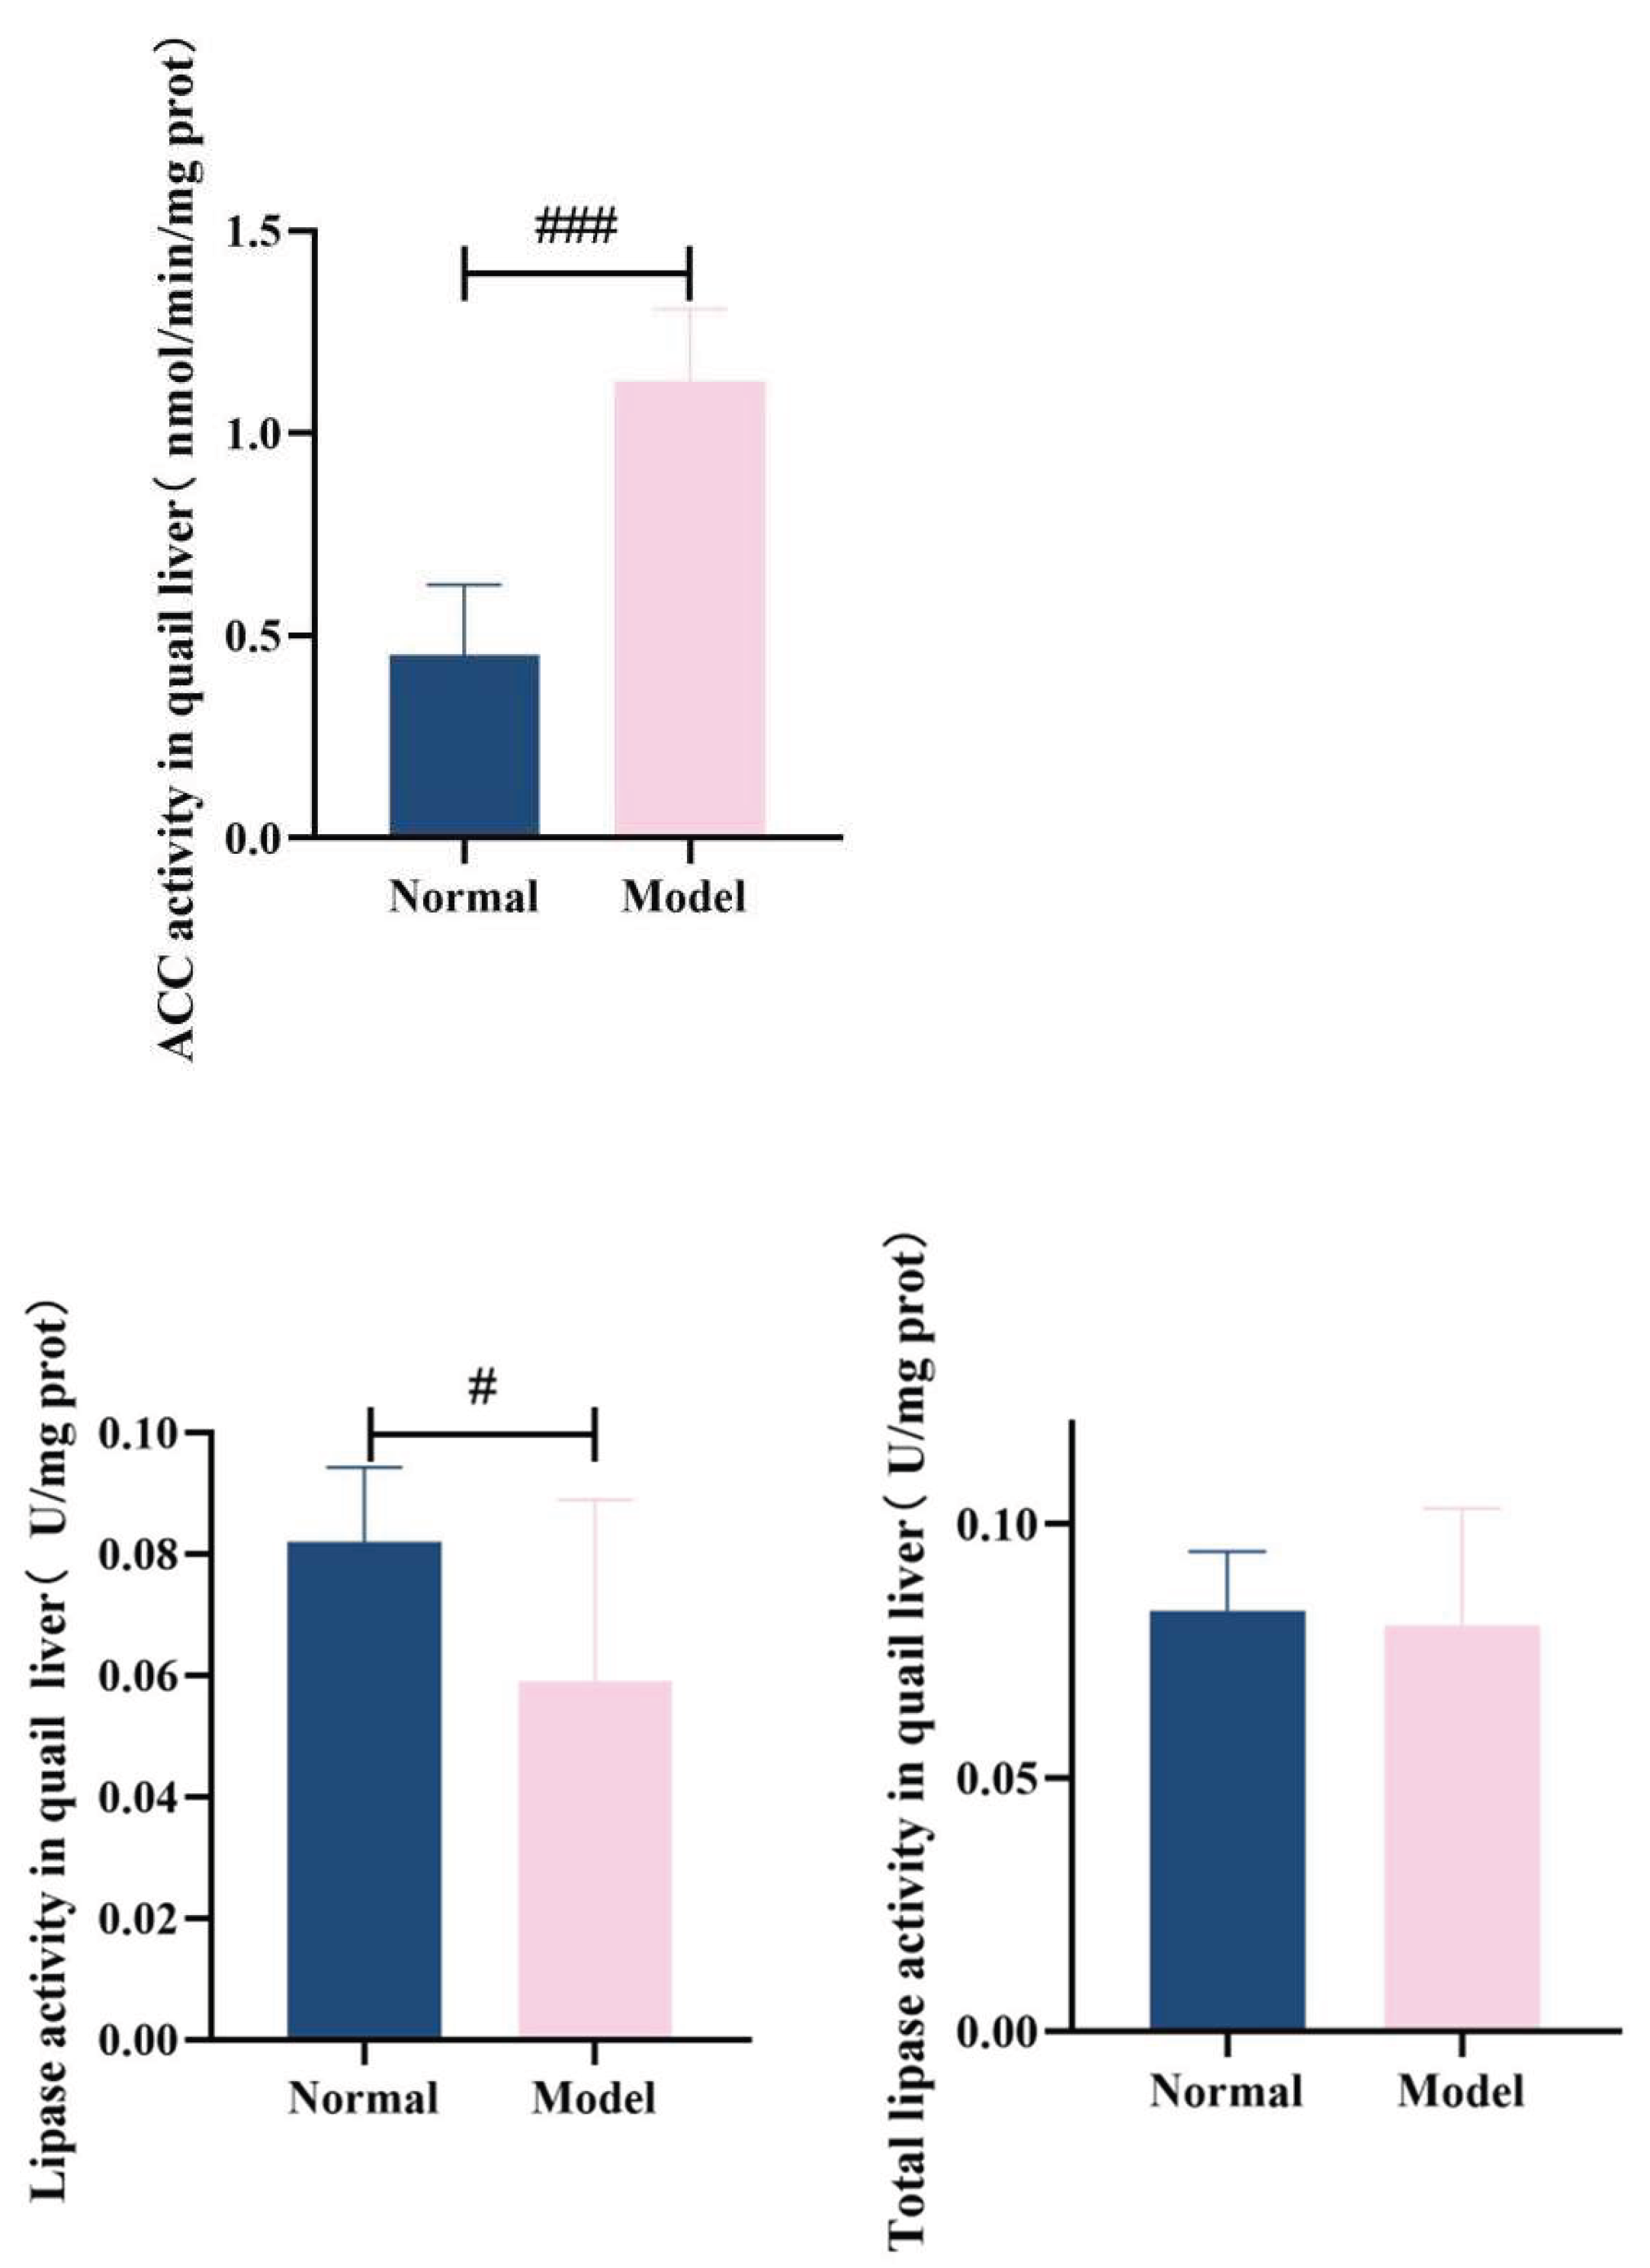
Figure 20.
Serum NAMPT and SIRT1 levels of quail.
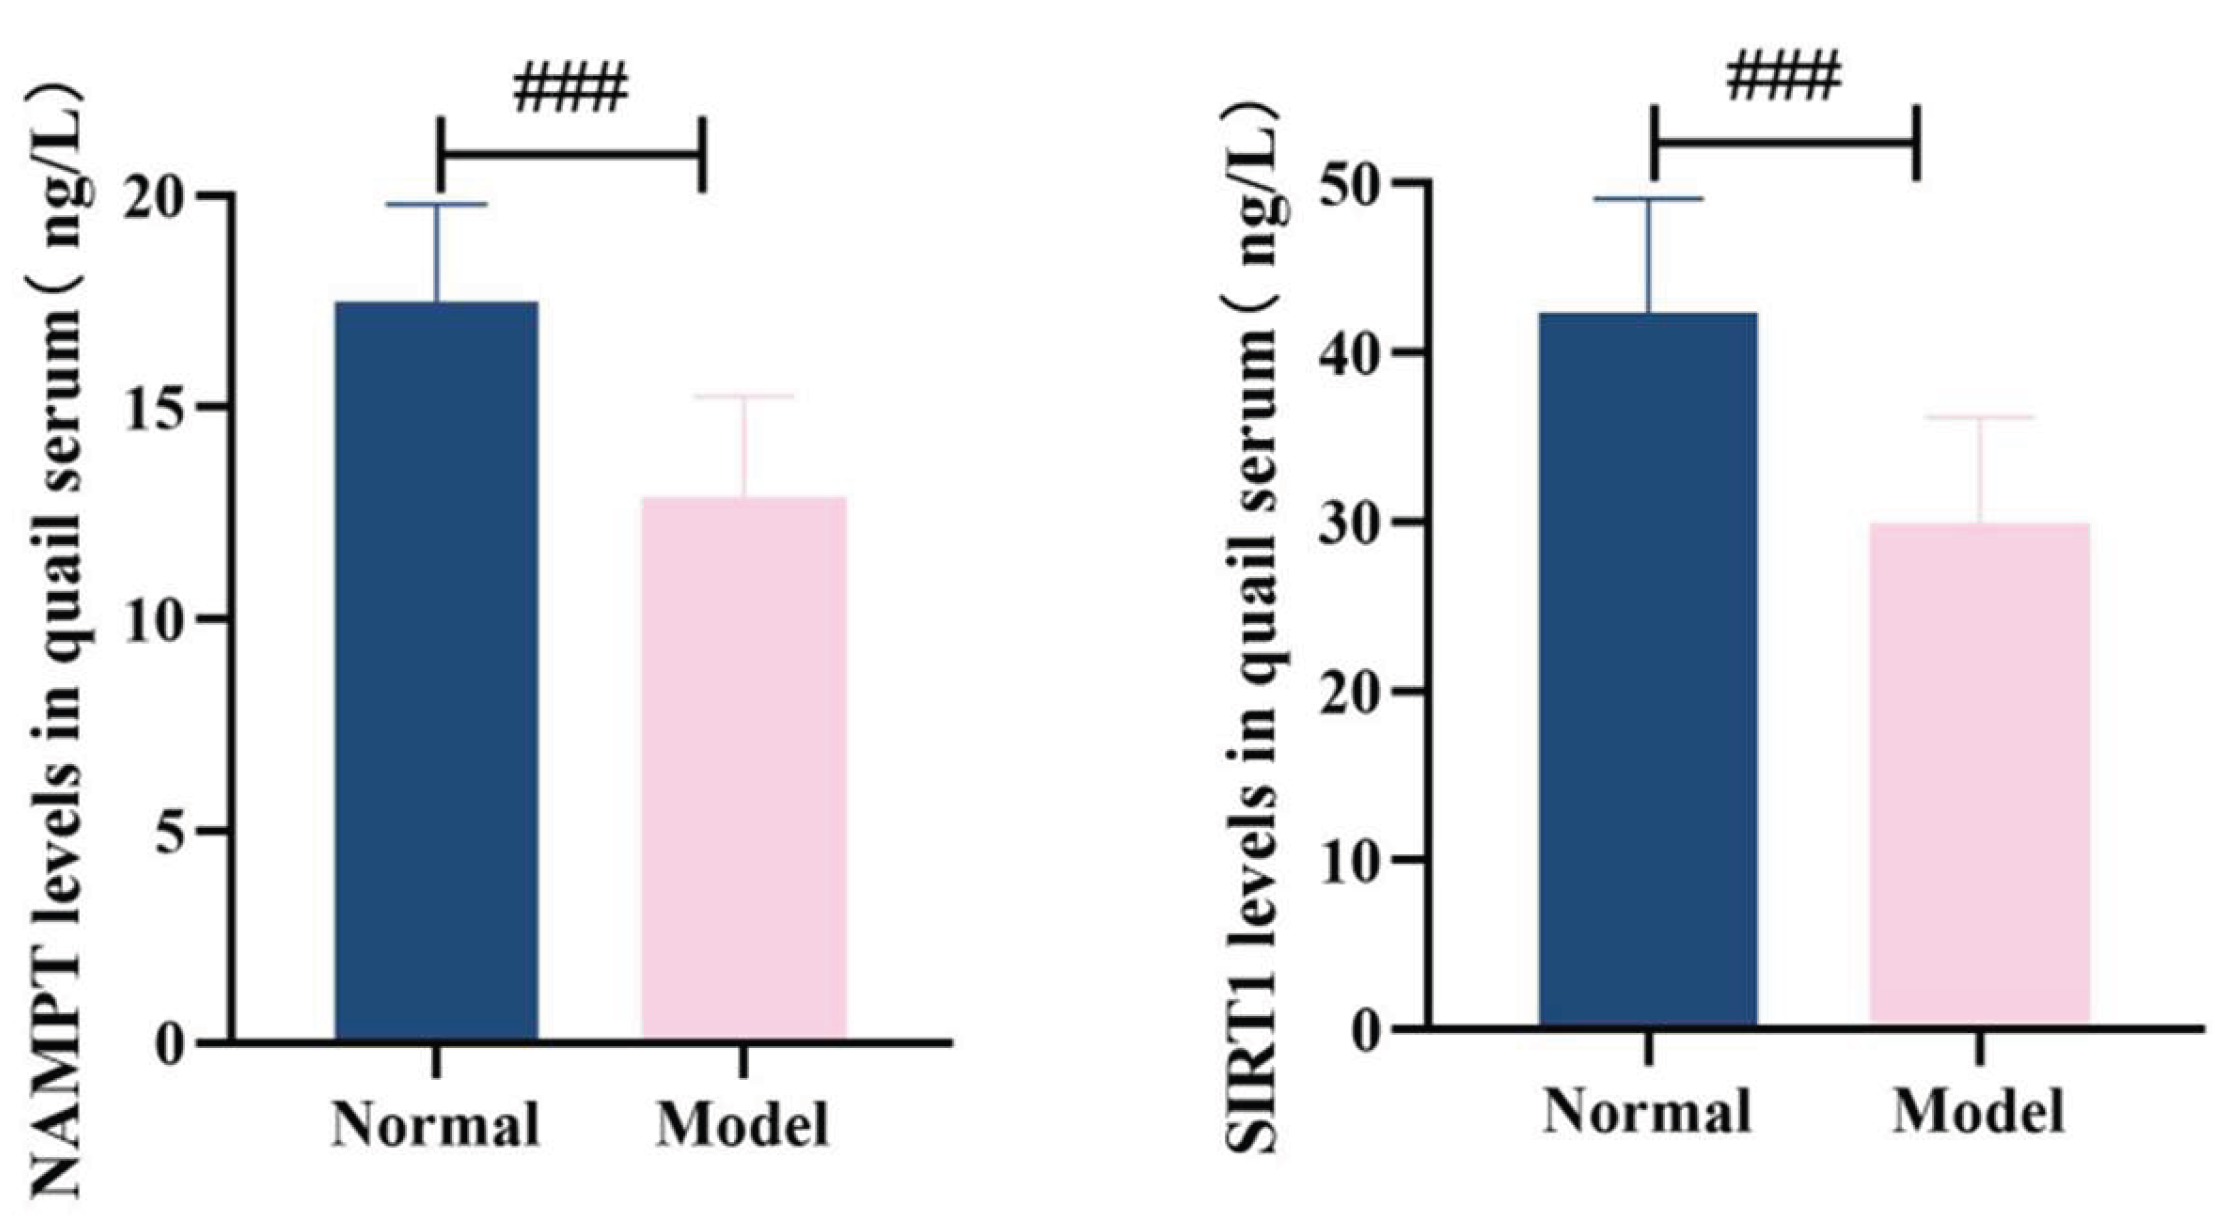
Figure 21.
NAMPT levels in quail liver, kidney and adipose tissue.
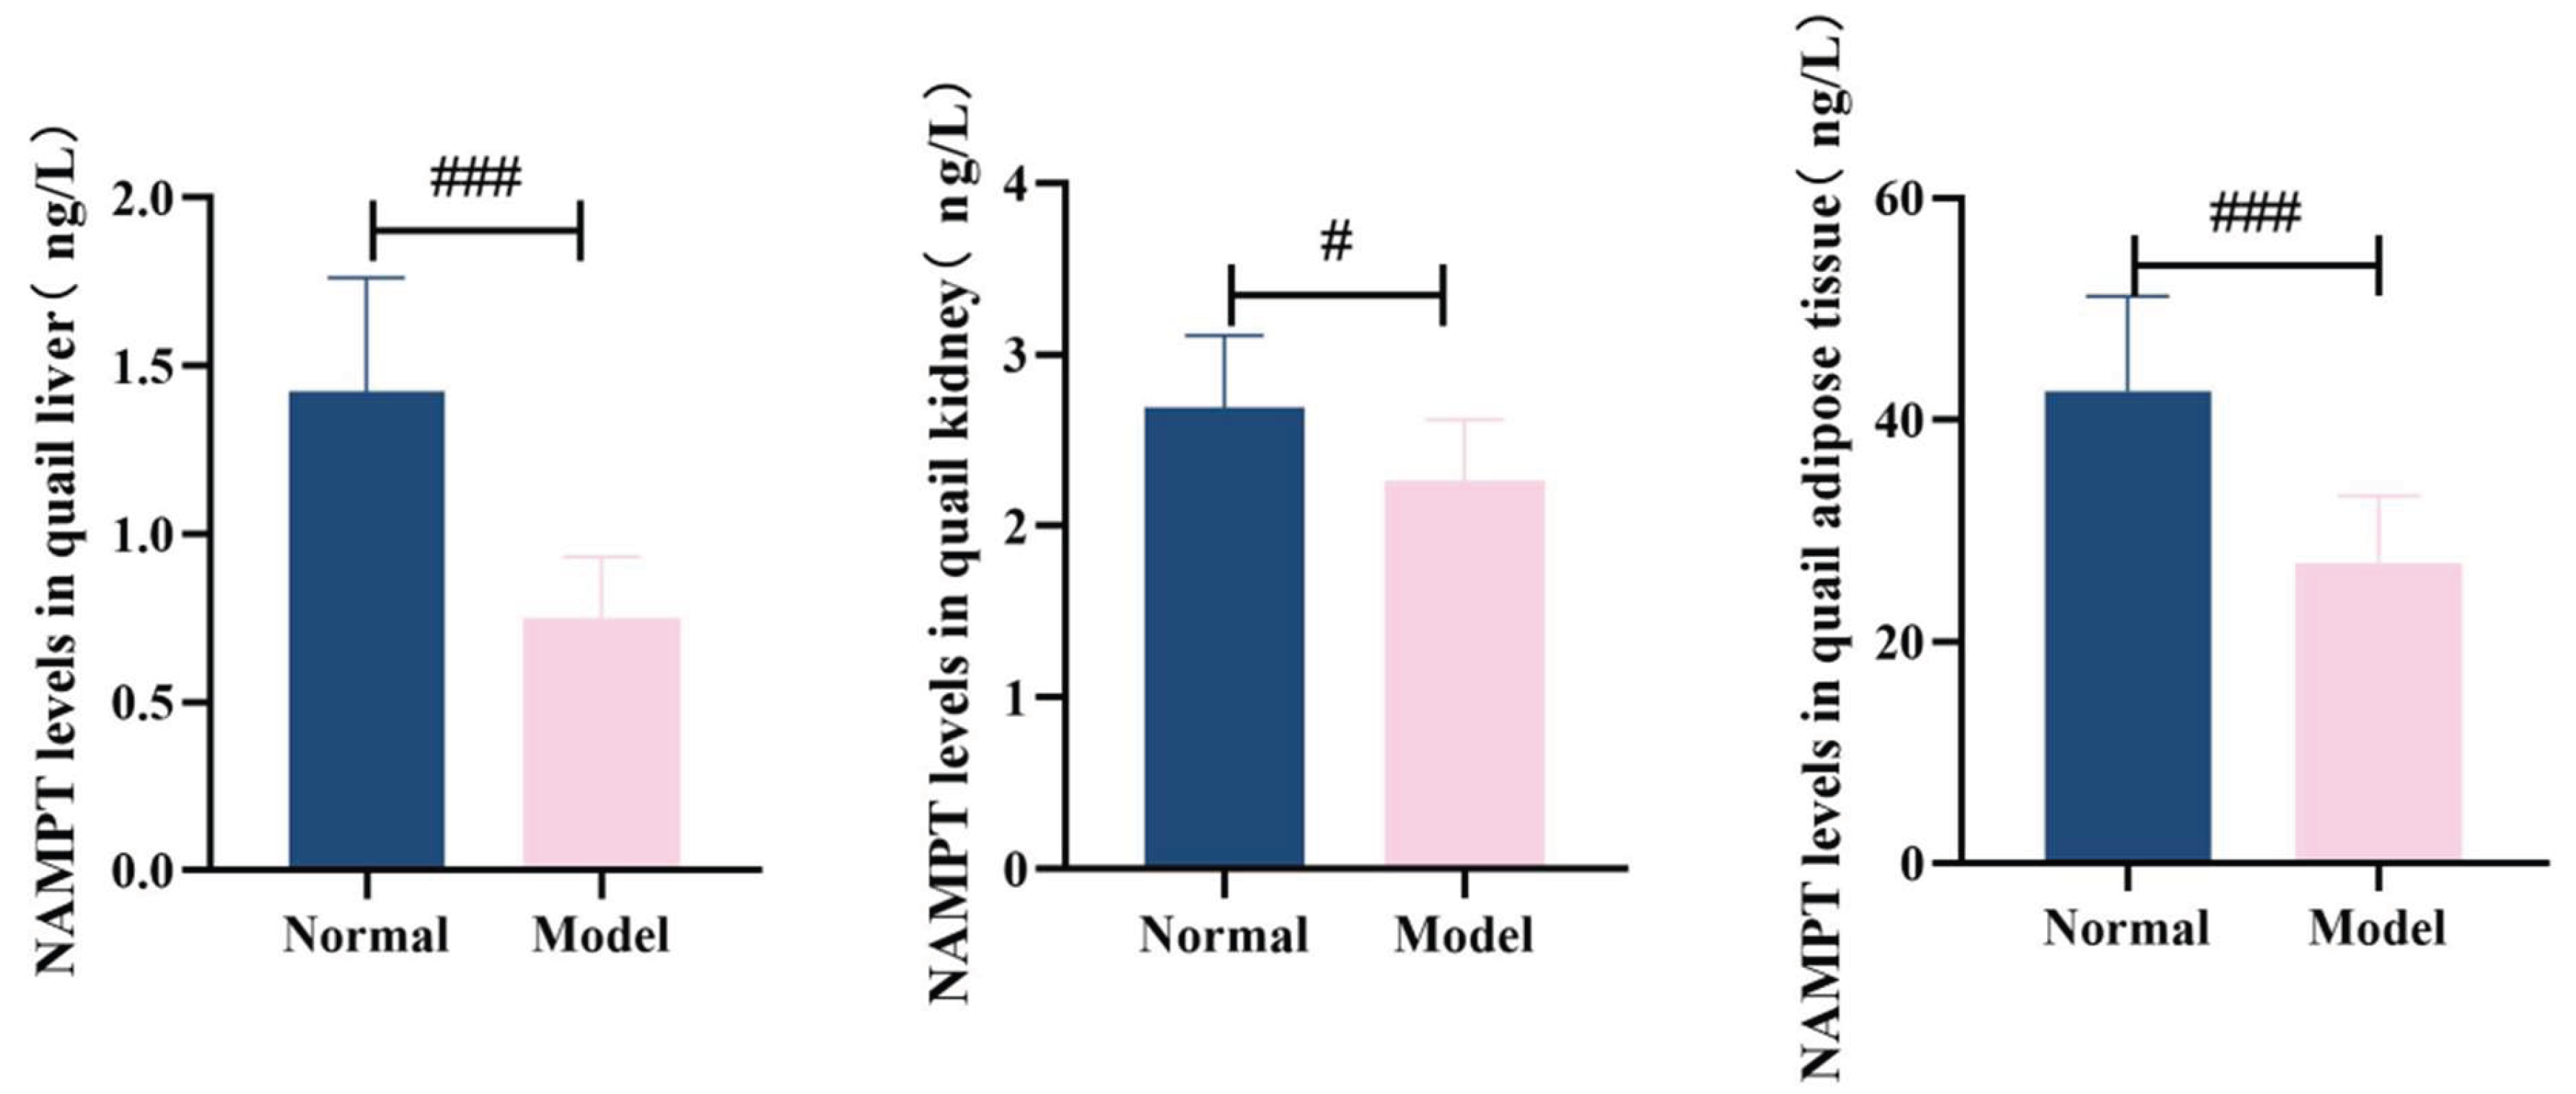
Figure 22.
SIRT1 levels in quail liver, kidney and adipose tissue.
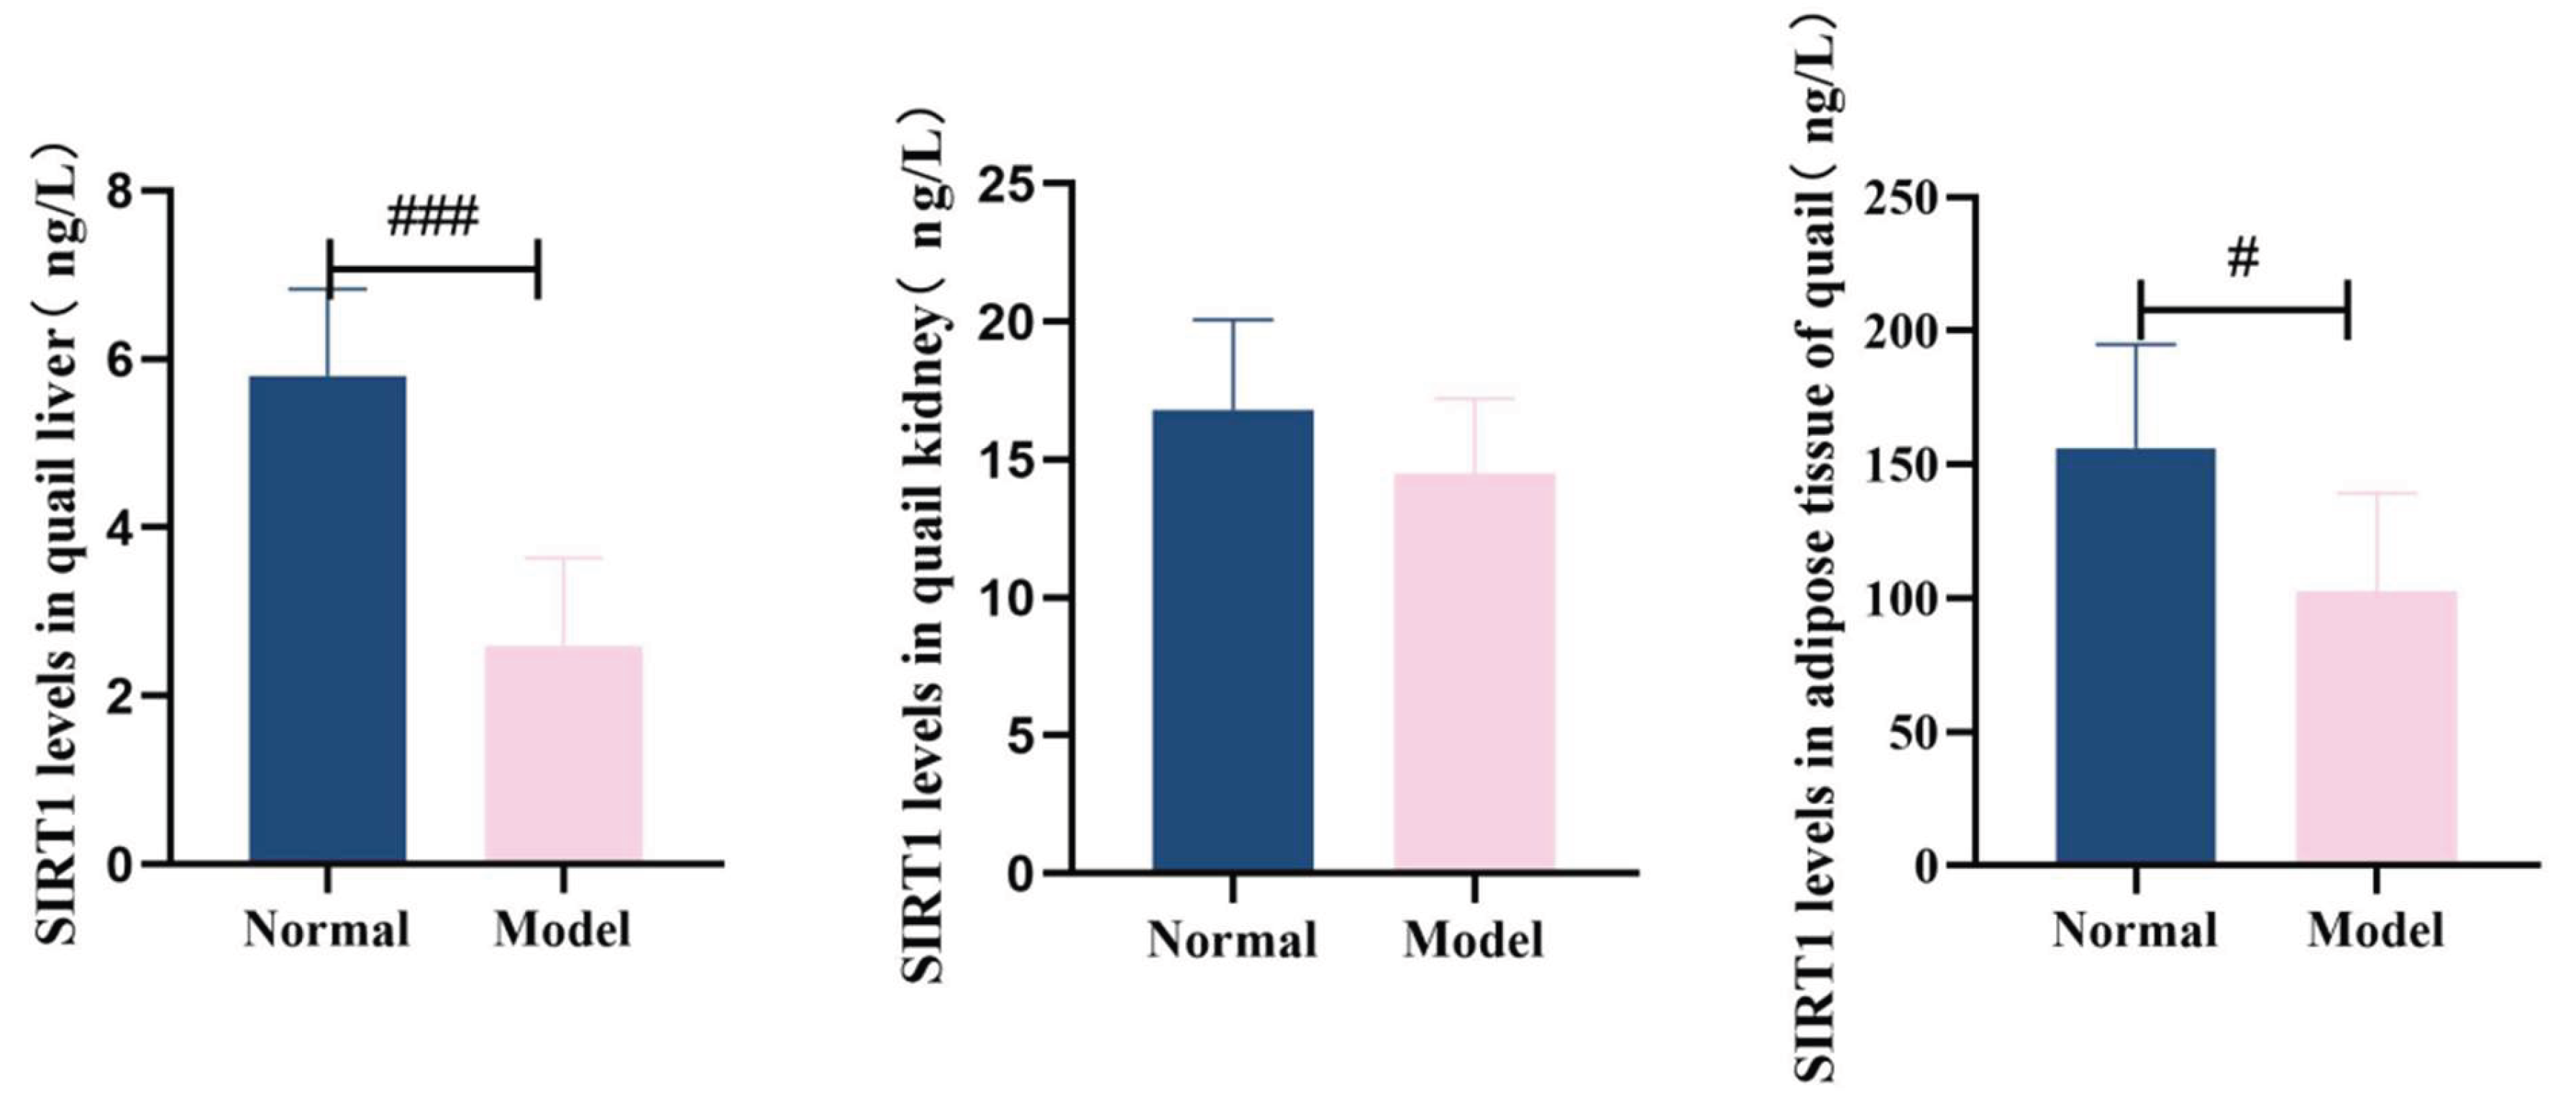
Figure 23.
NAMPT, SIRT1mRNA expression in quail liver.
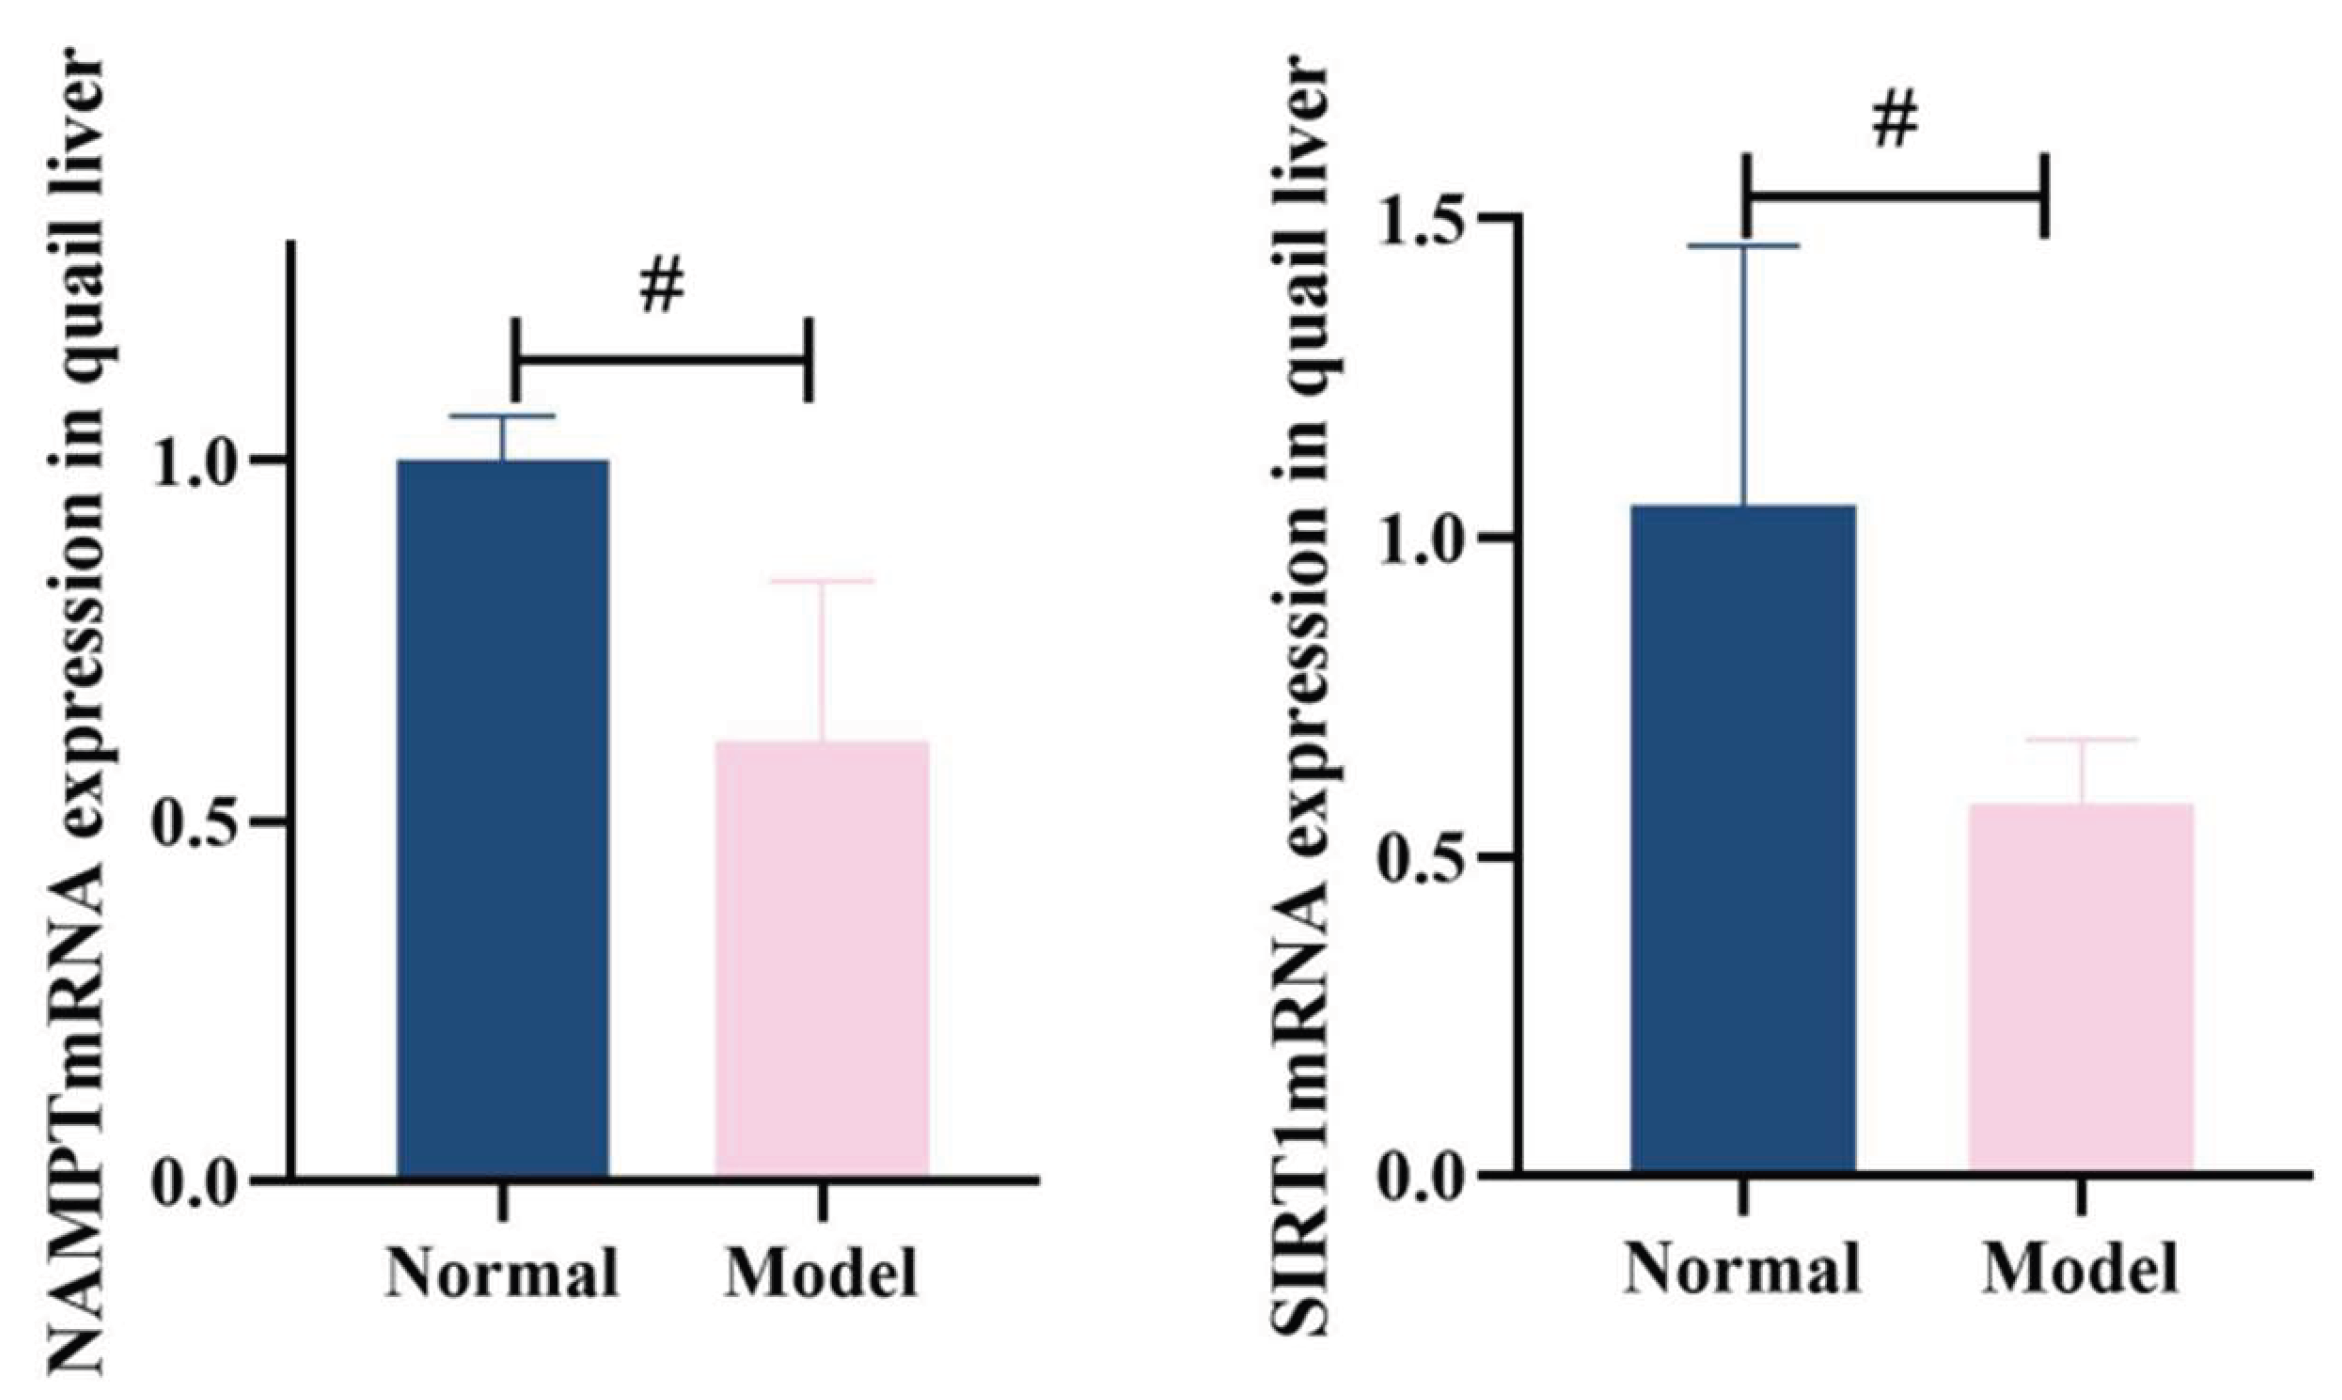
Figure 24.
NAMPT, SIRT1 mRNA expression in quail adipose tissue.
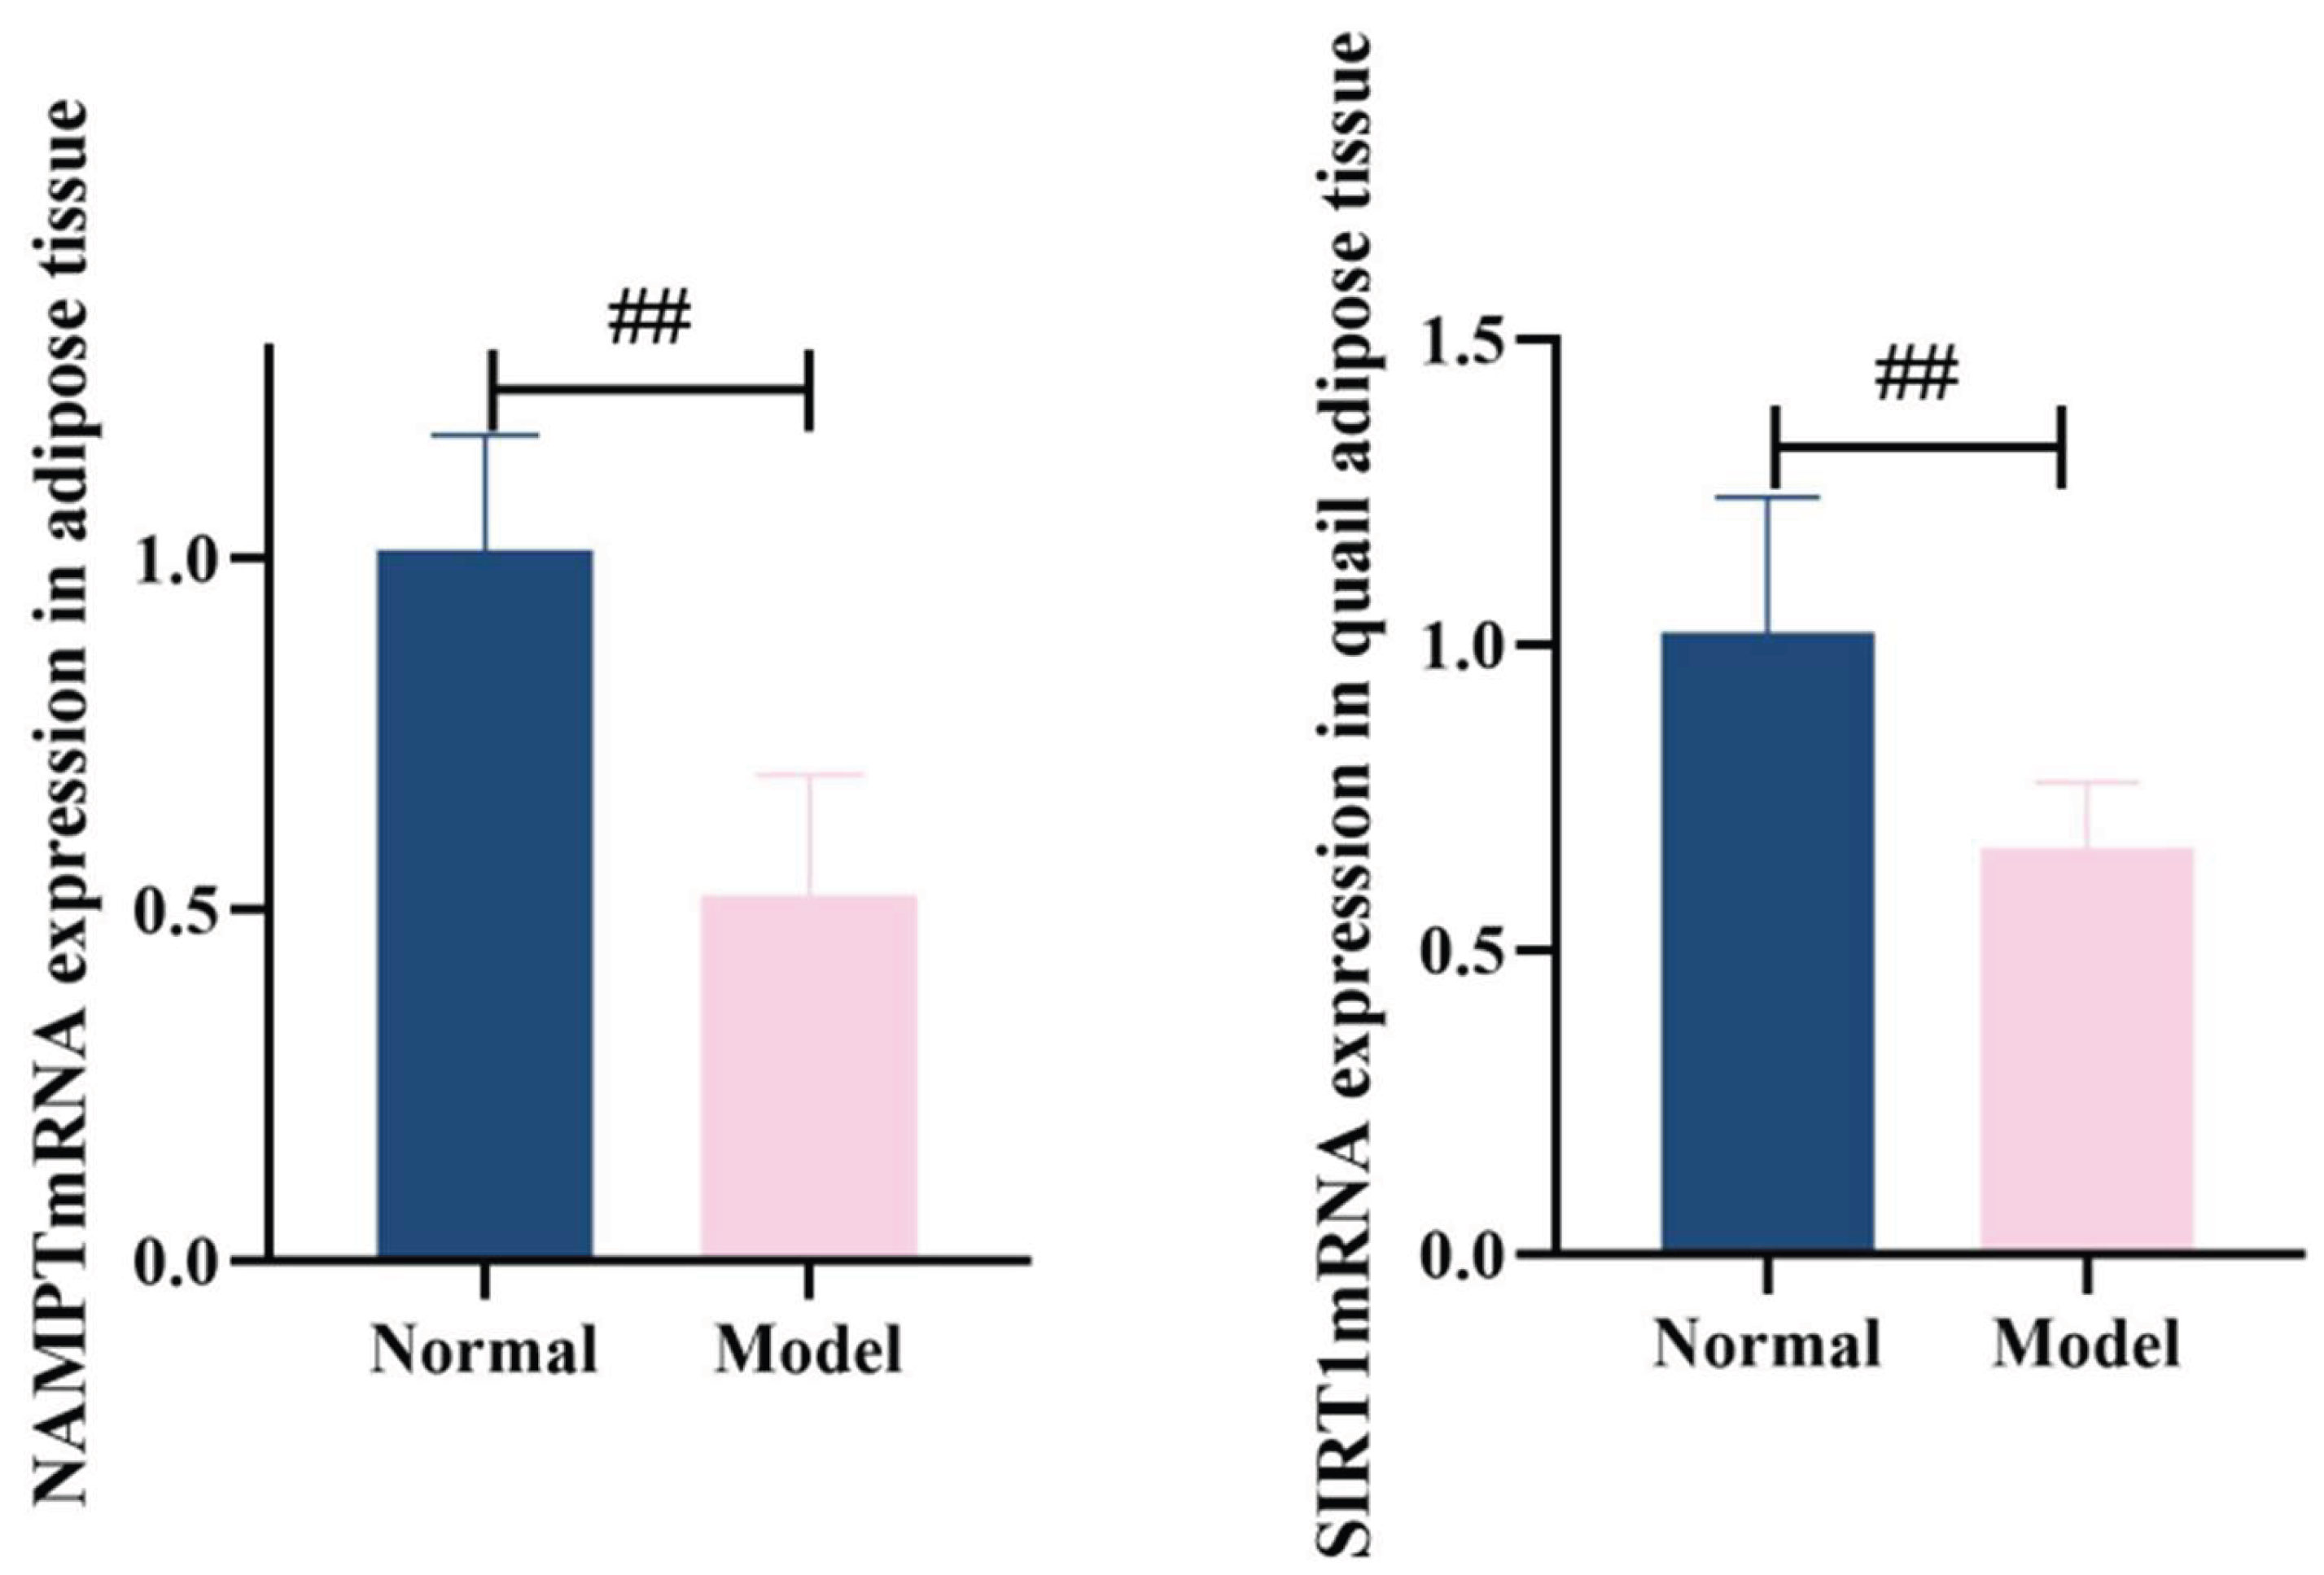
Table 3.
Summary of MTAG Analysis Results.
| metric | hyperuricacidemia GWAS | hyperlipemia GWAS | Shared mutation | Analysis of variance |
| Number of mutation sites | 30 | 30 | 20 | 40 |
| Genetic number | 19 | 19 | 13 | 25 |
| Genetic overlap rate (%) | - | - | 66.7 | - |
| Minimum P-value | 2.3×10⁻²⁴ | 1.2×10⁻³⁰⁸ | 2.3×10⁻²⁴ | 1.2×10⁻³⁰⁸ |
| Mean effect value | 0.028 | 0.087 | 0.065 | 0.058 |
Table 4.
Statistical summary of gene detection and expression variability across metabolic gene classes.
Table 4.
Statistical summary of gene detection and expression variability across metabolic gene classes.
| Gene category | Number of preset genes | Number of detected genes | relevance ratio(%) | Mean expression values | Coefficient of variation |
| NAD⁺pathway genes | 9 | 9 | 100 | 12.0±3.0 | 0.25 |
| Lipid metabolism genes | 8 | 8 | 100 | 9.5±2.5 | 0.26 |
| Transcript protein gene | 8 | 8 | 100 | 8.0±2.0 | 0.25 |
| Transcriptional regulatory genes | 5 | 5 | 100 | 7.8±1.8 | 0.23 |
| AMPK signal gene | 2 | 2 | 100 | 8.5±2.2 | 0.26 |
| amount to | 32 | 32 | 100 | 9.2±2.5 | 0.27 |
Table 6.
UA levels in quail serum and fecal-urine mixtures on days 7d,14d,21d,28d, and 35d (μmol/L, x ± s).
Table 6.
UA levels in quail serum and fecal-urine mixtures on days 7d,14d,21d,28d, and 35d (μmol/L, x ± s).
| Serum UA level(μmol/L) | Fecal urine mixture UA level(μmol/L) | |
| 7d Normal group (n=8/10) | 257.53 ± 92.68 | 404.63 ± 83.84 |
| 7d Model group (n=10) | 320.30 ± 90.13 | 641.43 ± 48.09### |
| 14d Normal group (n=10) | 126.13 ± 42.02 | 501.72 ± 74.31 |
| 14d Model group (n=10) | 421.77 ± 111.17### | 743.96 ± 58.78### |
| 21d Normal group (n=10) | 115.11 ± 33.48 | 243.00 ± 47.99 |
| 21d Model group (n=10) | 223.28 ± 41.96### | 141.15 ± 81.10### |
| 28d Normal group (n=10) | 137.64 ± 44.93 | 399.85 ± 148.05 |
| 28d Model group (n=10) | 205.56 ± 80.01# | 550.54 ± 84.26# |
| 35d Normal group (n=10) | 123.04 ± 17.80 | 194.90 ± 32.58 |
| 35d Model group (n=10) | 225.50 ± 93.41## | 206.77 ± 50.01 |
Note: Compared with the normal group, #P<0.05, ##P<0.01, and ###P<0.001.
Table 8.
Serum XOD and ADA activity of two groups of quail(U/L ,x ± s).
| Serum XOD | Serum ADA | |
| 21d Normal group (n=10) | 0.83 ± 0.30 | 7.29 ± 2.71 |
| 21d Model group (n=10) | 1.22 ± 0.21### | 7.55 ± 1.86 |
| 28d Normal group (n=10) | 0.80 ± 0.12 | 1.91 ± 0.22 |
| 28d Model group (n=10) | 1.26 ± 0.19### | 2.08 ± 0.40 |
| 35d Normal group (n=10) | 0.45 ± 0.06 | 4.58 ± 1.45 |
| 35d Model group (n=10) | 0.85 ± 0.23## | 5.25 ± 1.50 |
Note: Compared with the normal group, ##P<0.01 and ###P<0.001.
Table 9.
Liver XOD and ADA activity in two groups of quails(U/L ,x ± s).
| Liver XOD | Liver ADA | |
| Normal group (n=10) | 3.85 ± 0.64 | 1.50 ± 0.67 |
| Model group (n=10) | 5.79 ± 0.69### | 1.43 ± 0.32 |
Note: Compared with the normal group, ###P<0.001.
Table 10.
ACC, TL and HL activity in quail liver(x ± s).
| Liver ACC | Liver TL | Liver HL | |
| Normal group (n=10) | 0.45 ± 0.17 | 0.081 ± 0.01 | 0.80 ± 0.01 |
| Model group (n=10) | 1.13 ± 0.18### | 0.081 ± 0.02 | 0.06 ± 0.03# |
Note:Compared with the normal group, #P<0.05,###P<0.001.
Table 11.
Serum NAMPT and SIRT1 levels of quail(ng/L,x ± s).
| Serum NAMPT | Serum SIRT1 | |
| Normal group (n=10) | 17.50 ± 2.30 | 42.38 ± 6.74 |
| Model Group (n=10) | 12.89 ± 2.38### | 29.91 ± 6.30### |
Note: Compared with the normal group, #P<0.05,###P<0.001。.
Table 12.
NAMPT levels in quail liver, kidney and adipose tissue(ng/L,x ± s).
| Liver NAMPT | Kidney NAMPT | Adipose NAMPT | |
| Normal group (n=8) | 1.51 ± 0.33 | 2.69 ± 0.42 | 42.58 ± 8.57 |
| Model Group (n=8) | 0.70 ± 0.16### | 2.26 ± 0.36# | 27.08 ± 6.04### |
Note: Compared with the normal group, ##P <0.01 and ###P <0.001.
Table 13.
SIRT1 levels in liver, kidney and adipose tissue of quail (ng/L,x ± s).
| Liver SIRT1 | Kidney SIRT1 | Adipose SIRT1 | |
| Normal group (n=8) | 5.80 ± 1.03 | 16.82 ± 3.26 | 156.12 ± 38.88 |
| Model Group (n=8) | 2.59 ± 1.05### | 14.50 ± 2.72 | 102.34 ± 36.87# |
Note: Compared with the normal group, ##P<0.01 and ###P<0.001.
Table 14.
NAMPT and SIRT1mRNA expression in quail liver (x ± s).
| Liver NAMPTmRNA | Liver SIRT1mRNA | |
| Normal group (n=6) | 1.00 ± 0.06 | 1.05 ± 0.41 |
| Model Group (n=6) | 0.61 ± 0.22# | 0.58 ± 0.10# |
Note: Compared with the normal group, #P<0.05.
Table 15.
NAMPT, SIRT1mRNA expression in quail liver (x ± s).
| LiverNAMPTmRNA | LiverSIRT1mRNA | |
| Normal group (n=6) | 1.01 ± 0.13 | 1.02 ± 0.22 |
| Model group (n=6) | 0.52 ± 0.16## | 0.67 ± 0.11## |
Note: Compared with the normal group, ##P<0.01.
Disclaimer/Publisher’s Note: The statements, opinions and data contained in all publications are solely those of the individual author(s) and contributor(s) and not of MDPI and/or the editor(s). MDPI and/or the editor(s) disclaim responsibility for any injury to people or property resulting from any ideas, methods, instructions or products referred to in the content. |
© 2025 by the authors. Licensee MDPI, Basel, Switzerland. This article is an open access article distributed under the terms and conditions of the Creative Commons Attribution (CC BY) license (http://creativecommons.org/licenses/by/4.0/).
Copyright: This open access article is published under a Creative Commons CC BY 4.0 license, which permit the free download, distribution, and reuse, provided that the author and preprint are cited in any reuse.


