Submitted:
05 December 2025
Posted:
08 December 2025
You are already at the latest version
Abstract
Automotive dashboard cameras are widely used to record driving events and often serve as critical evidence in accident investigations and insurance claims. However, the accessibility of free and low-cost editing tools has increased the risk of video tampering, emphasizing the need for reliable methods to verify video authenticity. Temporal tampering typically involves manipulating the order of frames through insertion, deletion, or duplication. This study proposes a deep learning approach for detecting such tampering in dashcam videos using frame-difference analysis. Frame differences are calculated as the absolute pixel-wise difference between consecutive frames, and the resulting values are aggregated into a temporal magnitude signal, which is then normalized to the range [0, 1]. Sudden spikes in this signal indicate potential tampering. These normalized sequences are processed by a one dimensional Convolutional Neural Network (1D-CNN) for classification. Experimental evaluation using a custom dataset derived from the D2-City dataset demonstrates strong performance, achieving detection accuracies of 98.9% for frame insertion, 94.4% for frame deletion, and 92.4% for frame duplication. The model was further extended for multi-class classification to distinguish among non-tampered, insertion, deletion, and du-plication videos, achieving 92.8% accuracy with consistent precision, recall, and F1-scores. These results, combined with low computational cost, indicate strong potential for near real-time deployment in automotive cybersecurity and forensic applications, enhancing trust in IoT-enabled transportation systems.
Keywords:
video tampering detection
; frame difference analysis
; 1D Convolutional Neural Network (CNN)
1. Introduction
Automotive dashboard cameras (dashcams) have become increasingly common in modern vehicles, offering valuable evidence for accident investigations, insurance claims, and law enforcement. Despite their benefits, the widespread availability of inexpensive video editing tools has raised concerns about video authenticity. Courts and insurance companies require trusted forensic reports to validate video evidence; this makes tampering detection a critical cybersecurity challenge in IoT-enabled transportation systems [1]. Video tampering can occur in the temporal domain (frame insertion, deletion, duplication), the spatial domain (object removal or modification), or both (spatio-temporal tampering) [2]. Temporal tampering is particularly challenging because it alters the sequence of frames without obvious visual artifacts, making detection difficult in dynamic driving environments.
A wide range of methods have been explored to detect such manipulations. Early research primarily relied on handcrafted features and statistical inconsistencies. For example, inconsistencies in correlation coefficients were used to detect insertions and deletions [3], while extensions incorporating Local Binary Pattern descriptors improved robustness under varying conditions [4]. Other studies analyzed prediction residuals, optical flow gradients, and compressed-domain features [5], or proposed descriptors such as Pseudo Flow Orientation Variation (PFOV) combined with robust principal component analysis [6]. Additional works used time–frequency analysis of reconstructed DCT coefficients [7], motion vector inconsistencies [8], entropy-based descriptors [9], and Haralick feature correlations for detecting insertion, deletion, and duplication events [10]. Although these handcrafted methods demonstrate promising results, many are sensitive to moving background and compression.
With the introduction of deep learning, more powerful CNN-based and hybrid architectures emerged. Examples include 2D CNNs combined with SVM classifiers [11], 3D CNNs operating on absolute frame differences [12], contrastive-learning-based frameworks capturing motion continuity [13], and hybrid CNN–LSTM or CNN–GRU models for long-range temporal modeling [14,15]. At the same time, lightweight supervised and unsupervised frameworks were investigated, such as histogram-similarity-based SVM detection [15], correlation-distance-based dual-threshold methods [16], statistical descriptors using Sobel edges [17], and comparisons between supervised CNNs and unsupervised VGG-based representations [18]. Additional approaches utilized machine learning classifiers [19], regression-based outlier detection [20], motion vector and transform features for frame shuffling attacks [21], SIFT- and RANSAC-based duplication localization [22], tensor-based frameworks [23], KPCA-reduced VGG-16 features [24], improved PFOV-based approaches [25], and CNN-based architectures such as VFID-Net [26]. Other studies explored motion-residual and object-tracking-based tampering detection [27], and ensemble-based tampering detectors using Haralick and LBP features have also been reported [28]. Although these works show significant progress, they often require heavy computation, rely on dataset with static background or with very little movements, none of them are trained and tested on automotive dashcam dataset.
Despite these advancements, three major gaps remain: (1) most existing studies have been evaluated on static or surveillance datasets rather than real-world dashcam recordings; (2) many deep learning architectures are computationally expensive and unsuitable for large-scale deployment; and (3) few frameworks jointly address frame insertion, deletion, and duplication within a single unified model.
To address these gaps, this study proposes a computationally efficient deep learning method for detecting temporal tampering in dashcam videos using frame-difference features and a lightweight one-dimensional Convolutional Neural Network (1D CNN). Frame-difference magnitudes are extracted between consecutive frames and used as sequential signals to highlight potential temporal inconsistencies. Experiments conducted on a custom dataset derived from the D2-City dataset demonstrate high detection accuracy, 98.9% for frame insertion, 94.4% for frame deletion, and 92.4% for frame duplication, while maintaining low computational cost. The model is further extended to a multi-class setting, achieving 92.8% overall accuracy across non-tampered and tampered categories. These results highlight the potential of the proposed approach for near real-time deployment in forensic and automotive cybersecurity applications, strengthening trust in IoT-enabled transportation systems.
1.1. Contribution
This study contributes the following:
- A lightweight temporal tampering detector based on frame-difference magnitude signals and a compact 1D-CNN architecture.
- A unified approach capable of detecting frame insertion, deletion, duplication, and performing multiclass classification.
- A large-scale custom tampered dataset derived from D2-City with realistic manipulation conditions.
- A detailed ablation study analyzing kernel size, model depth, and dropout effects across all tampering types.
- A comprehensive computational efficiency analysis, demonstrating near real-time inference on CPU.
- Cross-dataset generalization experiments highlighting domain-shift challenges and directions for improvement.
2. Materials and Methods
The proposed method emphasizes computational efficiency and memory usage by leveraging pixel-based frame differences. Computing the frame difference between adjacent frames enables us to convert 3D data into a sequence of 1D data vectors. By focusing on frame differences, which capture similarities in consecutive frame sequences, the proposed approach significantly reduces the need for computational power and memory. For each video, frames are extracted sequentially to form a temporal sequence. The video frames are converted to grayscale to reduce computational complexity and then resized to a fixed dimension for consistency across different video inputs. Then, the difference between two consecutive frames is calculated. Mathematically, a video can be represented as a sequence of frames. The following methodology outlines how frame extraction and difference calculations are used to develop a computationally efficient deep learning model. Figure 1 shows the workflow diagram.
is the i-th frame in the video, and n is the total number of frames.
Figure 1.
Workflow Diagram for Temporal Video Tampering Detection Using Frame Difference Features and 1D-CNN.
Figure 1.
Workflow Diagram for Temporal Video Tampering Detection Using Frame Difference Features and 1D-CNN.
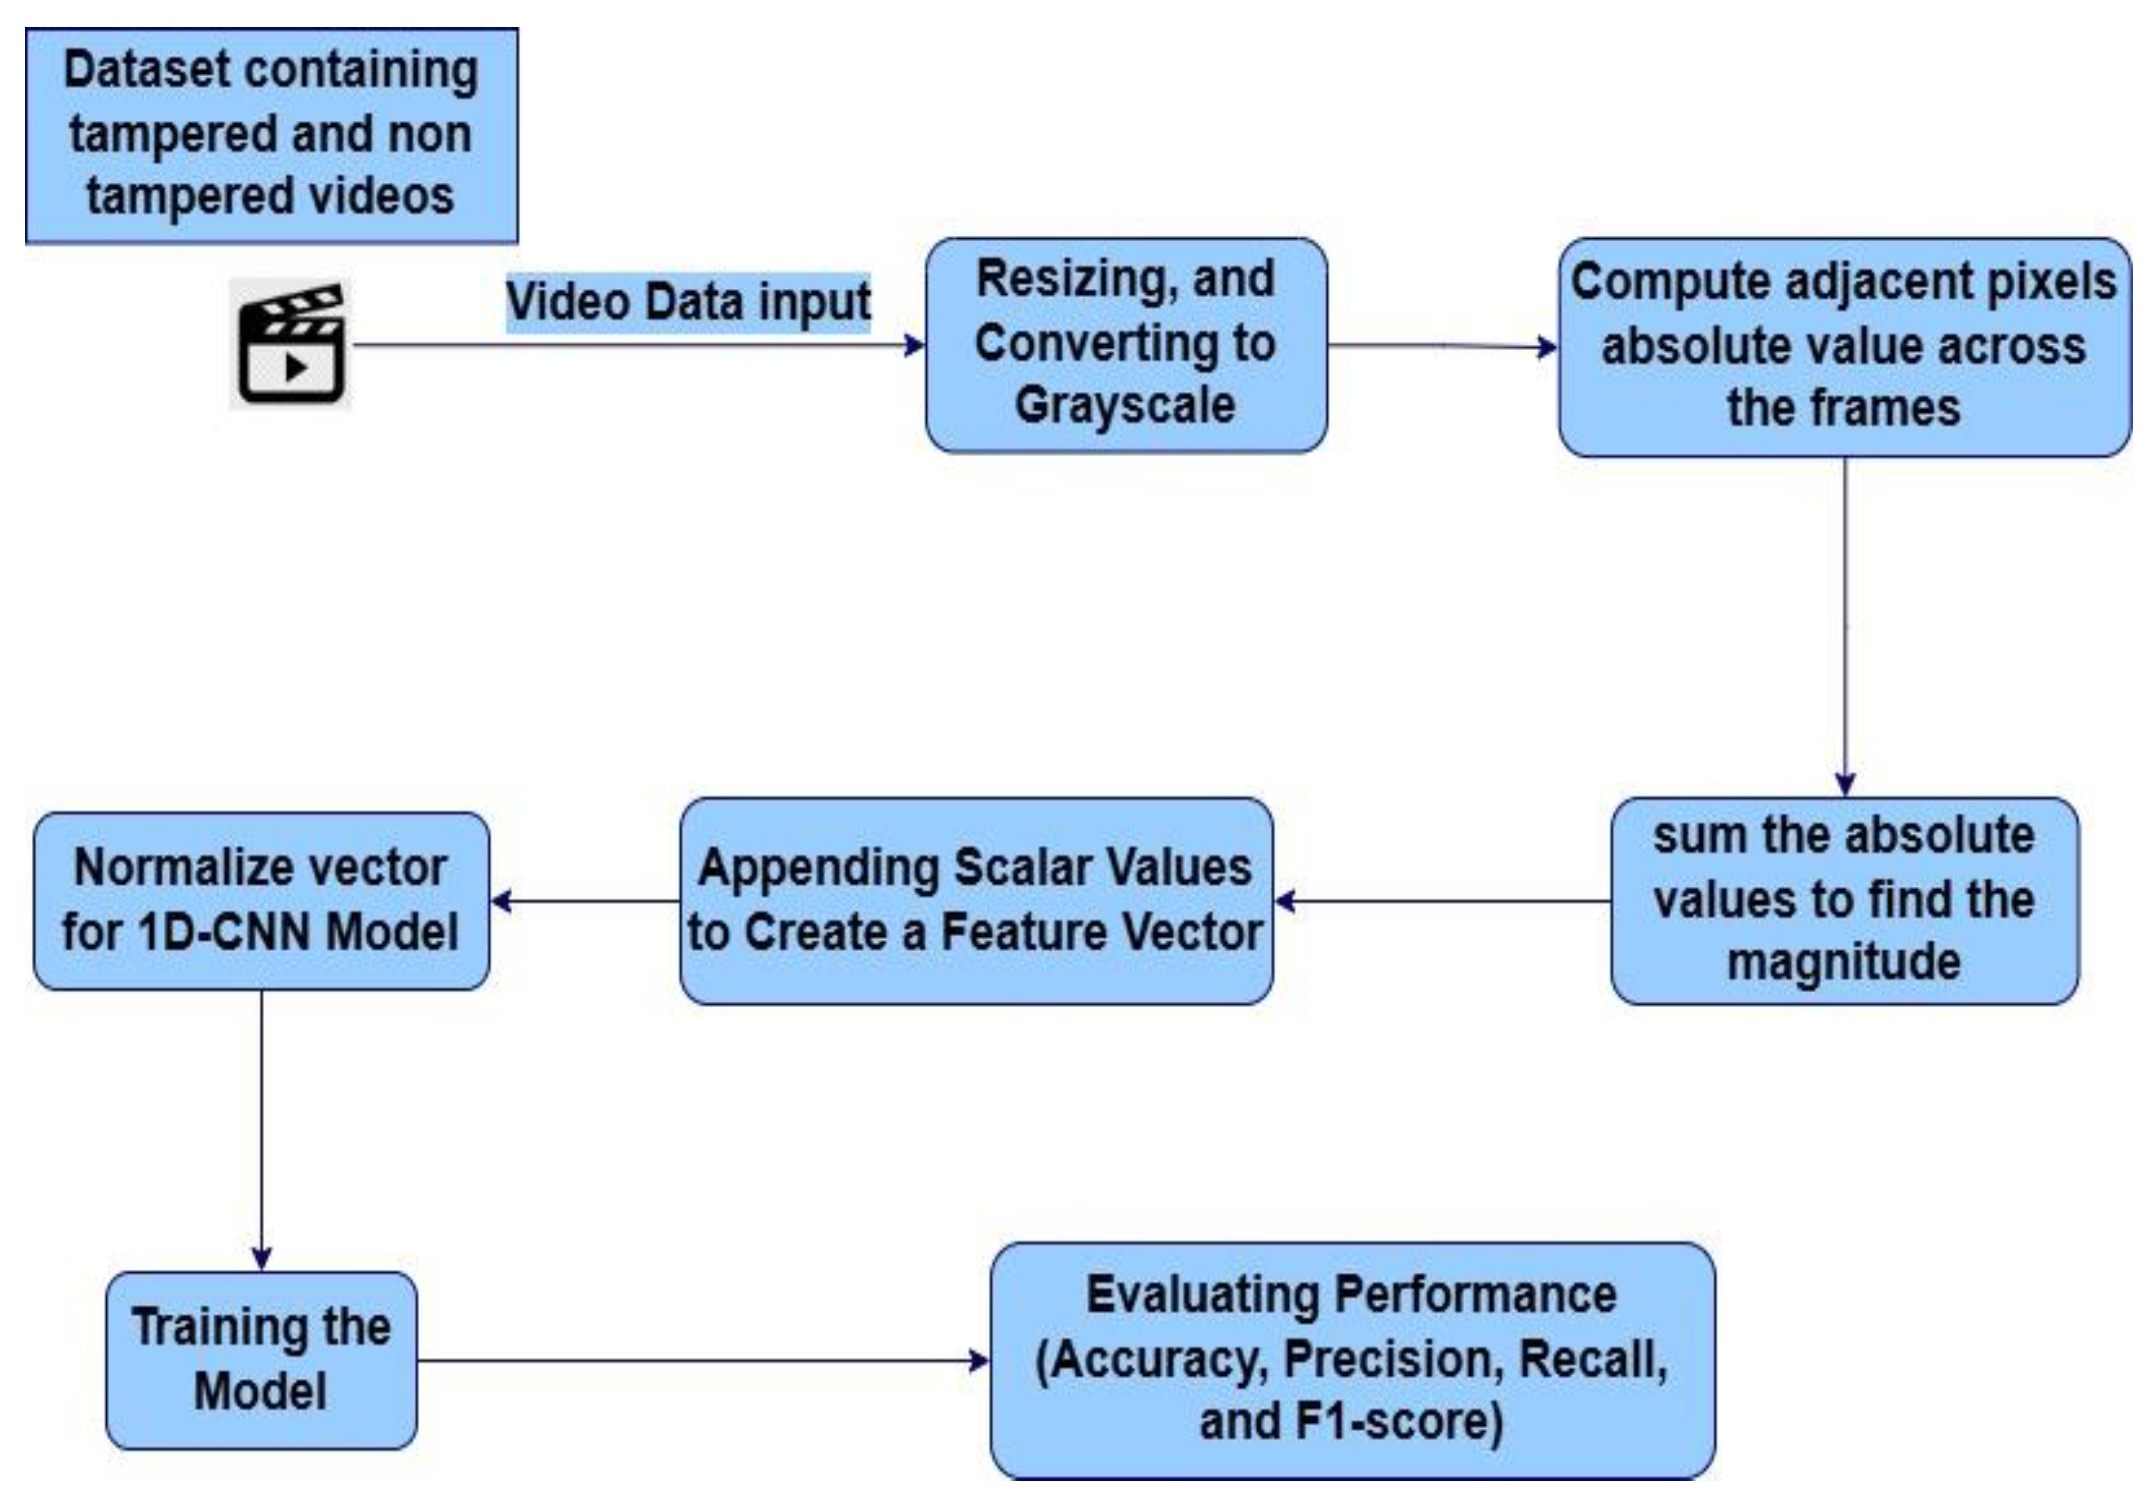
2.1. Steps Taken to Calculate Frame Difference
- Grayscale conversion reduces computational complexity by eliminating color channels and focusing on intensity.Where It is the intensity (grayscale) of the frame, and Rt, Gt, Bt are the red, green, and blue channels of the original frame.
-
The absolute difference between two consecutive frames It and It−1 is calculated as:Where is the pixel-wise difference between the current frame and the previous frame .
-
A global threshold τ = 30 was applied to suppress low-level noise in the frame-difference maps. The value was selected heuristically and was found to effectively remove insignificant fluctuations while preserving major temporal transitions:The result is a binary image with values of 0 (insignificant change) or 255 (significant change).Summing the difference, the binary image T(Dt) is then summed to obtain a scalar value representing the total change between the two frames.Where St is the sum of all pixel values in the threshold difference image, since the pixel values are either 0 or 255, St indicates the amount of motion or scene change between the frames.This scalar value, St, is appended to the list of frame differences, which will be used as input to the classification model.The entire process results in a sequence of frame differences {S1,S2,…,ST}, where T is the total number of frames in the video. This sequence is a time series representing the changes in the video over time. The following figures visualize the frame difference magnitudes of tampered and non-tampered videos.
Figure 2.
Frame difference magnitude of original video “a” across frames.
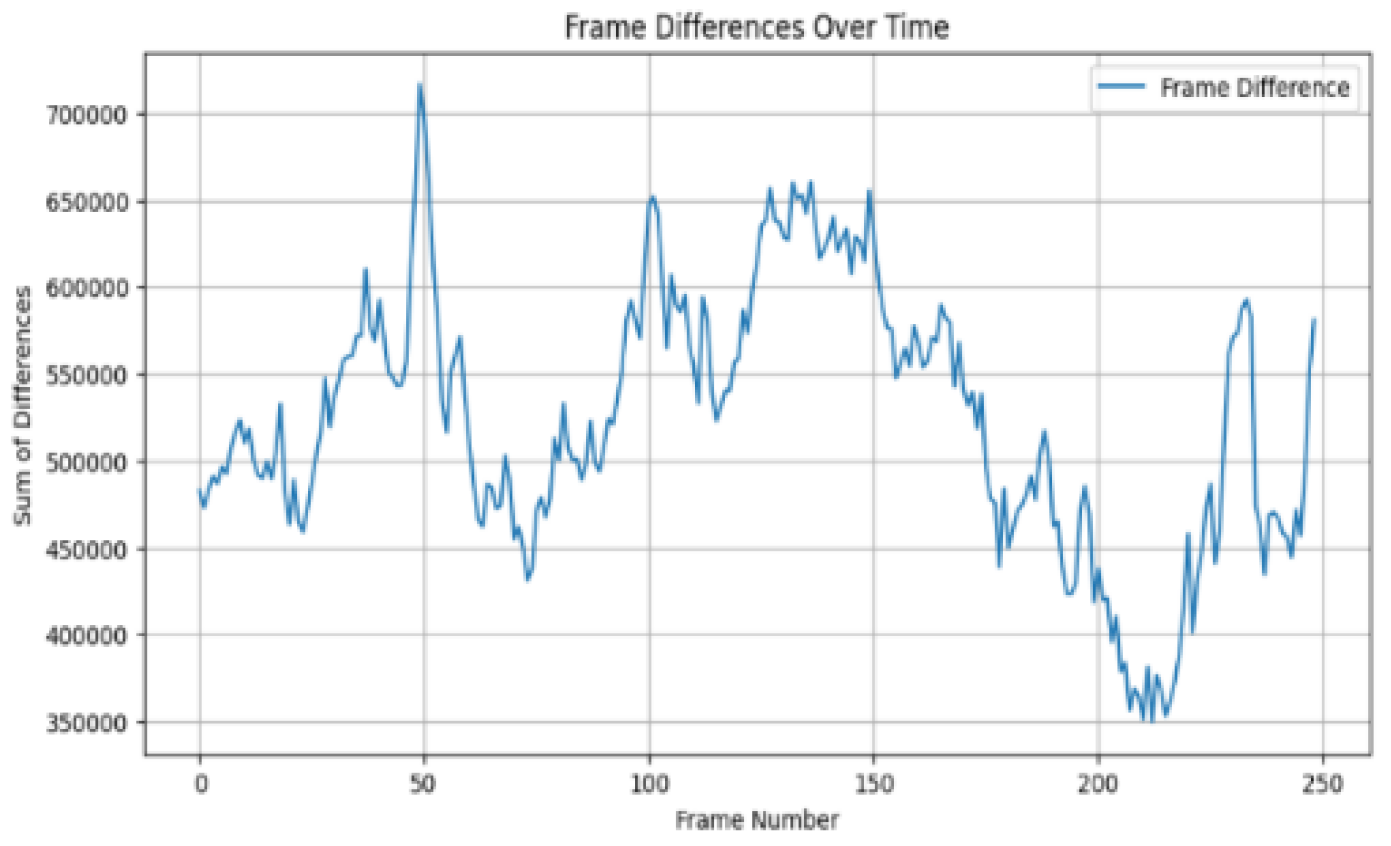
Figure 3.
Frame difference magnitude of tampered video "a" showing the deletion of 13 frames, from frame 62 to frame 74 (inclusive).
Figure 3.
Frame difference magnitude of tampered video "a" showing the deletion of 13 frames, from frame 62 to frame 74 (inclusive).
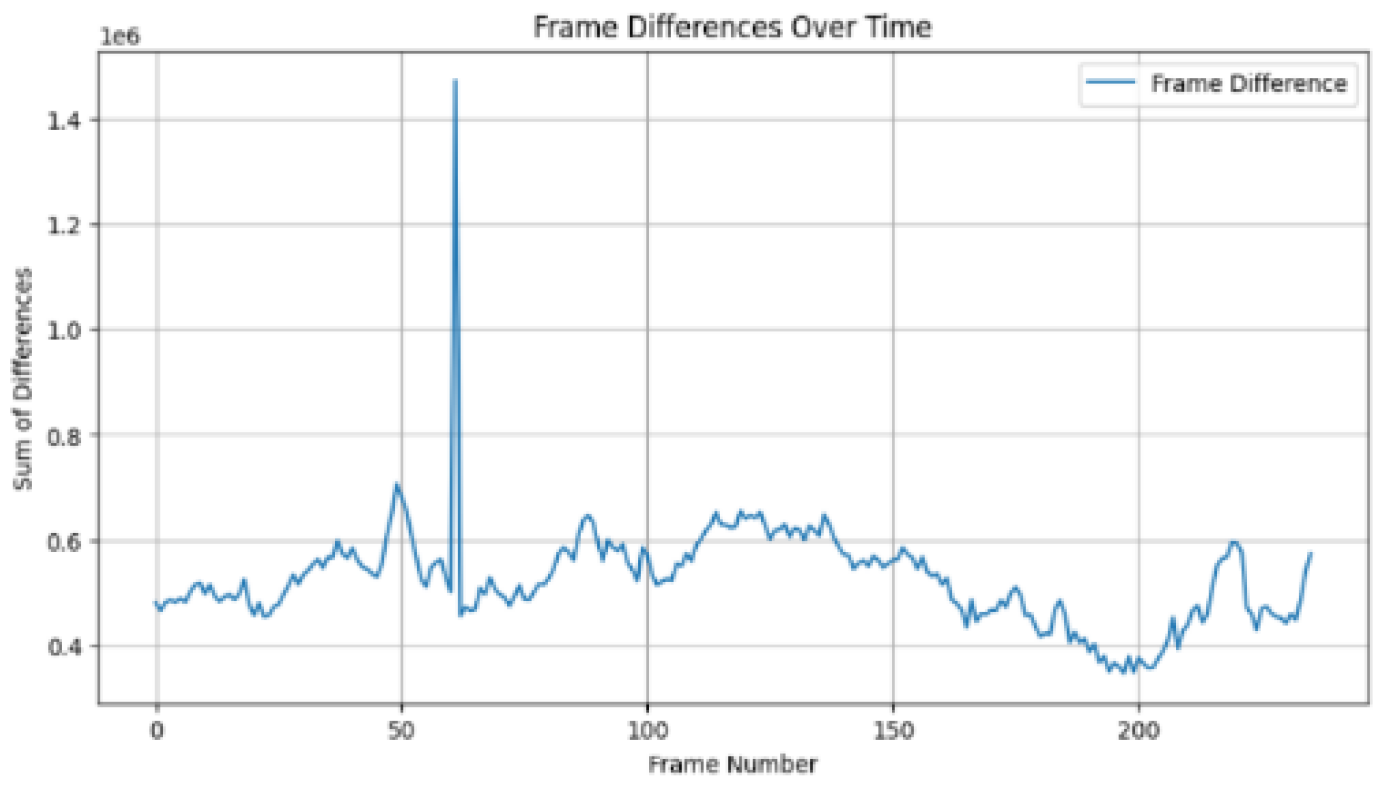
Figure 4.
Frame difference magnitude of original video “b” across frames.
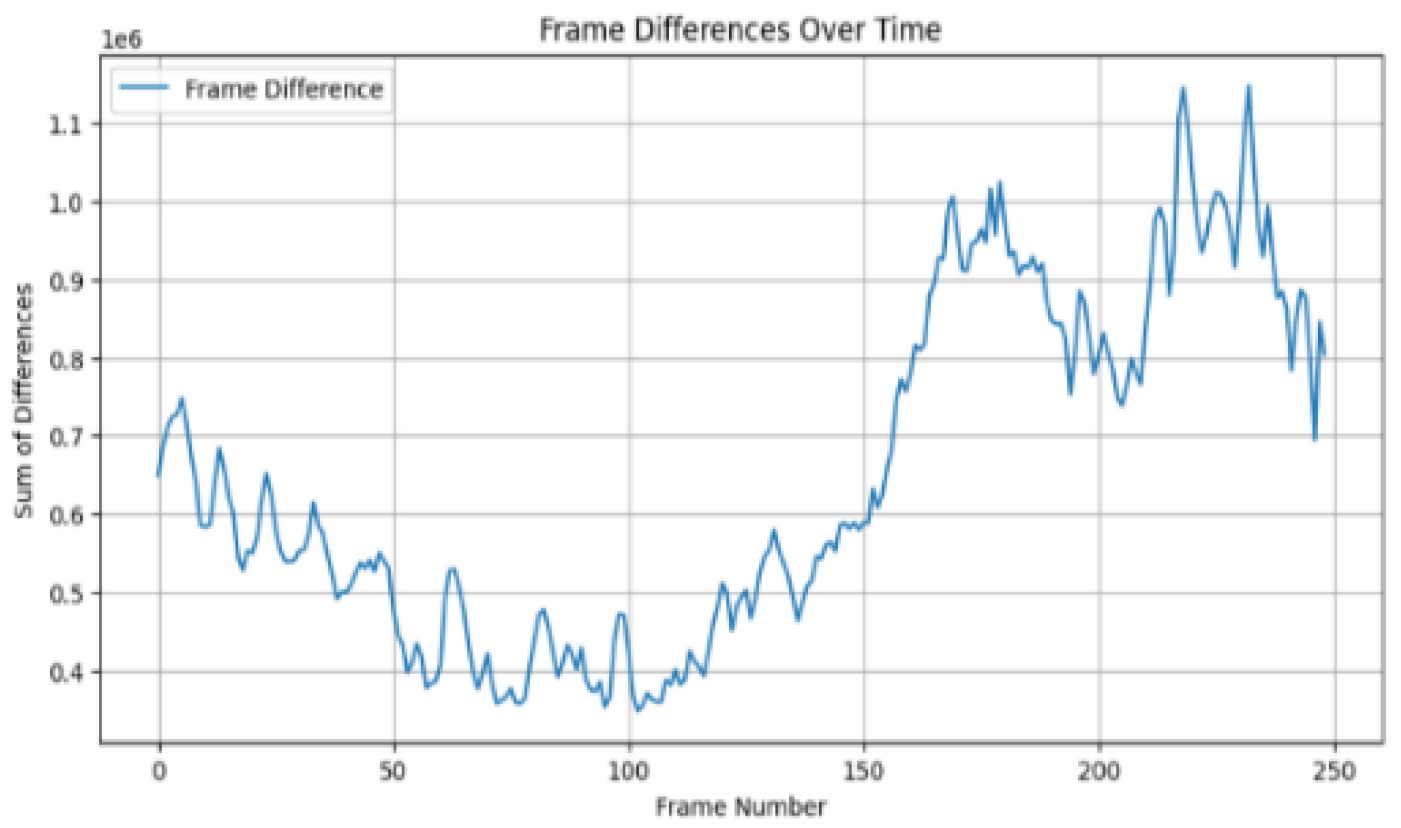
Figure 5.
Frame difference magnitude of tampered video "b" showing the insertion of 13 frames, from frame 132 to frame 144 (inclusive).
Figure 5.
Frame difference magnitude of tampered video "b" showing the insertion of 13 frames, from frame 132 to frame 144 (inclusive).
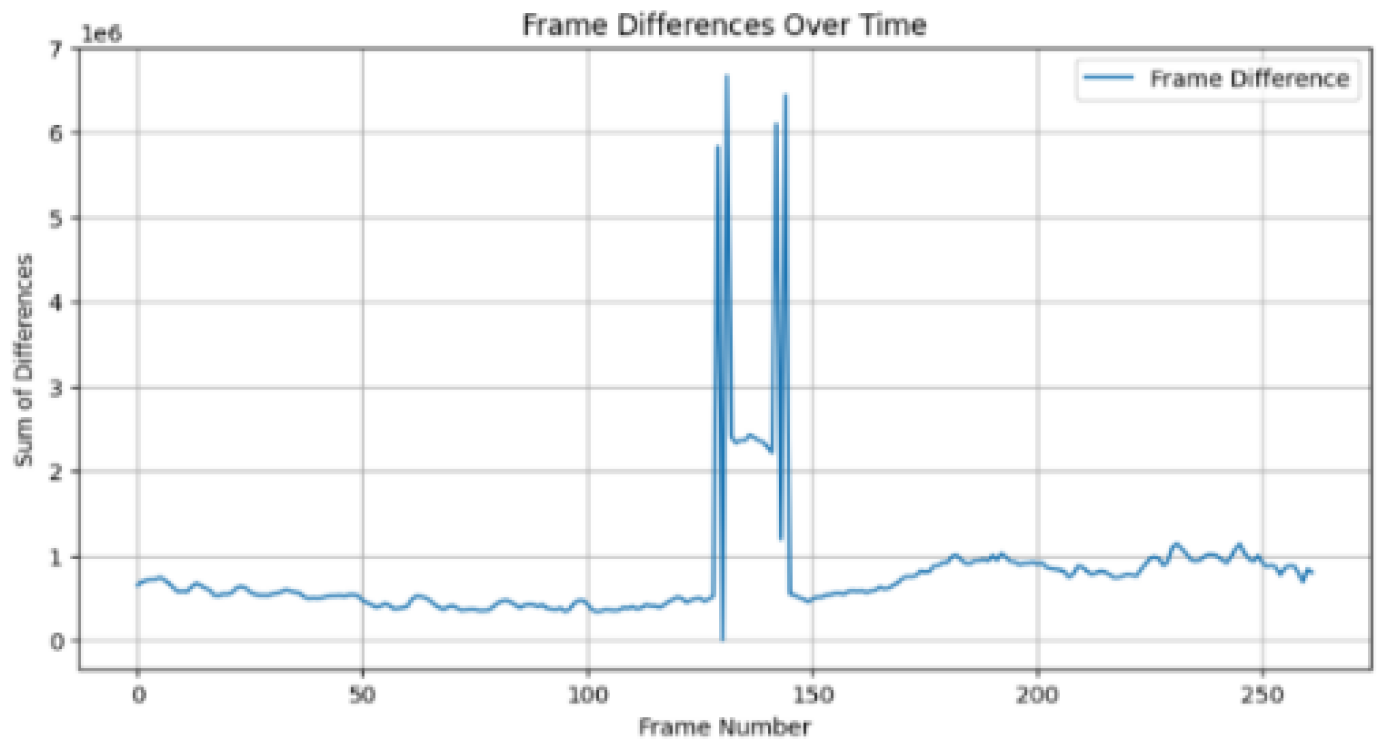
Figure 6.
Frame difference magnitude of original video “c” across frames.
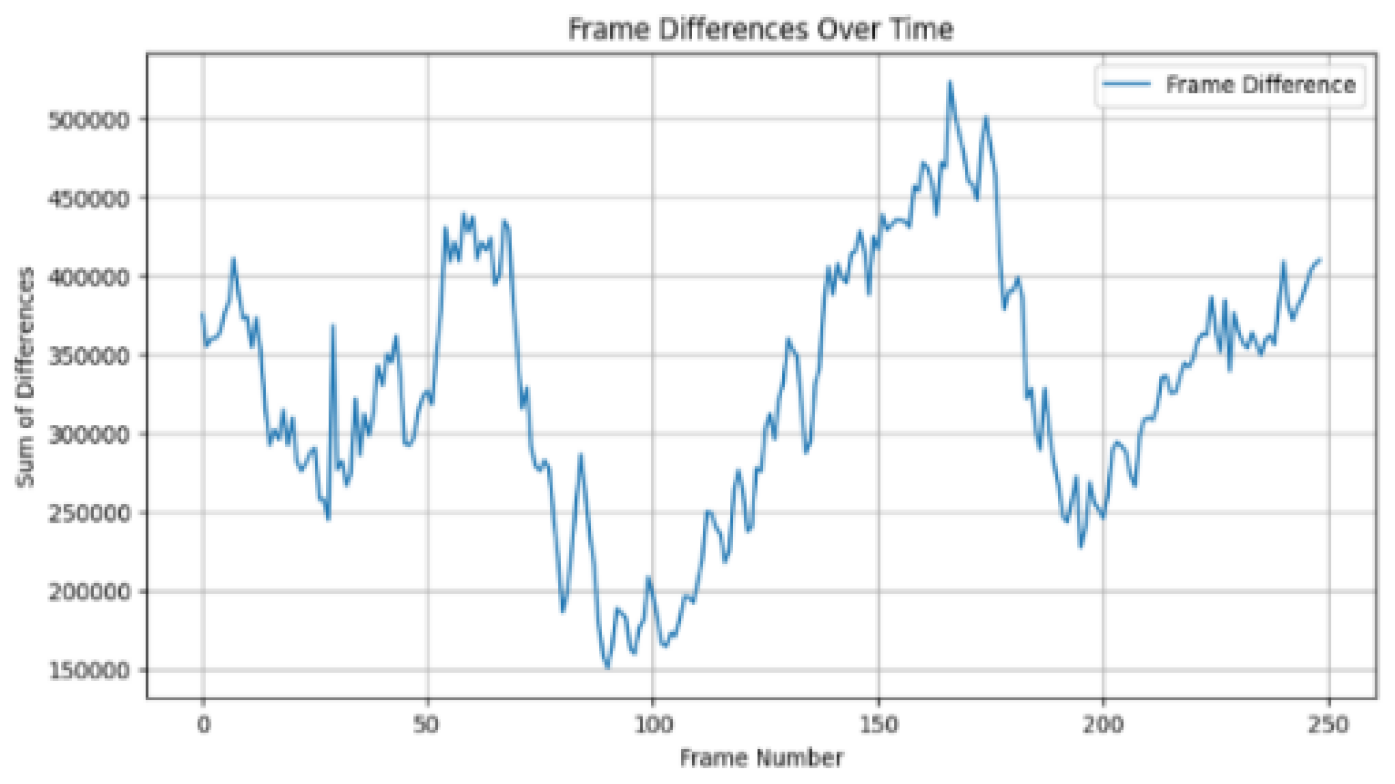
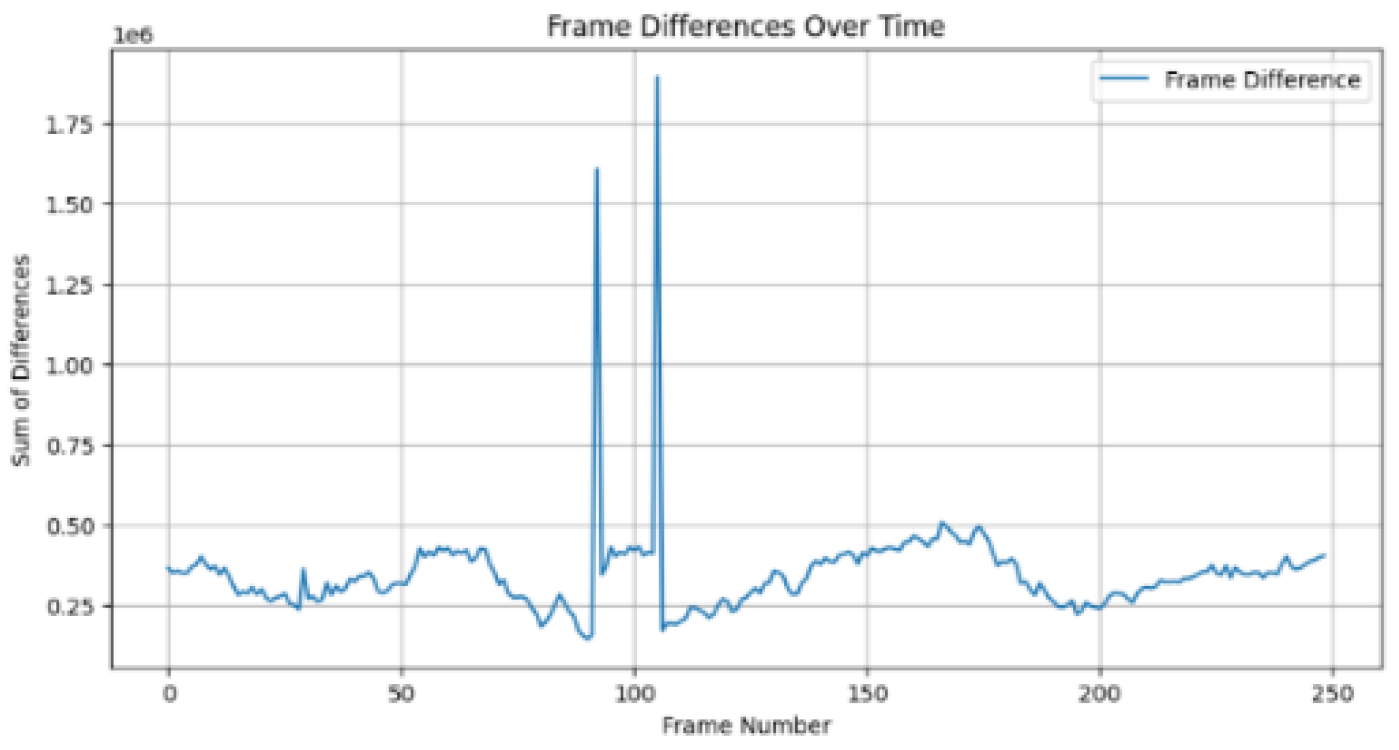
Figure 7.
Frame difference magnitude of tampered video "c" showing the duplication of 13 Frames. Frames 88 to 100 are duplicated and inserted at frames 105 to 117 (inclusive).
Figure 7.
Frame difference magnitude of tampered video "c" showing the duplication of 13 Frames. Frames 88 to 100 are duplicated and inserted at frames 105 to 117 (inclusive).
While comparing Figure 2 and Figure 3, in Figure 3, a prominent spike is observed after frame number 50 in the tampered video with frame deletion, with a sum of differences reaching approximately 1,600,000. This spike indicates an abrupt change in the frame sequence, characteristic of frame deletion. The magnitude of this spike is significantly higher than the typical fluctuations observed in the original video, which range from 350,000 to 700,000.
While comparing Figure 4 and Figure 5, the tampered video with frame insertion, a considerable spike is observed between frames 100 and 150, with a sum of differences reaching approximately 1,500,000.
This spike shows an abrupt change in the frame sequence due to the insertion of new frames. This spike's magnitude is much higher than the fluctuations observed in the original video.
While comparing Figure 6 and Figure 7, the tampered video with frame duplication, a noticeable spike is observed around frame number 100, with a sum of differences reaching approximately 1,400,000. This spike indicates an abrupt change in the frame sequence due to the duplication of existing frames. The magnitude of this spike is higher than the typical fluctuations observed in the original video.
Comparing the frame difference magnitudes of tampered and non-tampered videos demonstrates the effectiveness of frame difference analysis for detecting various types of video tampering. The tampered videos show spike values more than double the maximum values observed in the original video, providing clear evidence of tampering.
2.2. Model Architecture
The proposed 1D Convolutional Neural Network (1D CNN) is designed to process sequential data, specifically the magnitude vectors derived from consecutive frame differences in video pre-processing. This model is particularly suited for binary classification tasks, where it determines whether video tampering has occurred. The input to this model is a one-dimensional feature vector representing the sequential data (e.g., magnitude differences between frames). The CNN's role is to learn temporal dependencies within this sequential data. By applying 1D convolutional filters across the time axis, the model captures patterns that indicate tampering events, such as sudden changes over time. These filters extract meaningful features that help the model differentiate between tampered and non-tampered videos. After convolution and pooling operations, the extracted temporal features are flattened and passed through fully connected layers, which perform the final classification. Figure 8 shows the model architecture designed for detecting frame deletion tampering.
Figure 8.
Model architecture

Table 1 Provides a detailed layer-wise illustration of the 1D-CNN forward-pass for a video containing 13 frames (12 frame-difference magnitudes). The table shows the raw pixel-intensity differences, normalized to [0,1], convolutional operations with specific filters and biases, max-pooling, flattening, dense layer computation, and final sigmoid output. Each row includes the input window, mathematical operations, resulting output, and interpretation, highlighting how local and higher-order temporal patterns of pixel-intensity variations are captured. This table demonstrates the step-by-step transformation of the input sequence through the network and clarifies how the model produces the tampering probability from raw frame differences.

Table 1.
Layer-wise Forward Pass of the 1D-CNN Tampering Detection Model with Pixel-Intensity Features.
Table 1.
Layer-wise Forward Pass of the 1D-CNN Tampering Detection Model with Pixel-Intensity Features.
| Layer | Input / Window | Operation & Parameters | Output Computation | Output Value | Purpose / Intuition | |
|---|---|---|---|---|---|---|
| Raw frame difference between consecutive frames. For simplicity, we considered it for 13 frames only, so we have 12 magnitude values. | [100000,120000,450000,460000,110000,90000,95000,105000,115000,95000,90000,85000] | — | — | — | The overall pixel-intensity change between consecutive grayscale frames | |
| [] | (100000-85000)/(460000-85000)=0.04, (120000-85000)/(460000-85000)=0.09 etc. | [0.04,0.09,0.96,0.963,0.06,0.01,0.03,0.07,0.10,0.03,0.01,0] | Normalized pixel-intensity change between consecutive grayscale frames. This will be used as an input. | |||
| Conv1D-1 Window 1, | [0.04,0.09,0.96,0.963,0.06] | Filter w=[0.2,-0.1,0.5,0.4,-0.2], Bias=0.05, Activation=ReLU | 0.04*0.2+0.09*(-0.1)+0.96*0.5+0.963*0.4+0.06*(-0.2)+0.05 | 0.9022 | Captures local temporal changes in pixel intensity between consecutive frames | |
| MaxPooling1D-1 | [0.9022,0.5223,0.1443,0.2413,0.116,...] | Pool size=2 | Take max in windows of 2 | [0.9022,0.5223,0.2413,...] | Reduces temporal dimension, keeps salient features | |
| Conv1D-2 Window 1, Conv1D-2 other windows are not listed in this table. | [0.9022,0.5223,0.2413,0.116,0.144] | Filter w=[0.3,-0.2,0.5,0.1,0.2], Bias=0.05, Activation=ReLU | 0.9022*0.3+0.5223*(-0.2)+0.2413*0.5+0.116*0.1+0.144*0.2+0.05 | 0.4815 | Captures higher-order temporal patterns formed by combinations of local intensity variations | |
| MaxPooling1D-2 | [0.4815,...] | Pool size=2 | Max over windows | [0.4815,...] | Summarizes features | |
| Flatten | [0.4815,...] | — | Concatenate all feature values | [0.4815,...] | Prepare for Dense layer | |
| Dense | [0.4815,...] | Units=1, Weight=[0.2], Bias=0.05, Activation=ReLU | 0.4815*0.2+0.05 | 0.1463 → ReLU=0.1463 | Combine features into tampering evidence | |
| Output Sigmoid | 0.1463 | Activation=Sigmoid | 1/(1+exp(-0.1463)) | 0.5365 | Probability of tampering (threshold 0.5 → tampered) |
2.3. Dataset and Creating Custom Dataset
The D2-City dataset is a large-scale driving dataset of dashcam videos collected from vehicles operating on DiDi’s platform and hosted on Science Data Bank (https://www.scidb.cn). The dataset contains over 10,000 video clips captured in diverse road, weather, and traffic conditions. Original clips are 30 seconds long and recorded at 25 frames per second; source resolutions vary (720p or 1080p) and raw bitrates range roughly from 2000 kbps to 4000 kbps. To preserve data diversity, we retained each clip’s original resolution and bitrate where applicable. [29].
From this we selected a total of 1231 original videos (444 for deletion scenario, 408 for insertion scenario, and 379 for duplication scenario). Each selected original video was split into three non-overlapping 10-second clips, yielding 1231 × 3 = 3693 clips. From these clips we generated tampered versions as follows: (i) deletion: remove 13 consecutive frames at a random location; (ii) insertion: insert 13 new frames sampled from an external set at a random location; (iii) duplication: duplicate 13 consecutive frames from one random location and insert them at another random location. For each clip manipulated under a tampering type, the manipulated clip is paired with its original clip to create a balanced dataset per experiment.
The reason we deleted, inserted and duplicated 13 frames is that the human visual response times are typically 200–250 milliseconds, after which a physical reaction may begin. However, carrying out meaningful action, such as reaching, pushing, or shifting body position, usually takes at least 600 milliseconds [30,31]. Therefore, 13 frames, corresponding to about 0.52 seconds at 25 frames per second, cannot represent a complete and meaningful action. For this reason, a 13-frame manipulation was set in constructing the tampered dataset. All manipulations were performed using FFmpeg and custom Python scripts; the exact generation code and the seed used for random locations are provided.
2.4. Software and Hardware Environment
All experiments were implemented using:
- Python 3.12.10, OpenCV, NumPy, scikit-learn, TensorFlow 2.20.0, and Keras
- Processor: Intel® Core™ i7, Memory: 8 GB RAM, Operating System: Windows 10, and GPU: None; all training and inference were performed on CPU
This demonstrates that the proposed model is computationally efficient and suitable for deployment in real-world systems that may lack dedicated GPU resources.
3. Results
3.1. Detecting Frame Deletion Tampering
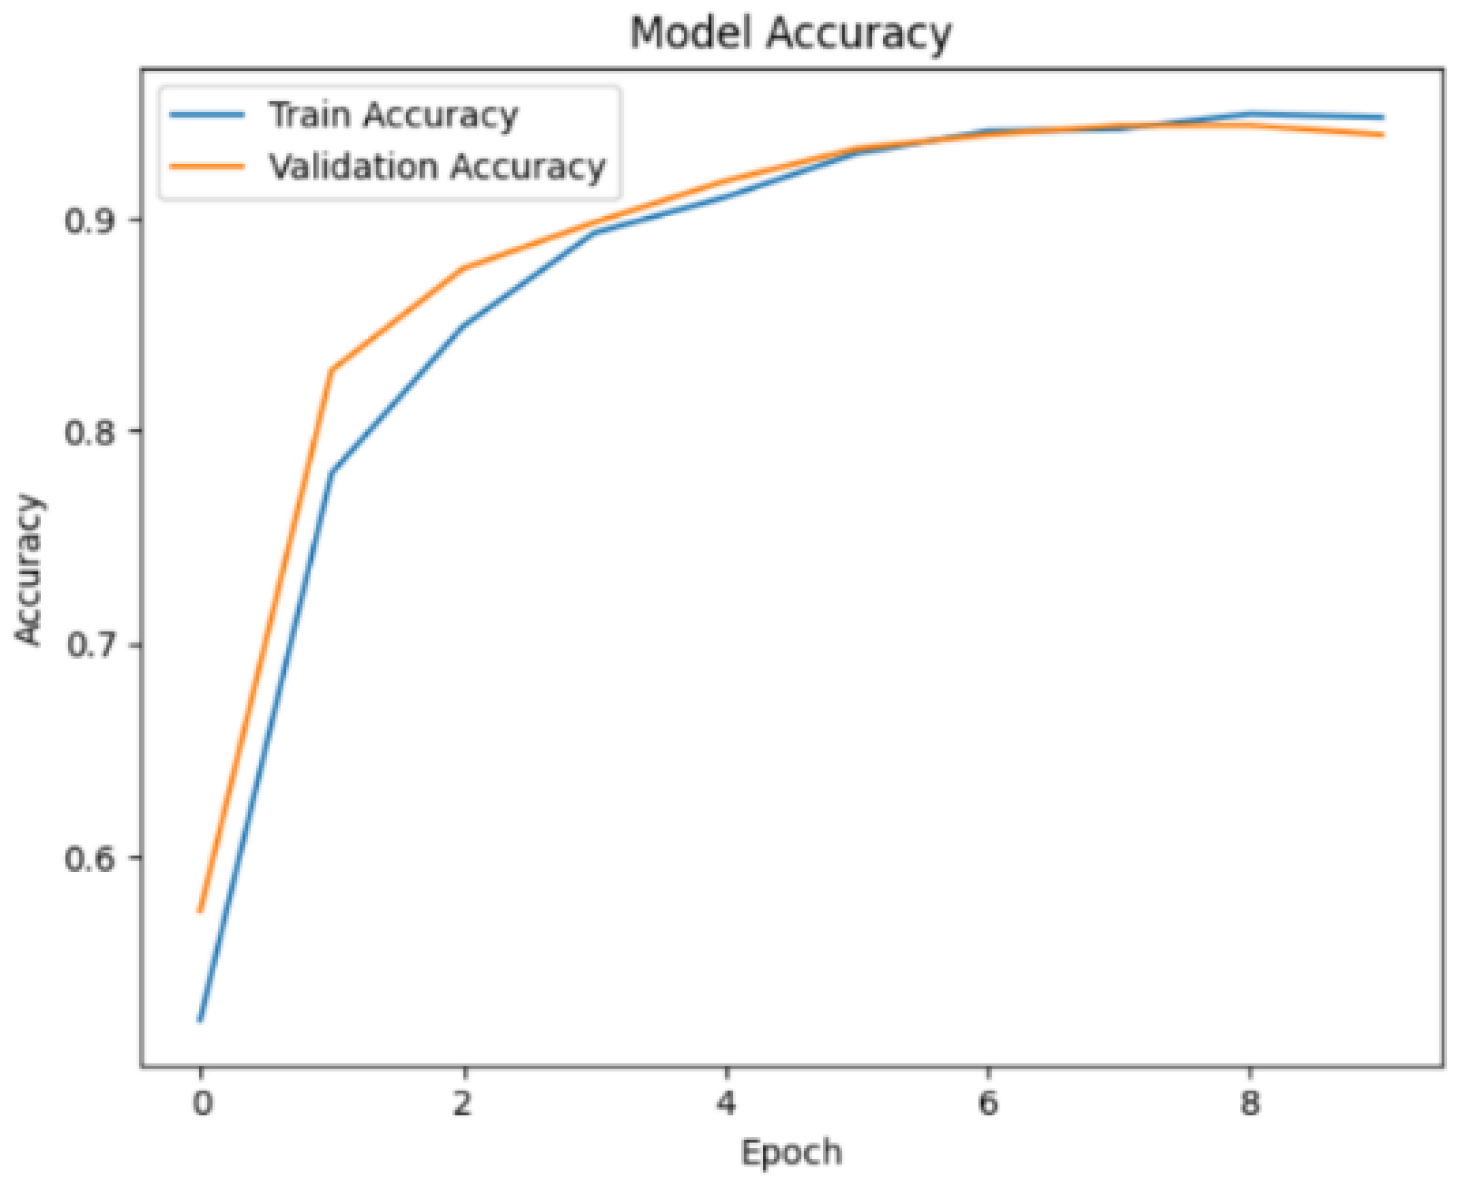
A subset of the D2City dataset was selected, containing 1,332 videos, each 10 seconds long with 25 frames per second. For the 1,332 non-tampered videos, an equal number of tampered videos were created, such that 13 frames were randomly deleted from each original video. After calculating the frame differences, the model was trained using feature vectors derived from these differences. Of all the videos, 15% were set aside for testing, and the remaining 85% were used for model training and validation, where 80% were used for training and 20% for validation. At the end of training, the training accuracy, loss, and validation accuracy and loss were computed for each epoch. Figure 9 shows the training and validation accuracy over the course of several epochs. By the end of the 10th epoch, the training accuracy reached 94.8%, and the validation accuracy was 93.9%.
Figure 9.
Training and validation Accuracy for frame deletion tampering over epochs.
Regarding the loss, a noticeable decrease was observed as the epoch progressed, as shown in Figure 10. At the end of the 10th epoch, the training loss was 0.149, and the validation loss was 0.147.
When tested on 15% of the testing dataset, the model achieved a detection accuracy of 94.4%, with a precision of 92.7%, a recall of 96.4%, and an F1 score of 94.5%. The confusion matrix and ROC curve shown in Figure 11, and Figure 12 illustrate the performance of the proposed model on unseen data using the frame difference method. The confusion matrix shows that out of 342 samples, 158 Original frames were correctly classified, while 13 were misclassified as tampered. Similarly, 165 tampered frames were correctly identified, with only 6 misclassified as original, indicating a very low error rate. The ROC curve further confirms the strong performance, with an AUC score of 0.992, which is very close to 1 and reflects excellent discrimination between original and tampered frames.
3.2. Detecting Frame Insertion Tampering
For detecting frames insertion tampering a subset of the D2-City dataset has been used, containing 1221 videos, each 10 seconds long with 25 frames per second. For 1221 non-tampered videos we created 1221 tampered videos, as such that to each video, a set of 13 consecutive frames were inserted randomly. After calculating the frame differences, the model was trained using a feature vector computed from these frame differences. Of all the videos, 15% were set aside for testing, and the remaining 85% were used for model training and validation, where 80% were used for training and 20% for validation. At the end of training, the training accuracy, loss, and validation accuracy and loss were computed for each epoch. Figure 13 shows the training and validation accuracy over the course of several epochs. By the end of the 10th epoch, the training accuracy reached 98.5%, and the validation accuracy was 98.0%.
Regarding the loss, a noticeable decrease was observed as the epochs progressed, as shown in Figure 14. At the end of the 10th epoch, the training loss was 0.043, and the validation loss was 0.070.
When tested on 15% of the testing dataset, the model achieved a detection accuracy of 98.9%, with a precision of 98.3%, a recall of 99.4%, and an F1 score of 98.9%. Figure 15 and Figure 16 show the confusion matrix and ROC curve. The confusion matrix indicates that the model correctly classified 180 Original frames and 182 Tampered frames, with only 4 misclassifications in total which demonstrates an extremely low error rate. The ROC curve further confirms the excellent performance, with an AUC score of 0.999, which is almost perfect and reflects an outstanding ability to distinguish between Original and Tampered frames.
3.3. Detecting Frame Duplication Tampering
To detect frame duplication tampering, a subset of the D2-City dataset was selected, containing 1,065 videos, each 10 seconds long with 25 frames per second. For 1065 non-tampered videos we created 1065 tampered videos, as such that in each video, 13 frames were duplicated at random locations. Both the starting position of the frames being copied and the location where they were duplicated were selected randomly. After calculating the frame differences, the model was trained using a feature vector derived from these frame differences. Of all the videos, 15% were set aside for testing, and the remaining 85% were used for model training and validation, where 80% were used for training and 20% for validation. At the end of training, the training accuracy, loss, and validation accuracy and loss were computed for each epoch. Figure 17 shows the training and validation accuracy over the course of several epochs. By the end of the 10th epoch, the training accuracy reached 92.4%, and the validation accuracy was 90.9%.
Regarding the loss, a noticeable decrease was observed as the epochs progressed, as shown in Figure 18. At the end of the 10th epoch, the training loss was 0.206, and the validation loss was 0.256.
When tested on 15% of the testing dataset, the model achieved a detection accuracy of 92.4%, with a precision of 88.5%, a recall of 97.4%, and an F1 score of 92.8%. Figure 19 and Figure 20 illustrate the model’s performance on the unseen dataset for frame duplication detection. The confusion matrix indicates that the model correctly identified 138 original and 155 tampered videos, with only a small number of misclassifications as shown in the Figure below. The ROC curve further supports this observation, showing an Area Under the Curve (AUC) value of 0.970, the sharp rise of the curve near the top-left corner confirms the model’s strong sensitivity and low false positive rate, indicating robust generalization and reliable performance on unseen frame duplication data.
3.4. Multiclass Classification
Classifying between non-tampered videos and tampered videos where frame insertion, frame deletion, and frame duplication exist, a multiclass classification model was used. For model training, evaluation, and testing, a dataset was developed that contains 1323 videos of frame deletion tampering, 1221 of frame insertion tampering, 1065 of frame duplication tampering, and 3609 non-tampered videos. Of all the videos, 15% were set aside for testing, and the remaining 85% were used for model training and validation, where 80% were used for training and 20% for validation. At the end of training, the training accuracy, loss, and validation accuracy and loss were computed for each epoch. Figure 21 shows the training and validation accuracy over the course of several epochs. By the end of the 10th epoch, the training accuracy reached 90.5%, and the validation accuracy was 92.9%.
Regarding the loss, a noticeable decrease was observed as the epochs increased, as shown in Figure 22. At the end of the 10th epoch, the training loss was 0.287, and the validation loss was 0.241.
The overall accuracy when tested on 15% of the testing dataset: the model achieved a detection accuracy of 92.8%, with a precision of 93.1%, a recall of 92.8%, and an F1 score of 92.8%. Figure 23 and Figure 24 shows the confusion matrix and ROC curves of multiclass classification video tampering detection model. The confusion matrix shows actual classes on the y-axis and predicted classes on the x-axis for four categories: Non-Tampered, Frame Insertion, Frame Deletion, and Frame Duplication. Most predictions fall along the diagonal, indicating high accuracy, with 516 non-tampered videos, 170 frame insertion cases, 177 frame deletion cases, and 134 frame duplication cases correctly classified, while misclassifications are minimal and mainly occur between similar tampering types. The ROC curves plot the True Positive Rate against the False Positive Rate for each class, and all curves are close to the top-left corner, demonstrating excellent separability. The AUC scores are 0.988 for Non-Tampered, 0.995 for Frame Insertion, 0.987 for Frame Deletion, and 0.977 for Frame Duplication, confirm that the model achieves near-perfect classification performance across all tampering types.
3.5. Cross Dataset Experimentations
To evaluate the generalizability of the proposed 1D-CNN model beyond its training domain, cross-dataset experiments were conducted on BDD-A [32] and VIRAT [33] datasets. On the unseen 15% test set of D²-City, the model achieved an accuracy of 94.4%, precision of 92.7%, recall of 96.4%, and F1 score of 94.5%, with an AUC of 0.992, indicating strong discrimination between original and tampered frames. On BDD-A, which comprises diverse urban driving scenarios with different camera viewpoints and scene dynamics, the model obtained an accuracy of 63.57%, precision of 67.53%, recall of 52.26%, and F1 score of 58.92%. While these results indicate a moderate drop in performance, they highlight the impact of domain shifts on frame deletion detection. Evaluation on VIRAT, containing static surveillance and aerial videos, resulted in an accuracy of 74.72%, precision of 76.36%, recall of 71.59%, and F1 score of 73.90%. The higher precision relative to recall indicates that the model is conservative in misclassifying untampered frames, but some tampered frames are missed due to differing motion patterns and scene characteristics. Overall, these experiments demonstrate that the proposed model performs exceptionally well within its intended domain, generalizes moderately to other driving datasets, and shows partial generalization to surveillance-type footage. The results underscore the importance of domain characteristics and suggest that domain adaptation, data augmentation, or incorporation of additional spatial-temporal features could further improve robustness across heterogeneous video domains.
3.6. Ablation Study
To examine how architectural design choices affect the performance of the proposed 1D-CNN video–tampering detector, we conducted a controlled ablation study varying three key hyperparameters: (i) convolutional kernel size ∈ {3, 5, 7}, (ii) number of convolutional blocks ∈ {1, 2}, and (iii) dropout rate ∈ {0.3, 0.5}. Each configuration was trained independently for three random seeds (42, 123, 2024), and all results are reported as mean ± standard deviation across the seeds. The dataset splits used for each task correspond exactly to those described in Section 3.1, Section 3.2, Section 3.3 and Section 3.4. The ablation grid produced a total of 12 configurations per task and 144 training runs across all four tasks (deletion, insertion, duplication, and multiclass).
Across all tasks, the ablation results show high stability, with extremely small inter-seed variance (std ≤ 0.0048), confirming that the model consistently converges regardless of initialization. The results also reveal several clear patterns:
3.6.1. Depth (Number of Conv1D Blocks) is the Dominant Factor Affecting Accuracy
Configurations with two Conv1D+Pool blocks consistently outperform those with a single block across all tasks. This pattern is particularly strong for deletion and multiclass detection, where one-block models underperform by 2–4% in F1 score. The improvement arises from deeper temporal abstraction and a larger effective receptive field.
3.6.2. Kernel Sizes 5 and 7 Outperform Kernel Size 3 Across All Datasets
Smaller kernels (k = 3) capture too narrow a temporal context, leading to reduced separability between original and tampered frame-difference sequences. In contrast, k = 5 and k = 7 achieve consistently higher F1 scores, with the optimal choice varying slightly by task:
- Frame deletion: kernel = 7 gives the strongest performance (0.9903 ± 0.0017).
- Frame insertion: kernel = 5 yields the highest stability and accuracy (0.9927 ± 0.0016).
- Frame duplication: kernel = 5 achieves the best F1 (0.9577 ± 0.0048).
- Multiclass: kernel = 5 achieves the most stable and accurate results (0.9824 ± 0.0010).
Thus, kernels in the range {5, 7} provide the best balance of temporal context and computational cost.
3.6.3. Dropout Moderately Influences Generalization, but no Extreme Sensitivity is Observed
Both dropouts 0.3 and 0.5 yield strong, nearly identical performance, with a slight preference depending on task:
- 0.5 is more robust for deletion and multiclass detection.
- 0.3 gives marginally better stability on insertion and duplication.
Importantly, performance differences are small (≤0.003), confirming that the model’s generalization ability is not highly sensitive to moderate dropout variations.This is consistent with the baseline model (Section 3.1, Section 3.2, Section 3.3 and Section 3.4), which uses dropout = 0.6 and achieved 94.6% accuracy and 94.7 F1 score.
3.6.4. Efficiency is Stable Across Architectural Variations
Inference times vary only slightly with architecture, ranging between 0.0522–0.0703s per 10-second video, and model size remains ~12 MB for all configurations.This indicates that the performance gains from deeper or wider receptive fields do not come with meaningful computational penalties.
3.6.5. Best Configurations Per Task
Table 2 shows the summary of best configuration per task, the results are closely aligned with the structure of the baseline model (two Conv1D blocks with kernel size 5; Section 3.1, Section 3.2, Section 3.3 and Section 3.4), which achieved 94.6% accuracy and 94.7% F1 in the deletion setting. Note that the original baseline model was developed prior to the ablation study; therefore, some ablation configurations obtain slightly higher performance. This does not contradict the baseline results but rather highlights that the architecture is robust and that several alternative configurations also achieve strong accuracy.
3.7. Efficiency Analysis
We evaluated the runtime and memory efficiency of the proposed 1D-CNN framework across all four experimental configurations: frame deletion detection, frame insertion detection, frame duplication detection, and multiclass tampering classification. The results, summarized in Table 3, demonstrate that the inference stage is consistently lightweight across all scenarios.
The model required only 0.0550–0.0557 seconds per video, corresponding to 17.96–18.17 FPS, confirming real-time or near–real-time capability on standard CPU hardware. Preprocessing, consisting of grayscale conversion, resizing, thresholding, and frame-difference extraction, dominated the total runtime and required 1.16–1.36 s per video, depending on the tampering type. Memory overhead during inference was minimal (0.0129–0.0188 MB on average) with peak memory allocation between 0.3867 MB and 1.8867 MB, demonstrating that the model remains computationally efficient and scalable even when processing more challenging manipulation patterns (e.g., duplication).
The multiclass classifier, despite operating on the largest test set (N = 1080), achieved the fastest inference time (0.0550 s) and the highest FPS (18.17), indicating that the model’s computational footprint remains stable regardless of the classification complexity. While more complex architectures such as LSTM and 3D-CNN can capture richer temporal dynamics, they generally require significantly higher resources, with prior studies reporting inference speeds below 5–10 FPS and memory consumption exceeding several hundred MBs [34,35]. In contrast, the proposed 1D-CNN offers a lightweight yet accurate solution, balancing performance with practical efficiency.
4. Discussion
The experimental results demonstrate that the proposed 1D-CNN framework combined with frame-difference features provides an effective and computationally efficient solution for detecting temporal video tampering in automotive dashcam footage. Compared to prior studies that rely on handcrafted descriptors such as PFOV, Haralick features, or motion vectors [6,10,28], our approach achieves superior accuracy while maintaining a lightweight architecture suitable for real-time deployment. The high detection rates for frame insertion (98.9%), deletion (94.4%), and duplication (92.4%) confirm that abrupt changes in frame-difference magnitudes are strong indicators of tampering, consistent with earlier findings on temporal inconsistency analysis [3,7].
The multiclass classification experiment further validates the robustness of the proposed model, achieving 92.8% accuracy across four categories. This performance compares favorably with complex architectures such as CNN–LSTM or 3D-CNN models, which often require significantly higher computational resources and exhibit slower inference speeds [14,15]. Our efficiency analysis highlights that inference time remains stable at approximately 0.055 s per video, corresponding to 18 FPS on CPU hardware, and memory overhead is minimal (<0.02 MB). These results underscore the practical applicability of the proposed method for forensic and IoT-enabled automotive systems where computational budgets are constrained.
Cross-dataset evaluations reveal important insights into generalization. While the model performs exceptionally well on D²-City, accuracy drops to 63.6% on BDD-A and 74.7% on VIRAT. Interestingly, performance on VIRAT (a surveillance dataset) surpasses BDD-A despite the latter being a driving dataset. This suggests that static surveillance scenes amplify deletion artifacts, whereas dynamic driving environments introduce motion complexity that masks tampering patterns. These findings align with prior observations that domain-specific characteristics, such as frame rate, compression, and scene dynamics, significantly influence tampering detection [12,13]. Future work should explore domain adaptation strategies, such as adversarial training or feature normalization, and incorporate spatial-temporal cues to improve robustness across heterogeneous video sources.
Generalization remains a challenge due to domain diversity in driving datasets. Future work should incorporate domain adaptation, self-supervised pretraining, and integration of optical flow or motion vectors.
5. Conclusions
This study presents a lightweight deep learning framework for detecting temporal video tampering in dashcam footage using frame-difference features and a 1D-CNN architecture. The proposed method achieves high accuracy for insertion, deletion, and duplication detection while maintaining low computational cost and near real-time inference capability on standard CPU hardware. Multiclass classification experiments confirm the model’s robustness across multiple tampering types, and efficiency analysis demonstrates its suitability for practical deployment.
Cross-dataset evaluations highlight the impact of domain variability on detection performance, emphasizing the need for domain adaptation and enhanced feature representation to improve generalization. Future research should focus on optimizing preprocessing pipelines, leveraging GPU acceleration, and exploring hybrid architectures that combine temporal and spatial cues. Overall, the proposed approach contributes to advancing video forensics and automotive cybersecurity by providing an accurate, efficient, and scalable solution for temporal tampering detection.
Supplementary Materials
The following supporting information can be downloaded at: https://doi.org/10.5281/zenodo.17696973 Figure S1: Example frame difference plots for tampered and original videos; Table S1: Detailed ablation study results for kernel size, depth, and dropout configurations; Video S1: Demonstration of frame deletion tampering detection; Video S2: Demonstration of frame insertion tampering detection; Video S3: Demonstration of frame duplication tampering detection; Script S1: Jupyter notebook for multiclass tampering detection (1DCNN Multi Class Classification.ipynb); Script S2: Jupyter notebook for frame deletion detection (1DCNN_Frame Deletion Detection.ipynb); Script S3: Jupyter notebook for frame insertion detection (1DCNN_Frame Insertion Detection.ipynb); Script S4: Jupyter notebook for frame duplication detection (1DCNN_Frame Duplication Detection.ipynb); Script S5: Dataset generation script for tampered videos (video_frame_deletion_insertion_duplication_generator.ipynb); Data S1: Readme_data.txt and README.txt describing dataset structure and usage; Other: requirements.txt listing Python dependencies.
Author Contributions
Conceptualization, Ali Rehman Shinwari and Uswah Binti Khairuddin; methodology, Ali Rehman Shinwari; model development, Ali Rehman Shinwari; model evaluation, Ali Rehman Shinwari, Uswah Binti Khairuddin and Mohamad Fadzli Bin Haniff; formal analysis, Ali Rehman Shinwari; investigation, Ali Rehman Shinwari; resources, Uswah Binti Khairuddin; data preprocessing, Ali Rehman Shinwari; writing original draft preparation, Ali Rehman Shinwari; review and editing, Uswah Binti Khairuddin and Mohamad Fadzli Bin Haniff; visualization, Ali Rehman Shinwari; supervision, Uswah Binti Khairuddin; project administration, Uswah Binti Khairuddin. All authors have read and agreed to the published version of the manuscript.
Funding
This research received no external funding.
Institutional Review Board Statement
Not applicable. The study used publicly available, de-identified datasets (D²-City, BDD-A, and VIRAT), and no human subjects were directly involved.
Informed Consent Statement
Not applicable.
Data Availability Statement
Supplementary data, scripts, and videos supporting this study are openly available at Zenodo under the Creative Commons Attribution 4.0 license, DOI: https://doi.org/10.5281/zenodo.17696973.
Acknowledgments
During the preparation of this manuscript, the authors used Microsoft Copilot (GPT-5 model) for the purposes of [e.g., language refinement, and code assistance]. The authors have reviewed and edited the output and take full responsibility for the content of this publication.
Conflicts of Interest
The authors declare no conflicts of interest.
Abbreviations
The following abbreviations are used in this manuscript:
| CNN | Convolutional Neural Network |
| 1D CNN | One-Dimensional Convolutional Neural Network |
| IoT | Internet of Things |
| ROC | Receiver Operating Characteristic |
| AUC | Area Under the Curve |
| FPS | Frames Per Second |
| PFOV | Pseudo Flow Orientation Variation |
| LBP | Local Binary Pattern |
| SIFT | Scale-Invariant Feature Transform |
| RANSAC | RANSAC: Random Sample Consensus |
| KPCA | Kernel Principal Component Analysis |
| GRU | Gated Recurrent Unit |
| LSTM | Long Short-Term Memory |
| DCT | Discrete Cosine Transform |
| IRB | Institutional Review Board |
References
- Giovannini, E; Giorgetti, A; Pelletti, G; et al. Importance of dashboard camera (Dash Cam) analysis in fatal vehicle–pedestrian crash reconstruction. Forensic Sci Med Pathol 2021, 17, 379–387. [Google Scholar] [CrossRef]
- Singh, RD; Aggarwal, N. Video content authentication techniques: a comprehensive survey. Multimed Syst 2018, 24, 211–240. [Google Scholar]
- Wang, Q; Li, Z; Zhang, Z; et al. Video Inter-Frame Forgery Identification Based on Consistency of Correlation Coefficients of Gray Values. Journal of Computer and Communications 2014, 02, 51–57. [Google Scholar] [CrossRef]
- Zhang, Z; Hou, J; Ma, Q; et al. Efficient video frame insertion and deletion detection based on inconsistency of correlations between local binary pattern coded frames. Security and Communication Networks 2015, 8, 311–320. [Google Scholar] [CrossRef]
- Kingra, S; Aggarwal, N; Singh, RD. Inter-frame forgery detection in H.264 videos using motion and brightness gradients. Multimed Tools Appl 2017, 76, 25767–25786. [Google Scholar] [CrossRef]
- Li, S; Huo, H. Frame deletion detection based on optical flow orientation variation. IEEE Access 2021, 9, 37196–37209. [Google Scholar] [CrossRef]
- Jin, X; Su, Y; Jing, P. Video frame deletion detection based on time–frequency analysis. J Vis Commun Image Represent, 2022; 83, Epub ahead of print. [Google Scholar] [CrossRef]
- Bakas, J; Naskar, R; Bakshi, S. Detection and localization of inter-frame forgeries in videos based on macroblock variation and motion vector analysis. Computers and Electrical Engineering, 2021; 89, Epub ahead of print. [Google Scholar] [CrossRef]
- Shelke, NA; Kasana, SS. Multiple forgeries identification in digital video based on correlation consistency between entropy coded frames. Multimed Syst 2022, 28, 267–280. [Google Scholar] [CrossRef]
- Bakas, J; Naskar, R; Dixit, R. Detection and localization of inter-frame video forgeries based on inconsistency in correlation distribution between Haralick coded frames. Multimed Tools Appl 2019, 78, 4905–4935. [Google Scholar] [CrossRef]
- Fadl, S; Han, Q; Li, Q. CNN spatiotemporal features and fusion for surveillance video forgery detection. Signal Process Image Commun, 2021; 90, Epub ahead of print. [Google Scholar] [CrossRef]
- Gowda, R; Pawar, D. Deep learning-based forgery identification and localization in videos. Signal Image Video Process 2023, 17, 2185–2192. [Google Scholar] [CrossRef]
- Li, S; Huo, H. Continuity-attenuation captured network for frame deletion detection. Signal Image Video Process 2024, 18, 3285–3297. [Google Scholar] [CrossRef]
- Akhtar, N; Hussain, M; Habib, Z. DEEP-STA: Deep Learning-Based Detection and Localization of Various Types of Inter-Frame Video Tampering Using Spatiotemporal Analysis. Mathematics, 2024; 12, Epub ahead of print. [Google Scholar] [CrossRef]
- Shehnaz, Kaur M. Detection and localization of multiple inter-frame forgeries in digital videos. Multimed Tools Appl 2024, 83, 71973–72005. [Google Scholar] [CrossRef]
- Kumar, V; Gaur, M. Multiple forgery detection in video using inter-frame correlation distance with dual-threshold. Multimed Tools Appl 2022, 81, 43979–43998. [Google Scholar] [CrossRef]
- Paing S, Htun Y. Video Inter-frame Forgery Identification by a Statistical Method. In: 2023 International Conference on the Confluence of Advancements in Robotics, Vision and Interdisciplinary Technology Management, IC-RVITM 2023. Institute of Electrical and Electronics Engineers Inc., 2023. Epub ahead of print 2023. [CrossRef]
- Tinipuclla C, Ceron J, Shiguihara P. Frame Deletion Detection in Videos Using Convolutional Neural Networks. In: IEEE Andescon, ANDESCON 2024 - Proceedings. Institute of Electrical and Electronics Engineers Inc., 2024. Epub ahead of print 2024. [CrossRef]
- Singla N, Singh J, Nagpal S. Video Frame Deletion Detection using Correlation Coefficients. In: Proceedings of the 8th International Conference on Signal Processing and Integrated Networks, SPIN 2021. Institute of Electrical and Electronics Engineers Inc., 2021, pp. 796–799.
- Panchal, HD; Shah, HB. Multiple forgery detection in digital video based on inconsistency in video quality assessment attributes. Multimed Syst 2023, 29, 2439–2454. [Google Scholar] [CrossRef]
- Prashant, KJ; Krishnrao, KP. Frame Shuffling Forgery Detection Method for MPEG-Coded Video. Journal of The Institution of Engineers (India): Series B 2024, 105, 635–645. [Google Scholar] [CrossRef]
- Kharat, J; Chougule, S. A passive blind forgery detection technique to identify frame duplication attack. Multimed Tools Appl 2020, 79, 8107–8123. [Google Scholar] [CrossRef]
- Alsakar, YM; Mekky, NE; Hikal, NA. Detecting and Locating Passive Video Forgery Based on Low Computational Complexity Third-Order Tensor Representation. J Imaging, 2021; 7, Epub ahead of print. [Google Scholar] [CrossRef]
- Shelke, NA; Kasana, SS. Multiple forgery detection in digital video with VGG-16-based deep neural network and KPCA. Multimed Tools Appl 2024, 83, 5415–5435. [Google Scholar] [CrossRef]
- Li, S; Huo, H. Frame deletion detection based on optical flow orientation variation. IEEE Access 2021, 9, 37196–37209. [Google Scholar] [CrossRef]
- Kumar, V; Gaur, M; kansal, V. Deep feature based forgery detection in video using parallel convolutional neural network: VFID-Net. Multimed Tools Appl 2022, 81, 42223–42240. [Google Scholar] [CrossRef]
- Oliaei, H; Azghani, M. Video motion forgery detection using motion residual and object tracking. Multimed Tools Appl 2024, 83, 12651–12668. [Google Scholar] [CrossRef]
- Mohiuddin, S; Malakar, S; Sarkar, R. An ensemble approach to detect copy-move forgery in videos. Multimed Tools Appl 2023, 82, 24269–24288. [Google Scholar] [CrossRef]
- Che, Z; Li, G; Li, T; et al. D$^2$-City: A Large-Scale Dashcam Video Dataset of Diverse Traffic Scenarios. 2019. Available online: http://arxiv.org/abs/1904.01975.
- Shelton, J; Kumar, GP. Comparison between Auditory and Visual Simple Reaction Times. Neurosci Med 2010, 01, 30–32. [Google Scholar] [CrossRef]
- Marteniuk RC, Mackenzie CL. Constraints on Human Arm Movement Trajectories*. 1987.
- Xia, Y; Zhang, D; Kim, J; et al. Predicting Driver Attention in Critical Situations. 2018. Available online: http://arxiv.org/abs/1711.06406.
- Oh, S; Hoogs, A; Perera, A; et al. A Large-scale Benchmark Dataset for Event Recognition in Surveillance Video. 2011. Available online: www.viratdata.org.
- Köpüklü, O; Kose, N; Gunduz, A; et al. Resource Efficient 3D Convolutional Neural Networks. 2021. Available online: http://arxiv.org/abs/1904.02422.
- M¨antt¨ari J, Broom´ S, Folkesson J, et al. Interpreting Video Features: A Comparison of 3D Convolutional Networks and Convolutional LSTM Networks. 2020.
Figure 10.
Model loss for frame deletion tampering over epochs.
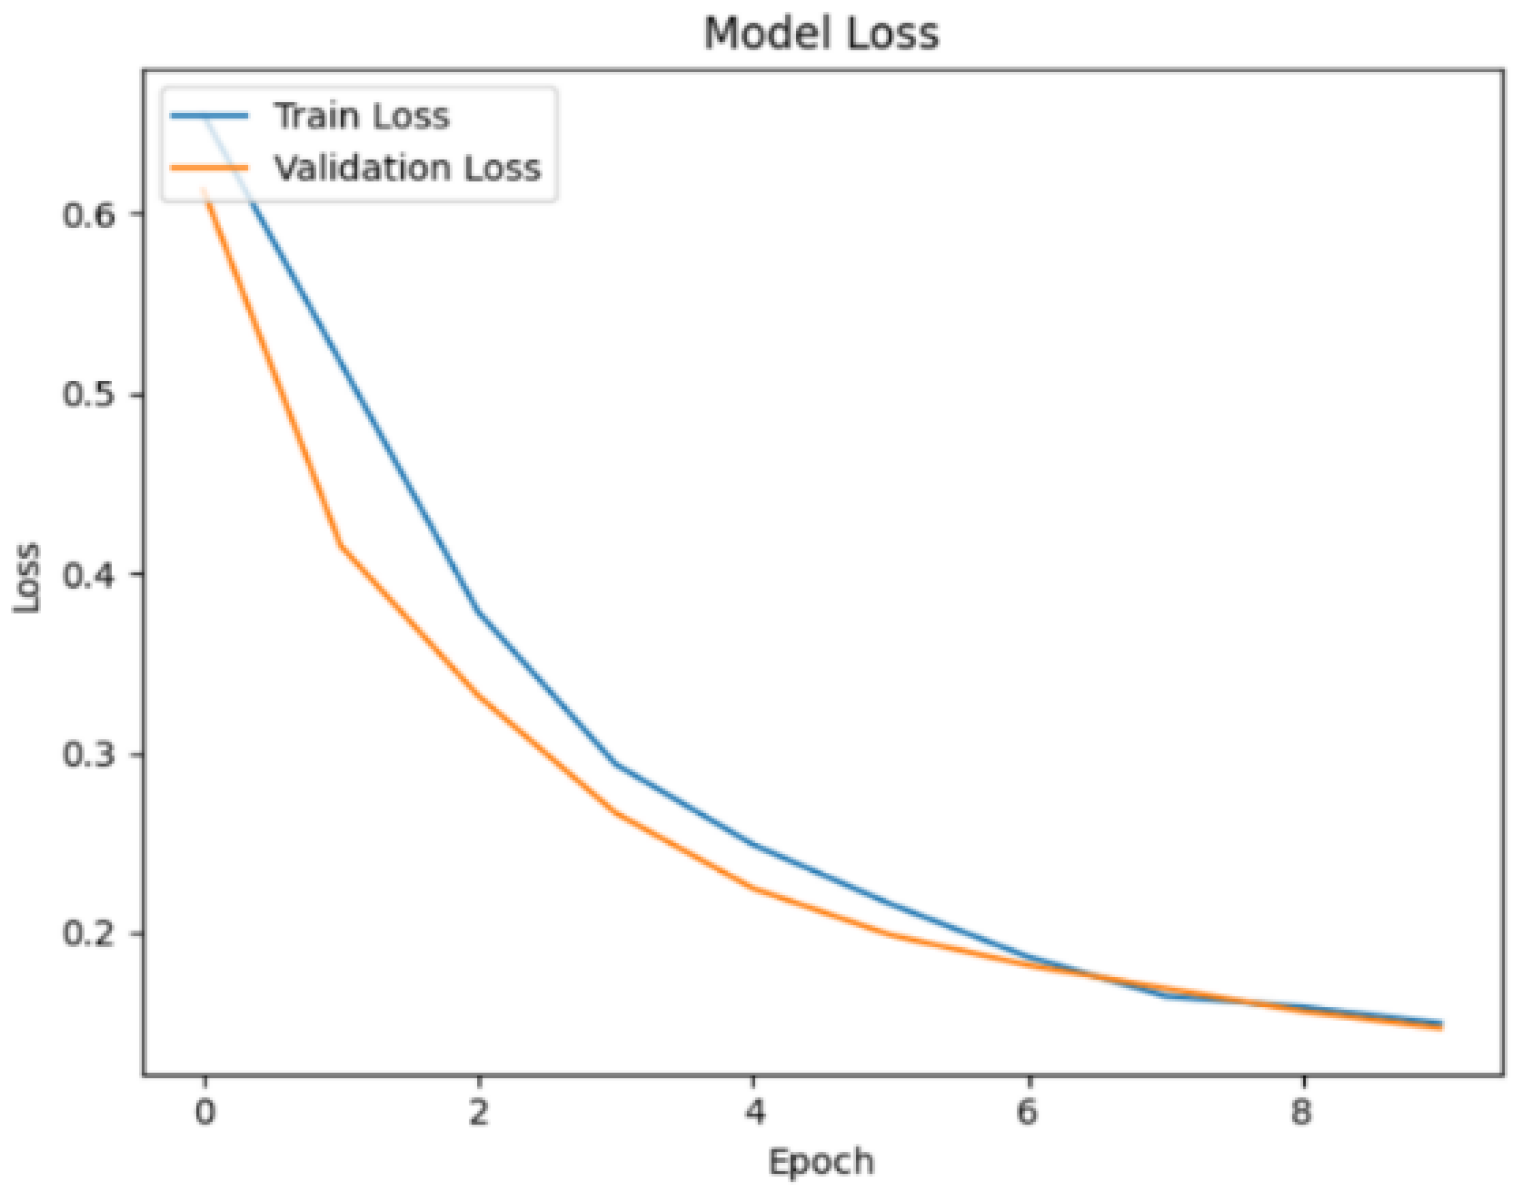
Figure 11.
Confusion Matrix.
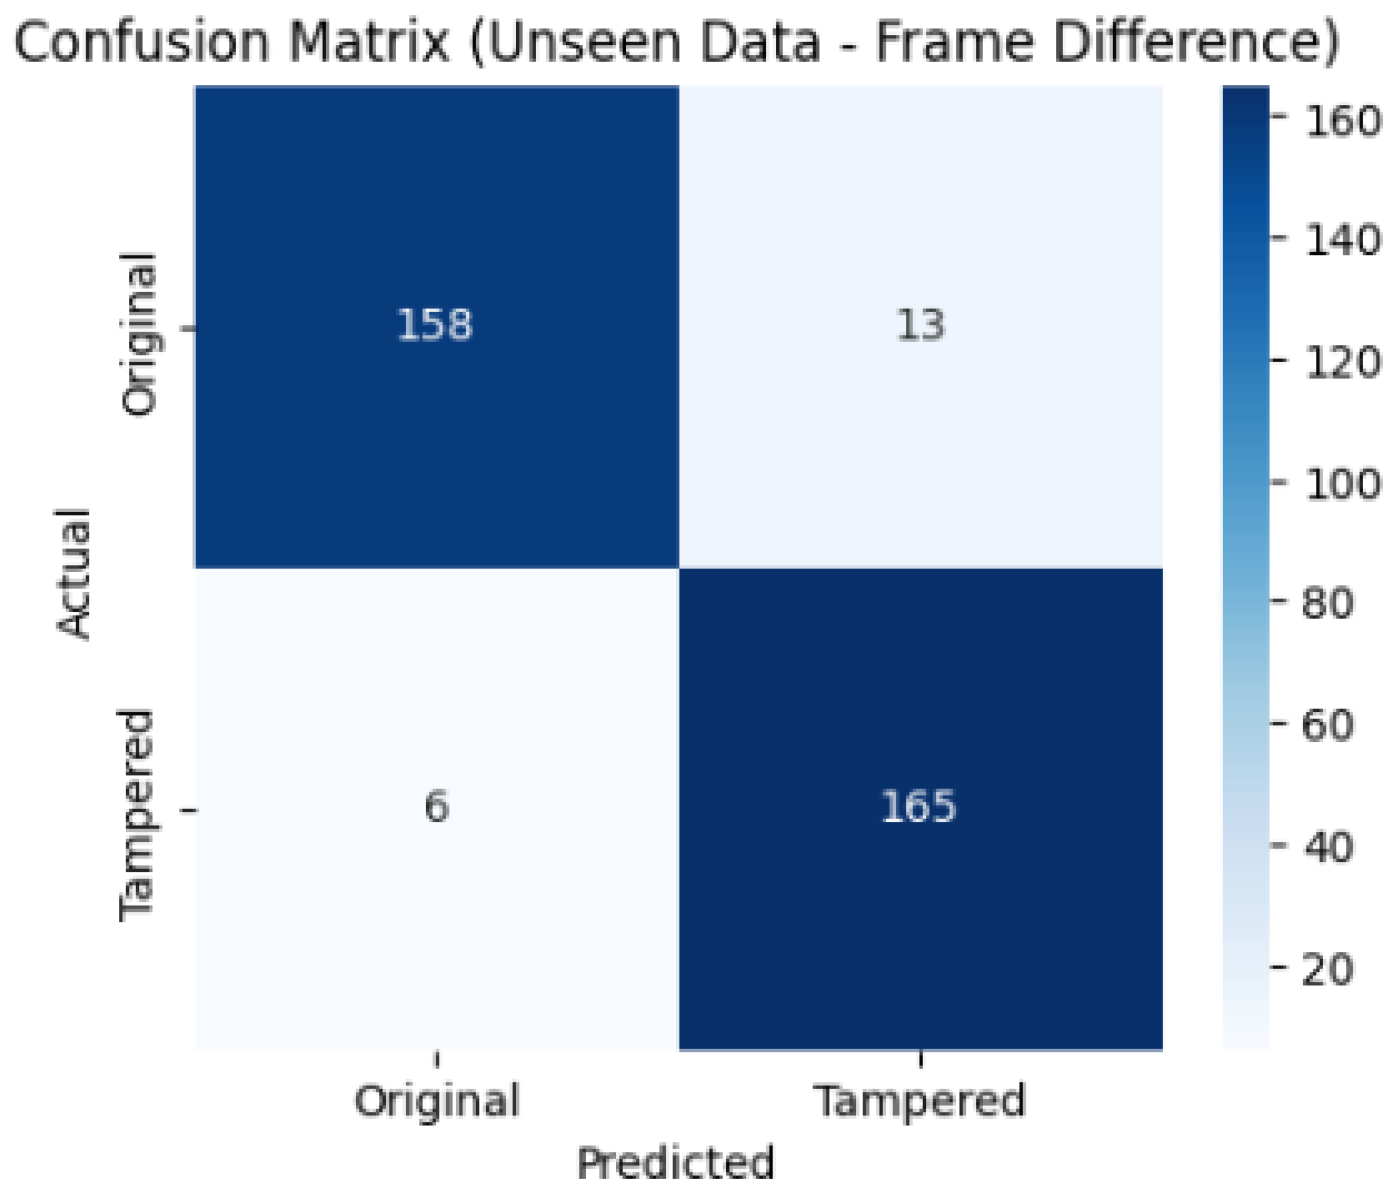
Figure 12.
ROC Curve.
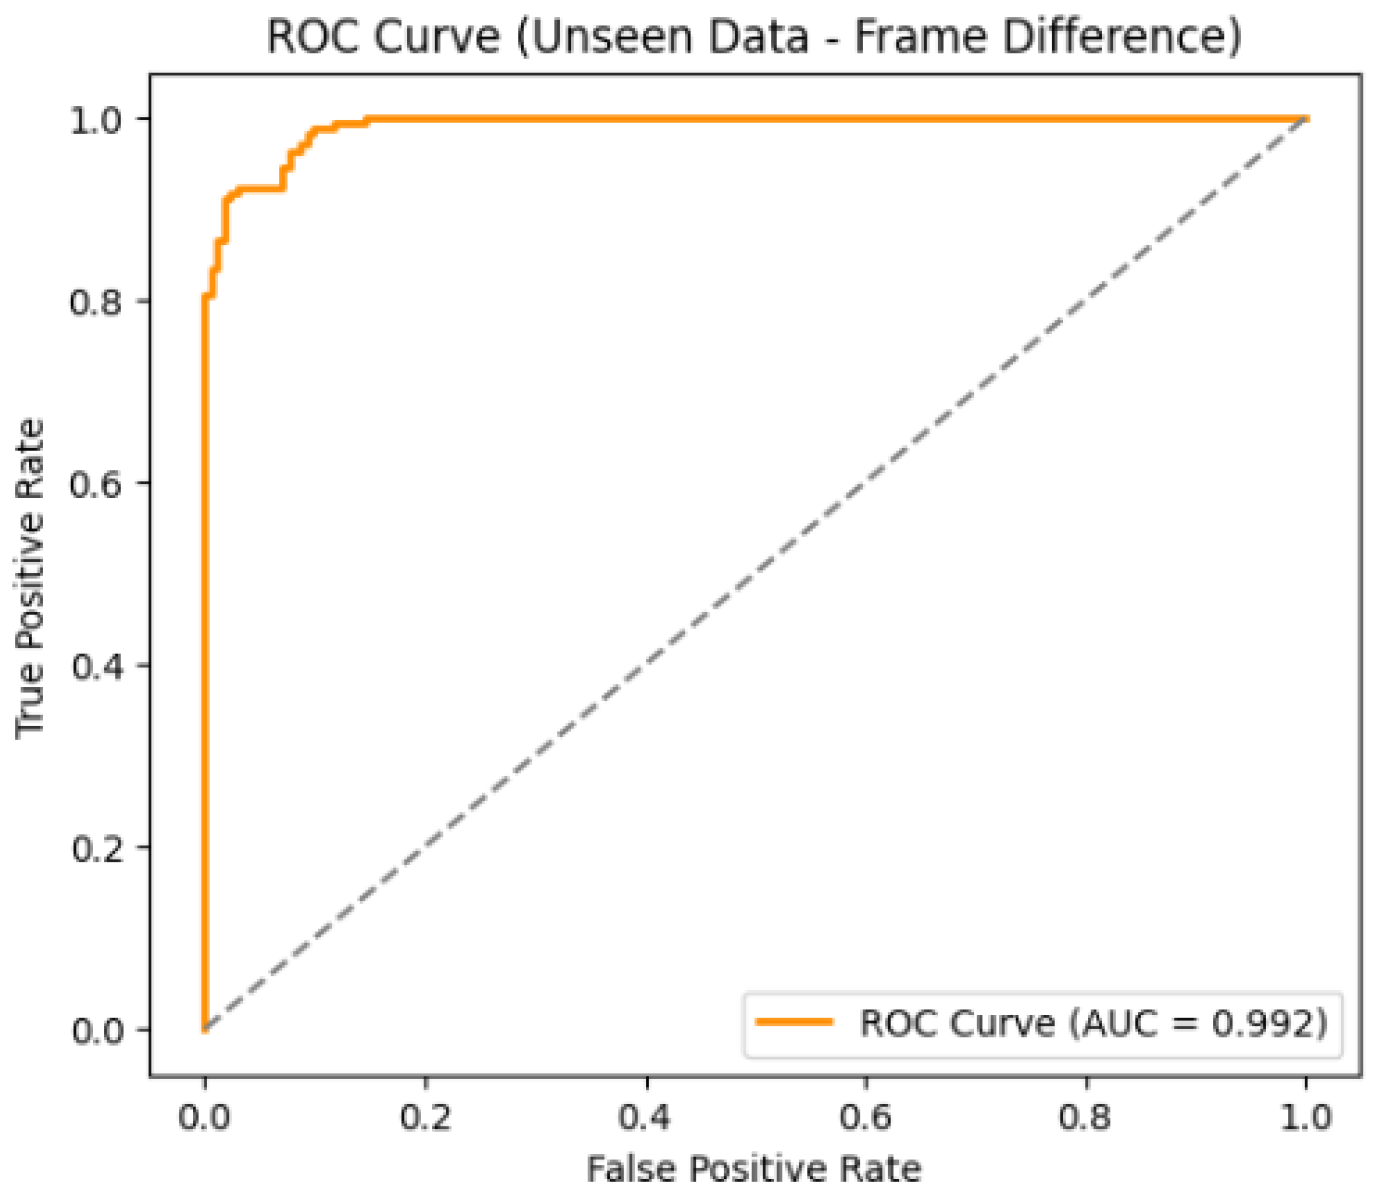
Figure 13.
Training and validation accuracy for frame insertion tampering over epochs.
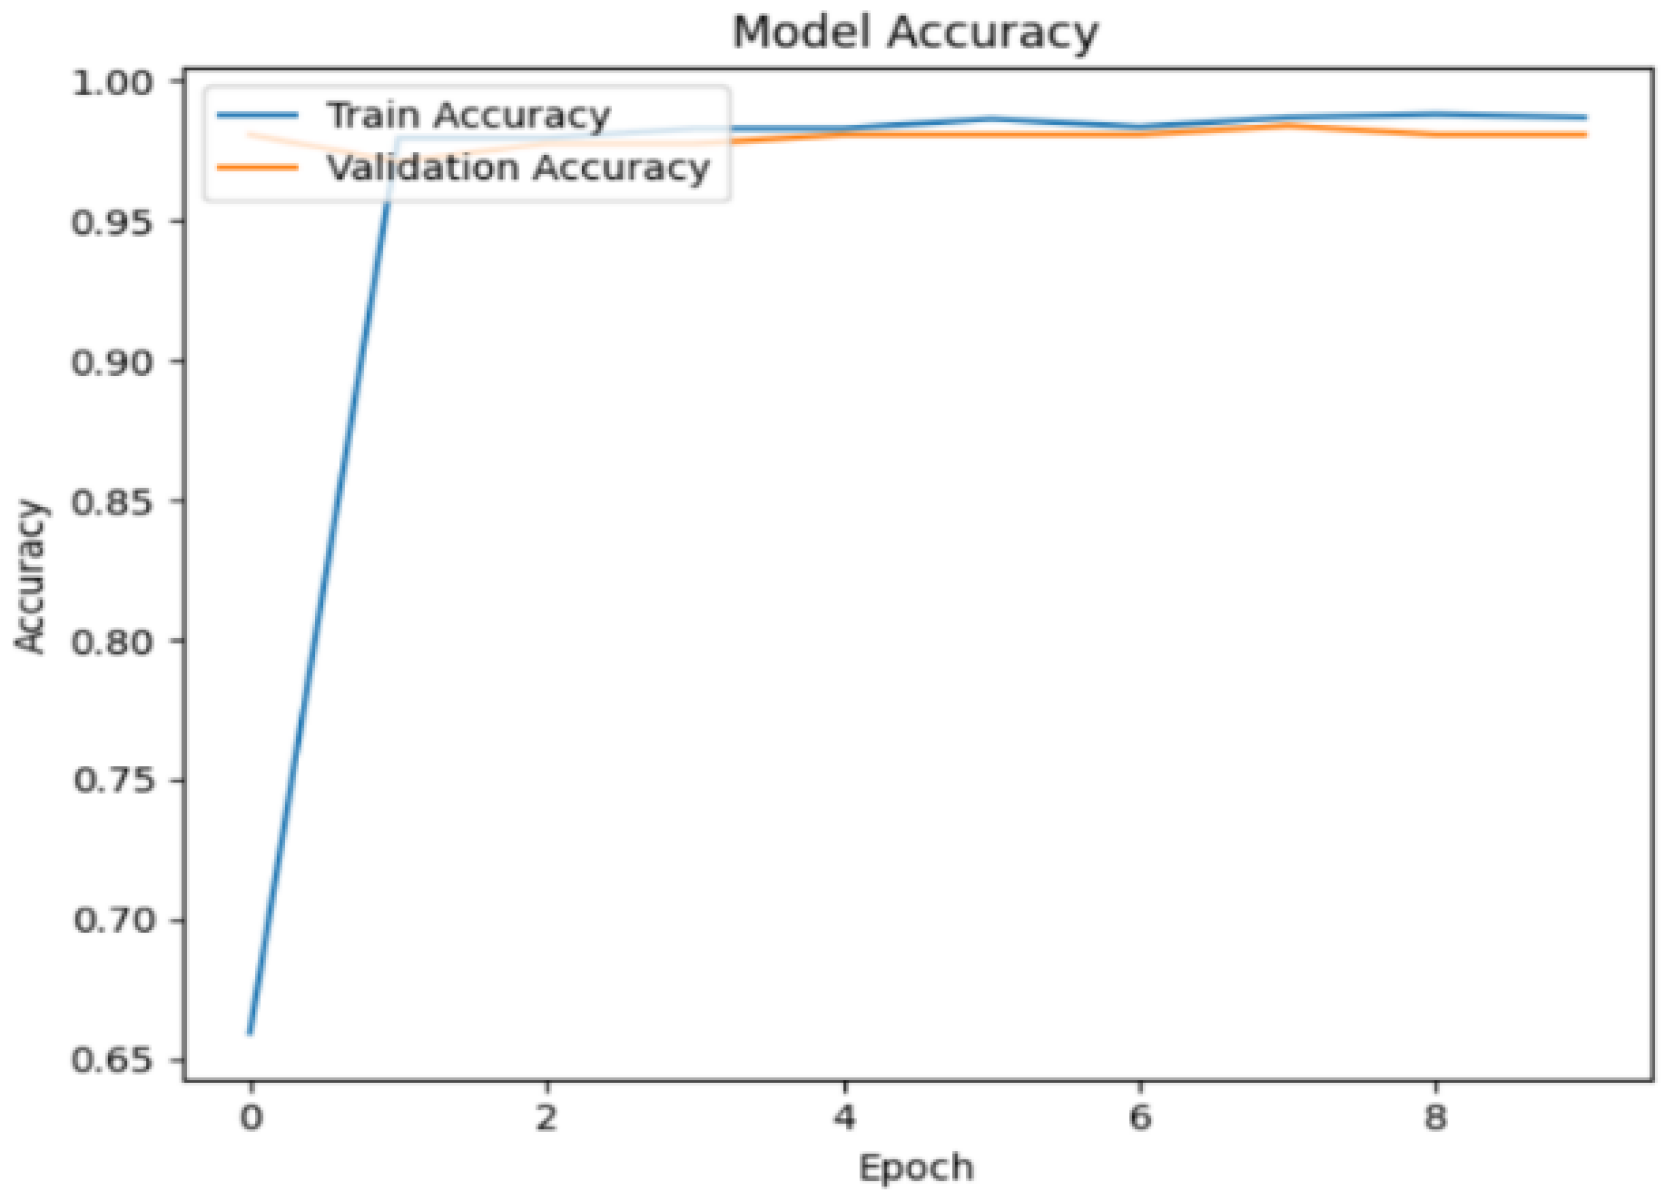
Figure 14.
Model loss for frame insertion tampering over epochs.
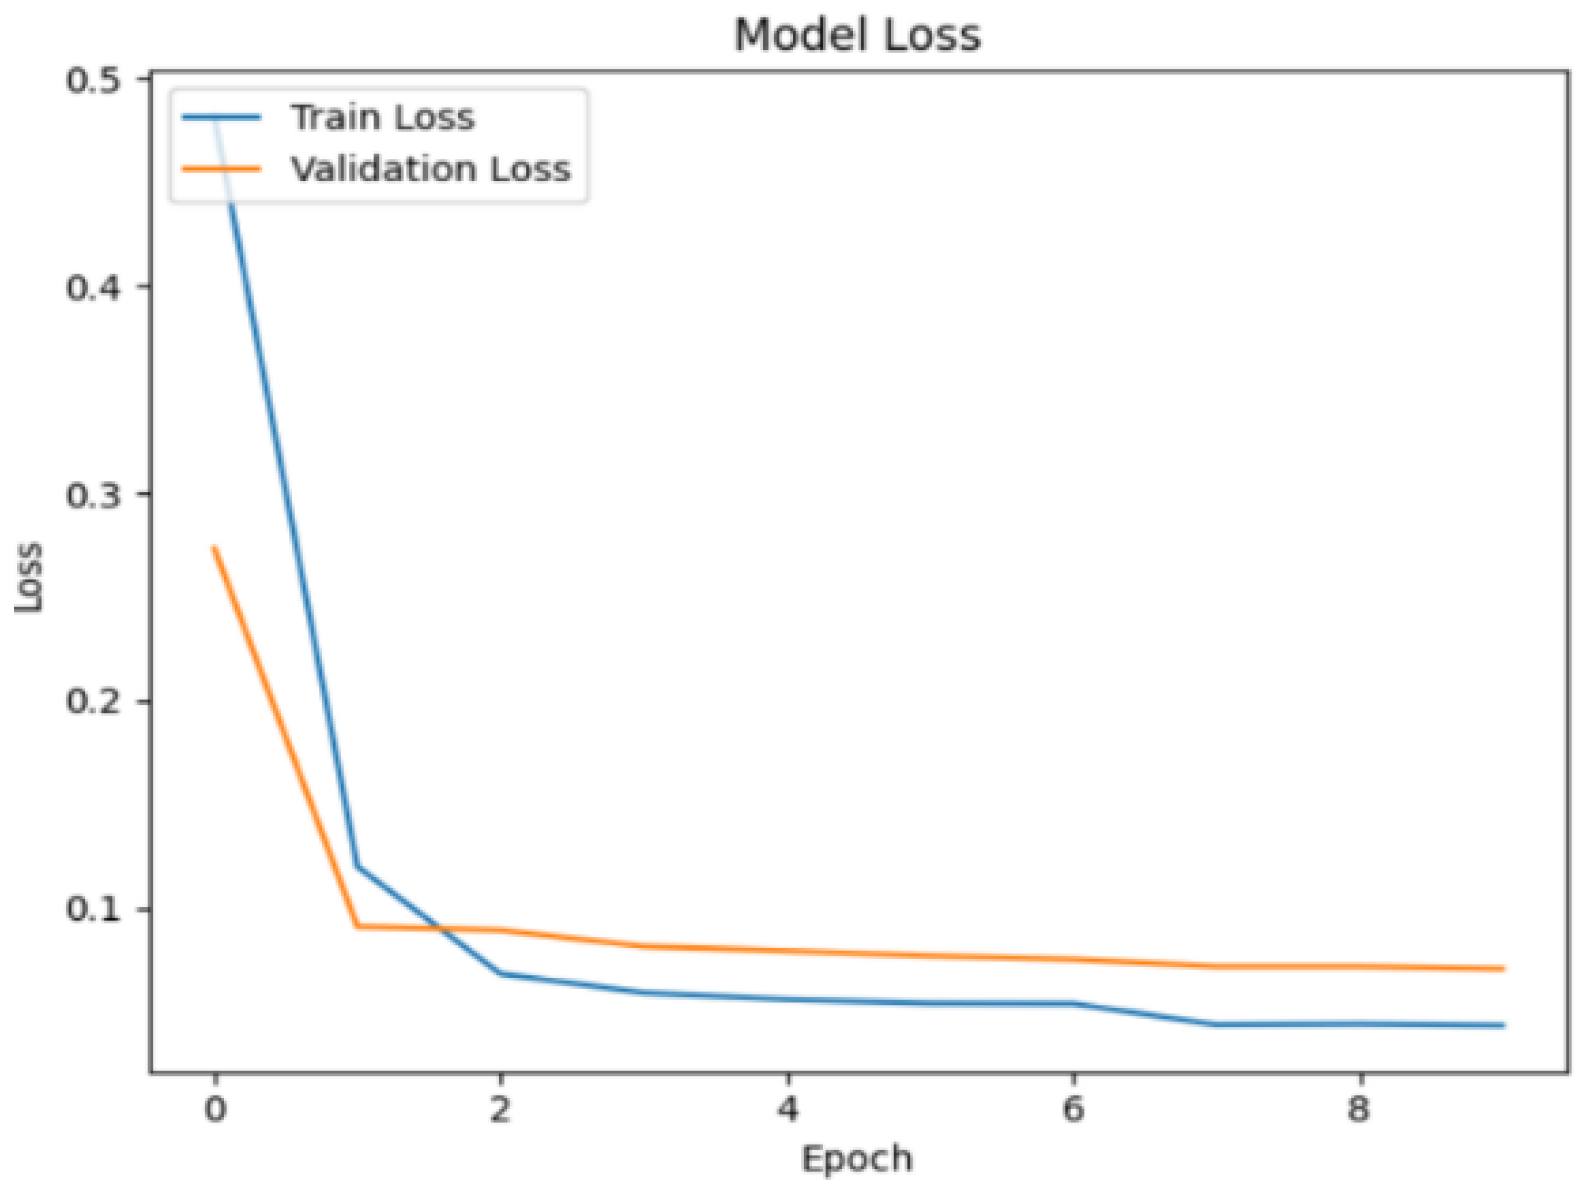
Figure 15.
Confusion Matrix.
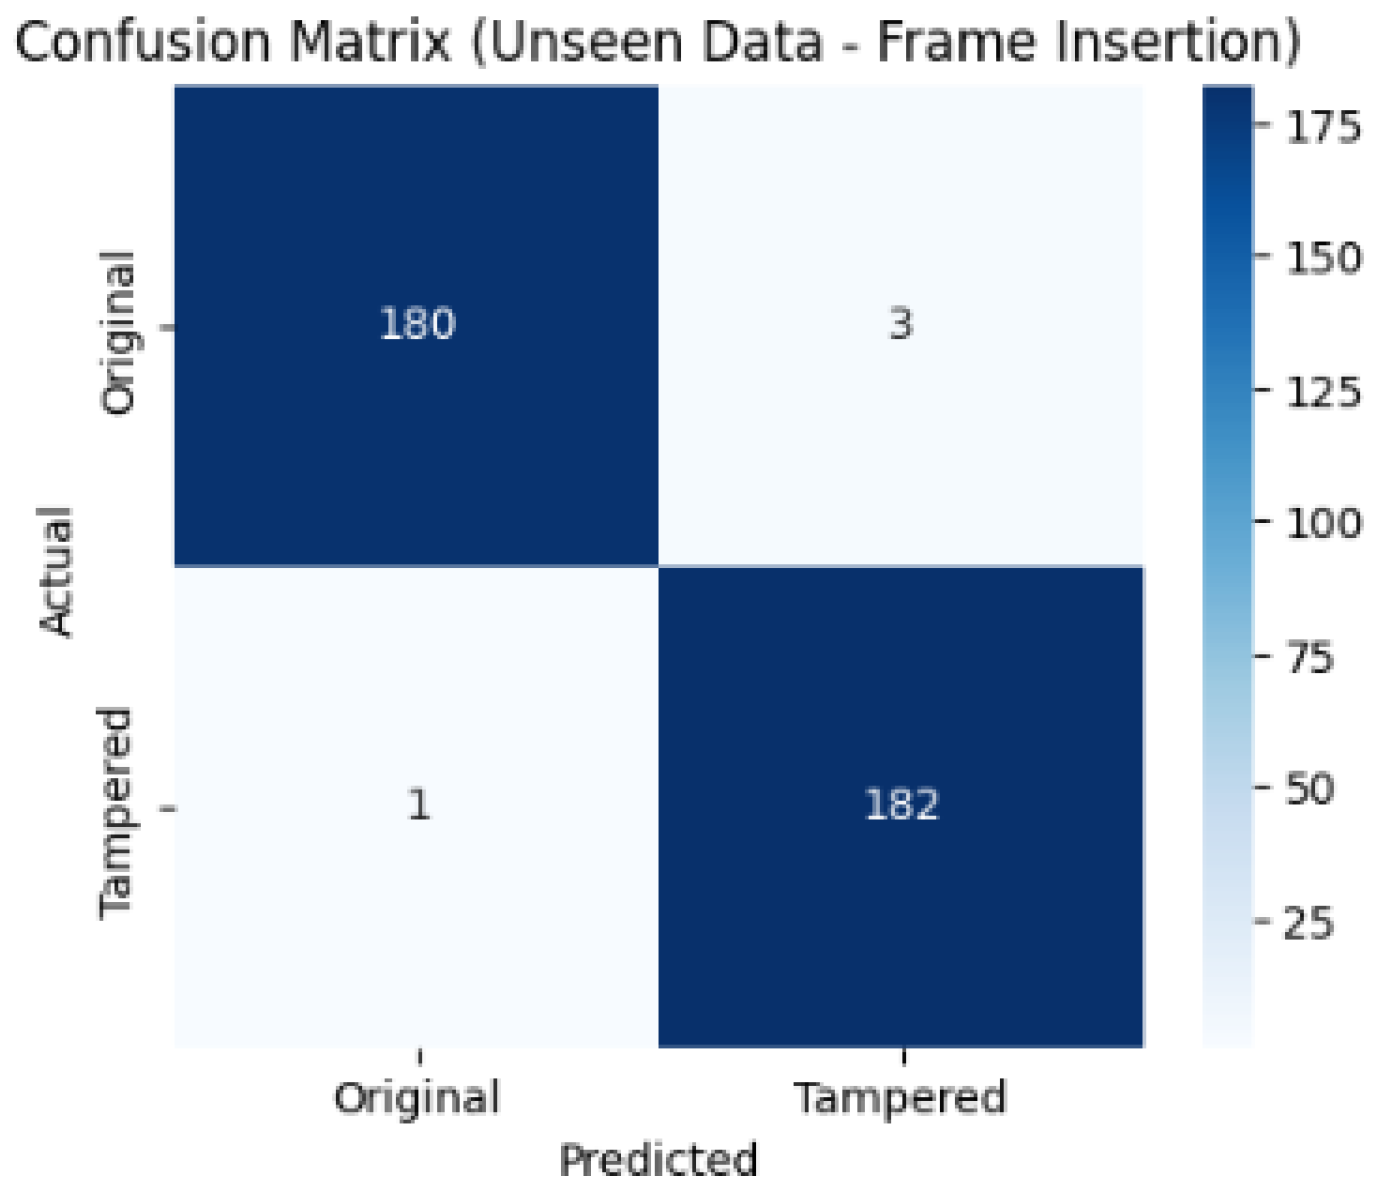
Figure 16.
ROC Curve.
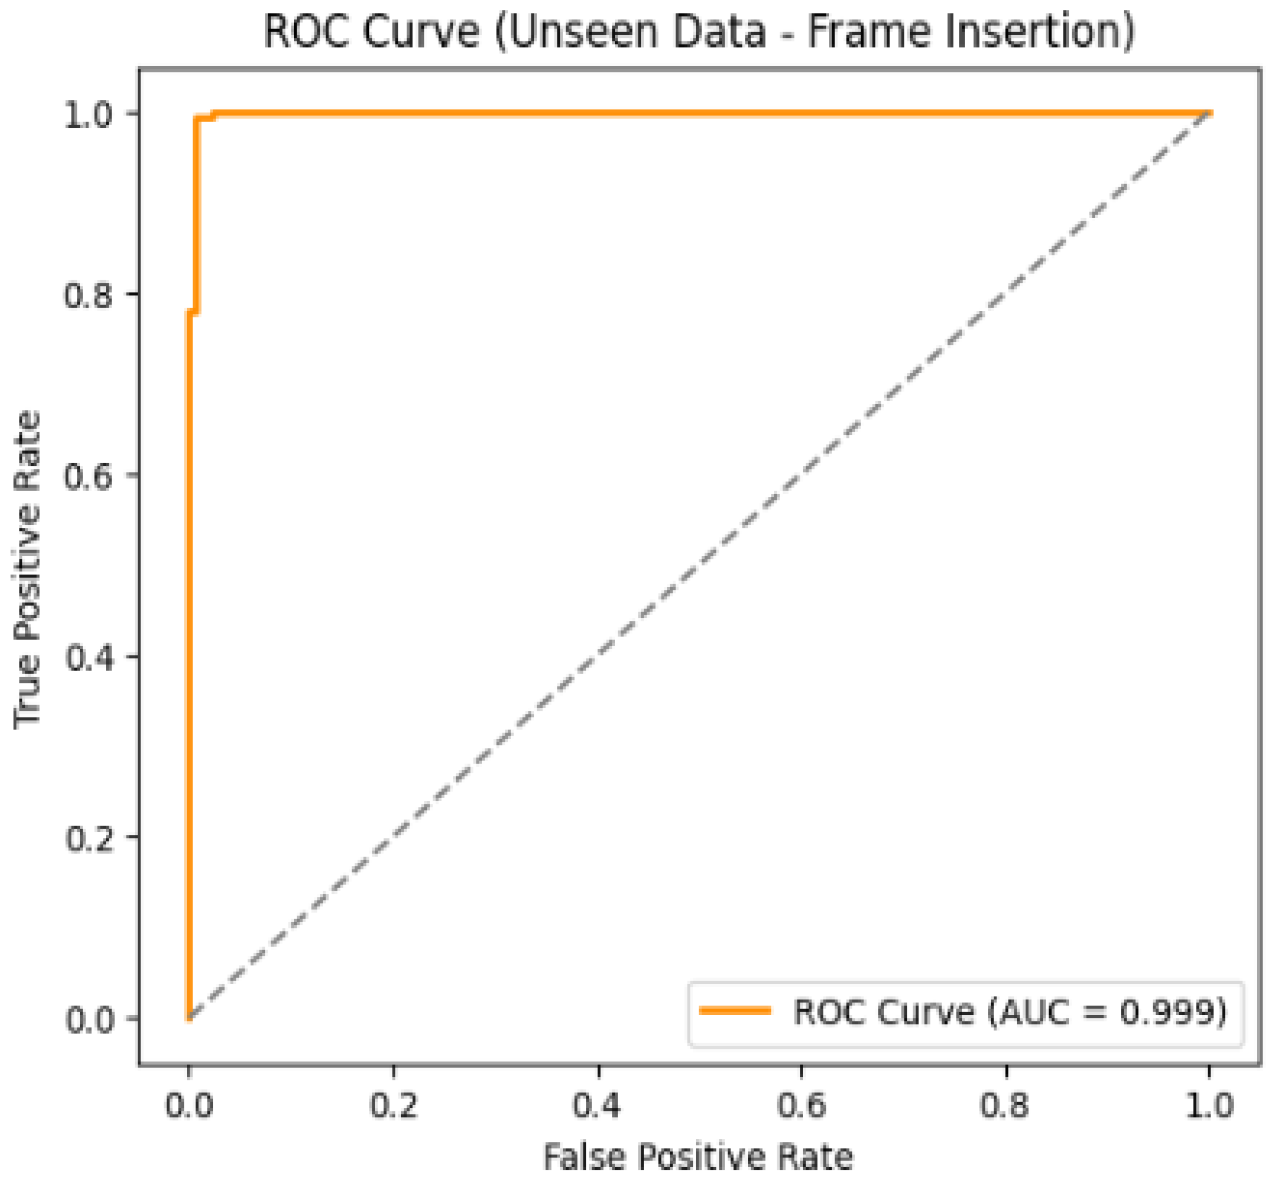
Figure 17.
Training and validation accuracy for frame duplication tampering over epochs.
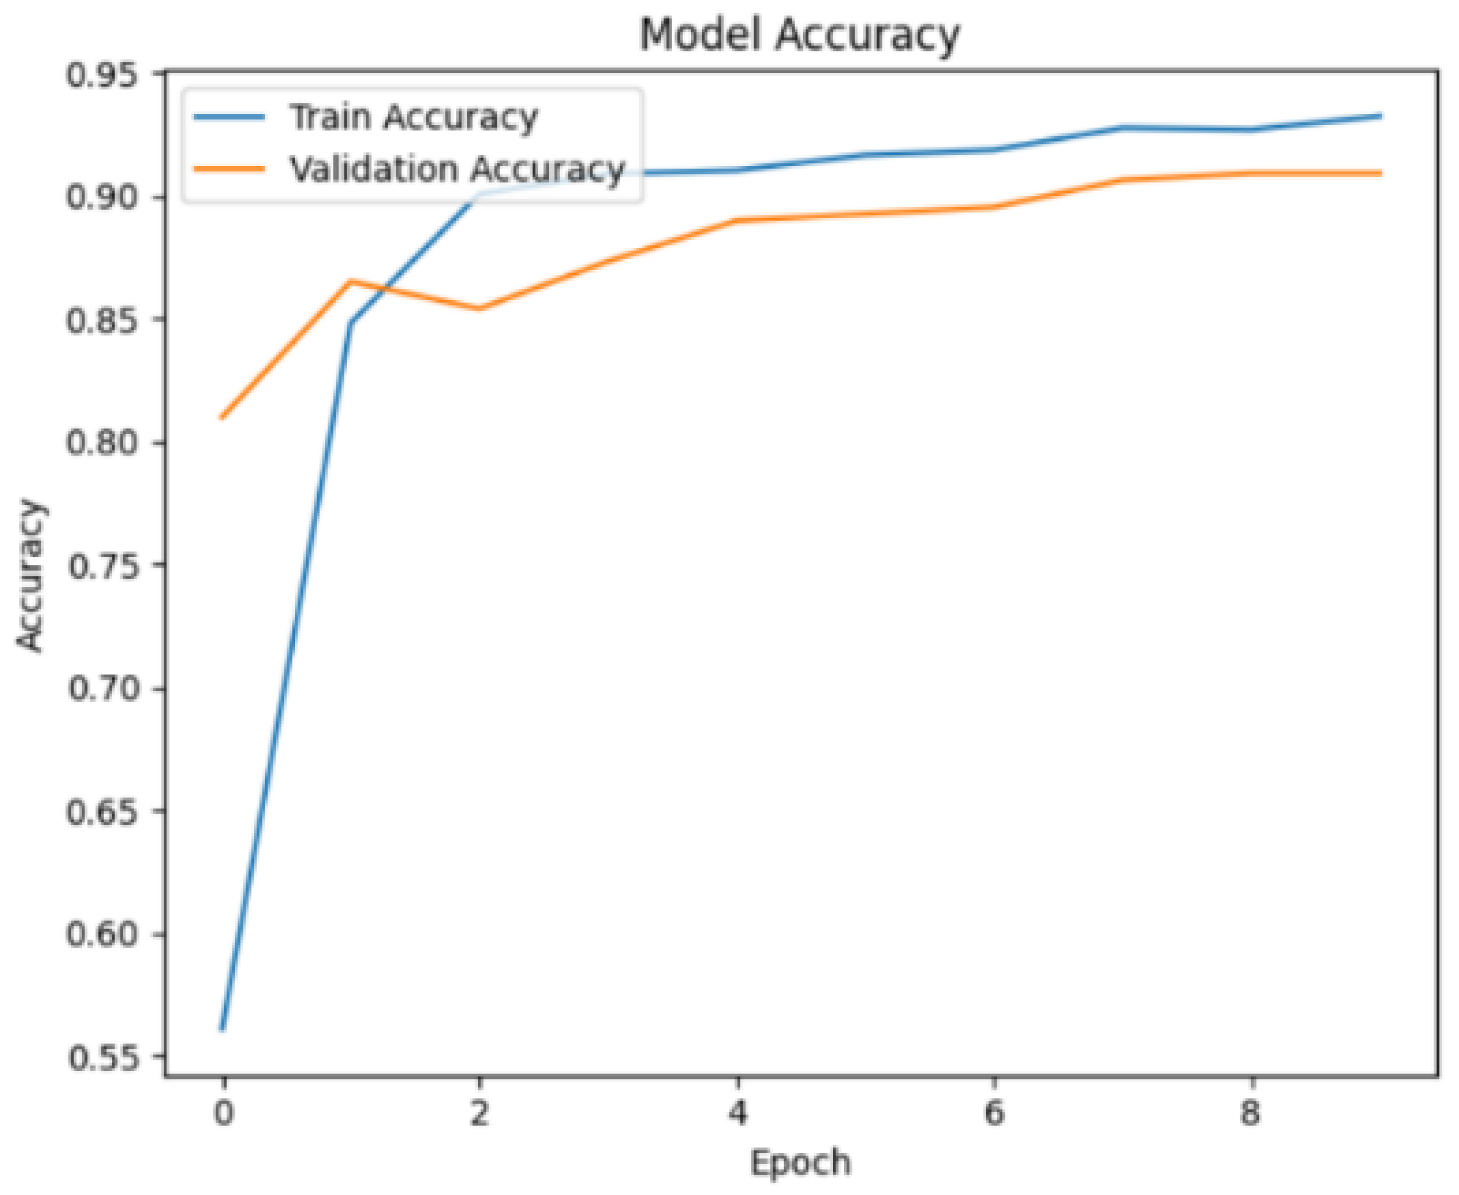
Figure 18.
Model loss for frame duplication tampering over epochs.
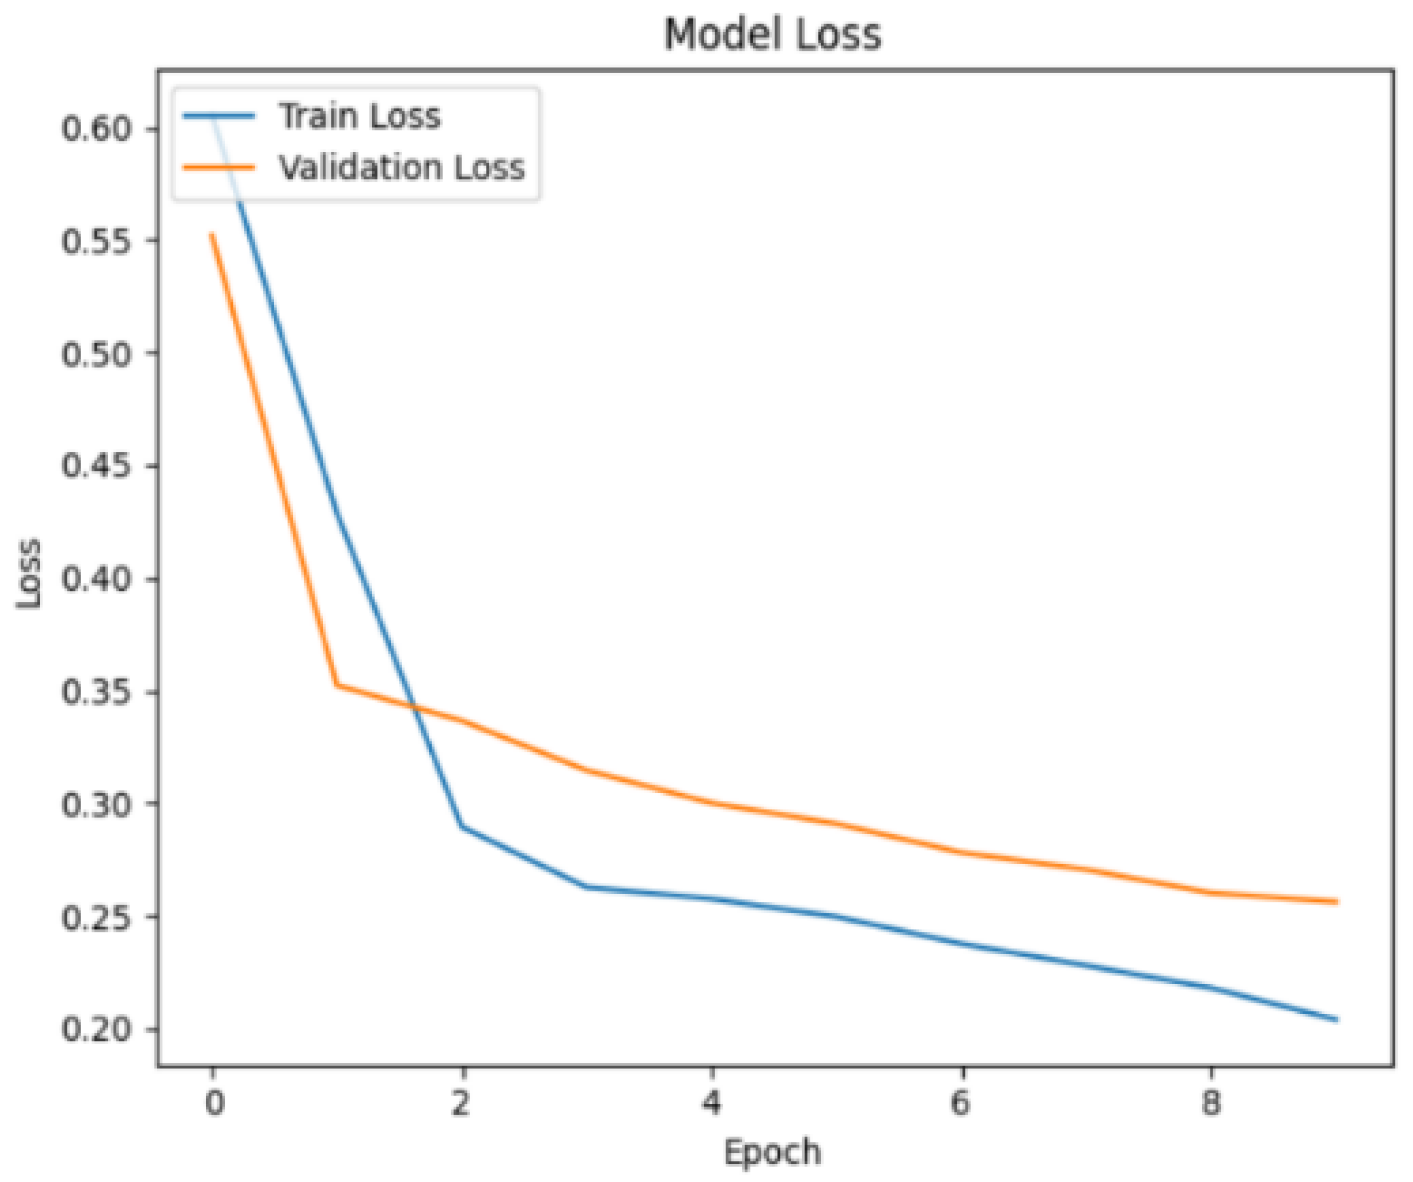
Figure 19.
Confusion matrix.
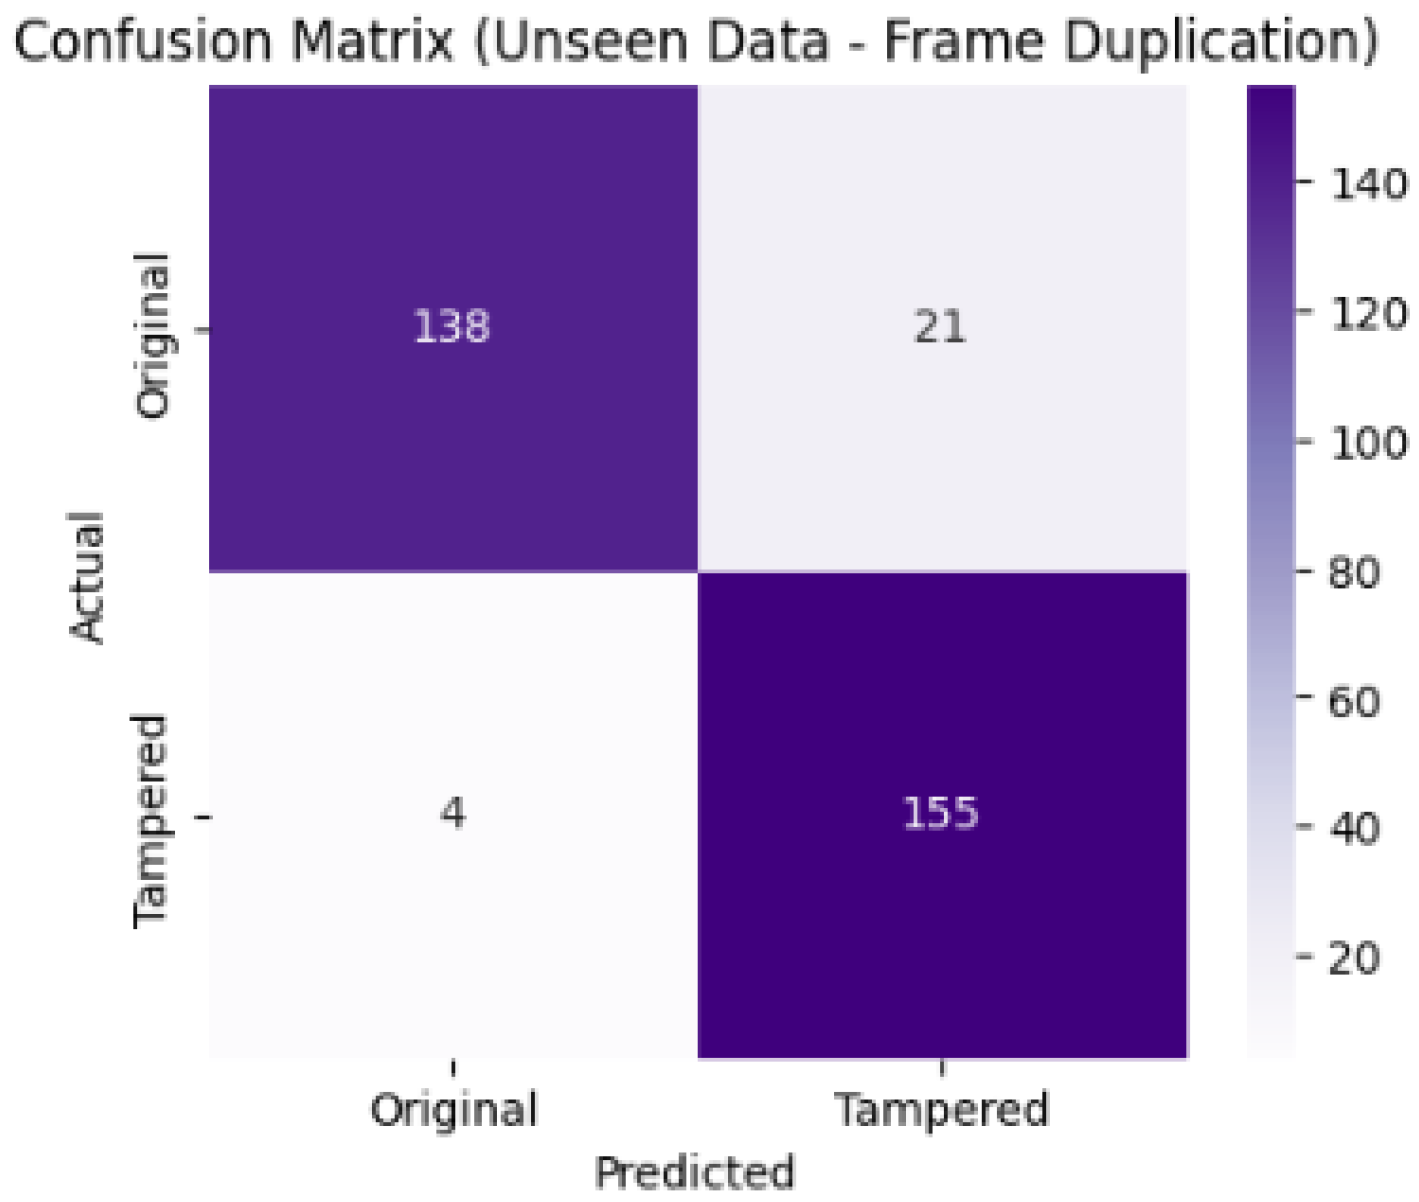
Figure 20.
ROC curve.
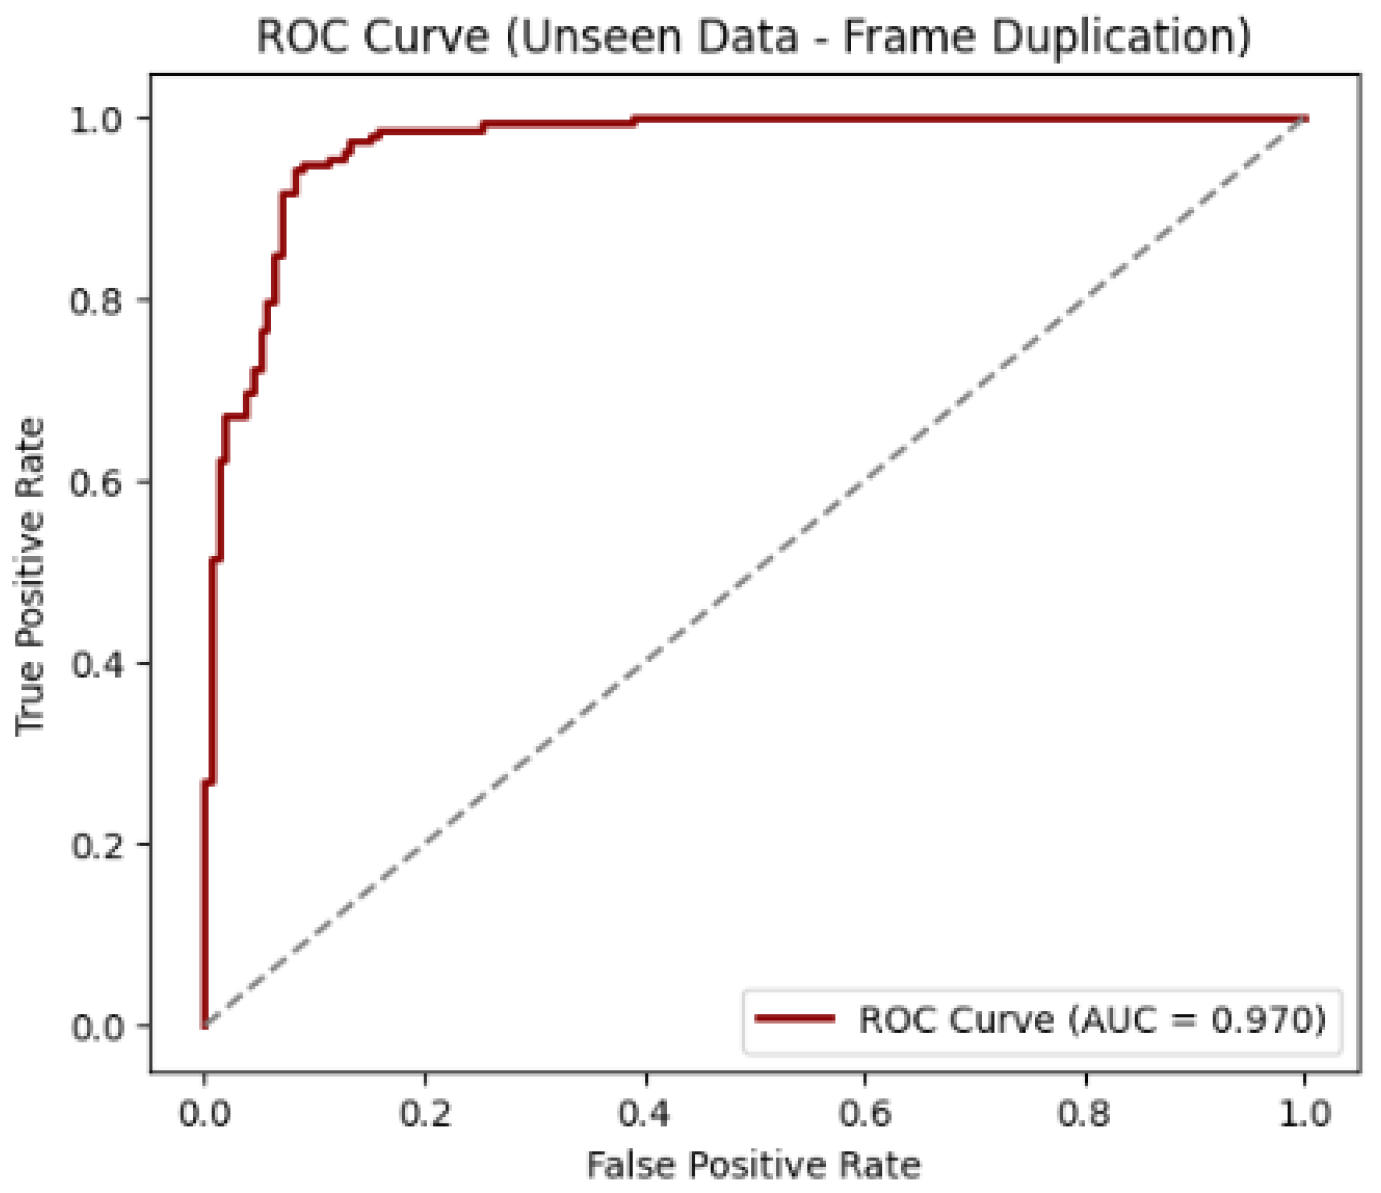
Figure 21.
Training and validation accuracy for multiclass classification tampering over epochs.
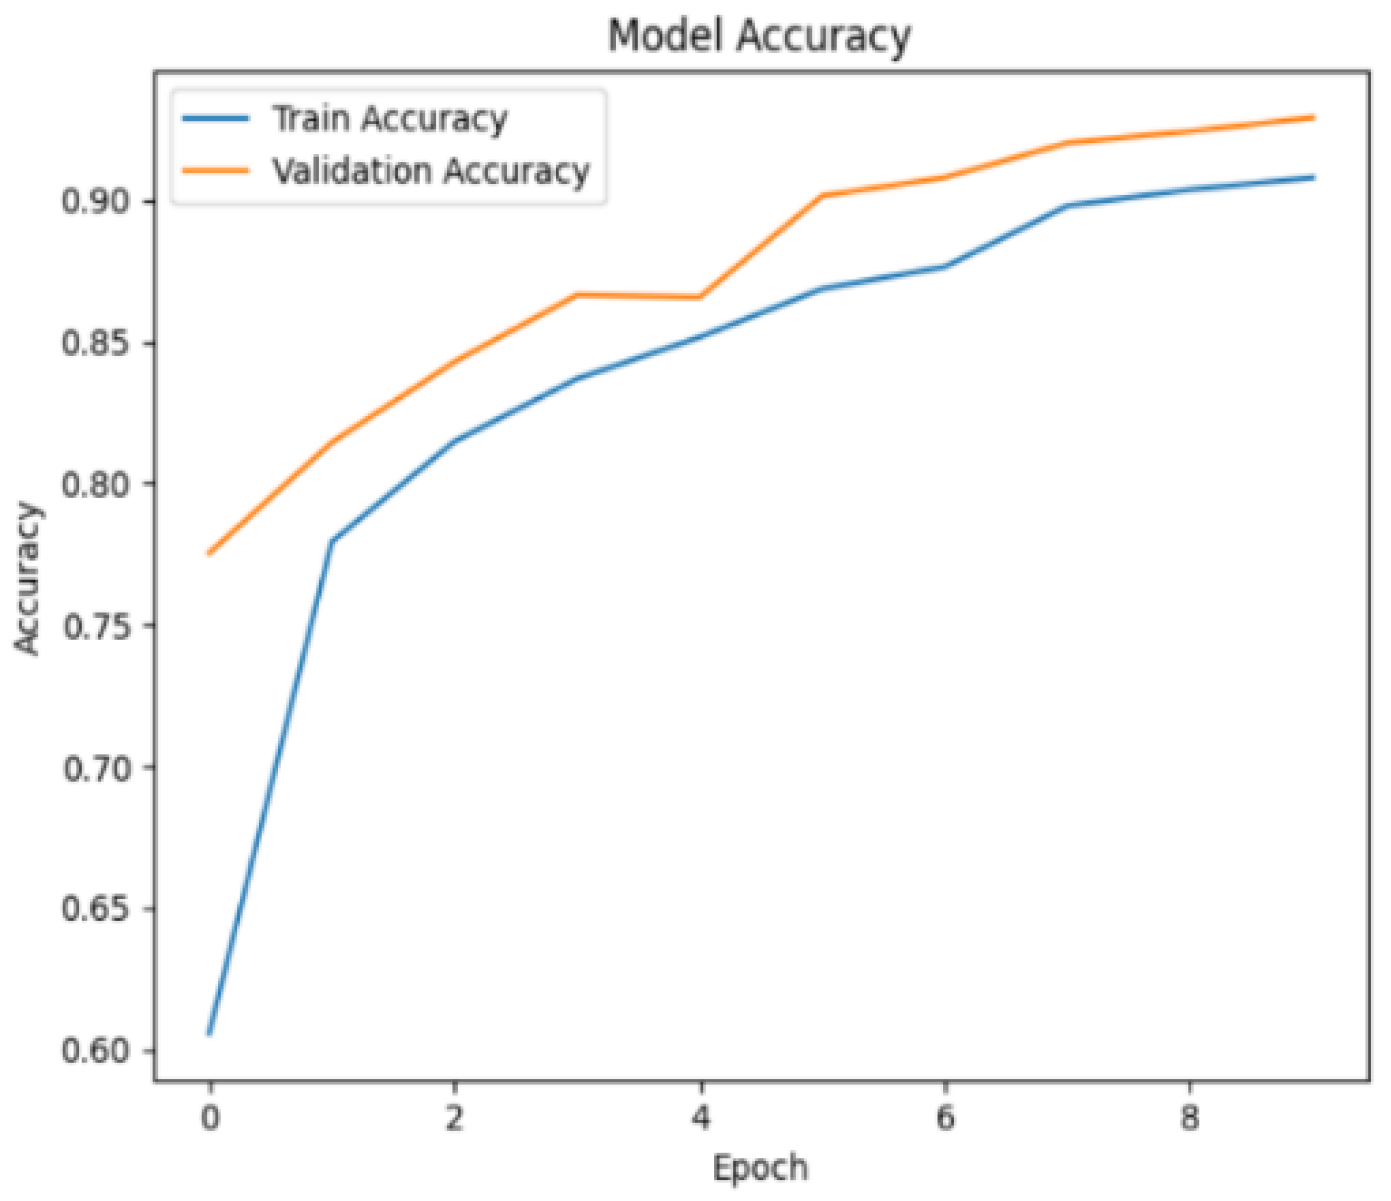
Figure 22.
Model loss for multiclass classification tampering over epochs.
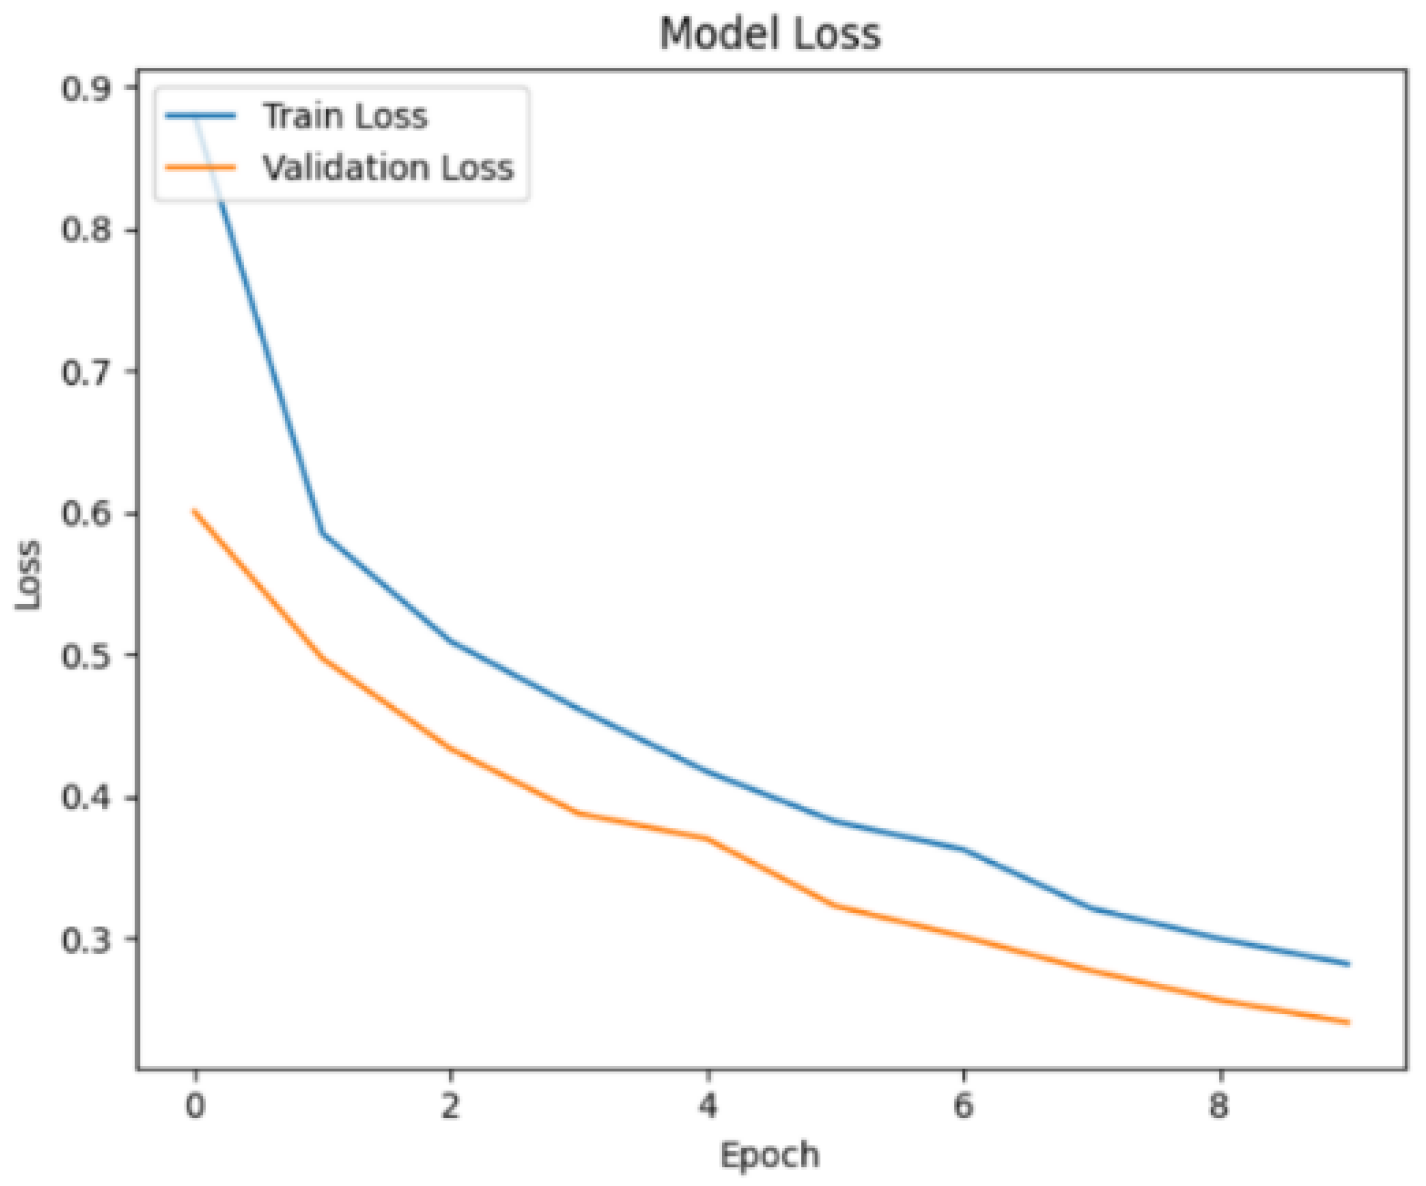
Figure 23.
Confusion Matrix – Multiclass Classification.
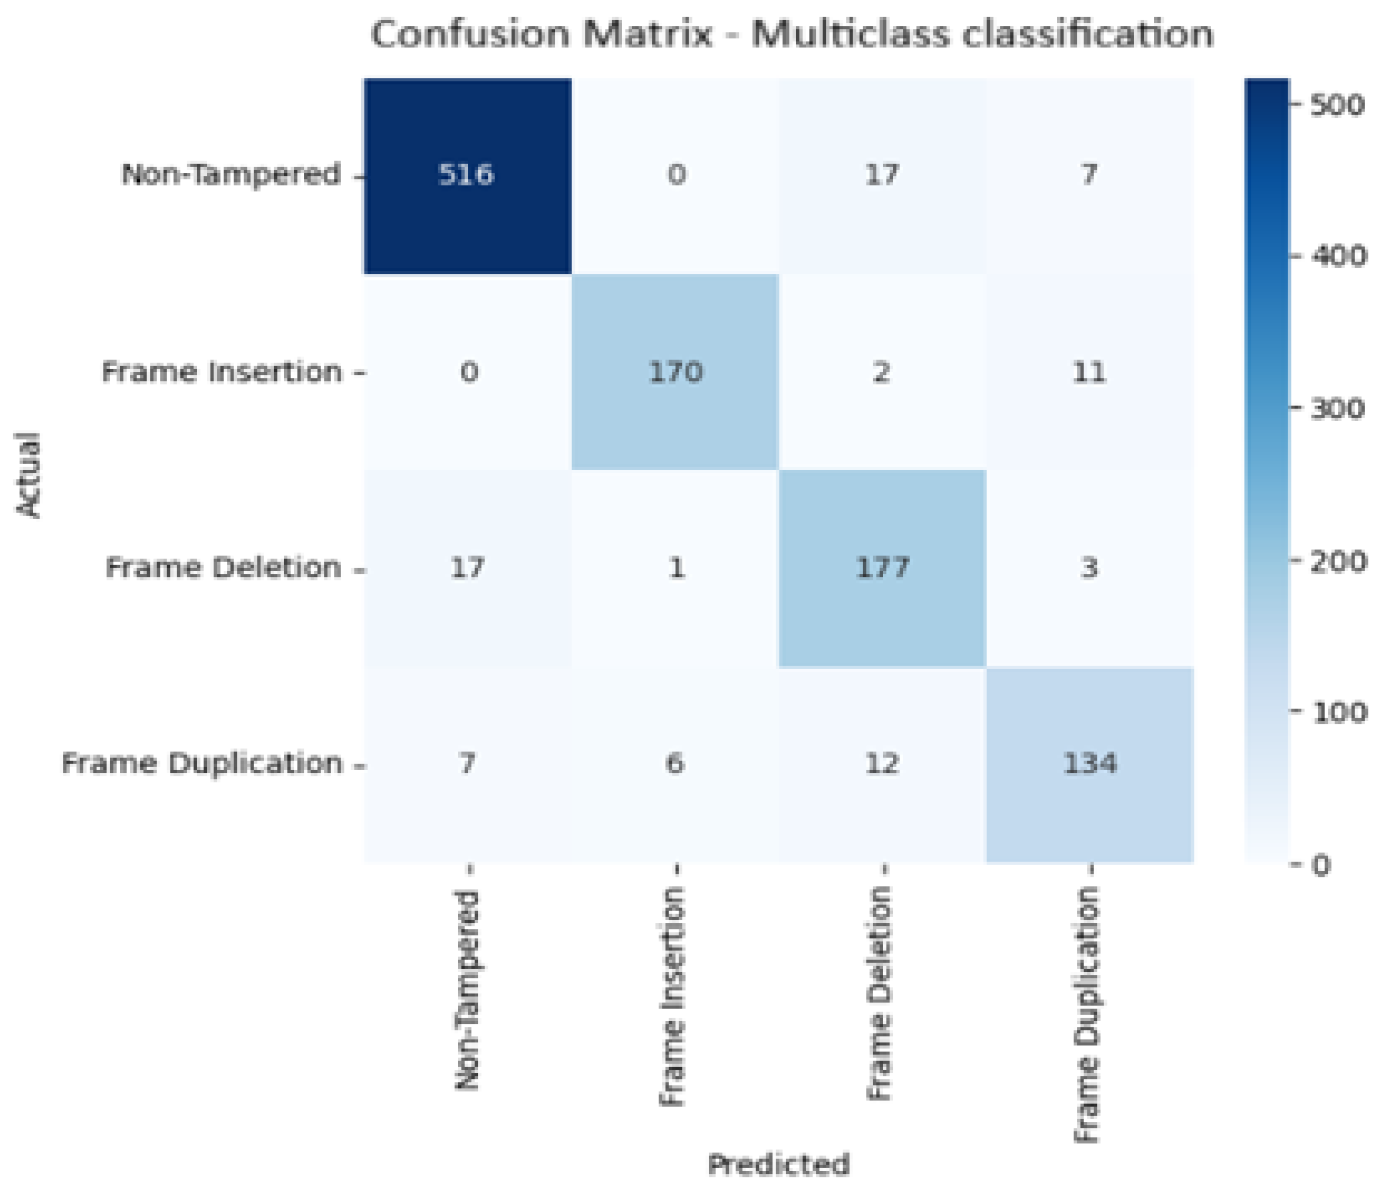
Figure 24.
ROC curve for multiclass classification.
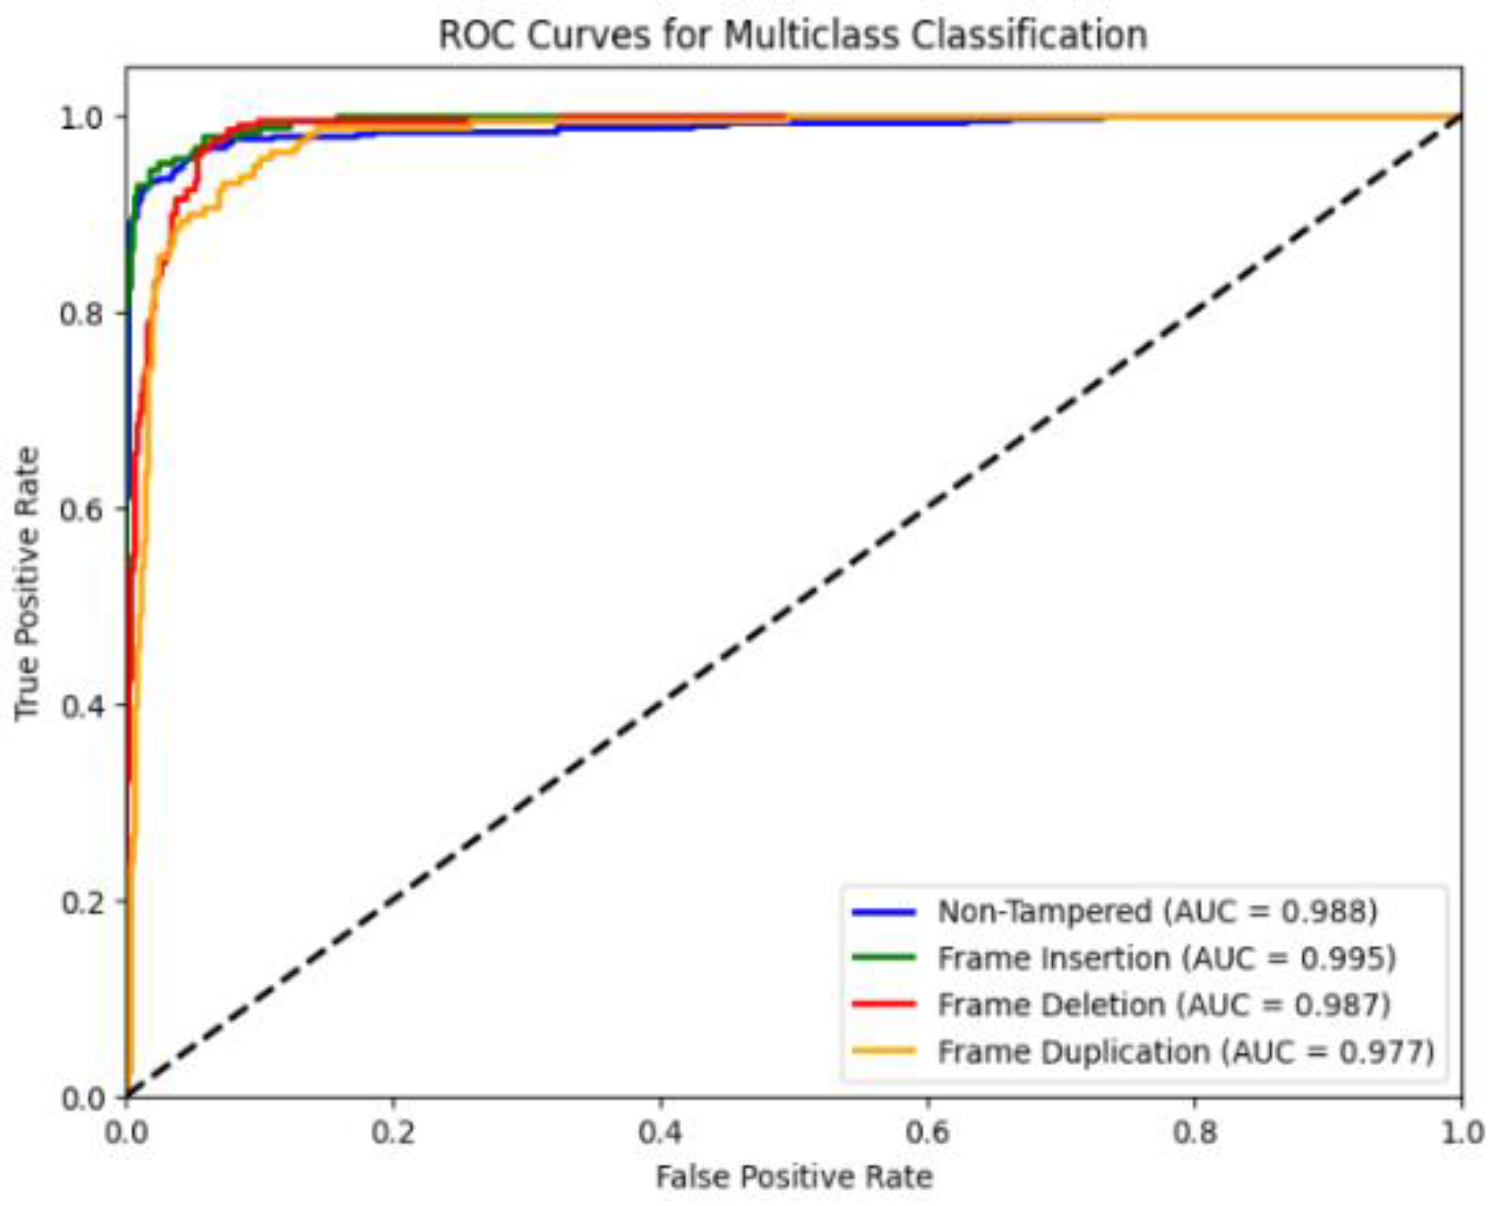
Table 2.
Summary of best configuration per task.
| Task | Kernel | Blocks | Dropout | Runs | Test Accuracy (mean ± std) | Test F1 (mean ± std) | Inference s (mean) |
|---|---|---|---|---|---|---|---|
| deletion | 7 | 2 | 0.5 | 3 | 0.9903 ± 0.0017 | 0.9903 ± 0.0017 | 0.0528 |
| duplication | 5 | 2 | 0.3 | 3 | 0.9581 ± 0.0048 | 0.9577 ± 0.0048 | 0.0703 |
| insertion | 5 | 2 | 0.3 | 3 | 0.9927 ± 0.0016 | 0.9927 ± 0.0016 | 0.0522 |
| multiclass | 5 | 2 | 0.5 | 3 | 0.9824 ± 0.0009 | 0.9824 ± 0.0010 | 0.0537 |
Table 3.
Computational efficiency across all experiments.
| Experiment | Test Videos | Avg. Preprocessing Time (s) | Avg. Inference Time (s ± SD) | FPS | Avg. Memory Overhead (MB) | Peak Memory Increase (MB) |
|---|---|---|---|---|---|---|
| Frame Deletion | 342 | 1.1651 | 0.0557 ± 0.0026 | 17.96 | 0.0161 | 0.4492 |
| Frame Insertion | 366 | 1.3652 | 0.0554 ± 0.0032 | 18.06 | 0.0129 | 0.4883 |
| Frame Duplication | 318 | 1.3499 | 0.0553 ± 0.0030 | 18.09 | 0.0188 | 1.8867 |
| Multiclass Classification | 1080 | 1.3588 | 0.0550 ± 0.0043 | 18.17 | 0.0882 | 0.3867 |
Disclaimer/Publisher’s Note: The statements, opinions and data contained in all publications are solely those of the individual author(s) and contributor(s) and not of MDPI and/or the editor(s). MDPI and/or the editor(s) disclaim responsibility for any injury to people or property resulting from any ideas, methods, instructions or products referred to in the content. |
© 2025 by the authors. Licensee MDPI, Basel, Switzerland. This article is an open access article distributed under the terms and conditions of the Creative Commons Attribution (CC BY) license (http://creativecommons.org/licenses/by/4.0/).
Copyright: This open access article is published under a Creative Commons CC BY 4.0 license, which permit the free download, distribution, and reuse, provided that the author and preprint are cited in any reuse.


