Submitted:
03 December 2025
Posted:
04 December 2025
You are already at the latest version
Abstract
This study presents a comprehensive data visualization and statistical analysis of Singapore’s waste management trends to evaluate progress toward Sustainable Development Goal 12: Responsible Consumption and Production. Drawing on datasets from national agencies and international repositories, the research integrates information on waste generation, recycling, imports, and public behavior to produce a multi-dimensional understanding of the nation’s waste ecosystem. The study employs data preprocessing, transformation, and exploratory visualization techniques to address inconsistencies across diverse data sources and uncover significant temporal and sectoral patterns. Findings reveal increasing plastic dependency, stagnating recycling rates in domestic sectors, and varying degrees of public participation in sustainable practices. Furthermore, the analysis identifies the energy and resource savings achievable through material-specific recycling initiatives, particularly emphasizing non-ferrous metals and plastics. By consolidating visual narratives through Tableau-based dashboards, the study provides actionable insights for policymakers, sustainability researchers, and environmental agencies to design more data-informed strategies for achieving Singapore’s Zero Waste 2035 vision.
Keywords:
Singapore waste management
; data visualization
; SDG 12
; recycling trends
; sustainability analytics
; waste reduction
; environmental policy
; plastic waste
; public behavior
; data integration
; Tableau
; energy savings
; zero waste
; sustainable development
; waste analytics
1. Introduction
Sustainable Development Goals(SDG) — established by the United Nations, serves as a worldwide framework to address global challenges such as social, economic and environmental threats. Among these goals, SDG 12: Responsible Consumption and Production, aims to promote efficient consumption and production patterns. (United Nations, 2023) It highlights the importance of taking action against challenges like mitigating climate change, managing natural resources and promoting healthy environmental sustainability. (United Nations, 2023)
Singapore, a densely populated and urbanized country, creates various opportunities in managing waste efficiently. Despite being a small country with high consumption rates, Singapore already implemented comprehensive policies and technologies to combat and reduce waste. (National Environment Agency, 2024) However, achieving zero waste while complying with SDG 12 would require years of continuous improvements, complete public support and policies that are backed up with historical data. (National Environment Agency, 2016)
In this report, Singapore's waste management datasets will be analyzed to gain trends and patterns that describe the effectiveness of current practices. By applying data visualisation techniques, this report aims to visualise complex datasets and provide an intuitive visual narrative, aimed to point out key insights, progress and limitations in Singapore’s waste management. With these methods this report will be able to explore the composition and volume of waste generated, the recycling and waste burning rates and also the effectiveness of current waste management strategies.
The insights obtained from this analysis will offer a clearer understanding of Singapore's current waste management methods while being an invaluable tool to aid in promoting a sustainable and clean environment for the near future generation. This report is also able to contribute to global missions of sustainable development through informed decision-making and collaborative actions such as establishing innovative and practical waste solutions and organizing public education programs. These actions may be performed with the joint effort of multi-stakeholder partnerships and public-private cooperation to achieve SDG 12 goals collectively.
2. Formulating Your Brief
This section outlines the basic structure and summary of our project in terms of what it aims to do, who it is for and what are its limitations.
2.1. Motivation
The topic of consumption, waste management, and recycling are of great interest to scientists and specialists from various different fields ranging from environment enthusiasts to business analysts and policy makers. However in many cases an issue they may face is that the data available to them is not presented in an easy way. It is spread out over multiple datasets, scattered in different sources. The interpretation of data is another challenge as they are not in a uniform format. For instance some datasets will give more details than others that are vague. This presents a huge challenge for those aiming to study the consumption and waste patterns as they will struggle with reconciling different sources with each other and the interpretation of data available to them. Our project is aimed at condensing the findings in a presentable way for the interested parties to understand the key information they require for their studies and policy making.
2.2. Stakeholders
Multiple stakeholders would be affected by this project encompassing several sectors of the economy due to the complex nature of sustainable waste management.
Firstly, Government Agencies such as the National Environment Agency (NEA) and the Ministry of Sustainability and the Environment (MSE) of Singapore are one of the stakeholders affected by this project. (National Environment Agency, 2024) That is because they play a pivotal role in establishing regulations, developing waste management infrastructure, and executing sustainability initiatives in Singapore. These regulations are a great concern to most first-world countries including Singapore as it is a very small country. Managing waste and consumption is one of the government’s top priorities in the long run to liberate the country from pollution. Besides that, International Organisations such as the United Nations Development Programme (UNDP) and the World Bank may utilise such data to evaluate a nation's performance and coordinate global efforts, provide technical or financial support where needed when it comes to achieving environment-related development goals. (UNDP, 2018)
Moreover, the general public and civil society including community groups, Non-Governmental Organization (NGOs) and the citizens play an important role in cultivating sustainable practices. Access to visualization and comprehensible information enables the public to make educated judgments and endorse recycling or zero-waste initiatives (Begum & Hong, 2023). Additionally, sustainability researchers, environmental scientists, and data analysts can benefit from this project. They require clear and accessible waste data to make comprehensive studies, devise creative solutions, and track the projects under SDG 12.
2.3. Constraints
There are several constraints which can affect the scope and effectiveness of this study. The data availability and quality poses a major risk to the credibility of this research. The risks of publicly accessible waste data include: aggregated data, outdated data, or lack of granularity. Hence, constraining the accuracy and depth of insights. Following that, data integration unravels more challenges. Waste-related data are dispersed across several sources with different formats, necessitating considerable time and effort to cleanse, standardise, and integrate for efficient visualisation and analysis. (National Environment Agency, 2024)
2.4. Deliverables
The aim of this project is to produce key outputs as discussed below. Firstly, we aim to create an extensive analytical data-driven report showcasing graphic representations of Singapore's waste data, encompassing trends in waste creation, recycling rates, incinerated volumes, and sector-specific analysis. Moreover, this study aims to create infographics and simplified data visualisations designed for community education initiatives which enhances awareness, promoting behavioural modifications about sustainable consumption and recycling. We intend to take into account the maximum number of data sources that are available to us to ensure our results are as close to reality as they possibly can.
3. Working With Data
This section will elucidate the practical mechanics of data manipulation to cultivate a thorough understanding of the data using the four: Data Acquisition, Data Examination, Data Transformation, and Data Exploration.
3.1. Data Acquisition
The data used in this project is sourced from reliable sources including government agencies, private organizations and trusted research libraries. The following table shows the details for every data sourced.

Table 1.
Data Acquisition Literature Review.
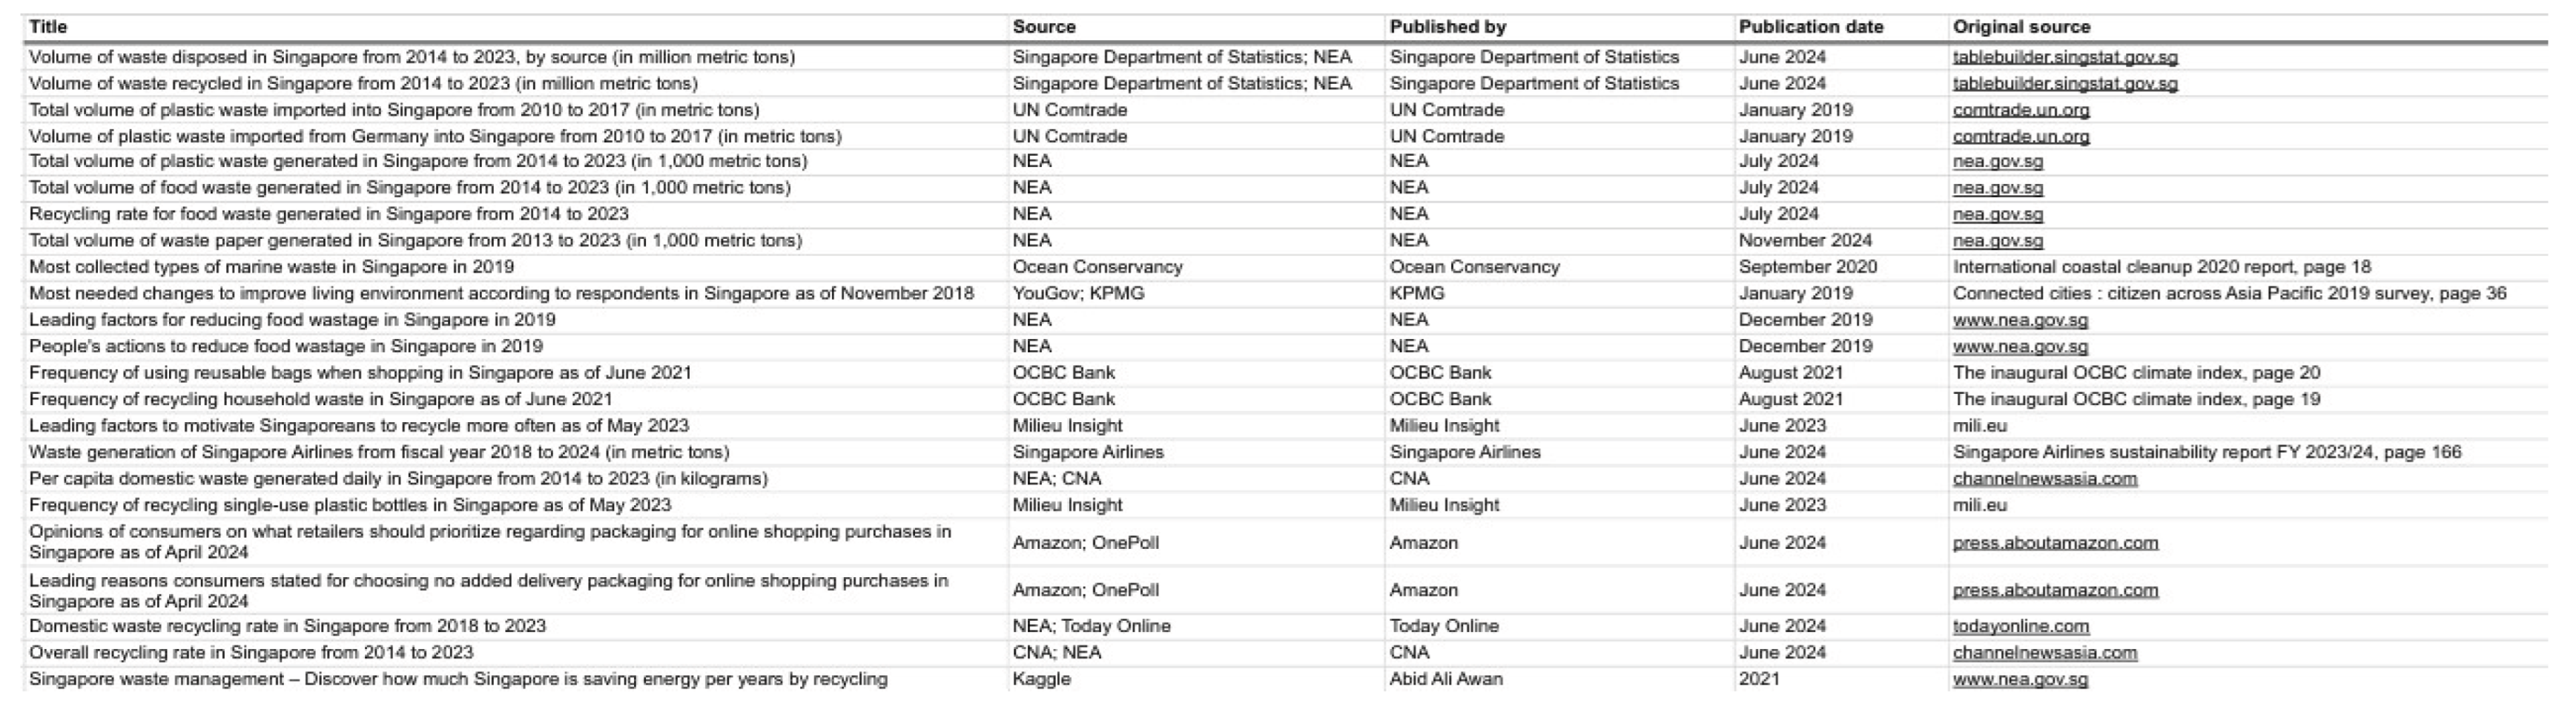 |
These sources guarantee data dependability, precision, and pertinence to the subject of waste management and sustainability in Singapore. The information encompasses multiple elements, including trash generation, recycling trends, public perceptions, and business sustainability initiatives.
The datasets were released from 2018 to 2024, with their origins traced to official platforms like nea.gov.sg, tablebuilder.singstat.gov.sg, comtrade.un.org, and other referenced sources. The variety and extent of these data sources establish a comprehensive basis for analysis in the following sections.
3.2. Data Examination
The data were acquired using multiple different secondary sources, creating a concern for the data formats. Through data examination, we were able to highlight the necessary changes to each dataset for easier data visualization. The following table describes the issues found with the datasets.
Table 2.
Datasets and their issues.
| Title | Issues with Dataset |
|---|---|
| Volume of plastic waste imported from Germany into Singapore from 2010 to 2017 (in metric tons) | Missing 2011 and 2016 data. |
| Singapore waste management - Discover how much Singapore is saving energy per years by recycling | Outdated data for the rate of recycling. |
3.3. Data Transformation
As emphasised throughout the data examination phase, several datasets require systematic modification to guarantee analytical integrity and completeness. A major issue emerged due to the lack of documented statistics about the quantity of plastic garbage imported from Germany to Singapore for the years 2011 and 2016. Due to the lack of primary source data for these years, statistical imputation was used as a corrective measure. Mean imputation was chosen for its efficacy in preserving central tendency while avoiding the onset of significant variation.
The arithmetic mean of the known values from the following years were computed to address the missing data, resulting in a representative estimate of 139.9 metric tonnes. The computed mean, shown in Figure 1 – Mean Calculation, was subsequently inserted into the gaps for the years 2011 and 2016. This approach guarantees the dataset maintains statistical consistency while enabling longitudinal trend analysis.
Moreover, supplementary data about Singapore's recycling rate was obtained from the digital archive of the Singapore Department of Statistics (2025). This supplemental dataset offers enhanced insights into the nation's recycling patterns, therefore strengthening the contextual framework for analysing the effects of plastic waste imports on overall sustainability initiatives.
The structure and format of most obtained datasets were not initially conducive for direct analysis. A prevalent problem was the presence of descriptive overview sheets dominating the first worksheet of Excel files, as seen in Figure 2– Sample Overview. The components, while informative, required removal to optimise the datasets for computer processing.
To make the data functional, the first sheets including metadata, publishing information, and narrative descriptions were omitted from the processing pipeline. Moreover, the actual data sheets often need manual reformatting since there are structural anomalies, like misaligned headers and multi-row title blocks.
Figure 3 – Format Changes exemplifies this transformation, whereby the original dataset, characterised by title rows and inconsistent column arrangements, was streamlined into a standardised tabular format with distinct columns. This reformatting was crucial for enabling the information to be effectively fed into visualisation platforms without errors.
This transformation process included statistical imputation to rectify missing data and structural reorganisation of datasets. These measures are essential for maintaining data integrity and guaranteeing the reliability of later analyses.
3.4. Data Exploration
Reviewing more than 25 raw datasets for relevance, structure, and the subjects they cover were necessary to perform a useful data exploration for Singapore's waste trends. These data sources included time-series metrics, surveys, insights into behaviors, and specialist data from various years and organizations.
To help with research and storytelling, each of the 25 datasets has been assigned to one of seven thematic groups: A to G. This segmentation helps concentrate the information and allows us to discover detailed insights in national trends, recycling habits, data on imports, and public opinion.
The different structures of the datasets, such as the formats of their columns and units they utilized, prevented them from being combined into one master table. To show the data understandably, we turned to Tableau for its robustness and reliability when working with multiple datasets.
This system makes all the stages concise, allowing us to carry out a specific analysis of visual elements in every theme, draw graphs, tables, and diagrams, making sure all visualizations were designed to comply with the project’s goals. The groups are as follows:
Figure 4.
Chart summarizing all the groups created.
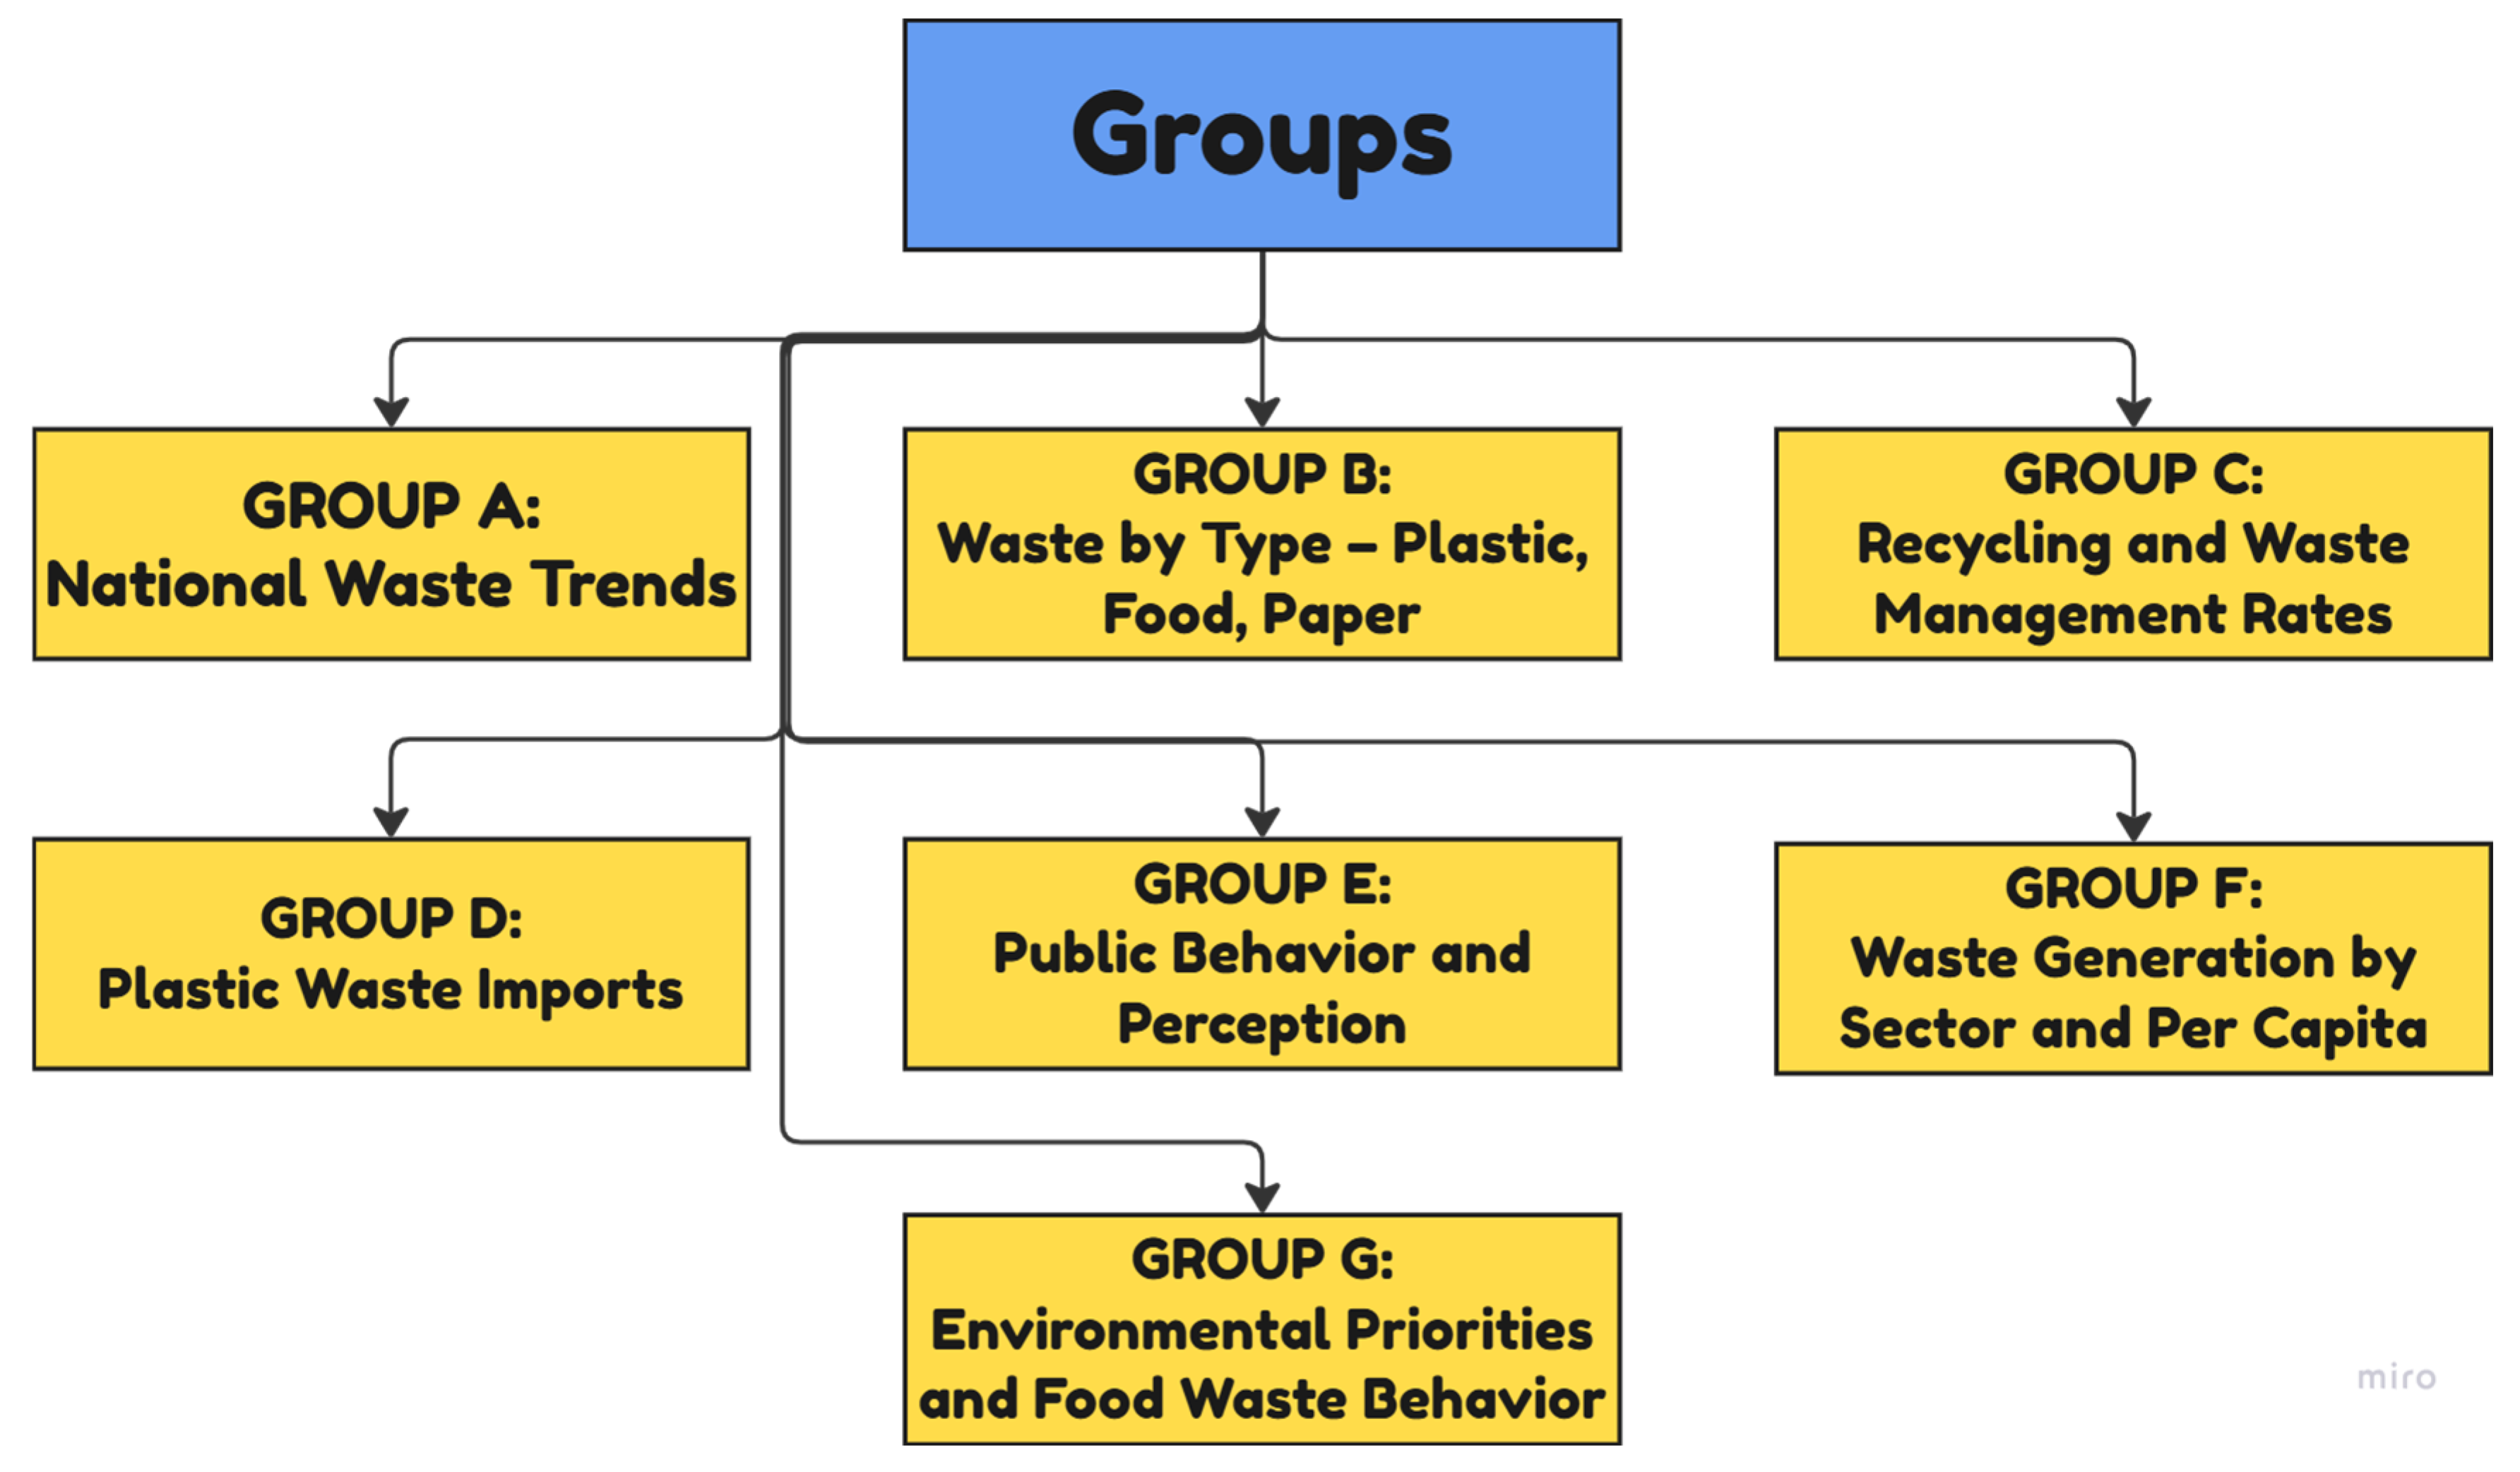
Descriptions of each group are provided in the sections to introduce the topic and highlight the meaning of each grouping.
3.4.1. Group A: National Waste Trends
This group analyzes Singapore’s total waste production and control from 2003 up to 2023. The data covers the total waste accumulated, the way it was disposed (in landfills or by burning) and the amount recycled, all explained by type. Such metrics prepare us to assess the nation’s overall progress and hurdles in working towards zero waste goals.
Figure 5.
Total Waste Generated in Singapore (2003–2017).
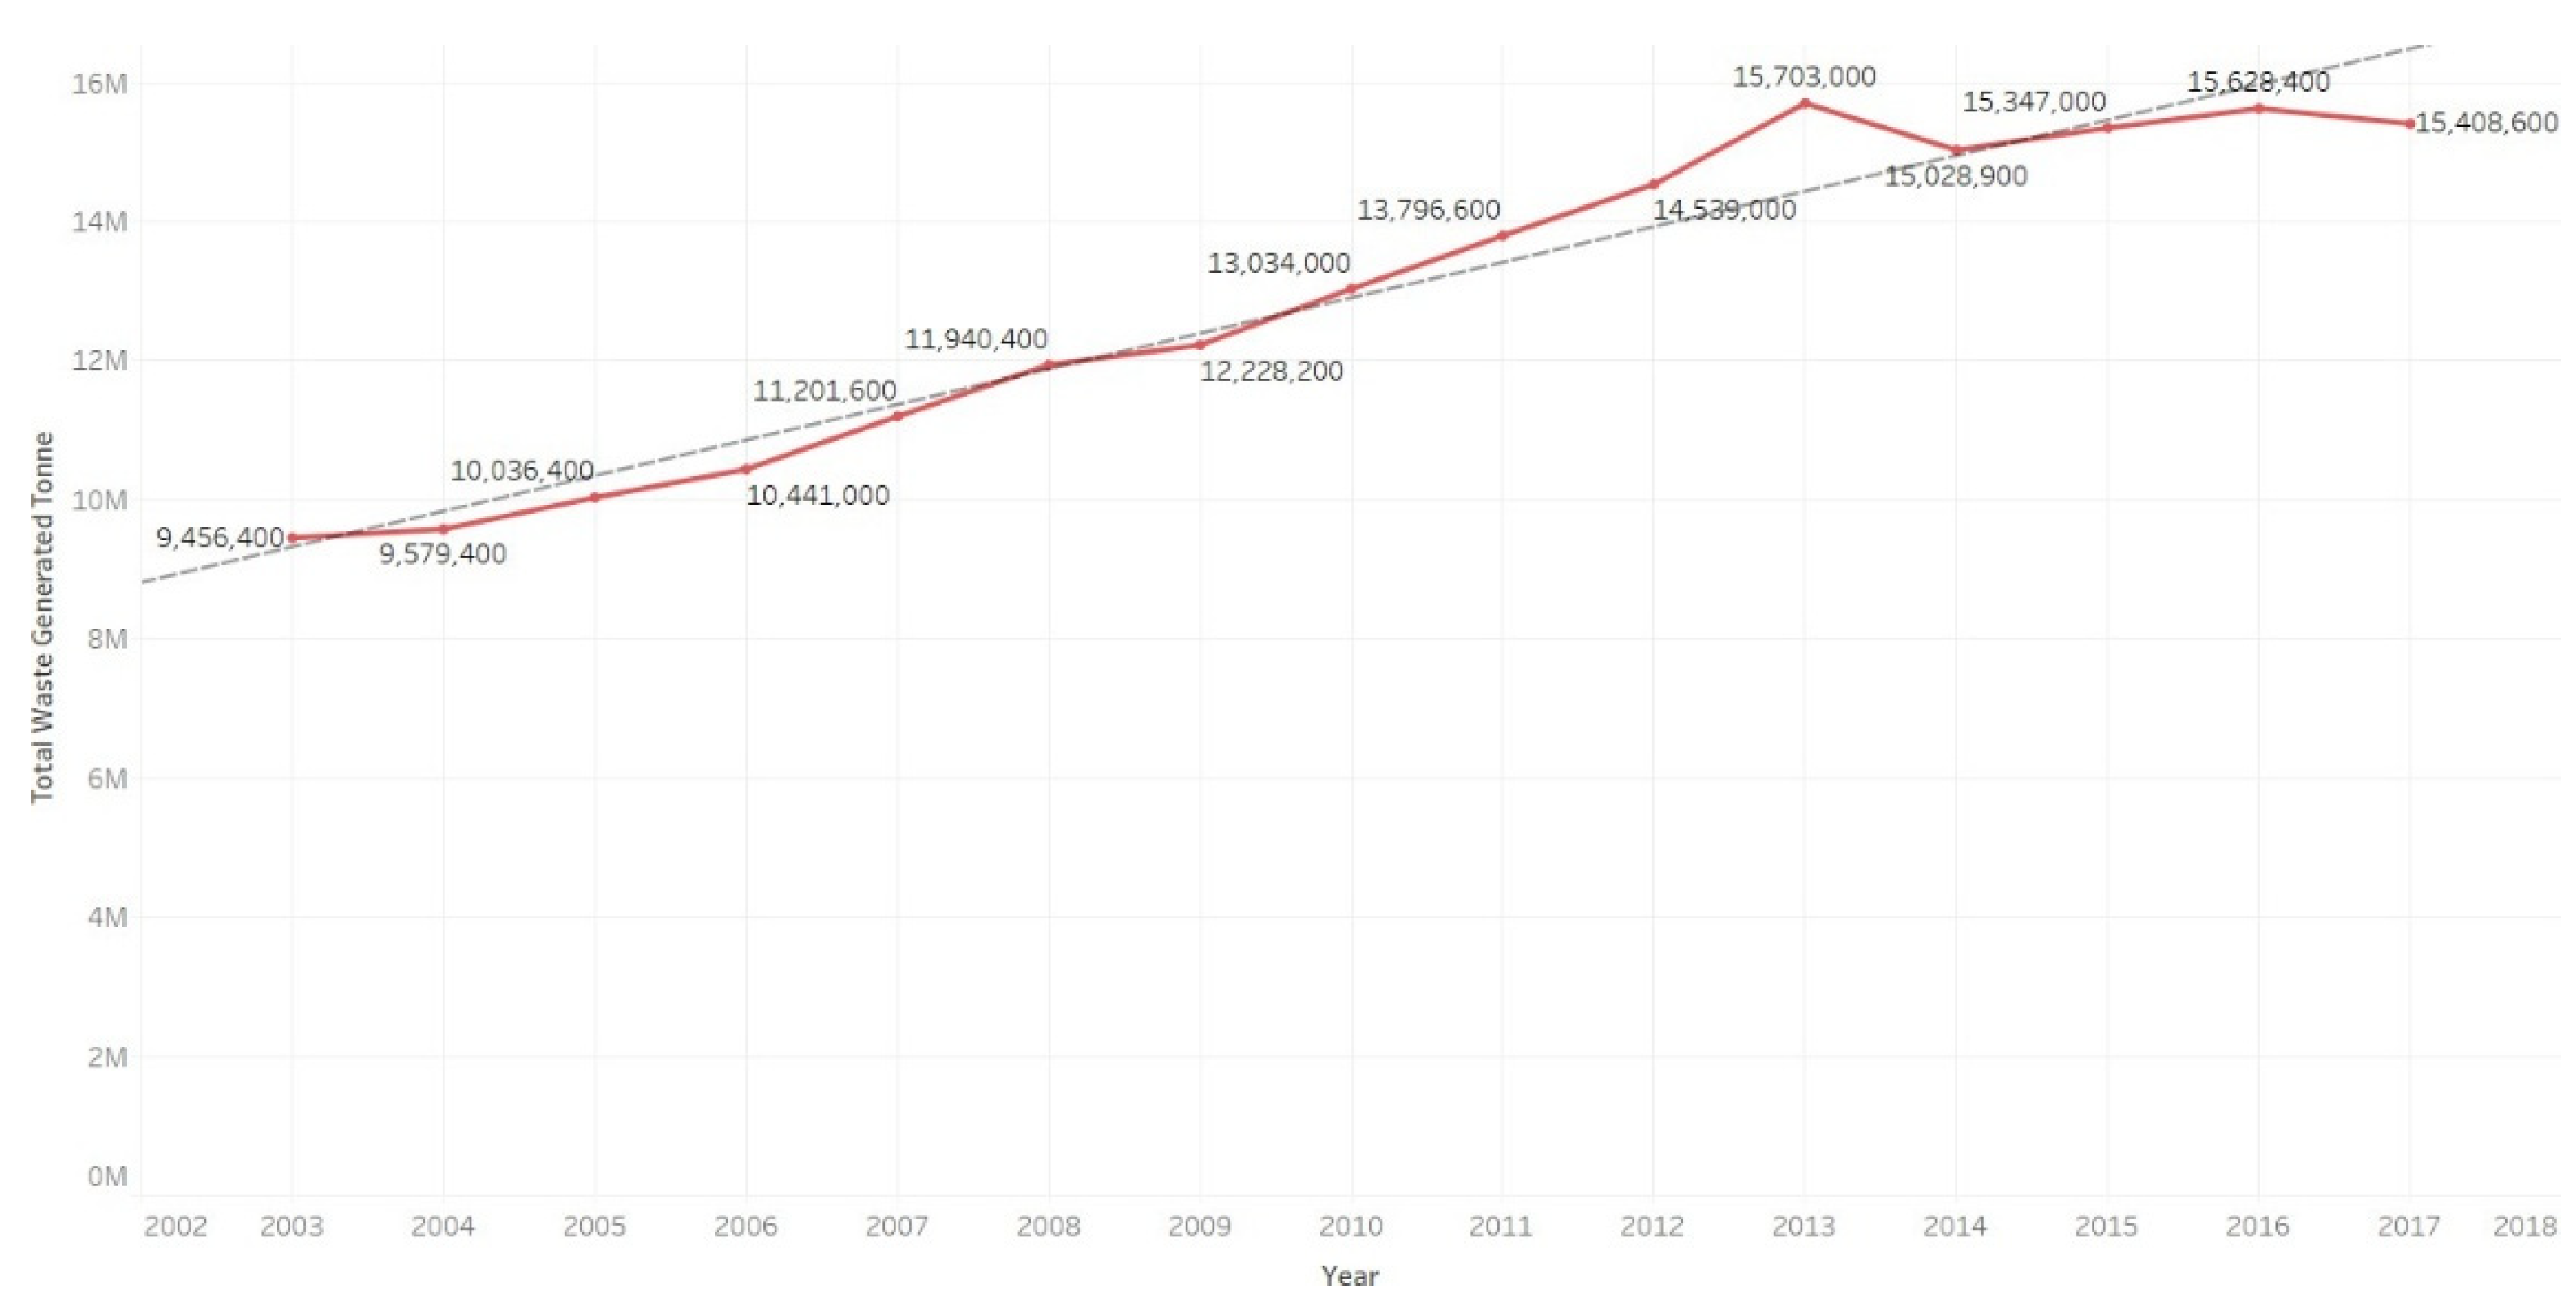
The following visualization demonstrates the total waste generated in Singapore from the year 2003 to 2017. The line graph shows a positive slope indicating a continual increase in the waste generated per year with the steepest incline between year 2012 (14,539,000 Tonnes) and 2013 (15,703,000). Despite this, there was a reduce in the waste generated which can be seen immediately after that peak, reducing to 15,028,900 the following year (2014).
Figure 6.
Recycled vs. Disposed Waste (2003–2017).
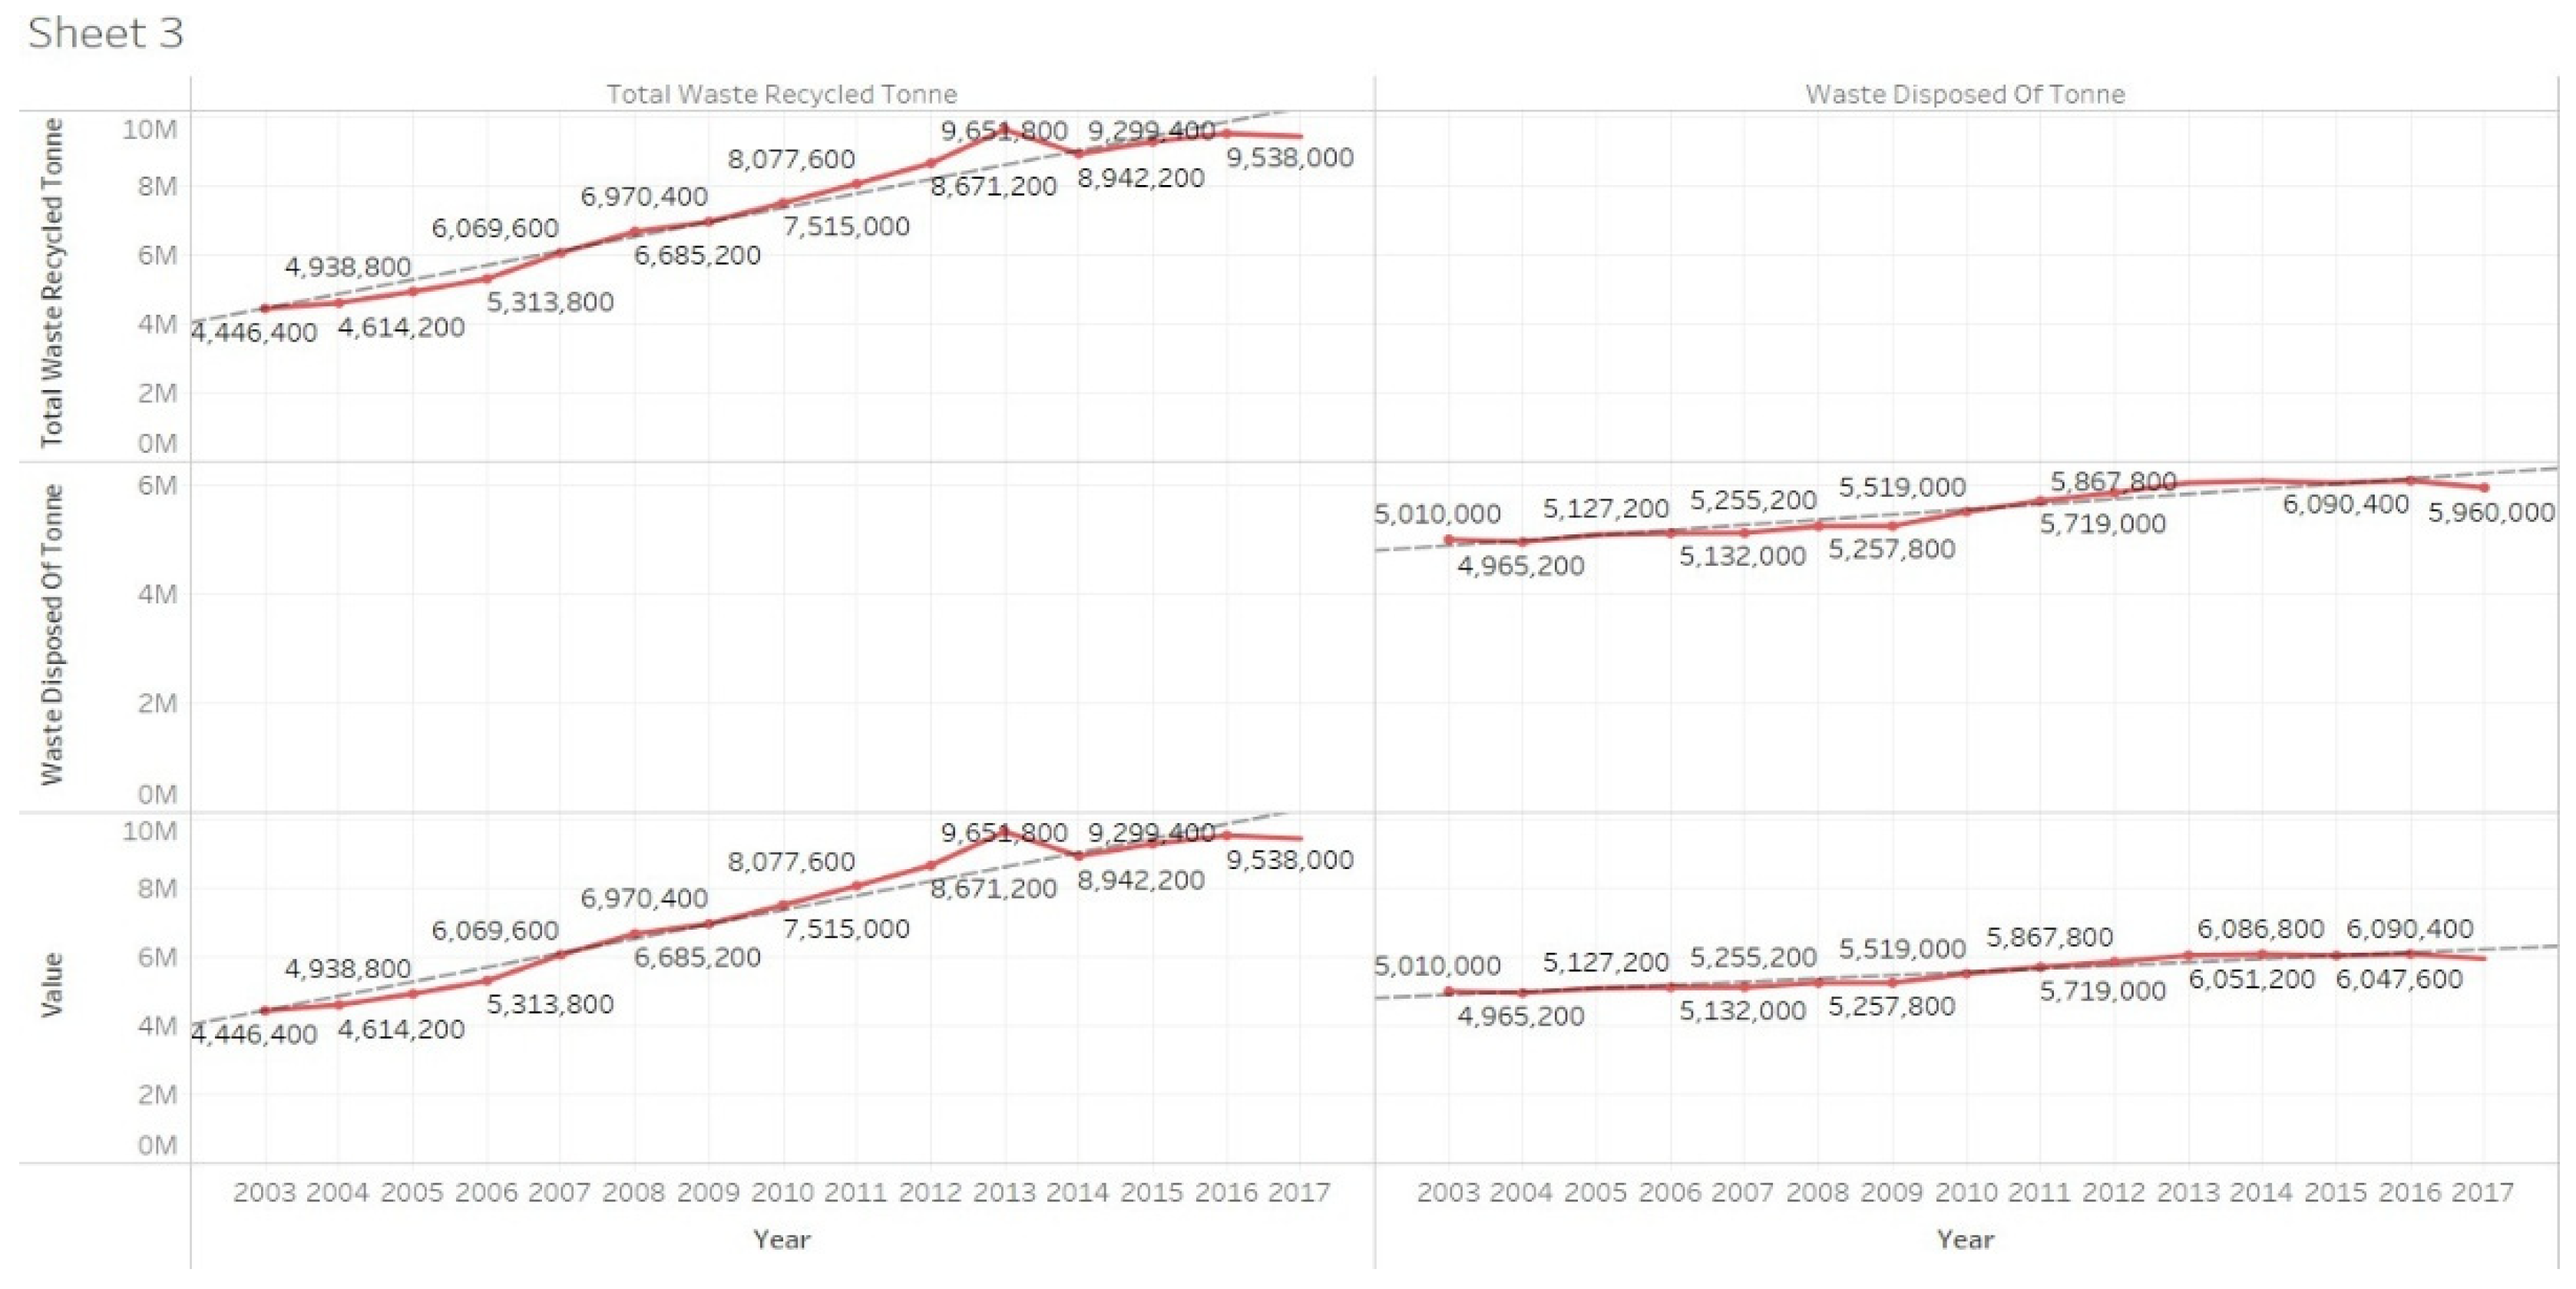
The following chart compares the amount of total waste which were recycled and disposed of in Singapore as of the year 2003 to 2017. The graph illustrates a steady rise slope in both waste streams, with recycled waste exhibiting a more pronounced increase over time. The total recycled waste had increased from 4,446,400 tonnes in 2003 to a maximum of 9,538,000 tonnes in 2016, virtually doubling throughout this timeframe. Concurrently, trash disposal rose at a more gradual pace, escalating from 4,965,200 tonnes in 2003 to 6,090,400 tonnes in 2015, before seeing a minor decline to 5,960,000 tonnes in 2017. This pattern signifies a favourable transition in recycling initiatives, notably prominent from 2009 to 2013, when recycled waste exceeded discarded garbage and sustained high levels thereafter.
Figure 7.
Overall Recycling Rate in Singapore (2003–2018).
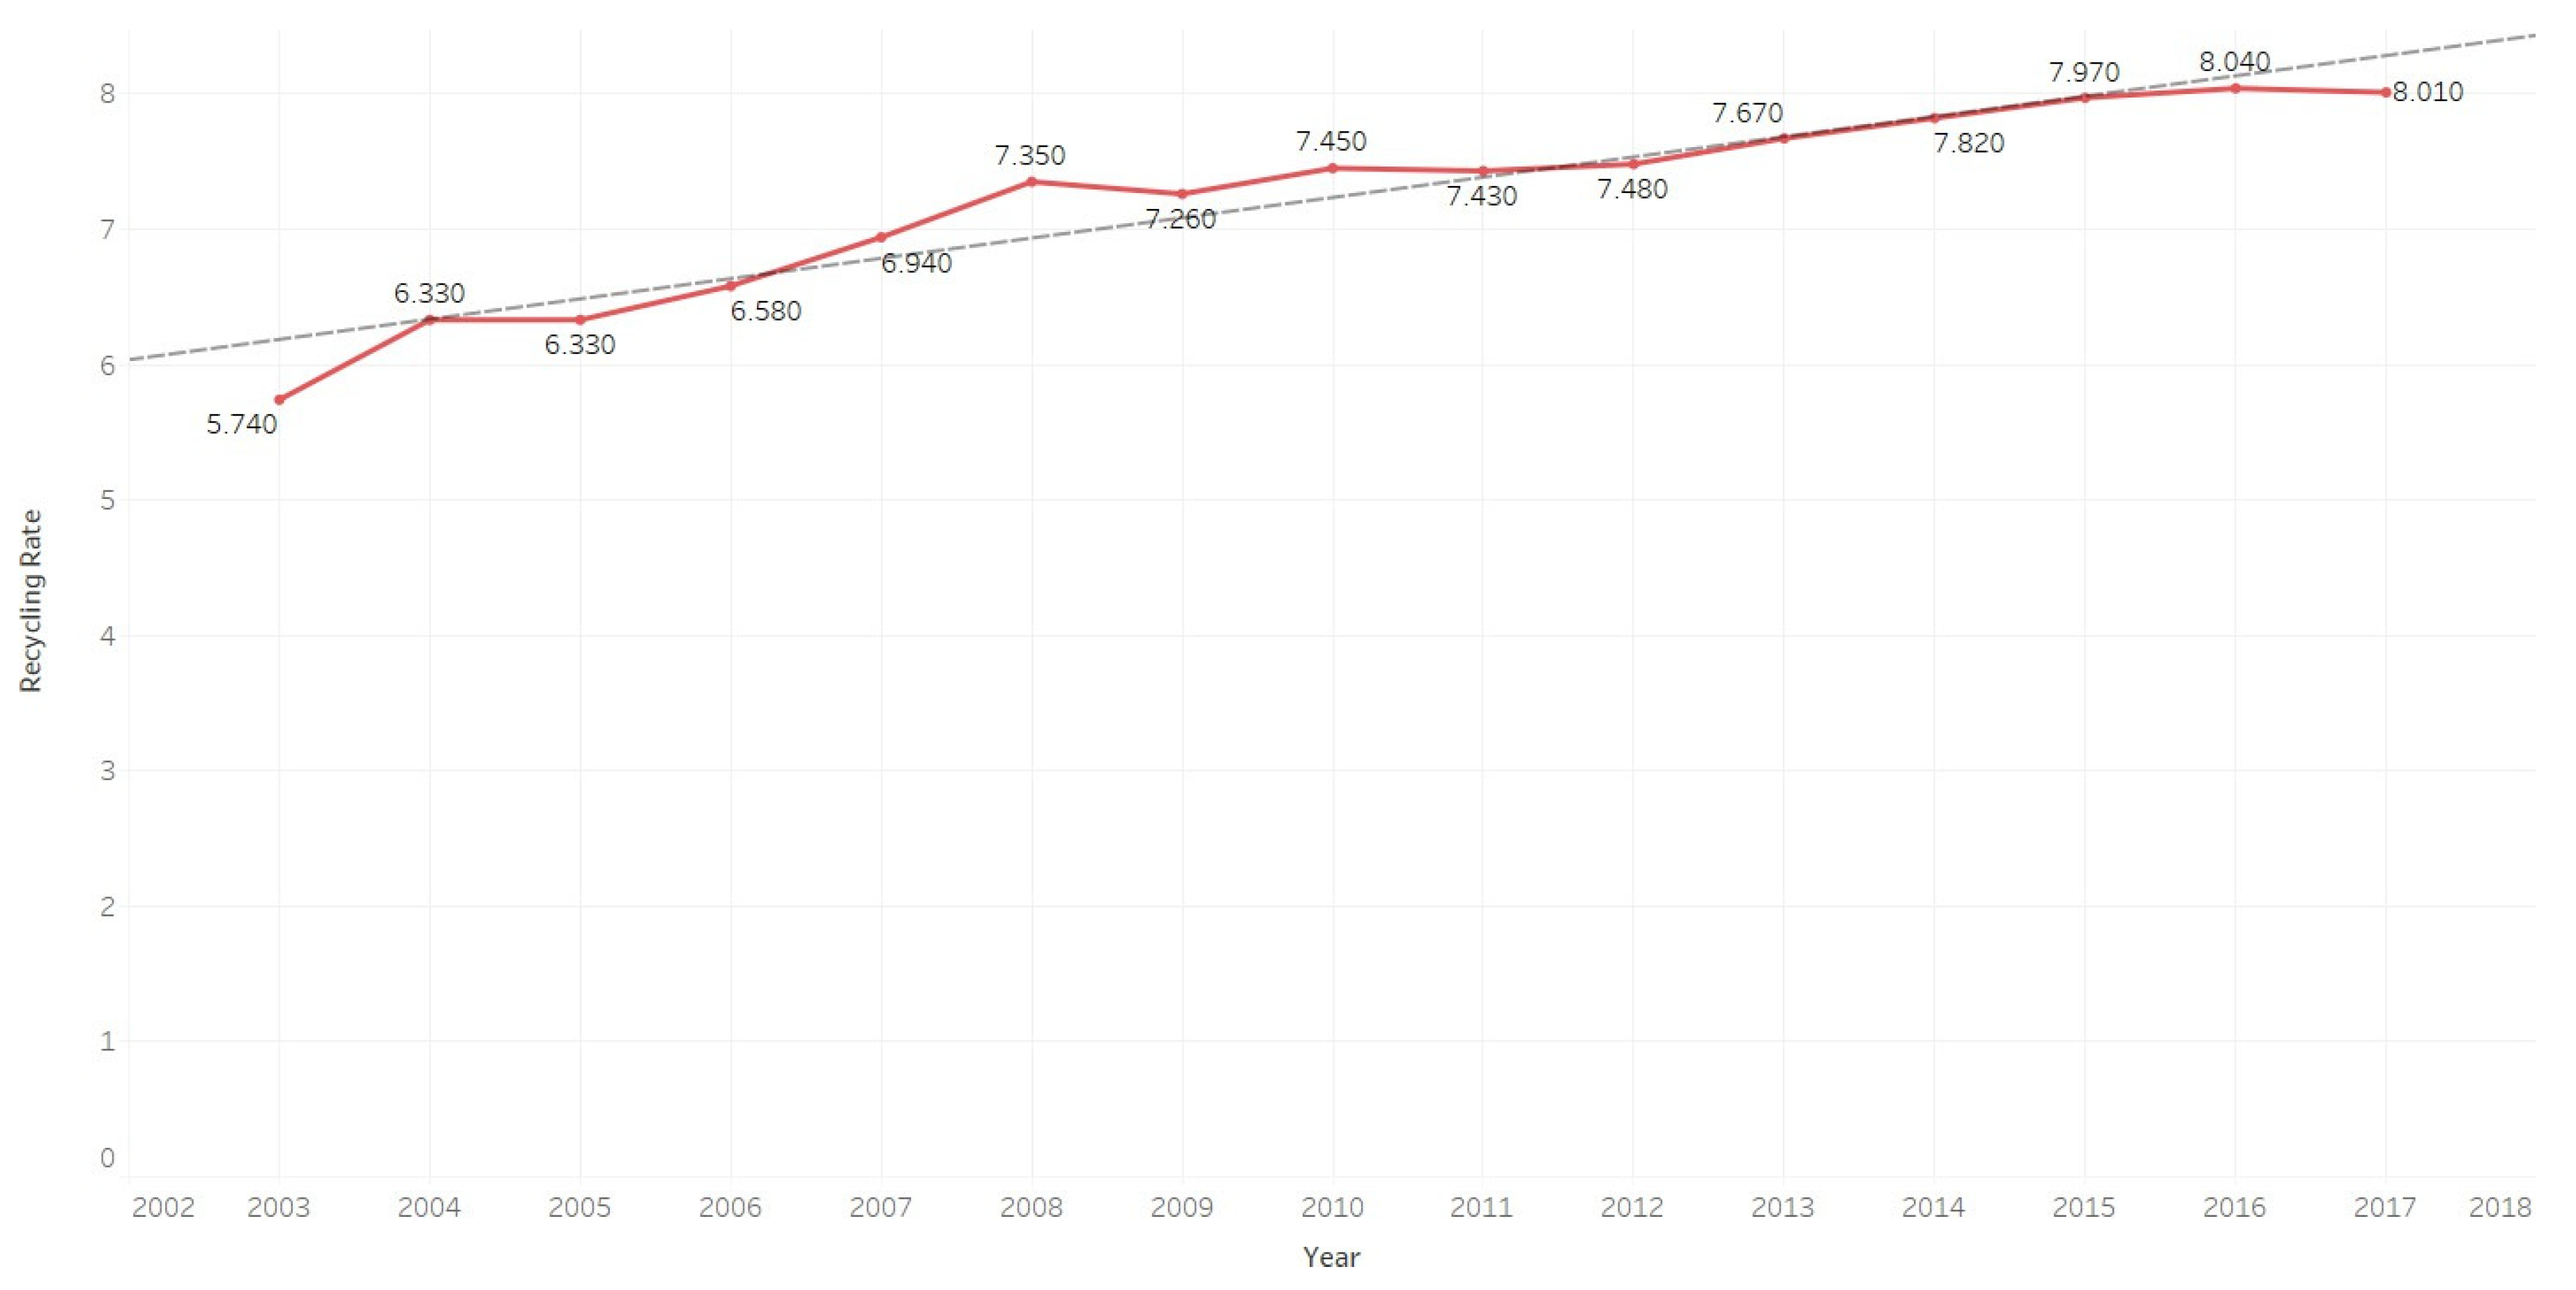
This visualisation illustrates the total recycling rate in Singapore from 2003 to 2018. The line graph illustrates a consistent rise in the recycling rate over time, commencing at 5.74 in 2003 and to a maximum of 8.04 in 2017, followed by a little decline to 8.01 in 2018. Significant growth transpired between 2007 (6.94) and 2013 (7.67), characterised by regular annual increases. This increasing trend reflects Singapore's continuous endeavours in waste management and recycling activities, demonstrating steady but consistent advancement in improving the nation's recycling performance.
Figure 8.
Energy Saved by Recycling 1 Tonne of Material (kWh).
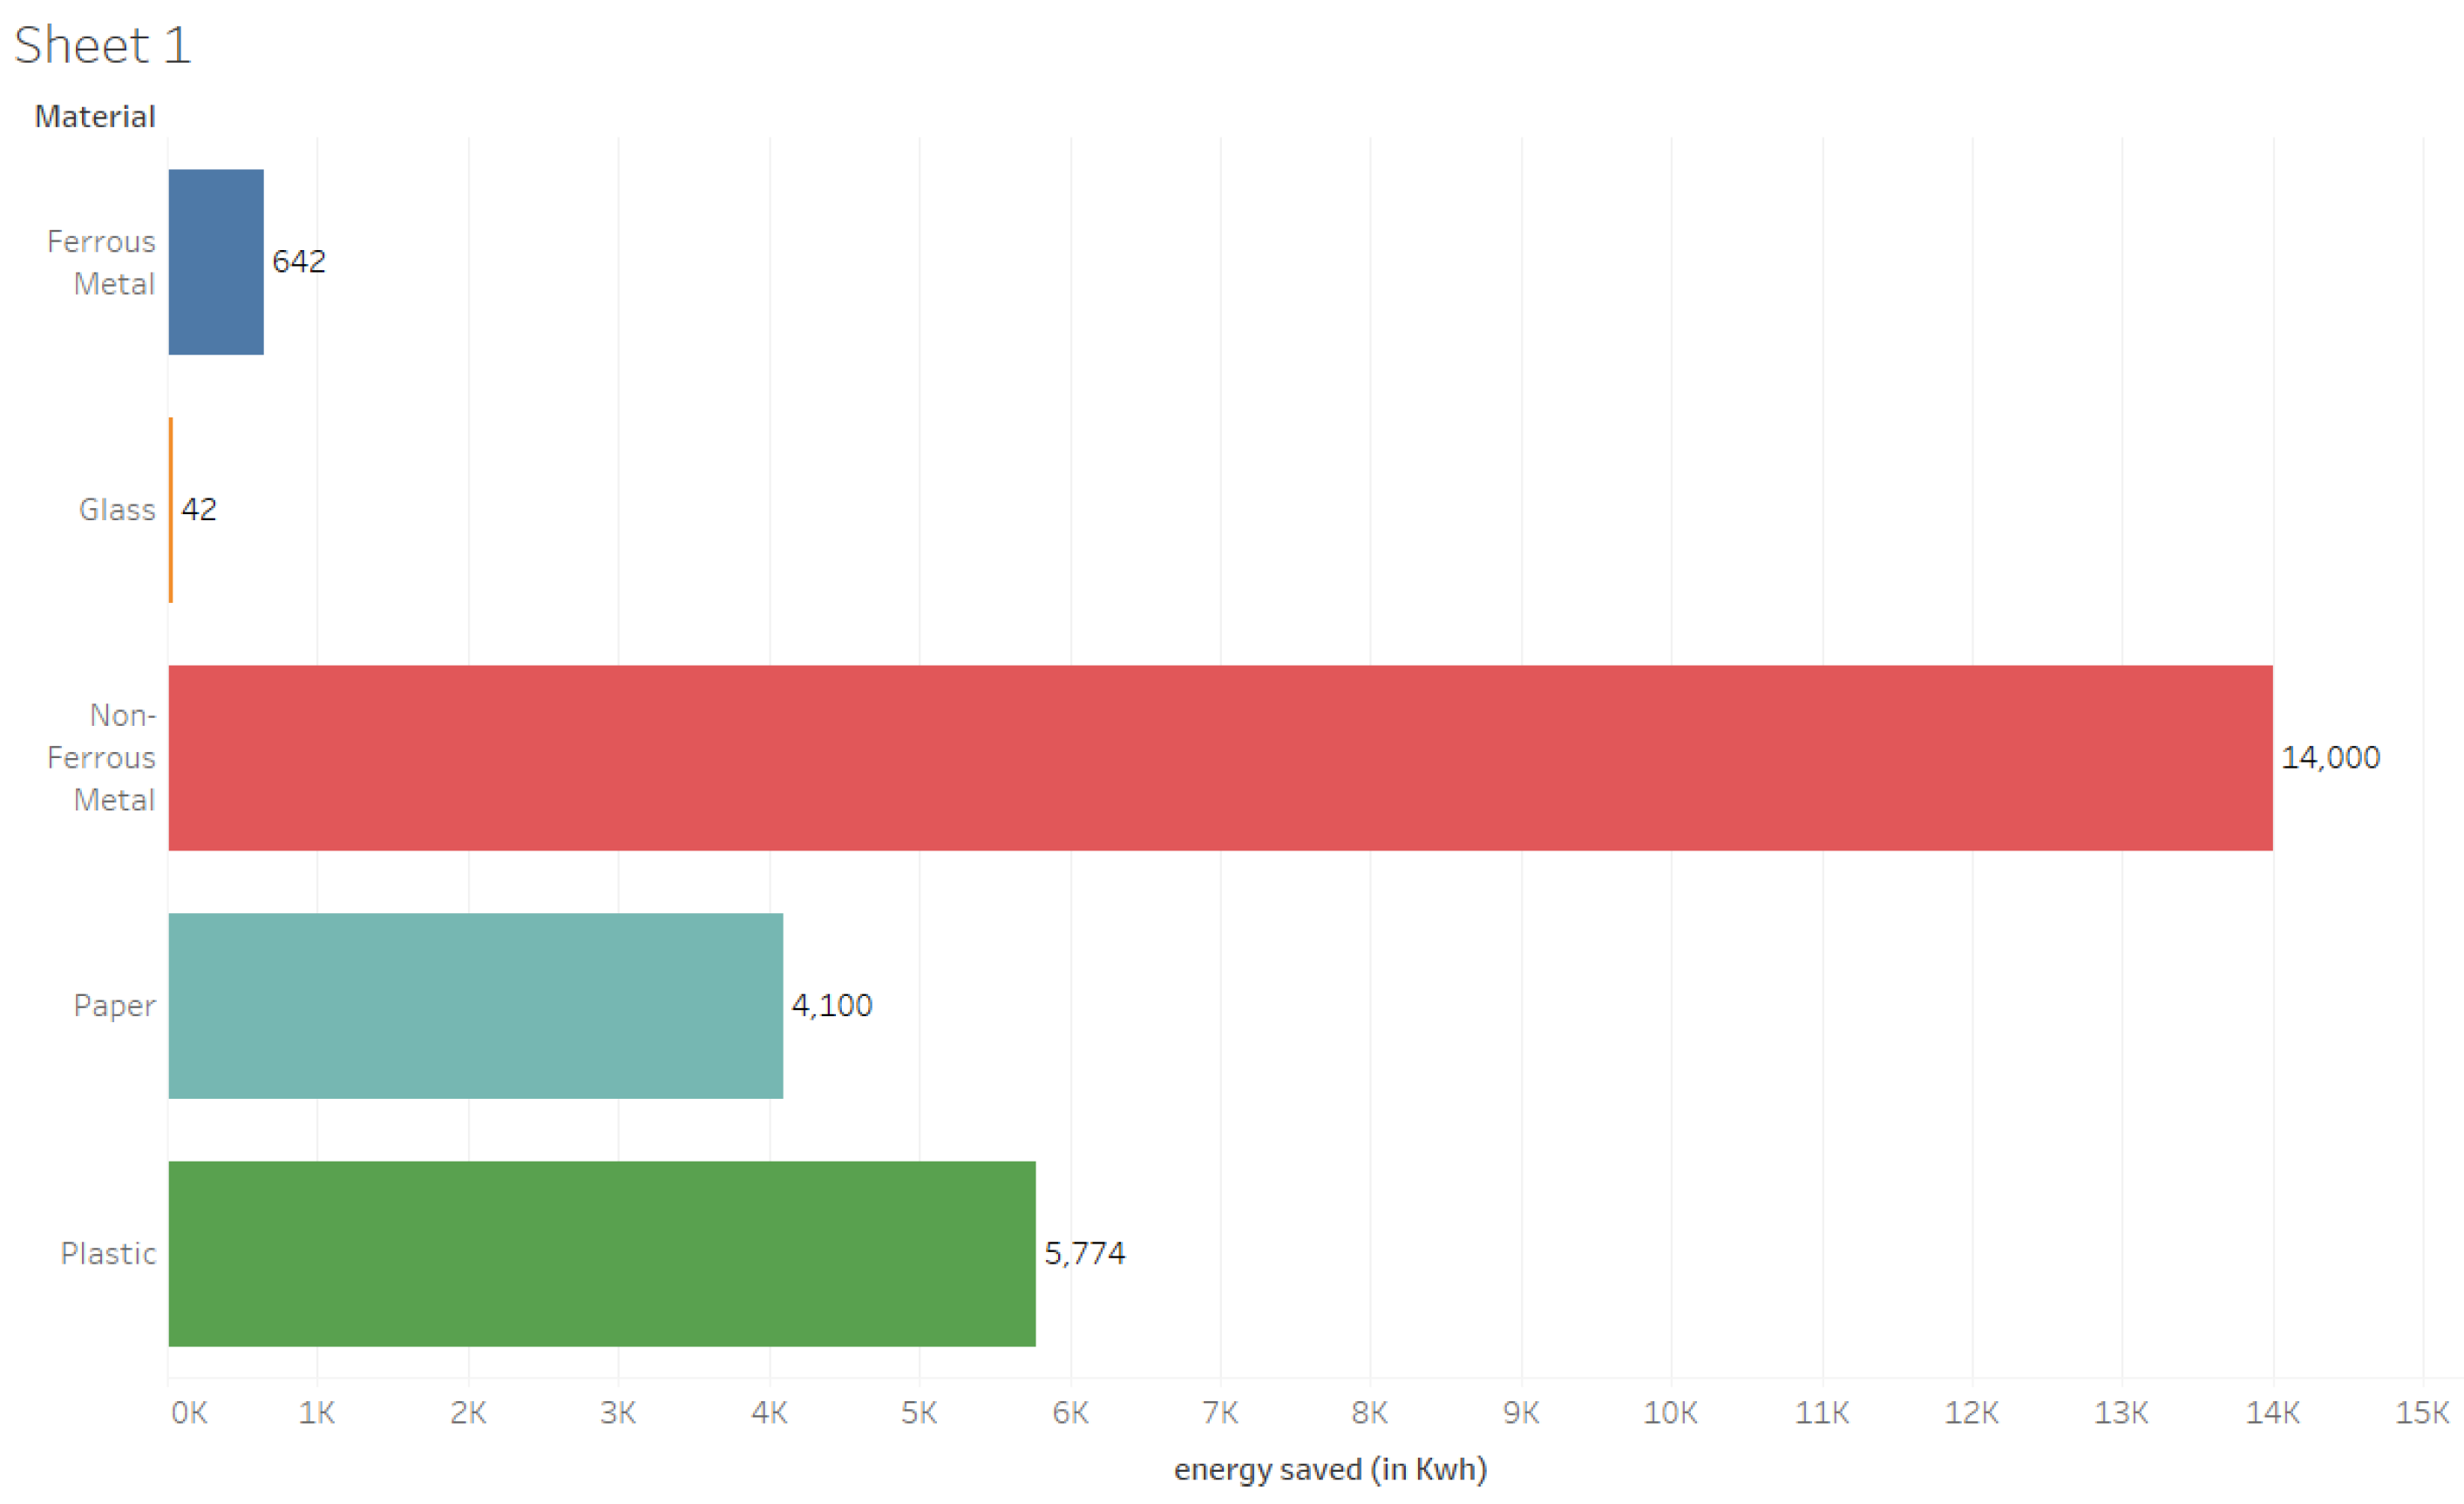
This visualisation depicts the energy saved (in kWh) by the recycling of 1 tonne of various materials. Of the commodities shown, non-ferrous metals provide the greatest energy savings at 14,000 kWh per tonne, markedly exceeding all other categories. Substantial energy savings are also contributed by plastic (5,774 kWh) and paper (4,100 kWh). Conversely, ferrous metals and glass save far less energy, at 642 kWh and 42 kWh, respectively.
Figure 9.
Crude Oil Saved by Recycling 1 Tonne of Material (in Barrels).
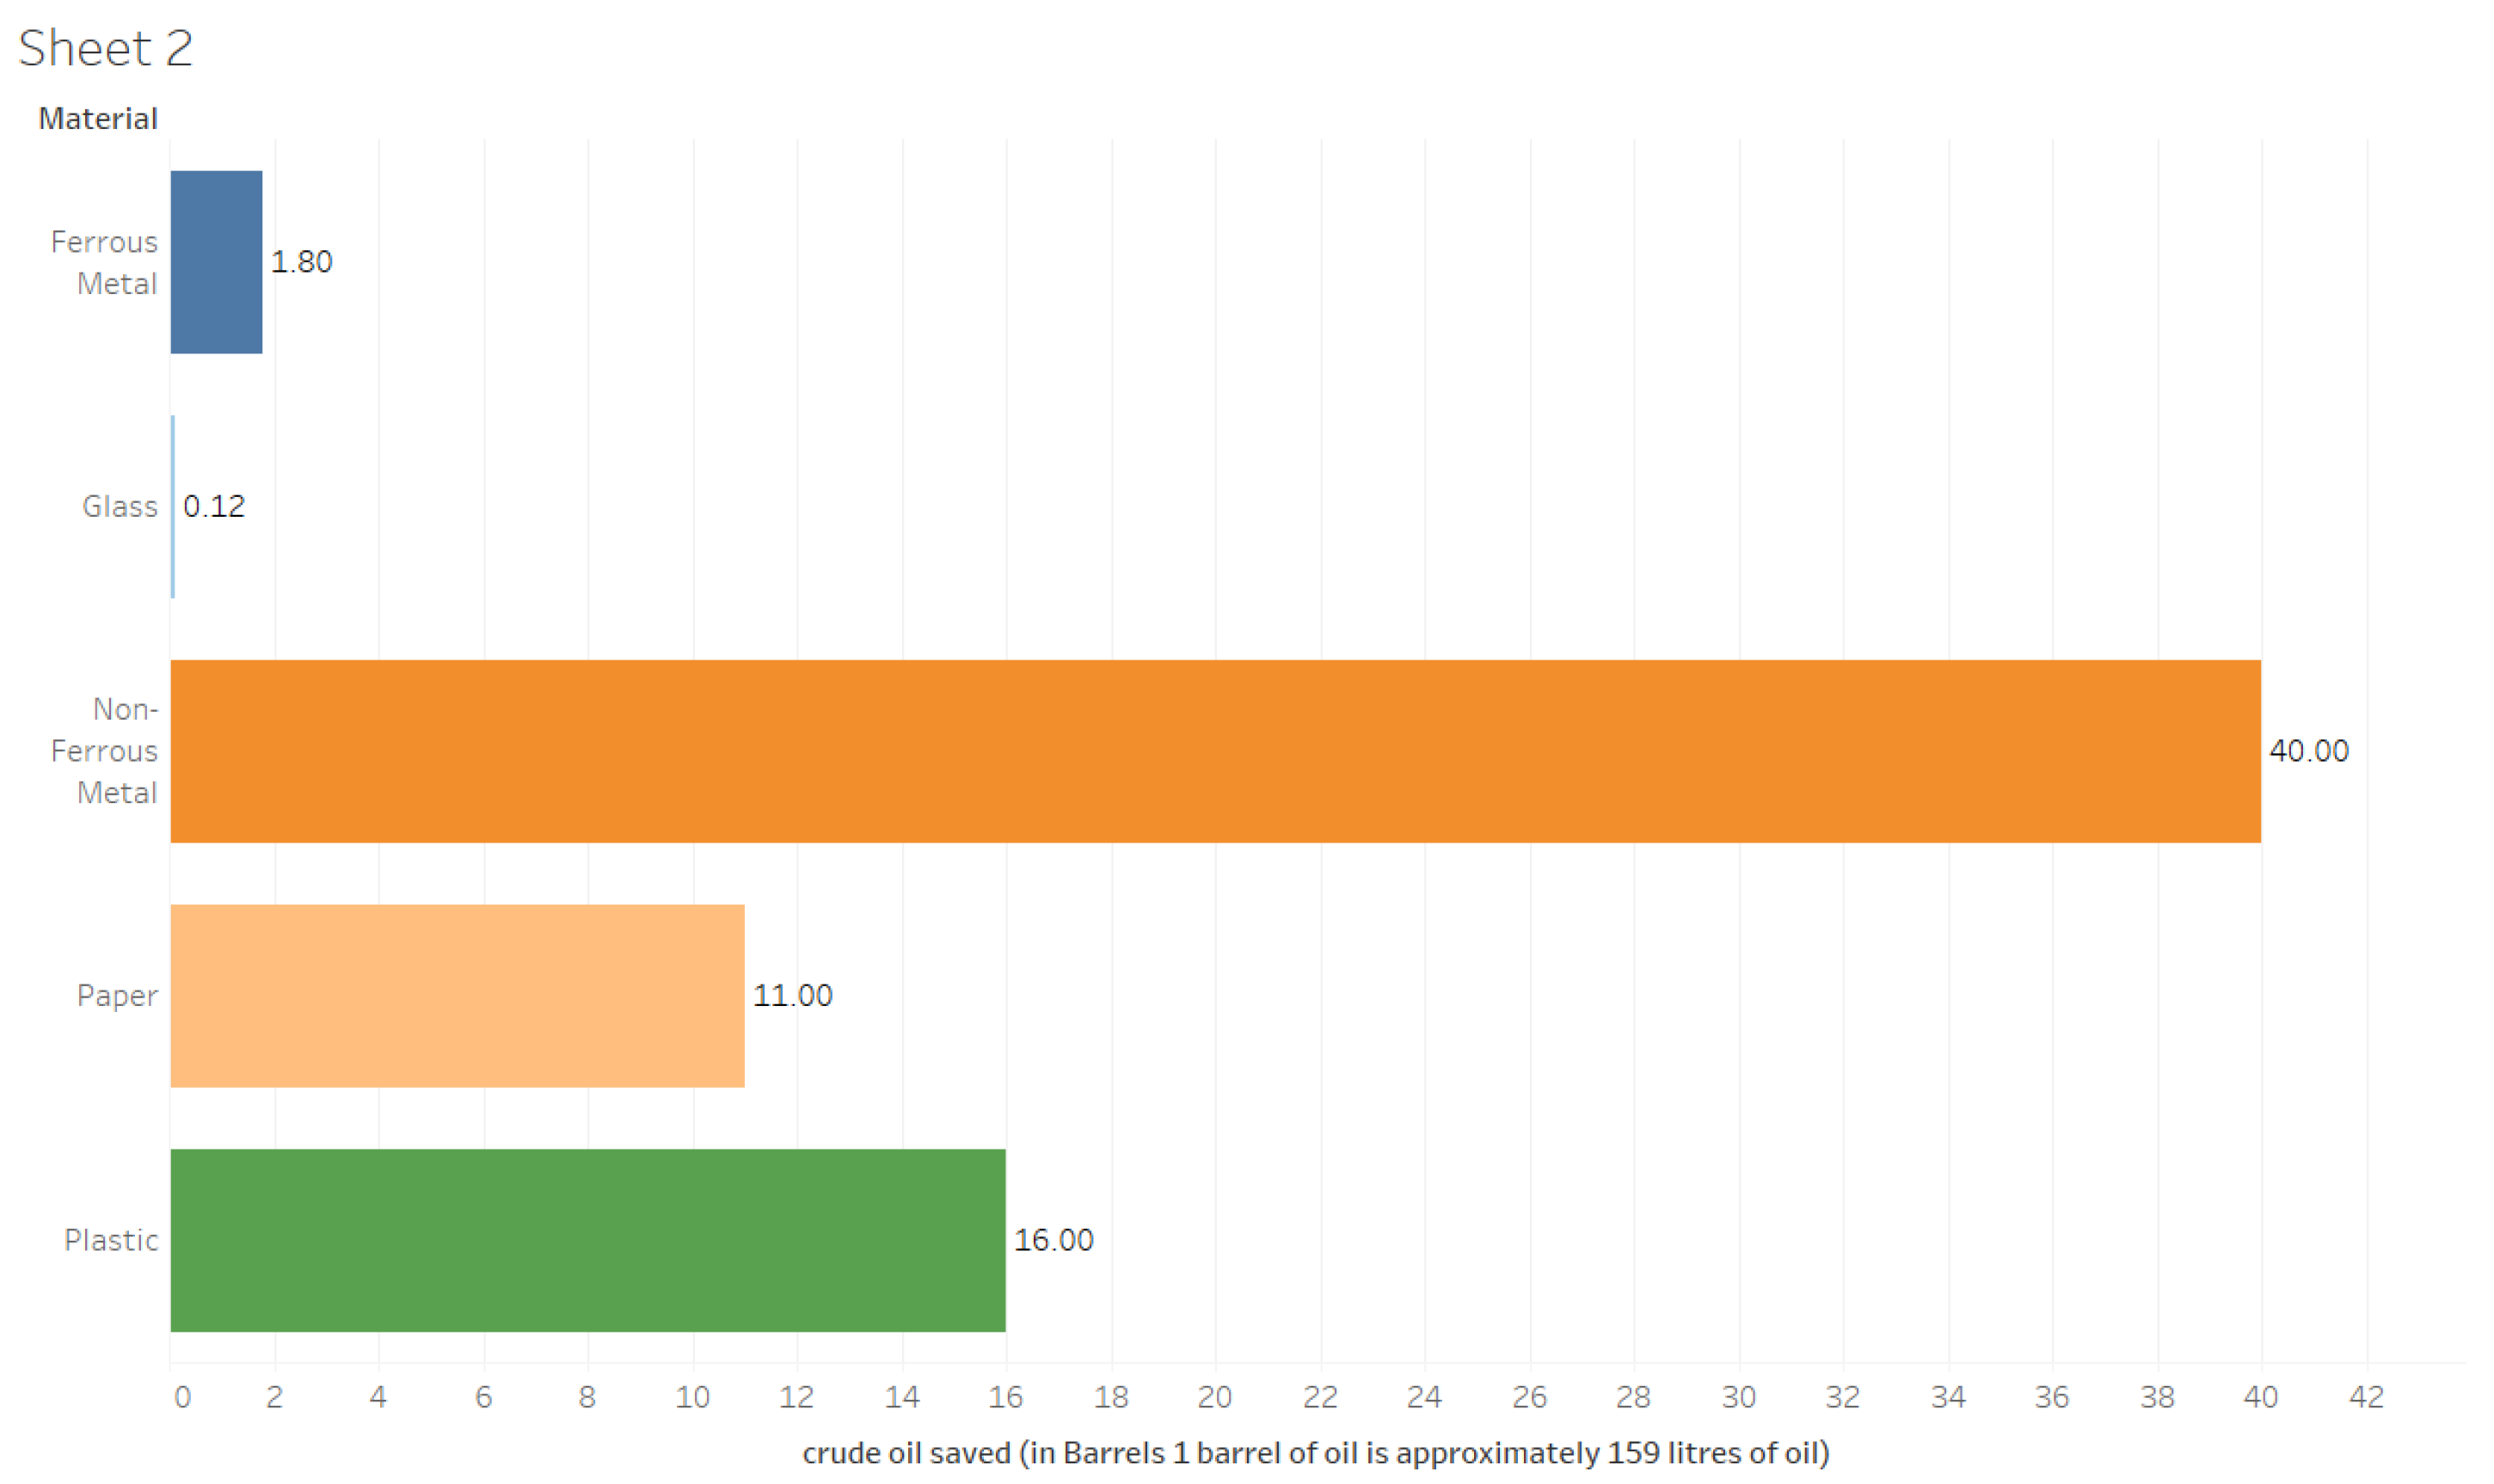
This visualisation illustrates the quantity of crude oil conserved, quantified in barrels, by the recycling of 1 tonne of different materials. Non-ferrous metals provide the greatest savings at 40 barrels per tonne, distinguishing themselves as the most significant in oil conservation. Subsequently, plastic (16 barrels) and paper (11 barrels) also play a substantial role in conserving crude oil. Conversely, recycling ferrous metals and glass yields little savings, amounting to about 1.80 and 0.12 barrels, respectively. This highlights the environmental benefit of prioritising the recycling of non-ferrous metals and plastics, since they significantly decrease fossil fuel use.
Figure 10.
Energy and Oil Saved per Tonne Recycled by Material.
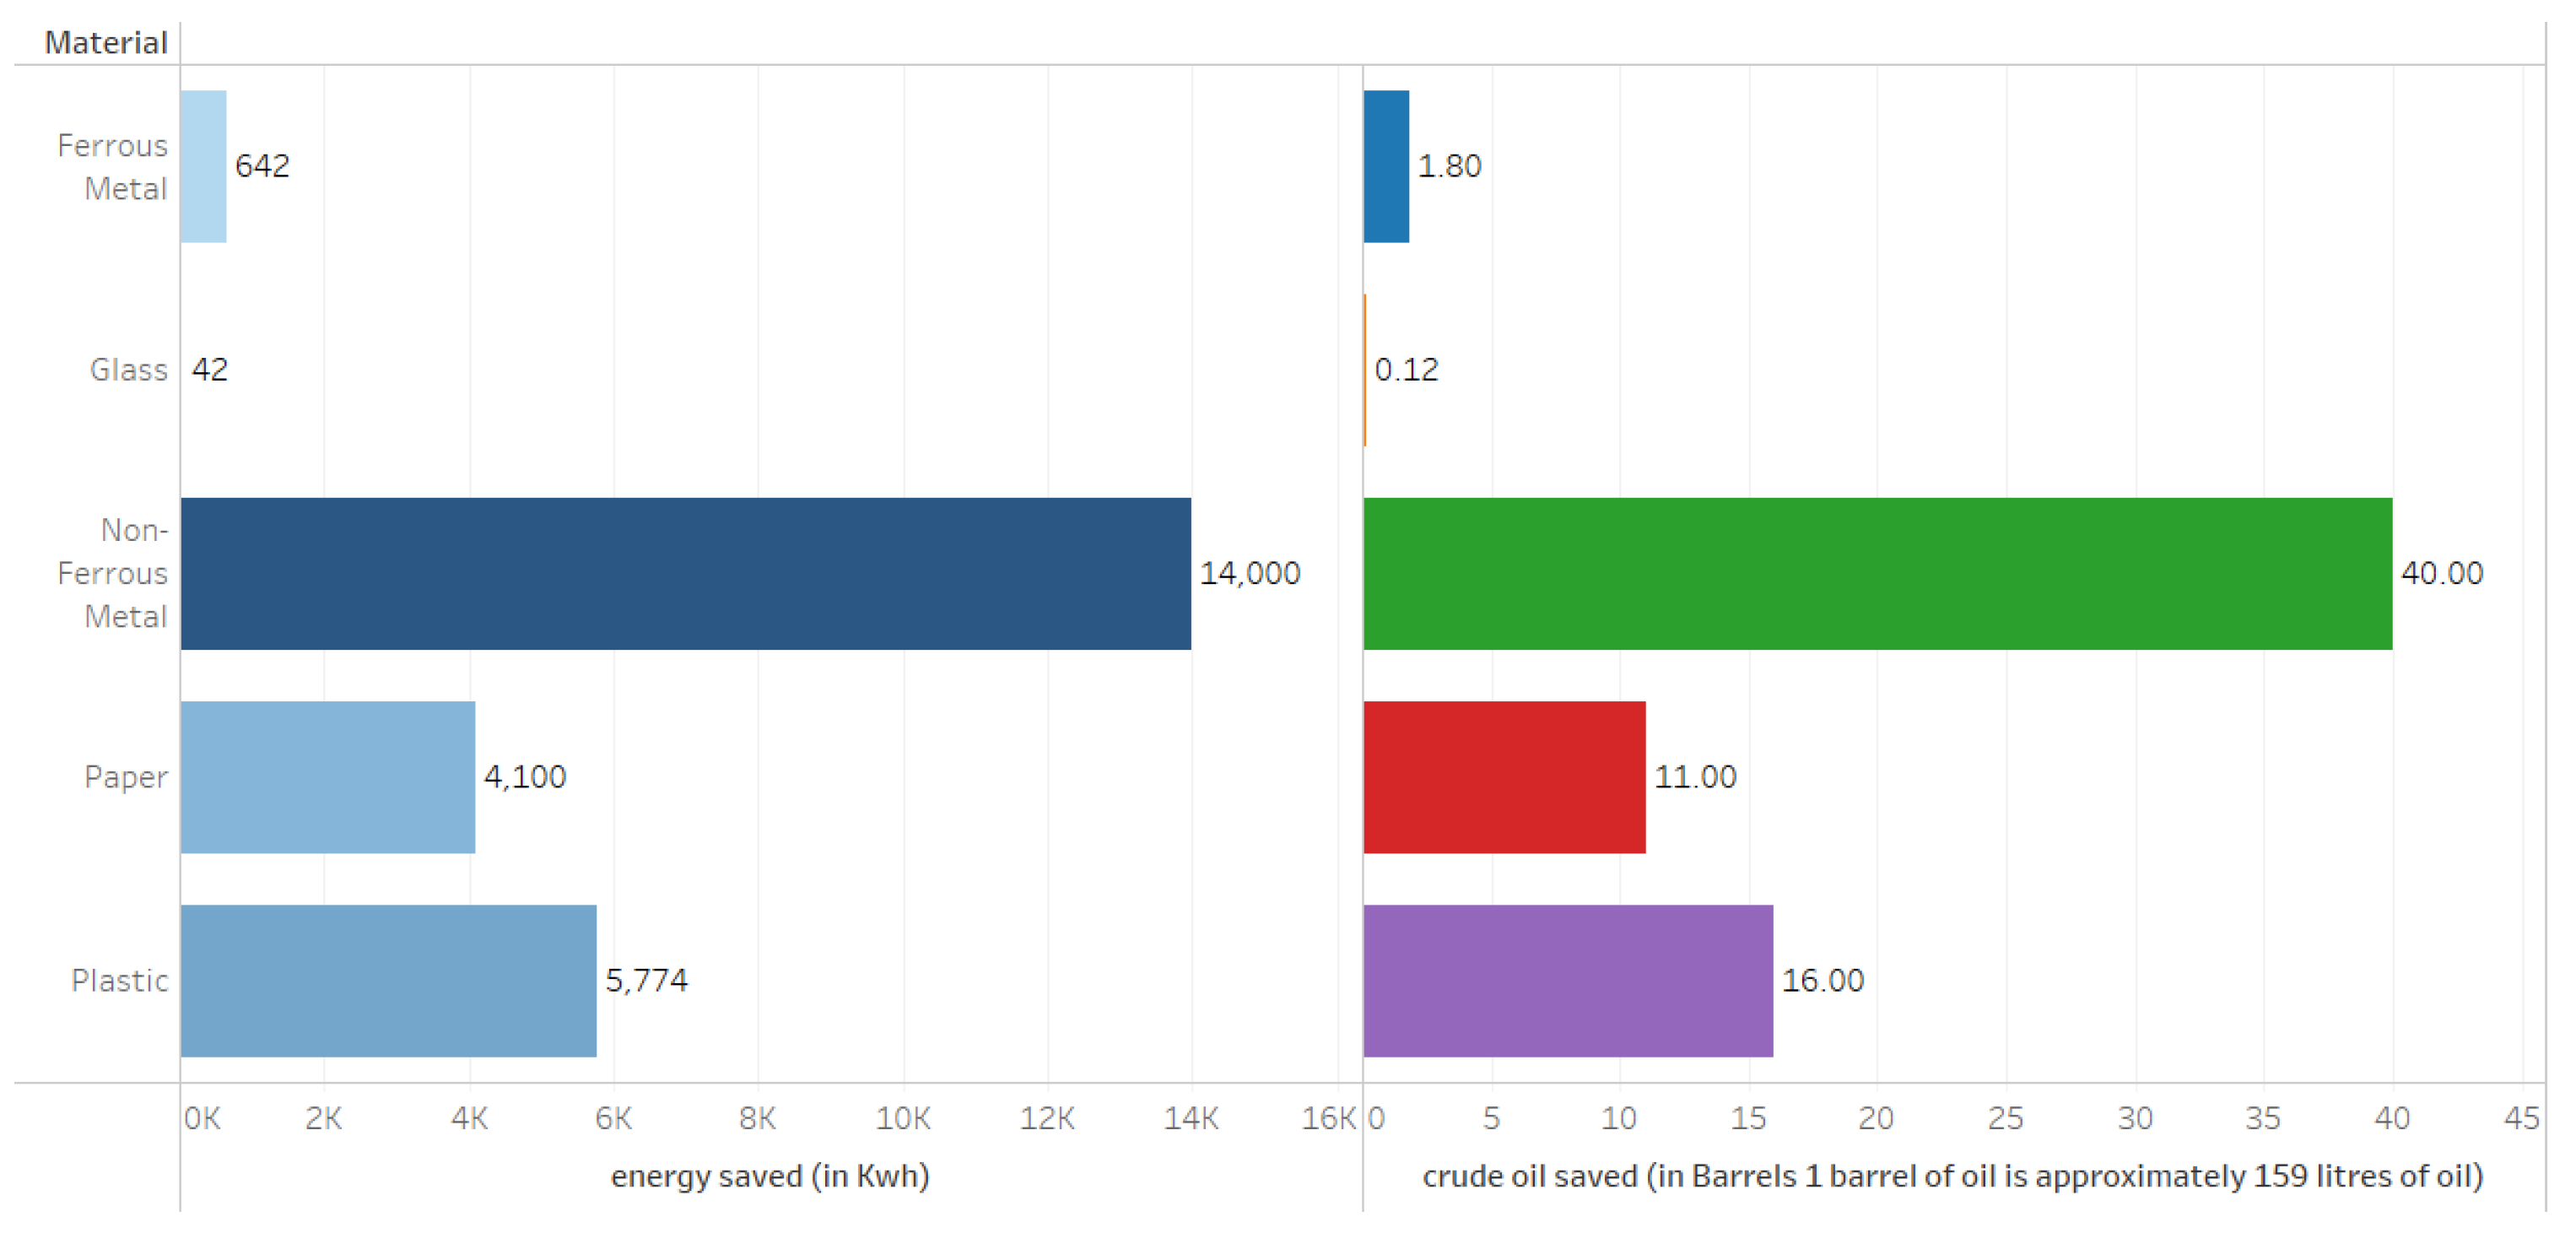
The following visualization builds on the previous chart by presenting not only the amount of crude oil saved but also the energy saved (in kWh) from recycling 1 tonne of various materials. While the crude oil savings data mirrors the earlier visual, this chart adds further insight by quantifying energy savings across materials. Non-ferrous metals remain the most impactful, conserving 14,000 kWh per tonne, far exceeding all other categories. Plastic and paper follow with 5,774 kWh and 4,100 kWh respectively. In contrast, ferrous metals and glass show minimal energy savings at only 642 kWh and 42 kWh.
3.4.2. Group B: Waste by Type – Plastic, Food, Paper
This group looks at the years 2014 to 2023 and focuses on the three types of waste that cause most concern in Singapore: plastic, food and paper. By comparing the amount of waste over different times, the study tries to discover the kinds that create the most difficulties and where positive changes can be implemented.
Figure 11.
Annual Waste Generation by Type in Singapore (2013–2023).
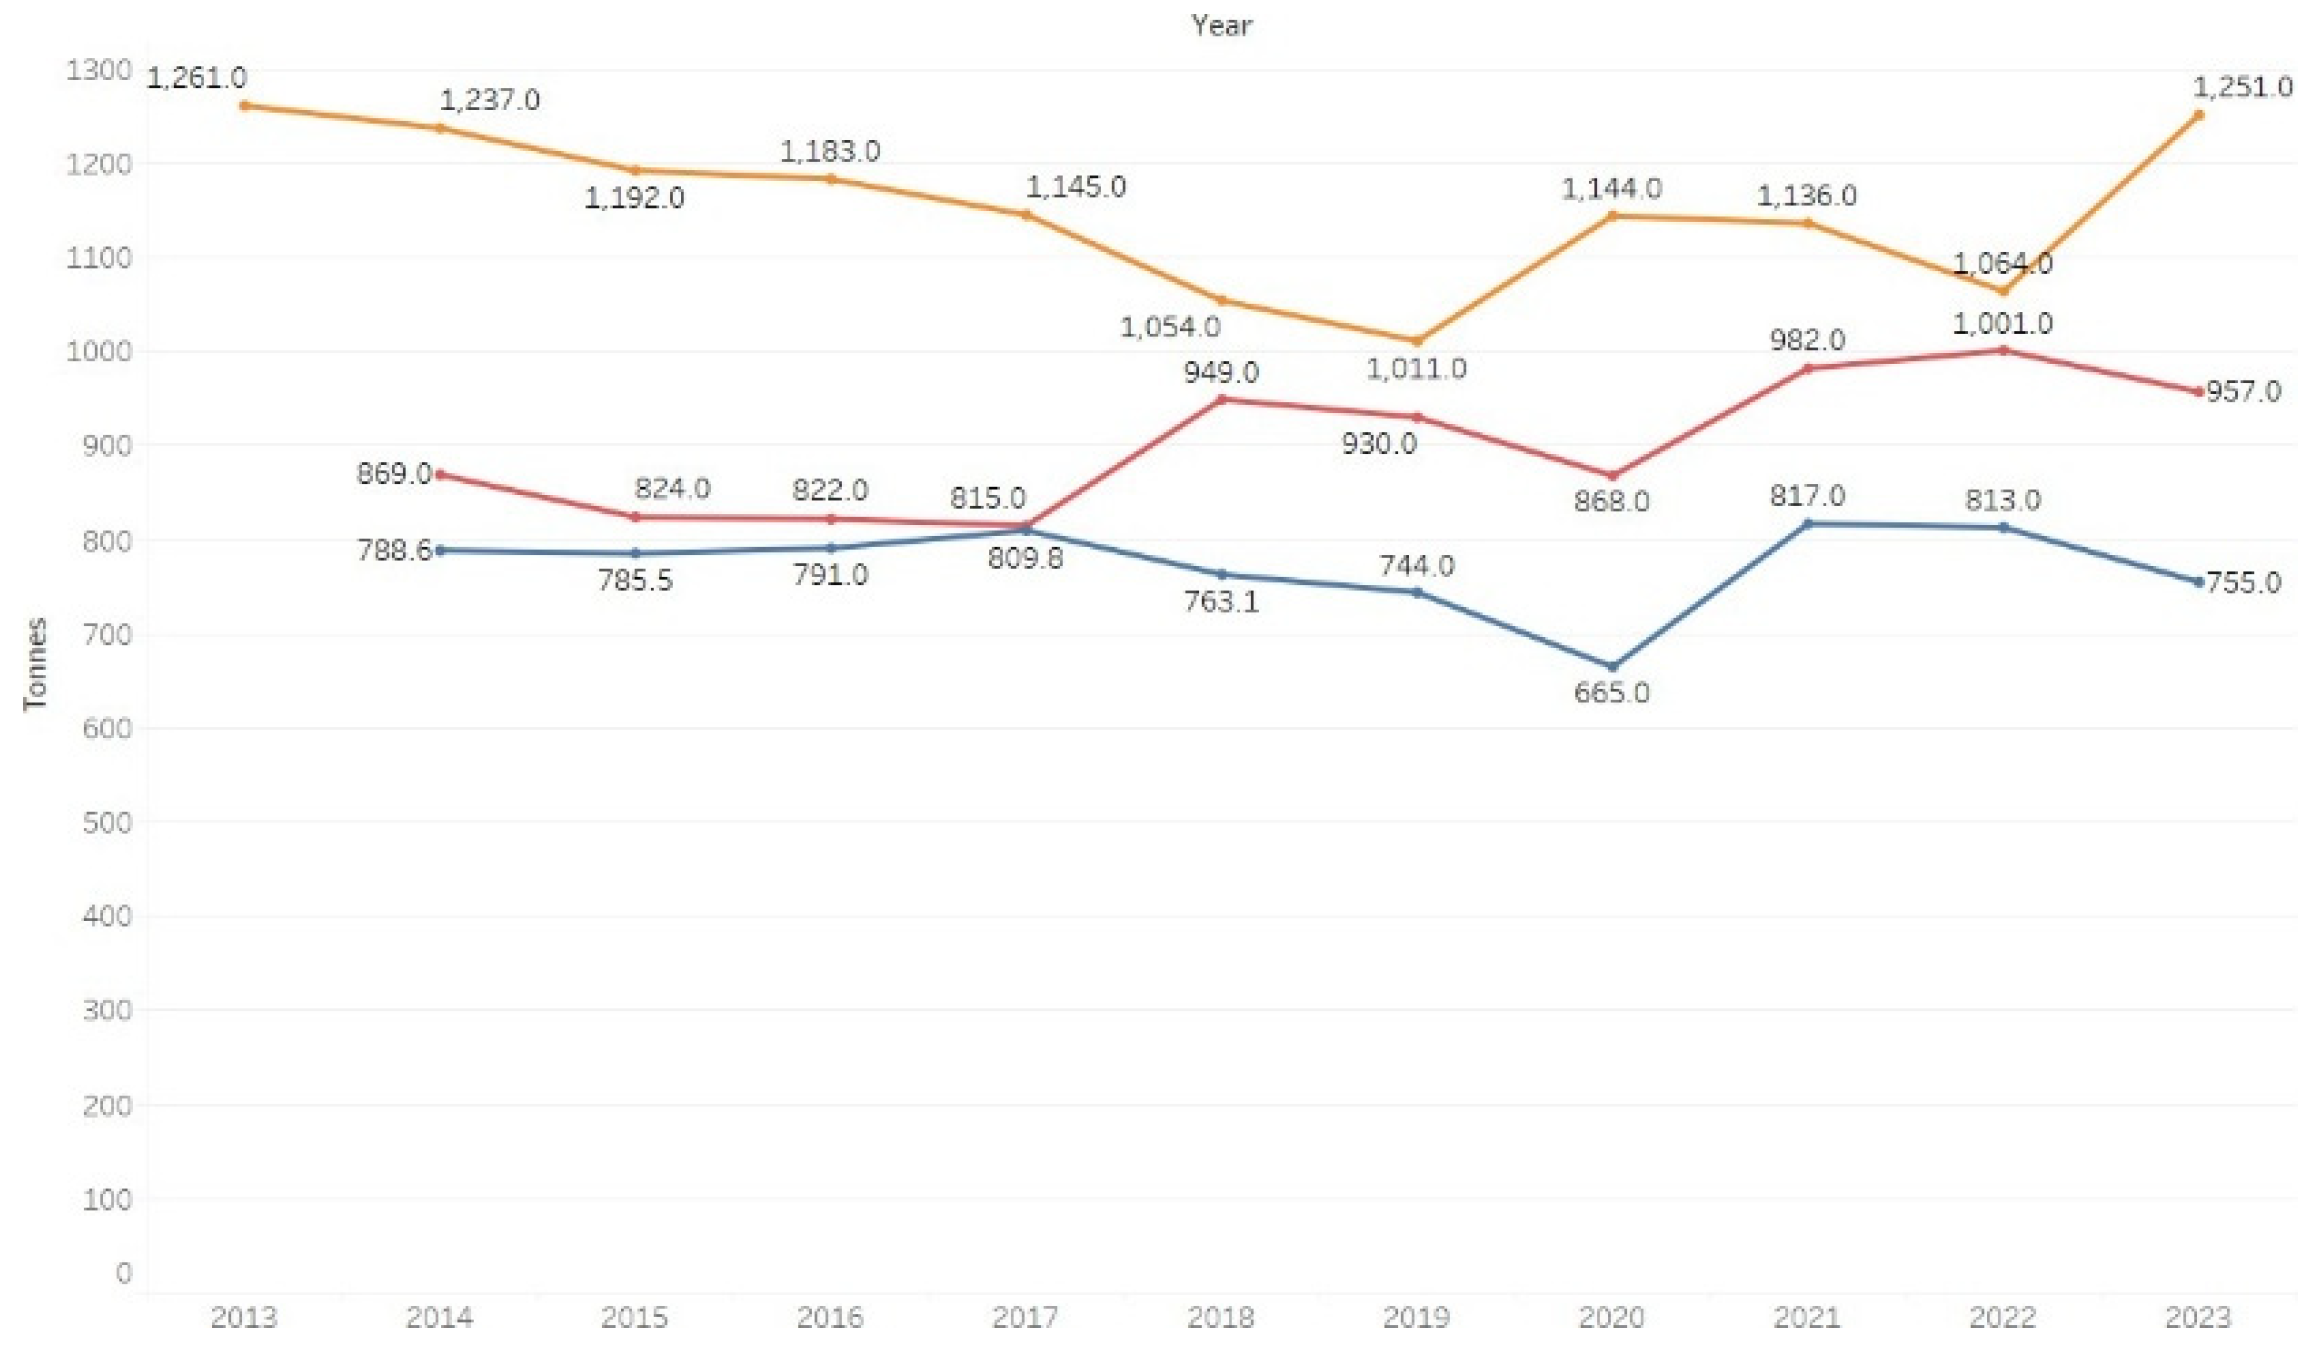
This visualisation depicts the yearly trash production in Singapore from 2013 to 2023, classified by food, paper, and plastic waste. Throughout the 11-year span, paper trash continually constituted the predominant contributor until 2020, when plastic garbage overtook it, culminating in a significant rise to 1,251.0 tonnes in 2023. Food waste showed a progressive decrease from 788.6 tonnes in 2013 to a minimum of 665.0 tonnes in 2020, thereafter increasing and stabilising between 750 and 820 tonnes in recent years. The variations indicate a transformation in consuming behaviours, with plastic trash becoming more prevalent, perhaps attributable to an increased dependence on packaging and disposable items in recent years. The decrease in paper waste may indicate digitalisation and less paper use.
Figure 12.
Distribution of Waste Volume by Type (2013–2023).
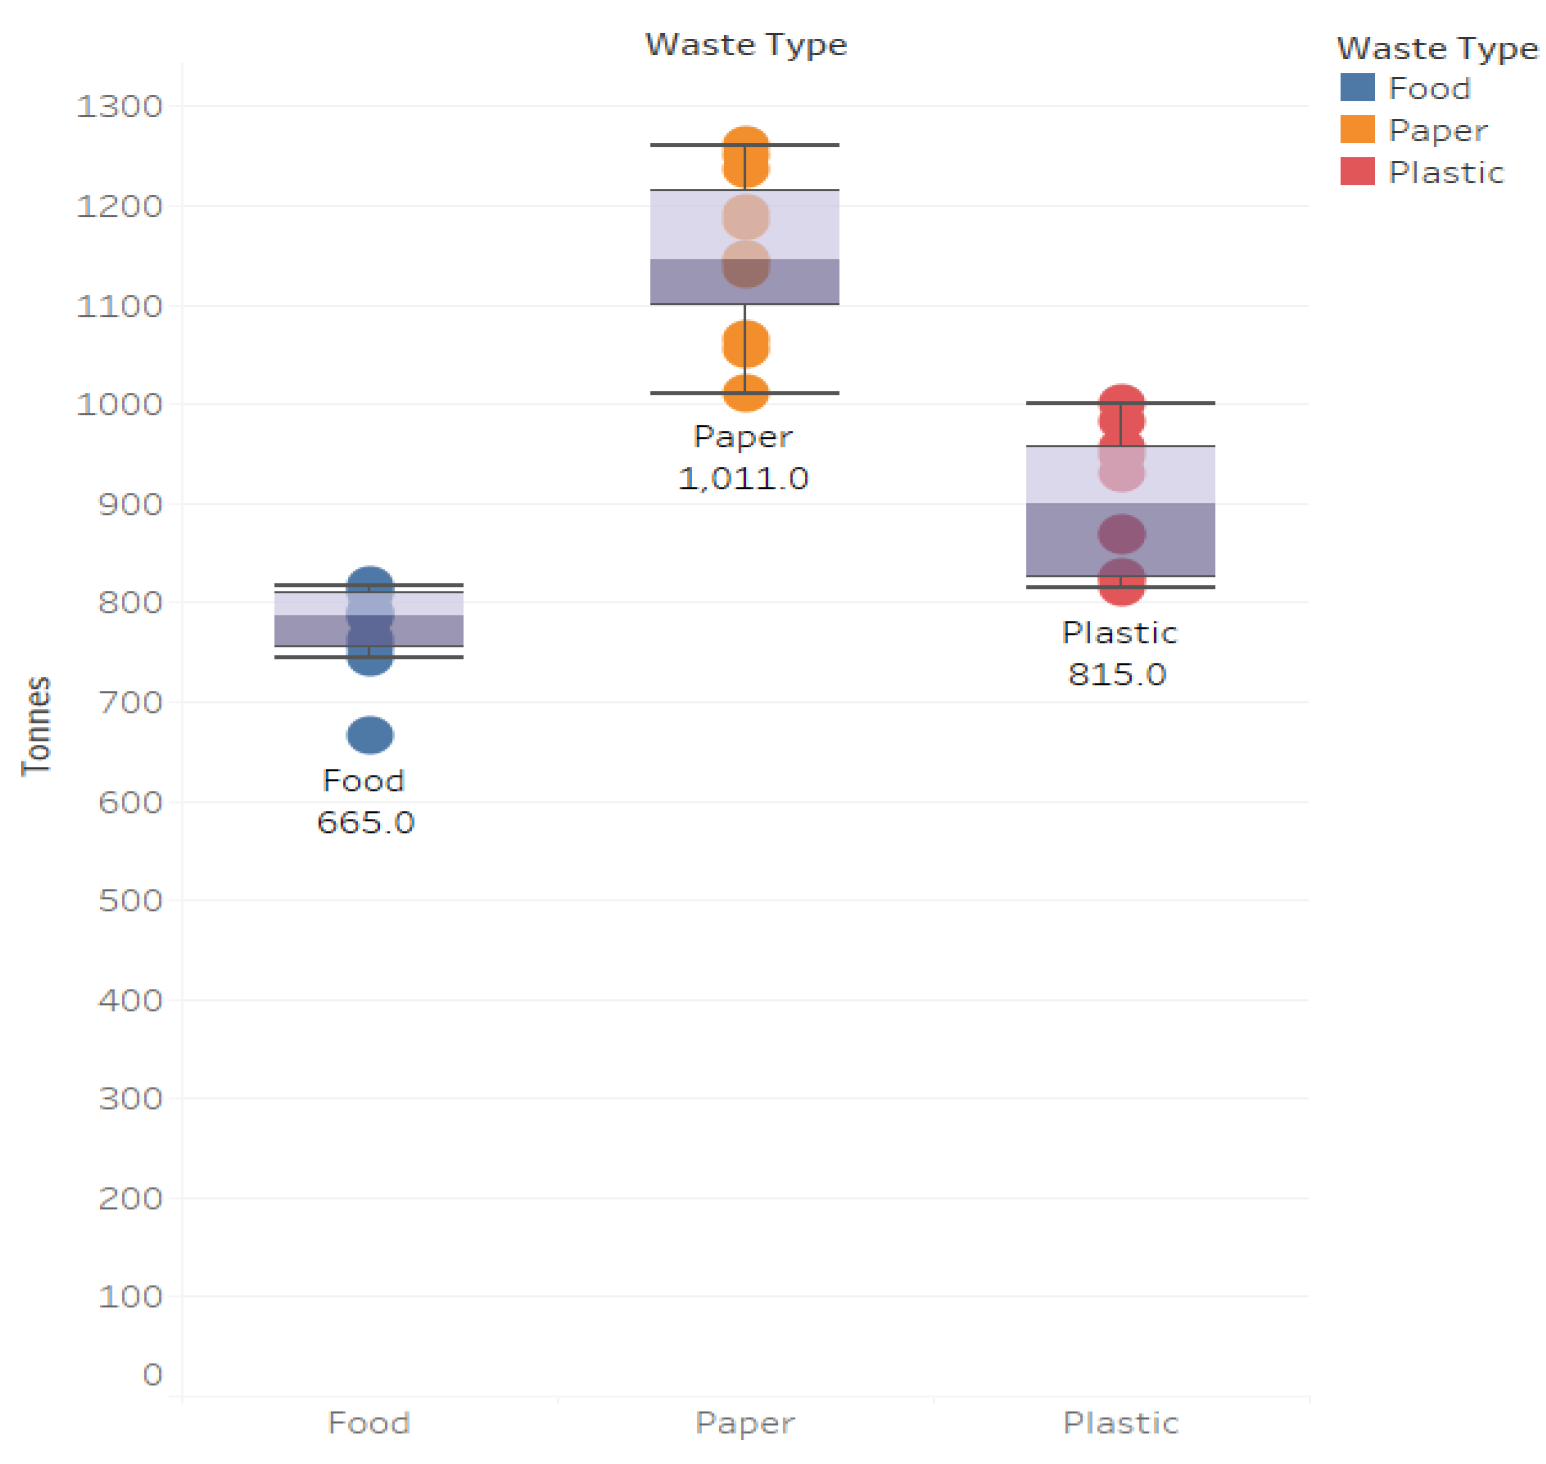
This visualisation illustrates the distribution of waste volumes by type in Singapore from 2013 to 2023, using a box plot approach to emphasise variation across food, paper, and plastic trash. Paper waste has the greatest total volume, with a median of around 1,011 tonnes and a broader distribution, indicating more annual variability. Plastic garbage, albeit somewhat reduced in amount (median: 815 tonnes), has a more concentrated distribution, indicating rather consistent production levels throughout the years. Food waste, with the lowest median of 665 tonnes, also shows the least variability. This figure enhances the prior time-series visualisation by highlighting the consistency and variability of trash creation across categories, underscoring that while paper waste is generally predominant, plastic waste has shown more stability over time.
Figure 13.
Comparison of Waste Types in [2013, 2017, 2020, 2023].
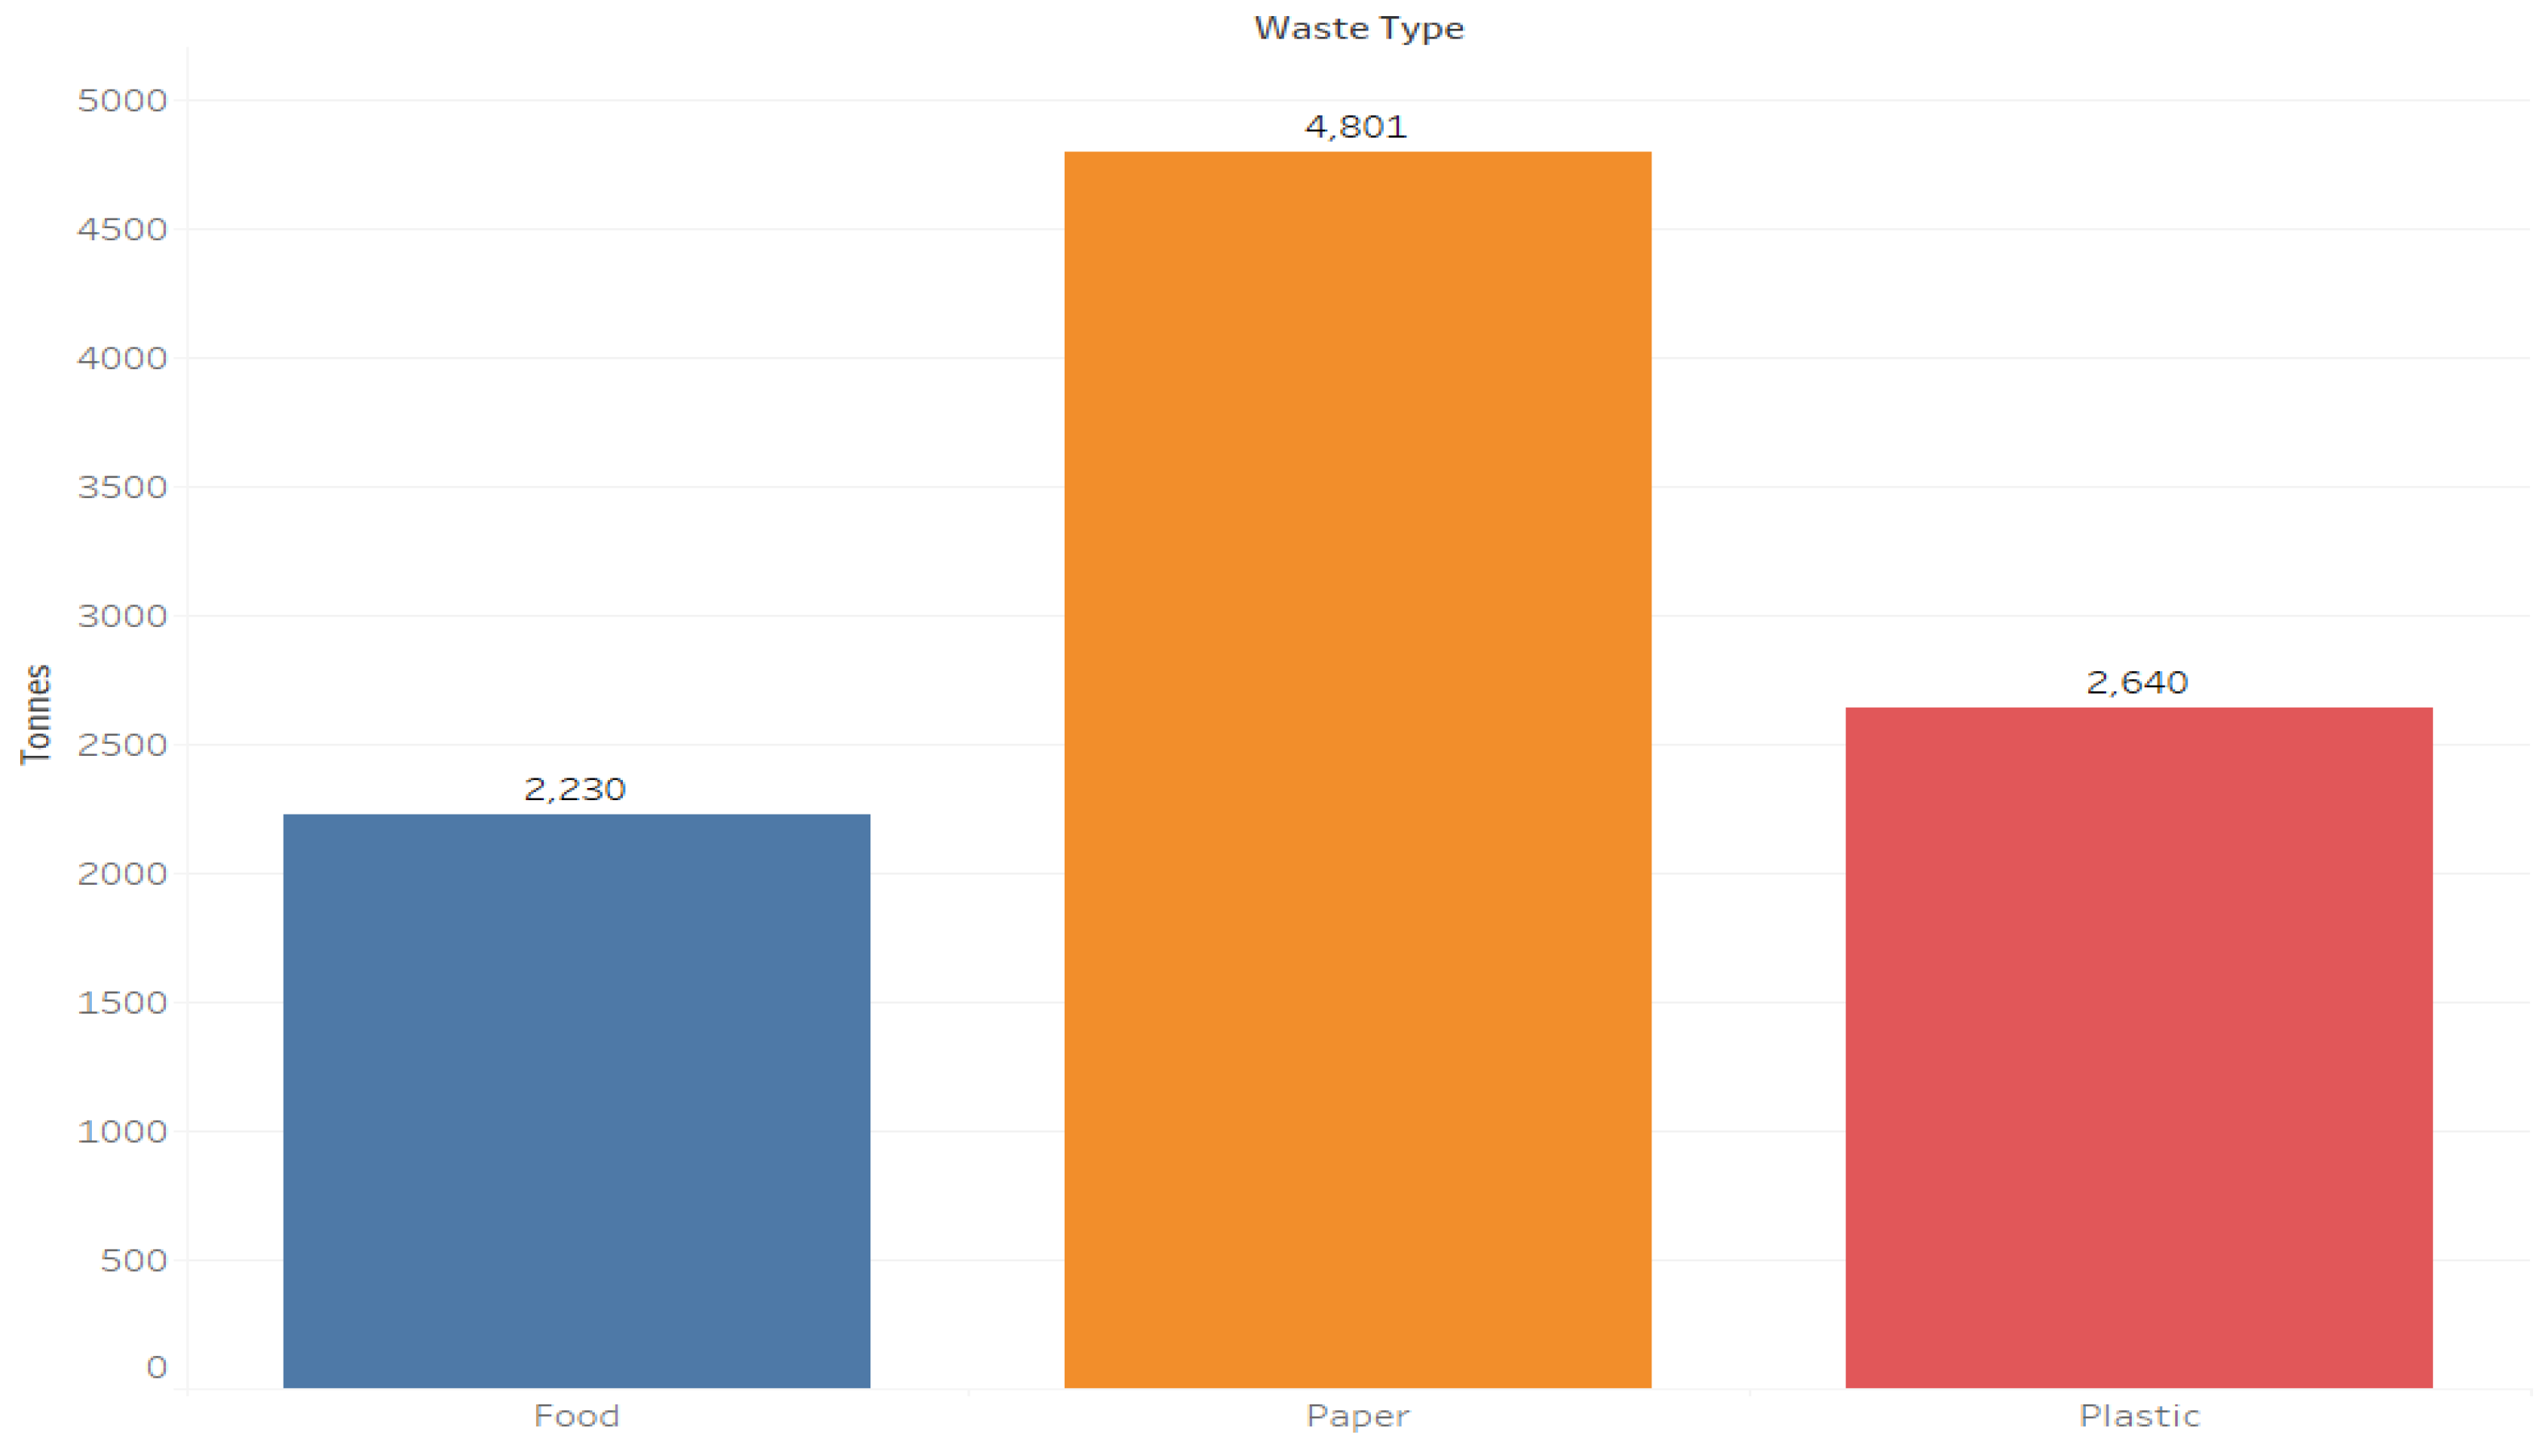
This visualisation contrasts the total trash produced by food, paper, and plastic categories in the years 2013, 2017, 2020, and 2023. Of the three, paper trash is unequivocally the most prevalent, amounting to 4,801 tonnes, much exceeding both plastic and food waste. Plastic waste amounts to 2,640 tonnes, whilst food waste is the least at 2,230 tonnes. This consolidated overview underscores the enduring prevalence of paper waste throughout time, while also indicating a comparable level of food and plastic waste.
3.4.3. Group C: Recycling and Waste Management Rates
Group C researches the number of people who recycle, studies family garbage routines, and analyzes waste handling practices in different nations. The chapter points out the differences in recycling between different industries and identifies the greatest issues in current recycling systems between 2014 and 2023.
Figure 14.
Comparison of Recycled and Disposed Waste in Singapore (2014–2023).
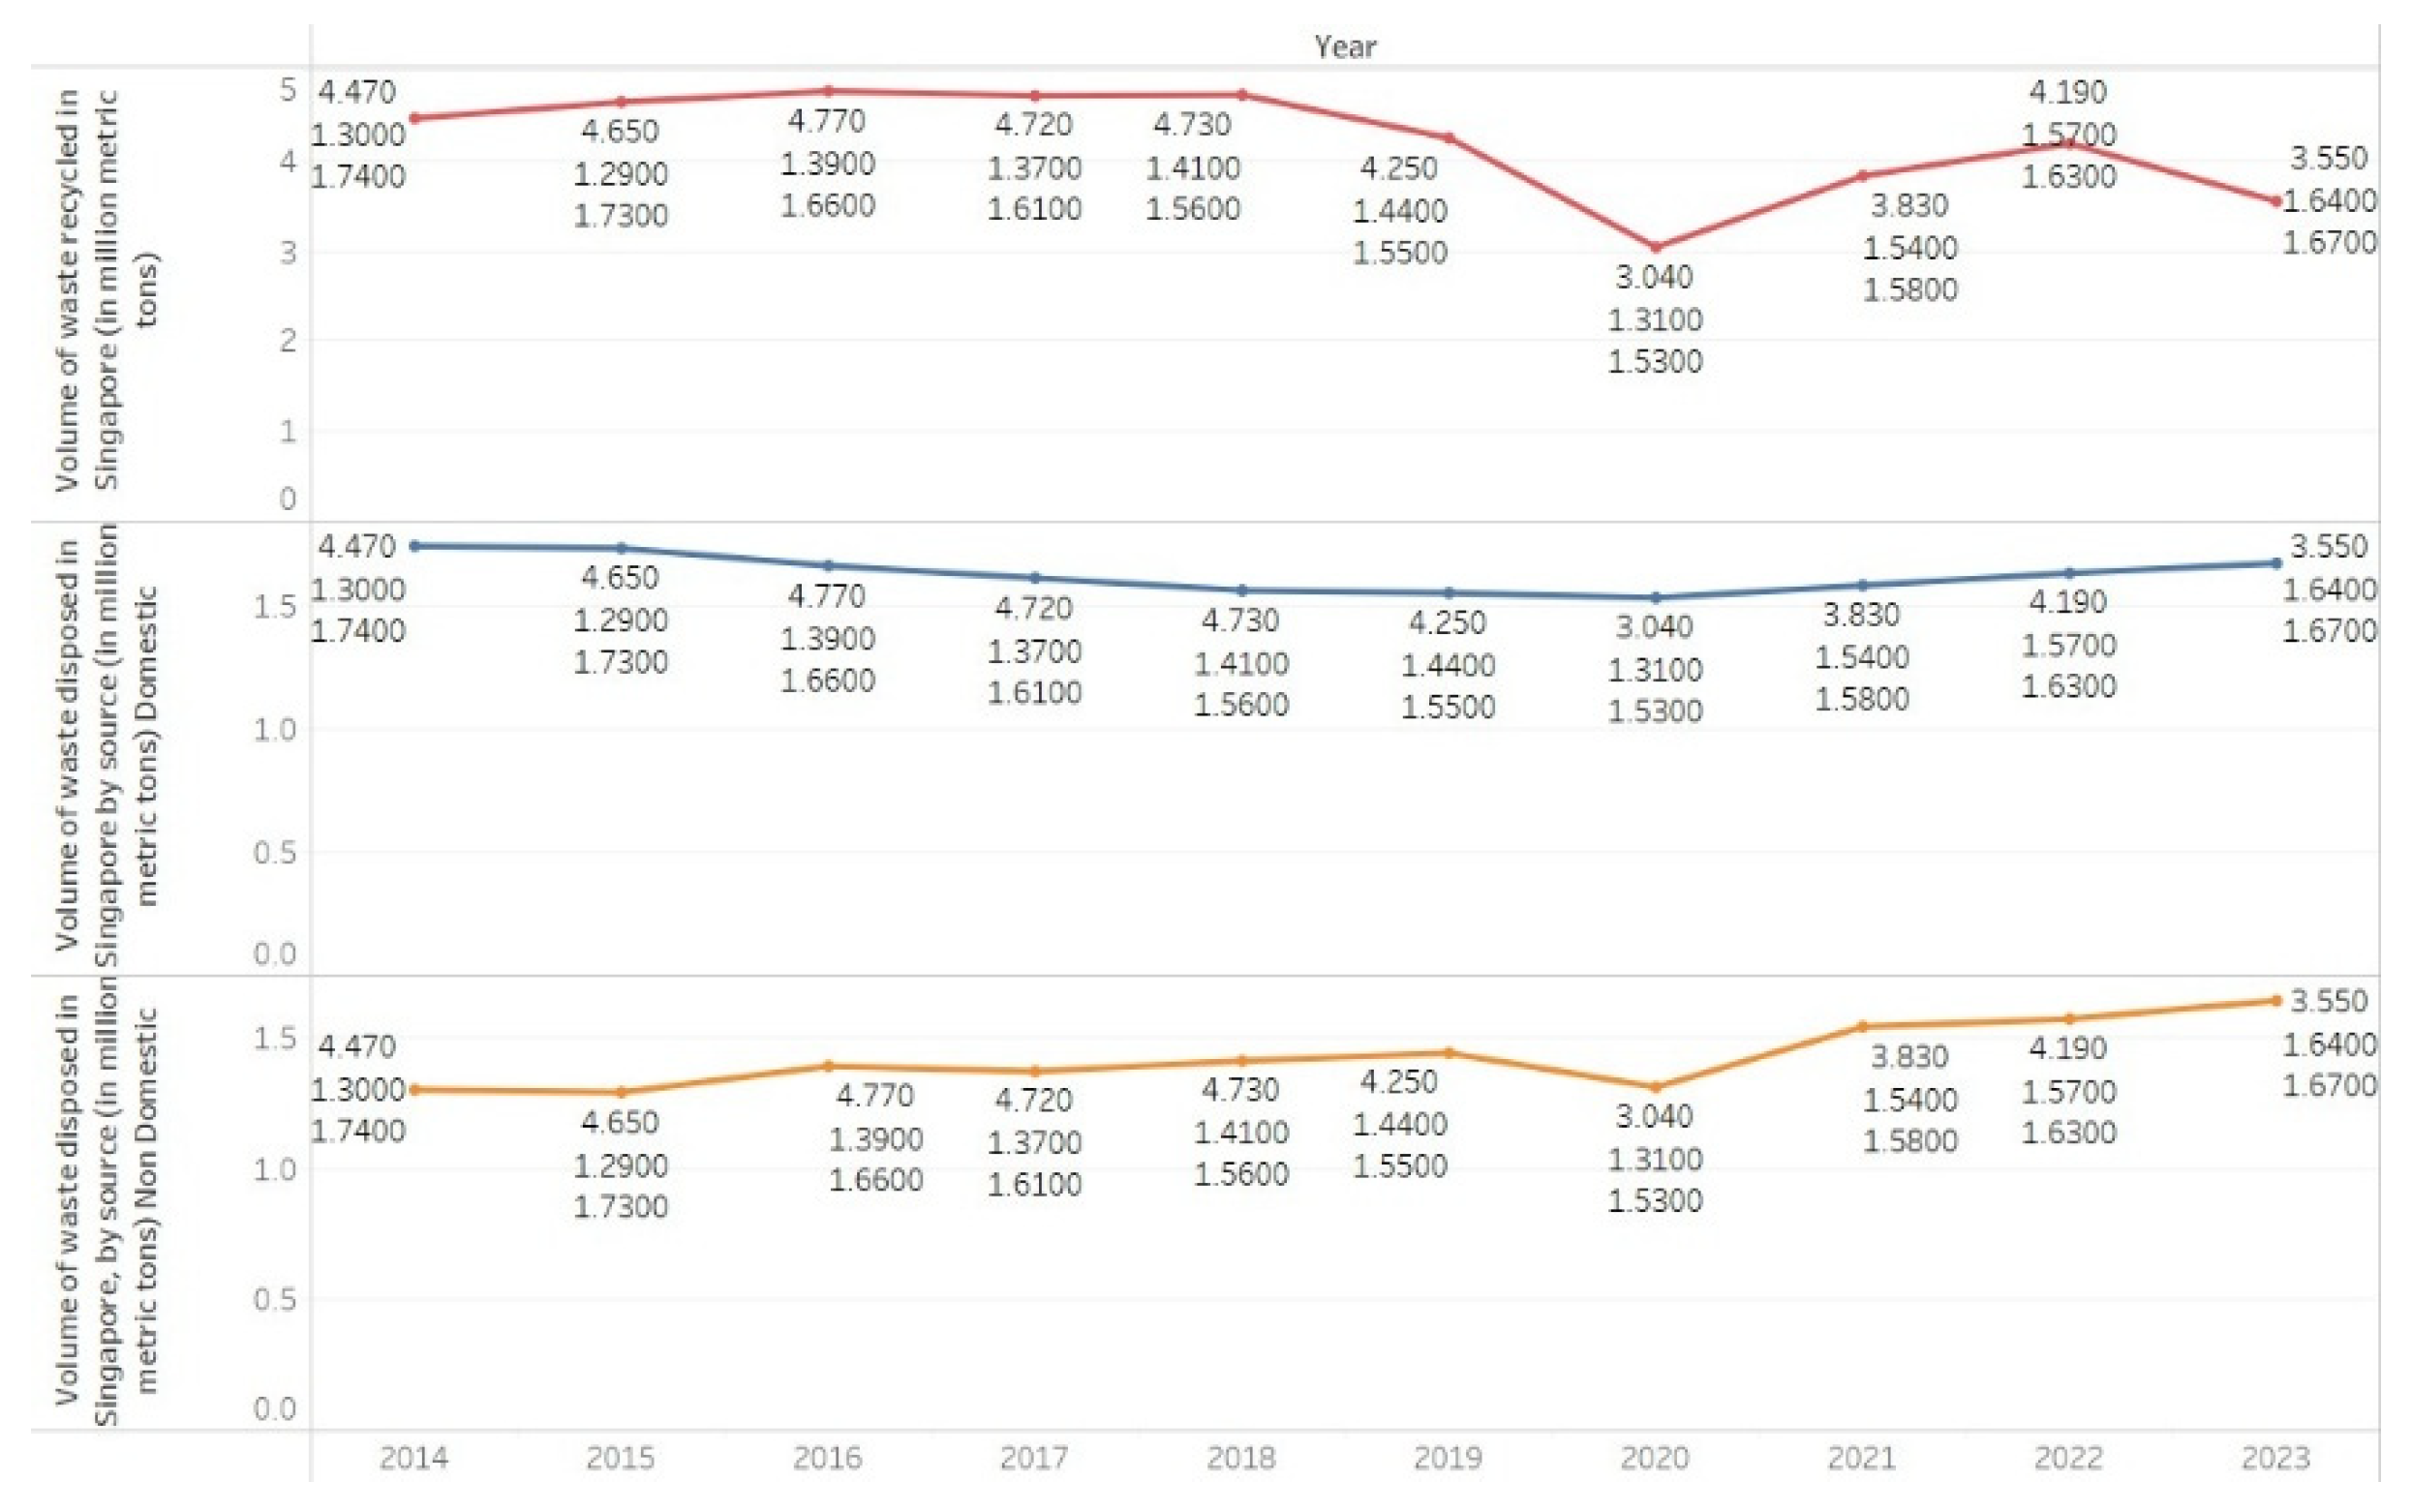
The visualisation shows Singapore's garbage recycling and disposal from 2014 to 2023. Recycling remained constant, with a slight decline in 2019 before rising again in 2023. Discharged garbage showed a significant disparity between home and non-domestic industries, with non-domestic disposal increasing steadily. This highlights the need for stronger waste reduction strategies alongside recycling.
Figure 15.
Relationship Between Recycling Volume and Overall National Recycling Rate (2014–2023).
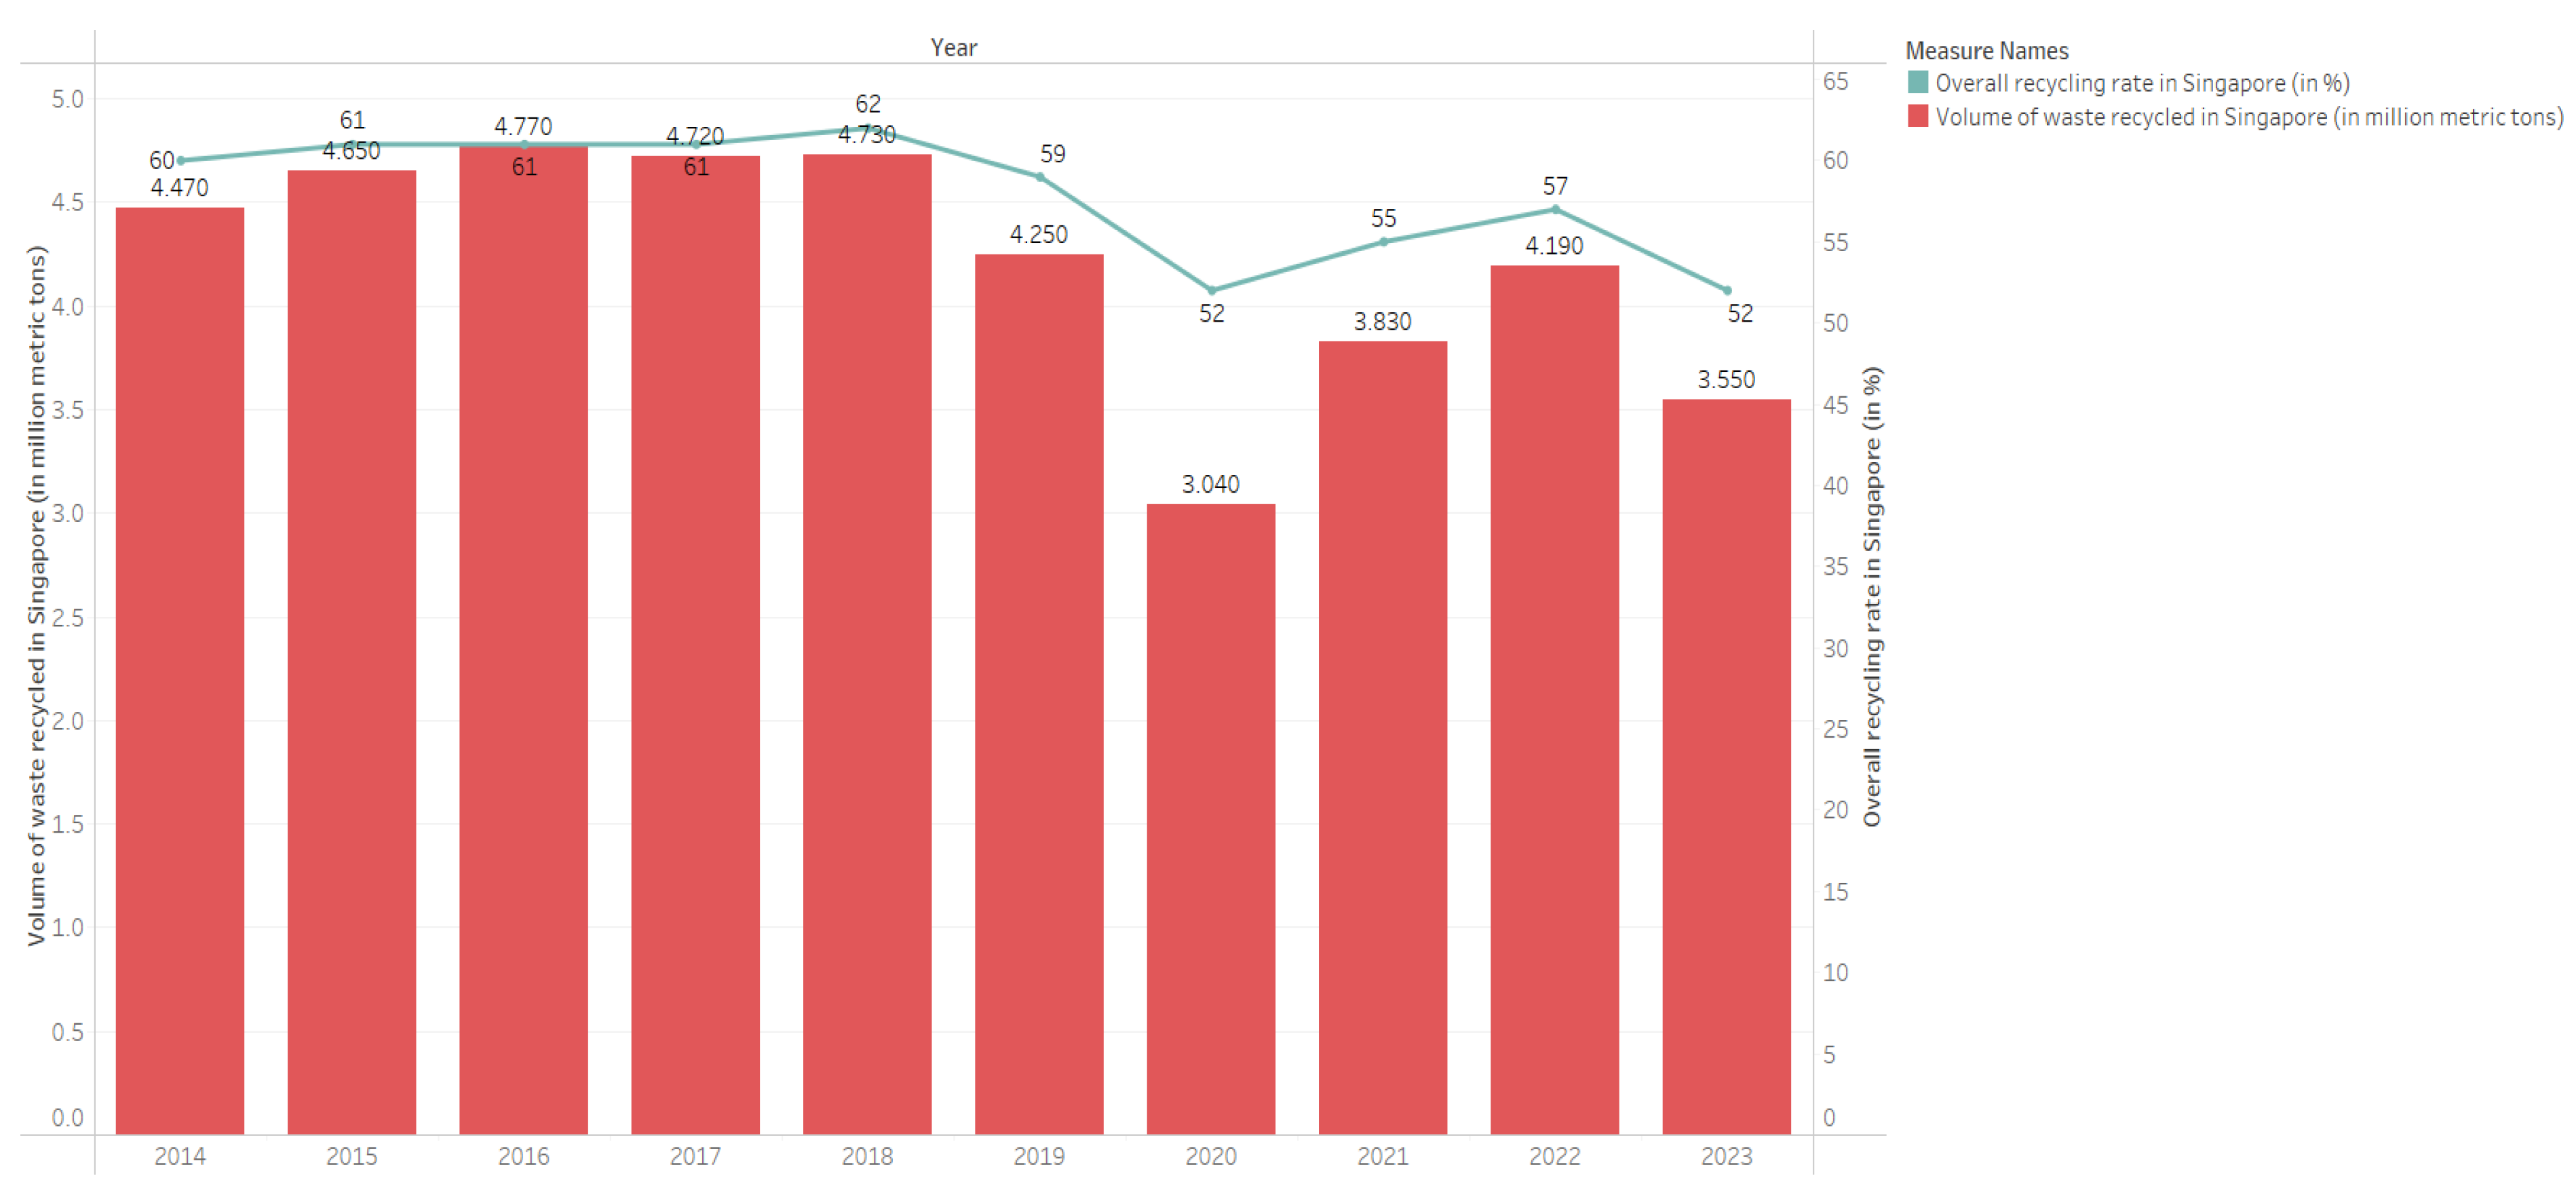
This visualisation analyses the correlation between the amount of garbage recycled (in million metric tonnes) and the national recycling rate (in %) in Singapore from 2014 to 2023. From 2014 to 2018, both metrics exhibited a consistent rising trajectory, with recycling volume reaching a zenith of 4.79 million tonnes and the recycling rate at a maximum of 62% in 2018. Nevertheless, a significant decrease occurred in 2020, with the volume plummeting to 3.04 million tonnes and the recycling rate falling to 52%, presumably because to interruptions caused by the COVID-19 epidemic. Despite a minor recovery in recycling volumes, which reached 4.19 million tonnes in 2022, the recycling rate remained below previous levels, stabilising between 52% and 57%.
Figure 16.
Breakdown of Waste Disposed by Source: Domestic vs. Non-Domestic (2014–2023).
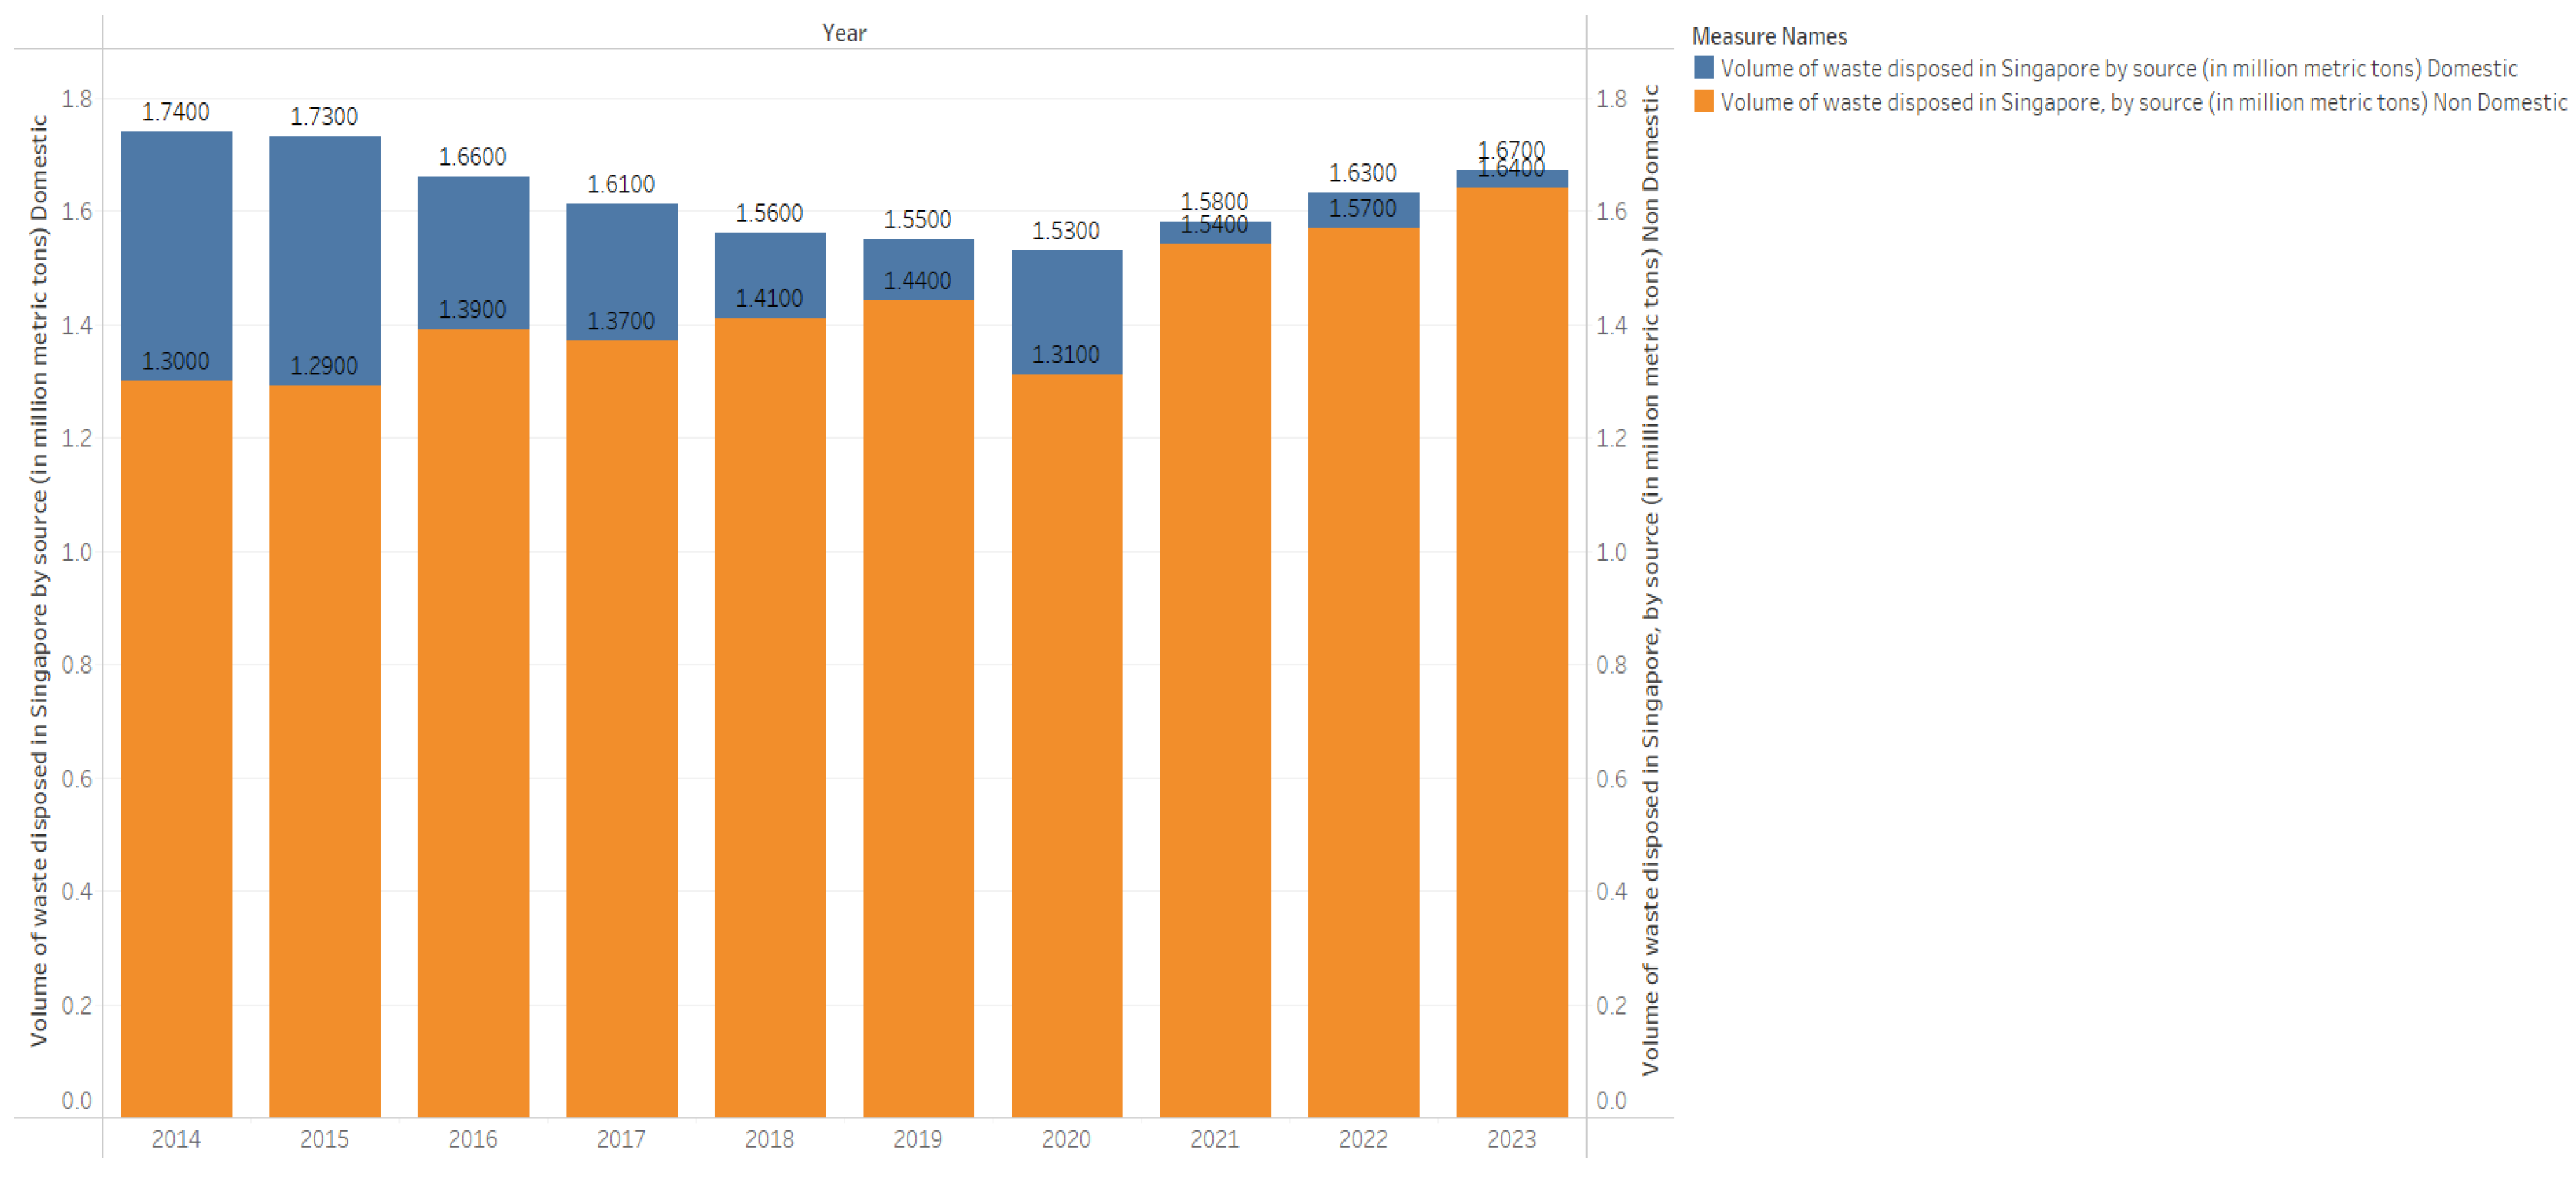
This visualisation outlines the composition of trash discarded in Singapore from 2014 to 2023, classified by domestic and non-domestic origins. Throughout the years, non-domestic trash continually represented the predominant portion of total garbage discharged, with amounts varying between 1.3 and 1.6 million metric tonnes, culminating at 1.67 million tonnes in 2023—the peak within the timeframe. Conversely, household trash had more fluctuation, decreasing from 1.3 million tonnes in 2014 to a minimum of 1.1 million tonnes in 2020, thereafter increasing to 1.46 million tonnes by 2023.
Figure 17.
Trends in Recycling Rates: Overall, Domestic, and Food Waste (2014–2023).
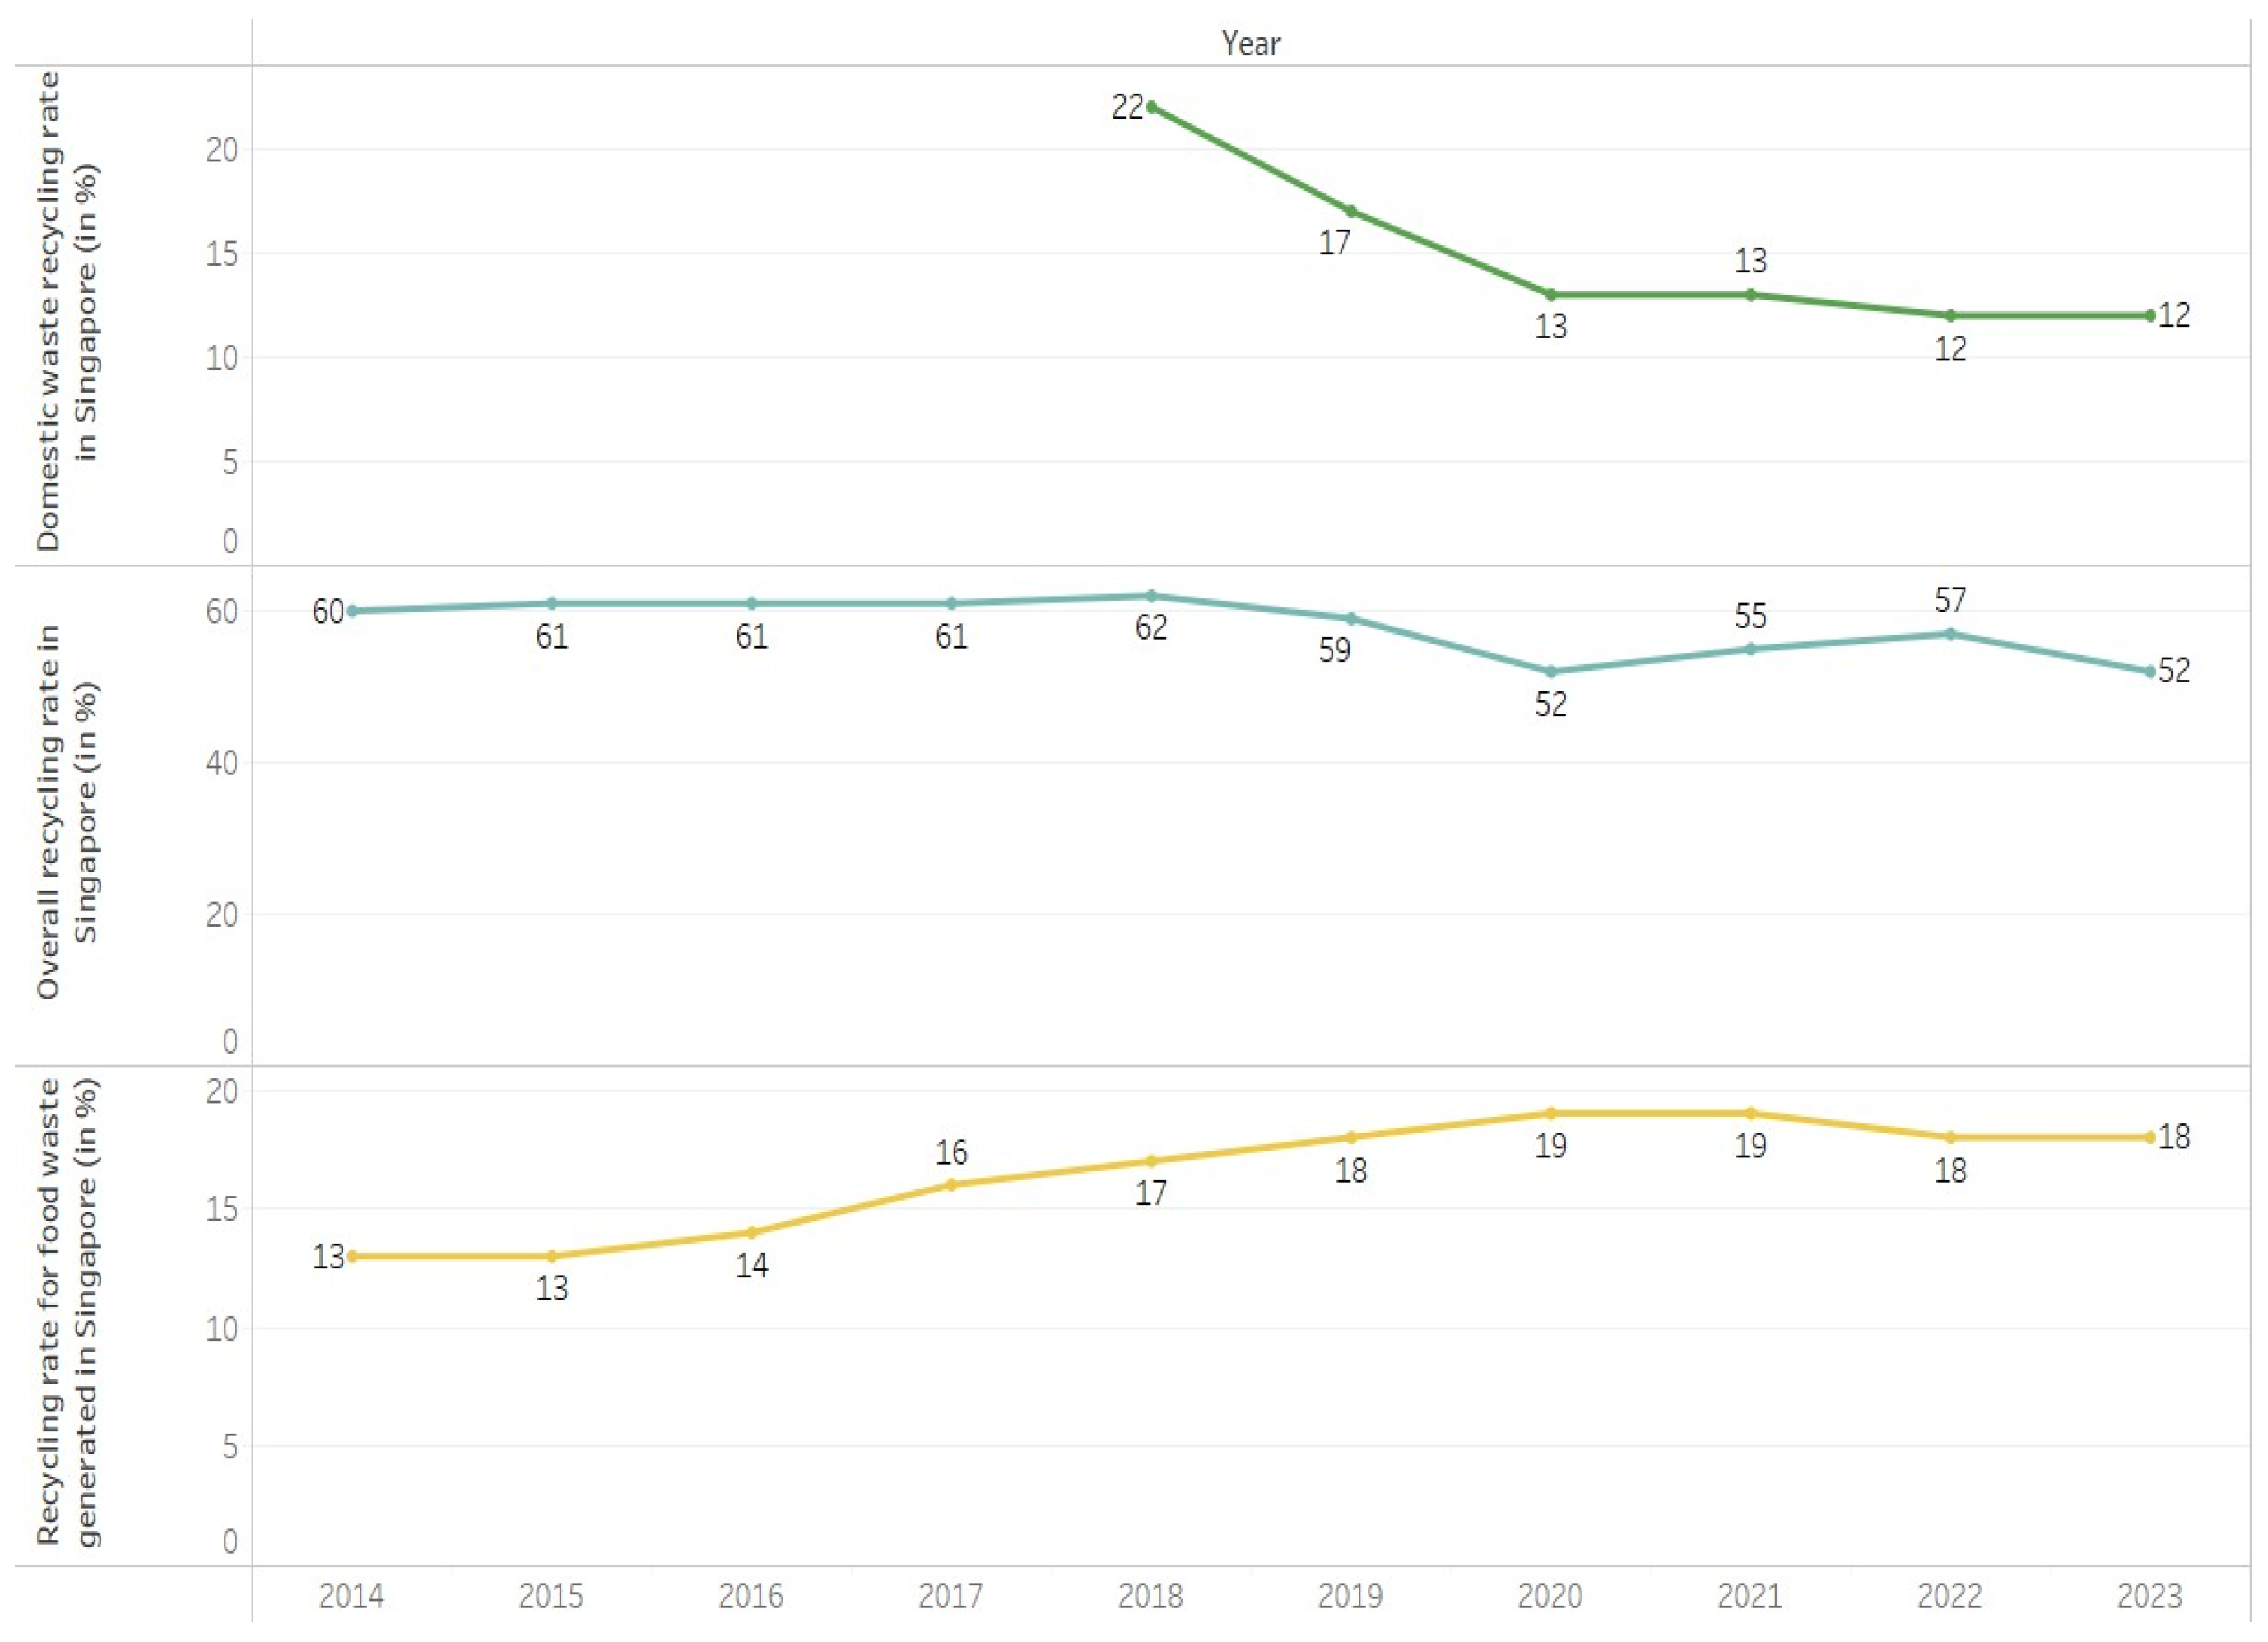
This visualisation monitors the changes in total, residential, and food waste recycling rates in Singapore from 2014 to 2023. The total recycling rate exhibited considerable stability in the first years, averaging about 60–62% from 2014 to 2018, before seeing a gradual decline to 52% in 2023. The home recycling rate had a severe decrease from 22% in 2018 to just 12% in 2023, signifying a substantial deterioration in household recycling efficacy. The recycling rate for food waste, the lowest of the three, showed progressive enhancement from 13% in 2014 to a high of 19% in 2020–2021, ultimately stabilising at 18% in 2023.
3.4.4. Group D: Plastic Waste Imports
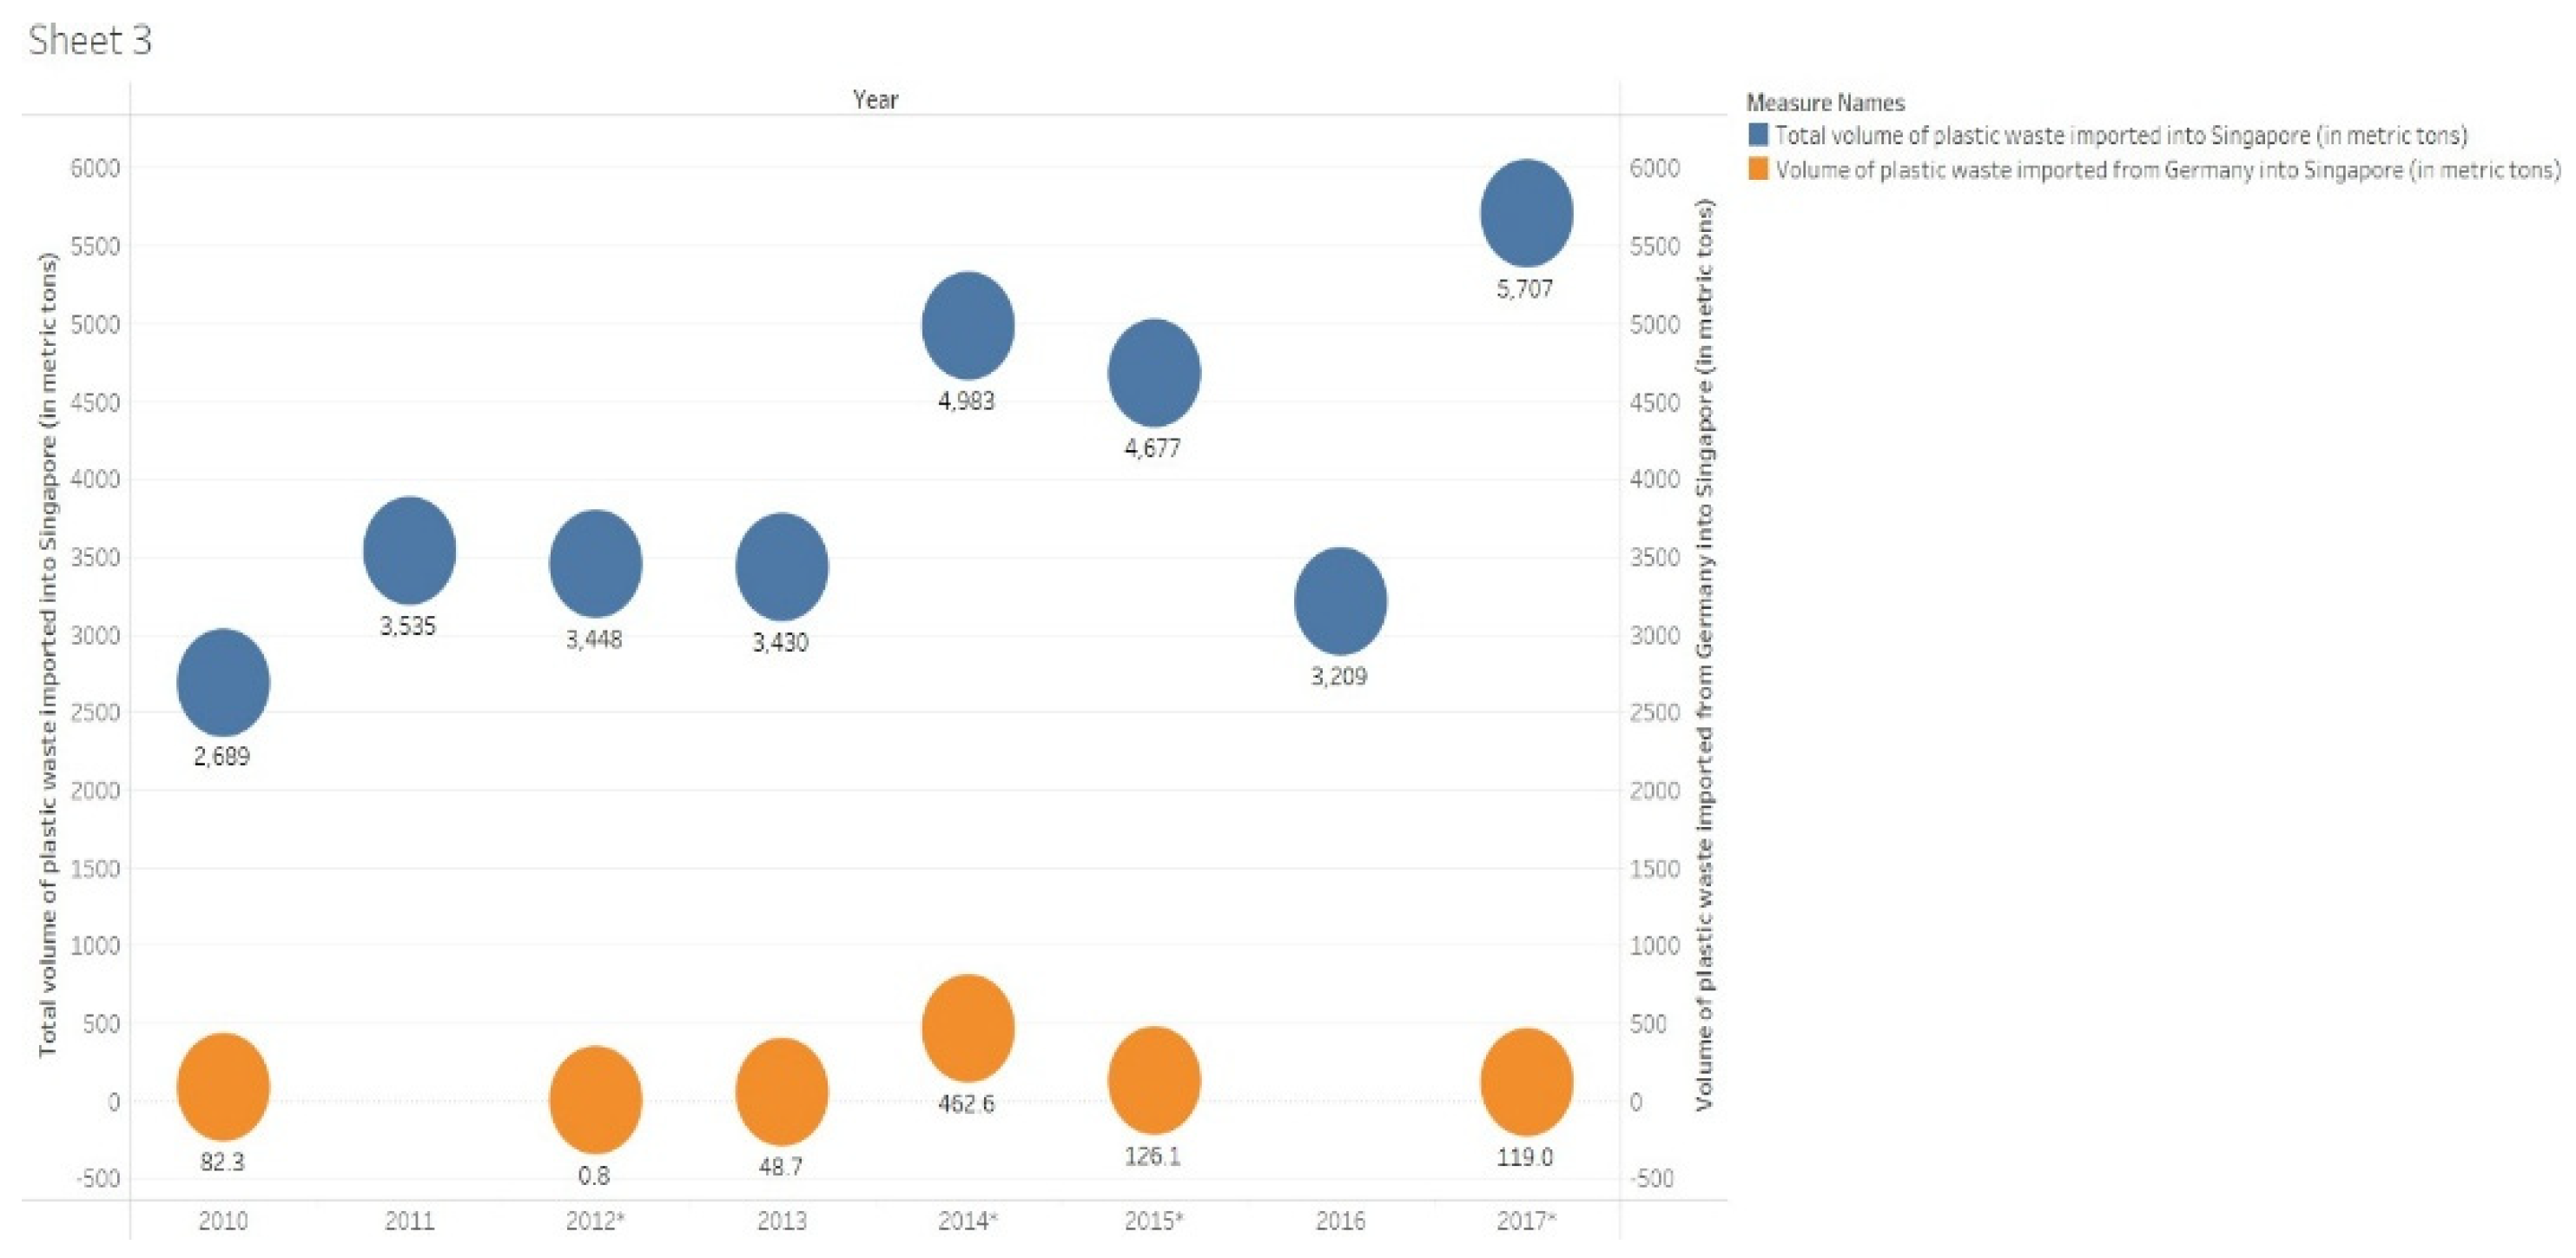
Between 2010 and 2017, Group D highlights Singapore’s plastic waste import, charting fuel sources from Germany as well as other countries. It outlines Singapore’s role in managing waste around the globe, which matters when we consider sustainability and becoming waste independent.
Figure 18.
Plastic Waste Imports into Singapore by Source (2010–2017).
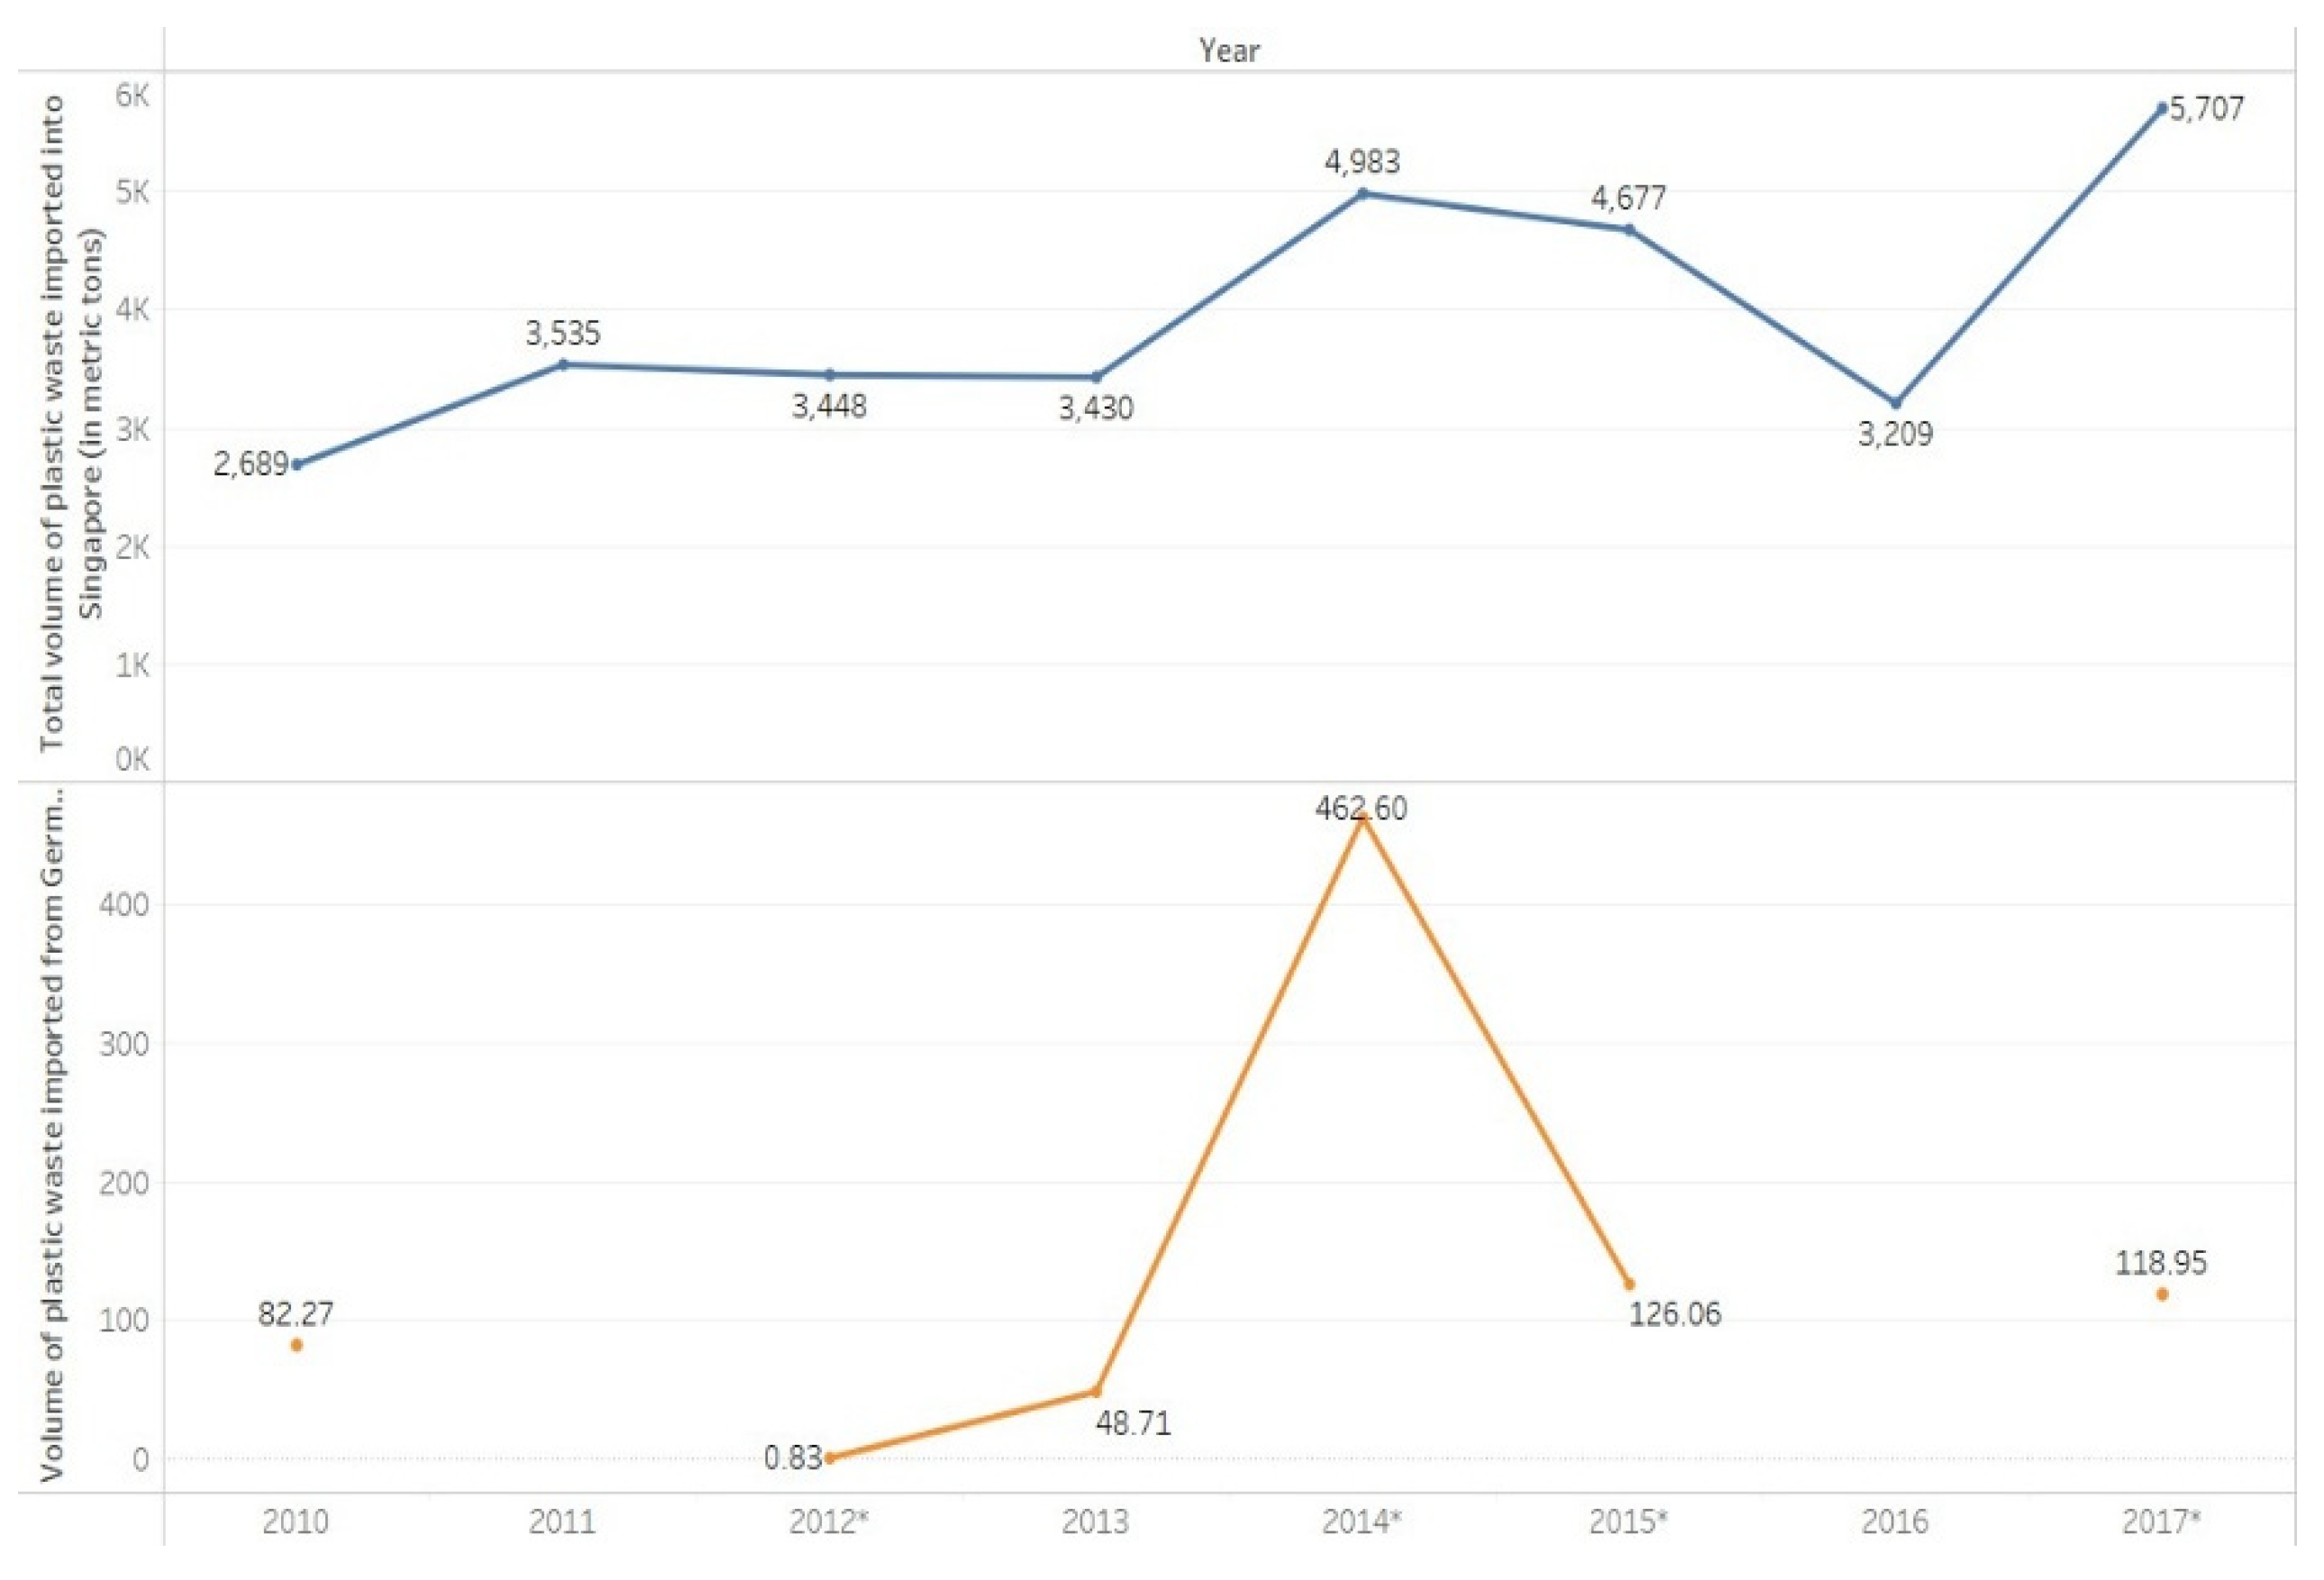
The below visualisation illustrates the entire volume of plastic garbage imported into Singapore from 2010 to 2017, including a detailed account of the quantity imported from Germany. During the eight-year span, total plastic trash imports increased from 2,669 metric tonnes in 2010 to a high point of 4,983 metric tonnes in 2014, thereafter exhibiting oscillations until reaching 5,707 metric tonnes in 2017—the greatest level documented. Imports from Germany were negligible in the first years but had a substantial increase in 2014, reaching 462.60 metric tonnes, before dramatically decreasing once again. This surge indicates a temporary or singular export alteration from Germany during that year. Although Germany significantly contributed to Singapore's plastic trash imports in 2014, the overarching pattern reveals a persistent and growing dependence on imported plastic garbage from diverse international origins.
Between 2010 and 2017, Singapore imported a significant amount of plastic garbage from Germany, with a significant increase in 2014, but remained insignificant beyond that peak. In 2017, Germany's contribution peaked at 5,588 metric tonnes, suggesting a temporary shift in trade or regulatory conditions.
The visualisation illustrates plastic garbage imports to Singapore with Germany's contributions from 2010 to 2017. Total imports rose, reaching an all-time high of 5,707 metric tonnes in 2017, although Germany's proportion remained minimal, with the exception of a surge in 2014. Notwithstanding heightened imports, Germany's role remained as constrained.
Figure 19.
Share of Plastic Waste Imported from Germany into Singapore (2010–2017).
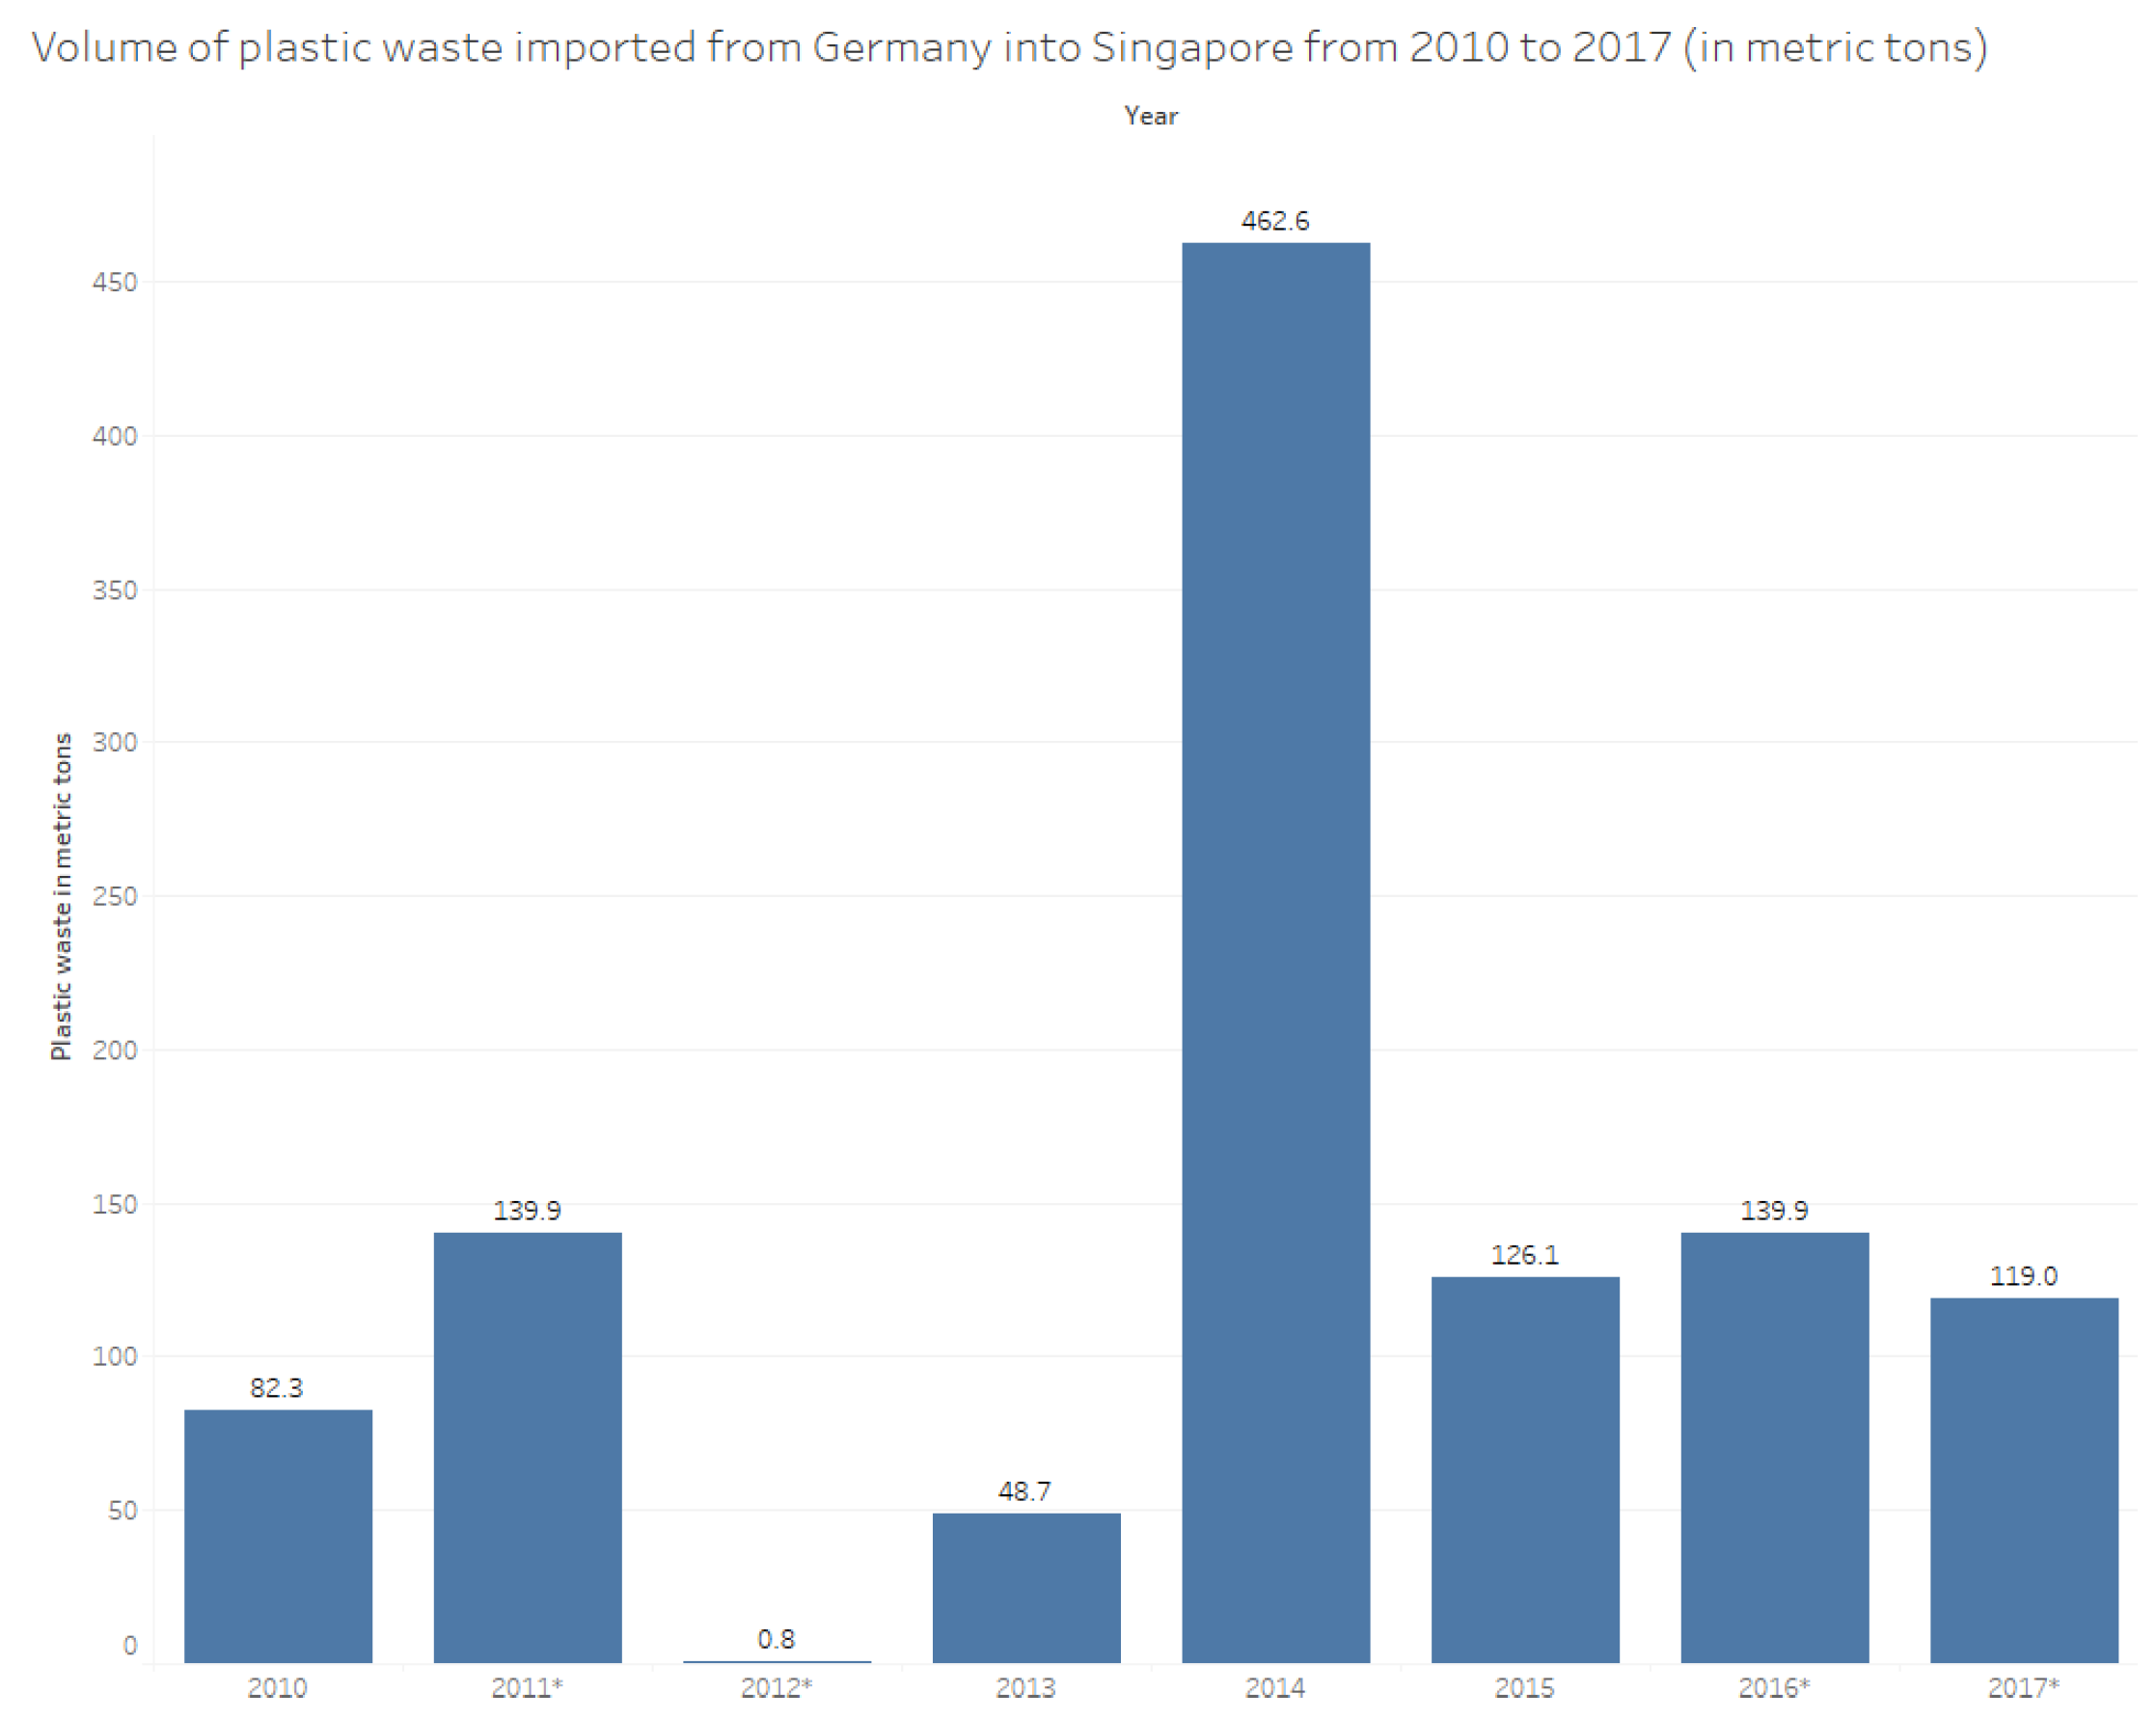
Figure 20.
Comparison of Total and Germany’s Plastic Waste Imports into Singapore (2010–2017).
3.4.5. Group E: Public Behavior and Perception
This category looks at people’s views on surveys about recycling and their choices when it comes to different packaging, as well as what they think about sustainable buying. Data from between 2021 and 2024 is reviewed to understand community preferences about zero-waste policies.
Figure 21.
Frequency of Using Reusable Bags While Shopping in Singapore (2021).
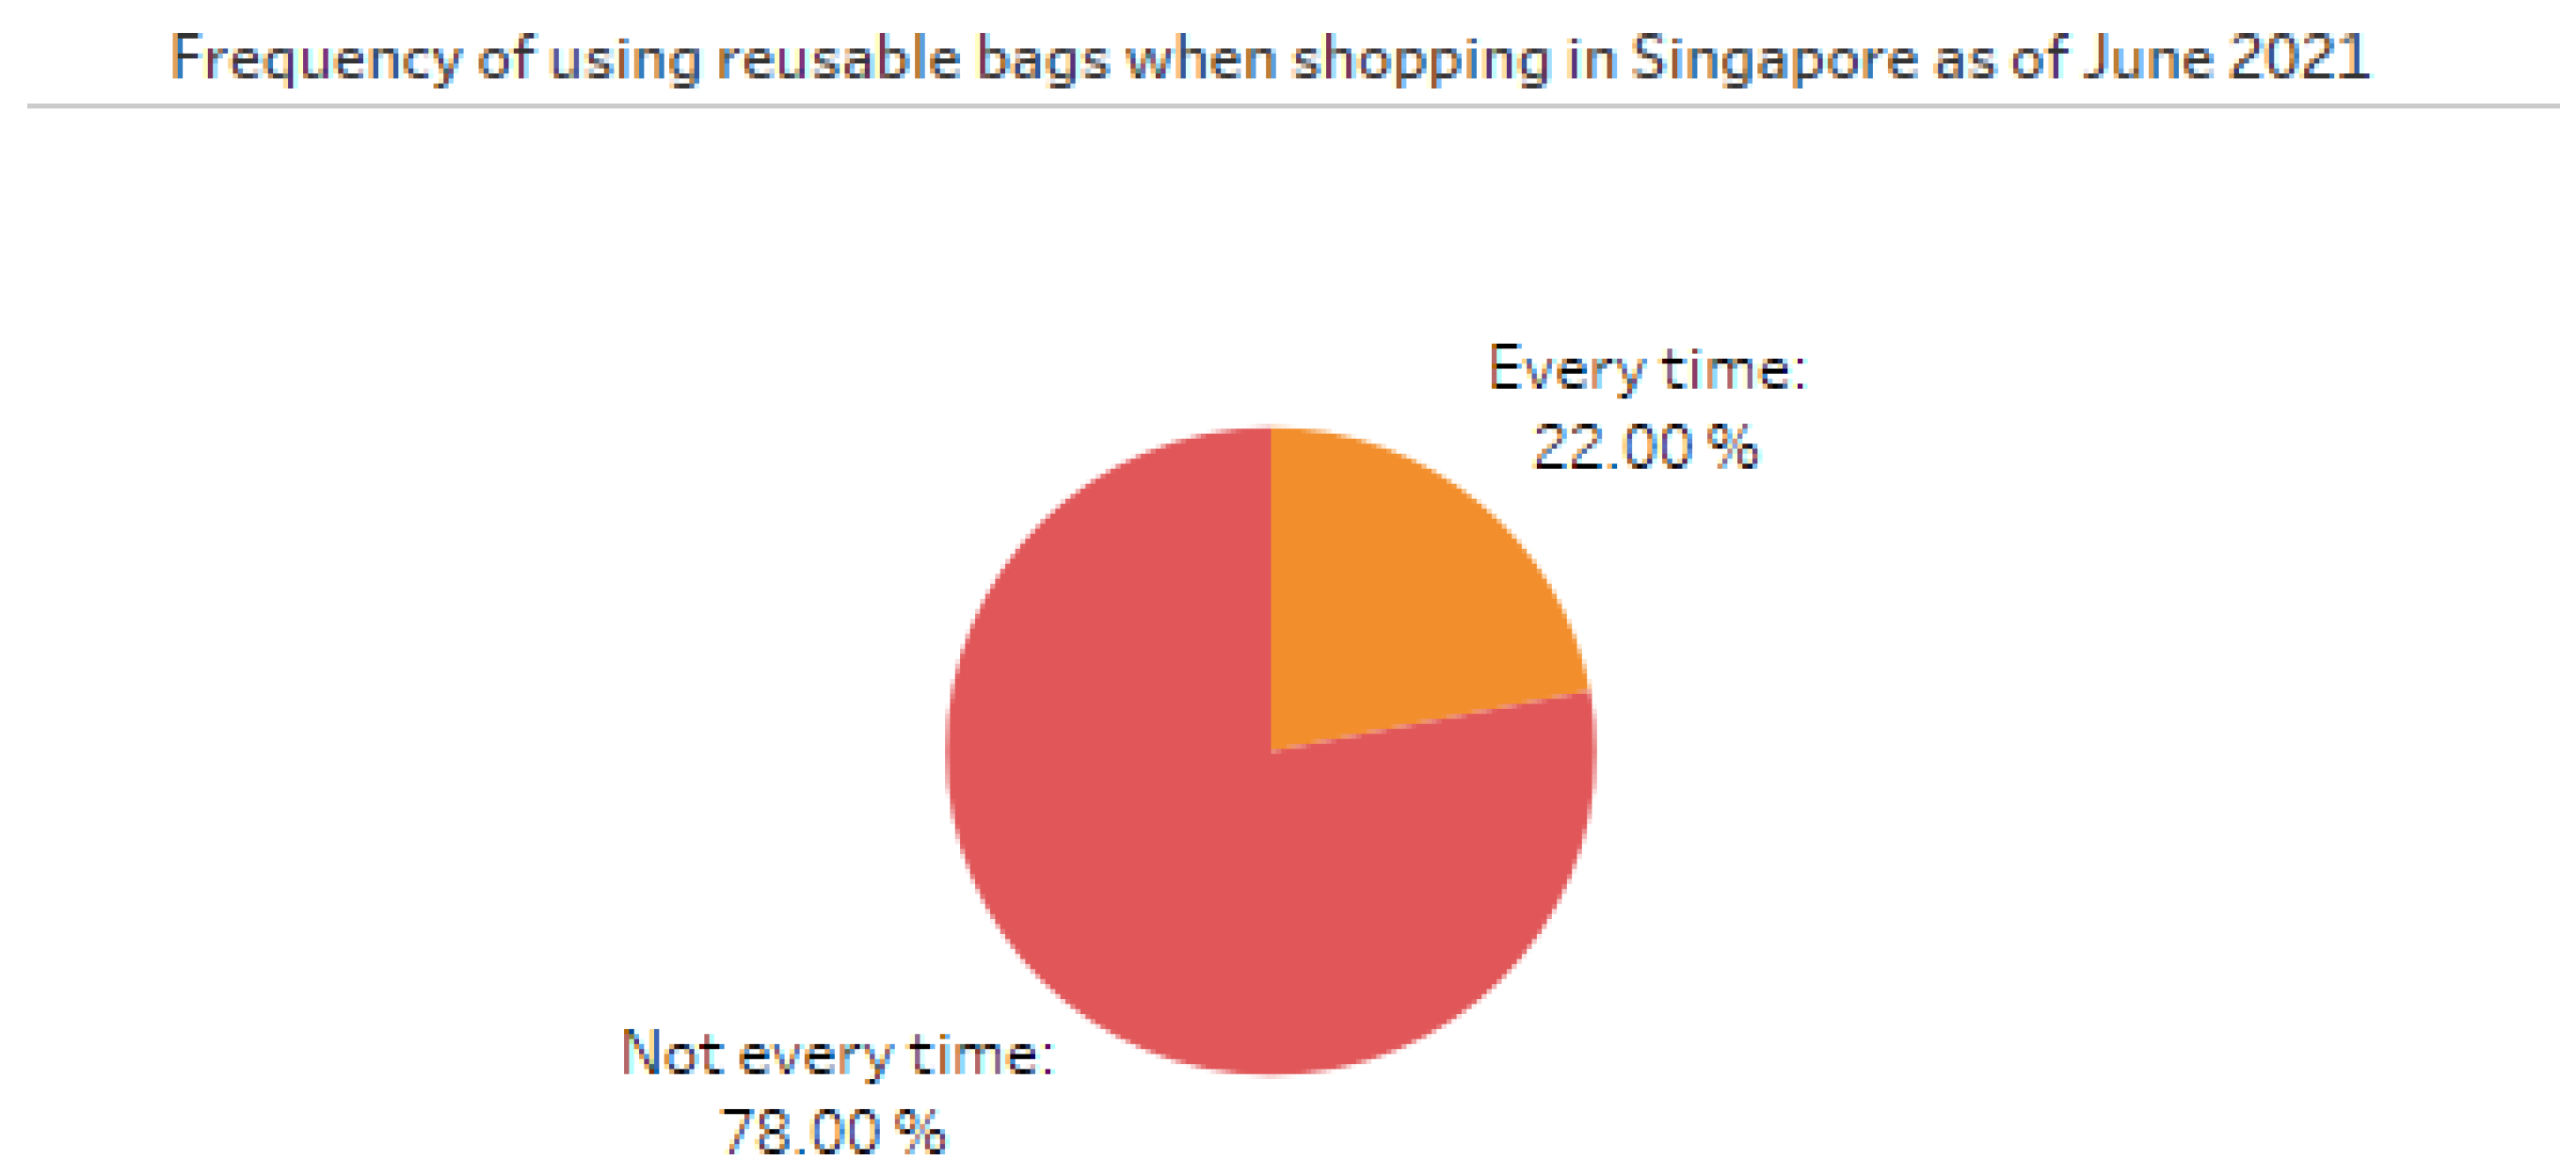
This visualisation depicts the frequency of reusable bags usage in Singapore in June 2021. The study indicates that just 22% of respondents consistently used reusable bags, whereas a significant 78% did not employ them consistently.
Figure 22.
Frequency of recycling Household Waste in Singapore (2021).
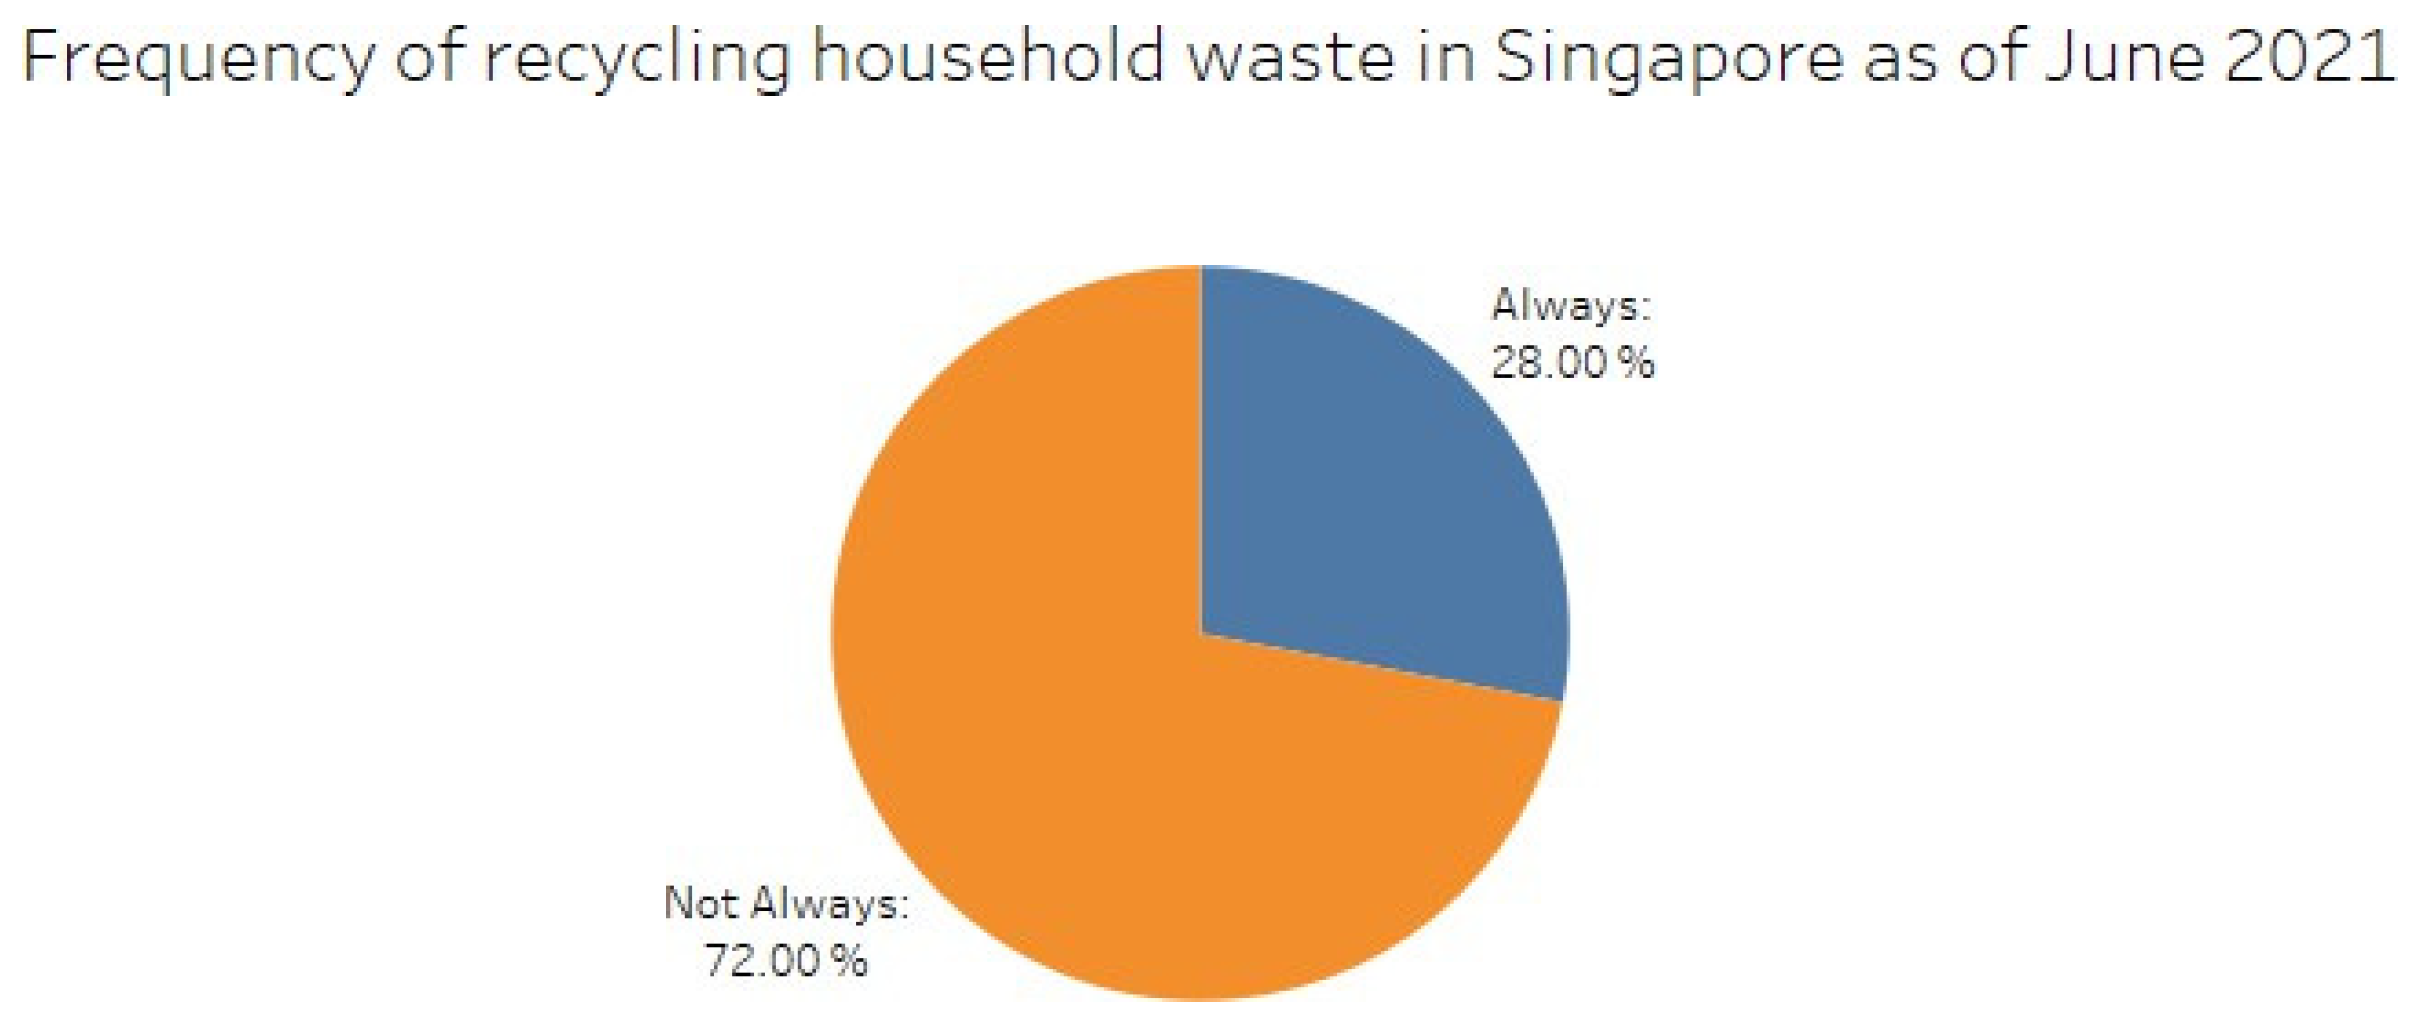
The visualisation depicts the frequency of household waste that is being recycled in Singapore in June 2021. Based on the pie chart, it can be said that 28% of the respondents always recycle their wastes whereas the majority 72% do not always recycle their household waste.
Figure 23.
Top Motivations for Recycling More Often in Singapore (2023).
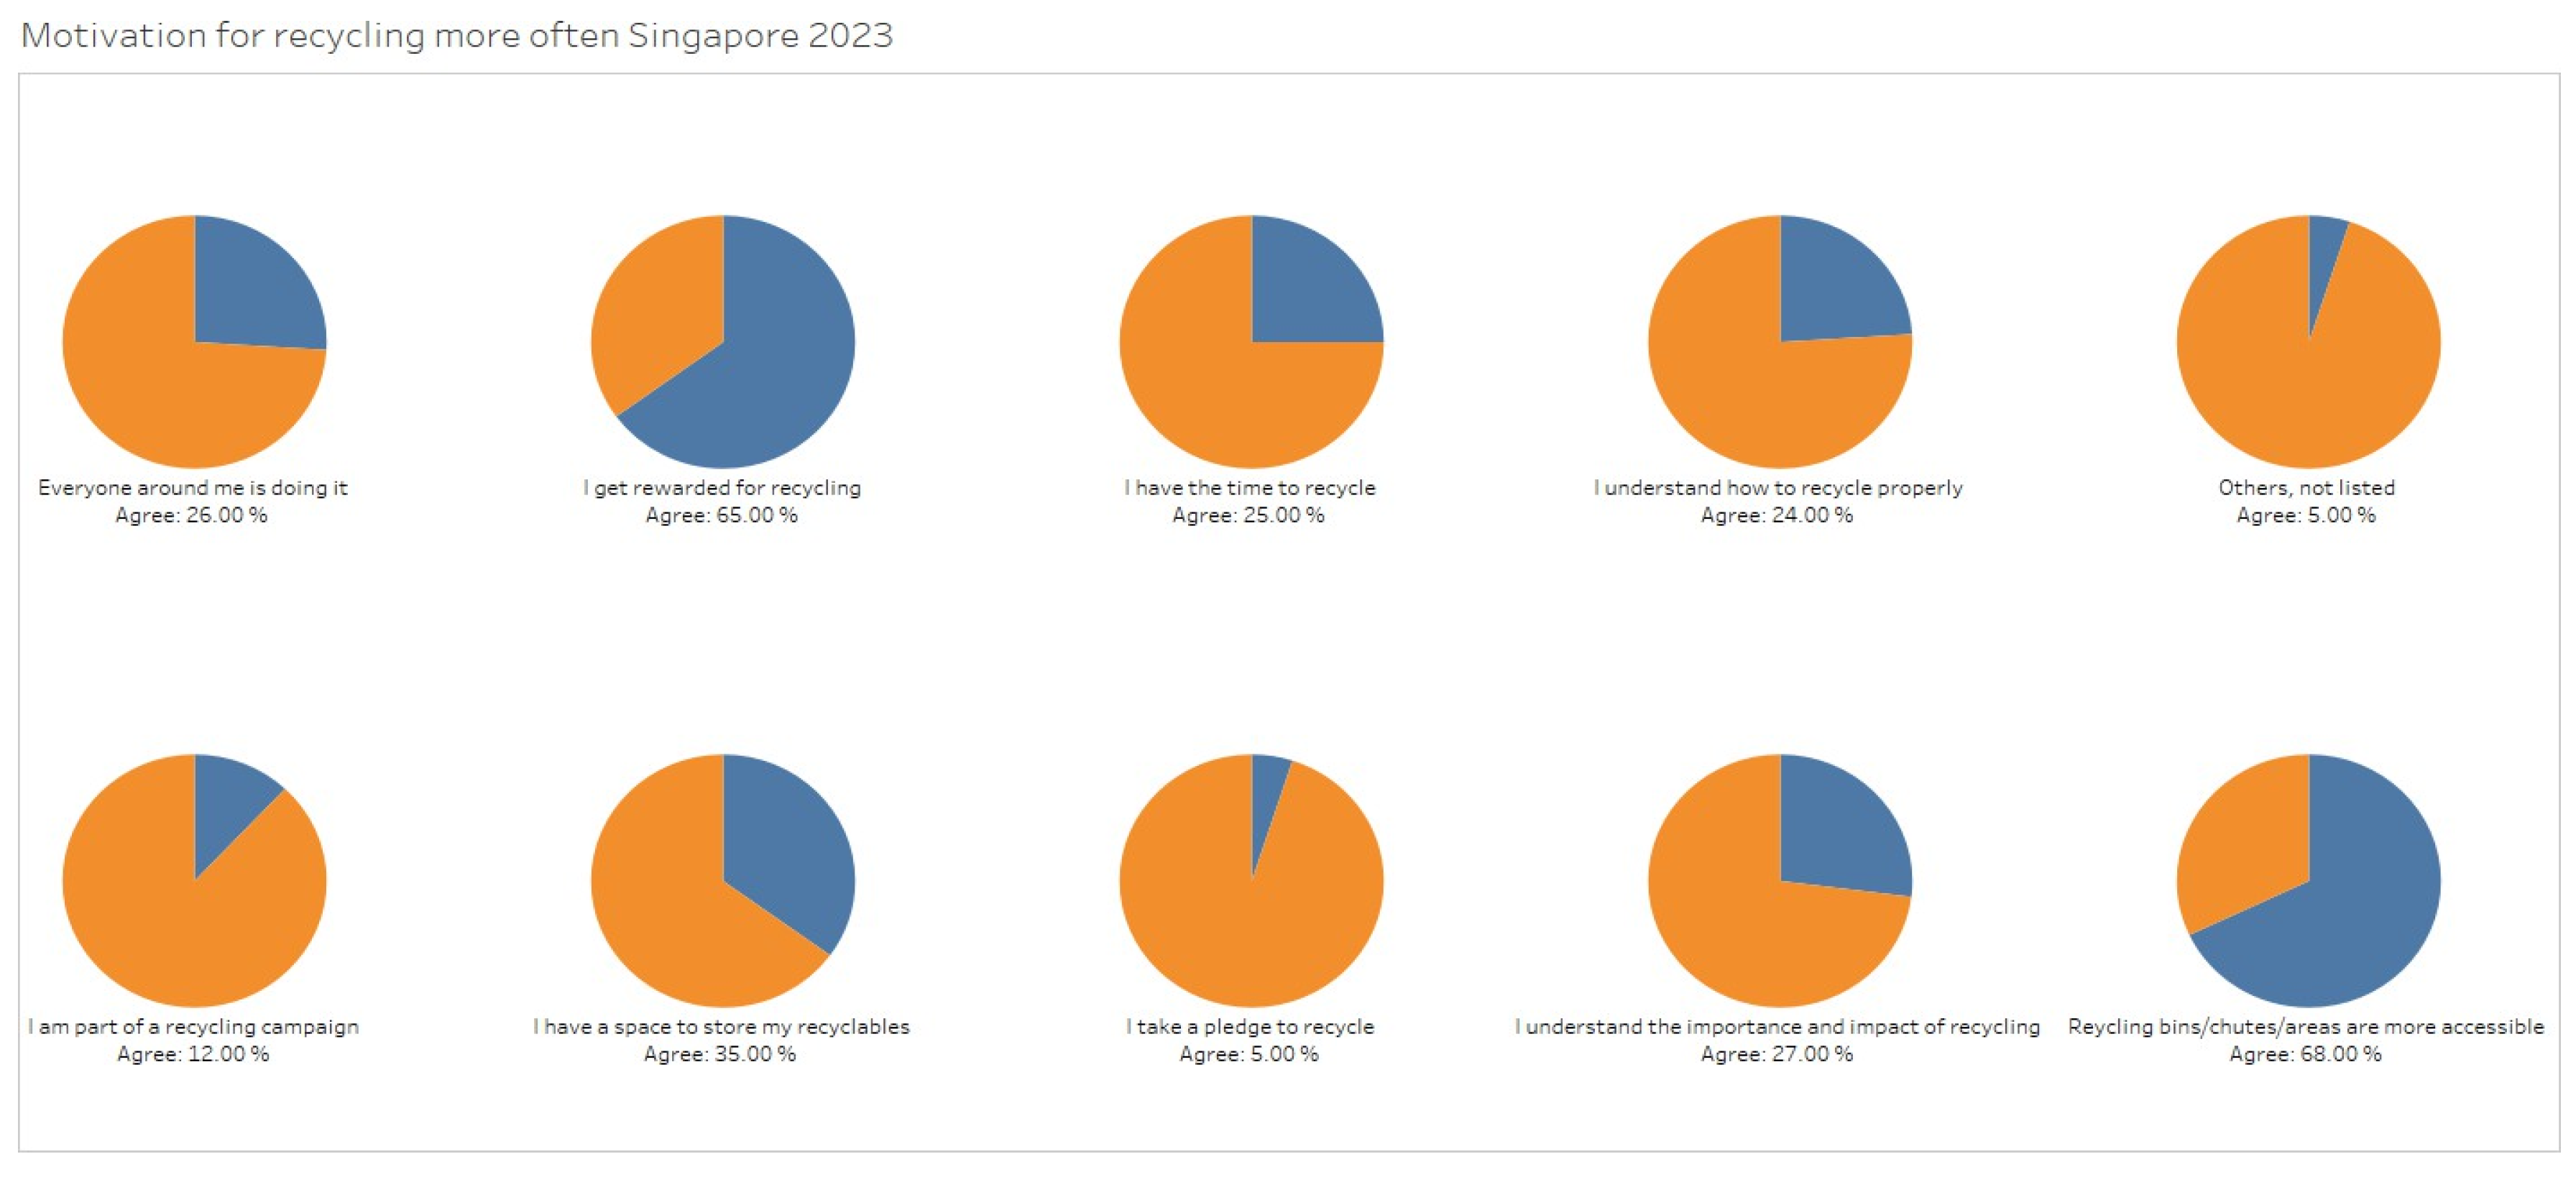
The visualisation shows the top motivations for people in Singapore to recycle more often in the year 2023. Each pie chart represents a different motivational factor with the percentage of people that agree for it. The highest motivators are “recycling bins/chutes/areas are more accessible” with 68% of agreement and “I get rewarded for recycling” with 65% agreement. On the other hand, reasons such as “I take a pledge to recycle” and “Others, not listed” only have 5% agreement. The other motivations have respondents within the range of 12% to 35%.
The visualisation shows the frequency of the practice of recycling single-use plastic bottles in Singapore in 2023. From the pie chart, it can be seen that 31% of people recycle sometimes in contrast to the 7% of people that never recycle. On the other hand, 22% and 25% of people always and often recycle the bottles respectively. In addition, only 15% of people have rarely recycled single-use plastic bottles.
The visualisation depicts the top priority that consumers want from retailers for sustainable packaging. 39% of consumers ask for retailers to prioritize the reduction of delivery packaging and use recyclable packaging whenever necessary. 29% of consumers think that retailers should make packaging reusable while 26% of consumers think that retailers should make packaging recyclable. The last 6% of consumers have other opinions that retailers should prioritize.
Figure 24.
Frequency of Recycling Single-Use Plastic Bottles in Singapore (2023).
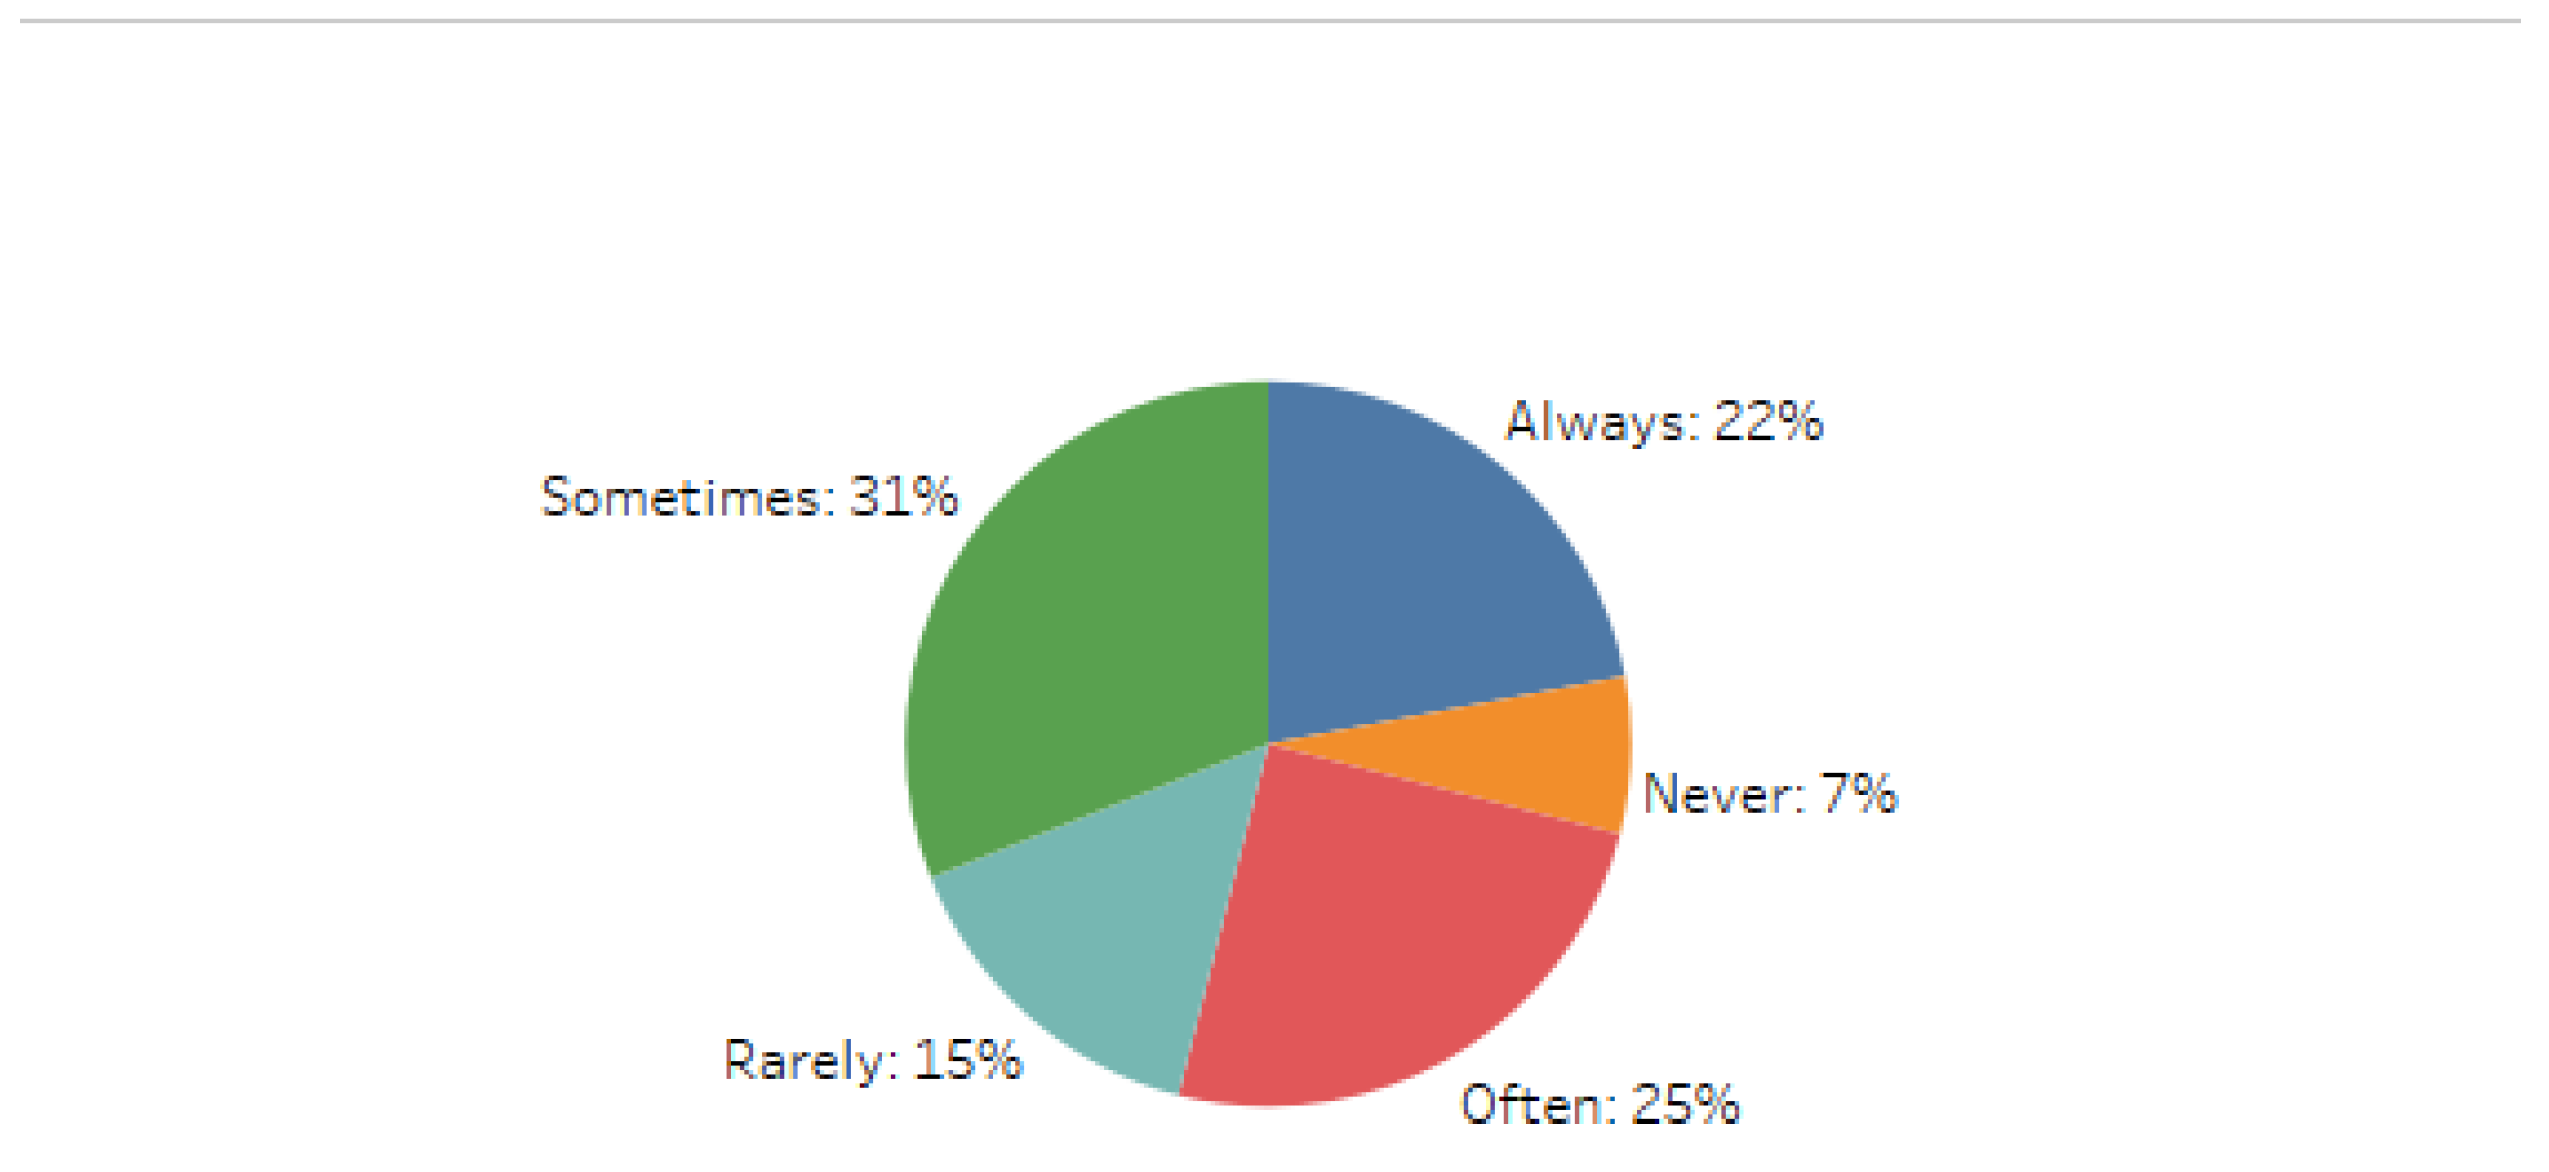
Figure 25.
What Consumers Want Retailers to Prioritize in Sustainable Packaging (2024).
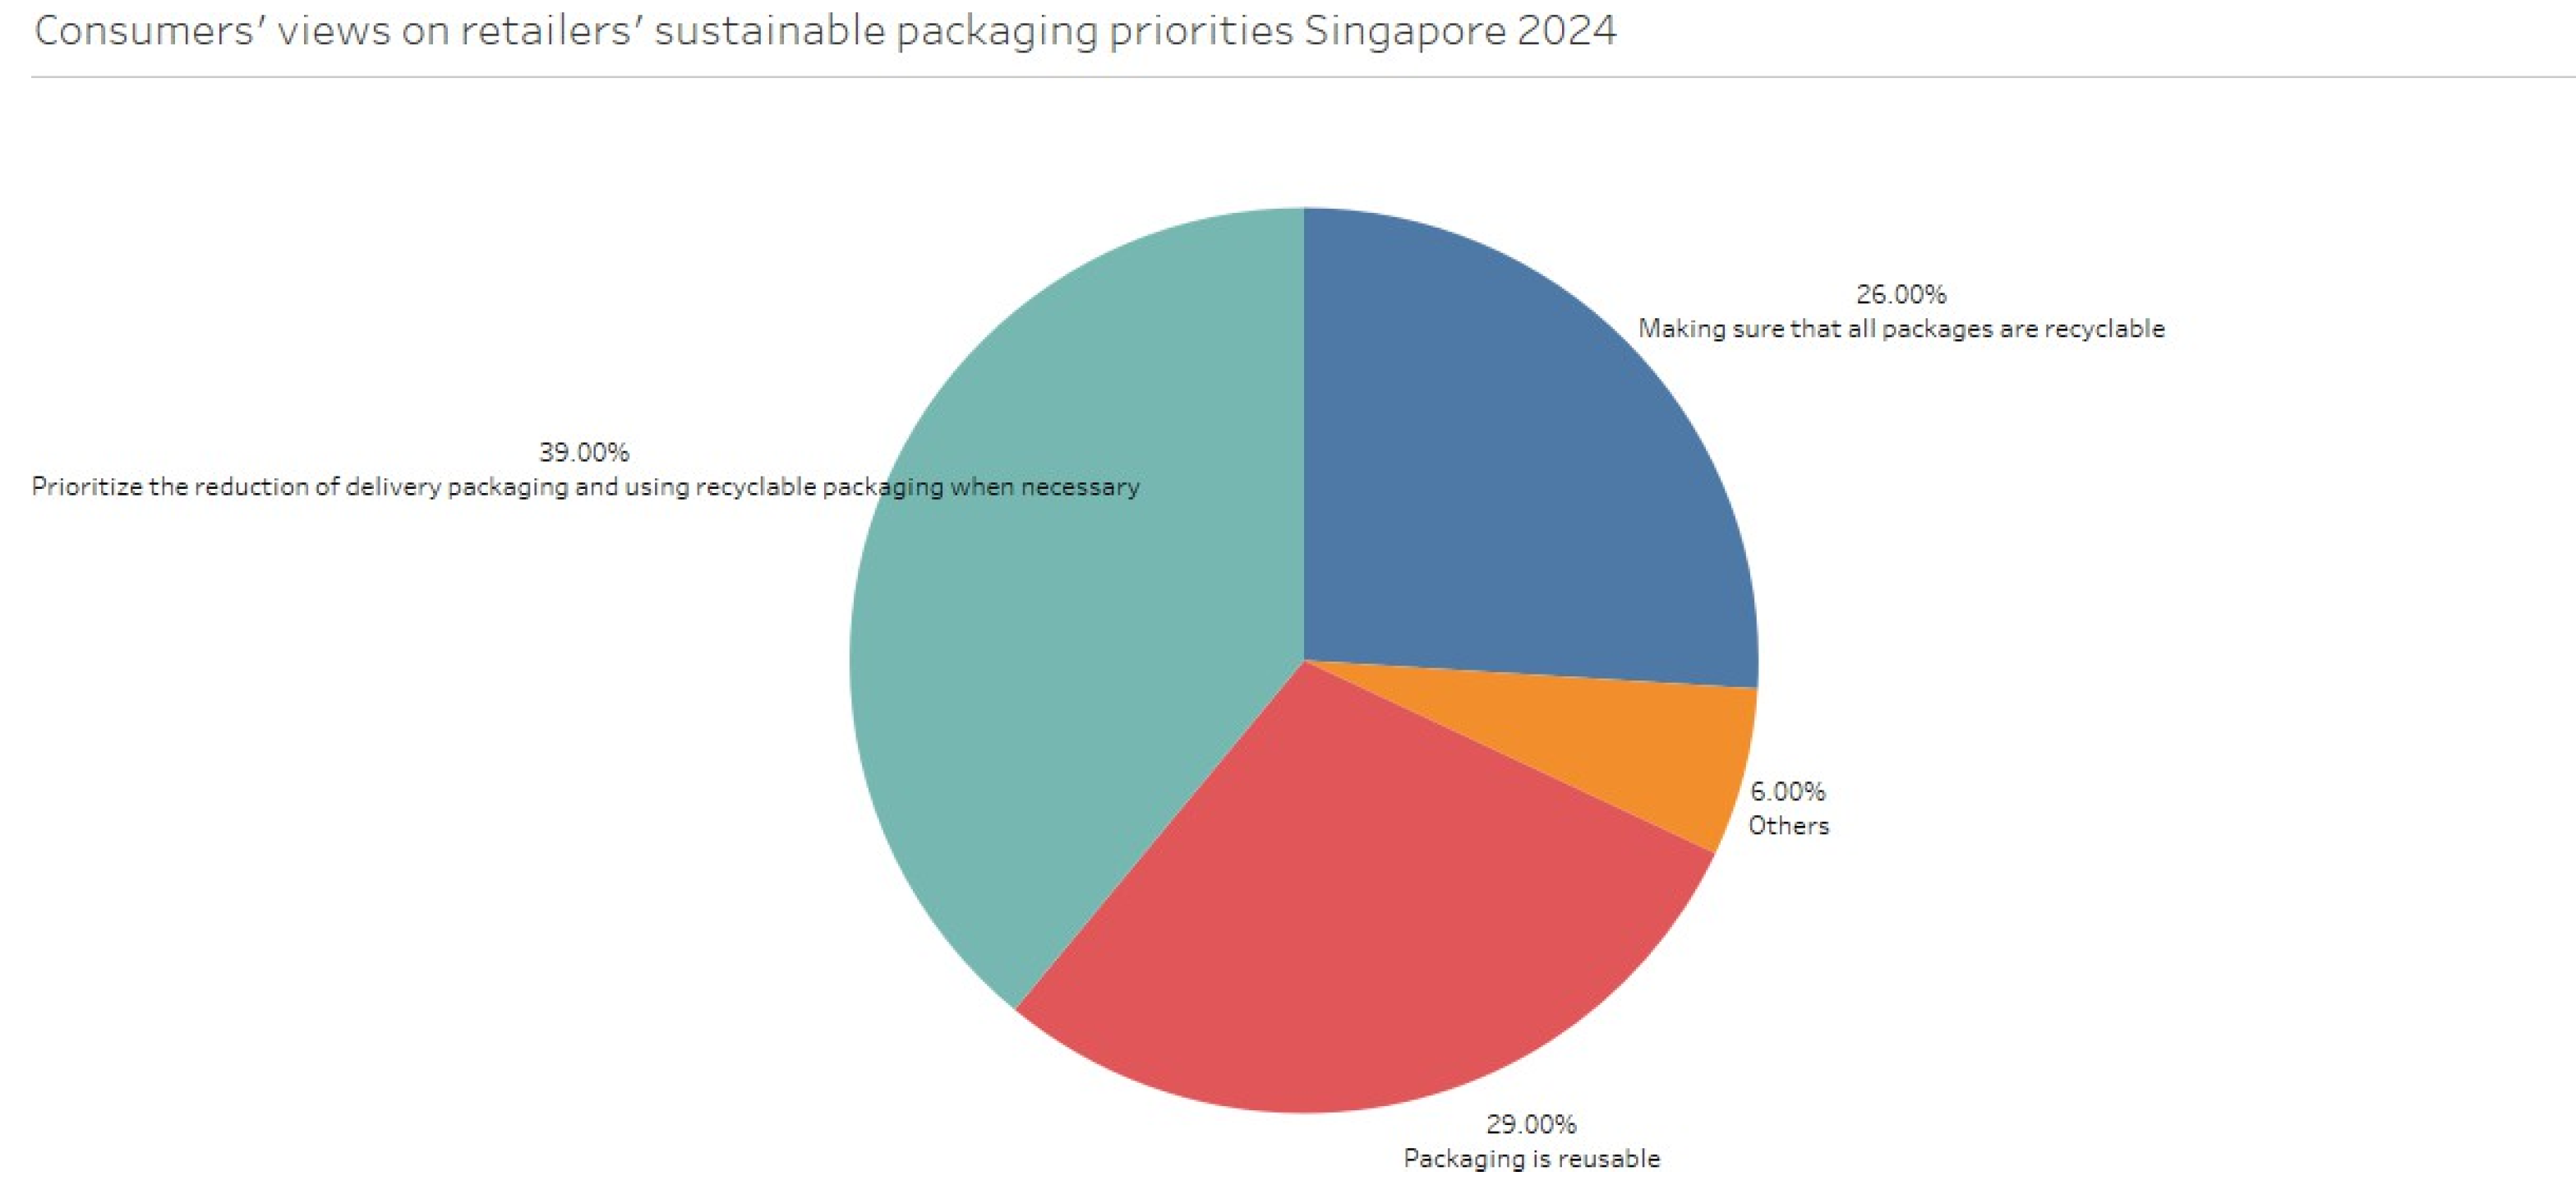
Figure 26.
Top Reasons for Choosing No Added Delivery Packaging (2024).
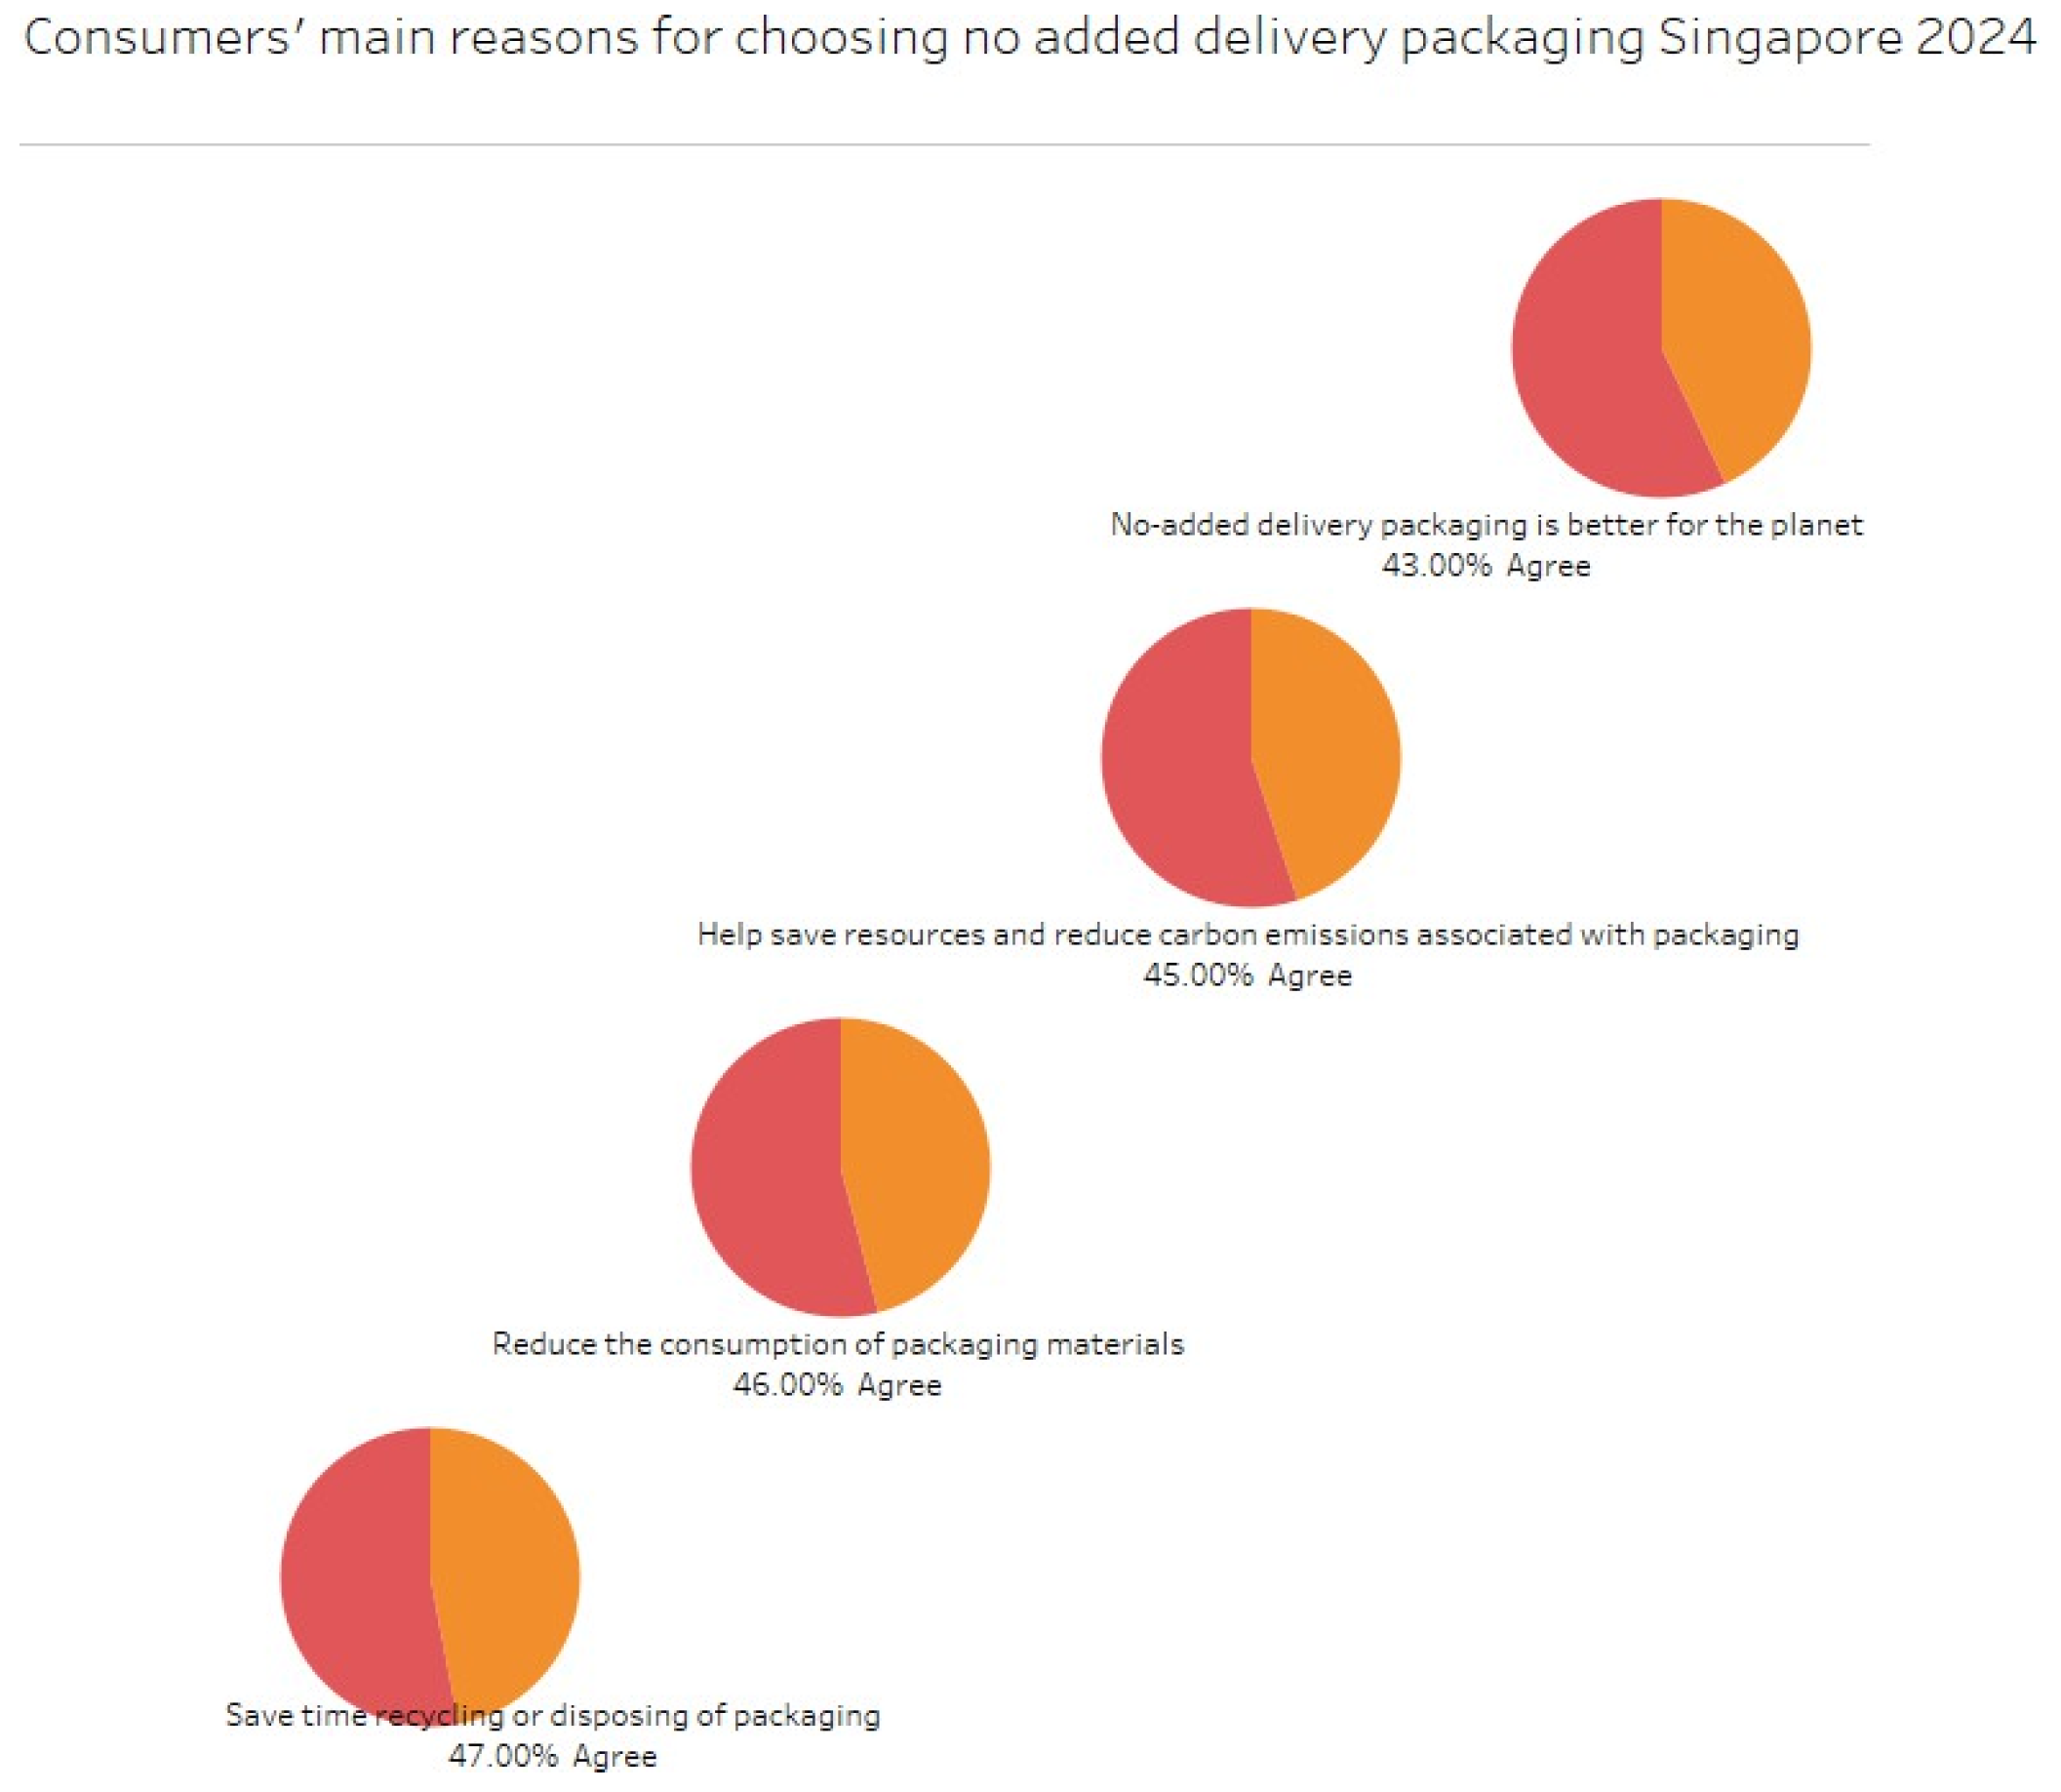
The visualisation depicts the top four reasons for consumers choosing the No Added Delivery Packaging option in Singapore. The top reasons include No Added Delivery Packaging is better for the planet, helps save resources and reduce carbon emissions, reduces the consumption of packaging materials and to save time for recycling or disposing of packages. The number of consumers that agree with these reasons range from 43% to 47%.
3.4.6. Group F: Waste Generation by Sector and Per Capita
Data in this group provides the typical amount of waste from individuals in Singapore and the waste produced by Singapore Airlines from 2014 to 2024. We can identify where waste is created most often which helps with choosing waste reduction spots.
Figure 27.
Per Capita Daily Waste Generation in Singapore (2014–2023).
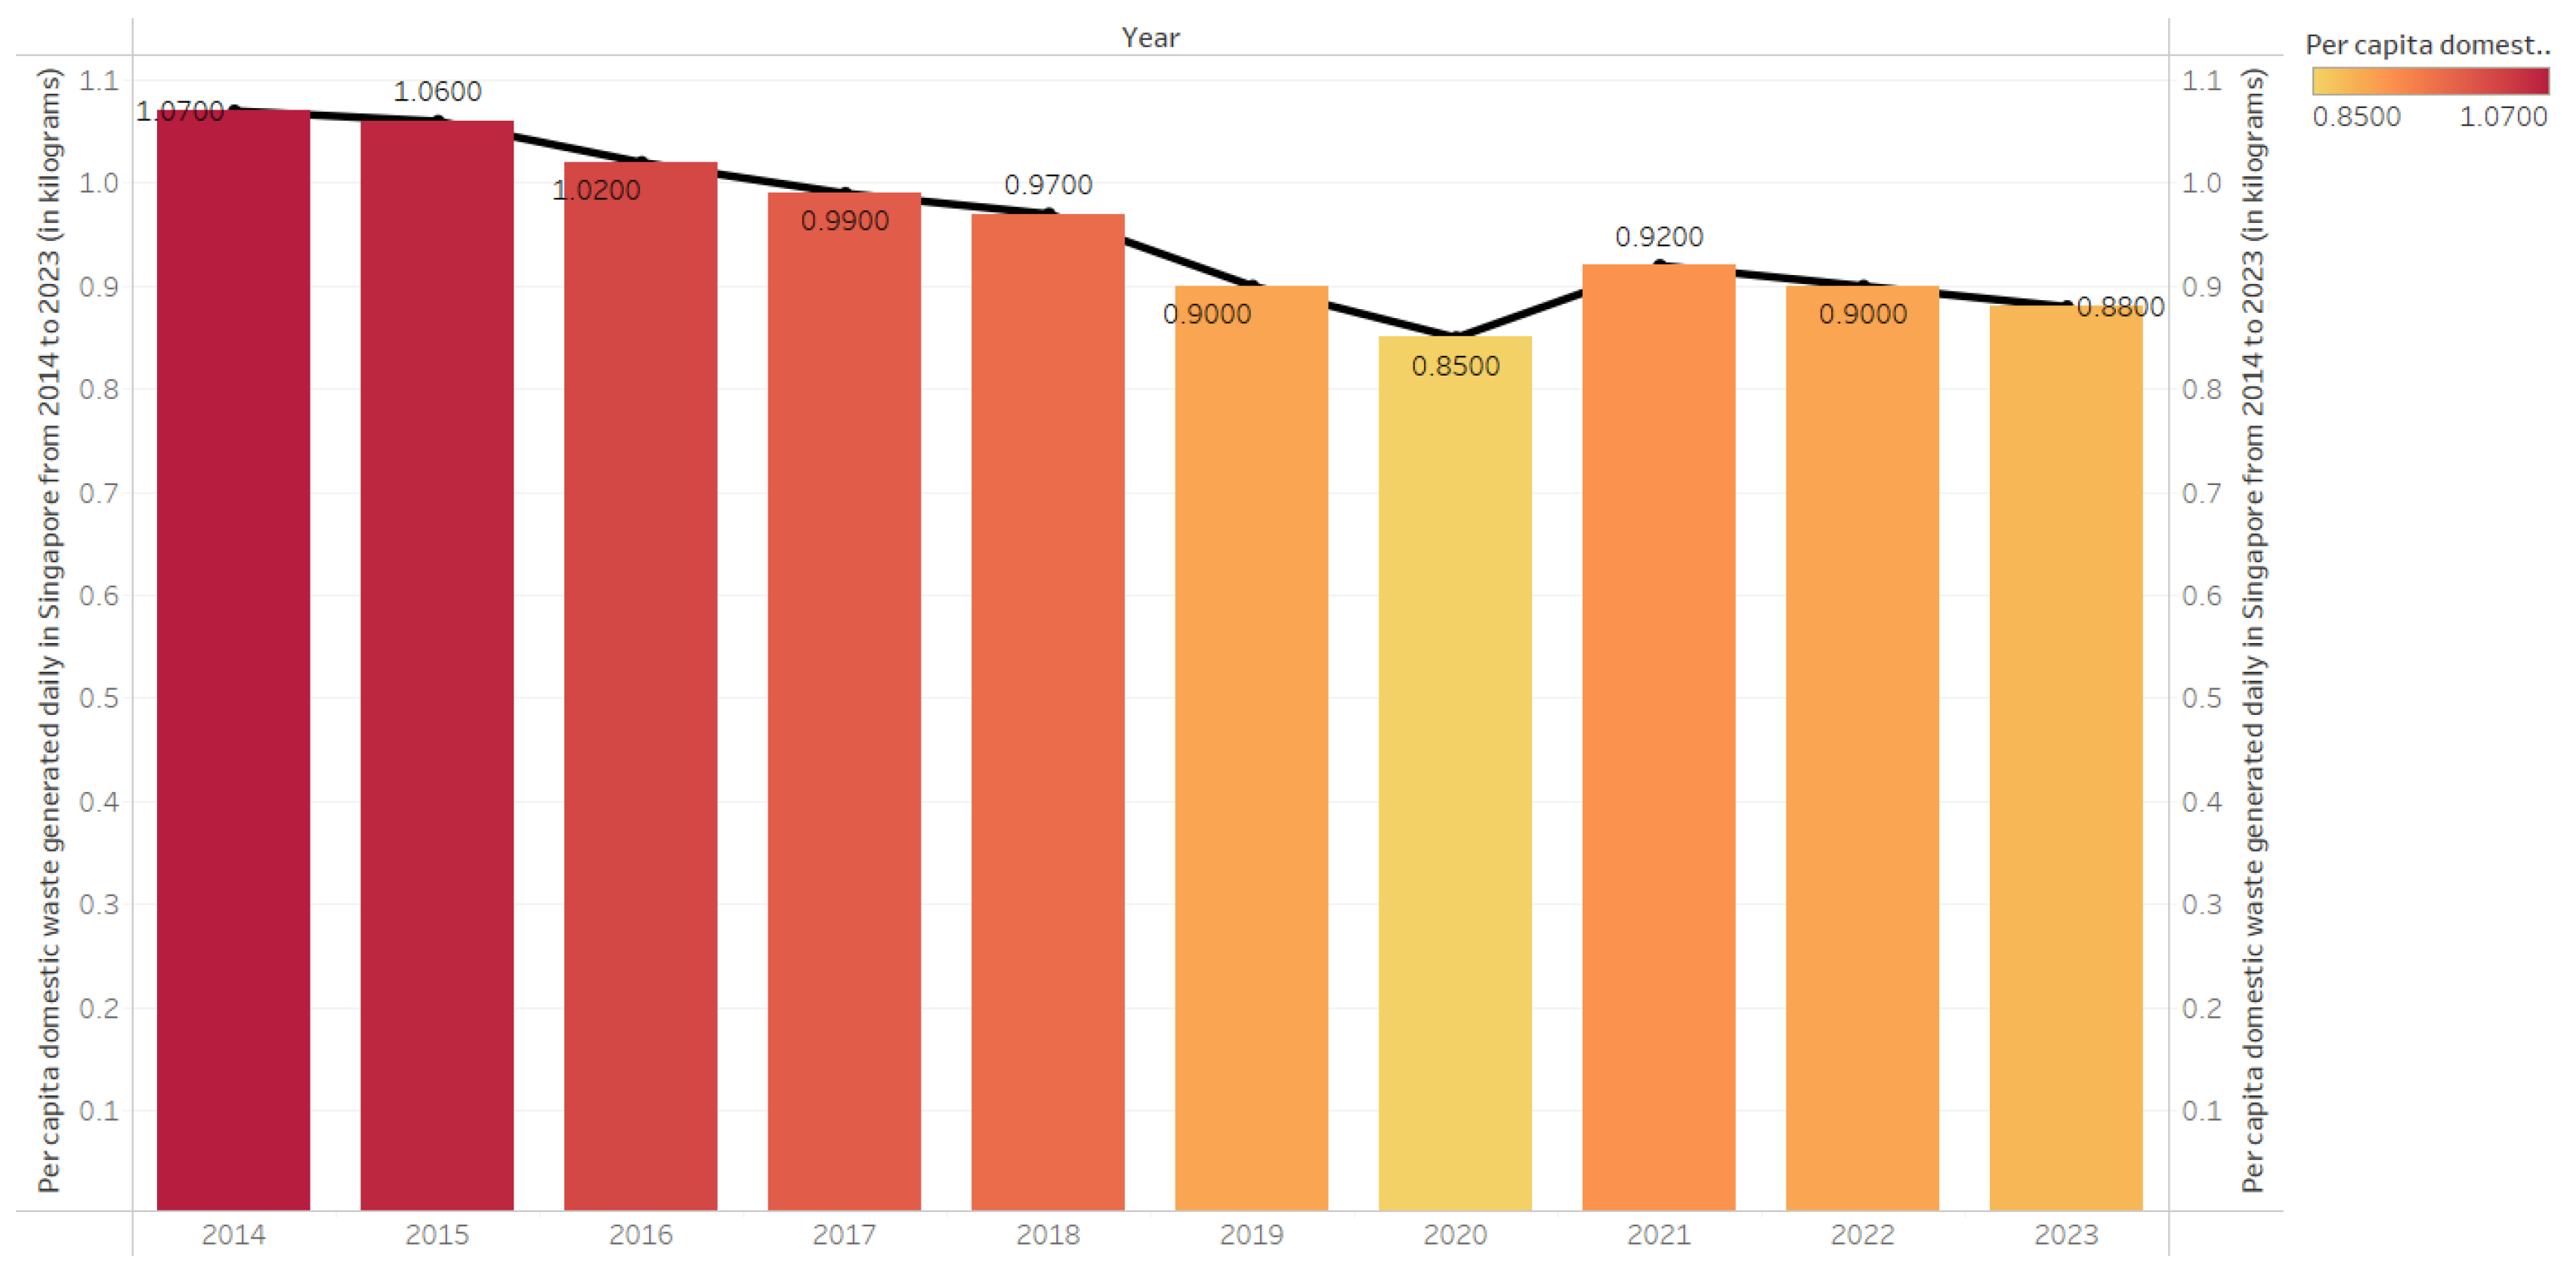
The visualisation illustrates the domestic waste generated per person on average on a daily basis from the years 2014 to 2023. A steady decline was found from the year 2014 with an average of 1.07 kg. The average sum will be reduced to 0.85 kg continuously in the year 2020. However, the average waste generation faced a slight increase in 2021 with 0.92 kg yet the sum continued decreasing 0.88 kg until the year 2023.
Figure 28.
Recycling Rates of Domestic Waste in Singapore (2018–2024).
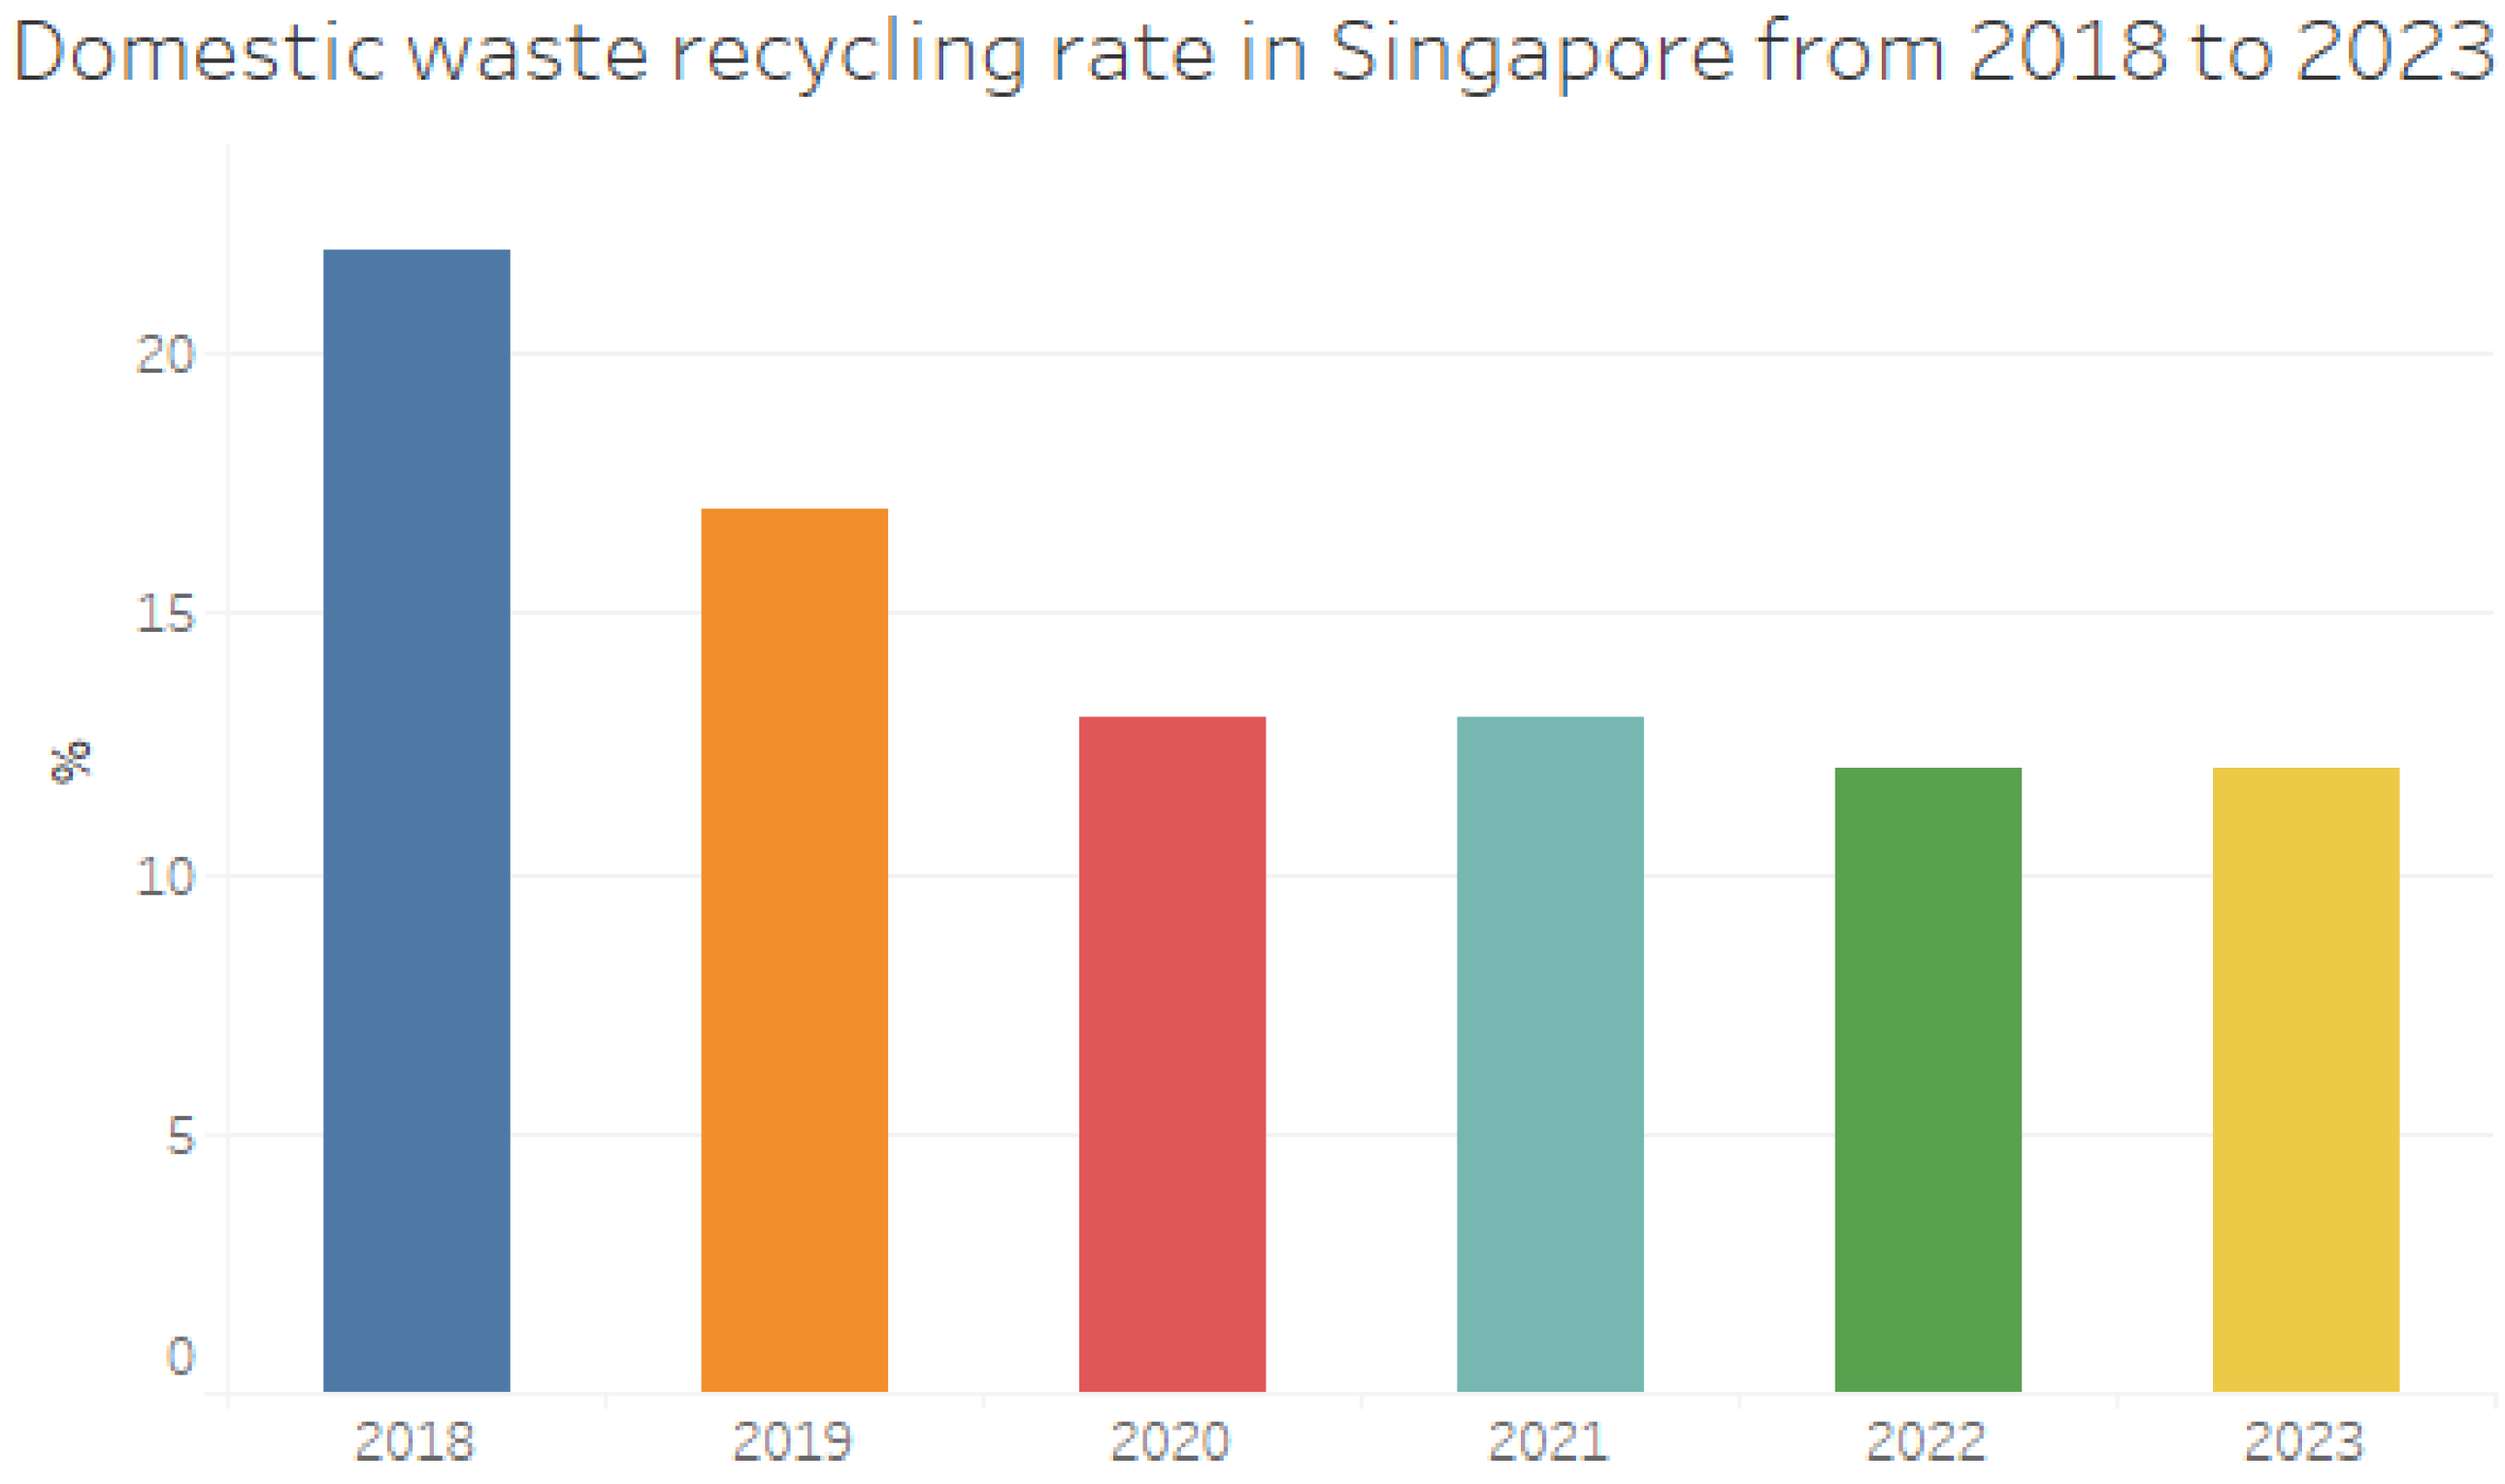
The visualisation illustrates the recycling rates of domestic waste in Singapore from 2018 to 2024. The rates had peaked in 2018 with roughly 22%. However, it dropped to around 17% in 2019. After that, the recycling rate remained stable from 2020 to 2021 with roughly 13%. After 2022, the rates reduced slightly and remained stable again at 12%.
Figure 29.
Singapore Airlines Waste Generation by Fiscal Year (2018–2024).
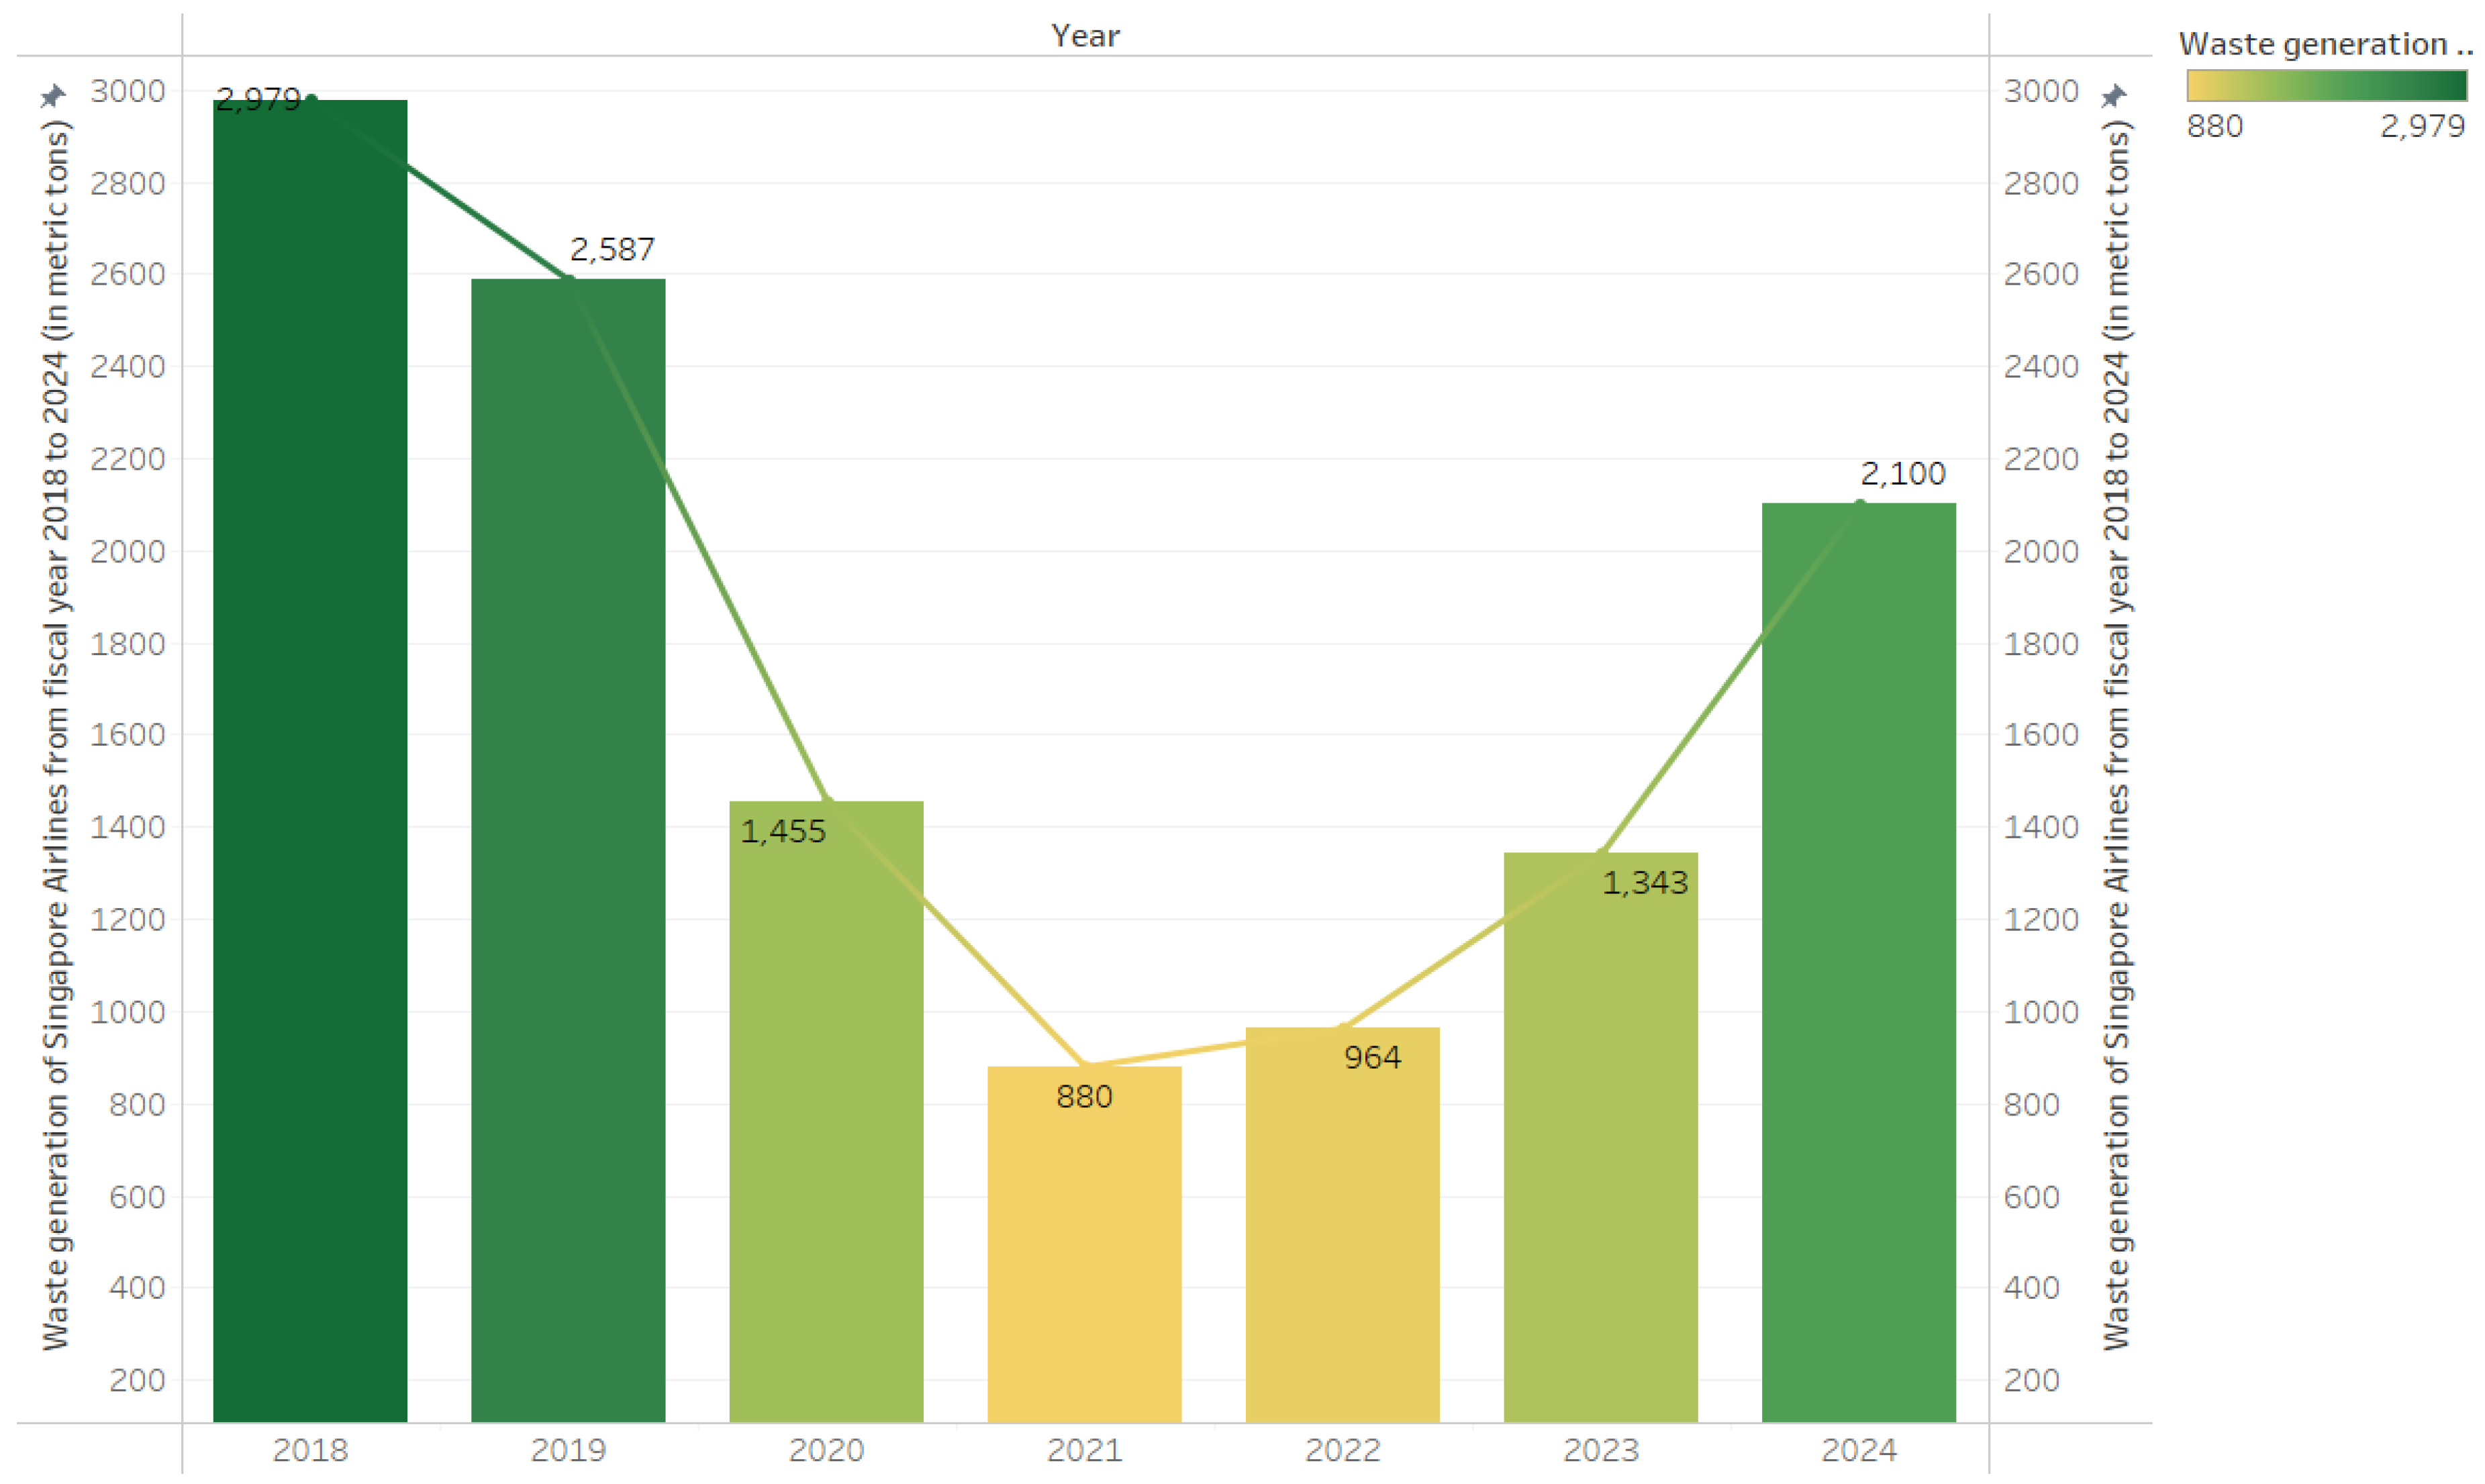
The visualisation depicts waste generation from Singapore Airlines from 2018 to 2024. The bar chart shows a significant fluctuation where waste generation peaked in 2018 with a total of 2,979 metric tons. The sum drastically reduced to a total of 880 metric tons in 2021 and increased again by the year 2024 with 2,100 metric tons.
3.4.7. Group G: Environmental Priorities and Food Waste Behavior
This group looks at how Singaporeans think environmental improvements can be made, what types of marine waste are collected, and how food waste is being reduced. Analysis of data from both years has provided useful information about public attitudes and actions towards the environment.
The visualisation depicts the biggest changes that are needed to improve the living environment in Singapore according to the public in 2018. The top change is the availability of affordable housing with 66% agreeing with it. Similarly, 54% of the people agree to develop comfortable living environments for elderly and disabled patients. However, a majority disagreed with the need for more green spaces (65%), better recycling and waste management infrastructure (61%), reducing pollution (80%), lowering the carbon footprint (79%), reducing traffic congestion and improving transport (54%), and urban development (82%).
The visualisation illustrates the most types of marine waste that were collected in Singapore in 2019. The top most waste that was found is cigarette butts with a rough sum of 13,000 units. The second most type of marine waste found is the plastic bottles with a total slightly higher than 12,000 units. In third is the straws and stirrers with roughly 8,000 units. Following that, food wrappers and plastic bottle caps have also been identified as marine waste with almost 6,000 units. Just below it are the other plastic bags with less than 5,000 units. Next is the plastic cups, plates, grocery bags and take away containers with each of them having a total of around 3,000 units. Lastly, plastic lids are found the least as marine waste which is an estimate of 1,000 units.
Figure 30.
Most Needed Changes to Improve the Living Environment in Singapore (2018).
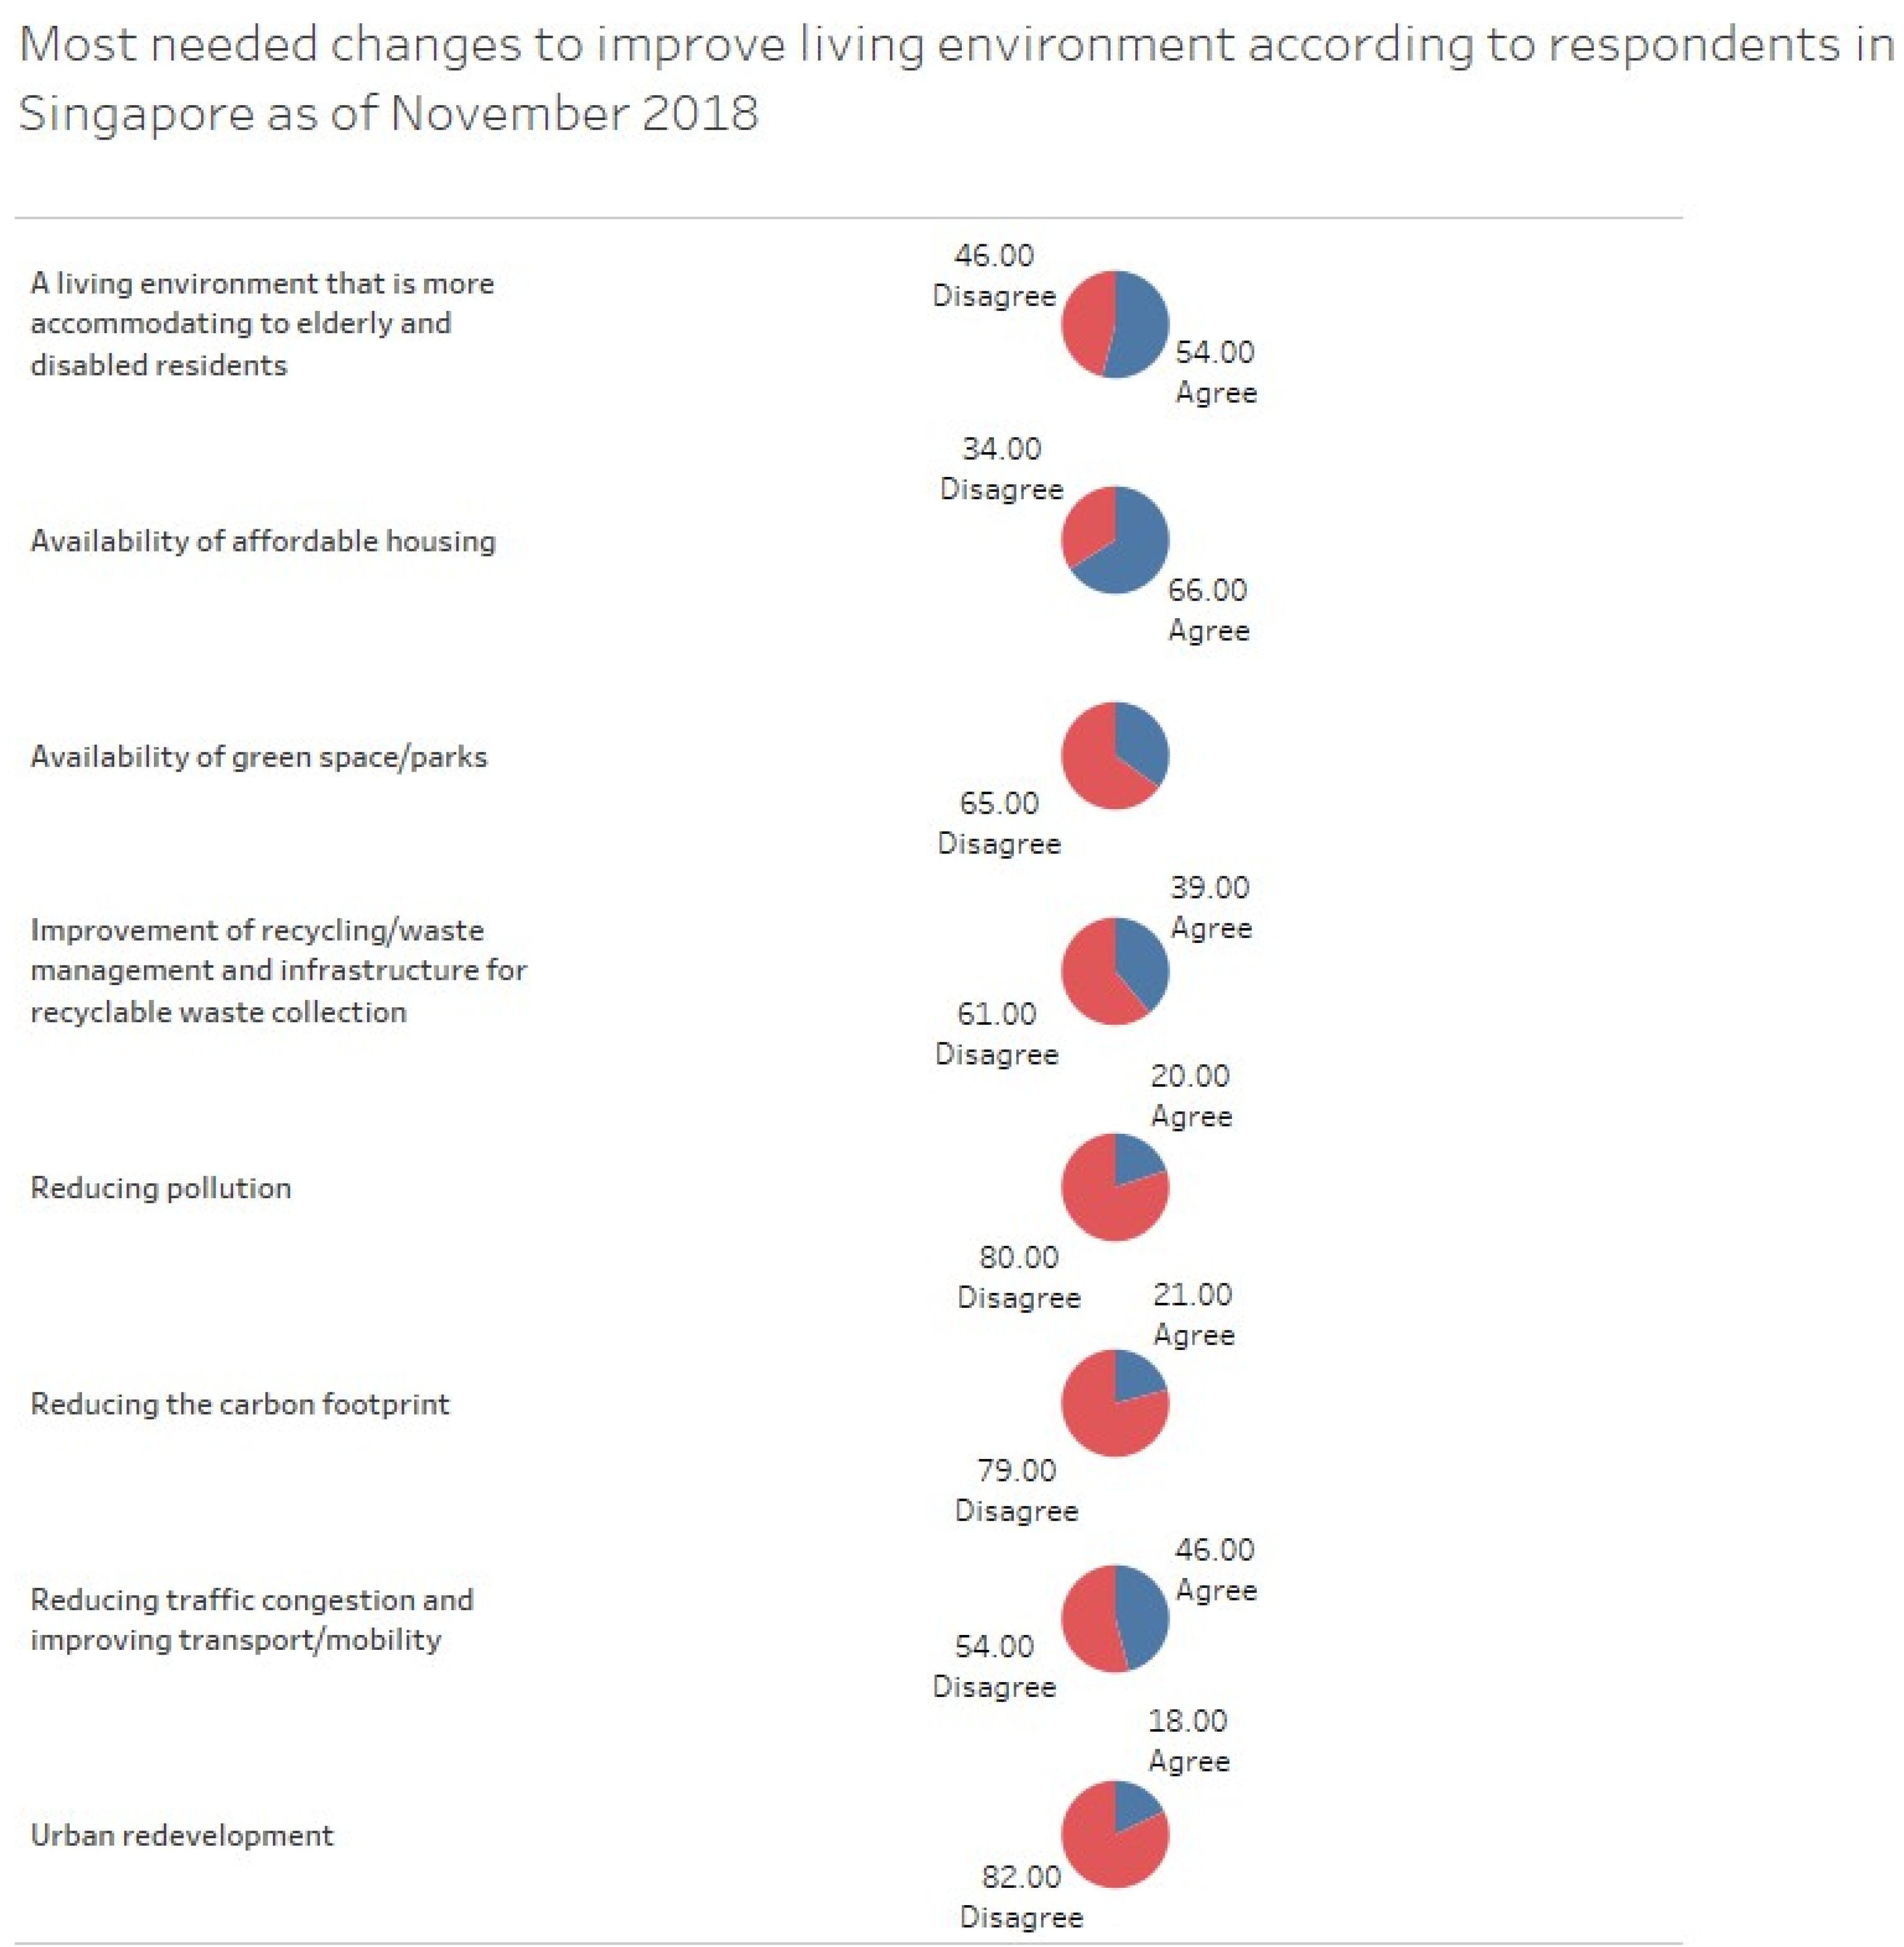
Figure 31.
Leading Types of Marine Waste Collected in Singapore (2019).
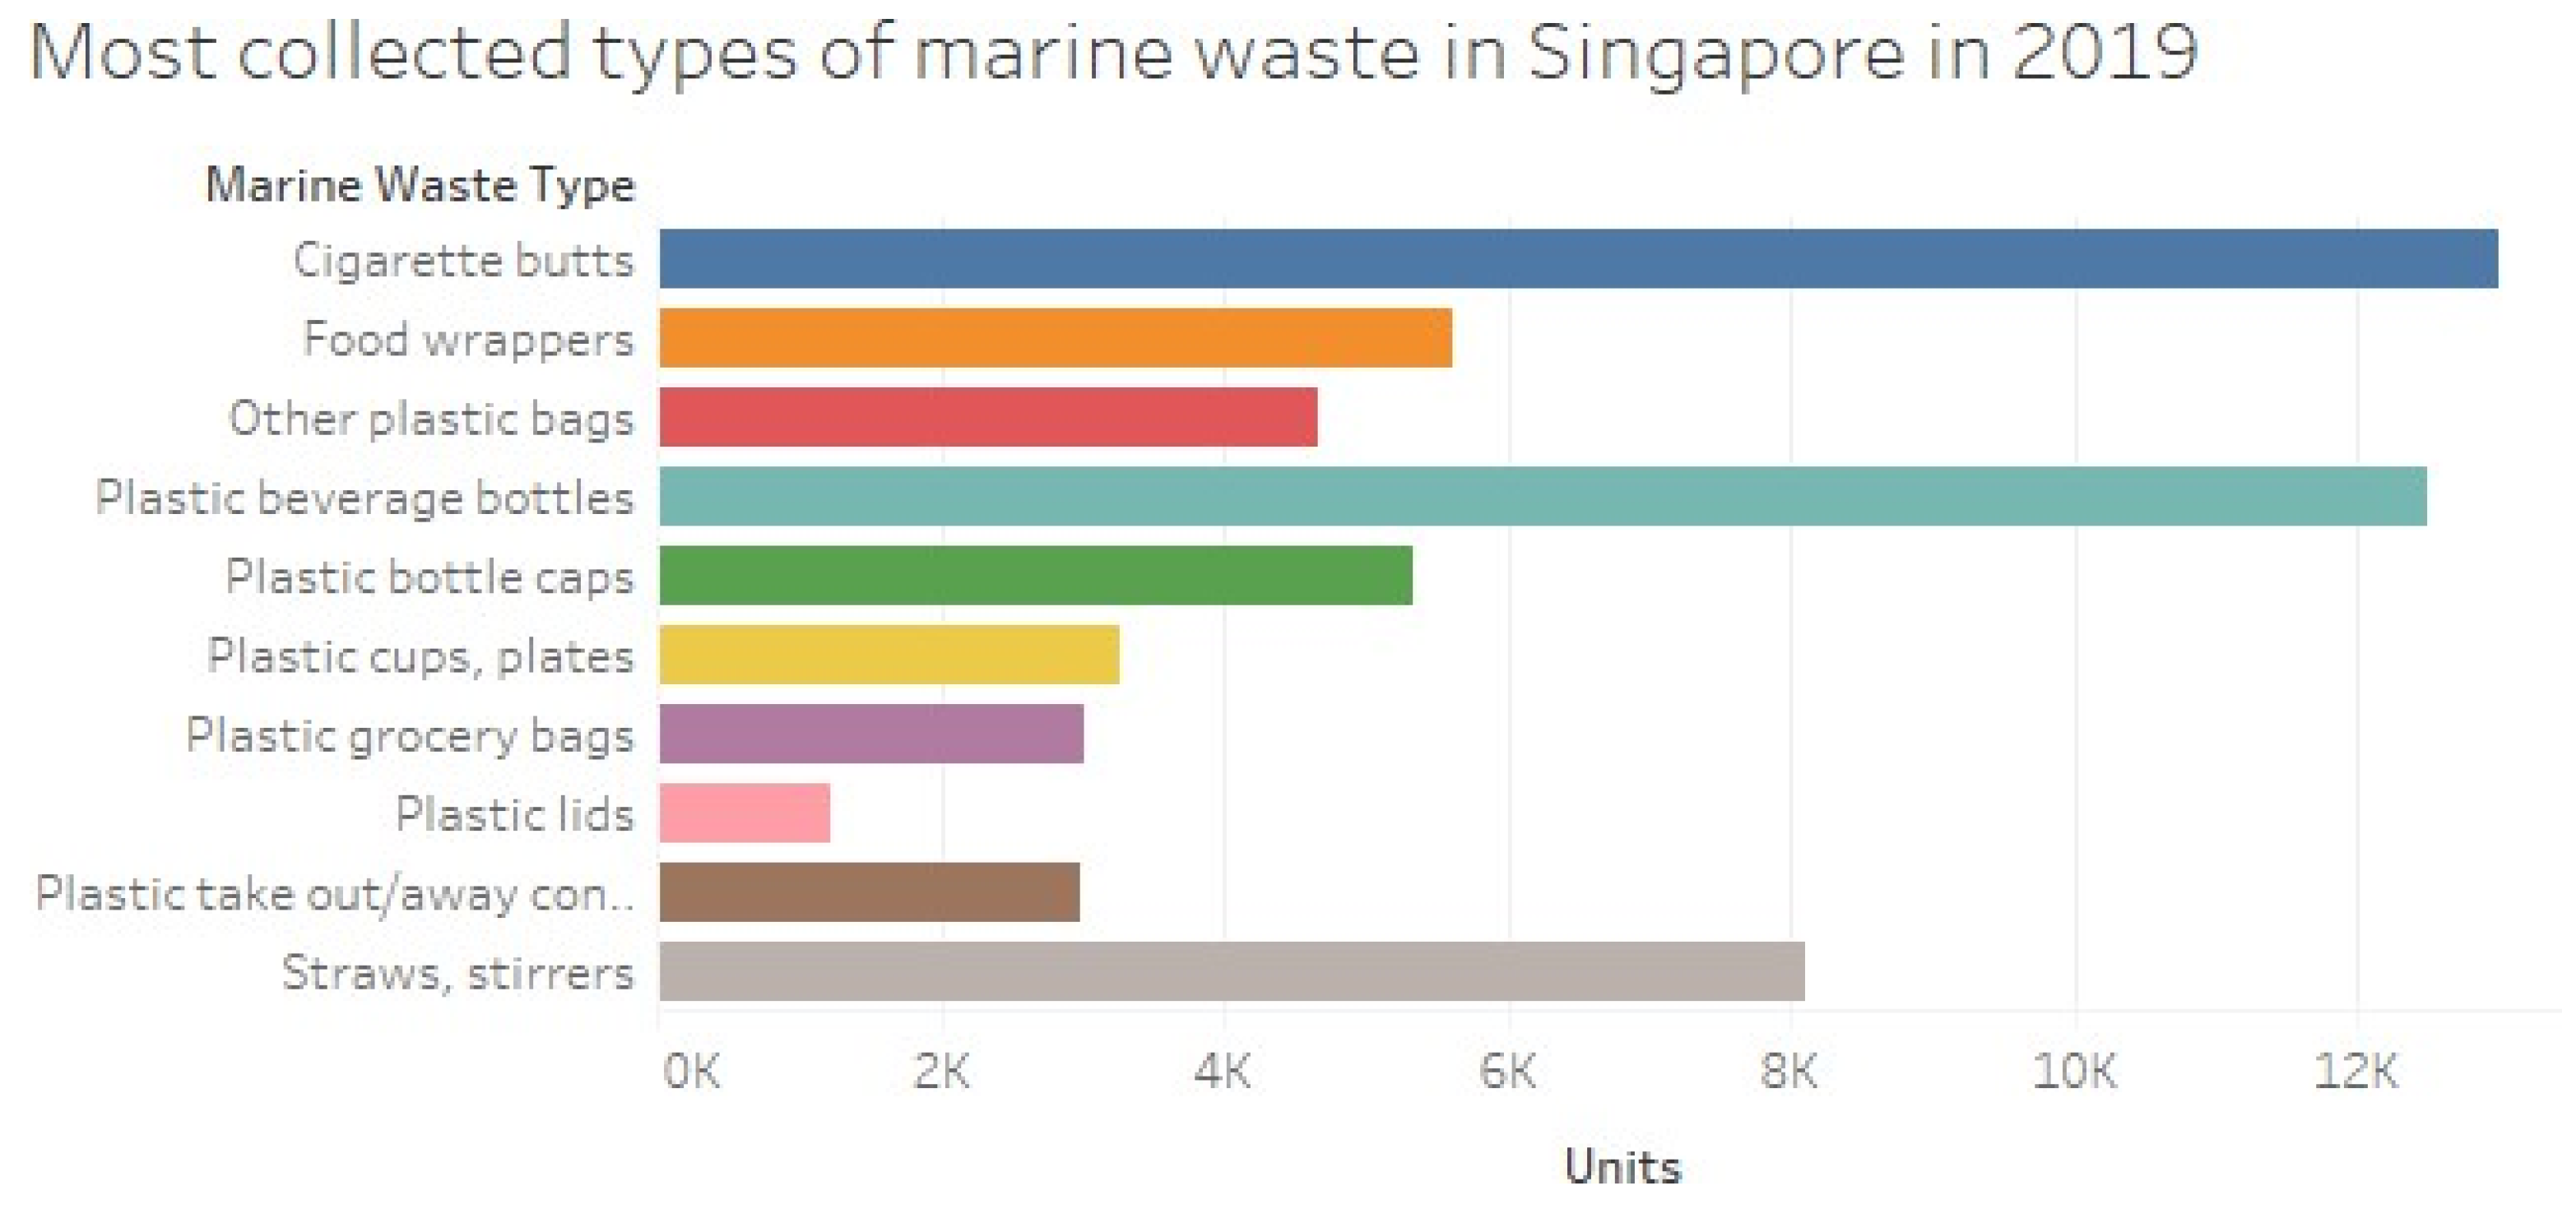
Figure 32.
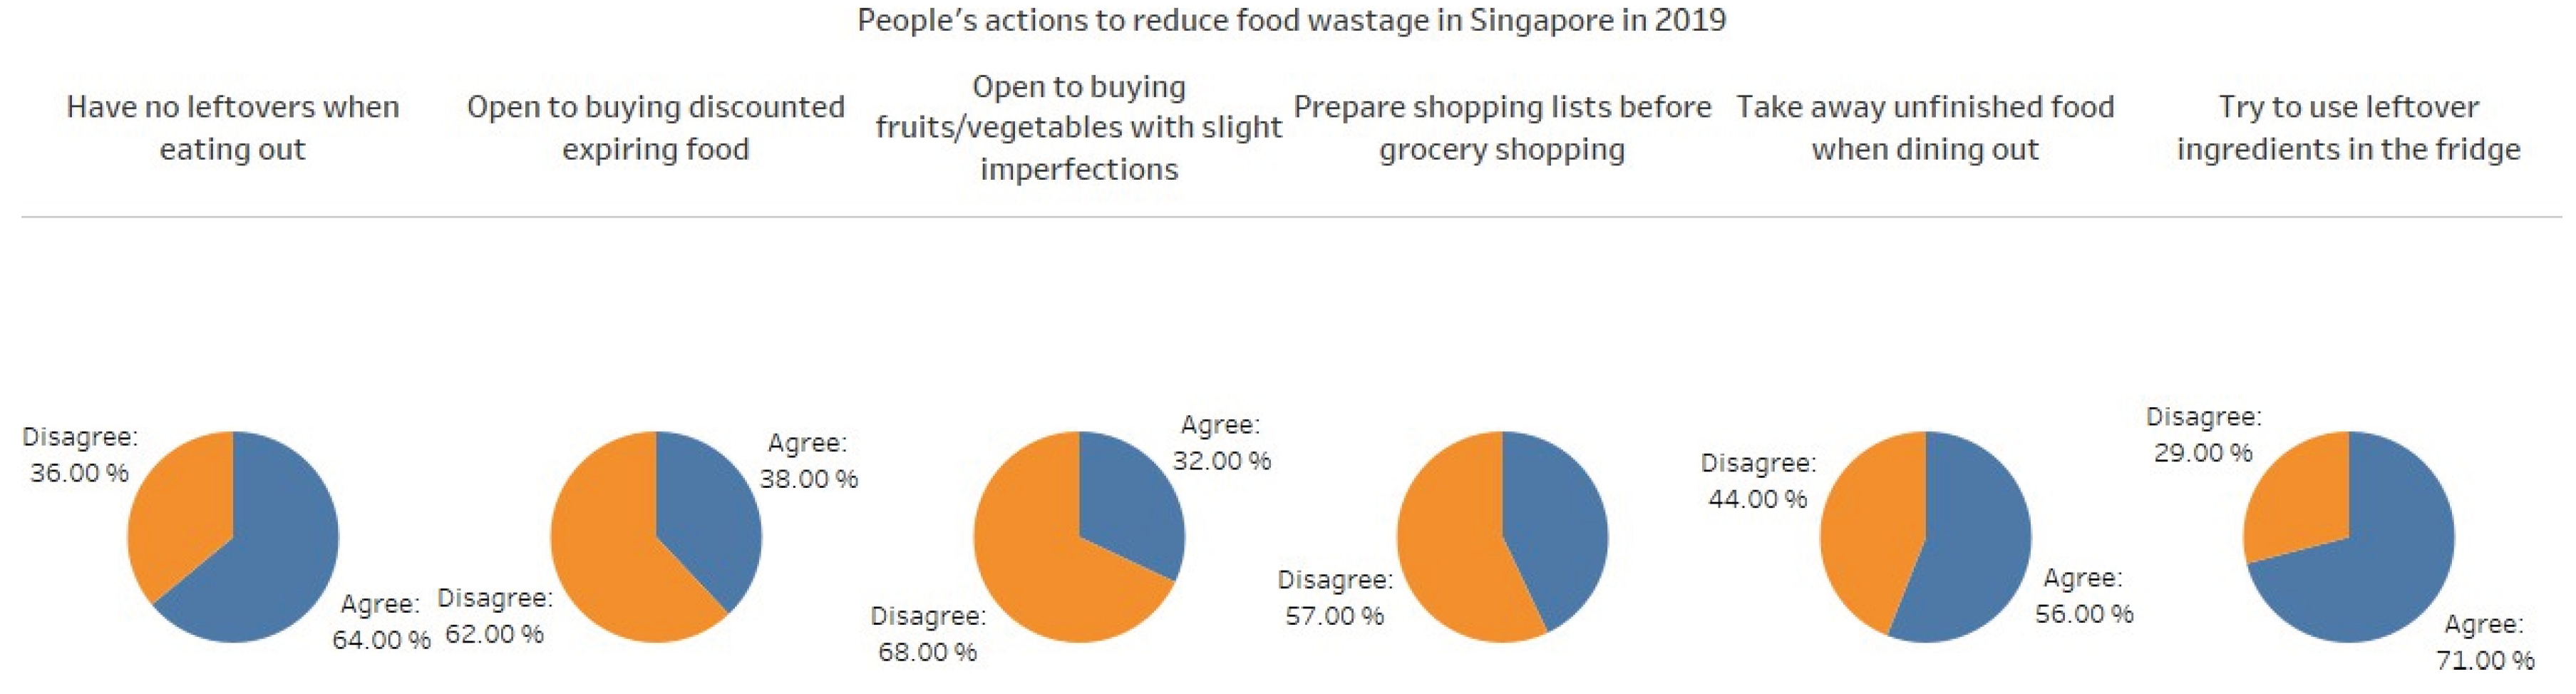
Key Factors for Reducing Food Wastage in Singapore (2019).
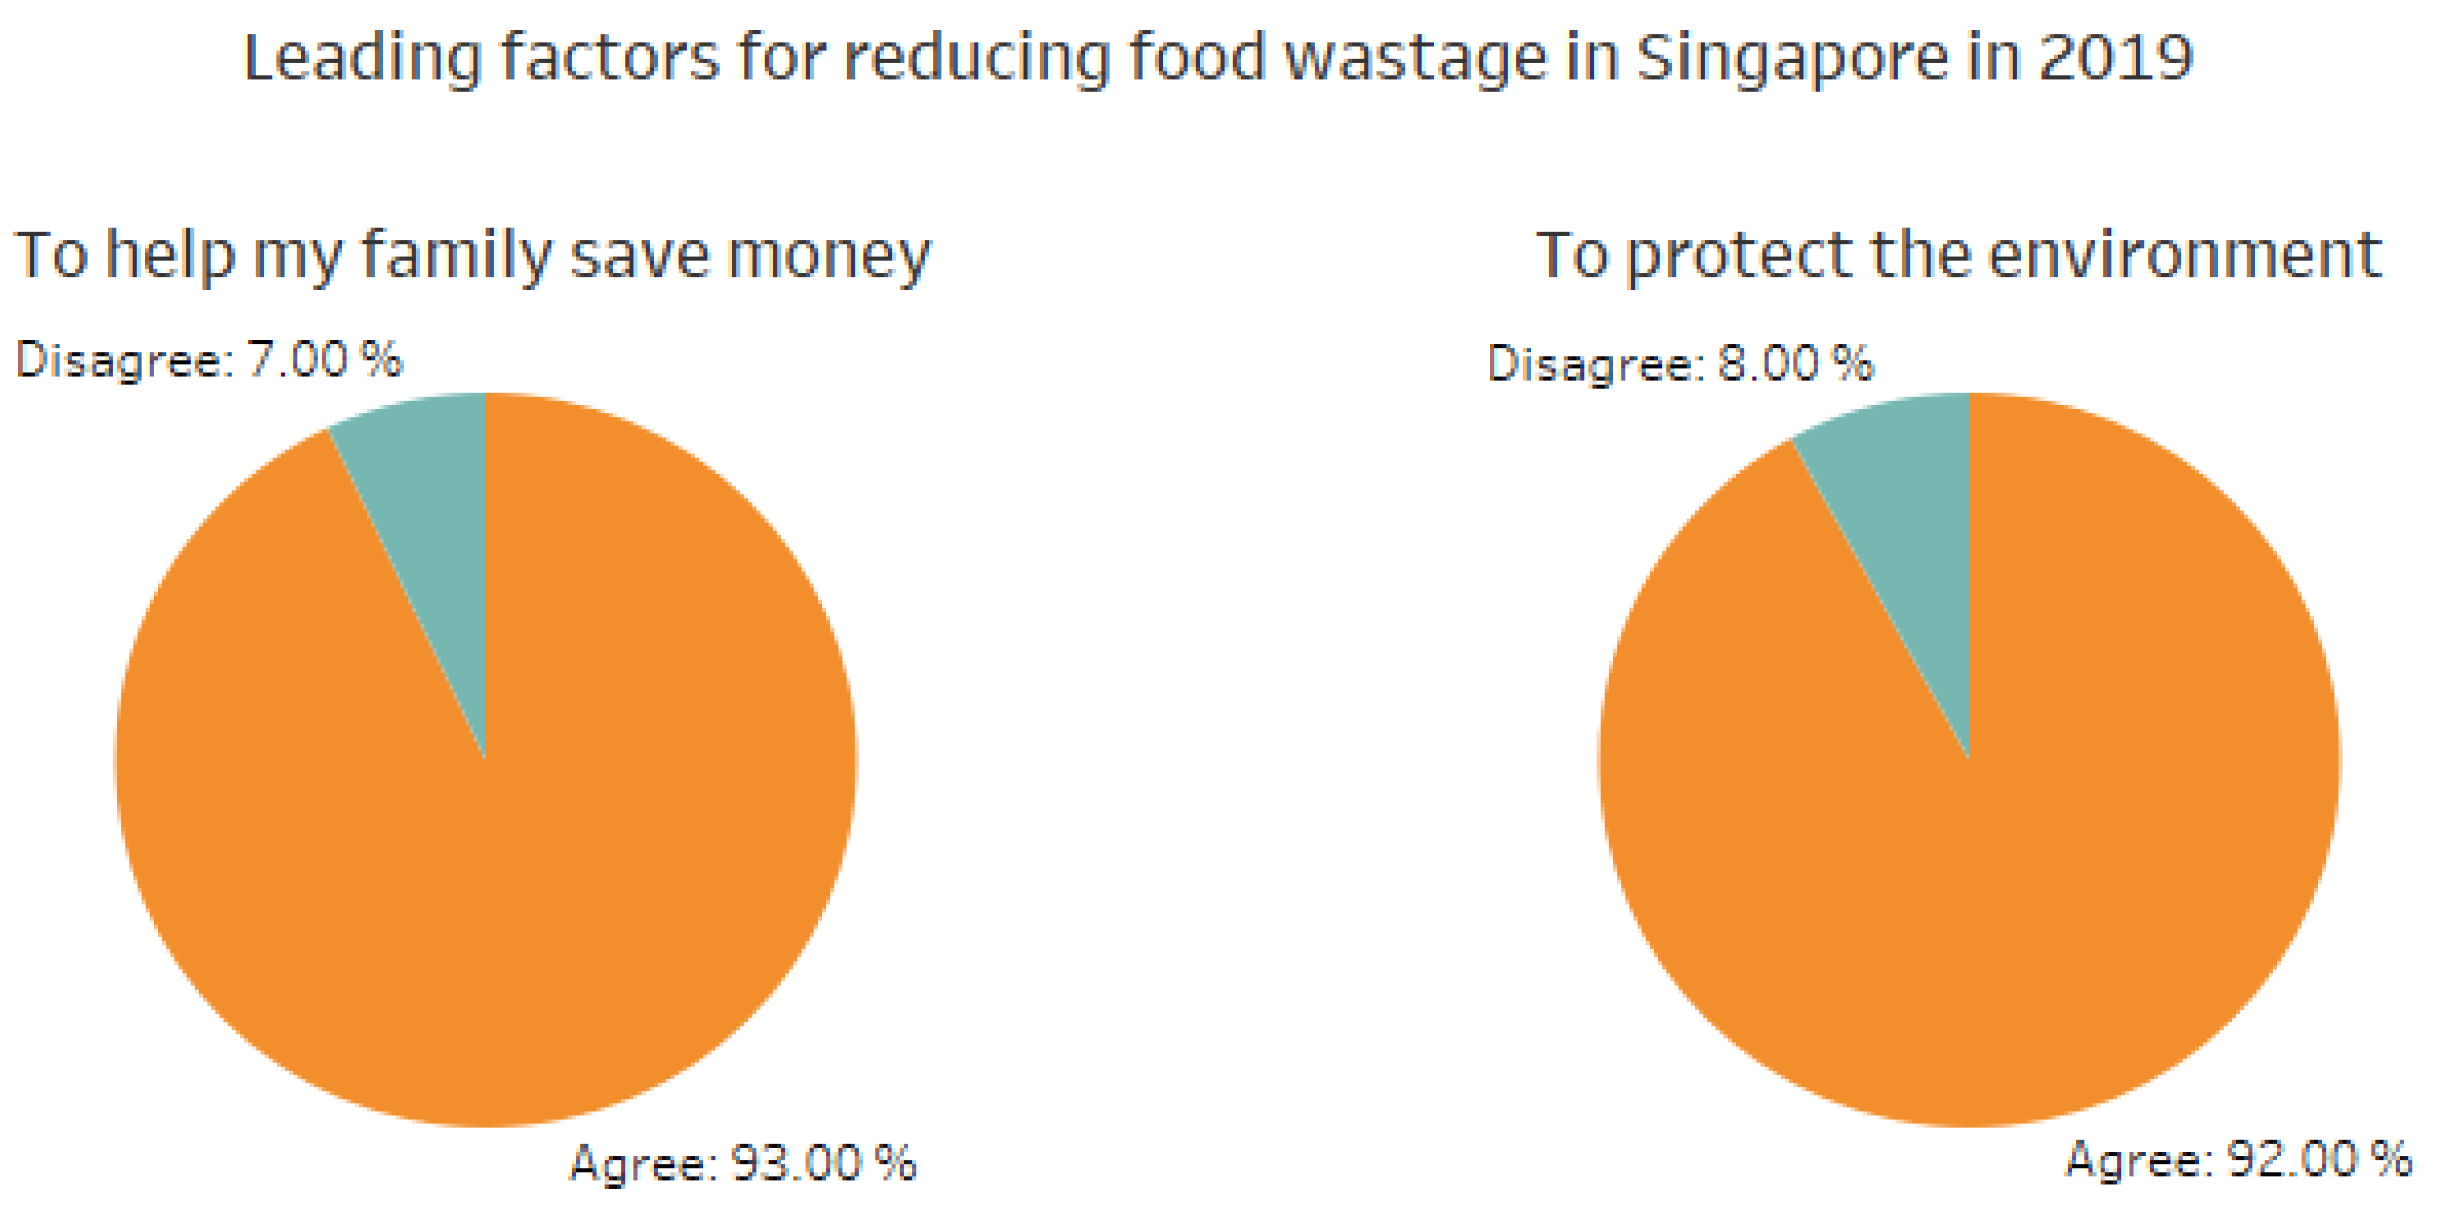
The visualisation shows the main factors for the public to reduce food wastage in Singapore in 2019. The first pie chart shows that 93% of people agree to reduce food waste mainly to help their family save on money. On the other hand, the second pie chart shows that 92% of people reduce food waste for the noble cause of protecting the environment
The visualisation illustrates the actions that the community have taken to reduce food waste in Singapore in 2019. The first pie chart shows that 64% of people agree to not keeping leftovers when eating outside. The next pie chart shows that 62% of people disagree with purchasing discounted foods that are almost expiring. The third pie chart shows that 68% of people disagree with purchasing groceries that have slightly imperfections. The fourth pie chart indicates that 57% of people disagree with preparing a shopping list before going grocery shopping. The next pie chart shows that 56% of people agree to take away unfinished food when dining out. Lastly, the final pie chart indicates that 71% of people agree to use leftover ingredients in the fridge
4. Editorial Thinking
4.1. Plastic Nation: Tracing Singapore’s Growing Plastic Problem
By Sai Rama Mahalingam
4.1.1. Angle
Among the different types of waste generated in Singapore, plastic has risen as the most concerning issue. Over the past few years, an increase in plastic waste has been found which shows a growing dependency on plastic materials. This issue is also worsened by consumer behaviour and global trading. Singapore’s increased plastic consumption is part of a bigger issue where the country also receives plastic waste imports. The most notable instance of the problem is the high volume of plastic waste imported from Germany in 2014.
4.1.2. Framing
This study frames the issue by analyzing the growth in waste generation using visualized data. It focuses on both local generation and international trading trends. When comparing plastic waste with other types of wastes, it is unveiled that plastic is considered to be a dominant waste stream.
4.1.3. Focus: Beyond Our Bin: Tracing the Plastic Trail
Plastic waste is slowly becoming the dominant waste type in Singapore with its steady growth in waste generation, as shown in Section 3.4.2 Group B Figure 10. This trend shows an increase in reliance on disposable packaging and plastic products. Despite this issue, recycling rates have remained low, providing inconsistency between waste generation and recovery. In Section 3.4.4 Group D, the charts show how Singapore also plays a role in the international plastic trade. Germany's imports of plastic saw the most notable surge in 2014, increasing to 462.6 tonnes. Despite the temporary issue, it mainly shows Singapore’s position in the global waste trade sector.
On the other hand, public behaviour worsens the problem. According to Section 3.4.5 Group E, a percentage of 22% of the total respondents report that they utilize reusable bags, and only 25% of them regularly recycle plastic bottles. Awareness campaigns are always raised, however, the motivation to recycle is mostly compelled by convenience.
4.2. The Human Factor: How Public Behavior Shapes Waste Trends
By Sivamuganathan Mohana Dass
4.2.1. Angle
Public behaviour and perception plays a critical role in influencing Singapore's development towards a sustainable future. Based on multiple studies carried out between 2018 to 2024 as discussed in Section 3.4.5 Group E and Section 3.4.7 Group G, although awareness of recycling and sustainable activities are present among the public, consistent implementation remains in progress. In this section, instead of concentrating on regulations or technologies, we aim to analyse public attitudes and how these translate into real-world actions such as recycling, reusing materials, and minimizing food and packaging waste.
4.2.2. Framing
Based on the survey responses and visual data, this analysis highlights both motivators who support sustainable efforts and obstacles that refrain from it. It examines how convenience, incentive systems, environmental concern and economic factors influence the public behaviour towards recycling and sustainability. The trend indicates the incremental developments such as an increase in recycling of plastic bottles and growing expectations for eco-friendly retail practices. But on the other hand, it also highlights persistent gaps such as seldom use of reusable bags and low frequency of household waste recycling as shown in Figure 21 and Figure 22 in Section 3.4.5 Group E.
4.2.3. Focus: Bridging the Intention–Action Gap in Public Sustainability Behavior
Despite surveys indicating increased public awareness, the actual behaviors in Singapore show a persistent gap between intention and action. As depicted in Figure 21 and Figure 22 from Section 3.4.5 Group E, only 22% of respondents always use reusable bags, and just 28% consistently recycle household waste, which suggests that although sustainability is valued in theory, it is not yet embedded in daily routines optimally.
Moreover, motivational data presented in Figure 23 indicates that the individuals are more motivated to recycle when the process is convenient or incentivized -68% of respondents identified improved access to recycling bins, while 65% emphasised incentives systems as significant motivators. This suggests that the logistical and psychological barriers surpass environmental consideration in promoting action.
Furthermore, Figure 24 shows that 47% of individuals frequently recycle single-use plastic bottles, although a significant 15% of them do so infrequently, and the remaining 7% do not recycle them at all. These inconsistencies highlight the fragmented nature of sustainable behavior adoption. Similarly, Figure 33 in Section 3.4.7 Group G shows inconsistent attitudes towards food waste reduction including a substantial acceptance on using leftovers (71%) while demonstrating low adherence to practices such as shopping planning (57% disagreement).
4.3. Hidden Culprits: Industries Behind Singapore’s Waste Burden
By Addy Arif Bin Mahathir
4.3.1. Angle
Although Singapore's trash discourse mostly focuses on family accountability and individual recycling practices, a detailed examination indicates that a significant fraction of the nation's waste load originates from non-domestic sources.
4.3.2. Framing
This editorial examines the disparity between home and non-domestic waste generation in Singapore during the last ten years, emphasising the significant contributions of industrial, commercial, and institutional sectors, especially aviation, to the national garbage footprint. This study uses longitudinal data from 2014 to 2023 to emphasise the need of reframing narratives around waste responsibility and advocating for structural improvements in industry-level waste management.
4.3.3. Focus: Non-Domestic Waste: The Predominant Contributor
In the last 10 years, Singapore has accomplished a notable decrease in non-domestic waste intensity. The daily non-domestic trash produced per dollar of Gross Domestic Product (GDP) decreased from 40 tonnes in 2013 to 26 tonnes in 2023, representing a 35% reduction. (National Environment Agency, 2023) This enhancement indicates improved resource efficiency and waste management methods in industrial and commercial sectors.
A multitude of variables has contributed to this favourable trend. The implementation of sustainable practices by firms, motivated by environmental restrictions and corporate responsibility efforts, has been essential. Moreover, transitions in the economic framework towards service-oriented businesses, which generally produce less waste than industrial sectors, have further facilitated the decline in non-domestic waste intensity.
4.3.4. Focus: Sector Spotlight: Singapore Airlines’ Waste Trajectory
Singapore Airlines (SIA) has significantly enhanced its in-flight trash management practices. In the fiscal year 2023/24, SIA claimed a recycling rate of 11% for its in-flight garbage, at 393 tonnes, a substantial rise from the previously recorded 1.7%. (The Straits Times, 2024) This improvement demonstrates the airline's dedication to sustainability and its initiatives to mitigate environmental effects.
The variations in SIA's waste production may be ascribed to many sources. The COVID-19 epidemic caused a significant decline in flying operations, leading to a drop in garbage production. With the resumption of operations, waste levels therefore escalated. Moreover, international rules often categorise in-flight garbage as biohazardous, so limiting recycling prospects and complicating waste reduction initiatives.
4.4. Beyond Recycling:Rethinking Waste Through Energy and Oil Savings
By Noor Ul Amin
4.4.1. Angle
It is a universally accepted fact that recycling saves energy and fossil fuels; the latter heavily pollutes the environment when it is used. The more waste recycled, the more energy and fossil fuels that gets conserved. However a closer look at the study of Singapore’s waste showed that recycling some materials saves more energy and fossil fuel (crude oil in this case) than others.
4.4.2. Framing
This editorial examines the disparity of energy and crude oil, as it was the only fossil fuel whose consumption in the process was found in the datasets publicly available. The information in ‘Figure 8 – Energy Saved by Recycling 1 Tonne of Material (kWh)’, ‘Figure 9 – Crude Oil Saved by Recycling 1 Tonne of Material (in Barrels)’, and ‘Figure 10 – Energy and Oil Saved per Tonne Recycled by Material’ - with Figure 10 combining both visualizations - shows the energy and crude oil saved in recycling 5 categories of materials: Ferrous Metals, Glass, Non-Ferrous Metals, Paper, and Plastic. From this study we learn that Non-Ferrous Metals save the most energy and crude oil when recycled and this shows that they should be given the priority when it comes to recycling waste because they use the most energy and crude oil.
4.4.3.1. Focus: Energy and Crude Oil saved from recycling waste items
Singapore is not a producer of crude oil but rather has to import it from abroad while energy production is also costly. Not only that but crude oil also causes lots of environmental pollution when it is burned creating an environmental and economic cost for the government. On the other hand if the government can figure out which materials save the most energy and crude oil it can help them divert more resources and attention to recycling these materials. In this context energy and crude oil saved by recycling an item is the measure of how much less energy and crude oil it takes to recycle an item from the waste compared to manufacturing it brand new (i.e., from scratch). In the long run the money saved on energy and crude oil can be invested into other initiatives that will overall improve the country and help it achieve its economic (i.e., lesser imports of crude oil from overseas) and environmental goals as well.
The studies in ‘Figure 10 – Energy and Oil Saved per Tonne Recycled by Material’ indicate that recycling glass saved the least amount of energy and crude oil at 42 Kwh and 40 barrels though it is possible that this is because of how low the share of glass waste is in overall Singapore’s generated waste - a fact that is supported by ‘Figure 13 – Comparison of Waste Types in [2013, 2017, 2020, 2023]’ which shows that Paper, Plastic and Food are the leading categories of generated waste in these years. It is rational to assume that this has been the same pattern throughout the time our data on crude oil and energy conservation was collected - given that iit does not explicitly mention the years. Ferrous Metals are next with 642 Kwh of energy and 0.12 barrels of crude oil being saved. Based on our findings discussed earlier we can give the exact same justification for Ferrous Metals as we did for Glass (i.e., their overall share in the waste generated by Singapore is low). Then comes paper with 4,100 Kwh of energy and 11.00 barrels of crude oil being saved. Paper is a highly used item in everyday life and yet our studies indicate that it is not the most energy-crude oil saving waste category but only the third in rank for plastic saves 5,774 Kwh of energy and 16.00 barrels of crude oil. The most energy and crude oil saving category is Non-Ferrous metals which save 14,000 Kwh of energy and 40.00 barrels of oil respectively.
The key takeaway from this is that the government should prioritize recycling Non-Ferrous Metals followed by Plastic and Paper as these are top 3 energy and crude oil saving items amongst the waste generated by the country, Furthermore they are part of everyday generated waste and so if the government chooses to invest on recycling them more then they will be saving more money because it costs more to manufacture these items from scratch than it does to recycle them from the waste and this is evidenced by the magnificent amount of energy and crude oil their recycling saves. The money saved on this can be invested by the government on lots of other initiatives which can economically develop the country while at the same time these measures help them reduce their carbon footprint and become more eco-friendly and progress in their environmental goals of reducing pollution by using the 3 R's - Reduce, Reuse, Recycle.
4.5. Singapore’s Path to Zero Waste: Successes and Setbacks
By Priyanshu Das
4.5.1. Angle
When we look carefully at long-term patterns of Singapore's national waste, we can see that while there are incredible achievements, there are also emerging obstacles. Using a national perspective, this editorial examines whether Singapore’s waste management efforts in the last 20 years fit with its dreams of reaching “Zero waste by 2035”.
The analysis relies on tracking data for waste generated, waste recycled, and waste disposed of to assess the effectiveness of policies and public support and to see if current trends will allow the 2035 target to be met. The purpose is not to doubt Singapore’s motives, but rather to examine the results of those goals based on what happened in the past and observe how the nation’s waste has shifted over this time.
4.5.2. Framing
Waste performance is evaluated along the national trajectory, with the help of key datasets from Group A and Group C. These datasets give a detailed overview of waste in Singapore for the last twenty years, showing the total amount of waste, total recycling and disposal volumes and rates for recycling household and food waste. They aid in gathering evidence that helps identify Singapore’s achievements and the main issues in its waste system.
The analysis divides the overall story into three stages: the formative years of the early 2000s, a successful period between 2009 and 2013, and a period of stagnation beginning around 2018. Because waste is measured by time, this approach helps you see how Singapore’s waste management has changed and which points showed major changes, good or bad. Long-term data enable us to investigate whether previous results have held up over time and how the healthcare system has handled tough situations, for instance, the COVID-19 pandemic.
4.5.3. Focus: 2009–2013 – A Period of Momentum
During the period from 2009 to 2013, Singapore made important progress in reducing and recycling its waste. The visualizations from Group A, including Section 3.4.1 Group A Figure 5 and Section 3.4.1 Group A Figure 6, indicate an increase in the amount of recycled waste, with the amount of overall waste starting to become more stable. At this moment, more than 60% of the country’s materials were being recycled, which represented a major achievement. The improvement happened thanks to the launch of the National Recycling Programme and a sudden increase in recycling among both companies and the public. Non-domestic sectors were very important in recovering waste by using large-scale recovery strategies [32,33,34,35,36,37].
At the same time, members of the public learned more about recycling, and the government put money into building more convenient bins and making collection easier. Sorting out industrial waste and using more resources in recycling made recycling numbers better nationwide [38,39,40,41,42]. Organic waste management started being mentioned during these years, which helped spark reforms still to come. All in all, Singapore showed what it can do when policy, infrastructure, and engagement are in sync. The trends are further proven with charts like Section 3.4.3 Group C Figure 16, revealing the nation's recycling performance rising steadily until it reached a plateau.
4.5.3. Focus: 2018–2023 – Stagnation and Setbacks:
After 2018, the situation developed differently. While a large amount of waste was still being made, advances in recycling stopped at a certain point. The Group C visualizations suggest that household recycling never increased beyond 13% to 18% over the years. Although more people are trying to recycle food waste, it was only at 18% by 2023. The statistics revealed that recycling by institutions continued at around the same rate, yet making recycling part of daily life for most people was still difficult. This is clearly illustrated in Section 3.4.3 Group C Figure 17, which highlights limited growth in key areas [43,44,45,46,47].
Reactions to the COVID-19 pandemic made things more difficult because it affected recycling programs, caused people to use more single-use plastic products, and moved attention from the environment to public health. While the Zero Waste initiative was created in 2019 to bring about national change, such as making food waste segregation mandatory and increasing responsibility for producers, its results are still not widely visible in data. The slow progress after 2018 reveals that wider knowledge alone is not enough and suggests we should introduce more oversight, extra incentives, and invest more in local recycling capabilities to make a difference.
5. Conclusion
Collectively, these charts underscore the pressing necessity for policies tailored to certain types of waste. The persistent and increasing amounts of paper waste indicate a need for enhanced policy attention and public involvement, despite the importance of addressing food and plastic waste. As Singapore progresses towards its Zero Waste 2035 objective, these insights can inform more customised and effective waste management strategies.
References
- Amazon, OnePoll. 77% of Singapore shoppers would be open to receiving online orders without added delivery packaging. Opinions of consumers on what retailers should prioritize regarding packaging for online shopping purchases in Singapore as of April 2024. 2024a. Available online: https://press.aboutamazon.com/sg/sustainability/2024/6/77-of-singapore-shop.
- Amazon, OnePoll. 77% of Singapore shoppers would be open to receiving online orders without added delivery packaging. Leading reasons consumers stated for choosing no added delivery packaging for online shopping purchases in Singapore as of April 2024. 2024b. Available online: https://press.aboutamazon.com/sg/sustainability/2024/6/77-of-singapore-shop.
- Awan, A. A. Discover how much Singapore is saving energy per years by recycling. Singapore waste management. 2021. Available online: https://www.kaggle.com/datasets/kingabzpro/singapore-waste-management.
- Begum, S.; Hong, L. Domestic recycling rate in Singapore in 2022 lowest in more than a decade. The Straits Times. 3 May 2023. Available online: https://www.straitstimes.com/singapore/domestic-recycling-rate-in-singapore-l.
- Channel News Asia, National Environment Agency, & Ganesan, N. (2024a). Singapore’s recycling rate falls to 52% in 2023, decline from 10 years ago. Amount of domestic waste generated daily by a person in Singapore on average. Available online: https://www.channelnewsasia.com/singapore/recycling-rate-domestic-waste-st.
- Channel News Asia, National Environment Agency, & Ganesan, N. (2024b). Singapore’s recycling rate falls to 52% in 2023, decline from 10 years ago. Overall recycling rate in Singapore from 2014 to 2023. Available online: https://www.channelnewsasia.com/singapore/recycling-rate-domestic-waste-st.
- Klynveld Peat Marwick Goerdeler, & YouGov. (2019). Connected cities : citizen across Asia Pacific 2019 survey,. 36. Most needed changes to improve living environment according to respondents in Singapore as of November 2018. Available online: https://assets.kpmg.com/content/dam/kpmg/cn/pdf/en/2019/01/connected-citie.
- Milieu Insight. (2023a). Frequency of recycling single-use plastic bottles in Singapore as of May 2023. mili.eu.
- Milieu Insight. (2023b). Leading factors to motivate Singaporeans to recycle more often as of May 2023. mili.eu.
- National Environment Agency. (2016). Solid Waste Management Infrastructure. Nea.gov.sg. 2016. Available online: https://www.nea.gov.sg/our-services/waste-management/waste-management-.
- National Environment Agency. (2019a). Leading factors for reducing food wastage in Singapore in 2019. Available online: www.nea.gov.sg.
- National Environment Agency. (2019b). People’s actions to reduce food wastage in Singapore in 2019. Available online: www.nea.gov.sg.
- National Environment Agency. (2023). Waste statistics and overall recycling. Nea.gov.sg. Available online: https://www.nea.gov.sg/our-services/waste-management/waste-statistics-and-.
- National Environment Agency. (2024a, December 3). Overview. Www.nea.gov.sg. Available online: https://www.nea.gov.sg/our-services/waste-management/overview.
- National Environment Agency. (2024b). Recycling rate for food waste generated in Singapore from 2014 to 2023. nea.gov.sg.
- National Environment Agency. (2024c). Total volume of food waste generated in Singapore from 2014 to 2023 (in 1,000 metric tons). nea.gov.sg.
- National Environment Agency. (2024d). Total volume of plastic waste generated in Singapore from 2014 to 2023 (in 1,000 metric tons). nea.gov.sg.
- National Environment Agency. (2024e). Total volume of waste paper generated in Singapore from 2013 to 2023 (in 1,000 metric tons). nea.gov.sg.
- National Environment Agency, Today Online, & Ganesan, N. (2024). Singapore’s recycling rate falls to 52% in 2023, decline from 10 years ago. Domestic waste recycling rate in Singapore from 2018 to 2023. Available online: https://www.channelnewsasia.com/singapore/recycling-rate-domestic-waste-st.
- Ocean Conservancy. (2020). International coastal cleanup 2020 report. 18. Most collected types of marine waste in Singapore in 2019. Available online: https://oceanconservancy.org/wp-content/uploads/2020/09/2020-Report_-FIN.
- Oversea-Chinese Banking Corporation Limited. (2021a). The inaugural OCBC climate index. 20. Frequency of using reusable bags when shopping in Singapore as of June 2021. Available online: https://www.ocbc.com/iwov-resources/sg/ocbc/gbc/pdf/sustainability/climate-in.
- Oversea-Chinese Banking Corporation Limited. (2021b). The inaugural OCBC climate index. 19. Frequency of recycling household waste in Singapore as of June 2021. Available online: https://www.ocbc.com/iwov-resources/sg/ocbc/gbc/pdf/sustainability/climate-in.
- Singapore Airlines. (2024). Singapore Airlines sustainability report FY 2023/24. 166. Waste generation of Singapore Airlines from fiscal year 2018 to 2024 (in metric tons). Available online: https://www.singaporeair.com/content/dam/sia/web-assets/pdfs/about-us/sust.
- Singapore Department of Statistics. (2025). Waste Management And Overall Recycling Rates, Annual | SINGSTAT. Data.gov.sg. Available online: https://data.gov.sg/datasets/d_daf568968ab40dc81e7b08887a83c8fa/view?d.
- Singapore Department of Statistics, & National Environment Agency. (2024a). Volume of waste disposed in Singapore from 2014 to 2023, by source (in million metric tons). tablebuilder.singstat.gov.sg.
- Singapore Department of Statistics, & National Environment Agency. (2024b). Volume of waste recycled in Singapore from 2014 to 2023 (in million metric tons). tablebuilder.singstat.gov.sg.
- The Straits Times. (2024, July 29). Singapore Airlines recycled more in-flight waste than earlier reported. The Straits Times. Available online: https://www.straitstimes.com/business/singapore-airlines-recycled-more-in-flig.
- UN Comtrade. (2019a). Total volume of plastic waste imported into Singapore from 2010 to 2017 (in metric tons). comtrade.un.org.
- UN Comtrade. (2019b). Volume of plastic waste imported from Germany into Singapore from 2010 to 2017 (in metric tons). comtrade.un.org.
- UNDP. (2018). Zero Waste Offer | United Nations Development Programme. UNDP. Available online: https://www.undp.org/chemicals-waste/our-work/zero-waste-offer.
- United Nations. (2023). Goal 12 | Ensure sustainable consumption and production patterns. United Nations. Available online: https://sdgs.un.org/goals/goal12.
- Sama, N. U., Zen, K., Jhanjhi, N. Z., & Humayun, M. (2024). Computational Intelligence Ethical Issues in Health Care. In Computational Intelligence in Healthcare Informatics (pp. 349-362). Singapore: Springer Nature Singapore.
- Yan, O. J.; Ashraf, H.; Ihsan, U.; Jhanjhi, N.; Ray, S. K. Facial expression recognition (FER) system using deep learning. 2024 IEEE 1st Karachi Section Humanitarian Technology Conference (KHI-HTC), 2024, January; IEEE; pp. 1–11. [Google Scholar]
- Tayyab, M.; Hameed, K.; Jhanjhi, N. Z.; Zaheer, A.; Qamar, F. Digital safeguards: Navigating cyber threats in the logistics industry framework. In Navigating cyber threats and cybersecurity in the logistics industry; IGI Global Scientific Publishing, 2024; pp. 258–299. [Google Scholar]
- Khandelwal, M.; Rout, R. K.; Umer, S.; Sahoo, K. S.; Jhanjhi, N. Z.; Shorfuzzaman, M.; Masud, M. A Pattern Classification Model for Vowel Data Using Fuzzy Nearest Neighbor. Intelligent Automation & Soft Computing 2023, 35(3). [Google Scholar]
- Pandian, M. T.; Chouhan, K.; Kumar, B. M.; Dash, J. K.; Jhanjhi, N. Z.; Ibrahim, A. O.; Abulfaraj, A. W. RETRACTED: Improving Efficiency of Large RFID Networks Using a Clustered Method: A Comparative Analysis. Electronics 2022, 11(18), 2968. [Google Scholar] [CrossRef]
- Humayun, M., Sujatha, R., Almuayqil, S. N., & Jhanjhi, N. Z. (2022, June). A transfer learning approach with a convolutional neural network for the classification of lung carcinoma. In Healthcare (Vol. 10, No. 6, p. 1058). MDPI.
- Srinivasan, K.; Garg, L.; Alaboudi, A. A.; Jhanjhi, N. Z.; Prabadevi, B.; Deepa, N. Expert System for Stable Power Generation Prediction in Microbial Fuel Cell. Intelligent Automation & Soft Computing 2021, 30(1). [Google Scholar]
- Saeed, S.; Jhanjhi, N. Z.; Abdullah, A.; Naqvi, M. Current Trends and Issues Legacy Application of the Serverless Architecture. International Journal of Computing Network Technology 2018, 6(3). [Google Scholar] [CrossRef]
- Javed, D.; Jhanjhi, N. Z.; Ashfaq, F.; Khan, N. A.; Das, S. R.; Singh, S. Student Performance Analysis to Identify the Students at Risk of Failure. 2024 International Conference on Emerging Trends in Networks and Computer Communications (ETNCC), 2024, July; IEEE; pp. 1–6. [Google Scholar]
- Jhanjhi, N. Z.; Gaur, L.; Khan, N. A. Global Navigation Satellite Systems for Logistics: Cybersecurity Issues and Challenges. In Cybersecurity in the Transportation Industry; 2024; pp. 49–67. [Google Scholar]
- Convergence of Industry 4.0 and supply chain sustainability; Khan, M. R., Khan, N. R., Jhanjhi, N. Z., Eds.; IGI Global, 2024. [Google Scholar]
- Ashraf, H.; Jhanjhi, N. Z.; Brohi, S. N.; Muzafar, S. A Comprehensive Exploration of DDoS Attacks and Cybersecurity Imperatives in the Digital Age. In Navigating Cyber Threats and Cybersecurity in the Logistics Industry; IGI Global Scientific Publishing, 2024; pp. 236–257. [Google Scholar]
- Qasim, M.; Mahmood, D.; Bibi, A.; Masud, M.; Ahmed, G.; Khan, S.; Hussain, S. J. PCA-based advanced local octa-directional pattern (ALODP-PCA): a texture feature descriptor for image retrieval. Electronics 2022, 11(2), 202. [Google Scholar] [CrossRef]
- Manzoor, M. K.; Latif, R. M. A.; Haq, I.; Jhanjhi, N. Z. An energy-efficient routing protocol via angle-based flooding zone in underwater wireless sensor networks. International Journal of Intelligent Systems and Applications in Engineering 2022, 10(2s), 116–123. [Google Scholar]
- Gill, S. H.; Sheikh, N. A.; Rajpar, S.; Jhanjhi, N. Z.; Ahmad, M.; Razzaq, M. A.; Jaafar, F. Extended Forgery Detection Framework for COVID-19 Medical Data Using Convolutional Neural Network. Computers, Materials & Continua 2021, 68(3). [Google Scholar] [CrossRef]
- Zaman, D. N.; Memon, N. A. Pakistan lags behind in Technical Textiles. Journal of Management and Social Sciences 2007, 3(2), 120–127. [Google Scholar]
Figure 1.
Mean Calculation.
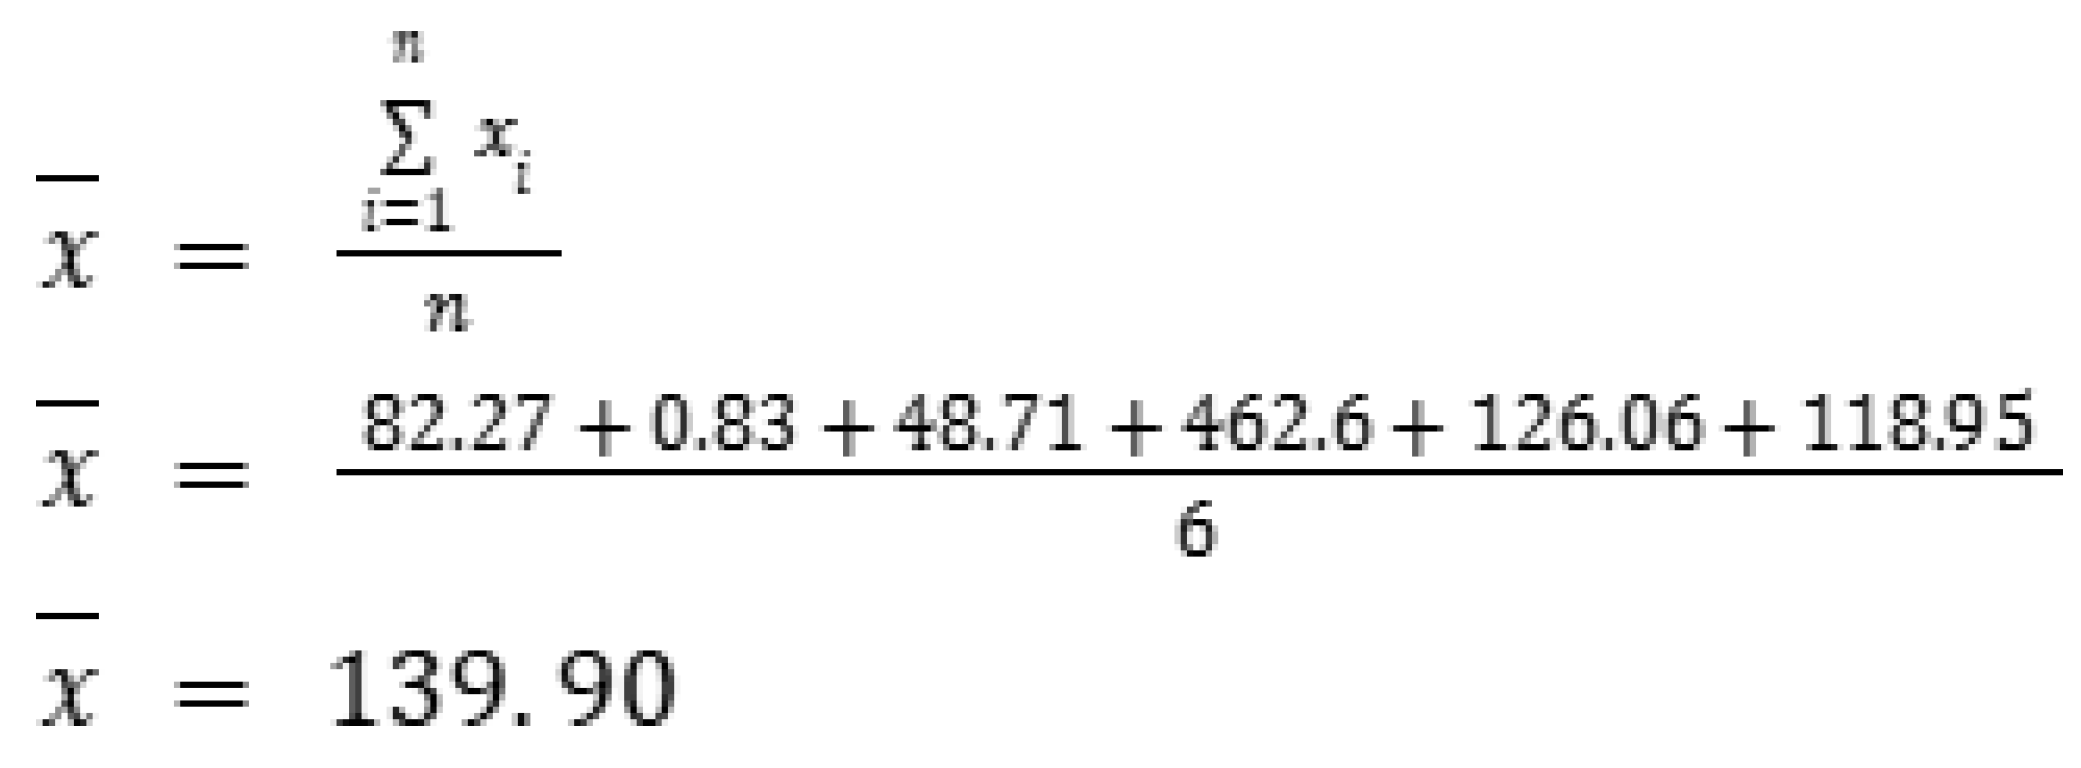
Figure 2.
Sample Overview.
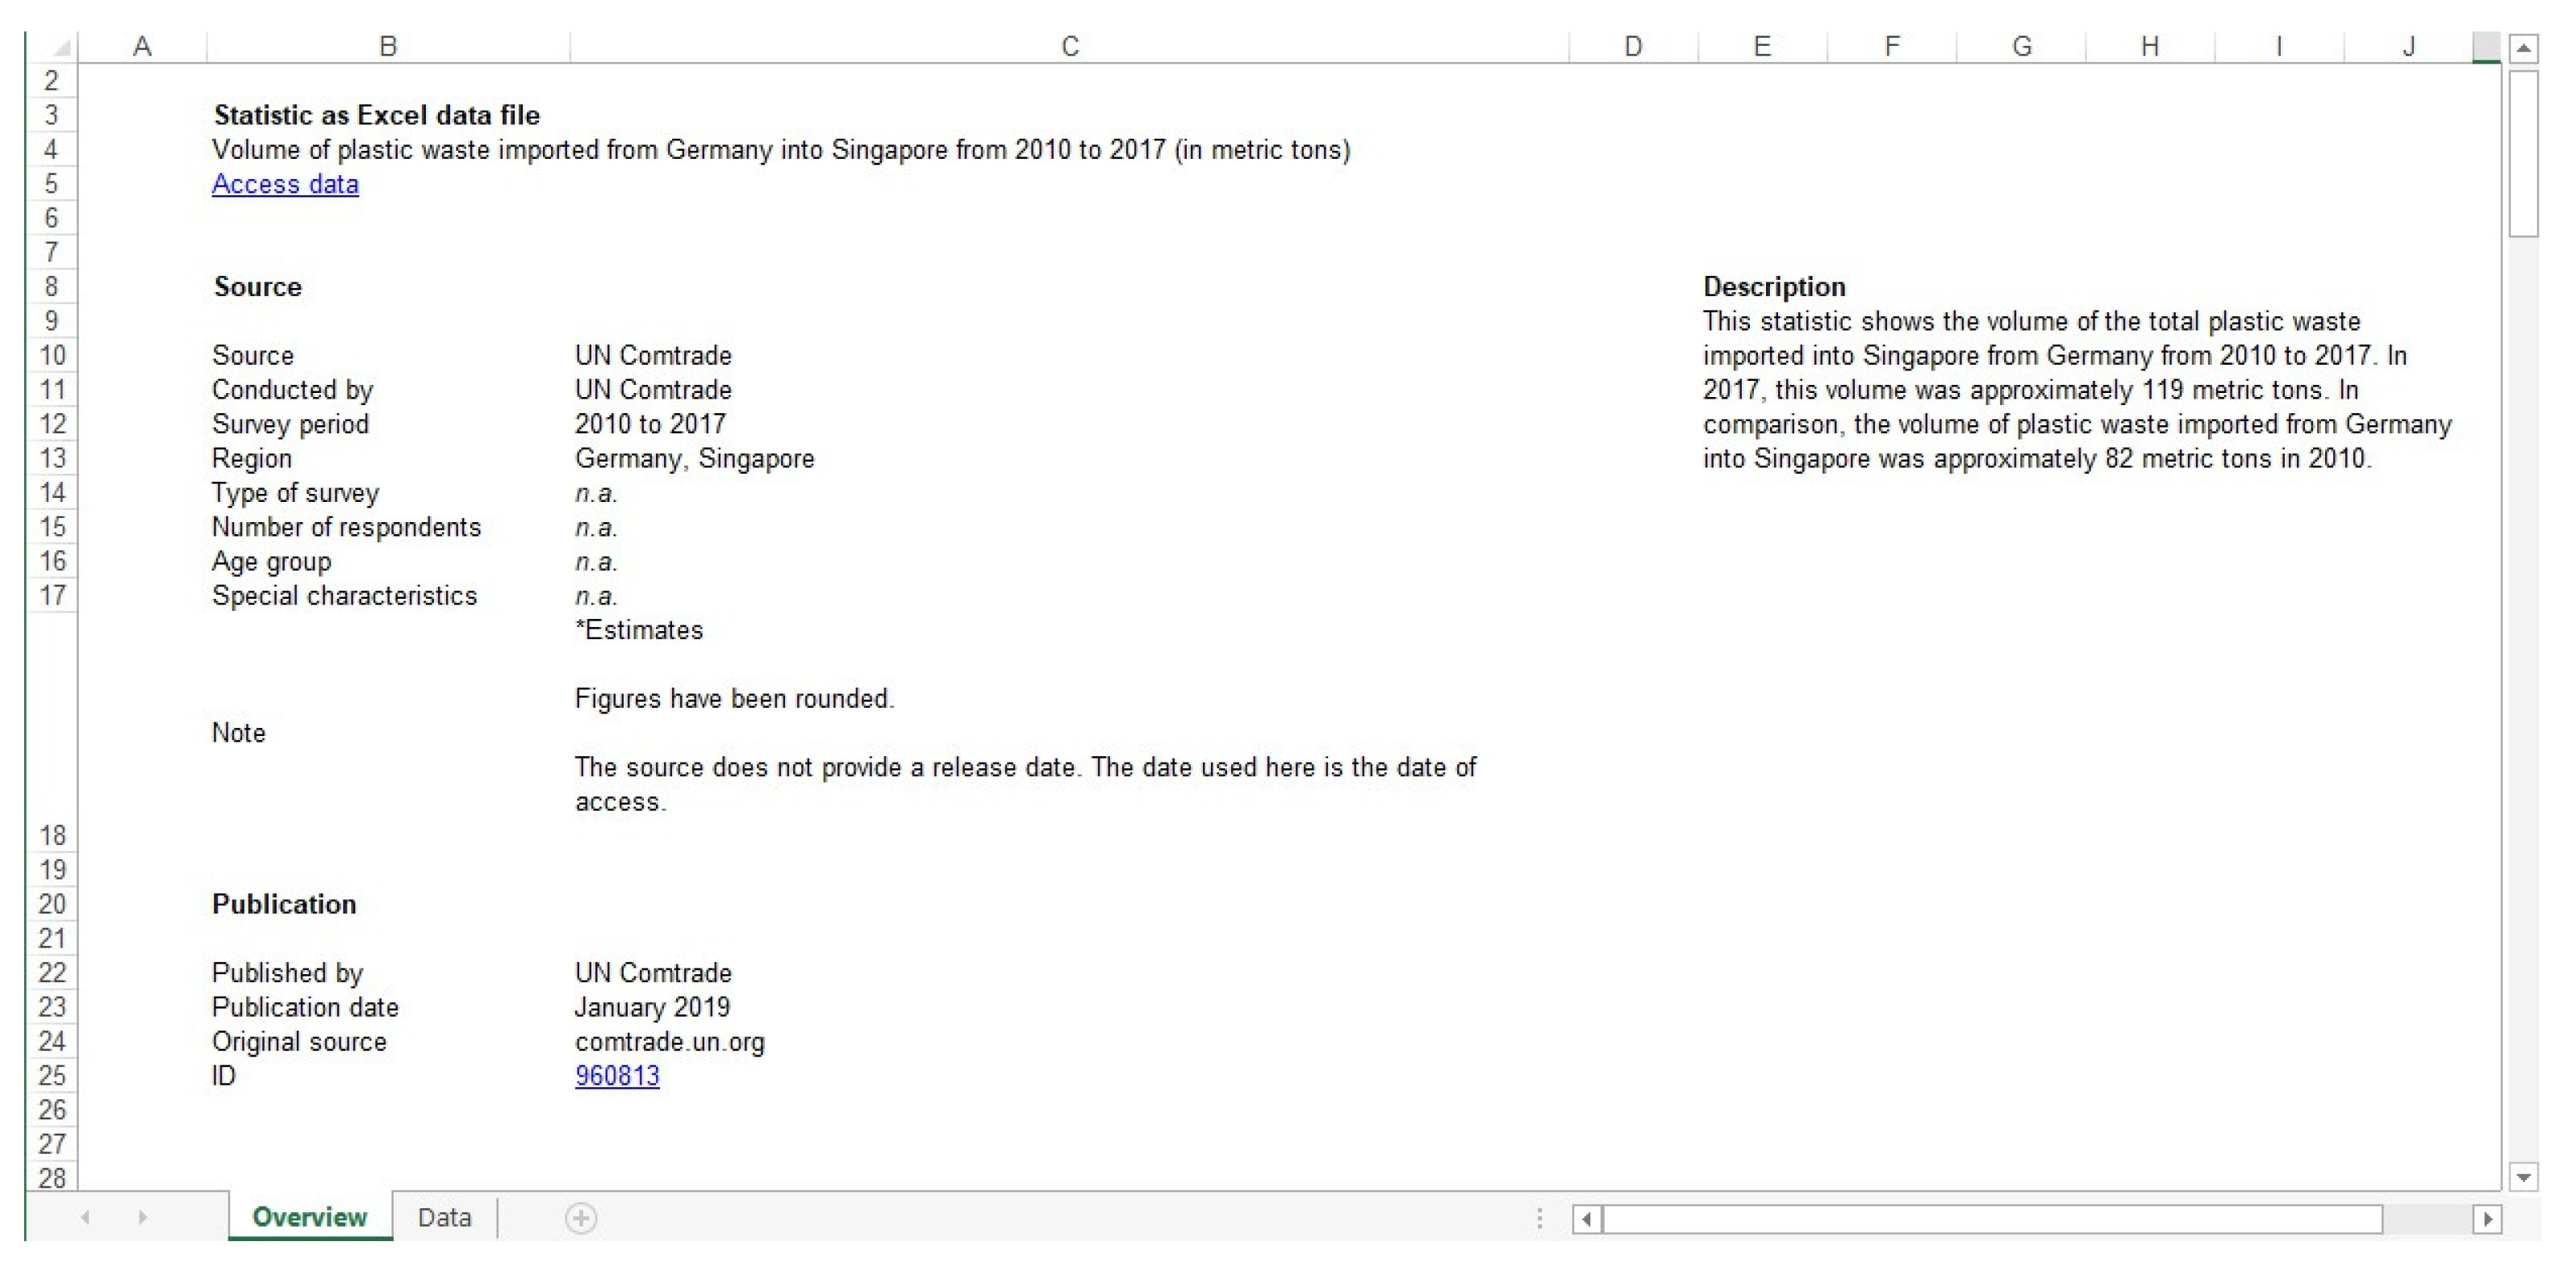
Figure 3.
Format Changes.
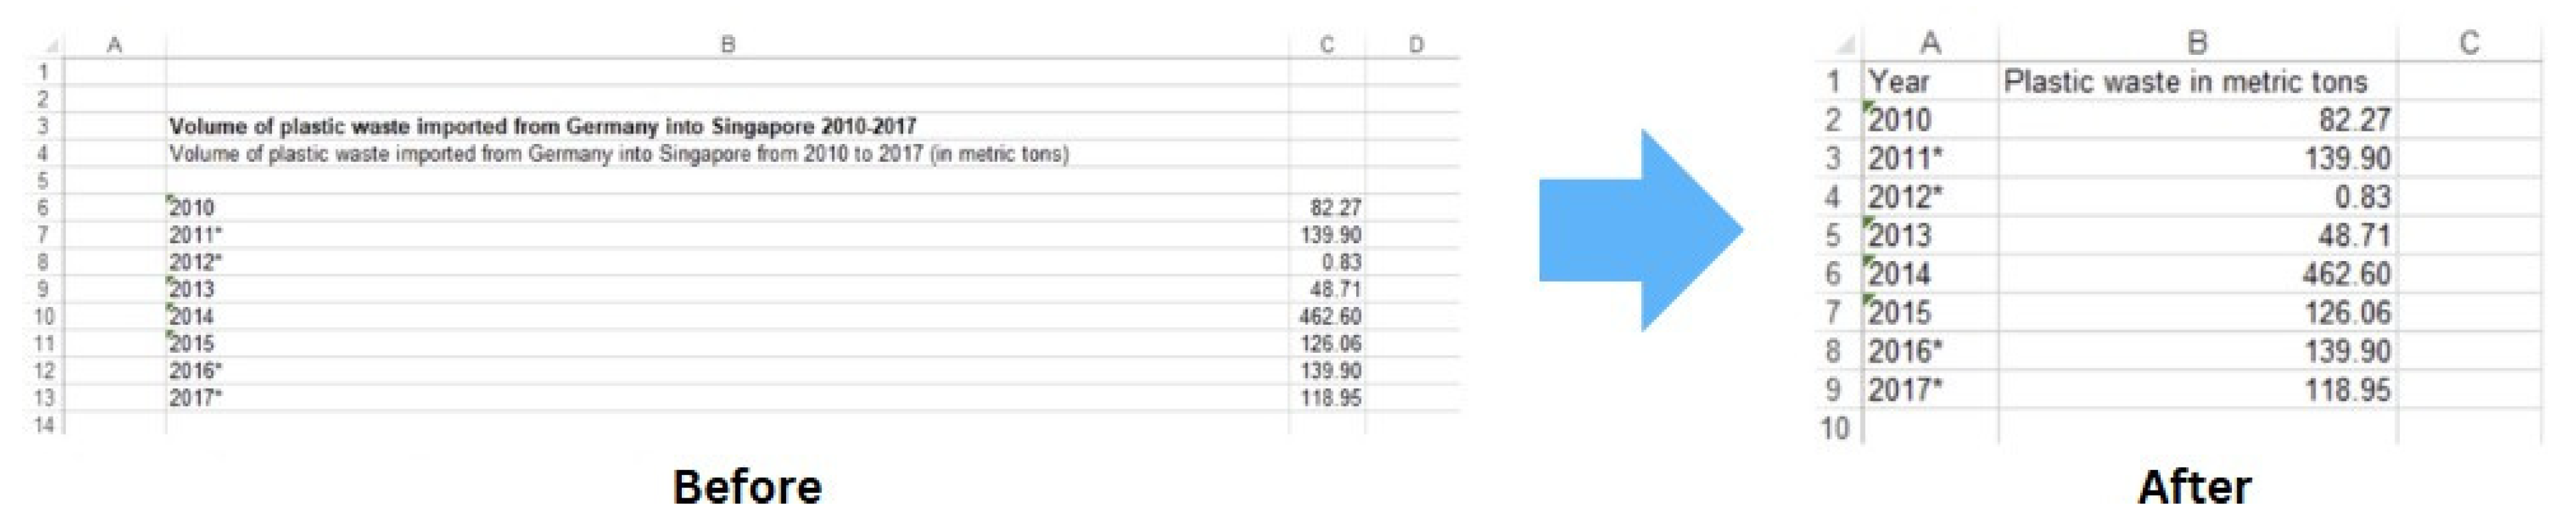
Figure 33.
Actions Taken by People to Reduce Food Wastage in Singapore (2019).
Disclaimer/Publisher’s Note: The statements, opinions and data contained in all publications are solely those of the individual author(s) and contributor(s) and not of MDPI and/or the editor(s). MDPI and/or the editor(s) disclaim responsibility for any injury to people or property resulting from any ideas, methods, instructions or products referred to in the content. |
© 2025 by the authors. Licensee MDPI, Basel, Switzerland. This article is an open access article distributed under the terms and conditions of the Creative Commons Attribution (CC BY) license (http://creativecommons.org/licenses/by/4.0/).
Copyright: This open access article is published under a Creative Commons CC BY 4.0 license, which permit the free download, distribution, and reuse, provided that the author and preprint are cited in any reuse.


