Submitted:
03 December 2025
Posted:
04 December 2025
You are already at the latest version
Abstract
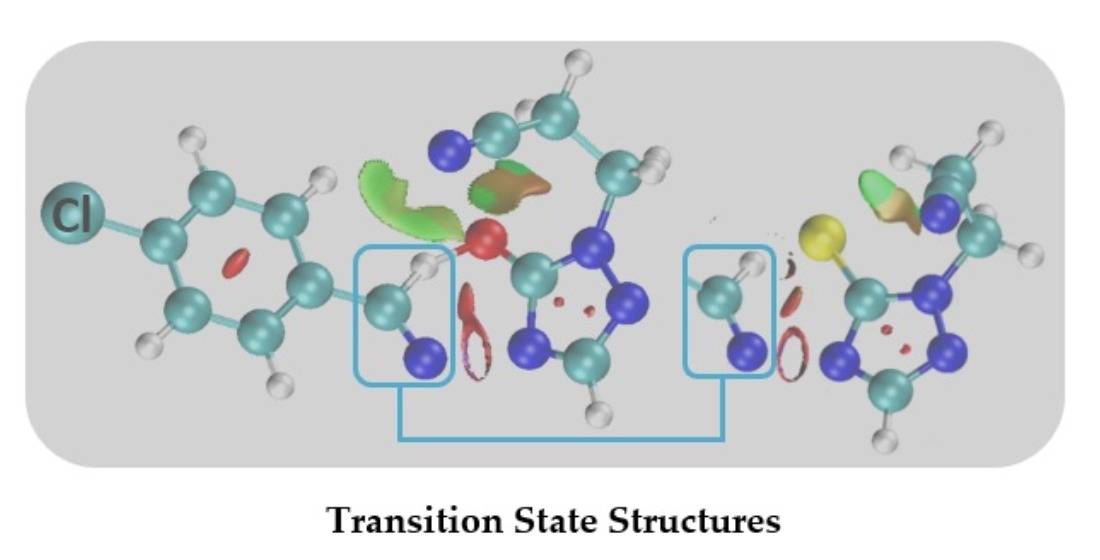
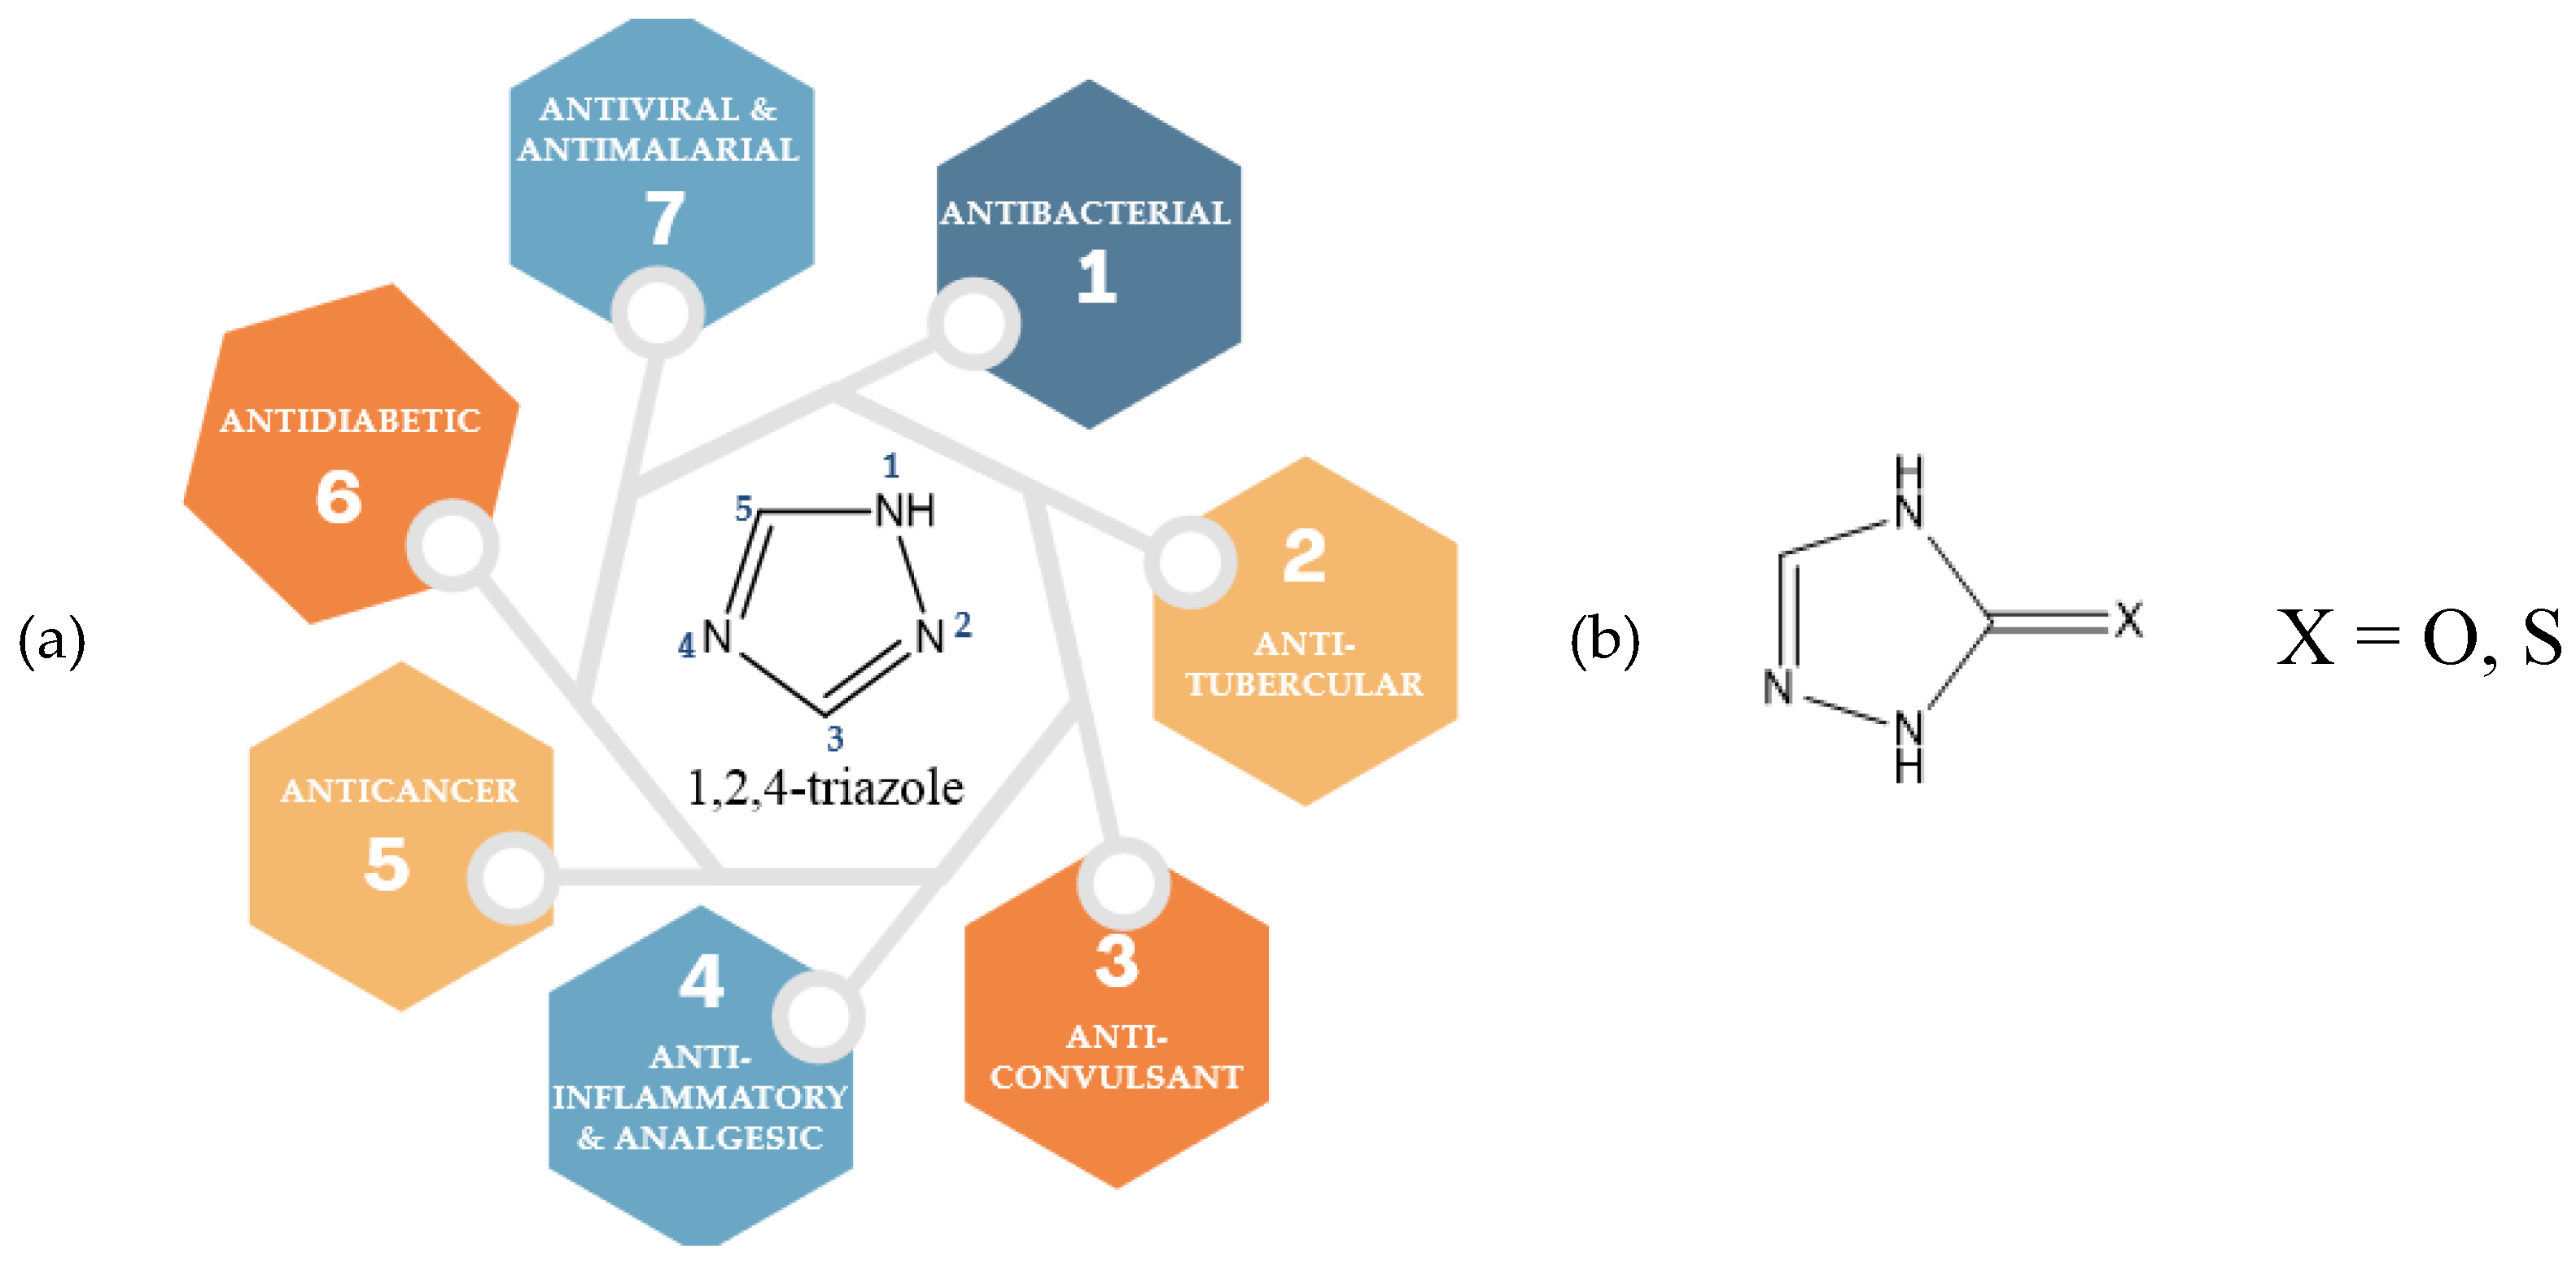
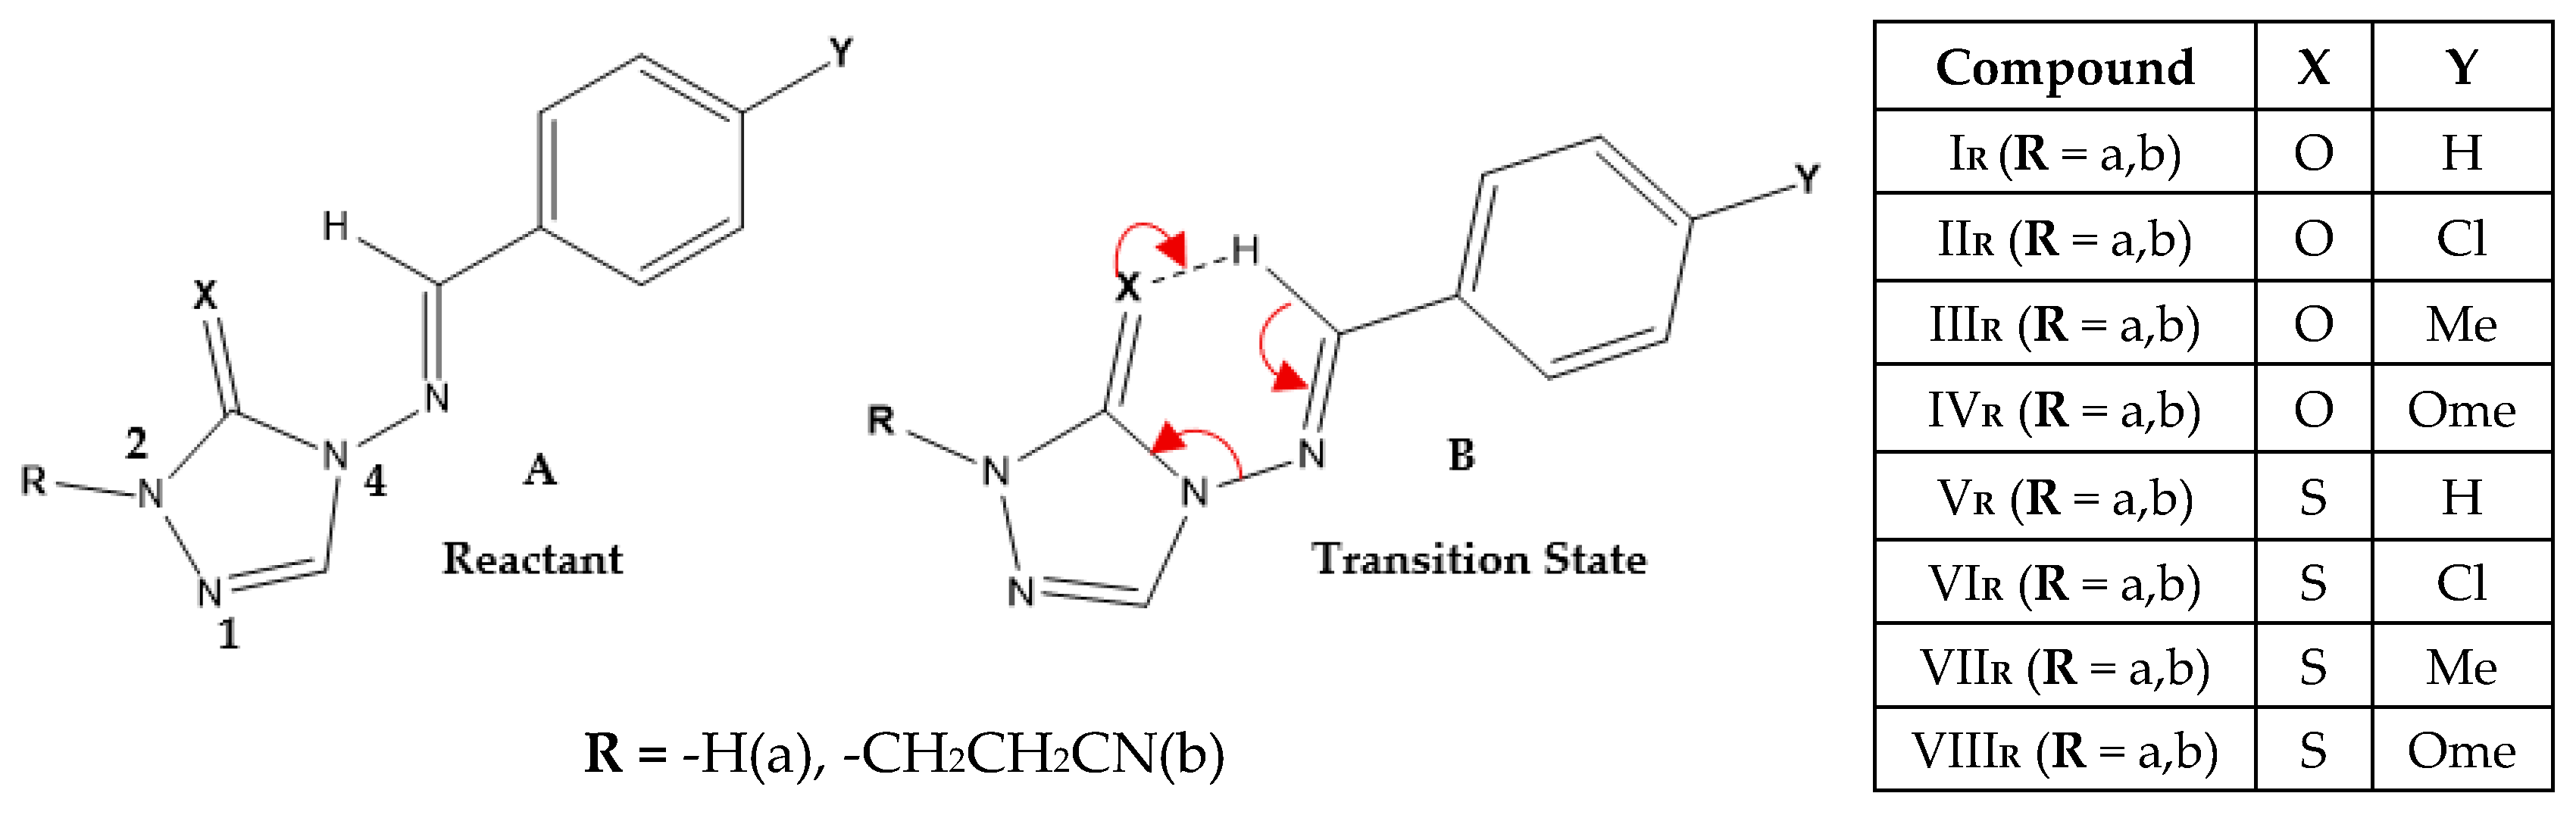
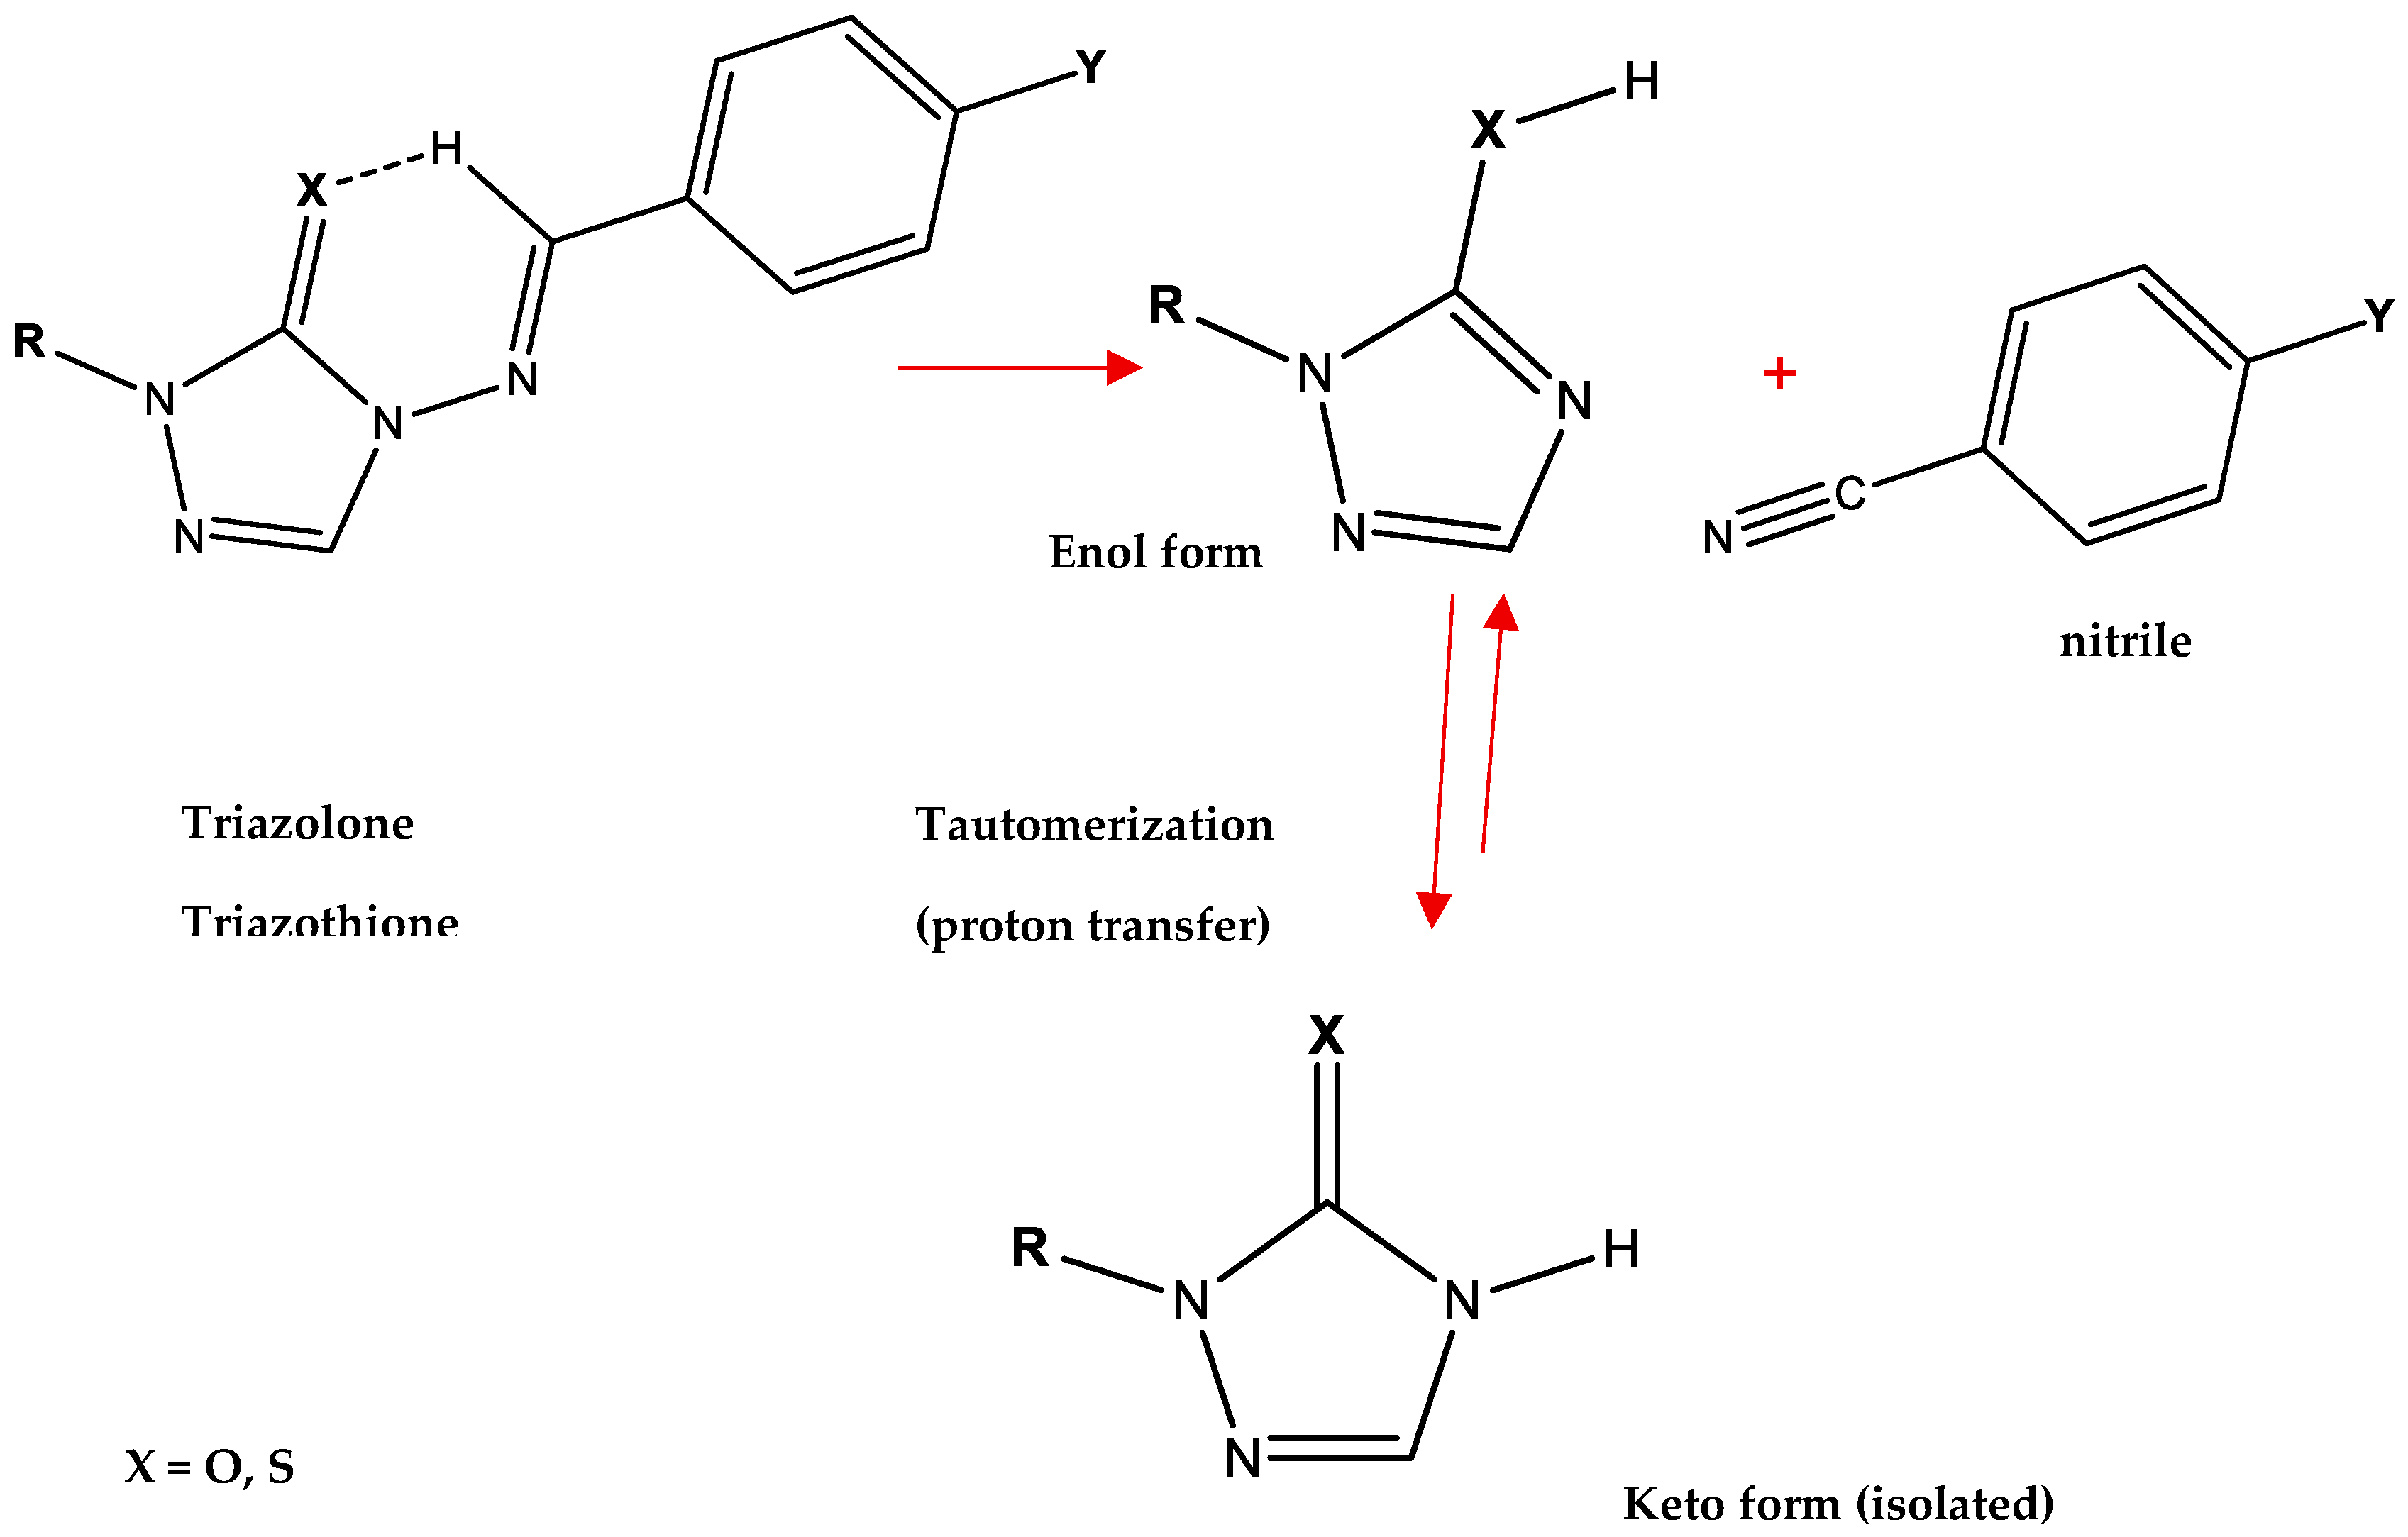
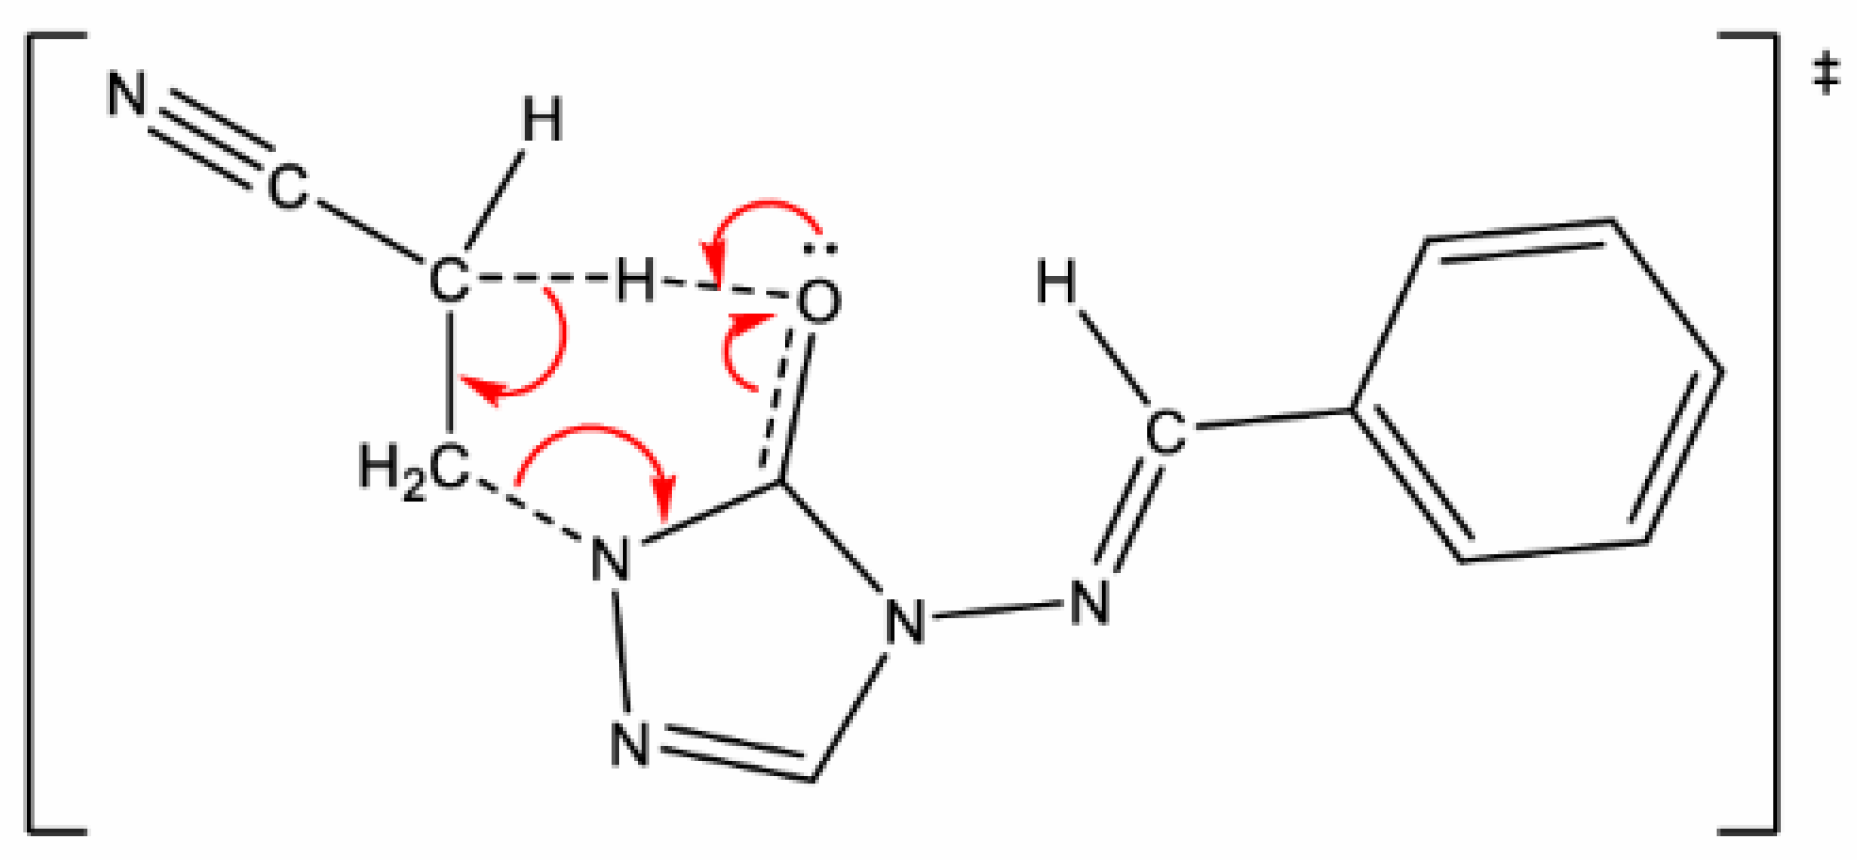
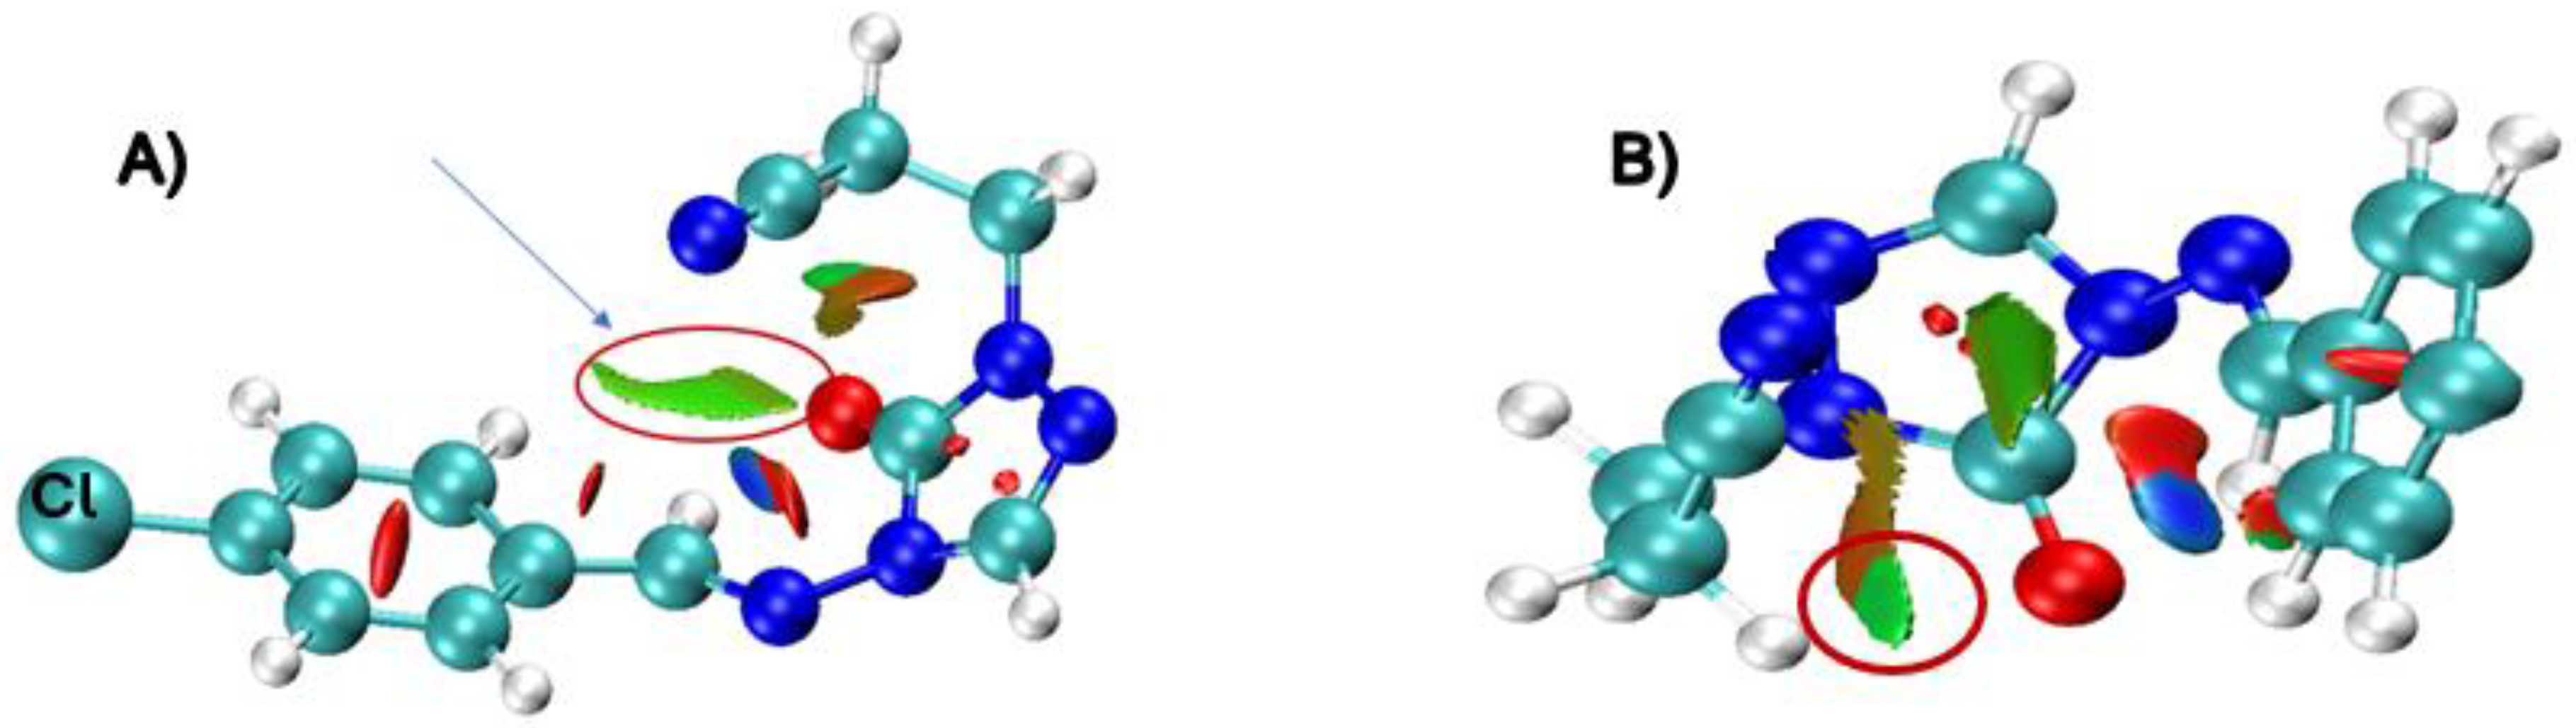
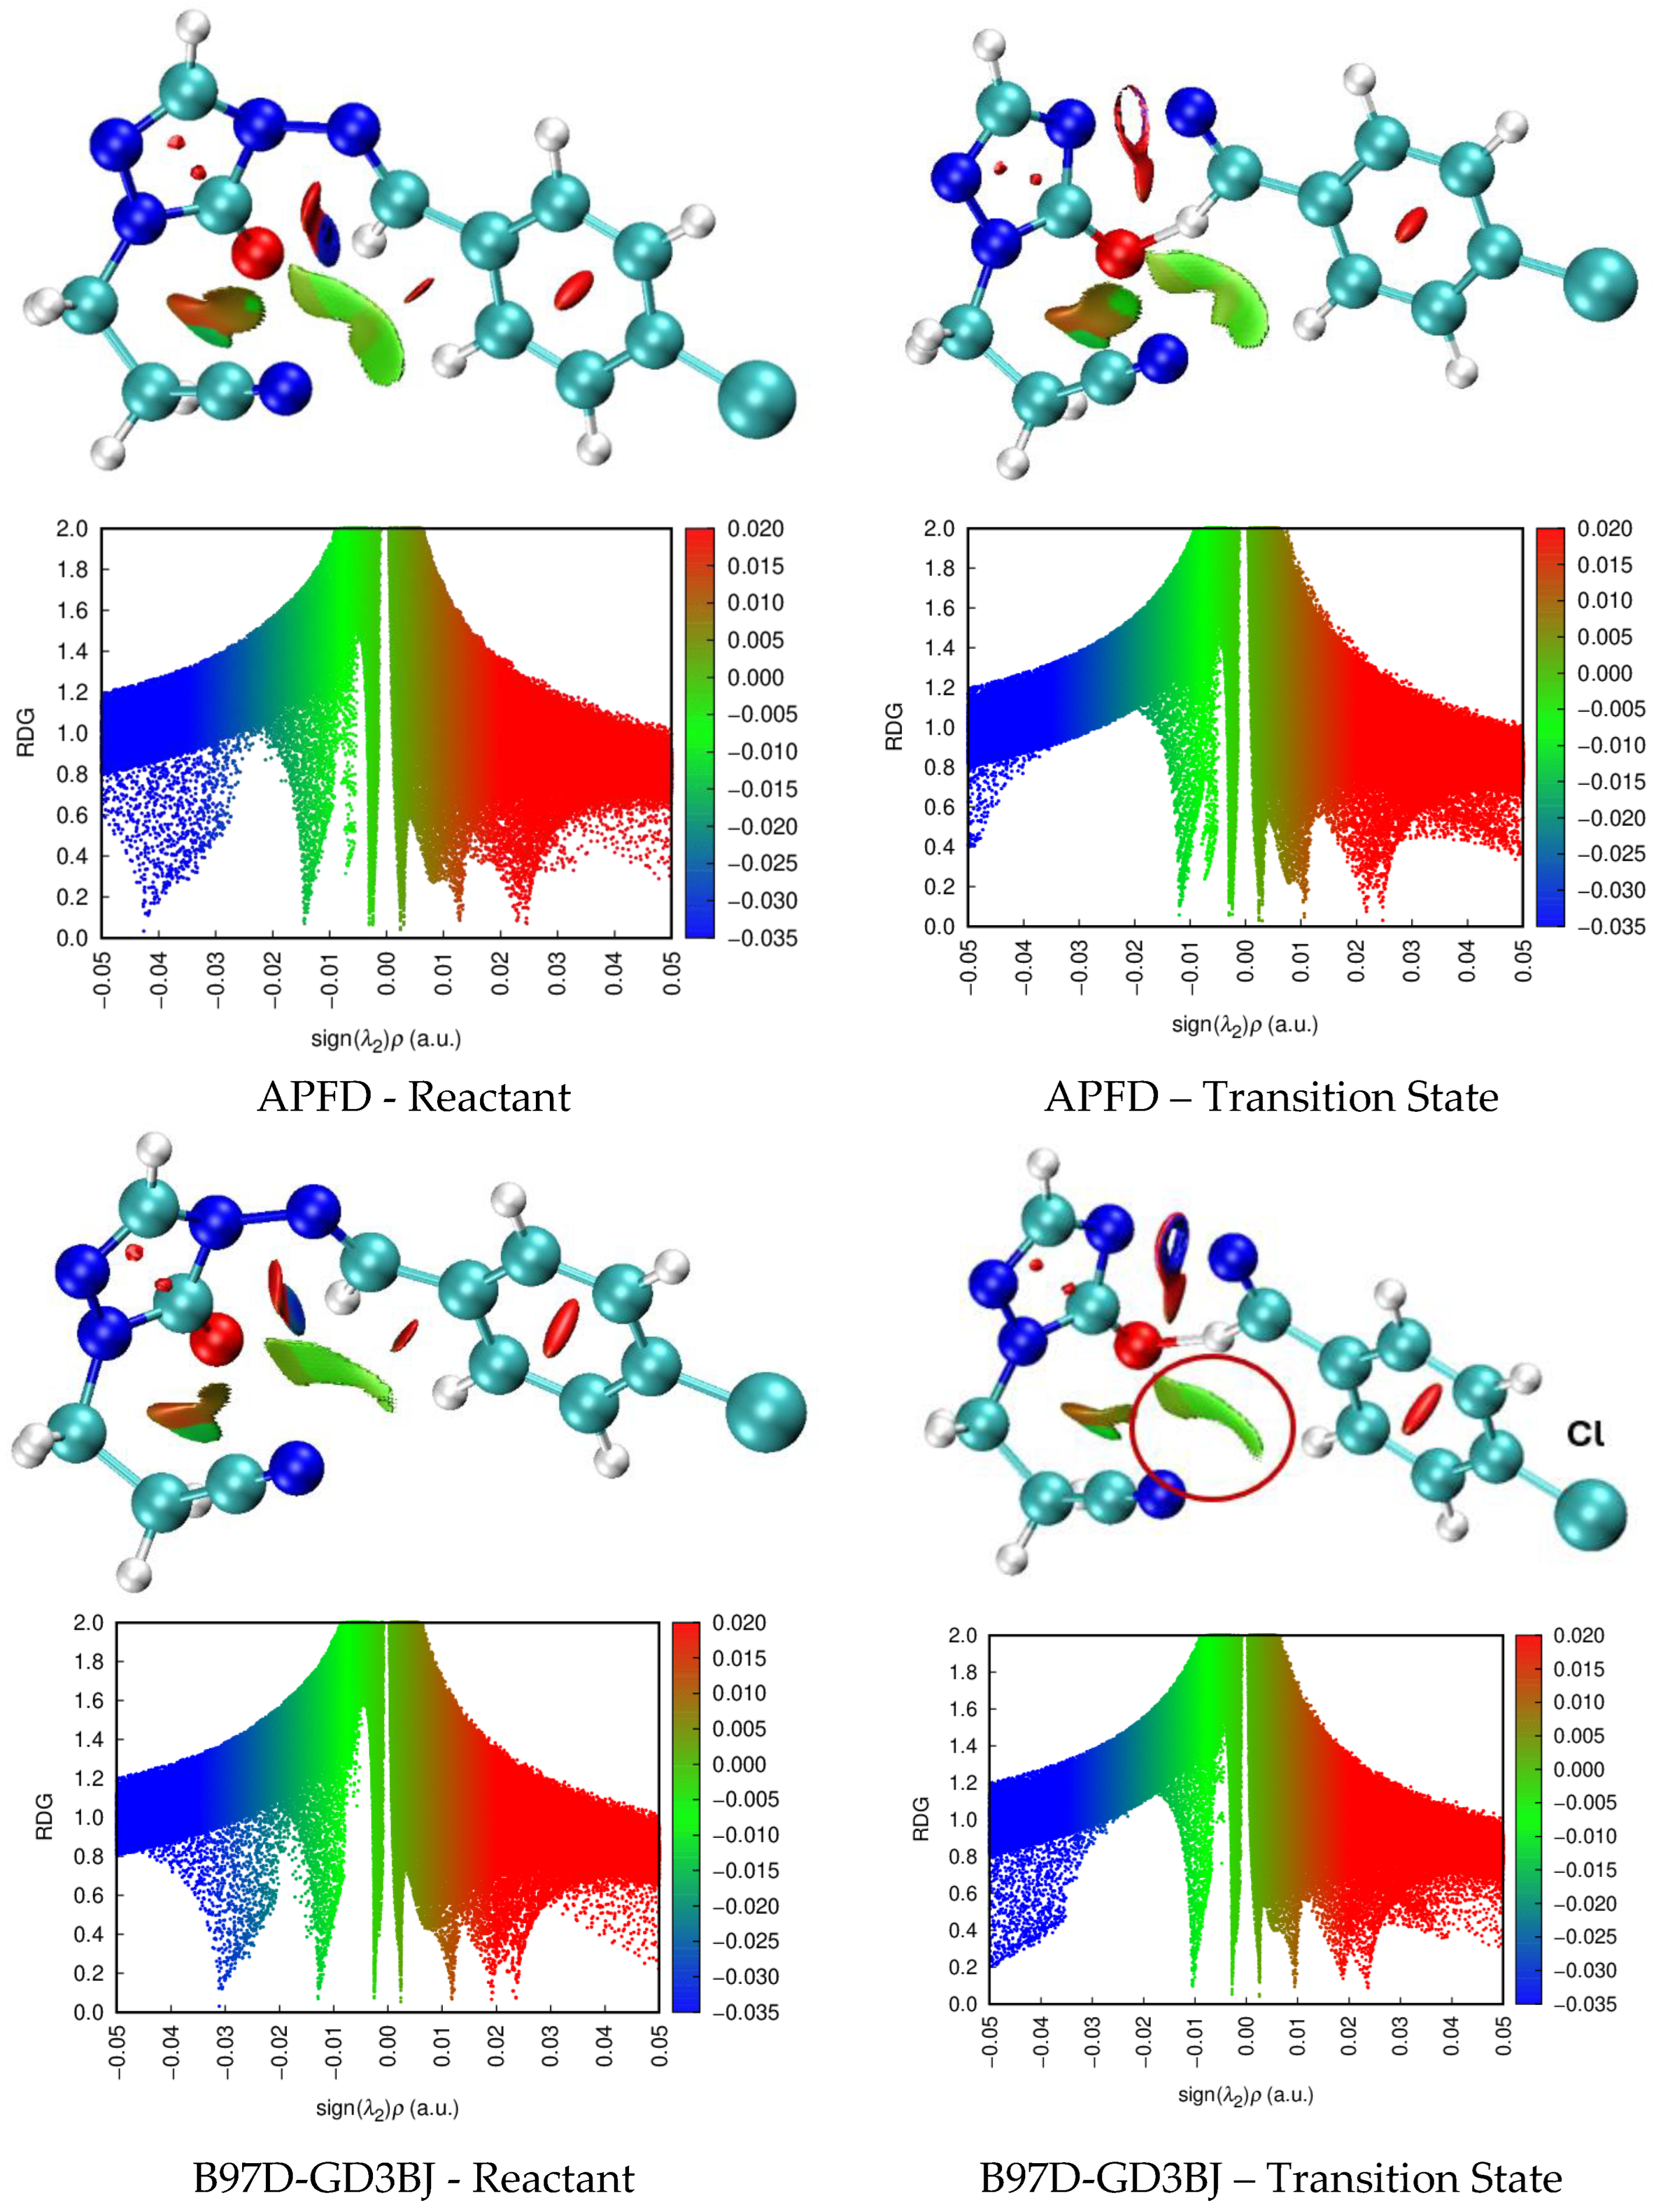
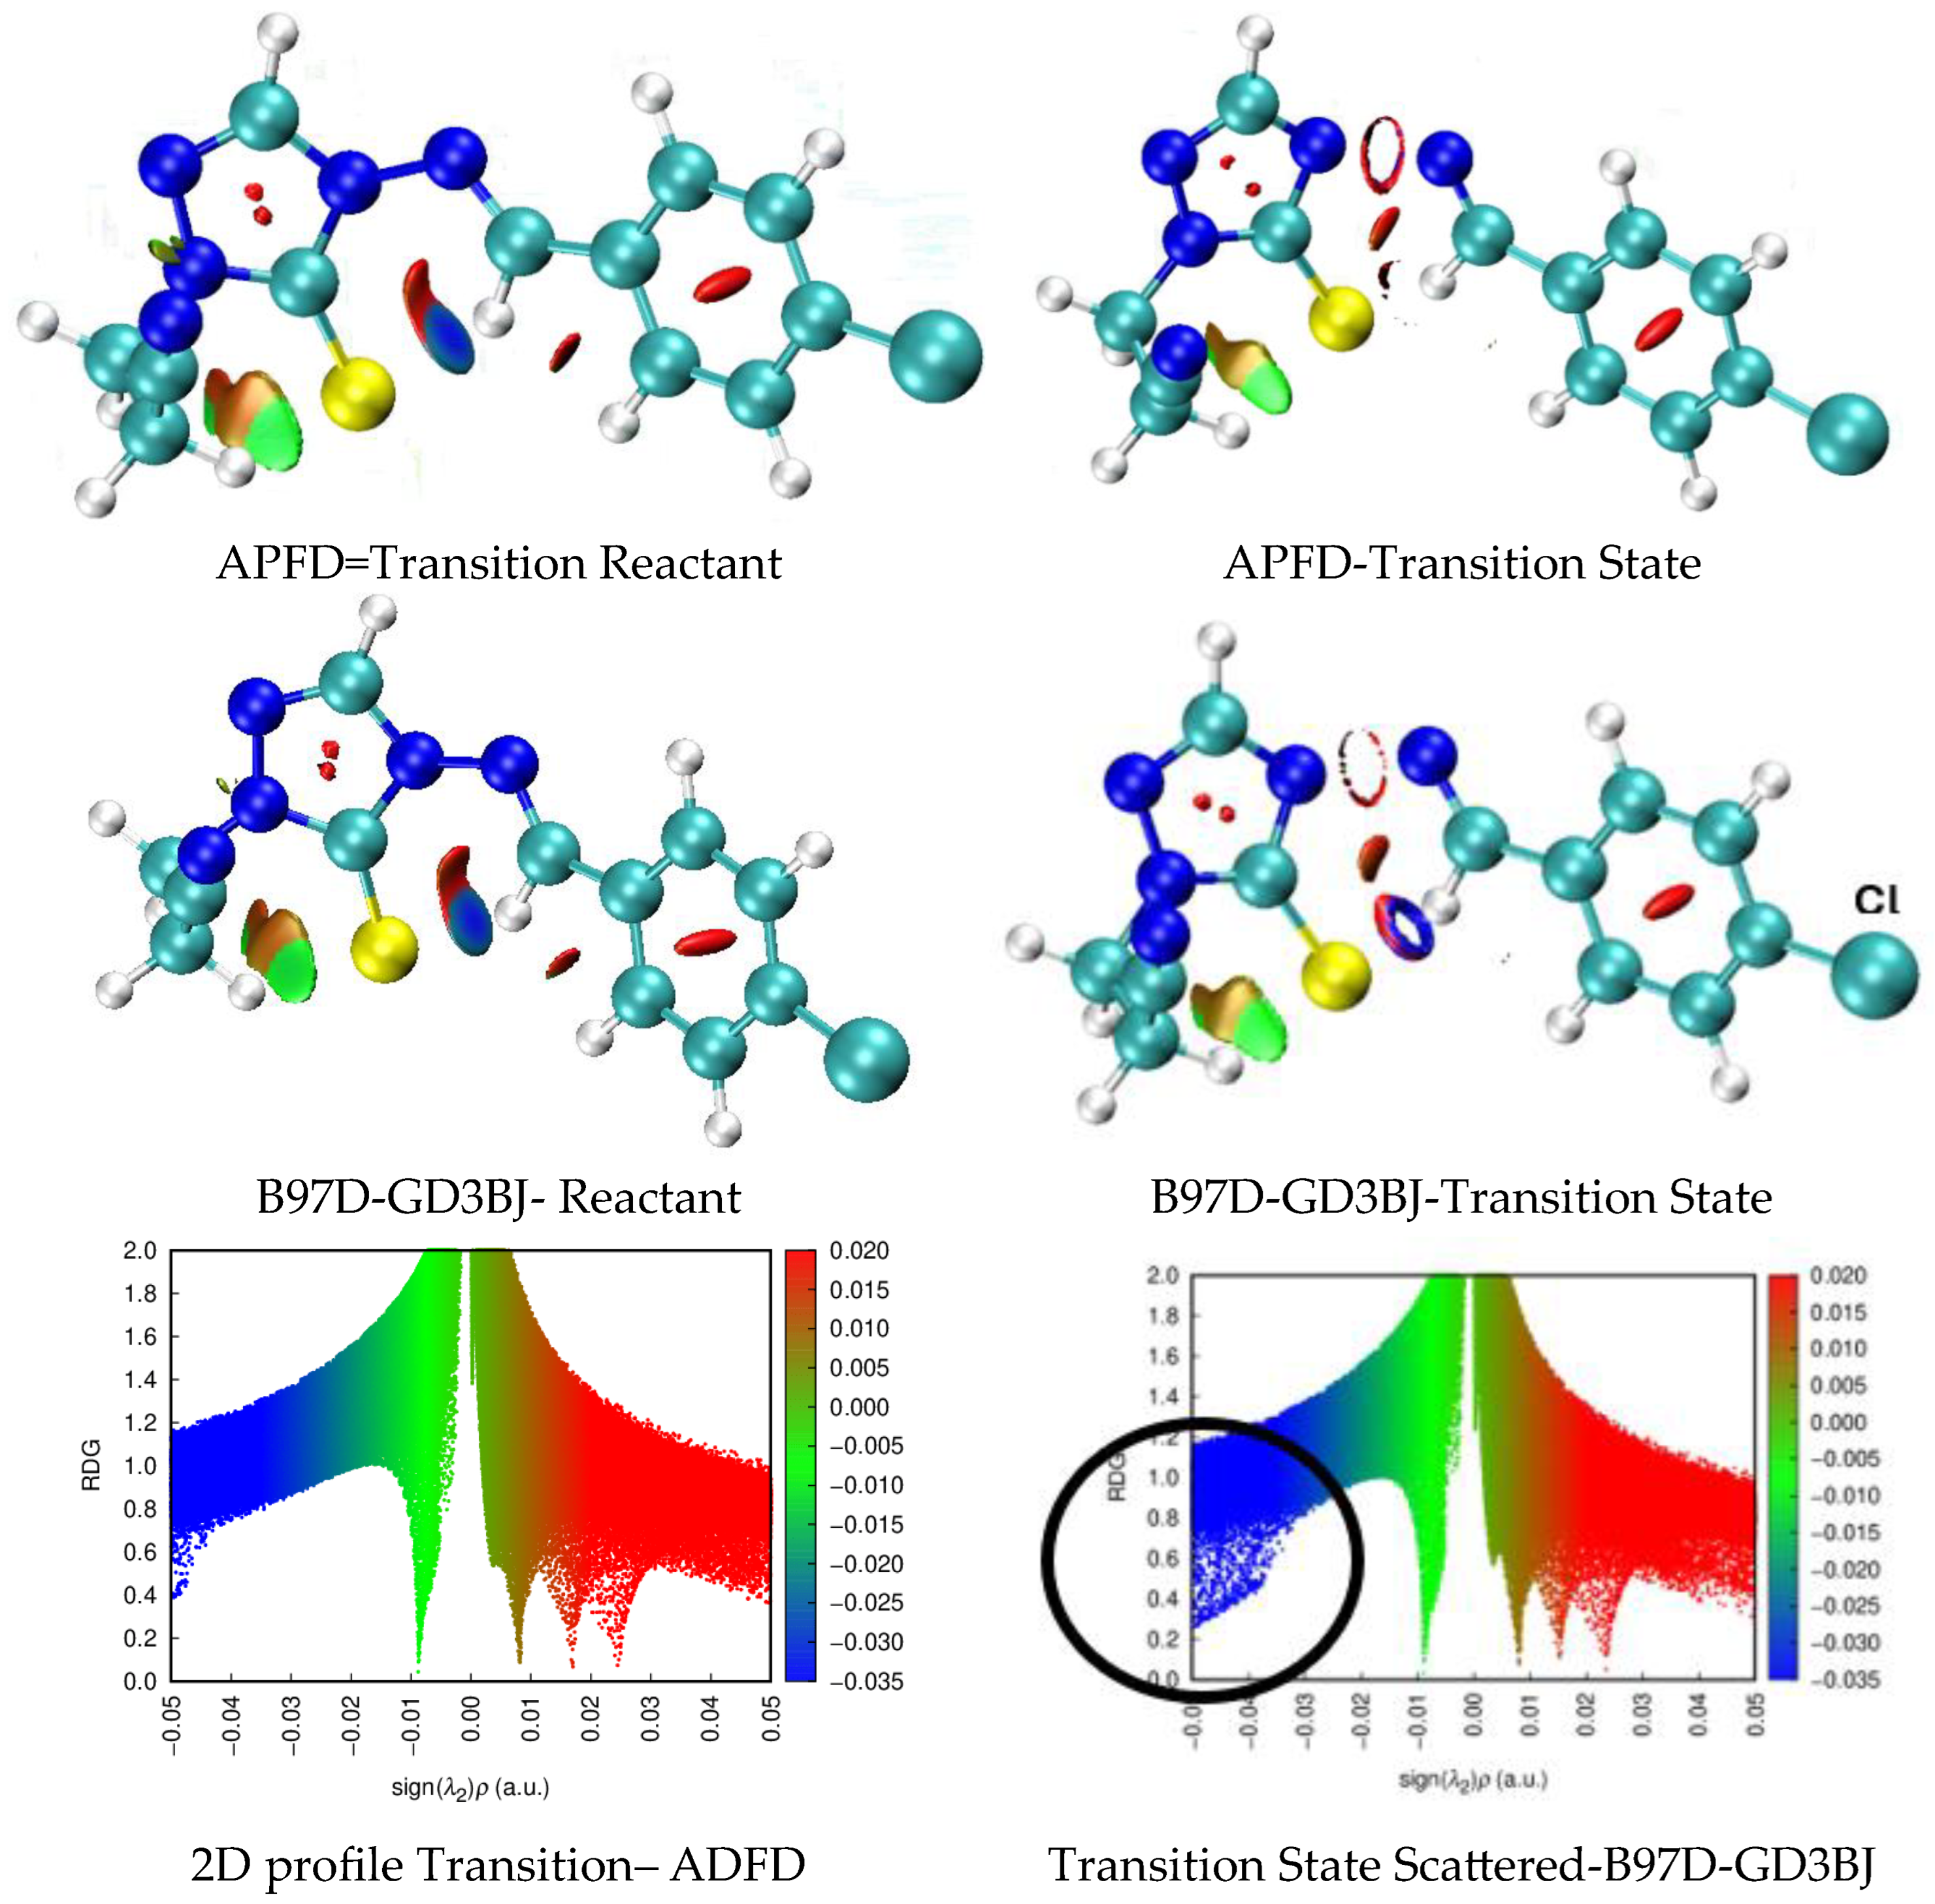
This computational study investigates the thermal decomposition of 1,2,4-triazol-3(2H)-ones and their thione analogues using Density Functional Theory (DFT). The reaction proceeds via a concerted, six-membered cyclic transition state, primarily driven by the breaking of the N–N bond. A key finding is that the accuracy of the calculated activation energies (Ea) strongly depends on the choice of the DFT functional. For sulfur-containing systems (thiones), the hybrid functional APFD (with 25% Hartree-Fock exchange) provides the most reliable results, effectively describing their higher polarizability. In contrast, for oxygen-containing systems (triazolones), the dispersion-corrected functional B97D-GD3BJ (with 0% Hartree-Fock exchange) delivers superior accuracy by better modeling electrostatic and dispersion interactions. The -CH2CH2CN group at the N-2 position acts not only as a protecting group, but also stabilizes the transition state through non-covalent interactions. Electron-withdrawing substituents slightly increase the Ea, while electron-donating groups decrease it. Sulfur analogues consistently show significantly lower activation energies (by ~40 kJ/mol) than their oxygen counterparts, explaining their experimentally observed faster decomposition. This work establishes a dual-methodology computational framework for accurately predicting the kinetics of these reactions, providing valuable insights for the regioselective synthesis of biologically relevant triazole derivatives via controlled pyrolysis.
Keywords:
Introduction
Computational Methods
- 1.
- Thermodynamic Properties and Wiberg Bond Index
- 2.
- IGM Bond Index IBSI
- 3.
- Selection of the Calculation Level
Results and Discussion
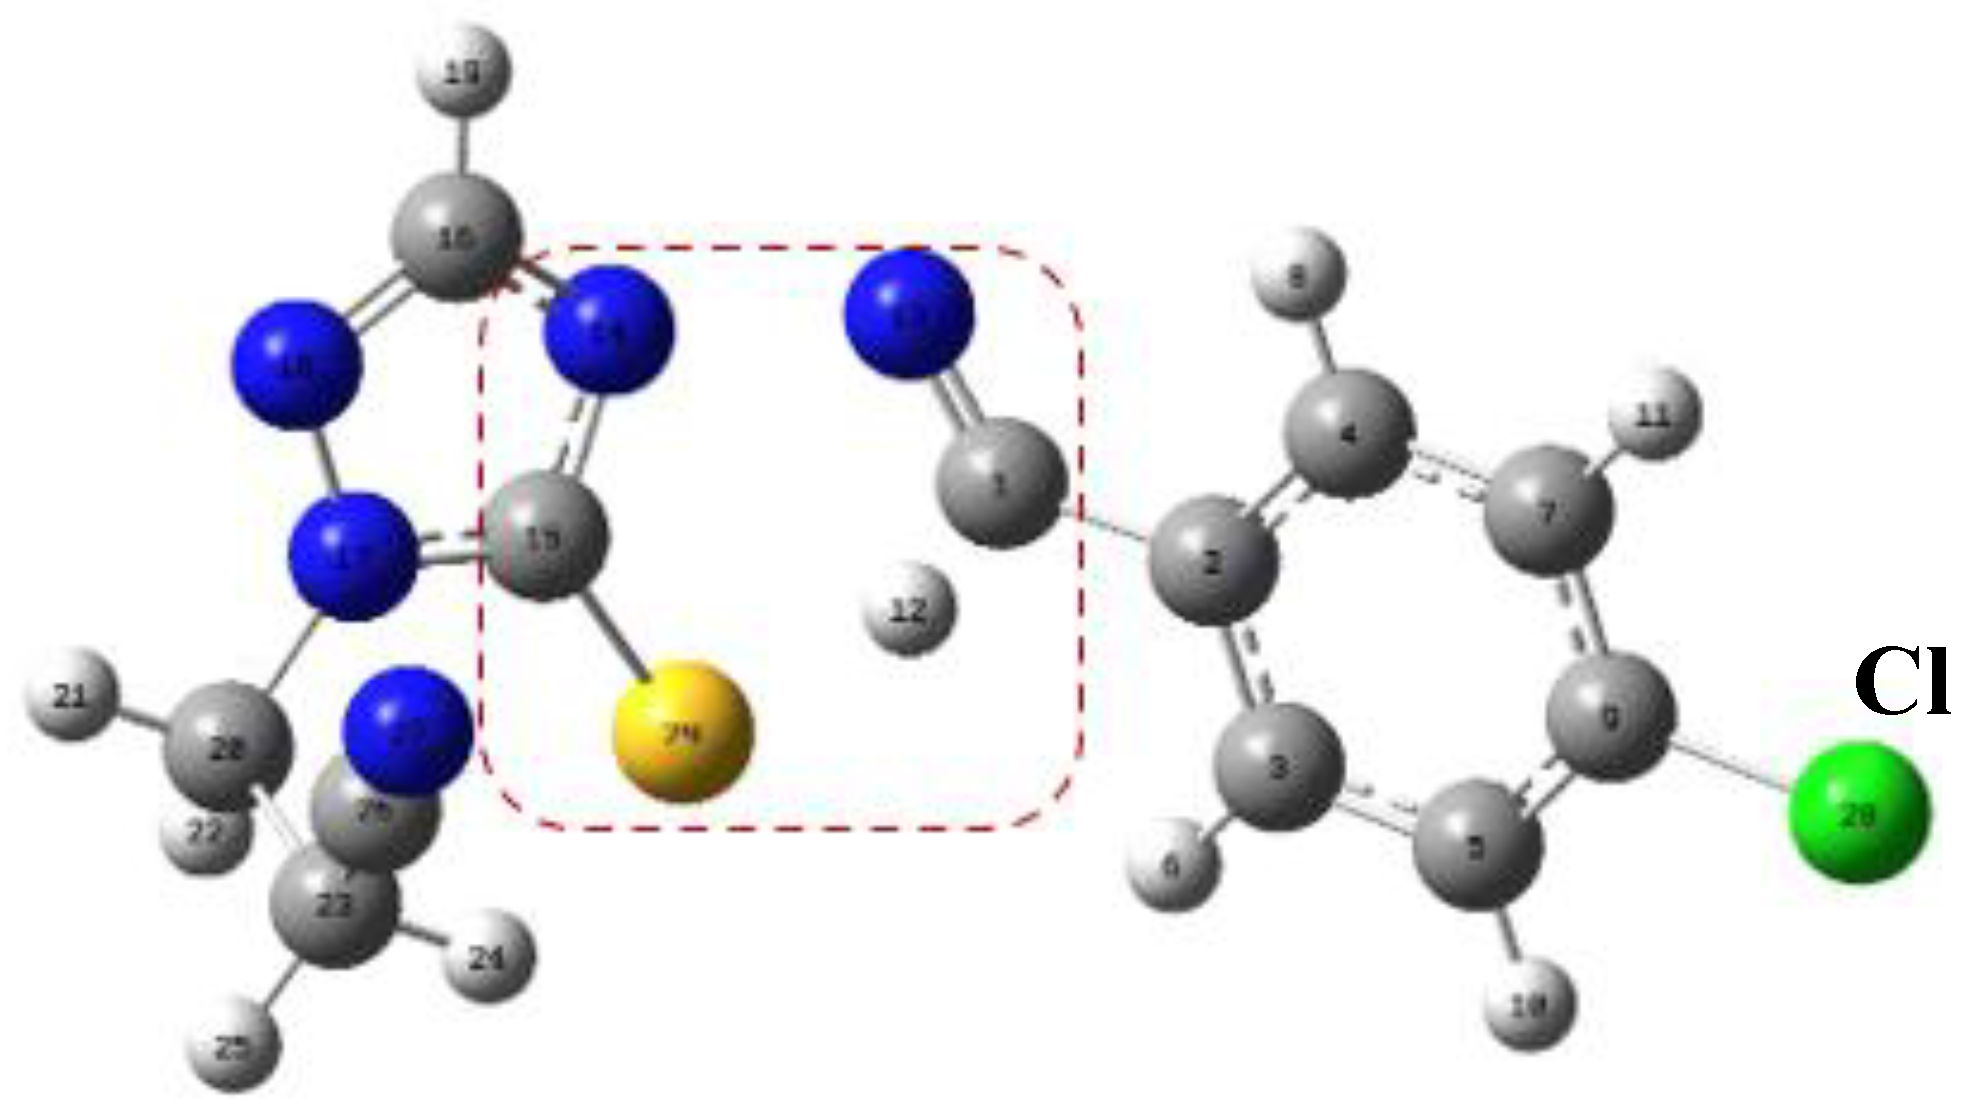
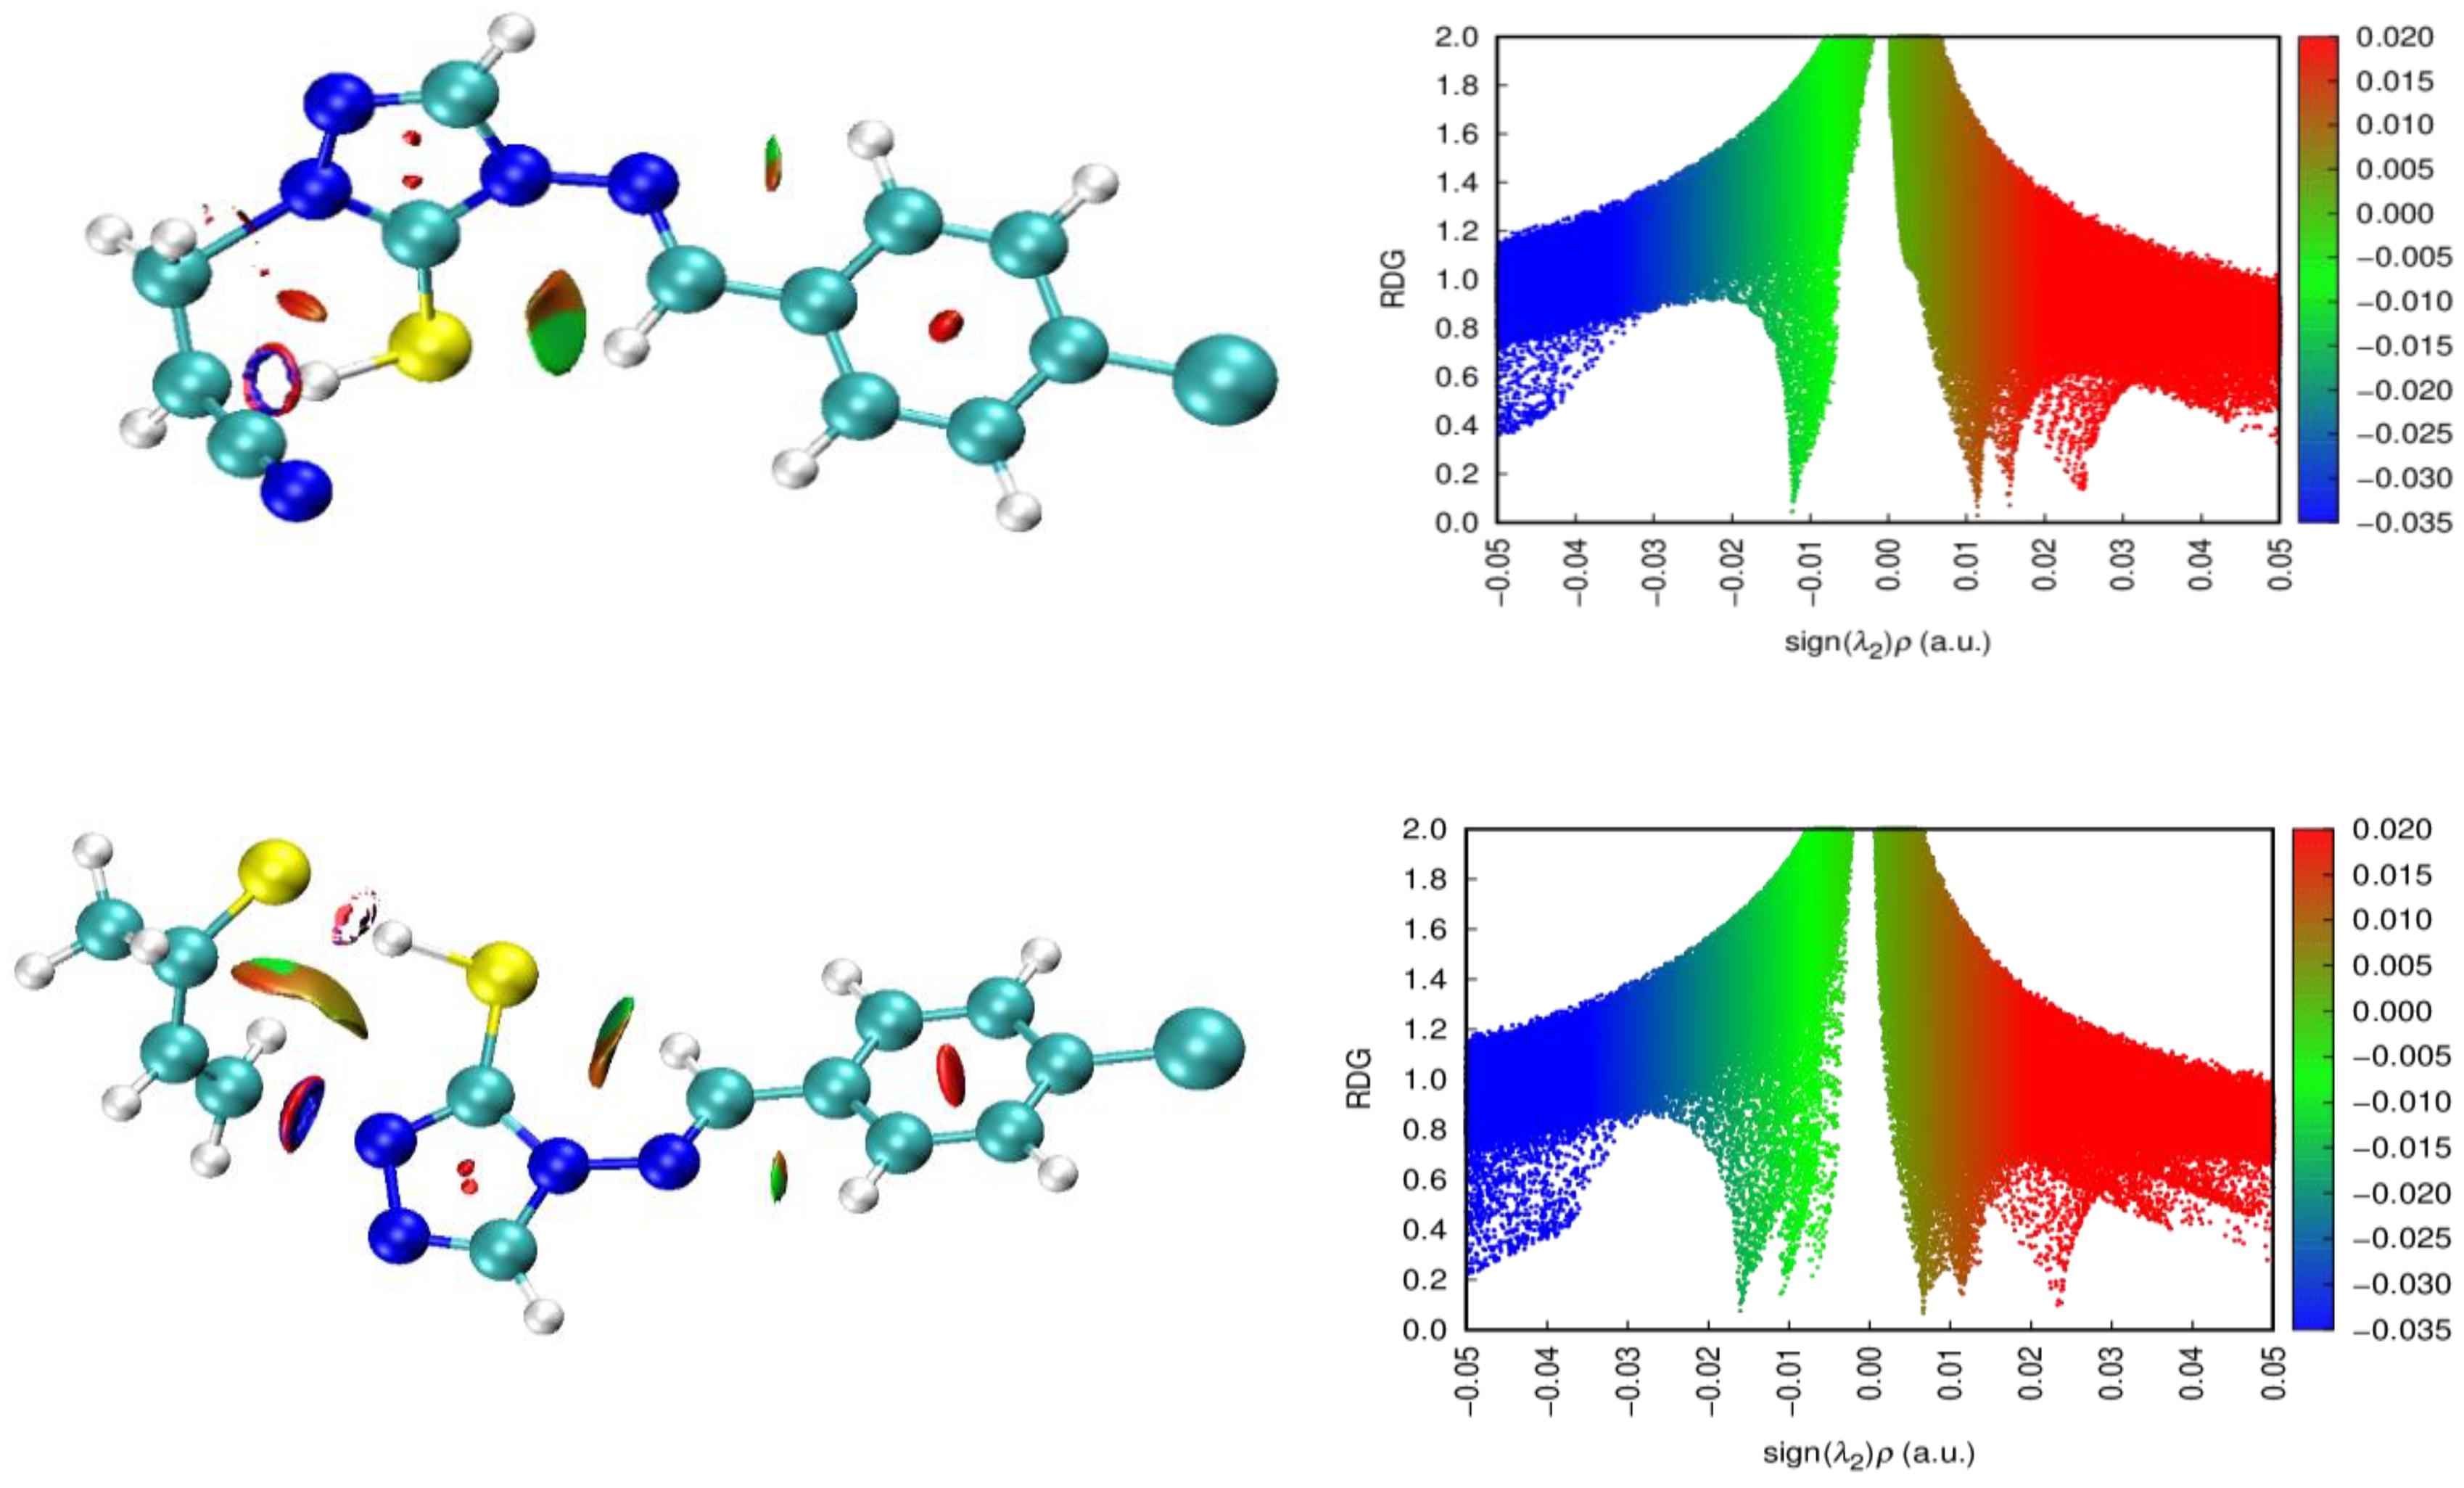
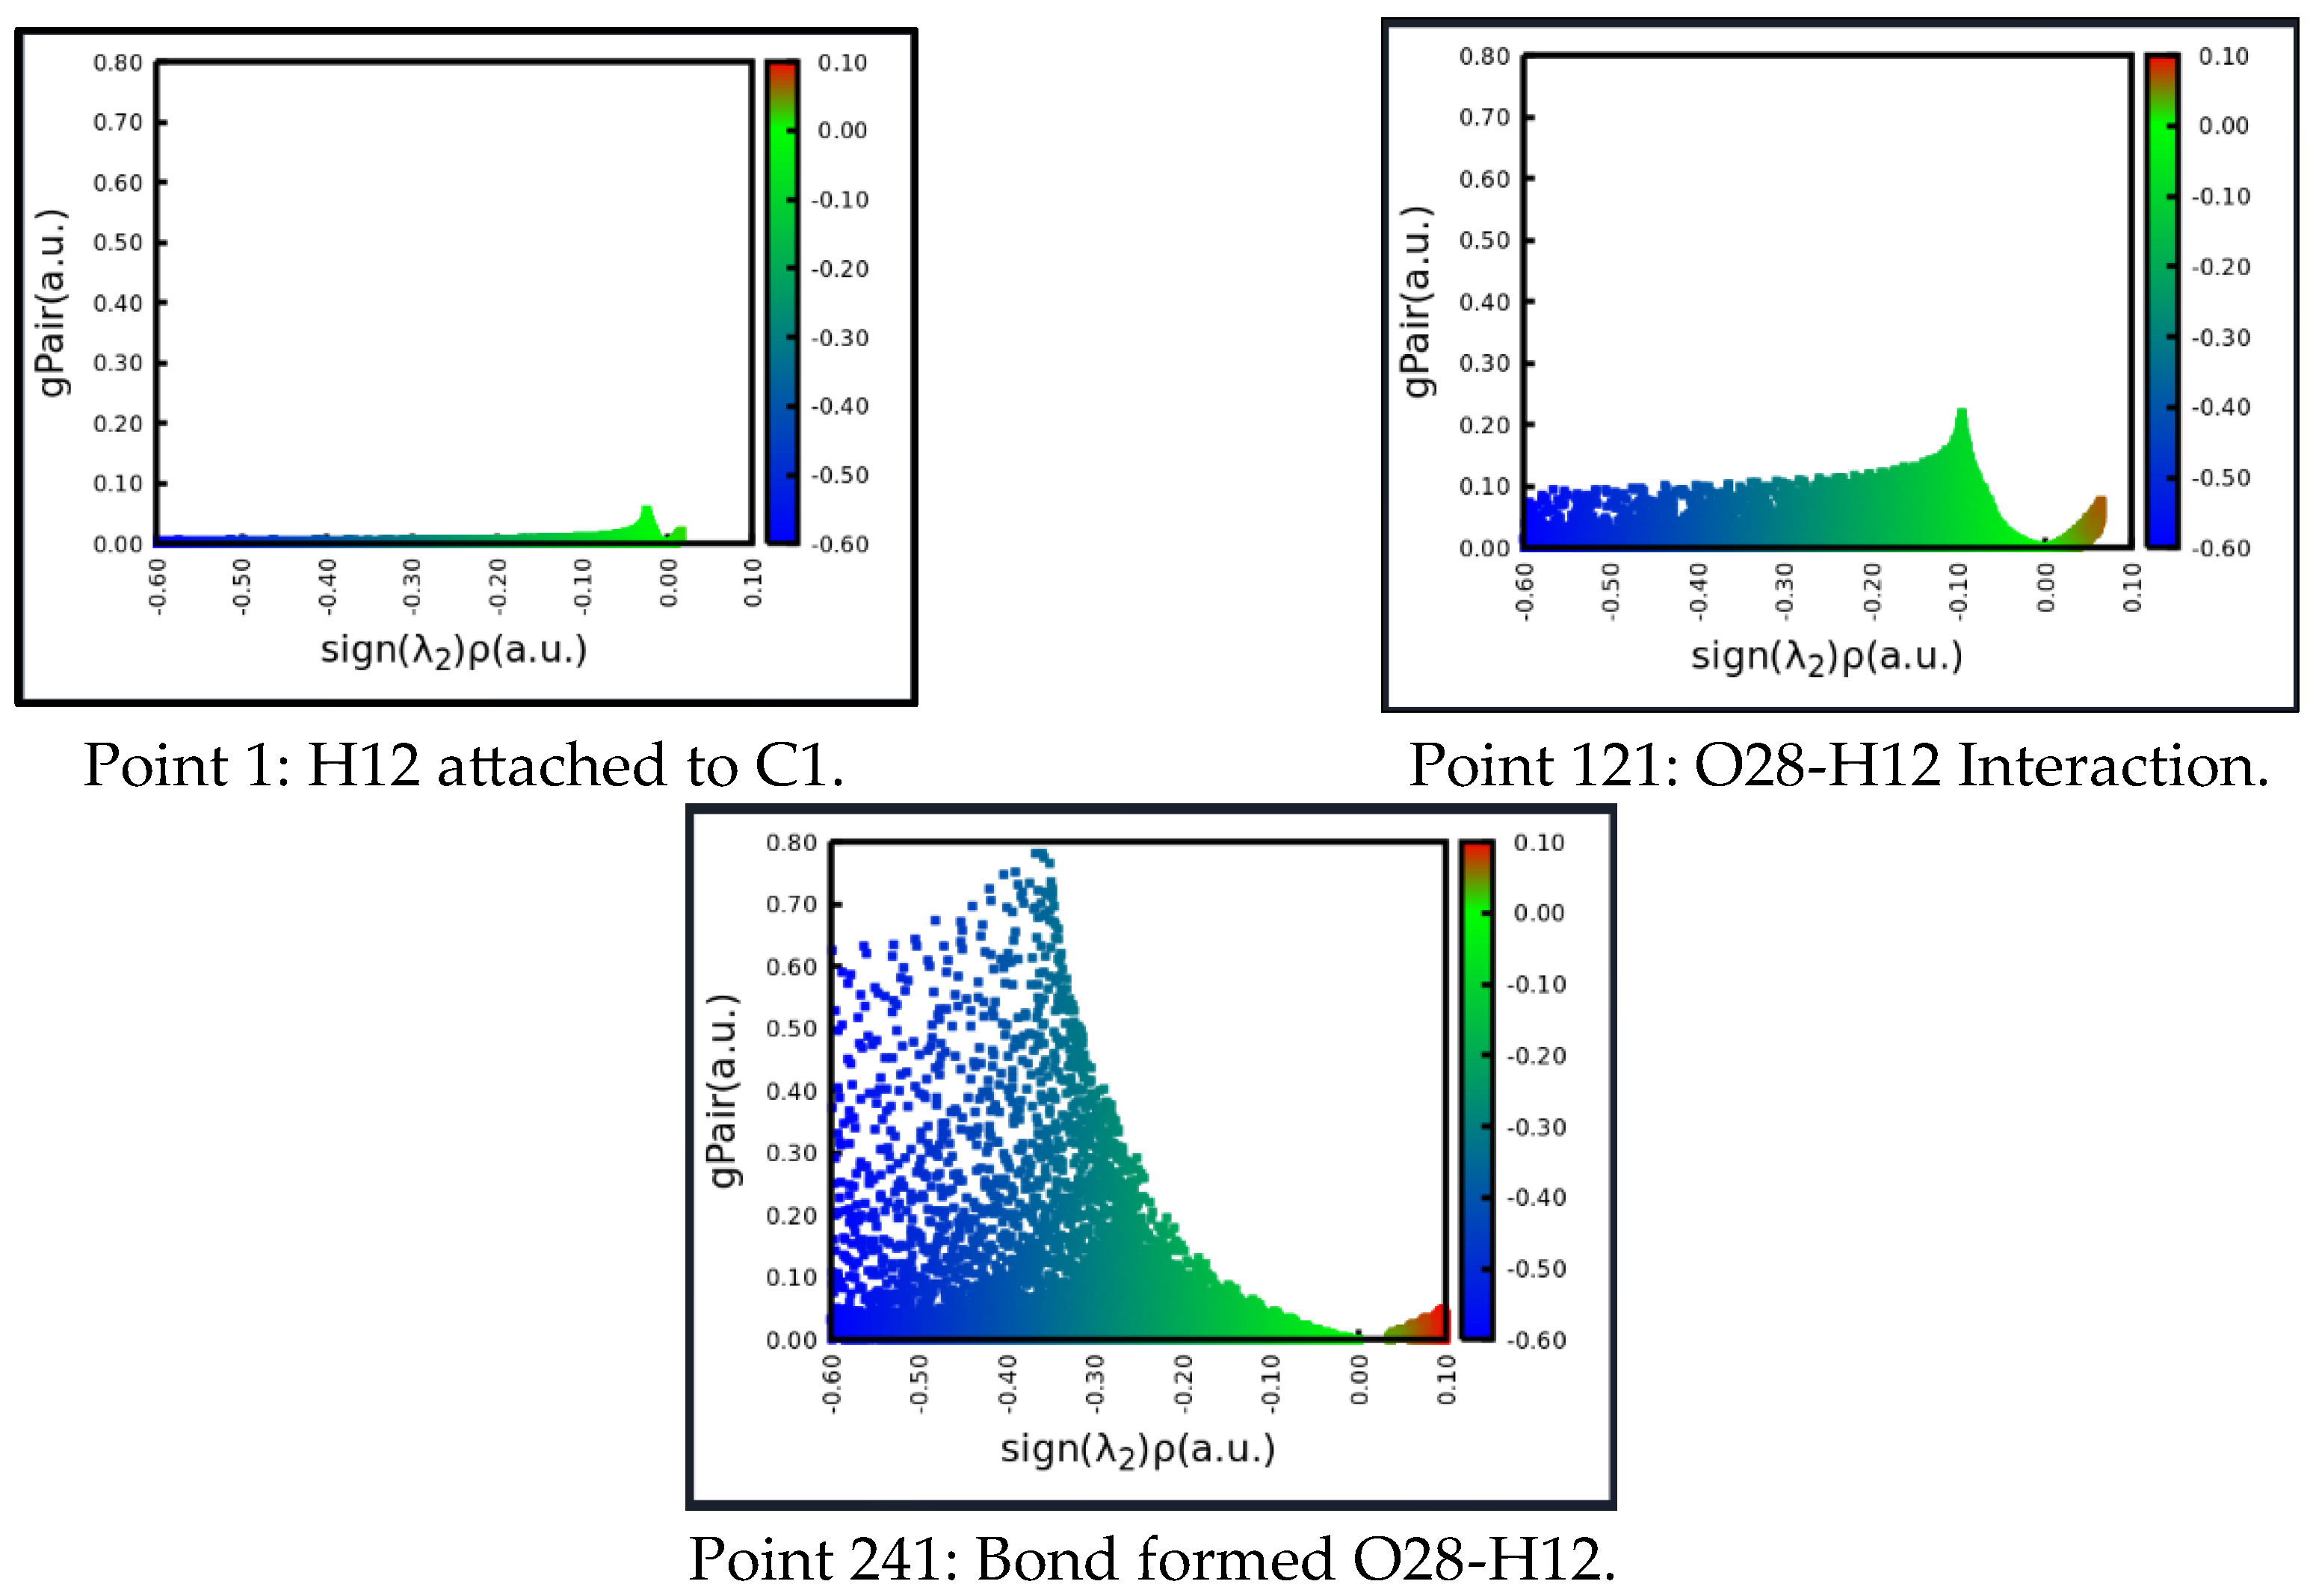
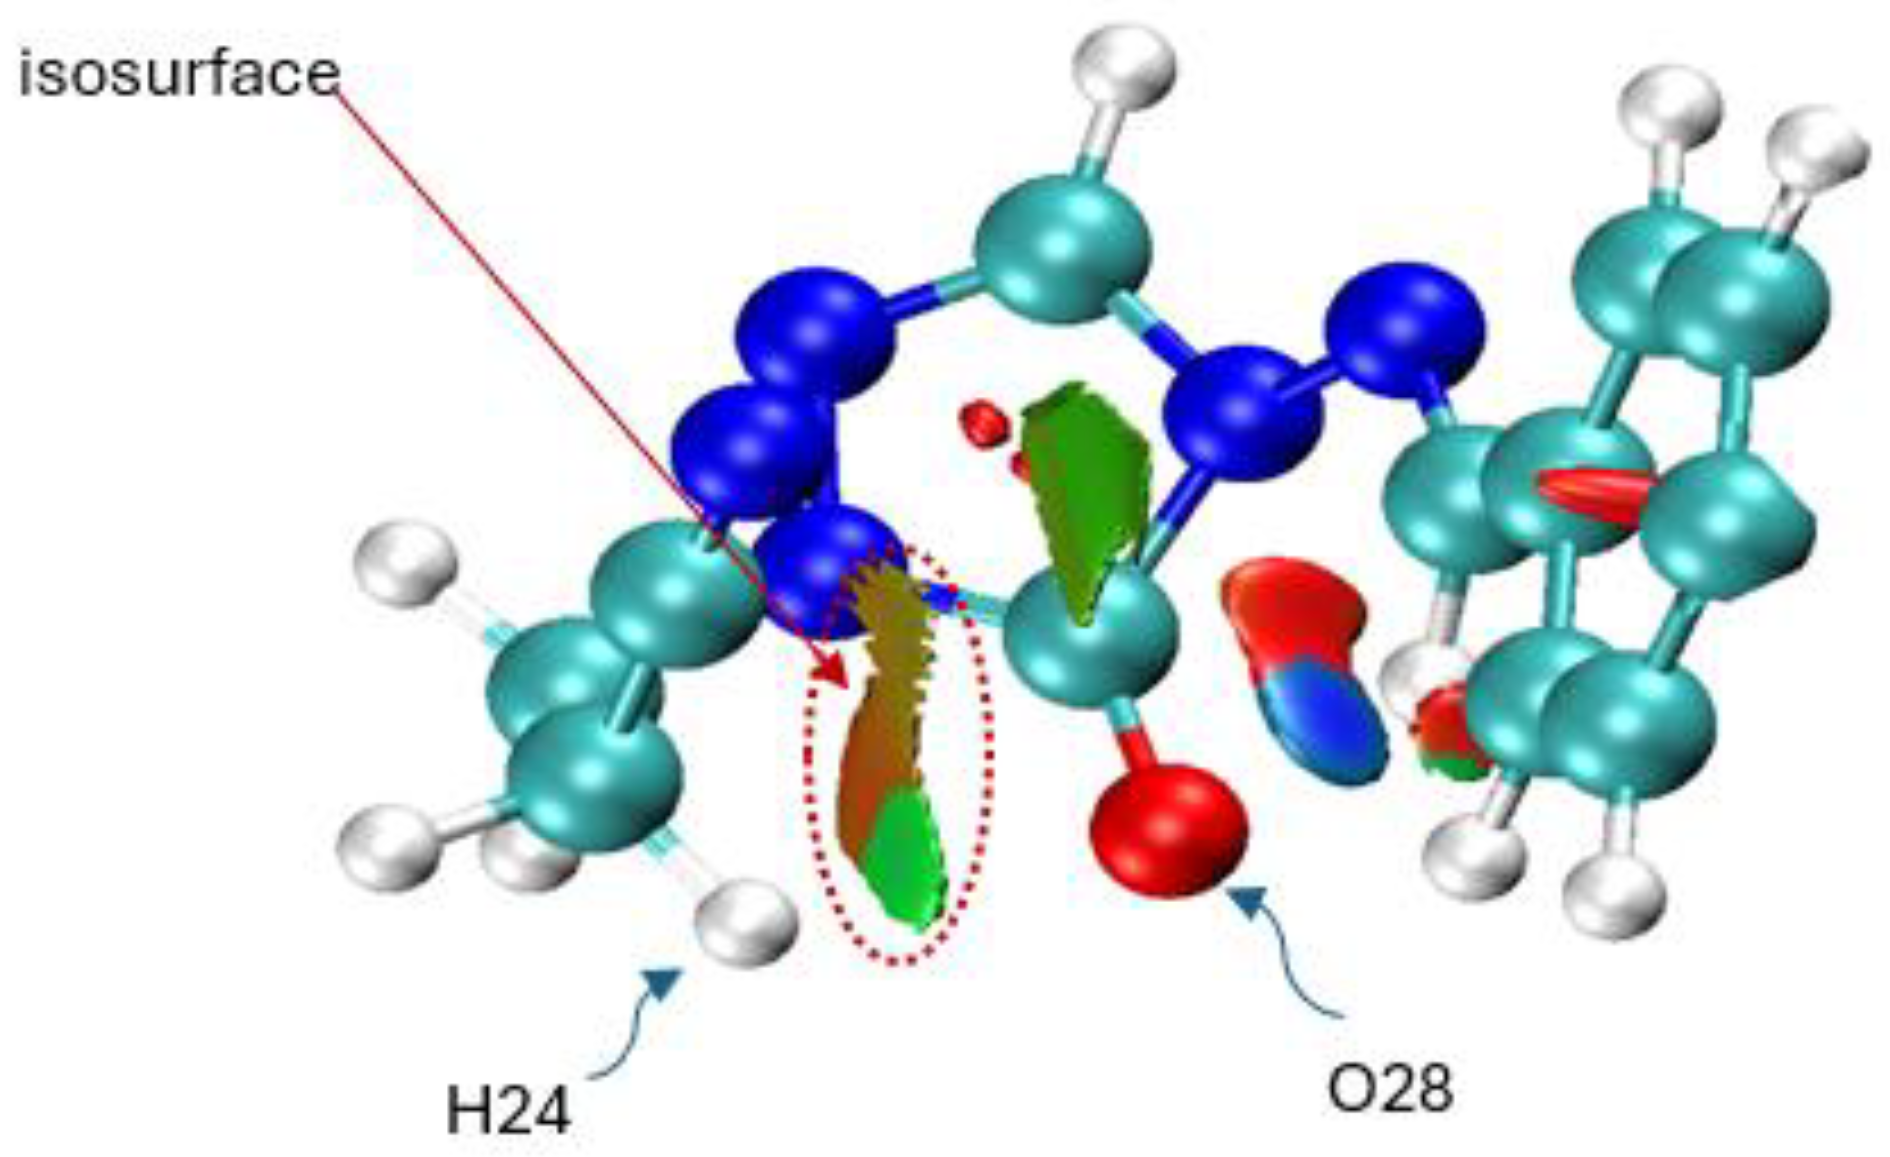
The Independent Gradient Model (IGM)

| Bond | d(Angs) | δg | IBSI | PDA (×10−1) | Asymmetry Direction | rho | Lap | bcp_x | bcp_y | bcp_z | L1 | L2 | L3 |
|---|---|---|---|---|---|---|---|---|---|---|---|---|---|
| H24-S29 | 2.9 | 0.118 | 0.019 | 252.5 | H24→S29 | 0.009 | 0.026 | -2.277 | -1.151 | -1.354 | -0.007 | -0.005 | 0.038 |
| S29-H12 | 1.925 | 0.431 | 0.162 | 384.7 | S29←H12 | 0.057 | 0.051 | -0.689 | 0.62 | -1.32 | -0.077 | -0.076 | 0.205 |
| H12-C1 | 1.159 | 0.736 | 0.762 | 212.1 | H12→C1 | 0.235 | -0.699 | -0.013 | 0.834 | -0.612 | -0.623 | -0.622 | 0.545 |
| C1-N13 | 1.238 | 2.006 | 1.822 | 30.9 | C1→N13 | 0.428 | -0.861 | 0.128 | 1.296 | 0.323 | -1.037 | -0.946 | 1.122 |
| N13-N14 | 2.012 | 0.7 | 0.241 | 1.3 | N13←N14 | 0.077 | 0.154 | -1.224 | 1.796 | 0.509 | -0.107 | -0.104 | 0.364 |
| N14-C15 | 1.363 | 1.769 | 1.325 | 38.1 | N14←C15 | 0.337 | -1.058 | -2.39 | 1.239 | -0.342 | -0.779 | -0.666 | 0.387 |
| C15-S29 | 1.693 | 1.728 | 0.839 | 292.5 | C15→S29 | 0.217 | -0.399 | -2.052 | 0.593 | -1.497 | -0.262 | -0.237 | 0.099 |
| C9-C128 | 1.739 | 1.6 | 0.737 | 322.5 | C9→C128 | 0.202 | -0.306 | 5.092 | -0.485 | 0.035 | -0.331 | -0.311 | 0.335 |
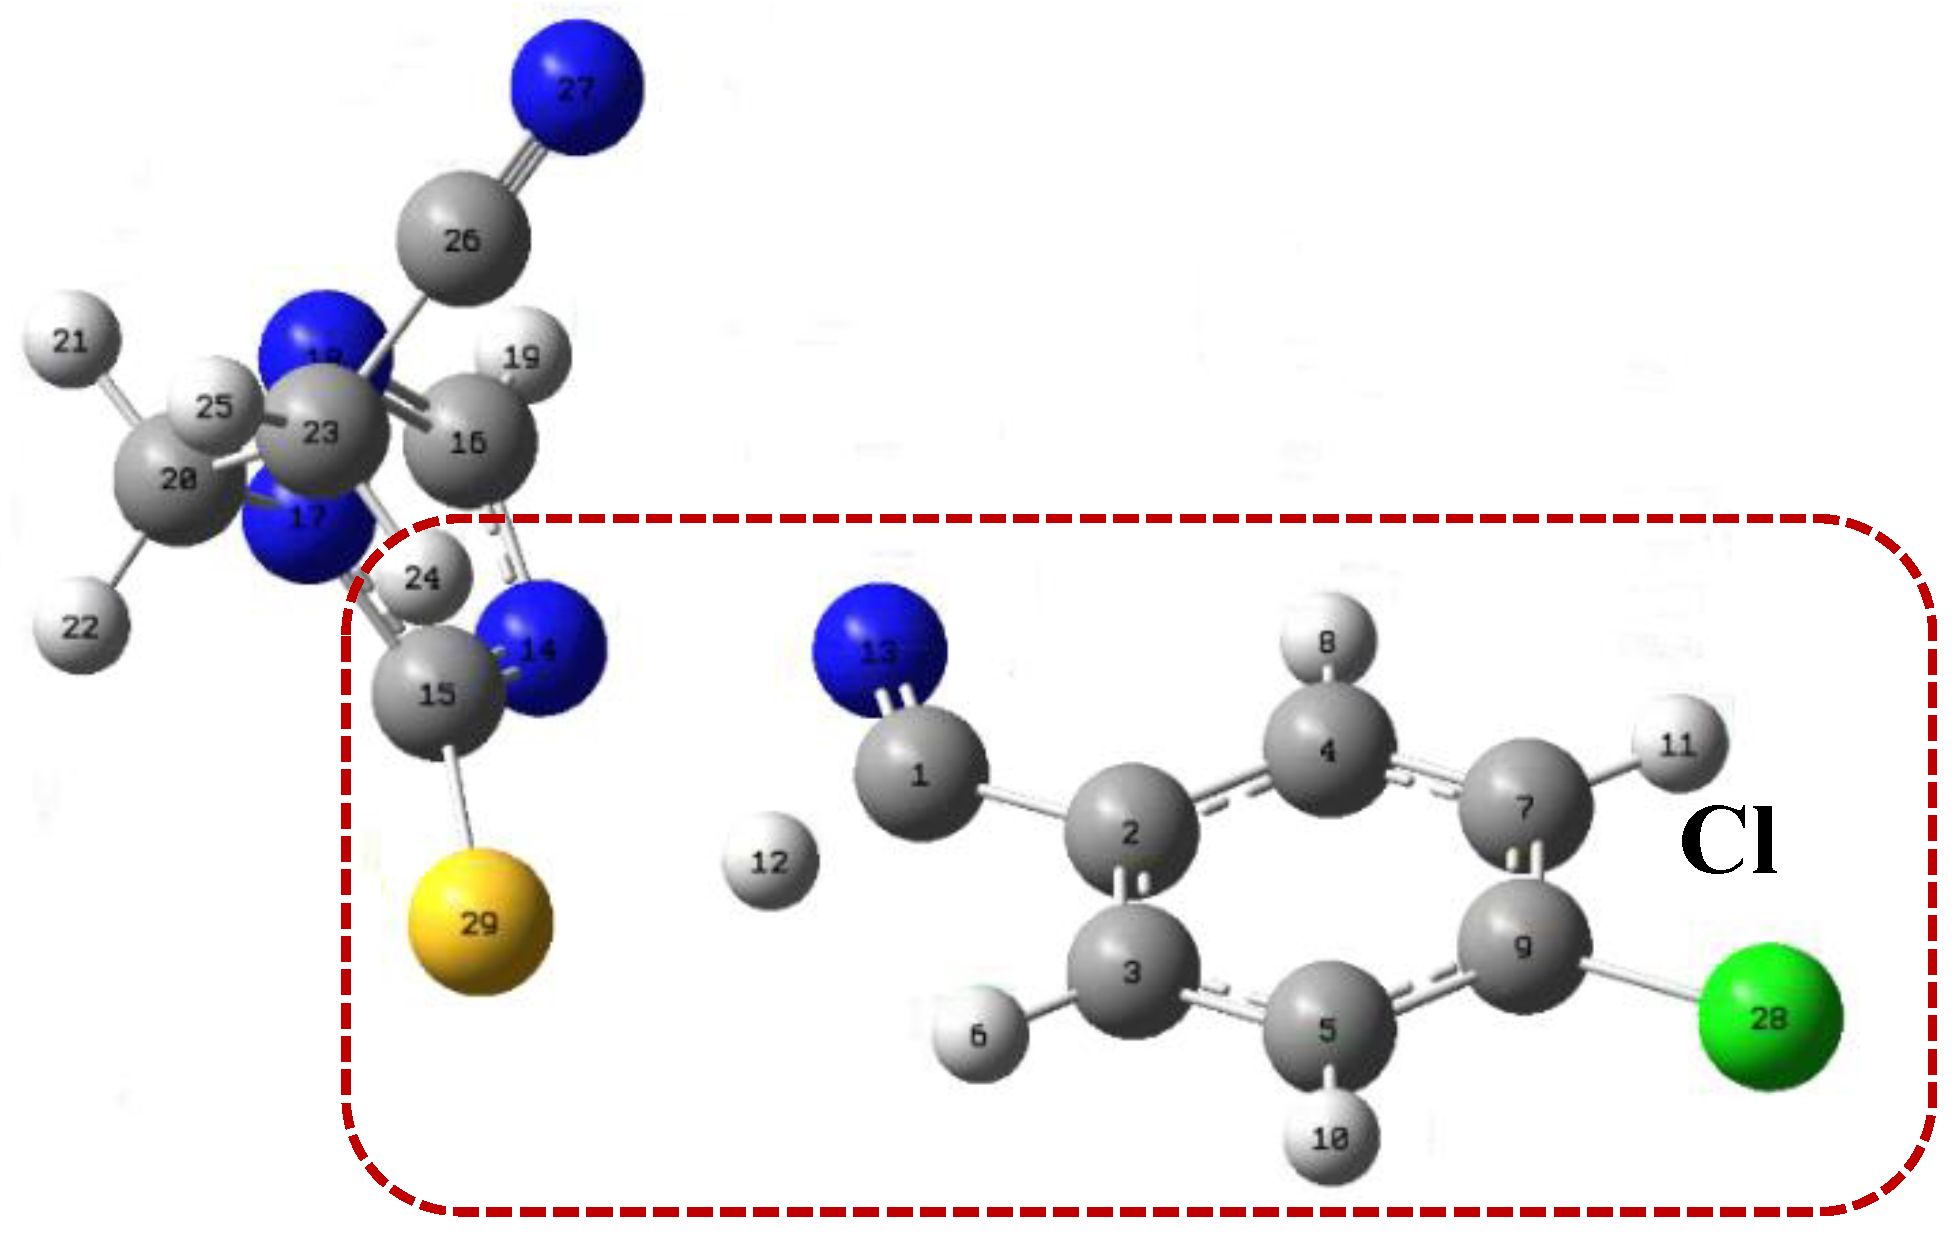
| Bond | d(Angs) | δg | IBSI | PDA (×10−1) | Asymmetry Direction | rho | Lap | bcp_x | bcp_y | bcp_z | L1 | L2 | L3 |
|---|---|---|---|---|---|---|---|---|---|---|---|---|---|
| H24-S29 | 2.911 | 0.107 | 0.018 | 250.4 | H24→S29 | 0.009 | 0.026 | -2.192 | 1.126 | 1.304 | -0.006 | -0.005 | 0.037 |
| S29-C15 | 1.699 | 1.688 | 0.814 | 291.2 | S29←C15 | 0.216 | -0.398 | -1.951 | -0.612 | 1.47 | -0.262 | -0.233 | 0.097 |
| C15-N14 | 1.34 | 1.795 | 1.392 | 38.5 | C15→N14 | 0.354 | -1.191 | -2.341 | -1.258 | 0.35 | -0.836 | -0.706 | 0.351 |
| N14-N13 | 2.037 | 0.641 | 0.215 | 0.8 | N14→N13 | 0.072 | 0.155 | -1.169 | -1.803 | -0.512 | -0.096 | -0.094 | 0.345 |
| N13-C1 | 1.214 | 2.013 | 1.903 | 29.8 | N13←C1 | 0.446 | -0.639 | 0.189 | -1.288 | -0.35 | -1.1 | -1.029 | 1.491 |
| C1-H12 | 1.226 | 0.678 | 0.628 | 203.8 | C1←H12 | 0.195 | -0.485 | -0.012 | -0.833 | 0.614 | -0.486 | -0.481 | 0.483 |
| H12-S29 | 1.773 | 0.539 | 0.239 | 416.7 | H12→S29 | 0.081 | -0.002 | -0.637 | -0.627 | 1.295 | -0.124 | -0.12 | 0.241 |
| C9-C128 | 1.724 | 1.626 | 0.762 | 324.2 | C9→C128 | 0.21 | -0.347 | 5.102 | 0.488 | -0.045 | -0.346 | -0.326 | 0.325 |
Conclusions
Author Contributions
Data Availability Statement
Acknowledgments
Conflicts of Interest
References
- Kumar, A.; Singh, A. K.; Singh, H.; Vijayan, V.; Kumar, D.; Naik, J.; Thareja, S.; Yadav, J. P.; Pathak, P.; Grishina, M.; et al. Nitrogen-Containing Heterocycles as Anticancer Agents: A Medicinal Chemistry Perspective. Pharmaceuticals 2023, 16, 299. [Google Scholar] [CrossRef]
- Wibowo, A.; Mohammed, M. F.; Shaameri, Z.; Rashid, F. N. A. A.; Pungot, N. H.; Hamzah, A. S. Five-Membered Nitrogen Heterocycles as New Lead Compounds in Drug Discovery. Heterocycles 2022, 105, 244–286. [Google Scholar] [CrossRef]
- Aly, A. A.; Hassan, A. A.; Makhlouf, M. M.; Bräse, S. Chemistry and Biological Activities of 1,2,4-Triazolethiones—Antiviral and Anti-Infective Drugs. Molecules 2020, 25, 3036. [Google Scholar] [CrossRef]
- Šermukšnytė, A.; Kantminienė, K.; Jonuškienė, I.; Tumosienė, I.; Petrikaitė, V. The Effect of 1,2,4-Triazole-3-thiol Derivatives Bearing Hydrazone Moisty on Cancer Cell Migration and Growth of Melanoma, Breast, and Pancreatic Cancer Spheroids. Pharmaceuticals 2022, 15, 1026. [Google Scholar] [CrossRef]
- Jasim, A. M.; Omar, T. N.-A.; Abdulhadi, S. L. Sulfur Derivatives of 1,2,4-Triazole: Recently Developed Compounds, Structure Activity Relationship, and Biological Activity: Review Article. Iraqi Journal of Pharmaceutical Sciences 2024, 33, 1–21. [Google Scholar] [CrossRef]
- De La Rosa, M.; Kim, H. W.; Gunic, E.; Jenket, C.; Boyle, U.; Koh, Y.; Korboukh, I.; Allan, M.; Zhang, W.; Chen, H.; Xu, W.; Nilar, S.; Yao, N.; Hamatake, R.; Lang, S. A.; Hong, Z.; Zhang, Z.; Girardet, J.-L. Tri-Substituted Triazoles as Potent Non-Nucleoside Inhibitors of the HIV-1 Reverse Transcriptase. Bioorg. Med. Chem. Lett. 2006, 16, 4444–4449. [Google Scholar] [CrossRef] [PubMed]
- Dong, W.-L.; Liu, Z.-X.; Liu, X.-H.; Li, Z.-M.; Zhao, W.-G. Synthesis and Antiviral Activity of New Acrylamide Derivatives Containing 1,2,3-Thiadiazole as Inhibitors of Hepatitis B Virus Replication. Eur. J. Med. Chem. 2010, 45, 1919–1926. [Google Scholar] [CrossRef] [PubMed]
- Karakıtçük-Iyidoğan, A.; Başaran, E.; Tatar-Yılmaz, G.; Oruç-Emre, E. E. Development of New Chiral 1,2,4-Triazole-3-thiones and 1,3,4-Thiadiazoles with Promising in Vivo Anticonvulsant Activity Targeting GABAergic System and Voltage-Gated Sodium Channels (VGSCs). Bioorg. Chem. 2024, 151, 107662. [Google Scholar] [CrossRef]
- Sirakanyan, S. N.; Spinelli, D.; Geronikaki, A.; Hakobyan, E. K.; Petrou, A.; Kartsev, V. G.; Yegoryan, H. A.; Paronikyan, E. G.; Zuppiroli, L.; Jughetsyan, H. V.; et al. New Triazole-Based Hybrids as Neurotropic Agents. RSC Adv. 2024, 14, 32922–32943. [Google Scholar] [CrossRef] [PubMed]
- Al-Awadi, N. A.; Ibrahim, Y. A.; Dib, H.; Kaul, K. Gas-Phase Elimination Reactions of 4-Arylideneimino-2-cyanoethyl-1,2,4-triazol-3(2H)-ones, Their Thione Analogues and 2-Glucosyl-1,2,4-triazole-3(2H)-thiones: A Kinetic and Mechanistic Study. J. Phys. Org. Chem. 2002, 15, 324–329. [Google Scholar] [CrossRef]
- Hadad, C. M.; Rablen, P. R.; Wiberg, K. B. C-O and C-S Bonds: Stability, Bond Dissociation Energies, and Resonance Stabilization. J. Org. Chem. 1998, 63, 8668–8681. [Google Scholar] [CrossRef]
- Al-Awadi, N. A.; Ibrahim, Y. A.; Kaul, K.; Dib, H. Regioselective Synthesis of 1,2,4-Triazol-3(2H)-ones and their 3(2H)-Thiones: Kinetic Studies and Selective Pyrolytic Deprotection. Heteroat. Chem. 2003, 14, 50–55. [Google Scholar] [CrossRef]
- León, L. A.; Notario, R.; Quijano, J.; Vélez, E.; Sánchez, C.; Quijano, J. C.; Al-Awadi, N. A Density Functional Theory Study of the Gas-Phase Elimination Reactions of 4-Arylideneimino-1,2,4-triazol-3(2H)-ones and Their 3(2H)-thione Analogues. Theor. Chem. Acc. 2003, 110, 387–394. [Google Scholar] [CrossRef]
- Austin, A.; Petersson, G. A.; Frisch, M. J.; Dobek, F. J.; Scalmani, G.; Throssell, K. A Density Functional with Spherical Atom Dispersion Terms. J. Chem. Theory Comput. 2012, 8, 4989–5007. [Google Scholar] [CrossRef]
- Lefebvre, C.; Rubez, G.; Khartabil, H.; Boisson, J.-C.; Contreras-García, J.; Hénon, E. Accurately Extracting the Signature of Intermolecular Interactions Present in the NCI Plot of the Reduced Density Gradient versus Electron Density. Phys. Chem. Chem. Phys. 2017, 19, 17928–17936. [Google Scholar] [CrossRef]
- Lefebvre, C.; Khartabil, H.; Boisson, J.-C.; Contreras-García, J.; Piquemal, J.-P.; Hénon, E. The Independent Gradient Model: A New Approach for Probing Strong and Weak Interactions in Molecules from Wave Function Calculations. ChemPhysChem 2018, 19, 724–735. [Google Scholar] [CrossRef]
- Lefebvre, C.; Khartabil, H.; Boisson, J.-C.; Contreras-García, J.; Piquemal, J.-P.; Hénon, E. Analysis of the Interaction Energy in Biomolecular Systems via the Independent Gradient Model (IGM). J. Chem. Theory Comput. 2020, 16, 2680–2691. [Google Scholar]
- Frisch, M. J.; Trucks, G. W.; Schlegel, H. B.; Scuseria, G. E.; Robb, M. A.; Cheeseman, J. R.; Scalmani, G.; Barone, V.; Petersson, G. A.; Nakatsuji, H.; et al. Gaussian 16, Revision C.01; Gaussian, Inc.: Wallingford, CT, 2016. [Google Scholar] [CrossRef]
- Grimme, S.; Hansen, A.; Brandenburg, J. G.; Bannwarth, C. Dispersion-Corrected Mean-Field Electronic Structure Methods. Chem. Rev. 2016, 116, 5105–5154. [Google Scholar] [CrossRef] [PubMed]
- McQuarrie, D. A.; Simon, J. D. Molecular Thermodynamics; University Science Books: Sausalito, CA, 1999. [Google Scholar] [CrossRef]
- Fukui, K. A Formulation of the Reaction Coordinate. J. Phys. Chem. 1970, 74, 4161–4163. [Google Scholar] [CrossRef]
- Weigend, F.; Ahlrichs, R. Balanced Basis Sets of Split Valence, Triple Zeta Valence and Quadruple Zeta Valence Quality for H to Rn: Design and Assessment of Accuracy. Phys. Chem. Chem. Phys. 2005, 7, 3297–3305. [Google Scholar] [CrossRef]
- Reed, A. E.; Weinhold, F. Natural Bond Orbital Analysis of Near-Hartree–Fock Water Dimer. J. Chem. Phys. 1983, 78, 4066–4073. [Google Scholar] [CrossRef]
- Reed, A. E.; Curtiss, L. A.; Weinhold, F. Intermolecular Interactions from a Natural Bond Orbital, Donor-Acceptor Viewpoint. Chem. Rev. 1988, 88, 899–926. [Google Scholar] [CrossRef]
- Wiberg, K. B.; Haven, N. Application of the Pople-Santry-Segal CNDO Method to the Cyclopropylcarbinyl and Cyclobutyl Cation and to Bicyclobutane. Tetrahedron 1967, 23, 1083–1096. [Google Scholar] [CrossRef]
- Glendening, E. D.; Landis, C. R.; Weinhold, F. NBO 6.0: Natural Bond Orbital Analysis Program. J. Comput. Chem. 2013, 34, 1429–1437. [Google Scholar] [CrossRef] [PubMed]
- Muller, O. H. The Polarographic Method of Analysis. J. Chem. Educ. 1942, 19, 249. [Google Scholar] [CrossRef]
- Benson, S. W. The Foundations of Chemical Kinetics; McGraw-Hill: New York, 1960. [Google Scholar]
- Moyano, A.; Pericàs, M. A.; Valenti, E. A Theoretical Study on the Mechanism of the Thermal and the Acid-Catalyzed Decarboxylation of 2-Oxetanones (β-Lactones). J. Org. Chem. 1989, 54, 573–582. [Google Scholar] [CrossRef]
- Klein, J.; Khartabil, H.; Boisson, J.-C.; Contreras-García, J.; Piquemal, J.-P.; Hénon, E. A New Way for Probing Bond Strength. J. Phys. Chem. A 2020, 124, 1850–1860. [Google Scholar] [CrossRef] [PubMed]
- Frisch, M. J.; Pople, J. A.; Binkley, J. S. Self-Consistent Molecular Orbital Methods 25. Supplementary Functions for Gaussian Basis Sets. J. Chem. Phys. 1984, 80, 3265–3269. [Google Scholar] [CrossRef]
- Lin, Y. S.; Li, G. D.; Mao, S. P.; Chai, J. D. Long-Range Corrected Hybrid Density Functionals with Improved Dispersion Corrections. J. Chem. Theory Comput. 2013, 9, 263–272. [Google Scholar] [CrossRef]
- Najibi, A.; Goerigk, L. The Non-Local Kernel in van-der-Waals Density Functionals as an Additive Correction: An Extensive Analysis with Special Emphasis on the B97M-V and ωB97M-V Approaches. J. Chem. Theory Comput. 2018, 14, 5725–5738. [Google Scholar] [CrossRef] [PubMed]
- Zaier, R.; Martel, A.; Antosiewicz, T. J. Effect of Benzothiadiazole-Based π-Spacers on Fine-Tuning of Optoelectronic Properties of Oligothiophene-Core Donor Materials for Efficient Organic Solar Cells: A DFT Study. J. Phys. Chem. A 2023, 127, 10555–10569. [Google Scholar] [CrossRef] [PubMed]
- Elias, R. S.; Saeed, B. A.; Kamounah, F. S.; Duus, F.; Hansen, P. E. Strong Intramolecular Hydrogen Bonds and Steric Effects Involving C=S Groups: An NMR and Computational Study. Magn. Reson. Chem. 2020, 58, 154–162. [Google Scholar] [CrossRef] [PubMed]
- Wang, Y.; Verma, P.; Jin, X.; Truhlar, D. G.; He, X. Revised M06 Density Functional for Main-Group and Transition-Metal Chemistry. Proc. Natl. Acad. Sci. U.S.A. 2018, 115, 10257–10262. [Google Scholar] [CrossRef] [PubMed]
- Edet, H. O.; Louis, H.; Gber, T. E.; Idante, P. S.; Egemonye, T. C.; Ashishie, P. B.; Oyo-Ita, E. E.; Benjamin, I.; Adeyinka, A. S. Heteroatoms (B, N, S) Doped Quantum Dots as Potential Drug Delivery System for Isoniazid: Insight from DFT, NCI, and QTAIM. Heliyon 2024, 10, e40199. [Google Scholar] [CrossRef] [PubMed]
- Savenko, E. S.; Kostjukov, V. V. Theoretical Study of the Excitation of Proflavine H-Dimers in an Aqueous Solution: The Effect of Functionals and Dispersion Corrections. Phys. Chem. Chem. Phys. 2023, 25, 12259–12276. [Google Scholar] [CrossRef]
- Jacquemin, D.; Wathelet, V.; Perpète, E. A.; Adamo, C. Extensive TD-DFT Benchmark: Singlet-Excited States of Organic Molecules. J. Chem. Theory Comput. 2009, 5, 2420–2435. [Google Scholar] [CrossRef]
- Bednarska, J.; Zalesny, R.; Bartkowiak, W.; Ośmiałowski, B.; Medved, M.; Jacquemin, D. Quantifying the Performances of DFT for Predicting Vibrationally Resolved Optical Spectra: Asymmetric Fluoroborate Dyes as Working Examples. J. Chem. Theory Comput. 2017, 13, 4347–4359. [Google Scholar] [CrossRef]
- Lefebvre, C.; Klein, J.; Khartabil, H.; Boisson, J.-C.; Hénon, E. IGMPlot: A Program to Identify, Characterize, and Quantify Molecular Interactions. J. Comput. Chem. 2023, 44, 1750–1766. [Google Scholar] [CrossRef]
- Menconi, G.; Tozer, D. J. Diatomic Bond Lengths and Vibrational Frequencies: Assessment of Recently Developed Exchange-Correlation Functionals. Chem. Phys. Lett. 2002, 360, 38–46. [Google Scholar] [CrossRef]
- Stuyver, T.; Shaik, S. Unifying Conceptual Density Functional and Valence Bond Theory: The Hardness—Softness Conundrum Associated with Protonation Reactions and Uncovering Complementary Reactivity Modes. J. Am. Chem. Soc. 2020, 142, 20002–20013. [Google Scholar] [CrossRef]
- Wieczorkiewicz, P.; Krygowski, T.; Szatyłowicz, H. Substituent Effects and Electron Delocalization in Five-Membered N-Heterocycles. Phys. Chem. Chem. Phys. 2024. [CrossRef] [PubMed]


| X | R | Y | ΔH (kJ/mol) |
ΔG (kJ/mol) | ΔS (J/Kmol) | Ea (kJ/mol) | % Error Ea (kJ/mol) | Ea (kJ/mol) Experimental |
|---|---|---|---|---|---|---|---|---|
| Sulfur | H | H | 156.25 | 158.18 | -3.87 | 160.40 | 29.0 | 124.3 ± 0.8 |
| Sulfur | H | NO2 | 160.85 | 161.98 | -2.27 | 165.01 | ||
| Sulfur | H | Me | 159.56 | 146.49 | 26.15 | 163.72 | 5.8 | 154.8 ± 0.1 |
| Sulfur | H | OMe | 154.67 | 158.23 | -7.11 | 158.83 | 1.4 | 156.7 ± 0.2 |
| Sulfur | H | Cl | 157.86 | 159.97 | -4.18 | 162.02 | 27.1 | 127.5 ± 0.4 |
| Oxygen | H | H | 195.62 | 194.91 | 1.40 | 199.77 | 14.4 | 174.6 ± 2.5 |
| Oxygen | H | NO2 | 201.10 | 197.22 | 7.67 | 205.21 | ||
| Oxygen | H | Me | 198.62 | 182.86 | 31.54 | 202.78 | 18.4 | 171.0 ± 0.9 |
| Oxygen | H | OMe | 193.31 | 194.07 | -1.52 | 197.47 | 39.0 | 142.1 ± 2.4 |
| Oxygen | H | Cl | 197.19 | 196.26 | 1.88 | 201.35 | 16.8 | 172.4 ± 2.1 |
| Functional | X | R | Y | ΔH (kJ/mol) |
ΔG (kJ/mol) |
ΔS (J/Kmol) |
Ea (kJ/mol) | % Error Ea (kJ/mol) |
|---|---|---|---|---|---|---|---|---|
| B3LYP GD3BJ P2 = 20% | Sulfur | H | H | 143.07 | 144.80 | -3.47 | 147.22 | 18.4 |
| M062X P2=54% | Sulfur | H | H | 173.60 | 174.28 | -1.36 | 177.76 | 43.0 |
| BHandHLYP P2=50% | Sulfur | H | H | 188.71 | 189.19 | -0.96 | 192.87 | 55.2 |
| wB97XD P2=100% | Sulfur | H | H | 170.66 | 172.56 | -3.77 | 174.83 | 40.7 |
| BLYP P2 = 20% | Oxygen | H | H | 148.57 | 148.76 | -0.37 | 152.73 | -13.8 |
| PBE0 P2=25% | Oxygen | H | H | 210.68 | 209.22 | 2.86 | 214.83 | 21.3 |
| M062X P2=54% | Oxygen | H | H | 208.68 | 205.86 | 5.64 | 212.84 | 20.2 |
| B3LYP P2 = 20% | Oxygen | H | H | 184.04 | 183.05 | -39.89 | 188.20 | 6.3 |
| B3LYP GD3BJ P2=20% | Oxygen | H | H | 183.29 | 182.98 | 0.62 | 187.45 | 5.8 |
| Functional | X | R | Y | ΔH (kJ/mol) | ΔG (kJ/mol) |
ΔS (J/Kmol) |
Ea (kJ/mol) | % Error Ea (kJ/mol) |
|---|---|---|---|---|---|---|---|---|
| MO6L | Sulfur | H | H | 134.97 | 137.91 | -5.89 | 139.12 | 11.9 |
| MO6L (GD3) | Sulfur | H | H | 135.03 | 138.04 | -6.02 | 139.19 | 12.0 |
| B97D (GD3BJ) | Sulfur | H | H | 117.43 | 120.04 | -5.21 | 121.59 | -2.2 |
| HCTH407$ | Sulfur | H | H | 133.61 | 135.20 | -3.17 | 137.77 | 10.8 |
| HCTH407 | Oxygen | H | H | 175.49 | 175.60 | -0.21 | 179.65 | 1.4 |
| B97D (GD3BJ) | Oxygen | H | H | 156.46 | 137.41 | 12.60 | 160.62 | -6.7 |
| BLYP | Oxygen | H | H | 148.57 | 148.76 | -0.37 | 152.72 | -13.8 |
| MO6L | Oxygen | H | H | 175.75 | 175.07 | 1.36 | 179.91 | 1.6 |
| Functional | X | R | Y | ΔH (kJ/mol) |
ΔG (kJ/mol) |
ΔS (J/Kmol) |
Ea (kJ/mol) | % Error Ea (kJ/mol) |
|---|---|---|---|---|---|---|---|---|
| APFD | Sulfur | CH2CH2CN | Cl | 159.21 | 158.09 | 2.23 | 163.36 | |
| APFD | Sulfur | CH2CH2CN | H | 158.18 | 156.04 | 0.10 | 162.34 | 2.7 |
| APFD | Sulfur | CH2CH2CN | Me | 159.02 | 159.71 | -1.39 | 163.17 | 0.2 |
| APFD | Sulfur | CH2CH2CN | OMe | 157.87 | 157.02 | 1.70 | 162.03 | 4.7 |
| APFD | Sulfur | CH2CH2CN | NO2 | 162.51 | 162.63 | -4.43 | 166.67 | 13.1 |
| APFD | Oxygen | CH2CH2CN | H | 195.34 | 184.68 | 0.69 | 199.50 | 23.4 |
| APFD | Oxygen | CH2CH2CN | NO2 | 201.07 | 197.81 | 6.51 | 205.22 | 32.7 |
| MO6L | Oxygen | CH2CH2CN | NO2 | 180.74 | 186.62 | -11.77 | 184.89 | 19.6 |
| APFD | Oxygen | CH2CH2CN | Me | 194.46 | 214.06 | -6.70 | 198.61 | 9.4 |
| APFD | Oxygen | CH2CH2CN | OMe | 194.34 | 195.53 | -2.38 | 198.50 | 7.1 |
| APFD | Oxygen | CH2CH2CN | Cl | 201.72 | 198.20 | 7.04 | 205.88 |
| X | R | Y | ΔH (kJ/mol) |
ΔG (kJ/mol) |
ΔS (J/Kmol) |
Ea (kJ/mol) |
|---|---|---|---|---|---|---|
| Sulfur | CH2CH2CN | Cl | 120.52 | 121.78 | -2.52 | 124.68 |
| Sulfur | CH2CH2CN | OCH3 | 118.75 | 121.39 | -5.22 | 122.91 |
| Sulfur | CH2CH2CN | CH3 | 114.73 | 118.35 | -7.24 | 118.89 |
| Sulfur | CH2CH2CN | NO2 | 123.59 | 121.82 | 3.55 | 127.75 |
| Sulfur | CH2CH2CN | H | 118.94 | 120.26 | -2.63 | 123.10 |
| Oxygen | CH2CH2CN | OCH3 | 157.23 | 155.49 | 3.50 | 161.39 |
| Oxygen | CH2CH2CN | CH3 | 157.41 | 156.77 | 1.28 | 161.56 |
| Oxygen | CH2CH2CN | Cl | 159.29 | 161.22 | -3.85 | 163.45 |
| Oxygen | CH2CH2CN | NO2 | 161.98 | 165.37 | -6.78 | 166.14 |
| Oxygen | CH2CH2CN | H | 158.05 | 158.29 | -0.47 | 162.21 |
| Oxygen | CH2CH2-CO-CH3 | Cl | 154.87 | 161.65 | -13.55 | 159.03 |
| Oxygen | CH2CH2-CS-CH3 | Cl | 150.84 | 157.05 | -12.44 | 155.00 |
| Oxygen | CH2CH2-O-CH3 | Cl | 156.69 | 159.09 | -4.81 | 160.85 |
| Oxygen | CH2CH3 | Cl | 158.42 | 158.04 | 0.76 | 162.58 |
| Functional | X | R | Y | ΔH (kJ/mol) |
ΔG (kJ/mol) | ΔS (J/Kmol) |
Ea (kJ/mol) |
|---|---|---|---|---|---|---|---|
|
APFD P2 = 25% |
Sulfur | CH2CH2-CS-CH3 | Cl | 145.59 | 146.94 | -2.69 | 149.75 |
| Oxygen | CH2CH2-CS-CH3 | Cl | 170.21 | 184.30 | -28.19 | 174.37 | |
|
B97D GD3Bj P2 = 0% |
Oxygen | CH2CH2-CS-CH3 | Cl | 148.74 | 156.83 | -16.18 | 152.90 |
| Sulfur | CH2CH2-CS-CH3 | Cl | 103.64 | 102.18 | 2.93 | 107.80 |
| Bond Pair | d(Angs) | δg | IBSI | PDA (×10−1) | Asymmetry Direction | rho | Lap | bcp_x | bcp_y | bcp_z | L1 | L2 | L3 |
|---|---|---|---|---|---|---|---|---|---|---|---|---|---|
| H24-O28 | 2.512 | 0.093 | 0.02 | 135.1 | H24 → O28 | 0.011 | 0.042 | -2.114 | 1.344 | 1.163 | -0.01 | -0.007 | 0.058 |
| O28-H12 | 1.434 | 0.497 | 0.336 | 249.8 | O28 ← H12 | 0.1 | 0.1 | -1.075 | -0.363 | 1.293 | -0.215 | -0.213 | 0.528 |
| H12-C1 | 1.212 | 0.693 | 0.656 | 205.9 | H12 → C1 | 0.204 | -0.542 | -0.474 | -0.716 | 0.864 | -0.523 | -0.519 | 0.5 |
| C1-N13 | 1.225 | 2.025 | 1.878 | 30.3 | C1 → N13 | 0.439 | -0.781 | -0.263 | -1.432 | 0.091 | -1.064 | -0.991 | 1.274 |
| N13-N14 | 2.165 | 0.538 | 0.16 | 0 | N13–N14 | 0.054 | 0.125 | -1.705 | -1.892 | 0.079 | -0.067 | -0.063 | 0.254 |
| N14-C15 | 1.369 | 1.751 | 1.301 | 38.6 | N14 ← C15 | 0.339 | -1.052 | -2.711 | -1.034 | 0.686 | -0.802 | -0.681 | 0.431 |
| C15-O28 | 1.269 | 1.987 | 1.717 | 84.2 | C15 → O28 | 0.372 | -0.609 | -2.421 | -0.326 | 1.136 | -0.95 | -0.826 | 1.167 |
| C9-C129 | 1.739 | 1.598 | 0.735 | 322.5 | C9 → C129 | 0.202 | -0.306 | 4.731 | 0.253 | -0.028 | -0.33 | -0.311 | 0.335 |
| Bond | d(Angs) | δg | IBSI | PDA (×10−1) | Asymmetry Dir. | rho | Lap | bcp_x | bcp_y | bcp_z | L1 | L2 | L3 |
|---|---|---|---|---|---|---|---|---|---|---|---|---|---|
| H24-028 | 2.476 | 0.082 | 0.019 | 137.5 | H24→028 | 0.012 | 0.049 | -2.297 | 1.376 | 1.105 | -0.011 | -0.007 | 0.066 |
| 028-C15 | 1.269 | 1.955 | 1.689 | 84.8 | O28←C15 | 0.373 | -0.601 | -2.386 | -0.295 | 1.05 | -0.967 | -0.849 | 1.215 |
| C15-N14 | 1.349 | 1.764 | 1.348 | 38.9 | C15→N14 | 0.352 | -1.189 | -2.619 | -1.012 | 0.645 | -0.85 | -0.71 | 0.371 |
| N14-N13 | 2.035 | 0.653 | 0.22 | 1 | N14→N13 | 0.072 | 0.151 | -1.581 | -1.892 | 0.118 | -0.096 | -0.092 | 0.339 |
| N13-C1 | 1.214 | 2.002 | 1.889 | 29.5 | N13←C1 | 0.445 | -0.589 | -0.211 | -1.392 | 0.14 | -1.087 | -1.043 | 1.542 |
| C1-H12 | 1.259 | 0.656 | 0.576 | 200.2 | C1←H12 | 0.18 | -0.425 | -0.498 | -0.593 | 0.854 | -0.45 | -0.444 | 0.469 |
| H12-028 | 1.334 | 0.559 | 0.438 | 267.9 | H12→028 | 0.127 | 0.045 | -1.062 | -0.252 | 1.221 | -0.314 | -0.31 | 0.668 |
| C9-C129 | 1.725 | 1.622 | 0.759 | 323.9 | C9→C129 | 0.209 | -0.347 | 4.739 | 0.278 | -0.059 | -0.344 | -0.324 | 0.321 |
Disclaimer/Publisher’s Note: The statements, opinions and data contained in all publications are solely those of the individual author(s) and contributor(s) and not of MDPI and/or the editor(s). MDPI and/or the editor(s) disclaim responsibility for any injury to people or property resulting from any ideas, methods, instructions or products referred to in the content. |
© 2025 by the authors. Licensee MDPI, Basel, Switzerland. This article is an open access article distributed under the terms and conditions of the Creative Commons Attribution (CC BY) license (http://creativecommons.org/licenses/by/4.0/).


