Submitted:
03 December 2025
Posted:
04 December 2025
You are already at the latest version
Abstract
Permeation of different chemical substances across the membrane is of utmost importance to the life and health of a living cell. Depending on the nature of the permeant, the process is mediated by either the protein (e.g., membrane channels) or lipid phases of the membrane, or both. In the case of small and physiologically important gas molecules, namely O2 and CO2, the literature supports the involvement of both pathways in their transport. The extent of involvement of the lipid phase, however, is directly dependent on the nature of the lipid constituents of the membrane that determine its various structural and physicochemical properties. In this study, we use molecular dynamics simulation, as a method with sufficient spatial and temporal resolutions, to analyze these properties in heterogeneous lipid bilayers, composed of phospholipids with varied tails, sphingomyelin, and cholesterol, to different degrees. Together with the calculation of the free energy profiles, diffusion constants, and gas diffusivity, the results shed light onto the importance of the lipid phase of membranes in gas transport rate and how they can be modulated by their lipid composition.
Keywords:
gas permeation
; cellular membranes
; molecular dynamics simulation
1. Introduction
Lipid membranes provide physical barriers that control the exchange and flow of substances in and out of living cells [1,2]. Unlike polar and charged molecules such as ions, which are energetically unfavorable to dissolve in the hydrophobic core of a lipid membrane [3,4], small, nonpolar gas species, such as O2, NO, and CO2, may diffuse readily through pure lipid bilayers. Although this mode has long been accepted as the main mechanism for gas transport across the cellular membranes [5,6,7], some biological membranes exhibit surprisingly low gas permeabilities [8,9]. Examples include the gastric parietal chief cells [10], erythrocytes [11,12], and fiber cells of the eye lenses [13]. These reports evoke the question as to what degree the lipid composition can determine the gas permeability of a membrane. Distinct gas permeation rates have been reported for membranes composed of different lipid constituents [13,14,15,16,17,18,19,20]. Membrane channels, e.g., aquaporins and Rhesus (Rh) glycoproteins, are also documented to facilitate gas transport across the membrane [21,22,23,24,25,26,27,28], but their physiological significance in this regard remains disputed [29,30], mainly due to experimental limitations [31,32]. Demonstrating that the lipid composition can modulate gas permeability is the first step in establishing the physiological significance of membrane proteins in the overall gas exchange in living cells.
Given its microscopic results, molecular dynamics (MD) simulation can offer insights into the delivery and transport of molecules across the membranes at the atomic level. Physical properties, such as molecular partitioning and permeability coefficients can also be predicted using MD [3,33,34,35]. For years, lipid membranes have been simulated with only one glycerophospholipid type, such as POPC, DOPC or POPE, which are highly fluid under ambient conditions. In recent years, all-atom simulations of membranes with heterogeneous lipid compositions containing multiple glycerophospholipid species, as well as cholesterol (CHL) and sphingomyelins (SM) have been performed [36,37,38].
CHL and SM (Figure 1) are key lipids for structural integrity and morphology of mammalian membranes, and perform other regulatory functions [2,39]. They are abundant in typical mammalian plasma membranes, including erythrocyte and lens membranes, which are reported to have low gas permeability [40]. In those membranes, CHL:phospholipid ratios can range from 1:1 to 4:1, where SM constitutes % of the lipid content [41,42]. CHL is enriched in the liquid-ordered phase of the membrane [43,44] and also known to induce lipid domain formations [45,46,47]. The clustering between SM with CHL has been implicated to the formation of liquid, highly-ordered domains, known as rafts, which have been proposed to be involved in cell signaling [48,49,50,51].
The effects of CHL on membrane permeability have been probed by MD simulations. Previous studies with extensive simulations and analysis of membranes with high CHL content (>30 mole%) predicted a reduced water permeability [52,53]. Other studies also found apparent reduction in the partitioning of small molecules and gases in membranes with CHL relative to CHL-free membranes [54,55,56,57].
The present study examines the effects of lipid composition heterogeneity, particularly the presence of high CHL and SM, on gas permeability by explicitly simulating O2 or CO2 molecules in membranes. The sets of independent simulations comprise CHL-free (pure) bilayers of POPC, SM or DPPC, binary compositions of POPC:CHL, SM:CHL, DPPC:CHL, POPC:SM and POPC:DPPC, and ternary compositions of POPC:PSM:CHL and POPC:DPPC:CHL. SM is represented by the palmitoylsphingomyelin (PSM) (Figure 1). The fully saturated DPPC (dipalmitoylphosphatidylcholine) lipids account for the effects of lipid saturation on gas permeability. We explicitly calculated membrane partitioning free energy profiles and permeability coefficients of the gas molecules from the equilibrium MD trajectories. The results show clearly the dependence of the calculated gas permeability on the lipid composition; they demonstrate that high CHL content reduces solubility of gas molecules in the membrane. Reduced gas permeability is pronounced in the simulated POPC-free PSM membranes, due to slow lipid dynamics and gel-liquid phase behavior under physiological body temperature (310 K).
2. Materials and Methods
2.1. Simulation Systems
The simulated membrane systems are summarized in Table 1. They comprise mixtures of POPC:PSM:CHL or POPC:DPPC:CHL lipids. The membrane patches were prepared using CHARMM-GUI [58]. The membranes were solvated with TIP3P water and ionized with 0.2 M NaCl. Structures and interactions of lipids (POPC, PSM and CHL), water, ions and gases were described by the CHARMM36 force field parameter set [59,60,61,62]. The initial dimension of each membrane plane was 100 Å × 100 Å.
Depending on the membrane system, a simulation was performed to equilibrate the system in the absence of gas molecules for tens to a few hundred nanoseconds. The area of the plane of each system was monitored and the simulation was continued until it became steady. To explicitly describe the partitioning and permeation of gases, O2 or CO2, 125 copies of each species were added to the equilibrated systems. The molecules were initially placed in the aqueous solution. We refer to this type of simulations as “flooding” simulations.
2.2. Simulation Protocols
All simulations were performed using NAMD2 [63,64] with the CHARMM36 force field [59,65] and a time step of 2 fs. All of the simulations were performed under NPT ensemble with the flexible cell under the constant ratio, with the z axis representing the membrane normal. The periodic boundary condition (PBC) was used throughout the simulations. To evaluate long-range electrostatic interactions in PBC without truncation, the particle mesh Ewald (PME) method [66] with a grid density of 1/Å3 was used. The temperature was maintained at 310 K by Langevin dynamics [67] with a damping coefficient of 1/ps. The modified Nosé-Hoover method [67,68], in which Langevin dynamics was used to maintain the pressure at 1 atm with a piston period of 200 fs. All bonds involving hydrogen atoms were kept rigid using the SHAKE algorithm [69]. The cutoff for van der Waals interactions was set at 12 Å.
2.3. Membrane Partitioning and Permeability of Gases
The partitioning free energy profiles () and membrane permeability coefficients () of O2 or CO2 were calculated using the last 175 ns part of trajectories for the 100% POPC membrane systems, and the last 400 ns parts of trajectories for the pure PSM, 0:50:50 POPC:PSM:CHL, and 0:50:50 POPC:DPPC:CHL systems. For the other membrane systems (50:0:50, 35:0:65, 50:50:0, 33:33:33 and 25:25:50 POPC:PSM:CHL, and 50:50:0 and 33:33:33 POPC:DPPC:CHL), which were simulated for 325 ns, we used the last 250 ns for the analysis. profiles representing the occupancy of the gas molecule was expressed as:
with and representing occupancy of the gas molecule at position i and in the aqueous solution, respectively. The VolMap plugin of VMD was used to calculate the occupancy coefficients, which were then projected onto a one-dimensional (z) axis (membrane normal) using the Volutil plugin.
was determined from the cumulative profiles of the number of permeation events (N) from either the extracellular side or the intracellular side over a time period () using linear regression. It is in the unit of cm/s and expressed as:
where m is the slope of N over , is the concentration of the gas molecule in the aqueous solution, and A is the area of the plane of the membrane. was determined from the average number of the gas molecules outside the membrane normalized by the number of water molecules in the same region.
The gas molecules were considered to be in the extracellular solution when they were at least 3 Å above the center of mass of the choline moiety of the lipid head groups, and within the membrane when they were at least 3 Å below the center of mass of the choline groups.
3. Results
3.1. Variation of Membrane Structure by Lipid Composition
3.1.1. Occupancy Profiles
We first monitored the changes in membrane structure by calculating the atomic profiles of its constituents including water and lipids (Figure 2).
In all the simulated membranes, the midpoint of the lipid bilayer () corresponds to the lowest occupancy region. In the pure POPC bilayer, as well as in the 50:50 POPC:PSM and POPC:DPPC bilayers (Figure 2A, G and J), the highest occupancy regions correspond to the head group regions located at Å, inferring a membrane thickness of ∼44 Å. Coincidentally, these points are at the intersection of the water and lipid occupancy profiles, also marking the lipid-water interfaces.
Having simulated the POPC membranes with a high content of CHL (50 and 65 mole%) and without it, we found that CHL significantly alters the membrane profiles (Figure 2A vs. B and C). In the presence of high CHL, the maximum density along the membrane normal spans from the head group regions to the lipid tails centered at Å. CHL molecules are localized beneath the phospholipid head groups. Their positioning decreases the depth of water penetration into the membrane, as indicated by the observed dehydration between and Å, and between and Å.
For the pure PSM bilayer, the lipid-water interfaces center at Å, thickening the membrane by ∼4 Å (Figure 2D). The membrane appears to be more condensed than the CHL-free POPC, POPC:PSM and POPC:DPPC bilayers. Its average area-per-lipid is ∼51 Å2, whereas those of the CHL-free POPC, POPC:PSM and POPC:DPPC bilayers are ∼65, 59, and 62 Å2, respectively. The maximum lipid density of the pure PSM bilayer plateaus to values between and Å, and between and 20 Å, respectively (Figure 2D). For the 50:50 PSM:CHL and DPPC:CHL bilayers, the distance between the two lipid-water interfaces increases to about 50 Å. However, the PSM:CHL one is more condensed than the DPPC:CHL one by ∼15% (Figure 2E-F). Similar to the 50:50 and 35:65 POPC:CHL bilayers, a high CHL content decreases the hydration in both PSM:CHL and DPPC:CHL bilayers. This same behavior is also apparent in the 33:33:33 POPC:PSM:CHL and POPC:DPPC:CHL bilayers (Figure 2H, I and K).
3.1.2. Lipid Ordering
The lipid molecules in the pure POPC bilayer as well as those in the other CHL-free bilayers appear disordered and highly fluid (Figure 3). Those in the simulated CHL-containing bilayers, on the other hand, are conformationally ordered and structurally extended. Uniquely, the pure PSM bilayer resembled more like a ripple phase (between gel and liquid phases). Its shape visibly appears undulated and its lipid molecules appear clustered into small domains (Figure 3).
To quantify the conformational dynamics of the lipid molecules, we calculated the deuterium order parameters () for the aliphatic chains of POPC and DPPC, the sphingosine and acyl chains of PSM (Figure 4).
An value of 0.5 indicates that the lipid molecules are ordered and that their tails are conformationally extended (not tilted). A value of 0 means that the lipids are highly disordered. Among the simulated membranes, the pure POPC bilayer is the most disordered membrane with the maximum values of ∼0.2 for both palmitoyl and oleoyl chains (Figure 4A). Lipids in the simulated CHL-containing bilayers are highly ordered with maximum values approaching 0.4 for POPC lipids and above 0.4 for PSM and DPPC lipids. In the pure PSM bilayer, values are slightly above ∼0.3, suggesting appreciable tilting of some lipid molecules, forming an undulated membrane. The lipid order is reduced in the 50:50 POPC:PSM bilayer with the drop of the maximum values of the PSM chains to 0.275 (Figure 4B). In the 50:50 POPC:DPPC bilayer, the values are ∼0.2 (Figure 4C).
To confirm the tilting of the lipid molecules, we also calculated the tilt angles () of the lipid tails (using carbon atoms) with respect to the membrane normal. In the absence of CHL, lipid tails adopt a broad range of orientations with spanning from 0 to 90°; the distribution peaks are ∼25° for POPC and DPPC lipids and ∼20° for PSM lipids (Figure 5).
This reflects the conformational heterogeneity of the lipid molecules, showing some are highly tilted or structurally bent. In the simulated bilayers with CHL, lipid tails become significantly less tilted; the values range between 0 and 90° with the peaks at 10°, consistent with increasing lipid order. For the pure PSM bilayers, although the distribution peaks of are ∼10°, spreads from 0 to 70° (Figure 5B), confirming high degrees of tilting in some lipid molecules.
3.2. Membrane Partitioning and Permeability of Gas Molecules
3.2.1. Pure POPC and Binary POPC:CHL Bilayers
The changes in membrane structure and dynamics by lipid compositions can have profound effects on the membrane partitioning and permeability of gas molecules. Using the equilibrium flooding MD trajectories, we directly calculated the permeability coefficients () and partitioning profiles of O2 and CO2 (Table 2, Figure 6 and Figure 7). For the pure POPC bilayers, the last 175 ns of the 225-ns simulations were used for the calculations. The calculated values are ∼12 and 16.6 cm/s for O2 and CO2, respectively (Figure 6A-B). The calculated profiles indicate the highest accumulation of O2 and CO2 to be in the midplane of the membrane, corresponding to free energy minima () of kcal/mol for O2 and kcal/mol for CO2 with respect to the bulk solution. The free energy maxima () of ∼0.5 kcal/mol, indicating the lowest occupancy or solubility regions of the gas molecules, are located in the headgroup regions. Thus, according to the profiles, the free-energy barriers of diffusing from the center of the membrane to the aqueous solution () are 2.5 kcal/mol for O2 and 1.25 kcal/mol for CO2 (Figure 7A and C).
For the simulated bilayers with 50 or 65 CHL mole%, the last 250 ns of the 325-ns simulations were used in and calculations. O2 and CO2 remain accumulated in the membrane relative to the aqueous solution, and also remains located in the midplane of the membrane. The incorporation of CHL molecules in the membrane decreases the occupancy of the gas molecules in the tail regions, as indicated by higher values, peaked at Å (Figure 7A). In the pure POPC bilayers, the value drastically decreases as the gas molecule diffuses from the head group region towards the center of the membrane. This decrease in membrane solubility, however, does not decrease O2 permeability. At 50 CHL mole%, plateaus at ∼0 kcal/mol, so for O2 is ∼0.5 kcal/mol lower than in the pure POPC bilayer, which results in a higher value of 16 cm/s. At 65 mole%, increases to 0.5 kcal/mol, forming new local at ±18 Å. Still, is about the same as that in the pure POPC bilayer (Figure 6A), as reflected by a value of 10 cm/s, which corresponds to a 16 % decrease.
3.2.2. Special Cases of Pure PSM and Binary PSM:CHL Bilayers
For the PSM bilayers with 0 and 50 CHL mole%, the last 400 ns of the 525-ns simulation trajectories were used to calculate the and profiles. The solubility of the gas molecules remain highest at the midplane of the membrane. In the pure PSM bilayers, no local is formed in the tail regions despite substantial alterations of membrane structure and lipid dynamics compared to the pure POPC bilayers. remains ∼2.5 kcal/mol for O2, and 1.5 kcal/mol for CO2, as in the pure POPC bilayers (Figure 7B and D). However, gas permeability in the pure PSM bilayers becomes appreciably smaller (by a factor of 10) than in the pure POPC and binary POPC:CHL bilayers. The calculated values are ∼1 cm/s for both O2 and CO2 (Figure 6A-B).
At 50 CHL mole%, the calculated for O2 is ∼2 cm/s which is two times higher than CHL-free membranes. It is still at least five times lower than any of the simulated POPC bilayers. With the at the tail regions,
3.2.3. POPC:PSM:CHL and POPC:DPPC:CHL Bilayers
POPC contains an unsaturated fatty chain and a saturated one, whereas PSM contains a saturated fatty chain and a sphingosine chain in the trans conformer. The saturation of lipid tail could modulate the permeation of gas molecules, as the pure PSM bilayers appear to resemble a gel phase under the simulated temperature of 310 K. We explored this potential effect by simulating CO2 dynamics in a new set of membrane systems constituted of either POPC and PSM or POPC and DPPC (fully saturated). This new set included 50:50:0, 33:33:33 and 25:25:50 POPC:PSM:CHL, and 50:50:0 and 33:33:33 POPC:DPPC:CHL bilayers.
Similar to the other simulated systems, the highest solubility region for the gas molecules is the center of the membrane. Like the simulated CHL-free bilayers, no local is apparent in the tail regions. are 8.4 cm/s and 14.3 cm/s in the 50:50 POPC:PSM and POPC:DPPC bilayers, respectively (Figure 6B-C), in correlation with the differences in lipid order and packing density. At 33 and 50 CHL mole%, CO2 occupancy is reduced in the tail region but to a lesser degree than the 50:50 PSM:CHL bilayer. CO2 permeability was also higher than in the pure PSM and 50:50 PSM:CHL bilayers. in the 33:33:33 POPC:PSM:CHL and POPC:DPPC:CHL bilayer were 6.5 cm/s and 7 cm/s, respectively (Figure 6B-C), in correlation with lipid occupancy profiles (Figure 2H and K). The value in the 25:25:50 POPC:PSM:CHL bilayer was 4.3 cm/s.
We also simulated CO2 diffusion in a DPPC bilayer with 50 CHL mole% and analyzed its last 400 ns trajectory for and calculations. The calculated value was ∼3 cm/s (Figure 6C), which is lower than those in the simulated POPC-containing bilayers but higher than the pure PSM and 50:50 PSM:CHL bilayers. was ∼2.25 kcal/mol, which is 0.5 kcal/mol lower than in the 50:50 PSM:CHL bilayer (Figure 7E).
3.3. Diffusivity of Gas Molecules
Following the inhomogeneous solubility diffusion model [3,75,76,77], membrane permeability of a gas molecule is modulated by its solubility or partitioning in the membrane, its diffusivity, and the membrane thickness. is expressed as:
where is the local partitioning free energy and is the local translational diffusion coefficient in membrane segment (dz). and corresponds to the upper and lower membrane part for which diffusivity is calculated, respectively; the distance resembles the membrane height, denoted as in Table 2. is the partitioning or solubility coefficient of a gas molecule with respect to the aqueous solution and can be calculated from the partitioning profiles (Figure 7). With the calculated , the overall diffusion coefficients of a gas molecule in the membrane () can be approximated to:
For all of the simulated POPC containing bilayers (i.e., pure POPC, POPC:CHL binary, and POPC:PSM:CHL and POPC:DPPC:CHL ternary bilayers), as well as for 50:50 DPPC:CHL, the decrease in the permeability of O2 and CO2 is resulted by the decrease of their membrane solubility. The estimated values for O2 and CO2 in these membranes are similar, ranging from to cm2/s (Figure 8), which is about 10 times slower than their diffusion in water ( cm2/s).
4. Discussion
The present MD study examines the extent to which changes in the lipid compositions, such as the CHL and SM contents and the degree of lipid saturation, influence the permeability of bioactive O2 and CO2 gases across the membrane. Our results shows that increasing CHL content results in an increase in lipid order, packing density and membrane thickness, in correlation with a reduced gas solubility in the membrane. The degree of lipid saturation (i.e., presence of POPC, PSM and/or DPPC) also contributes to the rate of gas permeation. Among the simulated bilayers, gas permeability is slowest is a pure PSM bilayer ( cm/s), and the incorporation of monosaturated POPC lipids increases the permeability by several folds.
We note that our simulation used a temperature of 310 K (body temperature). According to an X-ray diffraction study, the ripple-fluid phase transition temperature of the PSM bilayer is at 314 K [78]. This explains the observed undulated membrane structure at the simulated temperature (Fig. Figure 3). This also results in the dynamics of lipid molecules in the pure PSM bilayer to be slower than those in the simulated POPC or CHL bilayers, which are either in a liquid-ordered or liquid-disordered phase or coexist in both phases [44,79]. Low membrane fluidity, together with tight packing of PSM lipids, rationalizes the appreciably lower calculated and values for O2 and CO2 in the pure PSM bilayers. The apparently larger variations of the profiles in the PSM bilayer than in the CHL-free POPC, POPC:PSM and POPC:DPPC bilayers (Figure 7) are most likely due to the coexistence of solid and liquid lipid domains in the ripple phase.
We also show that the presence of CHL in the membrane limits the permeability of CO2 more significantly than O2 (Figure 6A-B). These findings agree with a recent MD study [57], observing only 23% reduction of O2 permeability at 62.5 CHL mole%. CHL partitioning in the membrane was also found to strengthen the hydrophobic lipid-lipid contacts [55], thereby tightening the membrane. This may make CO2, which has a larger volume, more difficult to diffuse than O2. This observation also explains the lower value for CO2 than O2, as CO2 shows a greater decrease in its solubility in the lipid-tail region occupied by CHL molecules (Figure 7A and C). Since the pure POPC and other simulated CHL bilayers have similar vlaues (Figure 8), gas permeation through fluid bilayers still follows the Meyer-Overton rule, which predicts their permeability from their solubility [29].
In all of our simulated bilayers, gas concentration is highest in the midplane of the membrane. barriers for the entry of gas molecules from the aqueous solution into the membrane is negligibly small. It is the diffusion of gas molecules from the midplane to the solution that constitutes the main barrier of their permeation. These features could play vital roles in a living cell by creating a local concentration gradient of gases that are substrates of many biochemical reactions taking place within the membrane. A notable example is the catalysis of O2 to water by cytochrome c oxidases of which the entrance of the O2 access pathway is located near the center of the membrane [80].
Many aspects potentially controlling membrane permeability remain to be explored, and this study focuses only on neutral phospholipids (POPC, DPPC and PSM) and CHL. Realistic biological membranes also contain anionic and more complex lipids, as well as integral and peripheral proteins and adhesion proteins. These other components, especially proteins, are structurally more condensed and less dynamic than lipids, so their presence could add significant barriers for gas molecules to penetrate in. In such conditions, membrane channels, such as aquaporins which contain high-affinity, always-open pathways for gases [81,82], may be important for maintaining cellular homeostasis and reducing cellular toxicity.
Author Contributions
Conceptualization, P.M., F.J.M., A.V., W.F.B., and E.T.; methodology, P.M.; validation, P.M.; formal analysis, P.M.; investigation, P.M.; resources, E.T.; data curation, P.M.; writing—original draft preparation, P.M.; writing—review and editing, A.R., F.J.M., and E.T.; visualization, P.M.; supervision, E.T.; project administration, E.T.; funding acquisition, E.T. All authors have read and agreed to the published version of the manuscript.
Funding
This work was supported in part by the National Institutes of Health (P41-GM104601 and R24-GM145965 to E.T. and U01-GM111251 and R01-DK128315 to W.F.B. and E.T.) and the Office of Naval Research (ONR N00014-16-1-2535 to W.F.B. and E.T.).
Conflicts of Interest
The authors declare no conflicts of interest.
References
- Harayama, T.; Riezman, H. Understanding the Diversity of Membrane Lipid Composition. Nat. Rev. Mol. Cell Biol. 2018, 19, 281–296. [Google Scholar] [CrossRef]
- van Meer, G.; Voelker, D. R.; Feigenson, G. W. Membrane Lipids: Where They Are and How They Behave. Nat. Rev. Mol. Cell Biol. 2008, 9, 112–124. [Google Scholar] [CrossRef]
- Marrink, S. J.; Berendsen, H. J. C. Permeation Process of Small Molecules Across Lipid Membranes Studied by Molecular Dynamics Simulations. J. Phys. Chem. 1996, 100, 16729–38. [Google Scholar] [CrossRef]
- MacCallum, J. L.; Bennett, W. F. D.; Tieleman, D. P. Distribution of Amino Acids in a Lipid Bilayer From Computer Simulations. Biophys. J. 2008, 94, 3393–3404. [Google Scholar] [CrossRef] [PubMed]
- Meyer, H. H. Zur Theorie Der Alkoholnarkose. Arch. Exp. Pathol. Pharmakol. 1899, 42, 109–118. [Google Scholar] [CrossRef]
- Overton, E. Über Die Osmotischen Eigenschaften Der Zelle in Ihrer Bedeutung Für Die Toxokologie Und Pharmakologie. Vjschr. Naturforsch. Ges. Zürich 1896, 41, 383. [Google Scholar]
- Al-Awqati, Q. One Hundred Years of Membrane Permeability: Does Overton Still Rule? Nat. Cell Biol. 1999, 1, E201–E202. [Google Scholar] [CrossRef]
- Boron, W. F. Sharpey-Schafer Lecture: Gas channels. Exp. Physiol. 2010, 95, 1107–1130. [Google Scholar] [CrossRef]
- Cooper, G.; Zhou, Y.; Bouyer, P.; Grichtchenko, I.; Boron, W. Transport of Volatile Solutes Through AQP1. J. Physiol. 2002, 542, 17–29. [Google Scholar] [CrossRef] [PubMed]
- Waisbren, S. J.; Geibel, J. P.; Modlin, I. M.; Boron, W. F. Unusual Permeability Properties of Gastric Gland Cells. Nature 1994, 368, 332–335. [Google Scholar] [CrossRef] [PubMed]
- Simon, S. A.; Gutknecht, J. Solubility of Carbon Dioxide in Lipid Bilayer Membranes and Organic Solvents. Biochim. Biophys. Acta 1980, 596, 352–8. [Google Scholar] [CrossRef]
- Föster, R. E.; Gros, G.; Lin, L.; Ono, Y.; Wunder, M. The Effect of 4,4’-diisothiocyanato-stilbene-2,2’-disulfonate on CO2 Permeability of the Red Blood Cell Membrane. Proc. Natl. Acad. Sci. USA 1998, 95, 15815–15820. [Google Scholar] [CrossRef]
- Widomska, J.; Raguz, M.; Subczynski, W. K. Oxygen Permeability of the Lipid Bilayer Membrane Made of Calf Lens. Biochim. Biophys. Acta 2007, 1768, 2635–2645. [Google Scholar] [CrossRef]
- Fischkoff, S.; Vanderkooi, J. Oxygen diffusion in biological and artificial membranes determined by the fluorochrome pyrene. J. Gen. Physiol. 1975, 65, 663–676. [Google Scholar] [CrossRef] [PubMed]
- Subczynski, W. K.; Hyde, J. S.; Kusumi, A. Oxygen Permeability of Phosphatidylcholine-cholesterol Membranes. Proc. Natl. Acad. Sci. USA 1989, 86, 4474–4478. [Google Scholar] [CrossRef]
- Subczynski, W. K.; Hyde, J. S.; Kusumi, A. Effects of Alkyl Chain Unsaturation and Cholesterol Intercalation on Oxygen Transport in Membranes: A Pulse ESR Spin Labeling Study. Biochemistry 1991, 30, 8578–8590. [Google Scholar] [CrossRef] [PubMed]
- Subczynski, W.; Hopwood, L.; Hyde, J. Is the Mammalian Cell Plasma Membrane a Barrier to Oxygen Transport? J. Gen. Physiol. 1992, 100, 69–87. [Google Scholar] [CrossRef]
- Xiang, T.-X.; Xu, Y.-H.; Anderson, B. D. The Barrier Domain for Solute Permeation Varies With Lipid Bilayer Phase Structure. J. Membr. Biol. 1998, 165, 77–90. [Google Scholar] [CrossRef]
- Uehlein, N.; Otto, B.; Eilingsfeld, A.; Itel, F.; Meier, W.; Kaldenhoff, R. Gas-tight Triblock-copolymer Membranes Are Converted to CO2 Permeable by Insertion of Plant Aquaporins. Sci. Rep. 2012, 2, 538. [Google Scholar] [CrossRef] [PubMed]
- Tsiavaliaris, G.; Itel, F.; Hedfalk, K.; Al-Samir, S.; Meier, W.; Gros, G.; Endeward, V. Low CO2 Permeability of Cholesterol-containing Liposomes Detected by Stopped-flow Fluorescence Spectrosopy. FASEB J. 2015, 29, 1780–1793. [Google Scholar] [CrossRef]
- Nakhoul, N. L.; Davis, B. A.; Romero, M. F.; Boron, W. F. Effect of Expressing the Water Channel Aquaporin-1 on the CO2 Permeability of Xenopus Oocytes. Am. J. Physiol. 1998, 274, C543–C548. [Google Scholar] [CrossRef]
- Prasad, G. V. T.; Coury, L.; Finn, F.; Zeidel, M. Reconstituted Aquaporin 1 Water Channels Transport CO2 Across Membranes. J. Biol. Chem. 1998, 273, 33123–33126. [Google Scholar] [CrossRef]
- Terashima, I.; Ono, K. Effects of HgCl2 on CO2 Dependence of Leaf Photosynthesis: Evidence Indicating Involvement of Aquaporins in CO2 Diffusion Across the Plasma Membrane. Plant Cell Physiol. 2002, 43, 70–78. [Google Scholar] [CrossRef] [PubMed]
- Uehlein, N.; Lovisolo, C.; Siefritz, F.; Kaldenhoff, R. The Tobacco Aquaporin NtAQP1 Is a Membrane CO2 Pore with Physiological Functions. Nature 2003, 425, 734–737. [Google Scholar] [CrossRef] [PubMed]
- Endeward, V.; Cartron, J.-P.; Ripoche, P.; Gros, G. RhAG Protein of the Rhesus Complex Is a CO2 Channel in Human Red Cell Membrane. FASEB J. 2008, 22, 64–73. [Google Scholar] [CrossRef] [PubMed]
- Musa-Aziz, R.; Chen, L.-M.; Pelletier, M. F.; Qin, X.; Boron, W. F. Relative CO2/NH3 selectivities in AQP1, AQP4, AQP5, AmtB, and RhAG. Proc. Natl. Acad. Sci. USA 2009, 106, 5406–5411. [Google Scholar] [CrossRef]
- Geyer, R. R.; Musa-Aziz, R.; Qin, X.; Boron, W. F. Relative CO2/NH3 selectivities of mammalian aquaporins 0-9. Am. J. Physiol. – Cell Physiol. 2013, 304, C985–C994. [Google Scholar] [CrossRef]
- Kai, L.; Kaldenhoff, R. A Refined Model of Water and CO2 Membrane Diffusion: Effects and Contribution of Sterols and Proteins. Sci. Rep. 2014, 4, 6665. [Google Scholar] [CrossRef]
- Missner, A.; Pohl, P. 100 Years of the Meyer-Overton Rule: Predicting Membrane Permeability of Gases and Other Small Compounds. Comput. Phys. Commun. 2009, 10, 1405–1414. [Google Scholar]
- Hulikova, A.; Swietach, P. CrossTalk Opposing View: Physiological CO2 Exchange Does Not Normally Depend on Membrane Channels. J. Physiol. 2015, 593, 5029–5032. [Google Scholar] [CrossRef]
- Boron, W. F.; Endeward, V.; Gros, G.; Musa-Aziz, R.; Pohl, P. Intrinsic CO2 Permeability of Cell Membranes and Potential Biological Relevance of CO2 Channels. ChemPhysChem 2011, 12, 1017–1019. [Google Scholar] [CrossRef]
- Endeward, V.; Al-Samir, S.; Itel, F.; Gros, G. How does carbon dioxide permeate cell membranes? A discussion of concepts, results and methods. Front. Physiol. 2014, 4, 1–21. [Google Scholar] [CrossRef]
- Bemporad, D.; Luttmann, C.; Essex, J. W. Permeation of Small Molecules Through a Lipid Bilayer: A Computer Simulation Study. J. Phys. Chem. B 2004, 108, 4875–4884. [Google Scholar] [CrossRef]
- Lee, C. T.; Comer, J.; Herndon, C.; Leung, N.; Pavlova, A.; Swift, R. V.; Tung, C.; Rowley, C. N.; Amaro, R. E.; Chipot, C. et al. Simulation-based Approaches for Determining Membrane Permeability of Small Compounds. J. Chem. Inf. Model. 2016, 56, 721–733. [Google Scholar] [CrossRef]
- De Vos, O.; Venable, R. M.; Van Hecke, T.; Hummer, G.; Pastor, R. W.; Ghysels, A. Membrane Permeability: Characteristic Times and Lengths for Oxygen and a Simulation-Based Test of the Inhomogeneous Solubility-Diffusion Model. J. Chem. Theory Comput. 2018, 14, 3811–3824. [Google Scholar] [CrossRef]
- Adams, M.; Wang, E.; Zhuang, X.; Klauda, J. B. Simulations of Simple Bovine and Homo Sapiens Outer Cortex Ocular Lens Membrane Models. Biochim. Biophys. Acta, Biomembr. 2018, 1860, 2134–2144. [Google Scholar] [CrossRef]
- Wang, E.; Klauda, J. B. Examination of Mixtures Containing Sphingomyelin and Cholesterol by Molecular Dynamics Simulations. J. Phys. Chem. B 2017, 121, 4833–4844. [Google Scholar] [CrossRef] [PubMed]
- Bera, I.; Klauda, J. B. Molecular Simulations of Mixed Lipid Bilayers with Sphingomyelin, Glycerophospholipids, and Cholesterol. J. Phys. Chem. B 2017, 121, 5197–5208. [Google Scholar] [CrossRef]
- Ikonen, E. Cellular Cholesterol Trafficking and Compartmentalization. Nat. Rev. Mol. Cell Biol. 2008, 9, 125–138. [Google Scholar] [CrossRef] [PubMed]
- Subczynski, W. K.; Raguz, M.; Widomska, J.; Mainali, L.; Konovalov, A. Functions of Cholesterol and the Cholesterol Bilayer Domain Specific to the Fiber-Cell Plasma Membrane of the Eye Lens. J. Membr. Biol. 2012, 245, 51–60. [Google Scholar] [CrossRef]
- Ramstedt, B.; Slotte, J. P. Membrane Properties of Sphingomyelins. FEBS Lett. 2002, 531, 33–37. [Google Scholar] [CrossRef]
- Mainali, L.; Raguz, M.; O’Brien, W. J.; Subczynski, W. K. Properties of Membranes Derived From the Total Lipids Extracted From the Human Lens Cortex and Nucleus. Biochim. Biophys. Acta, Biomembr. 2013, 1828, 1432–1440. [Google Scholar] [CrossRef]
- Veath, S. L.; Ivan, V. P.; Gawrisch, K.; Keller, S. L. Liquid Domains in Vesicles Investigated by NMR and Fluorescence Microscopy. Biophys. J. 2004, 86, 2910–2922. [Google Scholar] [CrossRef]
- Sodt, A. J.; Sander, M. L.; Gawrisch, K.; Pastor, R. W.; Lyman, E. The Molecular Structure of the Liquid-Ordered Phase of Lipid Bilayers. J. Am. Chem. Soc. 2014, 136, 725–732. [Google Scholar] [CrossRef] [PubMed]
- Xu, X.; London, E. The Effect of Sterol Structure on Membrane Lipid Domains Reveals How Cholesterol Can Induce Lipid Domain Formation. Biochemistry 2000, 39, 843–849. [Google Scholar] [CrossRef] [PubMed]
- Veath, S. L.; Keller, S. L. Separation of Liquid Phases in Giant Vesciles of Ternary Mixtures of Phospholipids and Cholesterol. Biophys. J. 2003, 85, 3074–3083. [Google Scholar] [CrossRef] [PubMed]
- Heberle, F. A.; Wu, J.; Goh, S. L.; Petruzielo, R. S.; Feigenson, G. W. Comparison of Three Ternary Lipid Bilayer Mixtures: FRET and ESR Reveal Nanodomains. Biophys. J. 2010, 99, 3309–3318. [Google Scholar] [CrossRef]
- Brown, D. A.; London, E. Functions of Lipid Rafts in Biological Membranes. Annu. Rev. Cell. Dev. Biol. 1998, 14, 111–136. [Google Scholar] [CrossRef]
- Simons, K.; Ikonen, E. Functional Rafts in Cell Membranes. Nature 1997, 387, 569–572. [Google Scholar] [CrossRef]
- Simons, K.; Ikonen, E. How Cells Handle Cholesterol. Science 2000, 290, 1721–1726. [Google Scholar] [CrossRef]
- Sezgin, E.; Levental, I.; Mayor, S.; Eggeling, C. The Mystery of Membrane Organization: Composition, Regulation and Roles of Lipid Rafts. Nat. Rev. Mol. Cell Biol. 2017, 18, 361–374. [Google Scholar] [CrossRef] [PubMed]
- Hong, C.; Tieleman, D. P.; Wang, Y. Microsecond Molecular Dynamics Simulations of Lipid Mixing. Langmuir 2014, 30, 11993–12001. [Google Scholar] [CrossRef] [PubMed]
- Saito, H.; Shinoda, W. Cholesterol Effects on Water Permeability Through DPPC and PSM Lipid Bilayers: A Molecular Dynamics Study. J. Phys. Chem. B 2011, 115, 15241–15250. [Google Scholar] [CrossRef] [PubMed]
- Hub, J. S.; Winkler, F. K.; Merrick, M.; de Groot, B. L. Potentials of Mean Force and Permeabilities for Carbon Dioxide, Ammonia, and Water Flux Across a Rhesus Protein Channel and Lipid Membranes. J. Am. Chem. Soc. 2010, 132, 13251–13263. [Google Scholar] [CrossRef]
- Wennberg, C. L.; van der Spoel, D.; Hub, J. S. Large Influence of Cholesterol on Solute Partitioning into Lipid Membranes. J. Am. Chem. Soc. 2012, 134, 5351–5361. [Google Scholar] [CrossRef]
- Zocher, F.; van der Spoel, D.; Pohl, P.; Hub, J. S. Local partition coefficients govern solute permeability of cholesterol-containing membranes. Biophys. J. 2013, 105, 2760–2770. [Google Scholar] [CrossRef]
- Dotson, R. J.; Smith, C. R.; Bueche, K.; Angles, G.; Pias, S. C. Influences of Cholesterol on the Oxygen Permeability of Membranes: Insight From Atomistic Simulations. Biophys. J. 2017, 112, 2336–2347. [Google Scholar] [CrossRef]
- Jo, S.; Kim, T.; Iyer, V. G.; Im, W. CHARMM-GUI: a Web-based Graphical User Interface for CHARMM. J. Comput. Chem. 2008, 29, 1859–1865. [Google Scholar] [CrossRef]
- MacKerell, Jr., A. D.; Bashford, D.; Bellott, M.; Dunbrack, Jr., R. L.; Evanseck, J. D.; Field, M. J.; Fischer, S.; Gao, J.; Guo, H.; Ha, S. et al. All-atom Empirical Potential for Molecular Modeling and Dynamics Studies of Proteins. J. Phys. Chem. B 1998, 102, 3586–3616. [Google Scholar] [CrossRef]
- Klauda, J. B.; Venable, R. M.; Freites, J. A.; O’Connor, J. W.; Tobias, D. J.; Mondragon-Ramirez, C.; Vorobyov, I.; MacKerell Jr., A. D.; Pastor, R. W. Update of the CHARMM All-atom Additive Force Field for Lipids: Validation on Six Lipid Types. J. Phys. Chem. B 2010, 114, 7830–7843. [Google Scholar] [CrossRef]
- Lim, J. B.; Rogaski, B.; Klauda, J. B. Update of the Cholesterol Force Field Parameters in CHARMM. J. Phys. Chem. B 2012, 116, 203–210. [Google Scholar] [CrossRef]
- Venable, R. M.; Sodt, A. J.; Rogaski, B.; Rui, H.; Hatcher, E.; MacKerrell Jr., A. D.; Pastor, R. W.; Klauda, J. B. CHARMM All-Atom Additive Force Field for Sphingomyelin: Elucidation of Hydrogen Bonding and of Positive Curvature. Biophys. J. 2014, 107, 134–145. [Google Scholar] [CrossRef]
- Phillips, J. C.; Braun, R.; Wang, W.; Gumbart, J.; Tajkhorshid, E.; Villa, E.; Chipot, C.; Skeel, R. D.; Kale, L.; Schulten, K. Scalable Molecular Dynamics with NAMD. J. Comput. Chem. 2005, 26, 1781–1802. [Google Scholar] [CrossRef]
- Phillips, J. C.; Hardy, D. J.; Maia, J. D. C.; Stone, J. E.; Ribeiro, J. V.; Bernardi, R. C.; Buch, R.; Fiorin, G.; Hénin, J.; Jiang, W. et al. Scalable Molecular Dynamics on CPU and GPU Architectures with NAMD. J. Chem. Phys. 2020, 153, 044130. [Google Scholar] [CrossRef]
- Best, R. B.; Zhu, X.; Shim, J.; Lopes, P. E. M.; Mittal, J.; Feig, M.; MacKerell, A. D. Optimization of the Additive CHARMM All-atom Protein Force Field Targeting Improved Sampling of the Backbone ϕ, ψ and Side-chain χ1 and χ2 Dihedral Angles. J. Chem. Theory Comput. 2012, 8, 3257–3273. [Google Scholar] [CrossRef]
- Darden, T.; York, D.; Pedersen, L. G. Particle Mesh Ewald: An N·log(N) Method for Ewald Sums in Large Systems. J. Chem. Phys. 1993, 98, 10089–10092. [Google Scholar] [CrossRef]
- Martyna, G. J.; Tobias, D. J.; Klein, M. L. Constant Pressure Molecular Dynamics Algorithms. J. Chem. Phys. 1994, 101, 4177–4189. [Google Scholar] [CrossRef]
- Feller, S. E.; Zhang, Y.; Pastor, R. W.; Brooks, B. R. Constant Pressure Molecular Dynamics Simulation: The Langevin Piston Method. J. Chem. Phys. 1995, 103, 4613–4621. [Google Scholar] [CrossRef]
- Ryckaert, J.-P.; Ciccotti, G.; Berendsen, H. J. C. Numerical Integration of the Cartesian Equations of Motion of a System With Constraints: Molecular Dynamics of N-Alkanes. J. Comp. Phys. 1977, 23, 327–341. [Google Scholar] [CrossRef]
- Vermeer, L. S.; de Groot, B. L.; Réat, V.; Milon, A.; Czaplicki, J. Acyl Chain Order Parameter Profiles in Phosphopholipid Bilayers: Computation From Molecular Dynamics Simulations and Comparison with 2H NMR Experiments. Eur. Biophys. J. 2007, 36, 919–931. [Google Scholar] [CrossRef] [PubMed]
- Gapsys, V.; de Groot, B. L.; Briones, R. Computational Analysis of Local Membrane Properties. J. Comp.-Aided Mol. Design 2013, 27, 845–858. [Google Scholar] [CrossRef]
- Hofsäß, C.; Lindahl, E.; Edholm, O. Molecular Dynamics Simulations of Phospholipid Bilayers with Cholestrol. Biophys. J. 2003, 84, 2192–2206. [Google Scholar] [CrossRef]
- Lindbolm, G.; Orädd, G. Lipid Lateral Diffusion and Membrane Heterogeneity. Biochim. Biophys. Acta 2009, 1788, 234–244. [Google Scholar] [CrossRef]
- Molugu, T. R.; Lee, S.; Brown, M. F. Concepts and Methods of Solid-State NMR Spectroscopy Applied to Biomembranes. Chem. Rev. 2017, 117, 12087–12131. [Google Scholar] [CrossRef] [PubMed]
- Finkelstein, A. Water Movement Through Lipid Bilayers, Pores, and Plasma Membranes; John Wiley & Sons: New York, 1987. [Google Scholar]
- Diamond, J. M.; Katz, Y. Interpretation of Nonelectrolyte Partition Coefficients Between Dimyristoyl Lecithin and Water. J. Membrane Biol. 1974, 17, 121–154. [Google Scholar] [CrossRef]
- Chipot, C.; Comer, J. Subdiffusion in Membrane Permeation of Small Molecules. Sci. Rep. 2016, 6, 35913. [Google Scholar] [CrossRef] [PubMed]
- Arsov, Z.; Gonzalez-Ramirez, E. J.; Goni, F. M.; Tristram-Nagle, S.; Nagle, J. F. Phase Behavior of Palmitoyl and Egg Sphingomyelin. 2018, 213, 102–110.
- Sodt, A. J.; Pastor, R. W.; Lyman, E. Hexagonal Substructure and Hydrogen Bonding in Liquid-Ordered Phases Containing Palmitoyl Sphingomyelin. Biophys. J. 2015, 109, 948–955. [Google Scholar] [CrossRef] [PubMed]
- Mahinthichaichan, P.; Gennis, R.; Tajkhorshid, E. All the O2 Consumed by Thermus thermophilus Cytochrome ba3 Is Delivered to the Active Site Through a Long, Open Hydrophobic Tunnel with Entrances Within the Lipid Bilayer. Biochemistry 2016, 55, 1265–1278. [Google Scholar] [CrossRef]
- Wang, Y.; Shaikh, S. A.; Tajkhorshid, E. Exploring Transmembrane Diffusion Pathways with Molecular Dynamics. Physiology 2010, 25, 142–154. [Google Scholar] [CrossRef]
- Wang, Y.; Cohen, J.; Boron, W. F.; Schulten, K.; Tajkhorshid, E. Exploring Gas Permeability of Cellular Membranes and Membrane Channels with Molecular Dynamics. J. Struct. Biol. 2007, 157, 534–544. [Google Scholar] [CrossRef]
Figure 1.
Representative lipids in biological membranes. Glycerophospholipids contain a diacylglycerol backbone attached to a phosphate head group. 1-palmitoyl-2-oleoyl-sn-glycero-3-phosphocholine (POPC) and 1-palmitoyl-2-oleoyl-sn-glycero-3-phosphoethanolamine (POPE) are among the common glycerophospholipids found in living cells. Cholesterol (CHL) is constituted of a planar steroid ring, decorated by two methyl group at C10 and C13, a hydroxyl group at C3, and an 8-carbon aliphatic tail at C17. Sphingomyelin (SM), a type of sphingolipid found in animal cells, contains the phosphocholine head group attached to the sphingosine chain (-chain) and an amide-linked acyl chain (-chain). Palmitoylsphingomyelin (PSM) is the most computationally and structurally studied sphingomyelin and has a similar size to a POPC. Its or sphingosine chain (1,3-dihydroxy-2-amino-4-octadecene) contains a trans double bond between C4 and C5, and a hydroxyl group attached to C3. It is the most common base in mammalian sphingomyelins. Its or acyl chain is a saturated hydrocarbon tail composed of 16 carbon atoms. These structural features of SMs allow its interfacial region between the head group and the hydrophobic tails to act as both hydrogen bond donor and acceptor, whereas the one of glycerophospholipids can only act as hydrogen bond acceptor. Atomic images of POPC, POPE, CHL and PSM lipids are shown in the top panel, and chemical structures are shown in the bottom panel.
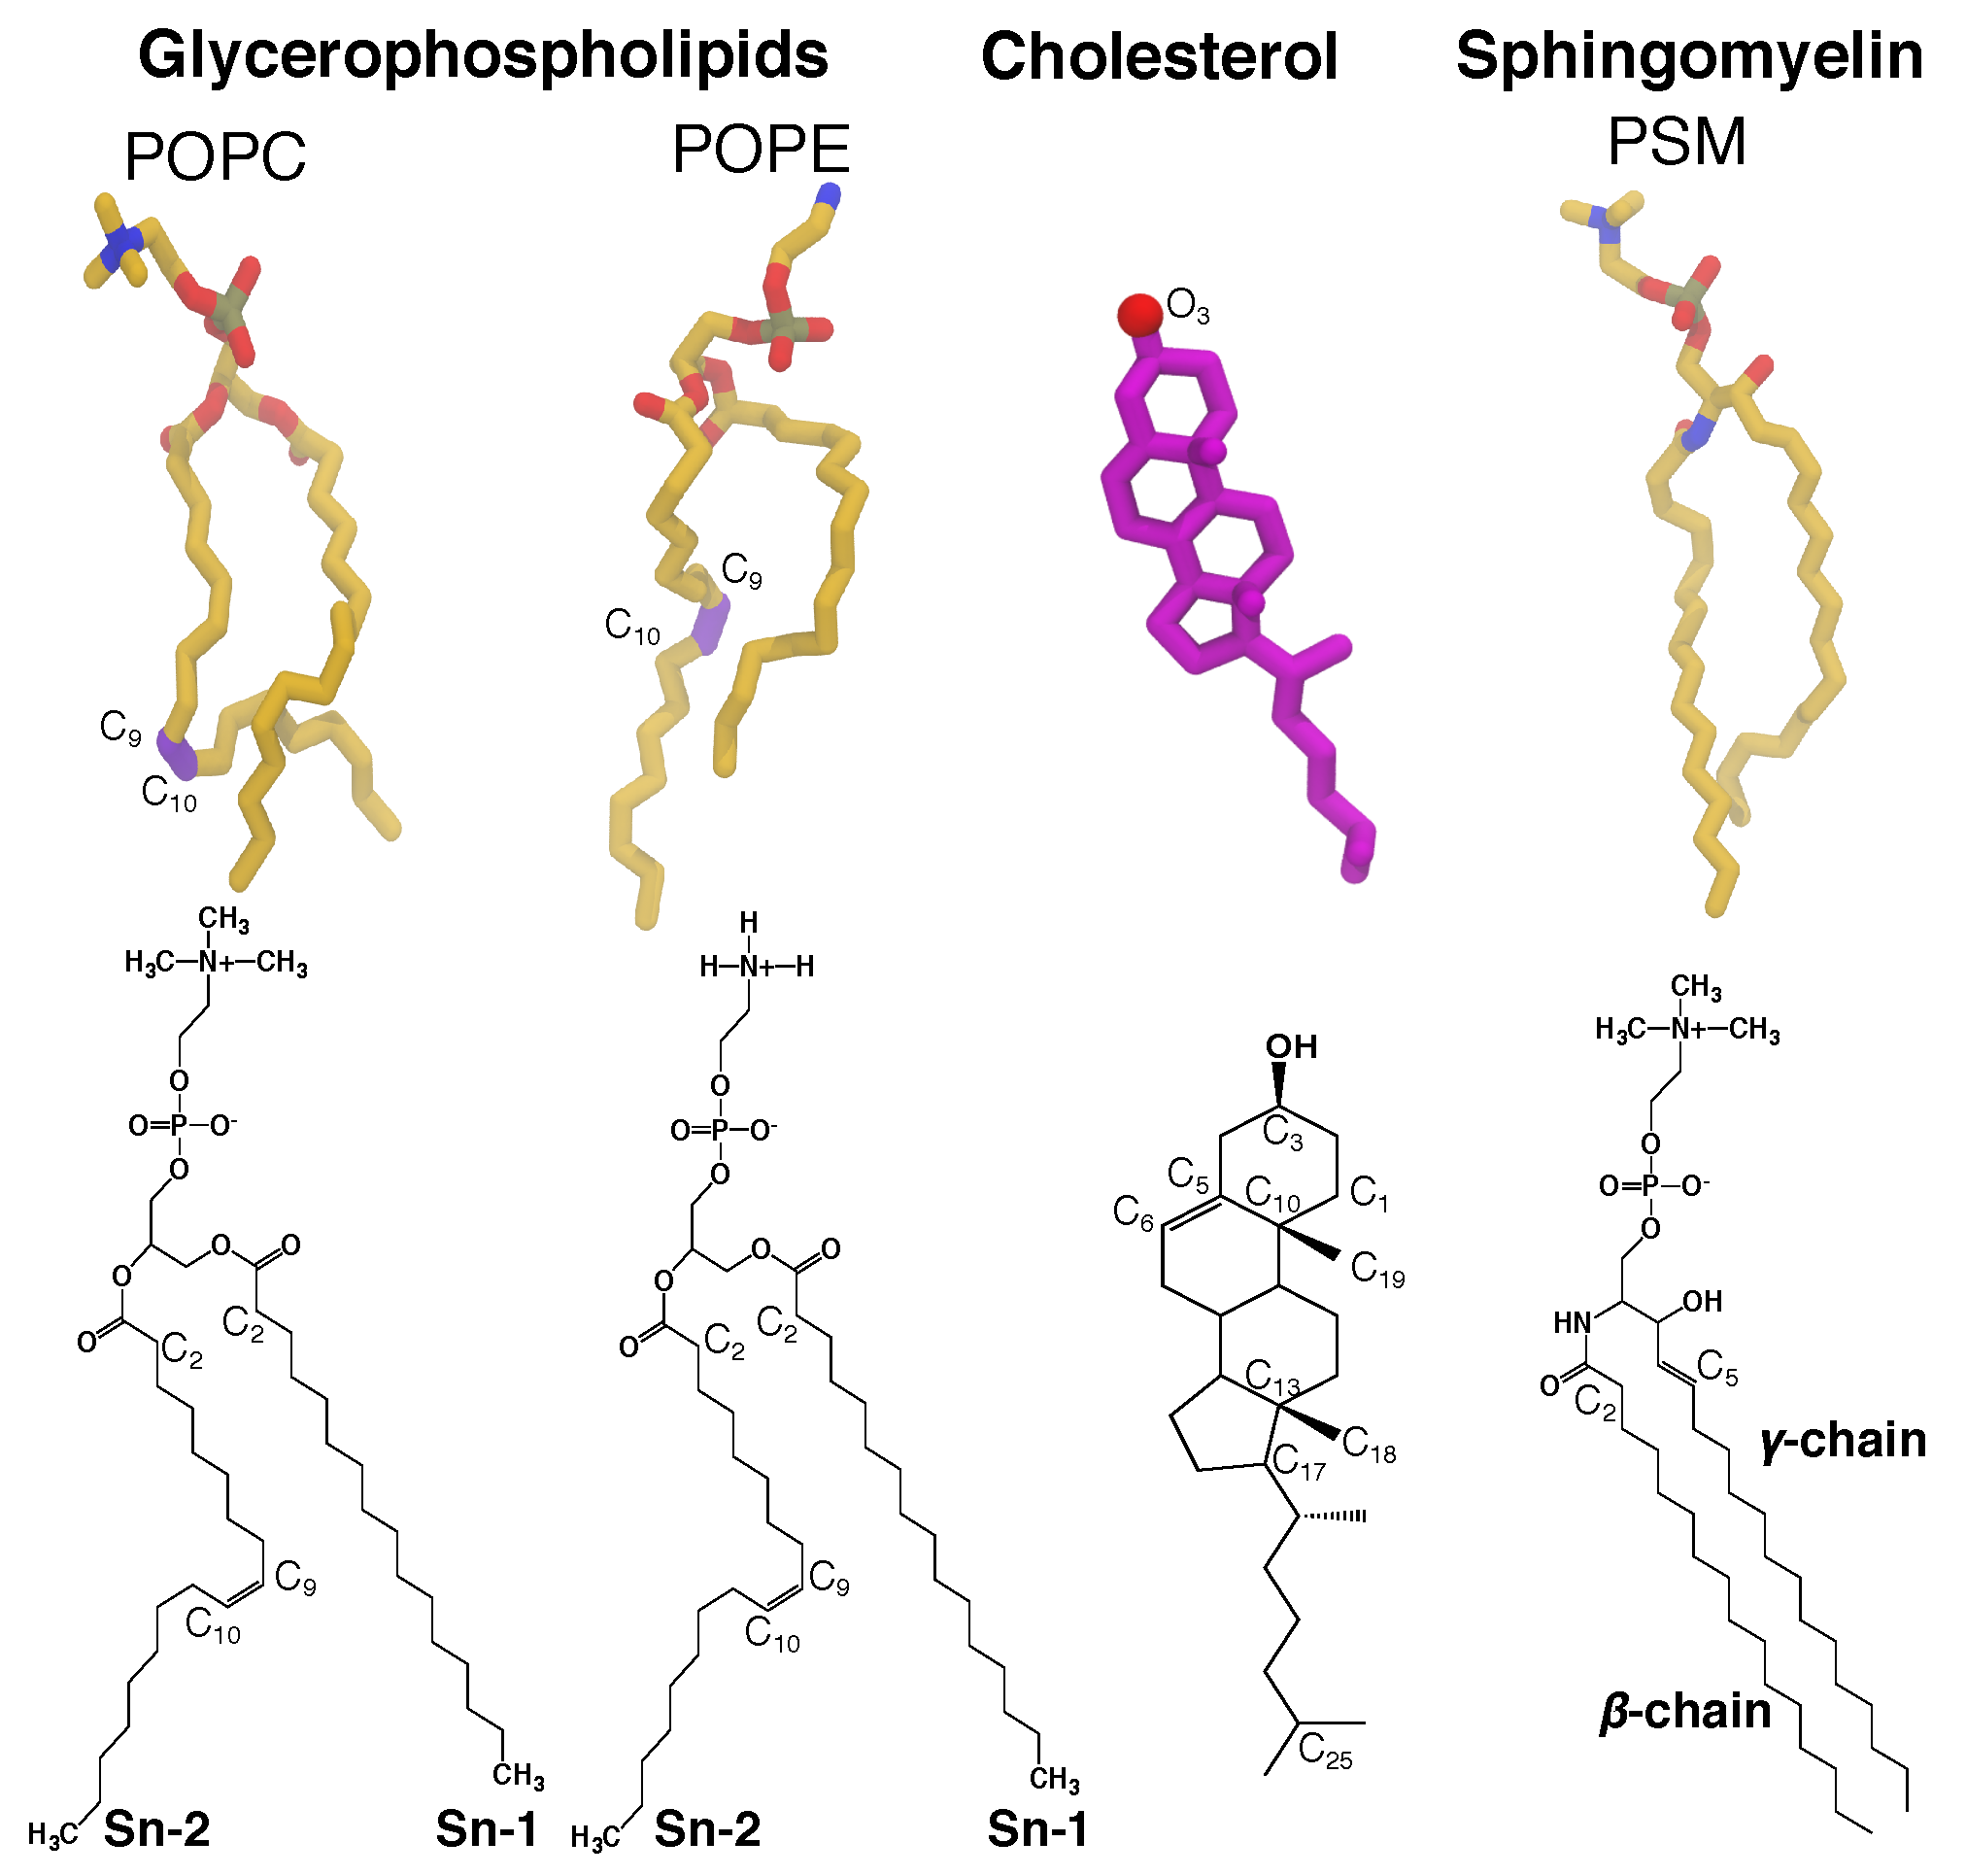
Figure 2.
Atomic profiles of membrane constituents (lipids and water). Water occupancy in the bulk was used to normalize the profiles. The intersection points of water and lipid profiles mark the water-lipid interfaces, where the phosphocholine head groups are located.
Figure 2.
Atomic profiles of membrane constituents (lipids and water). Water occupancy in the bulk was used to normalize the profiles. The intersection points of water and lipid profiles mark the water-lipid interfaces, where the phosphocholine head groups are located.
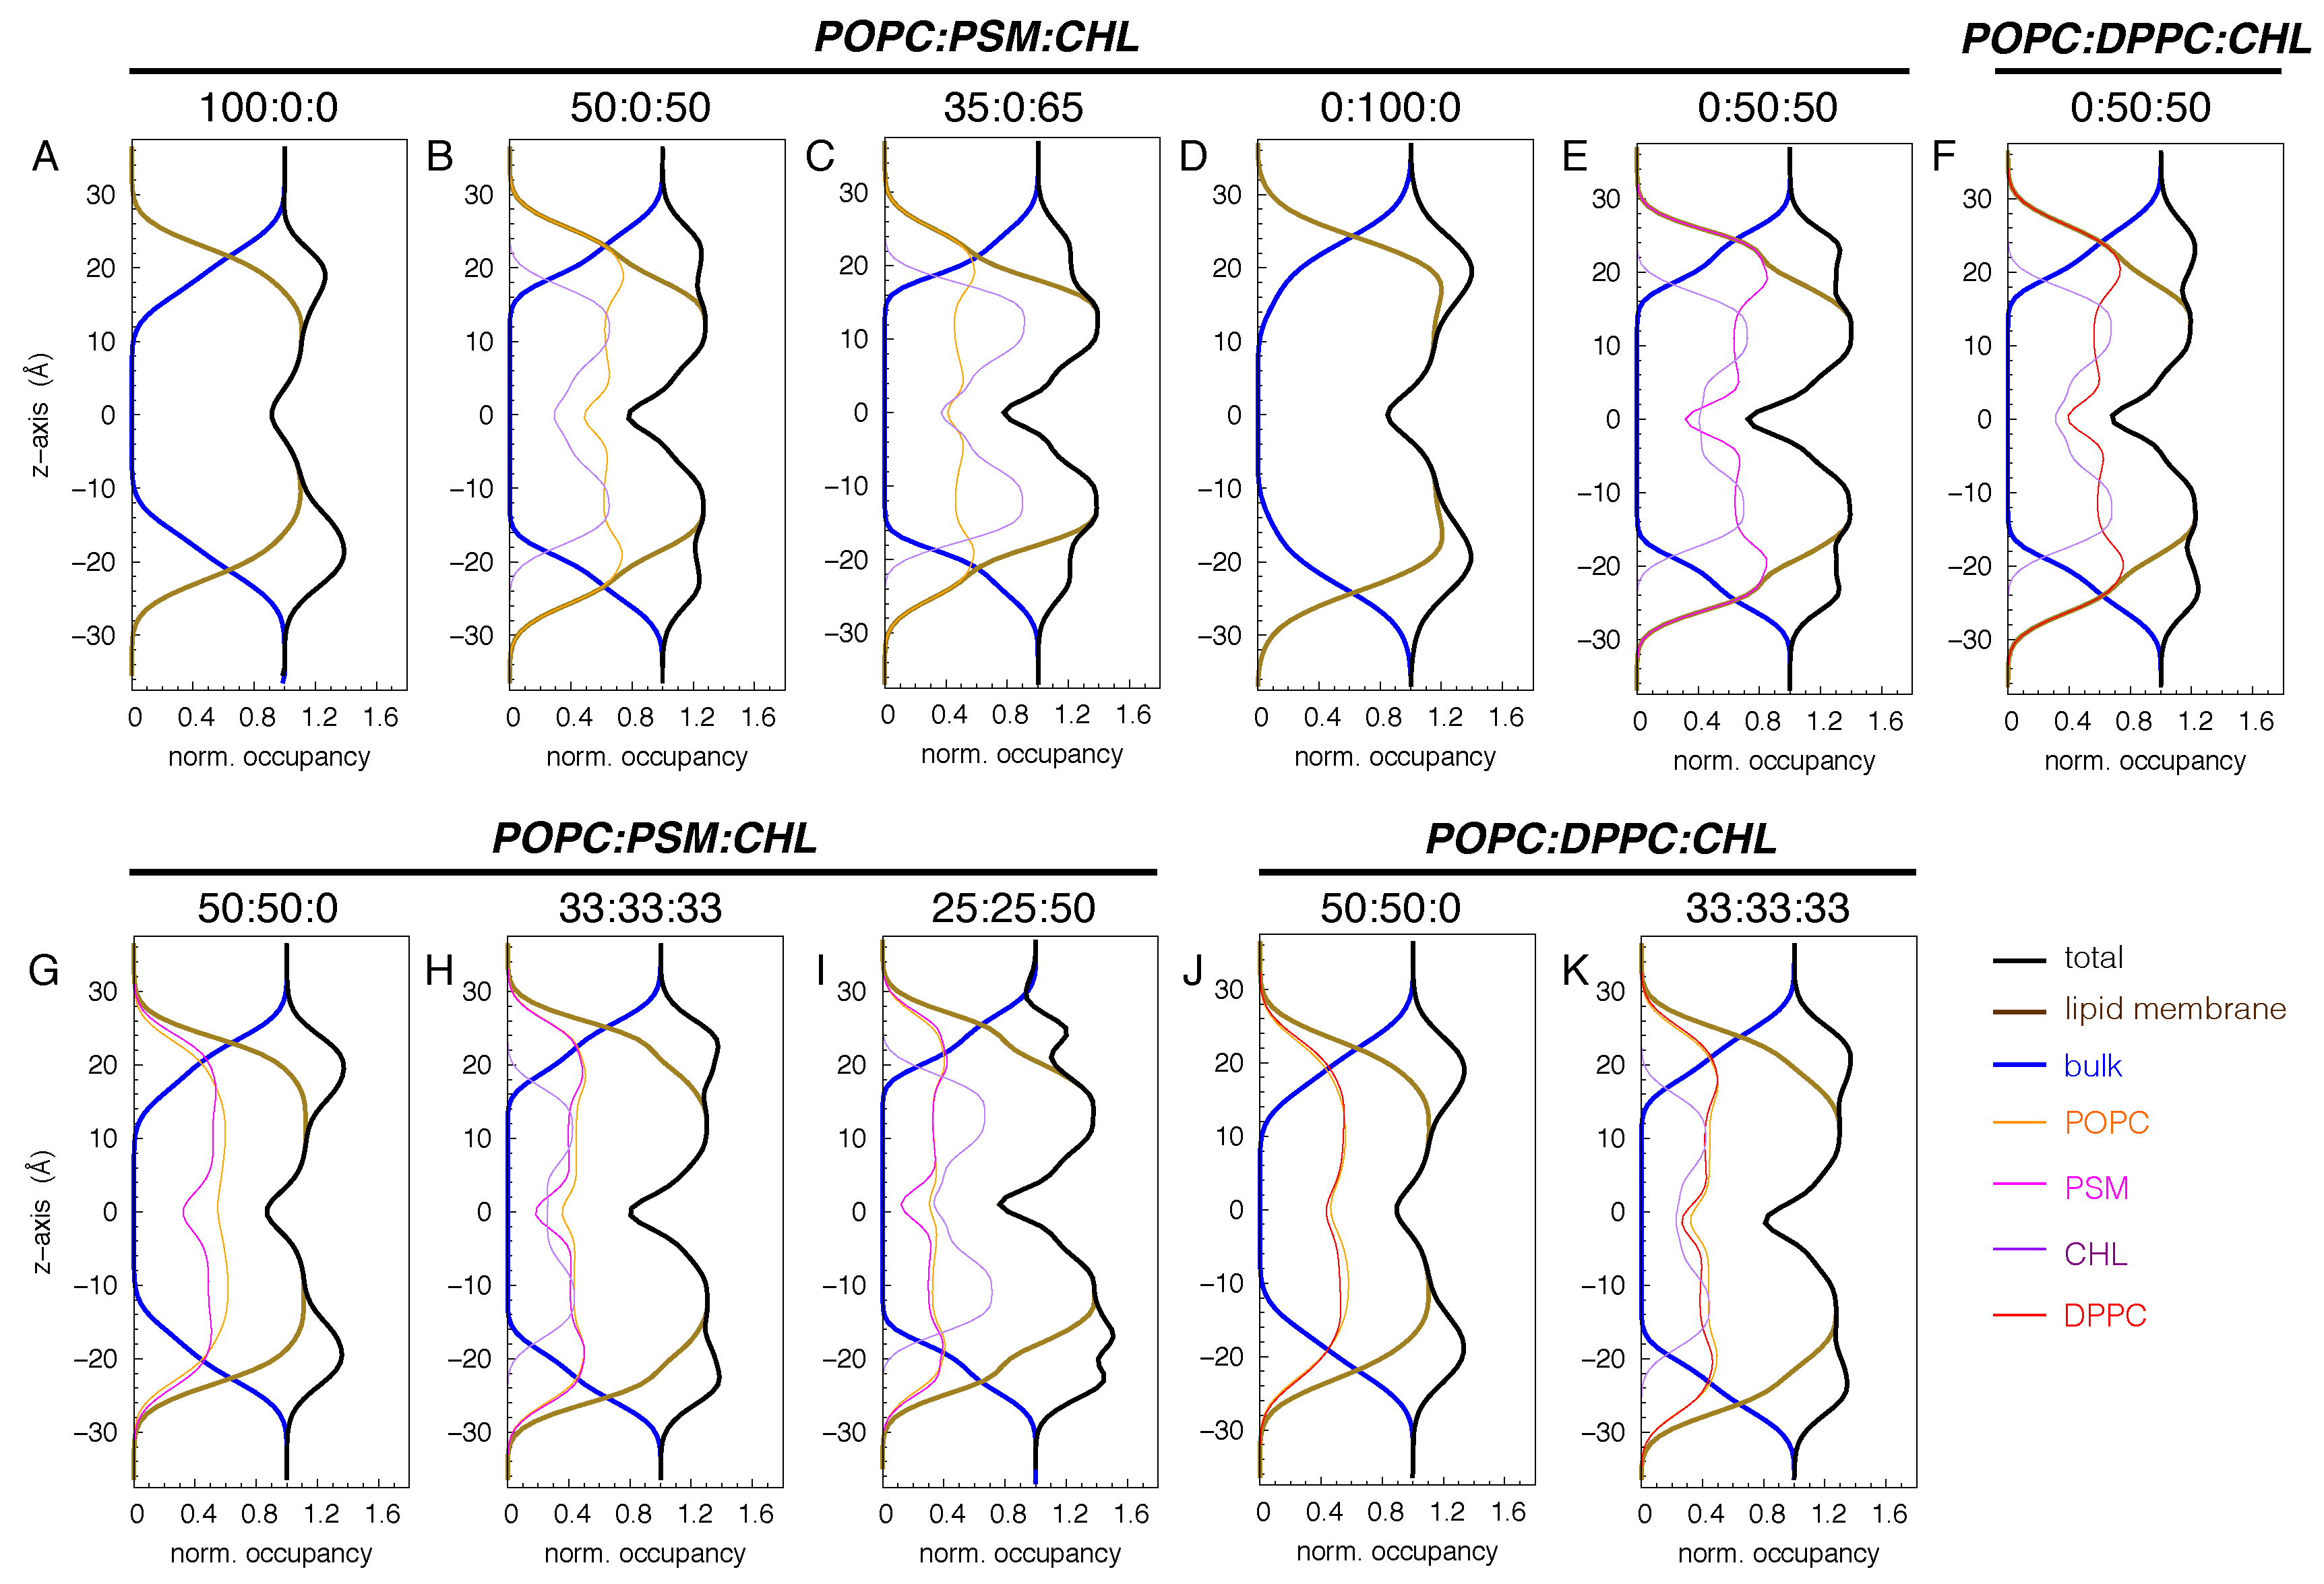
Figure 3.
Membrane structures with different membrane lipid compositions and gas distributions. Membrane systems are labeled based on POPC:PSM:CHL or POPC:DPPC:CHL mole percentage. Lipid molecules are shown in the licorice representation. Oxygen atoms are shown as red balls. Carbon atoms of POPC and PSM lipids are shown in yellow, and those of CHL molecules are shown in purple. CO2 molecules, shown in space-filling with carbon atoms as cyan balls and oxygen atoms as red balls, are the representatives of gases in this figure.
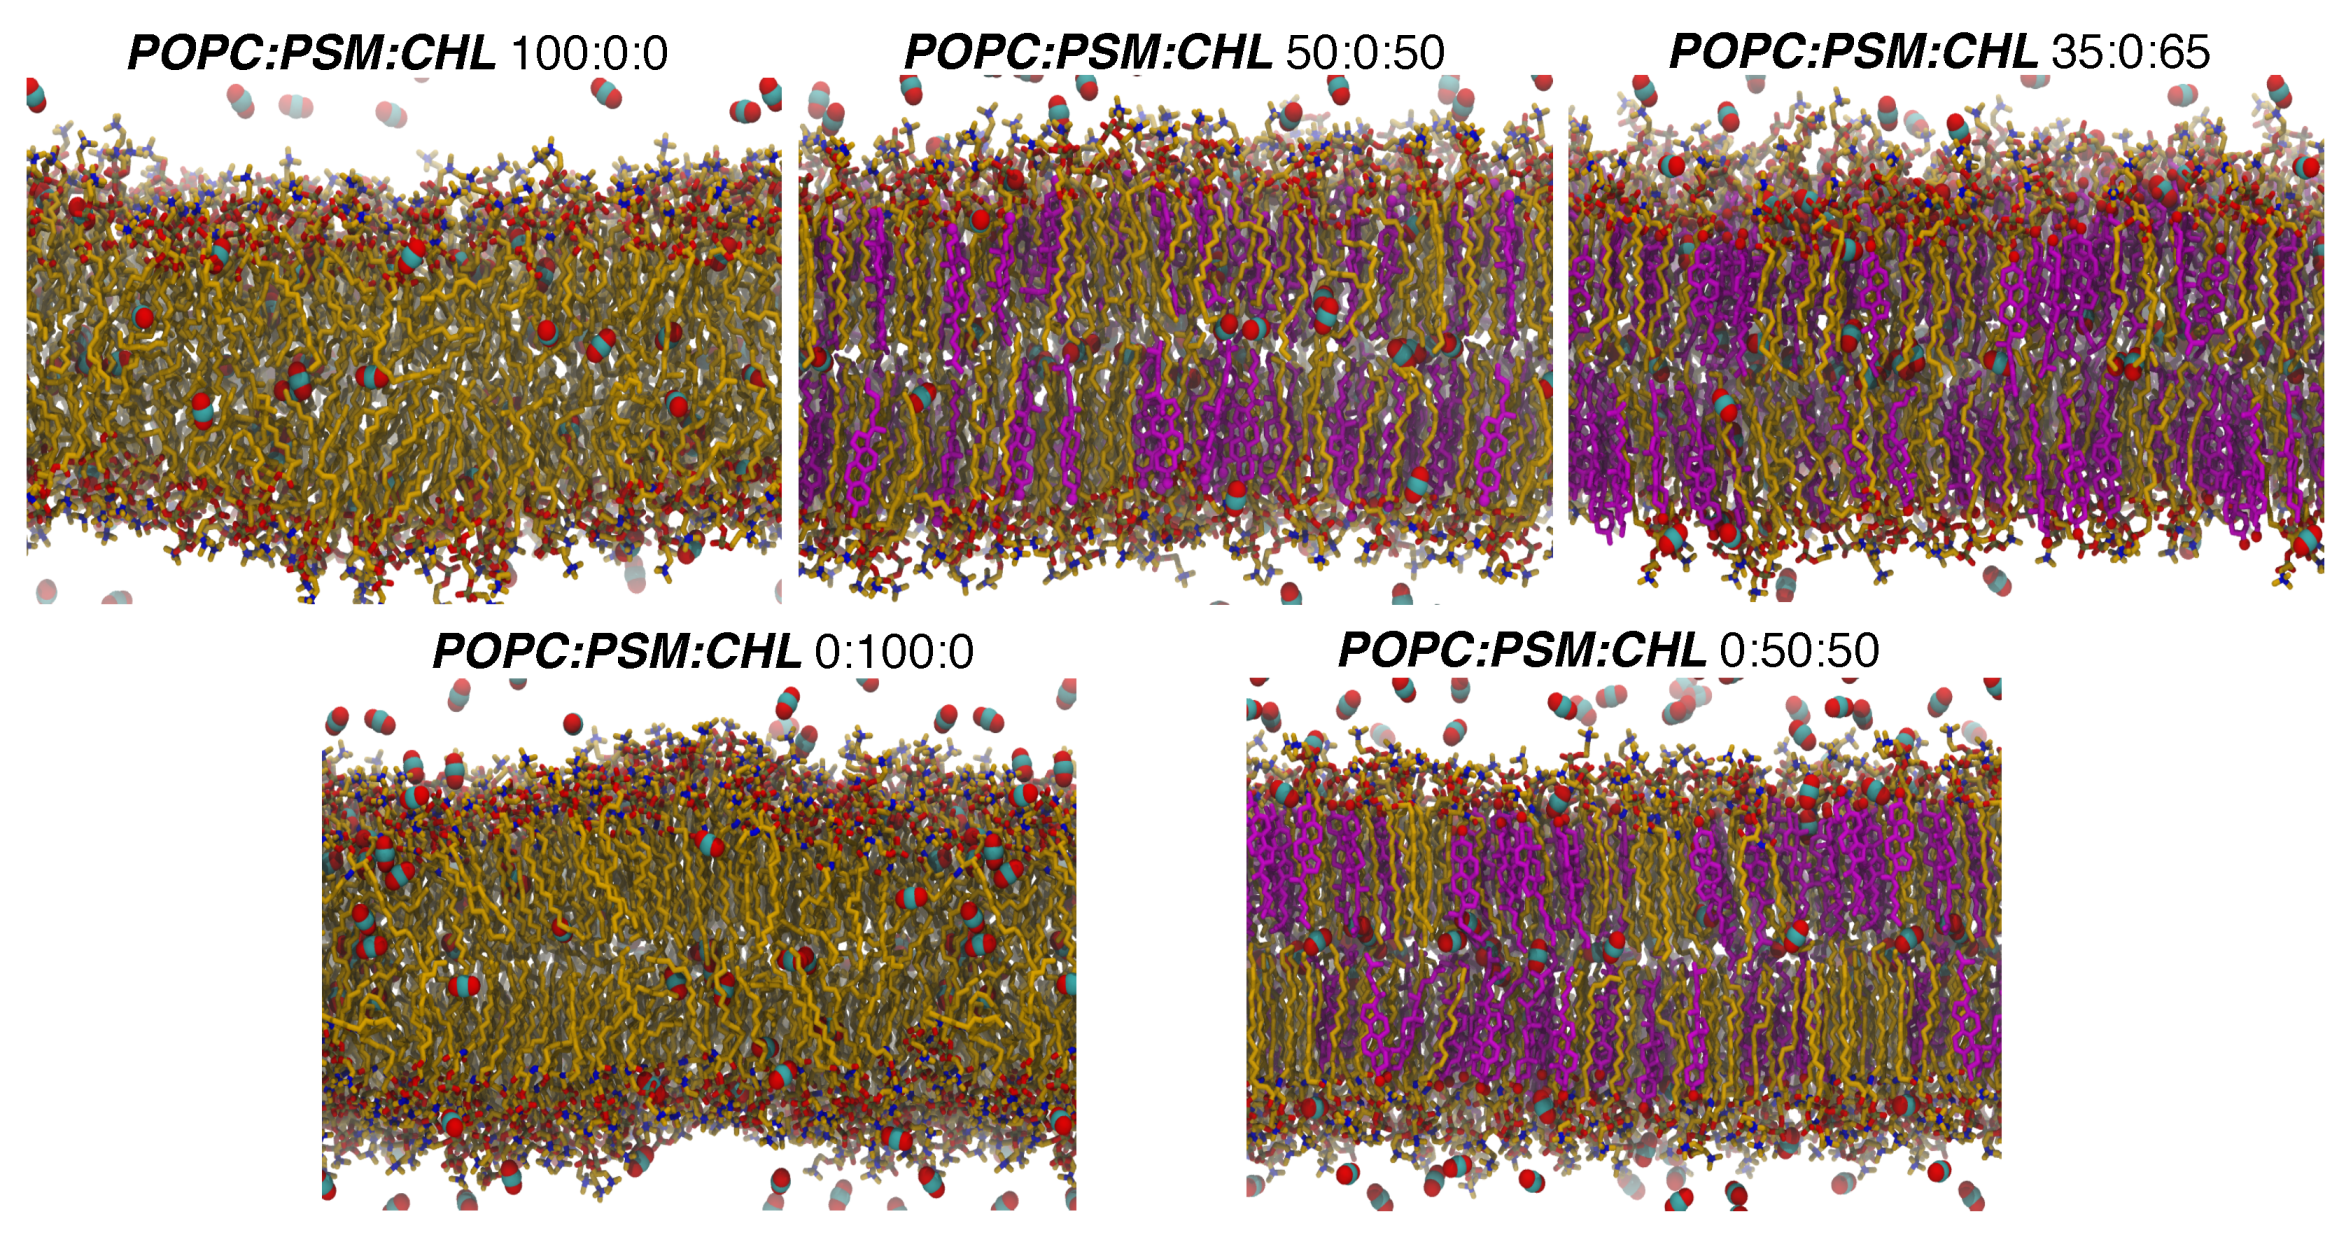
Figure 4.
Deuterium order parameters () illustrating the dynamics of POPC oleoyl and palmitoyl chains (A), PSM sphingosine and acyl chains (B), and DPPC sn-1 and sn-2 chains (C). , where is the angle between the membrane normal and a selected C-H bond vector. can also been calculated from quadrupolar splittings determined from 2H-NMR experiments [70,71,72,73,74]. Lipid chains are completely disordered or conformationally isotropic when , and this is when they are oriented at the magic angle with respect to the magnetic field. The chains are perfectly in order or in the extended all-trans conformation when -SCD = 0.5.
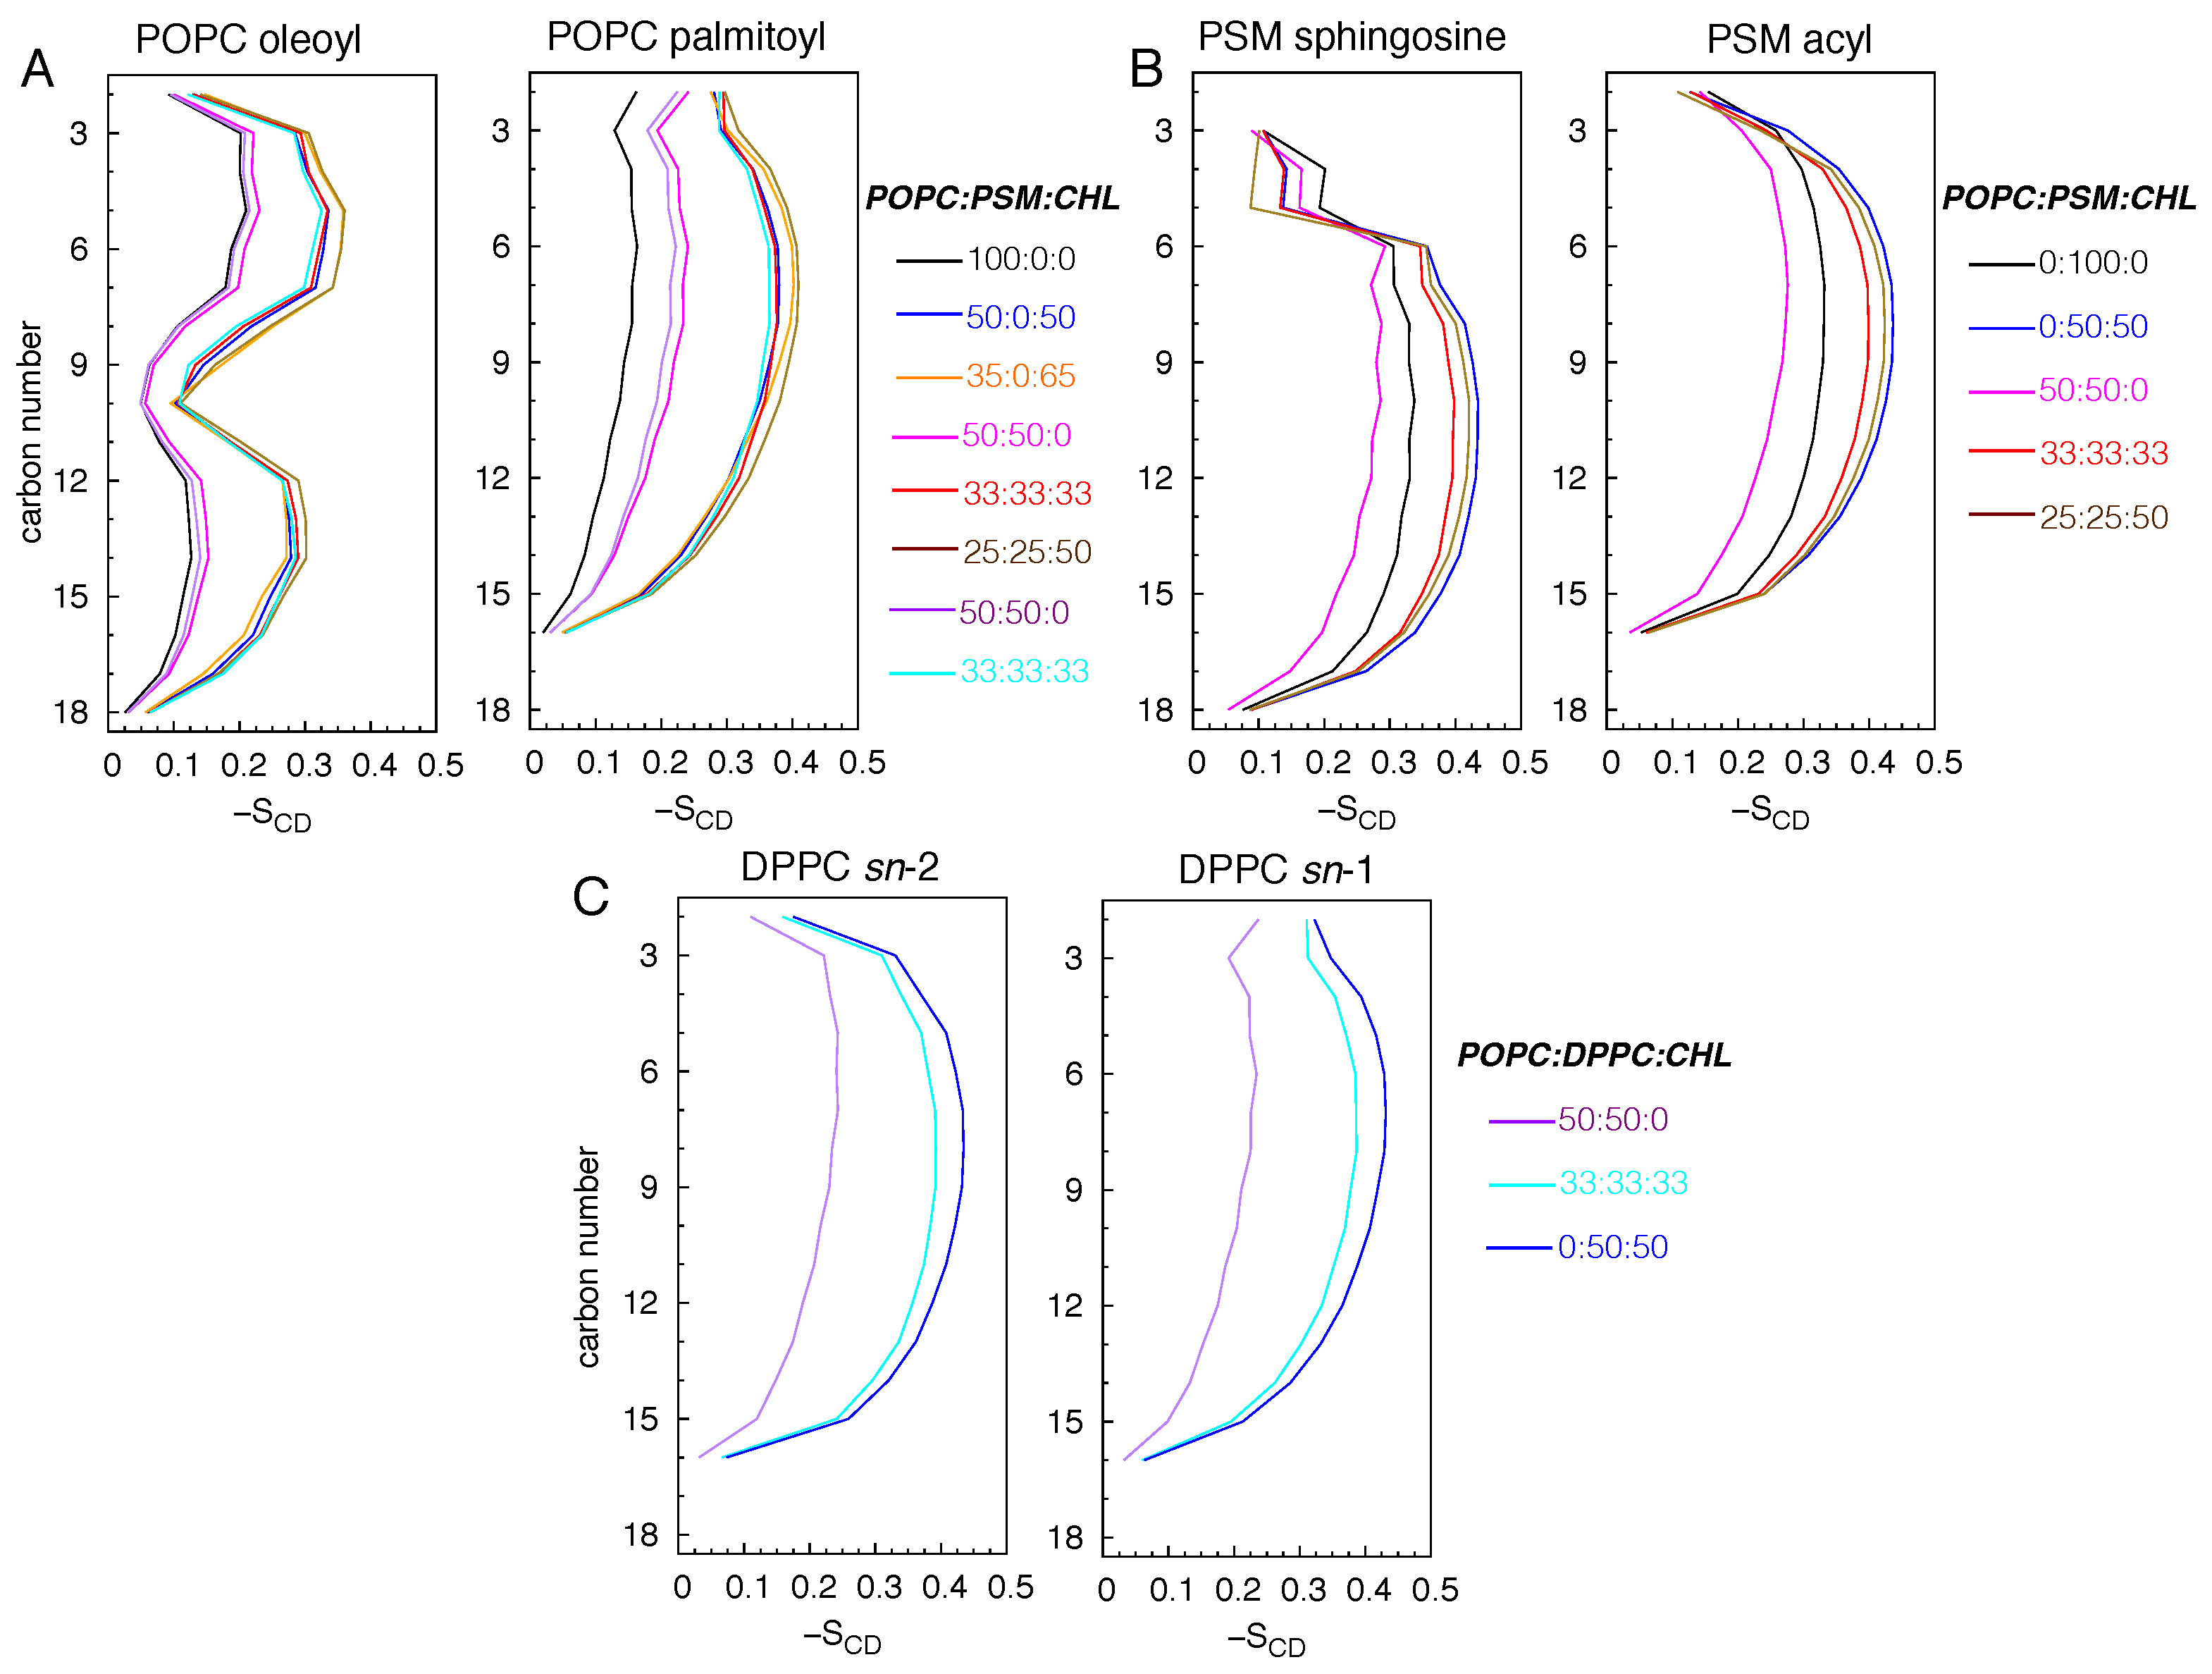
Figure 5.
Tilting of fatty acid chains. is the angle between the vector connecting the C2 and C16 atoms and the membrane normal (0, 0, 1) for the upper leaflet and (0, 0, -1) for the lower leaflet. Solid lines correspond to the distributions in the upper leaflet, whereas dashed lines correspond to those in the lower leaflets.
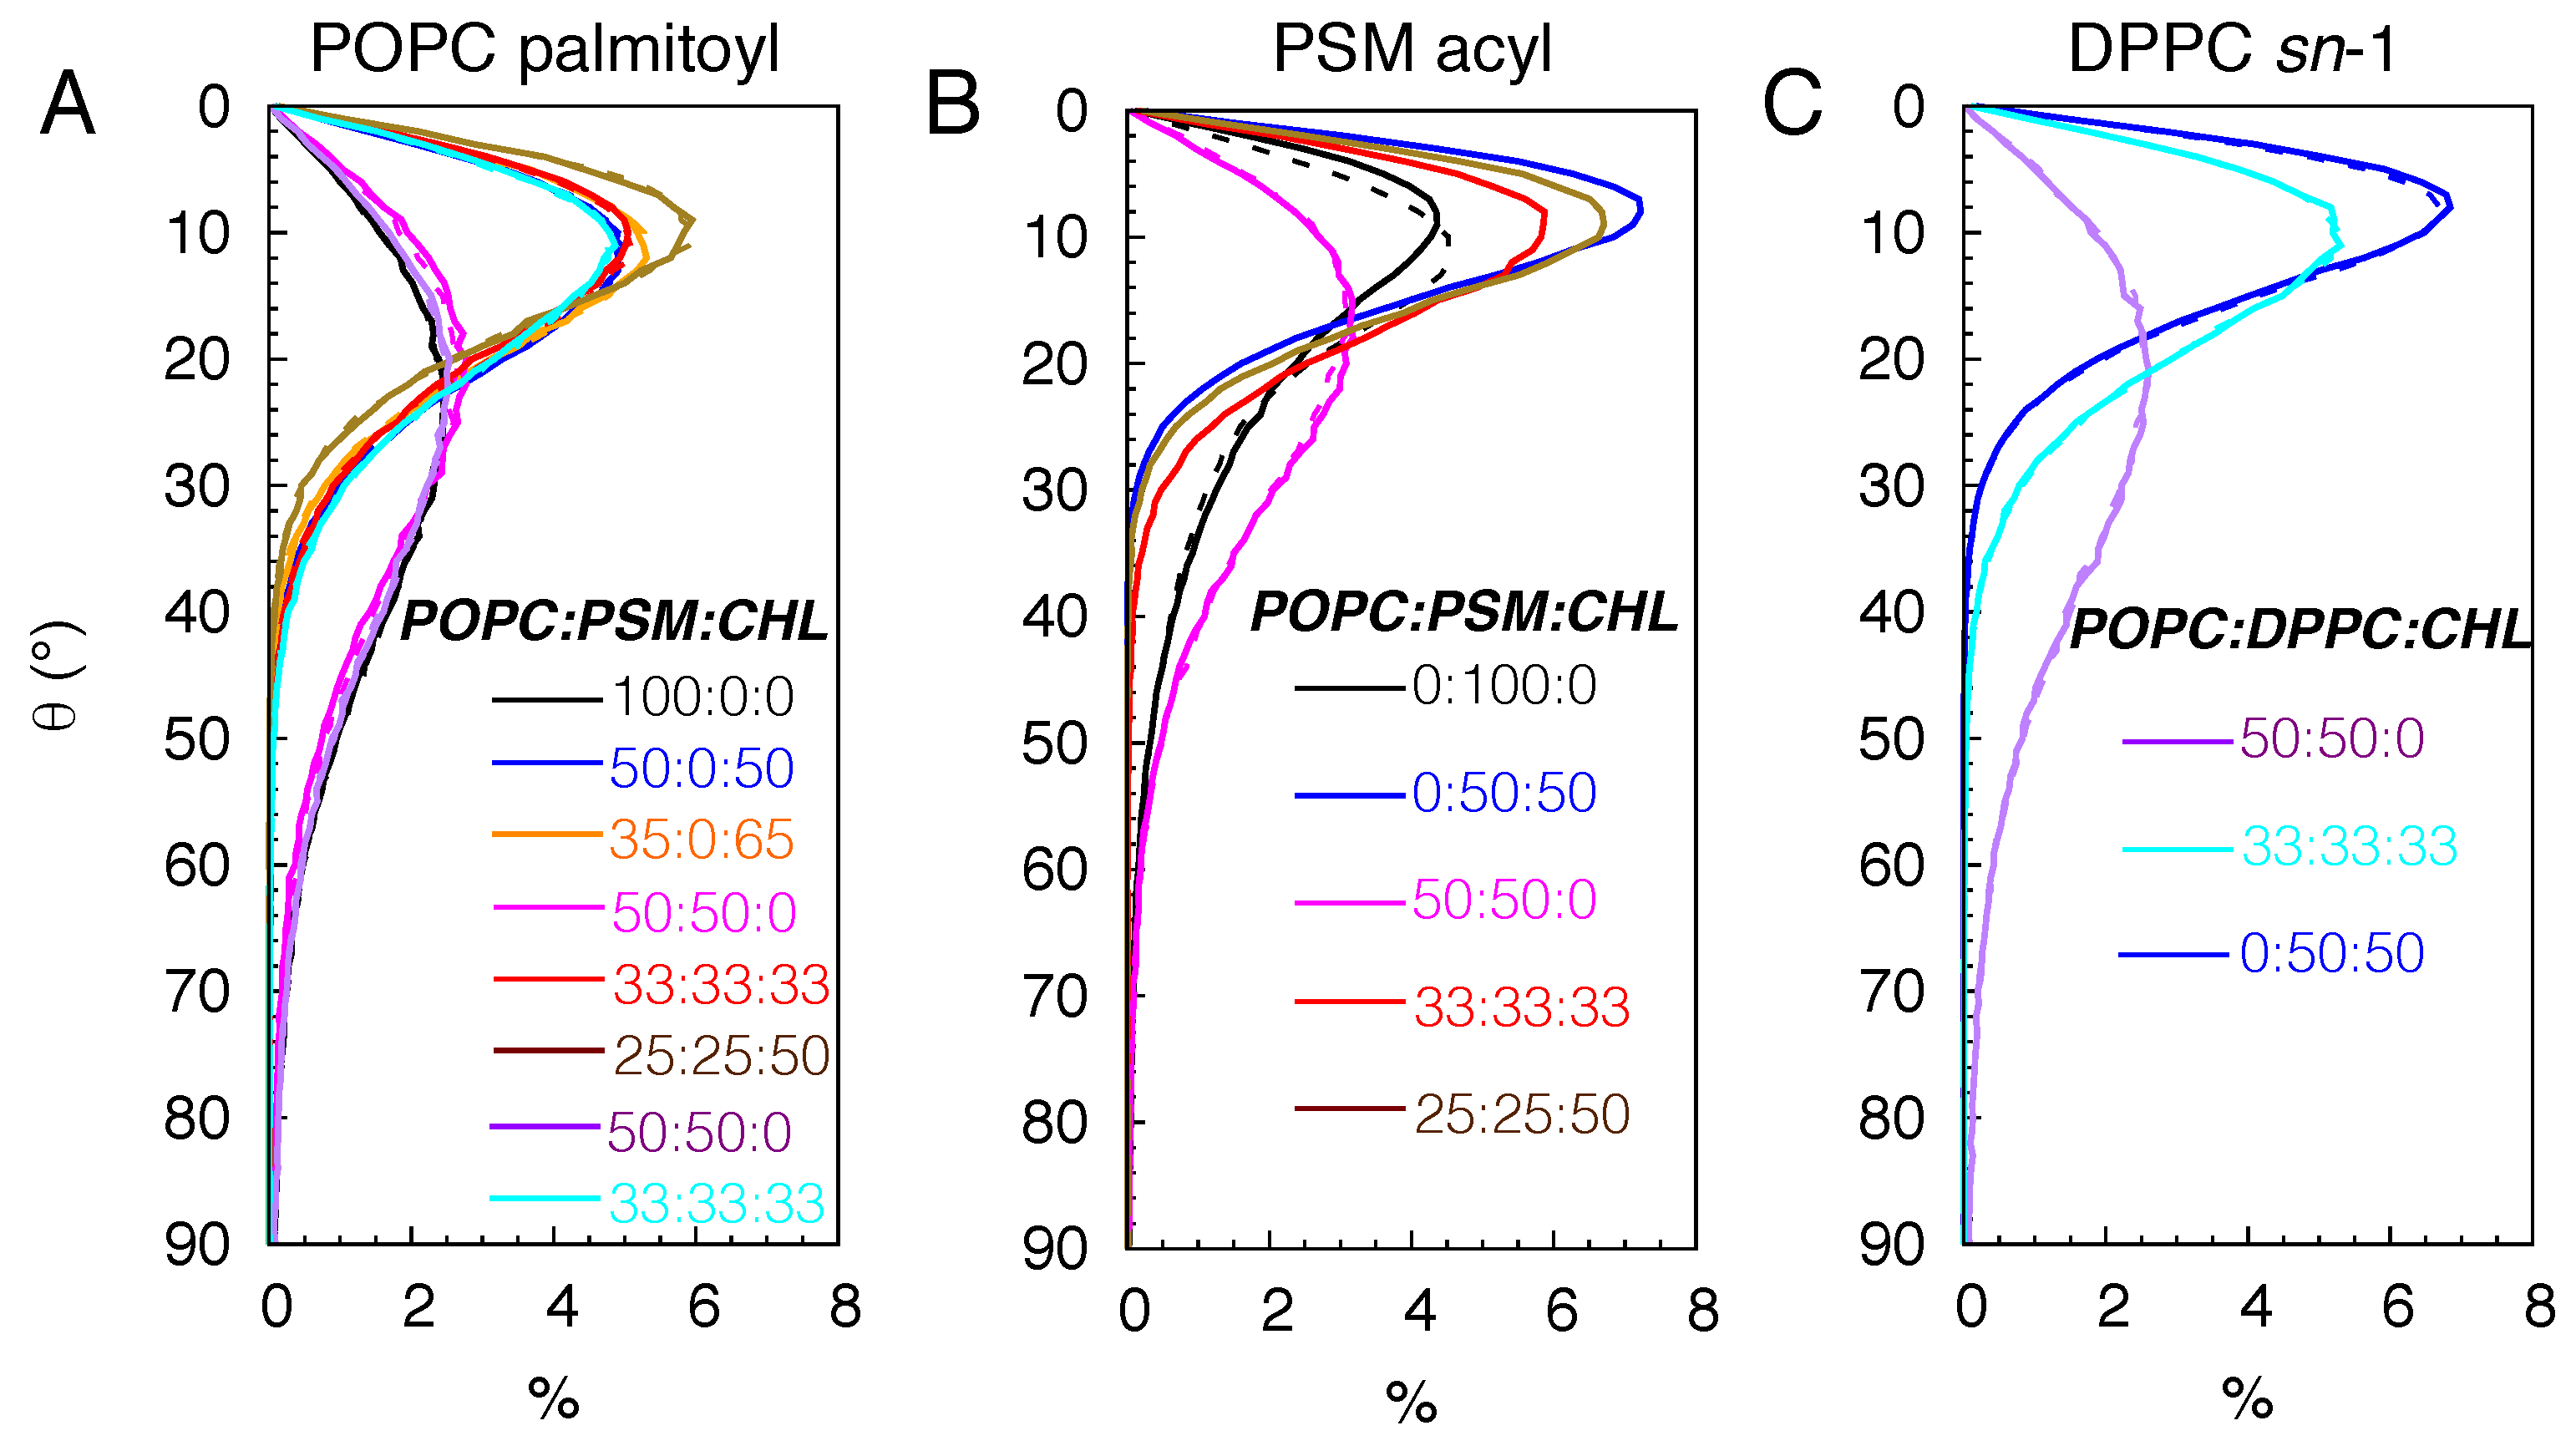
Figure 6.
Calculated membrane permeability coefficients () of gas molecules. A) O2 in POPC:PSM:CHL bilayers. B) CO2 in POPC:PSM:CHL bilayers. C) CO2 in POPC:DPPC:CHL bilayers.
Figure 6.
Calculated membrane permeability coefficients () of gas molecules. A) O2 in POPC:PSM:CHL bilayers. B) CO2 in POPC:PSM:CHL bilayers. C) CO2 in POPC:DPPC:CHL bilayers.
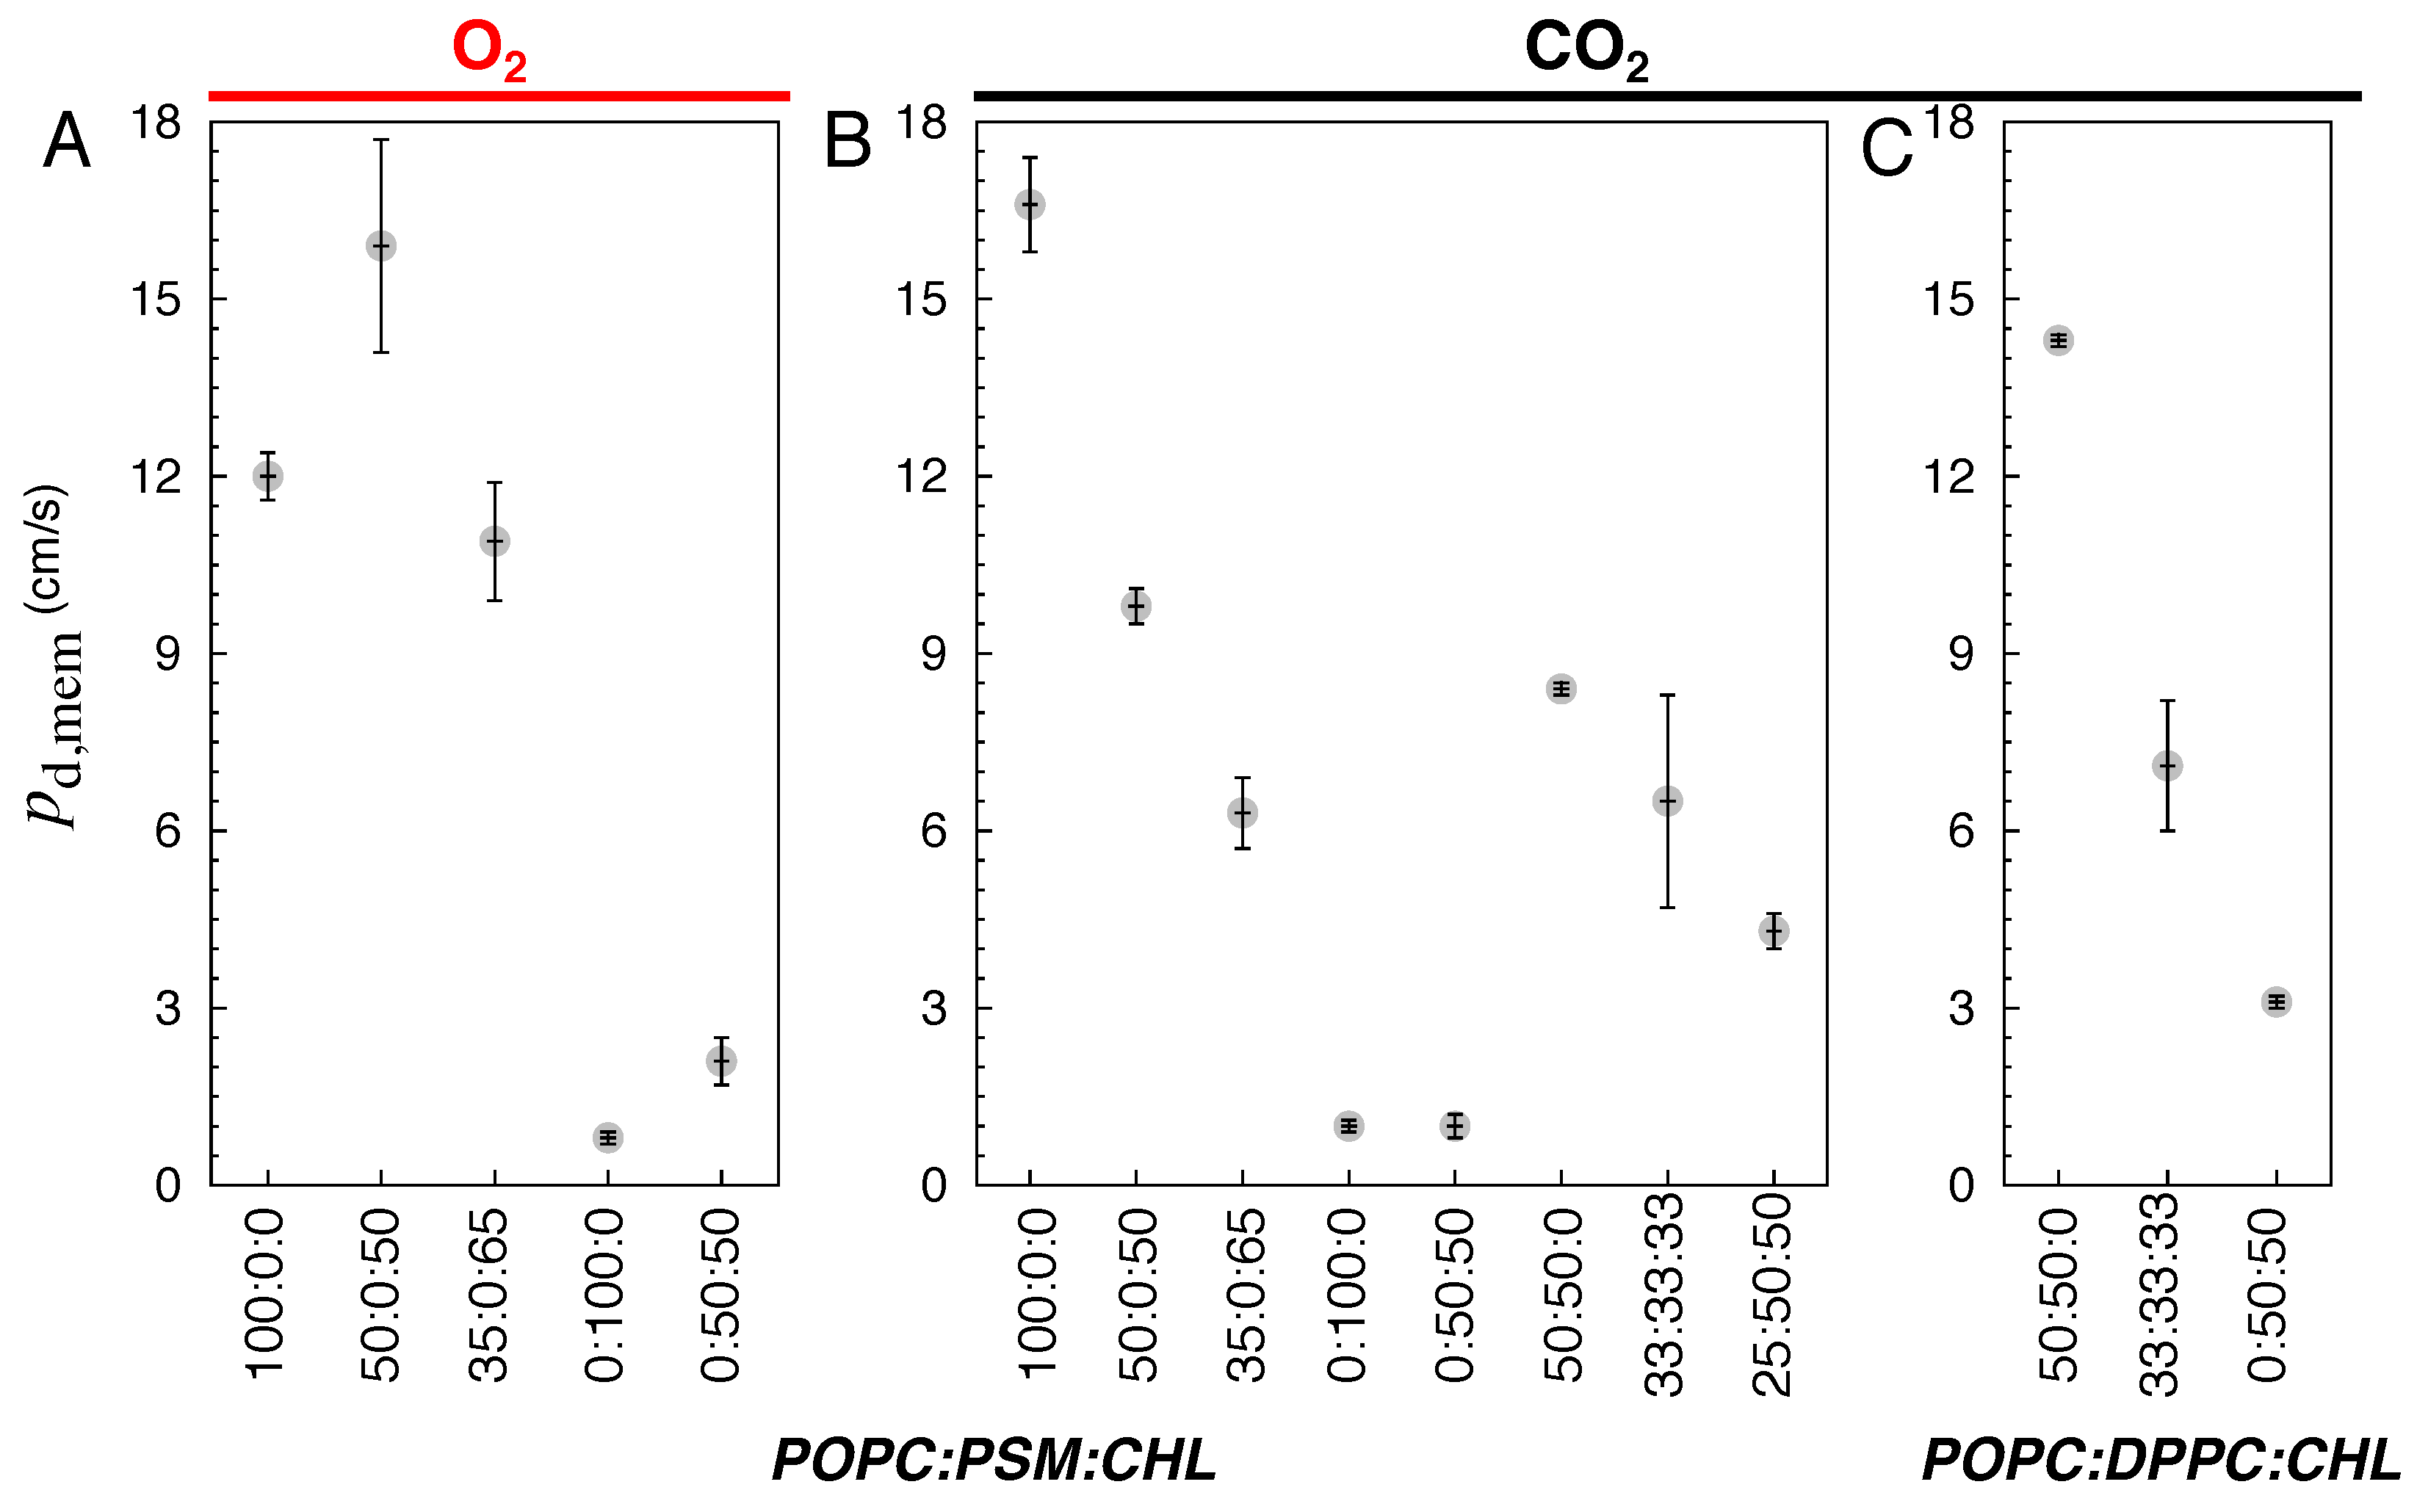
Figure 7.
Partitioning free energy profiles () of gas molecules for (A-B) O2 in POPC:PSM:CHL bilayers. (C-D) CO2 in POPC:PSM:CHL bilayers. (E) CO2 in POPC:DPPC:CHL bilayers. The partitioning profiles of gases were calculated using the equilibrium portions of flooding simulation trajectories. Bars indicated standard deviation of the mean.
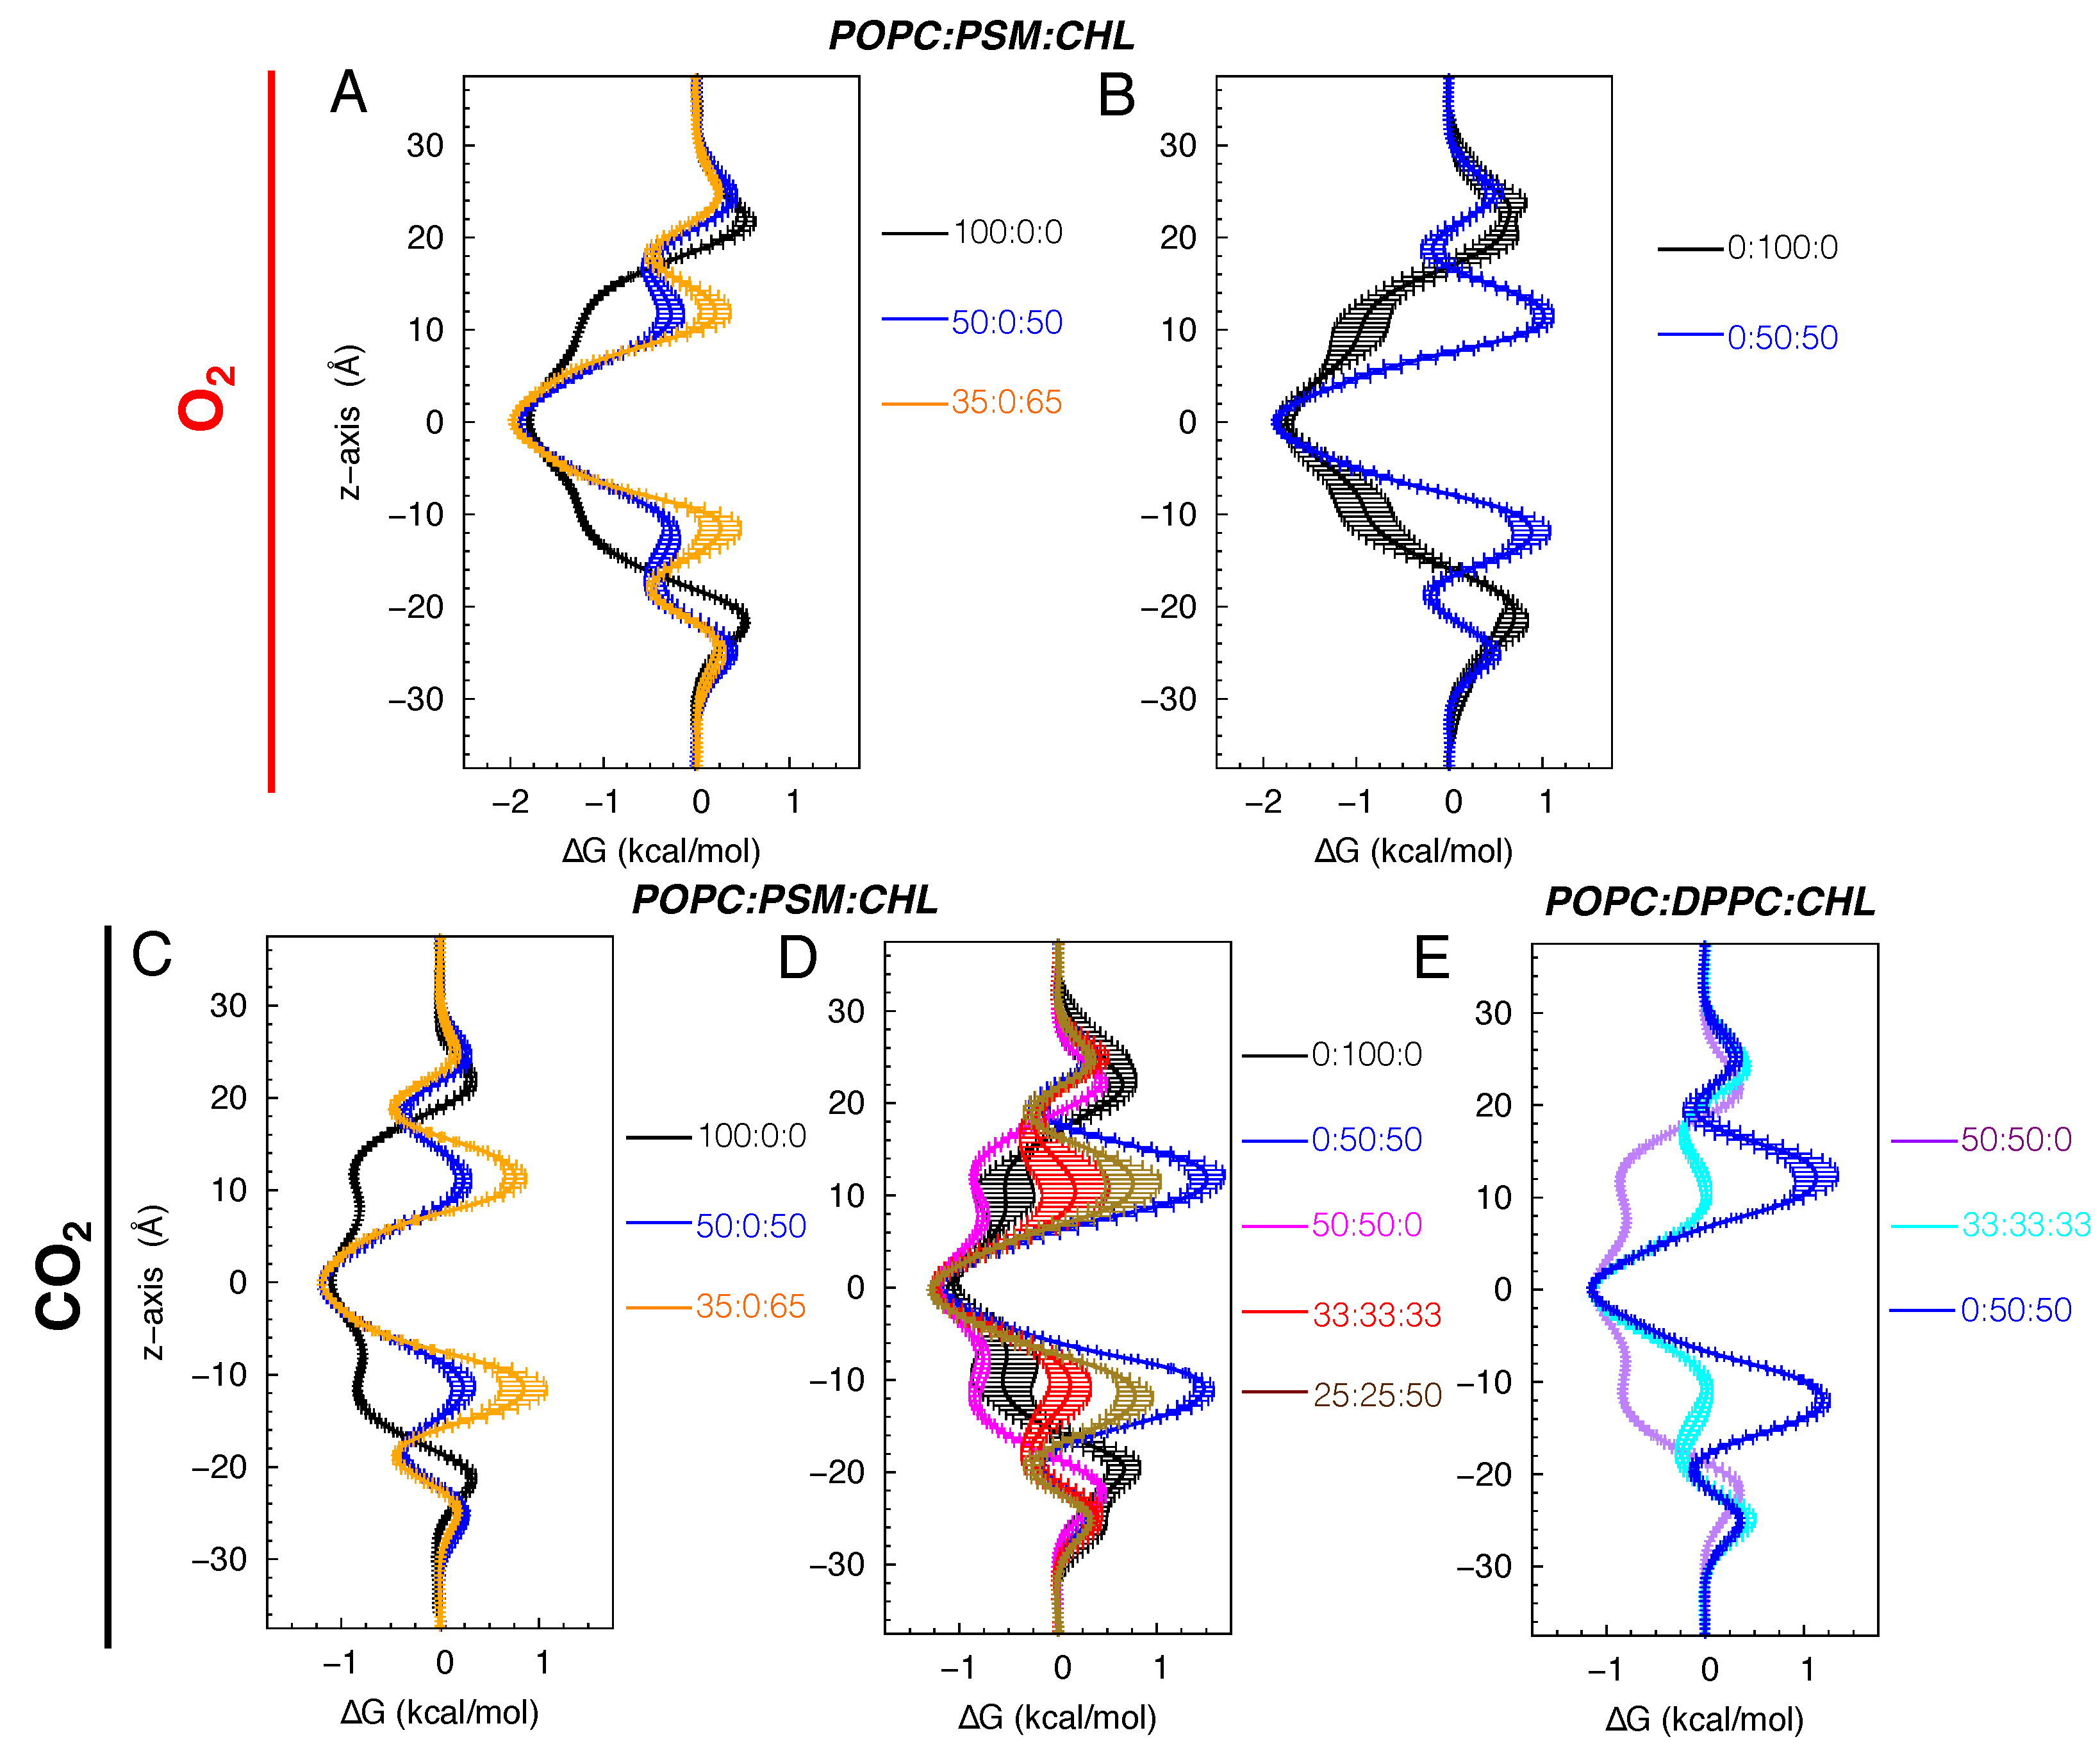
Figure 8.
Approximated overall diffusion coefficients () of O2 (A) and CO2 in POPC:PSM:CHL membranes (B) and of CO2 in POPC:DPPC:CHL membranes (C).
Figure 8.
Approximated overall diffusion coefficients () of O2 (A) and CO2 in POPC:PSM:CHL membranes (B) and of CO2 in POPC:DPPC:CHL membranes (C).
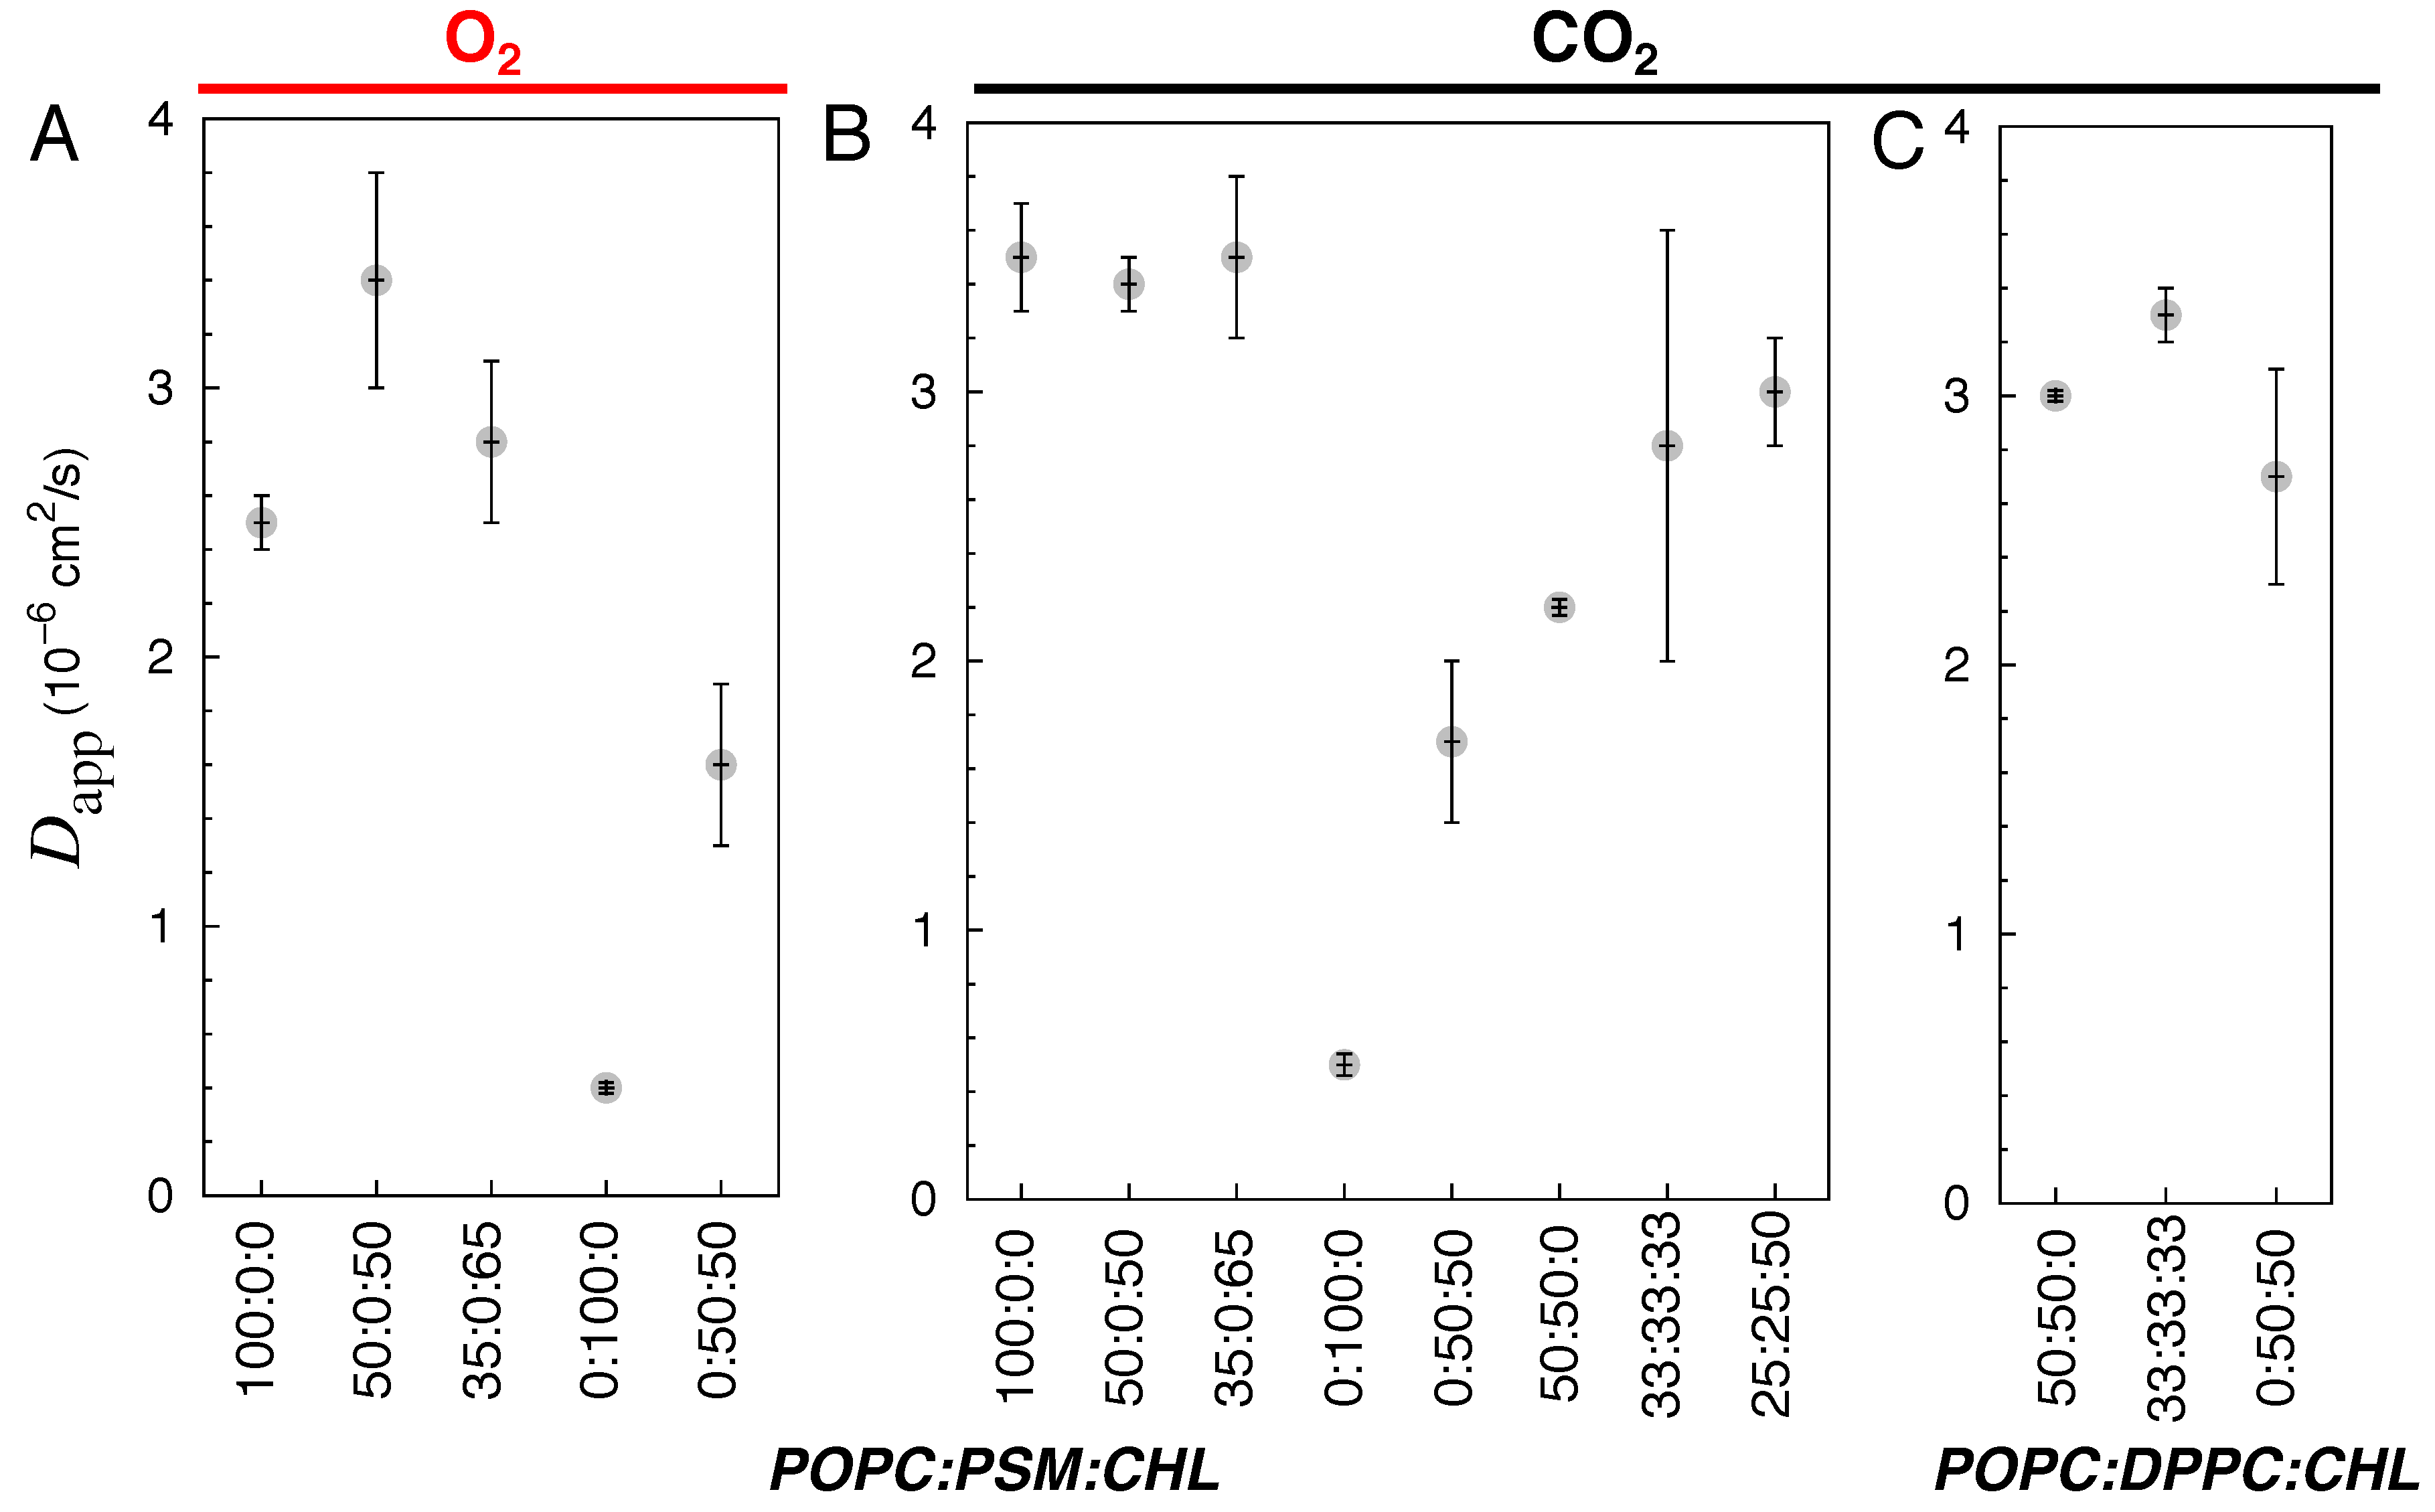

Table 1.
Lipid bilayer systems simulated in this study.
| Lipid ratio | Lipid numbers | System size (atoms) |
|---|---|---|
| POPC:PSM:CHL | ||
| 100:0:0 | 294/0/0 | 77,406 |
| 50:0:50 | 186/0/186 | 79,413 |
| 35:0:65 | 154/0/286 | 85,207 |
| 0:100:0 | 0/362/0 | 80,823 |
| 0:50:50 | 210/0/210 | 84,098 |
| 50:50:0 | 162/162/0 | 83,253 |
| 33:33:33 | 124/124/124 | 81,324 |
| 25:25:50 | 100/100/200 | 82,599 |
| POPC:DPPC:CHL | ||
| 50:50:0 | 154/154/0 | 78,708 |
| 0:50:50 | 196/196/0 | 79,346 |
| 33:33:33 | 118/118/118 | 78,997 |
Table 2.
Calculated membrane permeability of O2 and CO2.
| <[]> | <Area > | |||||
|---|---|---|---|---|---|---|
| (ns) | (mM) | (Å2) | (Å) | (cm/s) | (10−6 cm2/s) | |
| POPC:PSM:CHL | ||||||
| 100:0:0 | 175 | 54 | 9,486 | 44 | 12±0.4 | 2.5±0.1 |
| 50:0:50 | 250 | 86 | 8,022 | 46 | 15.9±1.8 | 3,4±0.4 |
| 35:0:65 | 250 | 77 | 8,967 | 44 | 10.9±1.0 | 2.8±0.3 |
| 0:100:0 | 400 | 76 | 9,245 | 48 | 0.8±0.1 | 0.4±0.0 |
| 0:50:50 | 400 | 115 | 8,346 | 50 | 2.1±0.4 | 1.6±0.3 |
| POPC:PSM:CHL | ||||||
| 100:0:0 | 175 | 125 | 9,545 | 44 | 16.6±0.8 | 3.5±0.2 |
| 50:0:50 | 250 | 182 | 8,017 | 46 | 9.8±0.3 | 3,4±0.1 |
| 35:0:65 | 250 | 173 | 8,958 | 44 | 6.3±0.6 | 3.5±0.3 |
| 0:100:0 | 400 | 165 | 9,154 | 48 | 1.0±0.1 | 0.5±0.0 |
| 0:50:50 | 400 | 223 | 8,342 | 50 | 1.1±0.2 | 1.7±0.3 |
| 50:50:0 | 250 | 117 | 9,473 | 46 | 8.4±0.1 | 2.2±0.0 |
| 33:33:33 | 250 | 178 | 8,162 | 50 | 6.5±1.8 | 2.8±0.8 |
| 25:25:50 | 250 | 185 | 8,206 | 50 | 4.3±0.3 | 2.7±0.4 |
| POPC:DPPC:CHL | ||||||
| 50:50:0 | 250 | 122 | 9,572 | 44 | 14.3±0.1 | 3.0±0.0 |
| 33:33:33 | 250 | 198 | 7,891 | 48 | 7.1±1.1 | 3.3±0.1 |
| 0:50:50 | 400 | 241 | 7,828 | 50 | 3.1±0.1 | 2.7±0.4 |
Disclaimer/Publisher’s Note: The statements, opinions and data contained in all publications are solely those of the individual author(s) and contributor(s) and not of MDPI and/or the editor(s). MDPI and/or the editor(s) disclaim responsibility for any injury to people or property resulting from any ideas, methods, instructions or products referred to in the content. |
© 2025 by the authors. Licensee MDPI, Basel, Switzerland. This article is an open access article distributed under the terms and conditions of the Creative Commons Attribution (CC BY) license (http://creativecommons.org/licenses/by/4.0/).
Copyright: This open access article is published under a Creative Commons CC BY 4.0 license, which permit the free download, distribution, and reuse, provided that the author and preprint are cited in any reuse.


