Submitted:
30 November 2025
Posted:
02 December 2025
You are already at the latest version
Abstract
The literature describes cases of chronic poisoning by organophosphates: pesticides, flame re-tardants, and other industrial and household chemicals. The delayed effects of acute, subacute, subchronic and chronic poisoning manifest themselves years after exposure, with the effects of the toxic factor eventually masked by age-related diseases with an immunological component. The aim of this study was to investigate the immunological profile of blood cells in a cohort of elderly patients diagnosed with occupational pathology caused by subacute or (sub)chronic ex-posure to organophosphates in the 1980s.
Analysis of well-being assessments revealed that patients in the control and organophos-phate-exposed groups had approximately equal levels of memory and thinking impairments, anxiety, melancholy and depression, and cognitive function assessments. However, the organo-phosphate-exposed group experienced significantly more balance and memory impairments, and more pronounced neurological symptoms, manifested by abnormal wrist reflexes, cranio-cerebral changes, impaired vibration and distal sensitivity, and depressed abdominal, ankle and plantar reflexes.
The organophosphates-exposed group showed decreased red blood cell counts and hematocrit, white blood cell counts were unchanged in both groups. Lymphocyte phenotyping revealed a 1.5-2-fold increase in the relative and absolute levels of circulating plasma cell precursors with the CD19+IgD–CD27++ phenotype, an absolute count of cells with the CD19+CD27++CD38++ phenotype, and an absolute count of TEMRA CD4+ T cells in the organophosphate-exposed group of patients. However, the proportion of CD56+CD57+ cells of the EM4 (CD27–CD28+) CD8+ T cell subset was more than 2-fold reduced.
The identified changes indicate a disruption of immune regulation in elderly people with occu-pational pathology, which along with indicators of the neurological and cognitive status of pa-tients can shed light on the pathogenesis of late pathology and serve as important markers in differential diagnosis.
Keywords:
organophosphates
; occupational pathology
; elderly patients
; delayed effects
; immunity
; lymphocyte phenotyping
1. Introduction
Organophosphates, which include pesticides, retardants, and other organophosphates-containing chemicals, are widespread xenobiotics, with numerous poisonings reported worldwide each year [1,2,3]. This often occurs as a result of violations of safety regulations when working with organophosphates. According to [4], organophosphate exposure, depending on the dose, frequency of exposure, and time after exposure, can lead to the development of cholinergic crisis, intermediate syndrome, organophosphates-induced delayed polyneuropathy (OPIDP), and chronic organophosphate-induced neuropsychiatric disorder (COIND). This list can be supplemented by Gulf War Illness syndrome [5,6]. The consequences of organophosphate exposure include aberrations in embryonic development, defects in neurocognitive functions in early life, and the development of neurodegenerative diseases in adults [7,8,9,10]. The late effects of subchronic and chronic poisoning usually manifest themselves years after exposure, so the diagnostic problem is aggravated by the aging of the body and age-related diseases [11]. Damage to the endothelium of blood vessels is one of the main pathogenetic factors of age-related diseases [12], but age-related changes in blood vessels are closely associated with the modulation of the activity of immune system cells [13,14].
The aging immune system suffers from both quantitative and qualitative deficiencies in the innate and adaptive immune systems, characterized by a reduced response to de novo antigens and vaccines, as well as low-grade inflammation that is modulated by nutrition [15]. The neutrophil-to-lymphocyte ratio (NLR) has become a widely available and cost-effective marker of systemic inflammation, and aging is associated with a gradual increase in NLR due to an increase in neutrophils and a decrease in lymphocytes, reflecting underlying immunosenescence and systemic inflammation [16].
Many studies indicate the important role of the immune system in the development of cardiovascular and neurodegenerative diseases [13,17,18]. However, virtually no studies have examined the relationship between the delayed effects of acute and/or chronic organophosphate poisoning, on the one hand, and the aging of the body and the state of the immune system, on the other.
The aim of the study was to investigate the immunological profile of a unique cohort of elderly patients, former employees of a chemical industry enterprise, diagnosed with occupational pathology caused by (sub)chronic exposure to organophosphates in the 1980s.
2. Results
2.1. Socio-Demographic Data, Vaccinations, and Illnesses
Based on the survey results of a cohort of former employees of a chemical enterprise and employees of Medical Unit No. 29 of the Federal Medical and Biological Agency of Russia residing in Novocheboksarsk (more than 240 individuals), a target population consisting of 143 individuals (41 men and 102 women) was created for comparative analysis. The average age of the individuals was 74.4 ± 3.9 years for men and 73±4 years for women. The subjects were divided into two groups based on their working conditions: control group (employees of the medical unit and those whose profession was not associated with exposure to organophosphates), and occupational pathology (OP) group (employees with an occupational organophosphate-related pathology).
The resulting groups did not differ in average age or gender composition. The characteristics of the groups are presented in Table 1. Body mass index (BMI) was calculated using the formula I = m / h2, where m is body weight in kg and h is height in m. According to WHO recommendations, BMI is classified as underweight, normal body weight, overweight or pre-obesity, and grade 1, 2, or 3 obesity. The Mann-Whitney test was used to compare the BMI of the control group and the group of occupational patients. Statistically significant differences were found between the groups, but these differences are not of clinical significance. There are no differences between the groups with the average values in both groups in the overweight range. The proportions of people with normal weight, overweight, and obesity in each group are presented in Table 1.1. For accurate statistical analysis, obesity levels 2 and 3 were combined into one category. Chi-square analysis was performed; no differences were found between the groups. Smokers were defined as all those who had ever smoked, regardless of smoking intensity and duration. The proportion of smokers in the OP group was four times higher (p<0.05). The proportion of people with secondary, vocational, or higher education in each group is presented in Table 1. Employees with secondary specialized education predominate in both groups.
Cases of vaccination and previous coronavirus infection by the time of the survey were recorded from the respondents’ words. Based on the respondents’ answers, 4 categories were distinguished: the first - never sick and not vaccinated (v-d-), the second - vaccinated and never sick (v+d-), the third - sick but not vaccinated (v-d+), the fourth - sick before or after vaccination (v+d+). The distribution of patients in the groups differed statistically significantly (p<0.01), the proportion of each category is presented in Table 1.1 and Figure 1.1. For additional statistical evaluation, patients were grouped by the criterion “vaccinated or not” regardless of their previous coronavirus infection. This approach revealed a difference in the proportion of vaccinated patients - there were twice as many such patients in the organophosphorus-infected group (p<0.001). The next step was grouping the array by the criterion “sick - not sick”. No statistically significant differences were found between the groups – the number of those who recovered from the disease in both groups was 29-36%.
Respondents also recorded medications they named as frequently or regularly taken. For general information, the term “drug burden” was introduced, which was assessed by the number of medications named, regardless of their pharmacologic class. Half of the control group patients took 3-5 medications daily, while patients with occupational diseases took 3-8, meaning their drug burden was higher (p<0.001).
The following diagnoses were noted from the participants’ medical histories: coronary heart disease, hypertension, GID, including hepatitis (toxic or otherwise), DM, cancer, MSSD, and episodes of CVA or chronic CVD.
Diseases of all listed groups, with the exception of GID, occurred with comparable frequency in the control group and the occupational patients. However, GID (especially hepatitis) were statistically significantly more common in the OP group. PNP was diagnosed during the examination. In the control group, 39 patients were diagnosed with this condition, representing 66% of those examined in the control group. In the OP group, PNP was diagnosed in 87% of those examined (p<0.01). Approximately 20% of patients in each group may have diabetic polyneuropathy. PNP of the lower extremities was diagnosed more frequently, but only 12% of the control group had PNP of both the upper and lower extremities, compared to 29% of patients in the OP group (p<0.05).
To assess cognitive impairment, subjects were asked to complete three tests and also self-assess their well-being across several parameters. Self-assessments of balance problems and difficulty performing daily activities allowed two response options (yes/no). Self-assessments of memory problems and anxiety allowed three response options (yes/no/sometimes). Self-assessments of personality changes also allowed three response options: yes, no, and difficult to answer.
Subsequently, for statistical evaluation of memory and thinking problems, patients were regrouped into two categories: negative responses and positive responses (yes or sometimes). Responses regarding anxiety were also combined into two similar categories. For further processing, only strictly negative or positive responses were retained in the responses regarding personality changes (thus reducing the number of respondents). The results of the self-assessments of well-being before and after grouping are presented in Table 2.
When analyzing the patient well-being questionnaire, memory and thinking problems were reported by the majority of respondents in the control and OP groups (87% and 95%, respectively). Difficulty maintaining balance was reported by 69% of respondents in the control group, compared to 84% of those in the OP group (p<0.001). Feelings of anxiety, melancholy, and depression were experienced at least occasionally by 87% of respondents, regardless of group. More than half of respondents in both groups reported personality changes. Difficulty performing everyday activities due to memory problems was experienced by 49% of respondents in the control group, and a quarter more in the OP group (p<0.0001). No differences were found between the groups when assessing cognitive function using the MMSE (Mini Mental State Examination), SAGE (Self-Administered Gerocognitive Exam), and Clock tests. The results are presented in Table 3.
When assessing neurological status, subjective and objective symptoms were assessed. Subjective symptoms included complaints of increased blood pressure, headache, dizziness, back and joint pain, weakness and fatigue, paresthesia or numbness in the extremities, vasomotor reactions, and psychoemotional disturbances (primarily related to sleep disturbances). One point was added for each of these symptoms, so subjective symptoms were assessed on a 10-point scale (0-9). The results are presented in Table 4. In the OP group, respondents reported at least three subjective symptoms from the list, while in the control group, at least one symptom. Although the medians were equal in both groups, more pronounced symptoms can be observed in the OP group (p<0.05).
Among objective symptoms, the presence of abnormal plantar and wrist reflexes was taken into account. In both groups, abnormal plantar reflexes were noted in 7% of patients. Pathological wrist reflexes were detected in 12% of subjects in the OP group and only one subject (2%) in the control group (p<0.05).
Coordination impairments (intention, ataxia, missed shots) and craniocerebral changes (nystagmoid, nystagmus, nasolabial fold asymmetry, weak convergence, tongue deviation, and symptoms of oral automatism) were assessed using a scoring system (one point for each symptom).
In both groups, an average of two signs of coordination impairment and the same number of signs of craniocerebral changes were noted. However, due to differences in the maximum values and the third quartile, craniocerebral changes were more common in the OP group (p<0.001).
Vibration sensitivity impairments were detected in 94% of subjects in the OP group, which is higher than in the control group, where 80% of subjects had such impairments. Impaired distal sensitivity was detected in 56% of subjects in the control group. In the OP group, such impairments occurred in 83% of subjects (p<0.001). Depression (to the point of complete absence) of abdominal, ankle, and plantar reflexes was also noted (Table 4). Hypothermia of the extremities in both groups occurred in 6-7% of subjects, and hyperhidrosis in 38-44%.
2.2. Hematological Parameters
Basic hematological parameters are presented in Table 1S. In the OP group, a decrease in red blood cell count and hematocrit (p<0.01) was observed, accompanied by a slight decrease in hemoglobin concentration (Figure 2 and Figure 3). Other red blood cell parameters (MCV, mean corpuscular volume; MCH, mean corpuscular hemoglobin; MCHC, mean corpuscular hemoglobin concentration) were unchanged. White blood cell counts were within the reference range in both groups.
A statistically significant increase in platelet count was also observed in the phospholipid group; however, overall, this indicator was within the normal range. Rather, a decrease in platelet count was observed in some patients in the control group. A graphical representation of these data is shown in Figure 4.
2.3. Immunological Parameters
Staining with antibodies against IgD and CD38 allowed us to distinguish the following B cell subsets within total peripheral blood circulating CD19+ B cells: “naive” Bm1 cells with the IgD+CD38– phenotype; “activated naive” Bm2 cells (IgD+CD38+); Bm2’ – germinal center progenitor cells (IgD+CD38++); a general subpopulation including centroblasts and centrocytes – the so-called “Bm3+Bm4” cells (IgD–CD38++); early memory eBm5 cells (IgD–CD38+) and resting memory Bm5 cells (IgD–CD38–) [19].
In the next step, several additional subpopulations of memory B cells were identified. Staining with antibodies against surface IgD and CD27 molecules allowed us to separate the group of “naive” cells with the IgD+CD27– phenotype from three types of memory cells: memory cells with an “unswitched” class of synthesized antibodies (“unswitched” IgD+CD27+), memory cells with a switched class of synthesized antibodies (“class-switched” memory cells, IgD–CD27+) and so-called “double-negative” memory cells (IgD–CD27–), as well as circulating plasma cell precursors with the IgD–CD27++ phenotype [20].
To more accurately identify circulating plasma cell precursors (plasmablasts), we used an analysis algorithm based on the assessment of CD38 and CD27 expression levels [21]. In addition to plasmablasts with the CD27++CD38++ phenotype, this approach allowed us to distinguish five more subsets of peripheral blood B cells: “transient” or transitional B cells (CD27−CD38++), mature “naive” cells (CD27−CD38+), mature activated cells (CD27+CD38+), resting memory cells (CD27+CD38−), and “double-negative” B cells (CD27–CD38–).
According to the results of our studies of a cohort of elderly patients with occupational pathology, the distribution of B cells among subsets is presented in relative and absolute terms in relation to all lymphocytes (Table 2S), and only in relative terms in relation to the total number of B cells (Table 3S). Statistically significant differences between the control and OP groups were revealed in the relative and absolute levels of circulating plasma cell precursors with the IgD–CD27++ phenotype (an increase by 66% and 2-fold, respectively; Figure 5 and Figure 7) and only in the absolute number of the same population with the CD27++CD38++ phenotype (an increase by 60%, Figure 6).
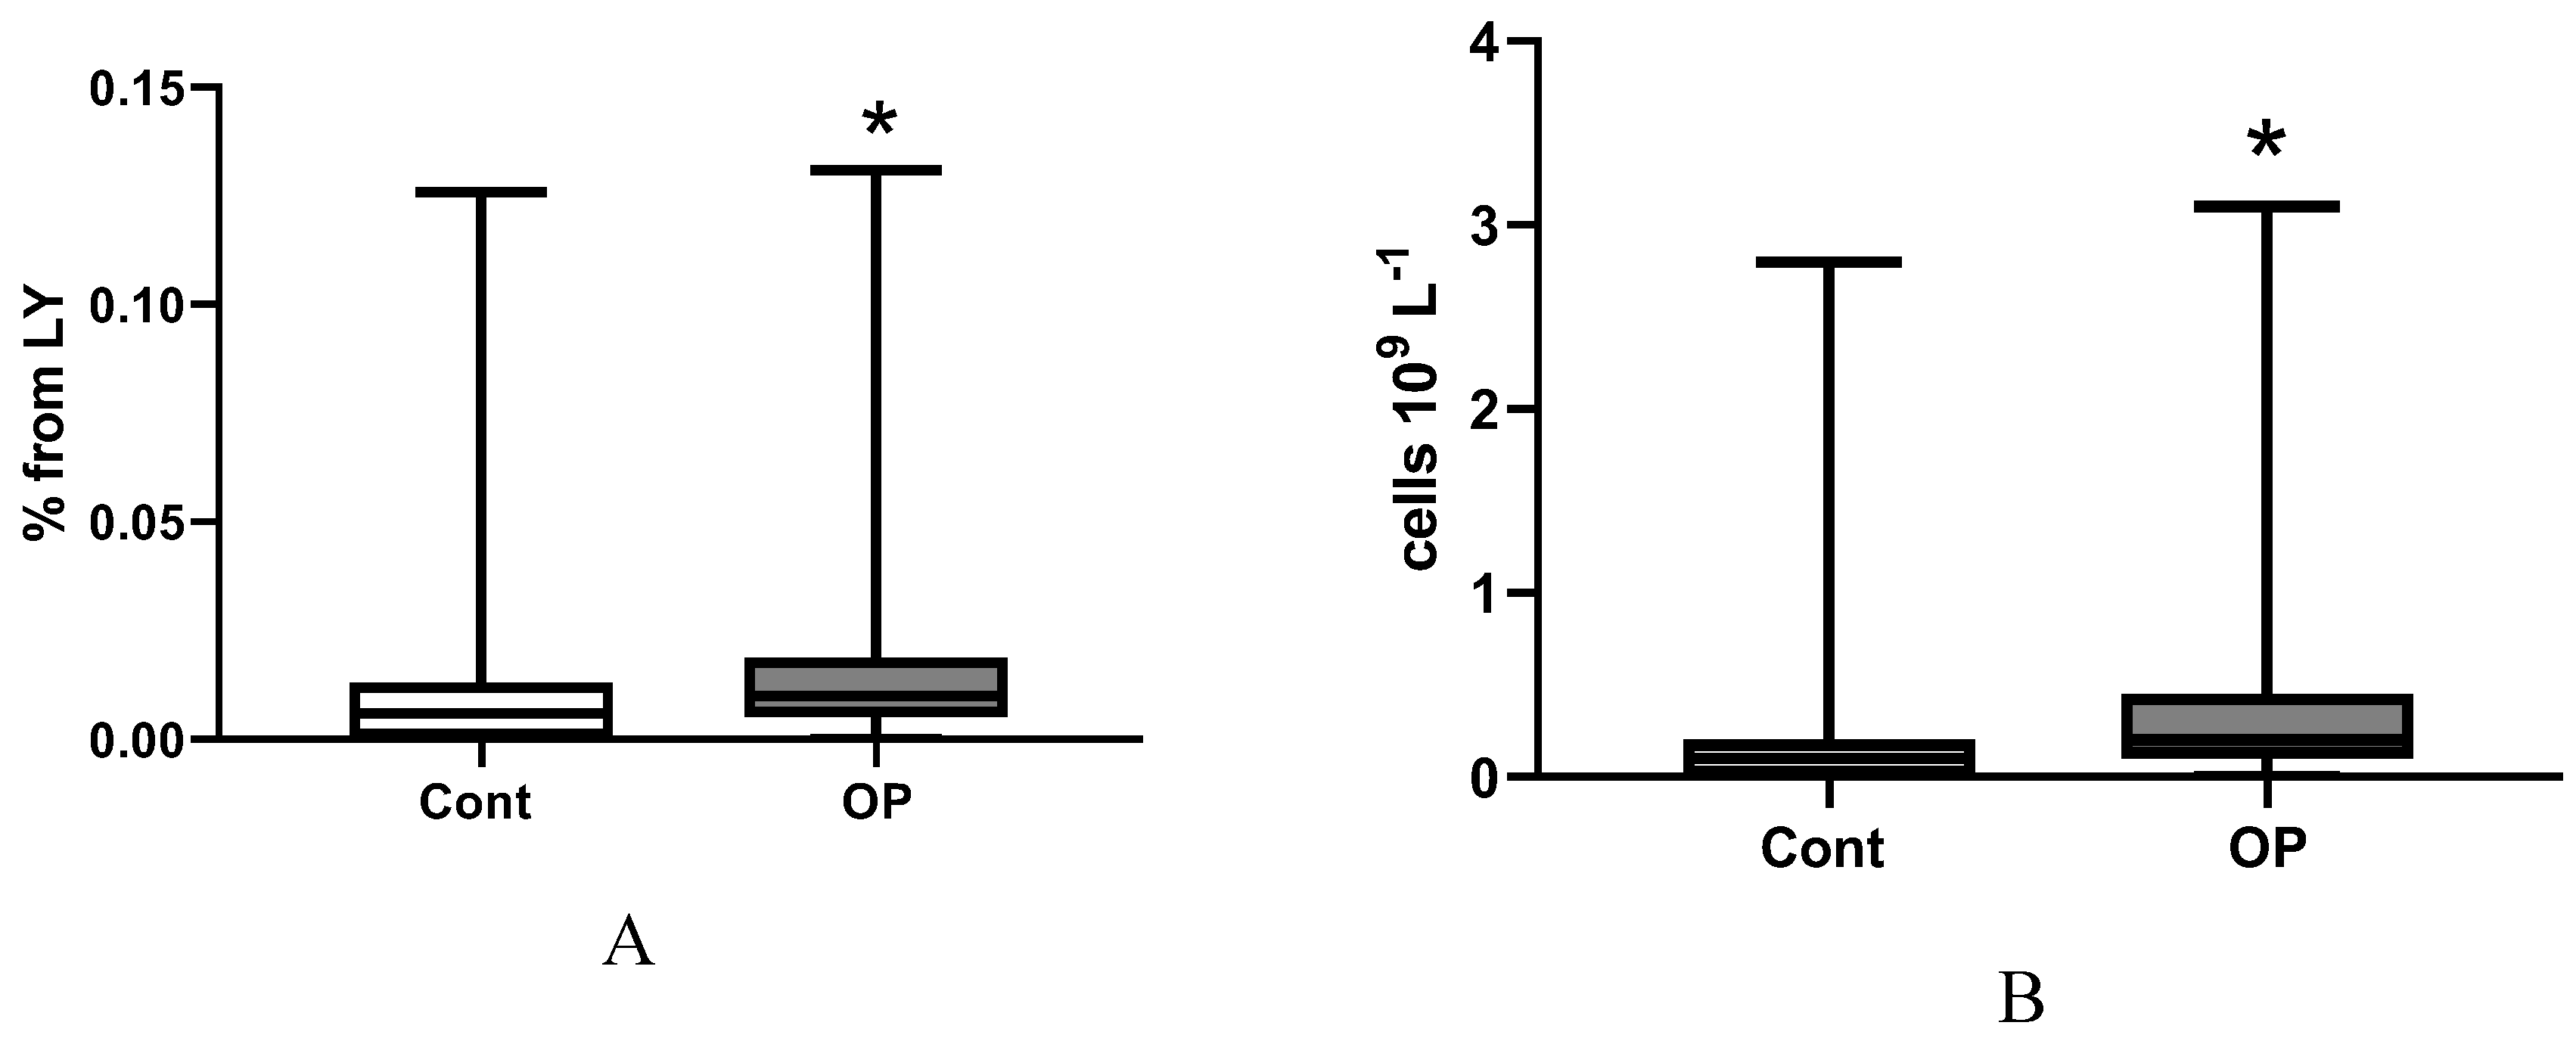
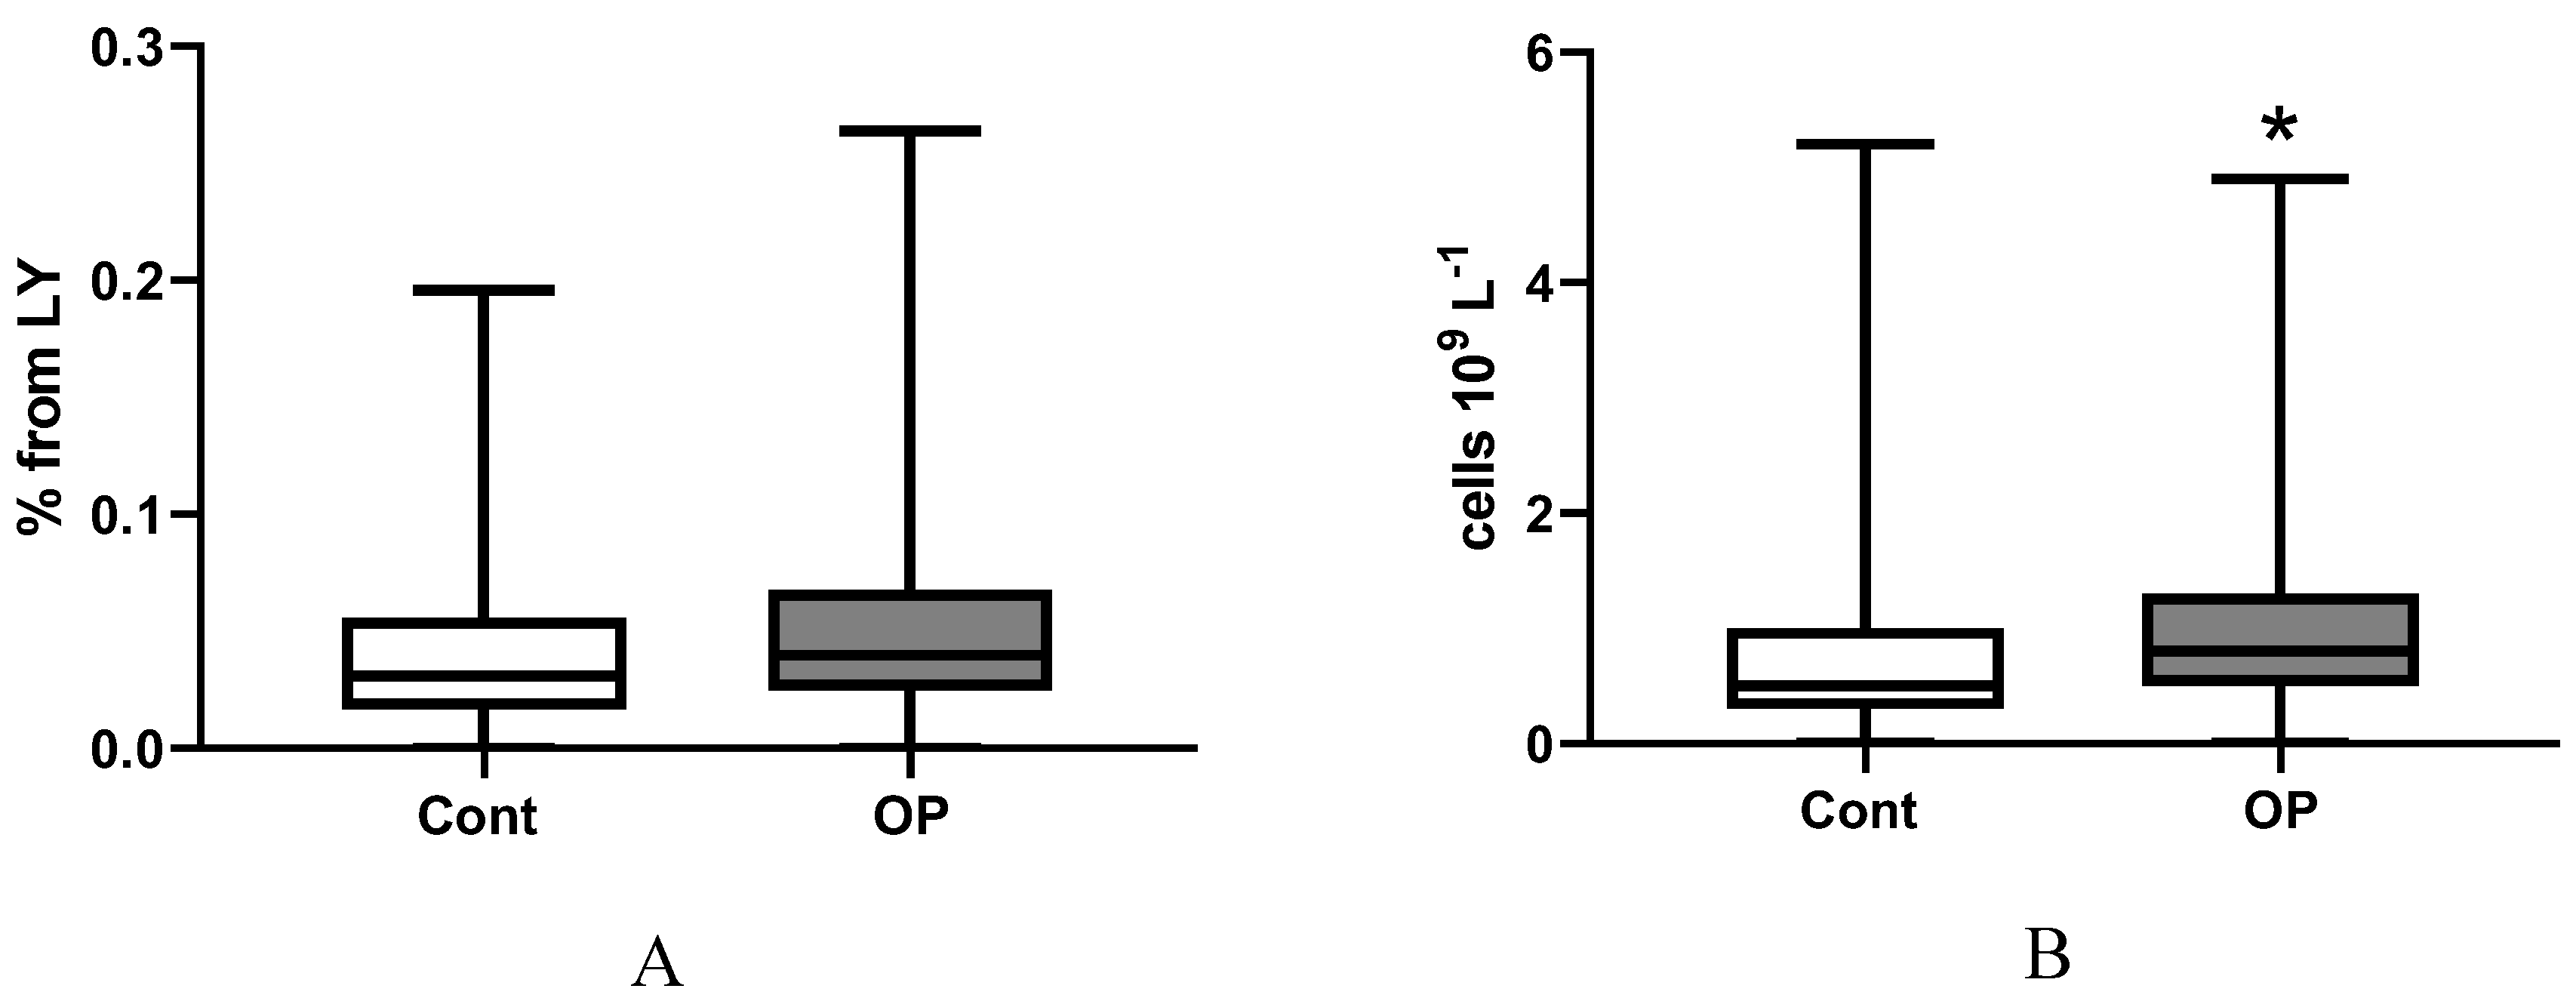
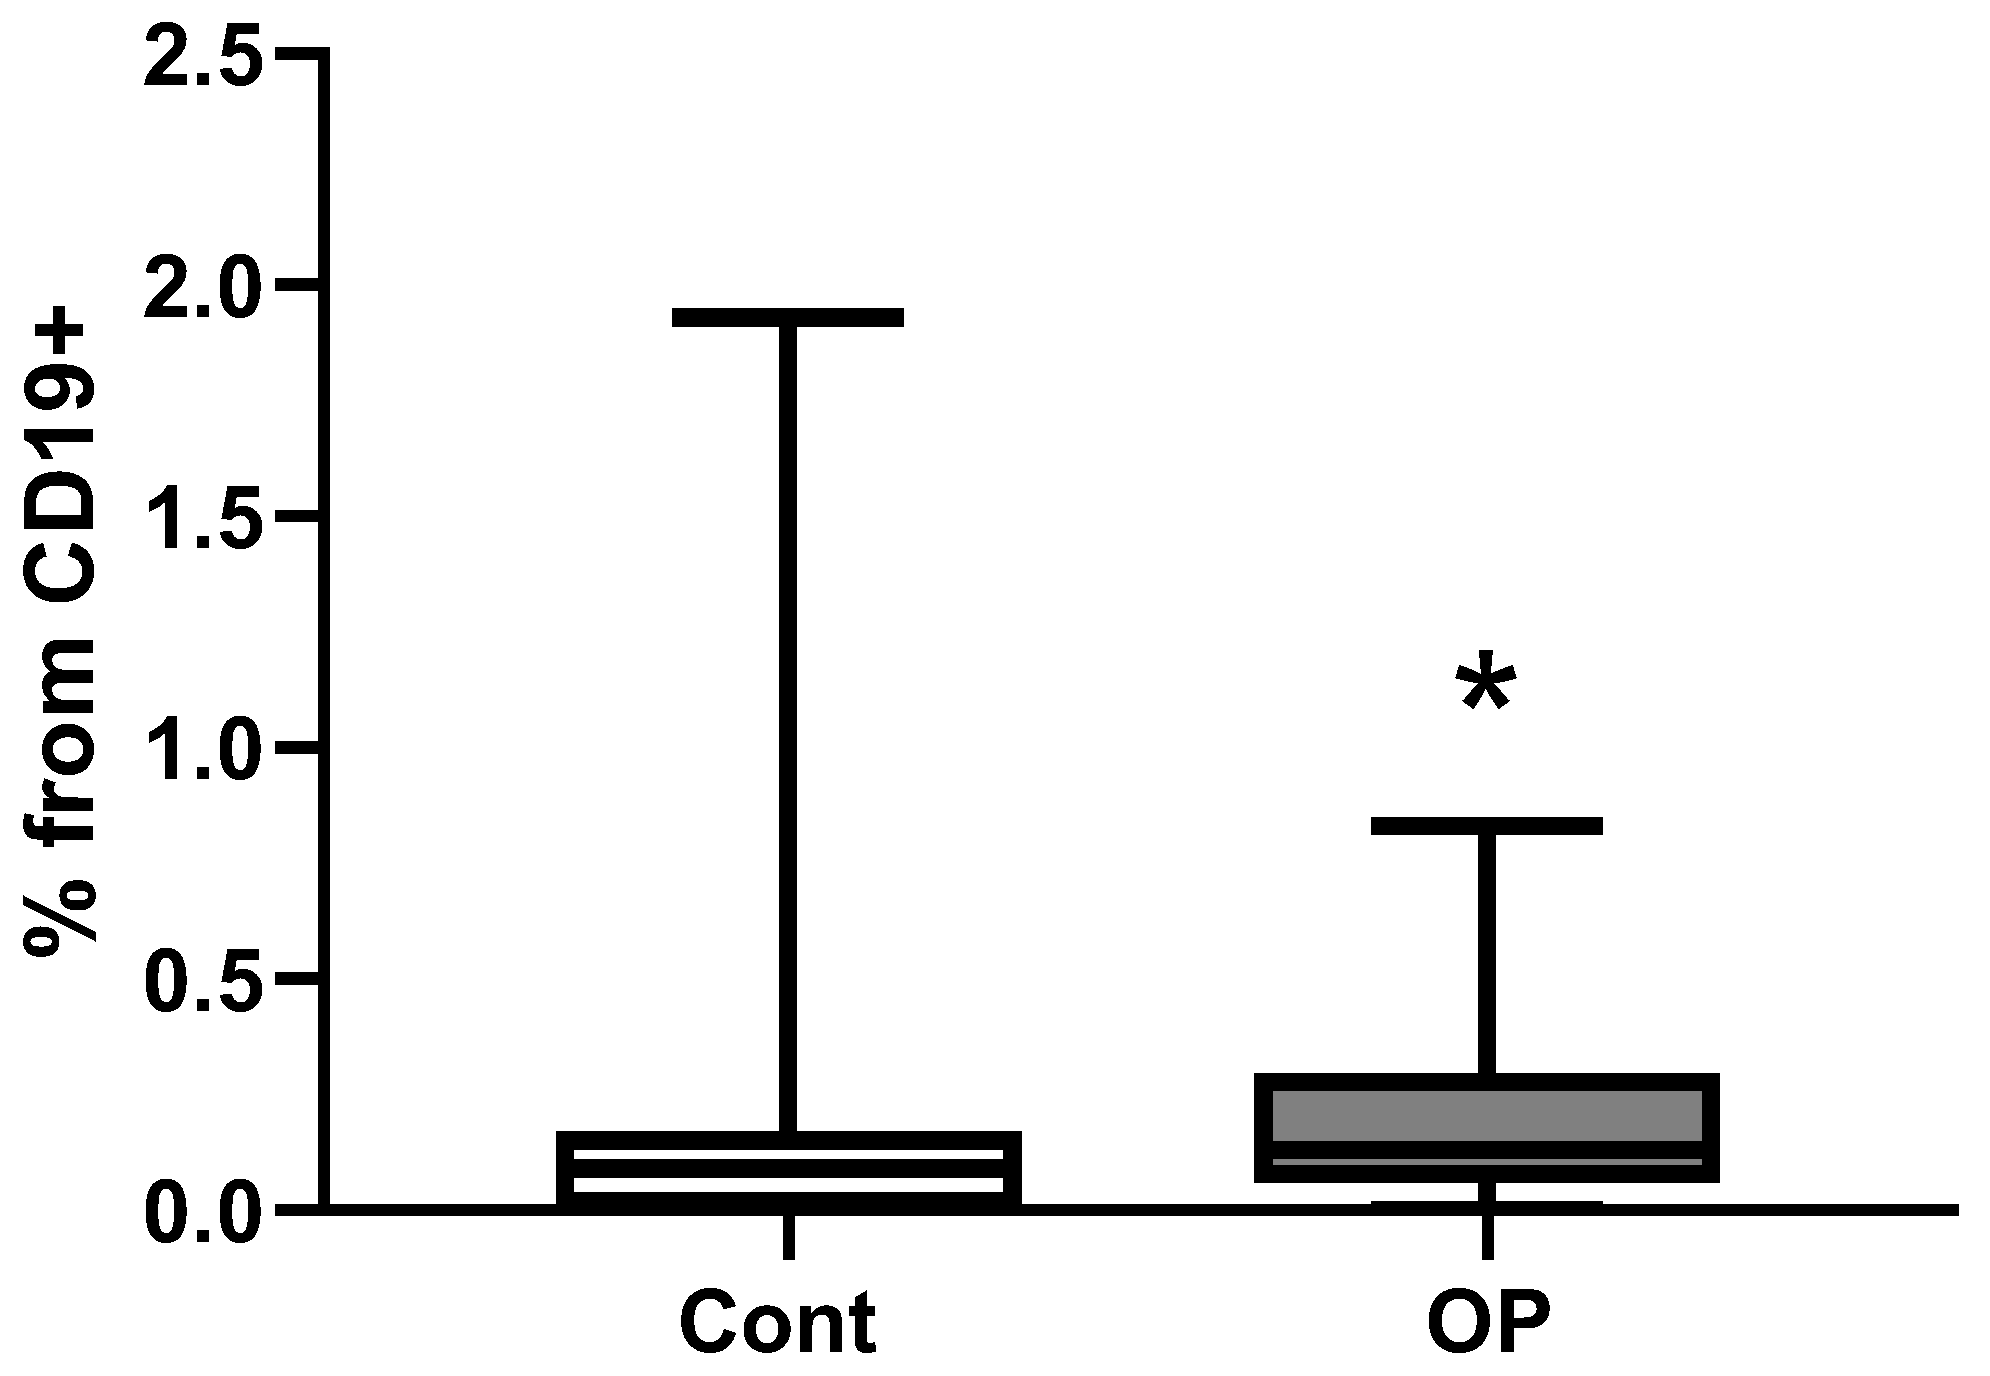
Figure 5.
The relative (% within CD19+ B cells, plot A) and absolute (number of cell per 1 µL, plot B) frequencies of IgD–CD27++ circulating plasma cell precursors in the control (n=59, white) and OP (n=82, grey) groups. Quantitative data are presented as median, quartile (Med (Q25; Q75)), and minimum to maximum range. Statistical analysis was performed using the Mann-Whitney U-test.
Figure 6.
The relative (% within CD19+ B cells, plot A) and absolute (number of cell per 1 µL, plot B) frequencies of CD27++CD38++ circulating plasma cell precursors in the control (n=59, white) and OP (n=82, grey) groups. Quantitative data are presented as median, quartile (Med (Q25; Q75)), and minimum to maximum range. Statistical analysis was performed using the Mann-Whitney U-test.
Figure 7.
27-vs-IgD PB cells from CD19+. The relative (% within CD19+ B cells) frequency of IgD–CD27++ circulating plasma cell precursors in the control (n=59, white) and OP (n=82, grey) groups. Quantitative data are presented as median, quartile (Med (Q25; Q75)), and minimum to maximum range. Statistical analysis was performed using the Mann-Whitney U-test.
The distribution of T cells among subpopulations is presented in relative and absolute terms in relation to all lymphocytes (Table 4S) and only in relative terms in relation to the total number of T cells (Table 5S), to the total number of cytotoxic T cells (Table 6S) and to the total number of T helpers (Table 7S). Statistically significant differences between the control and OP groups were revealed only in the absolute level of TEMRA CD4+ T cell subpopulation cells (a 2-fold increase, Figure 8). TEMRA (Terminal Effector Memory Re-expressing CD45RA) cells – terminally differentiated effector memory T cells – play a decisive role in immune aging. This specific T cell subpopulation exhibits high cytotoxicity and proinflammatory capacity; the number of these cells increases, in particular, in some viral diseases and/or as a result of antiviral therapy [22].
Natural killer (NK) cells are cytotoxic lymphocytes that lack CD3 and express CD16, CD56, and CD57. Human NK cells were originally identified as CD3−CD56+CD16± lymphocytes and were phenotypically divided into two main groups based on the degree of CD56 expression, which correlates with functional activity: CD56bright are the major cytokine-producing subset, whereas CD56dim exhibit greater cytotoxic activity [23]. In human peripheral blood, the majority of NK cells have a CD3−CD56dim phenotype, while a minority have a CD3−CD56bright phenotype, which are the precursors of CD56dim cells. Both NK cell subsets produce IFN-γ upon cytokine stimulation, and CD3−CD56dim NK cells degranulate [24]. CD57 expression was later shown to define functionally discrete NK cell subsets. CD57+ NK cells are highly cytotoxic and are essential for some non-infectious diseases [25]. Immature cell types expressing CD27 and/or CD28 exhibit high CD56 densities, while differentiated effector cells lacking CD27 or both molecules are characterized by the presence of CD57. Co-expression of CD56 and CD57 may be a distinctive feature of exclusively mature effector cytotoxic T lymphocytes, which are classified as effector memory cells and “terminally differentiated” CD45RA+ effector cells [26].
In the cohort studied, the distribution of CD57/CD56-expressing cytotoxic T cell subsets is presented in Table 8S. In representatives of the OP group, the proportion of CD56+CD57+ cells of the EM4 subpopulation was reduced by 62% (Figure 9), while the proportion of CD56–CD57– cells of the pE1Tcyt subpopulation (type 1 pre-effectors) was increased by 11% (Figure 10).
Analysis of the relative abundance of numerous helper cell subpopulations revealed no differences between the control and OP groups (Tables 9S-11S).
3. Limitations of the Research
The uniqueness of the sample of patients is closely related to the limitations of the experimental design. Its single-center design may limit external validity, as the sample may not capture the heterogeneity of patients with delayed pathologies after exposure to organophosphates. Moreover, thirty to forty years ago, biochemical and instrumental analysis capabilities were insufficient for objective monitoring of patients’ condition, the frequency, and extent of organophosphate-related damage. In addition, the absence of a healthy control group completely matched on age and socio-economic status prevents full isolation of syndrome-specific effects. Many retrospective cohort studies can’t prove causality, only suggest associations, and our study is no exception to this rule. Probably the main internal contradiction of our retrospective cohort study is that changes in the quality of data or exposure status over time can occur, but it is the nature of these changes that is the main goal of our research. A cohort study could establish a temporal relationship, which helps in inferring causality, but the overlapping cause-and-effect relationships that lead to age-related diseases also negates the potential. Confounding variables can affect the results, but in theory statistical methods can be used to adjust for them. However, in our case, it is not so simple or even impossible to select the most relevant statistical analysis method from the generally accepted ones. Therefore, one of the main goals of further research is to develop fundamentally new analytical methods using machine learning.
4. Discussion
Systemic dysfunction of the vascular endothelium, accompanied by processes of its morphogenetic transformation, is an integral component of the aging process [11,12]. Damage to endoneurial capillaries is a key pathogenetic feature of peripheral neuropathy of various origins. However, the role of the microvascular endothelium itself and the mechanisms of its damage have not yet been fully studied [27,28,29]. In the case of diabetic neuropathy, the mechanism of microvascular pathogenesis is usually explained by facilitated glucose entry into the vascular endothelium via glucose transporters 1 (GLUT1) and 3 (GLUT3), which ensure passive diffusion of glucose along a concentration gradient and do not require insulin for its transport [30]. Excess glucose concentration in endothelial vessels activates several biochemical pathways, including protein kinase C (PKC), advanced glycation end products (AGEs), the polyol pathway, and the hexosamine biosynthetic pathway [31,32], while elevated glucose-6-phosphate levels activate the nuclear factor kappa B (NF-kB) pathway and stimulate Toll-like receptors (TLRs) [33,34]. The latter circumstance increases the likelihood of interaction between endothelial cells and bacterial endotoxin, which in turn leads to the release of the contents of Weibel-Palade bodies, one of the main components of which is von Willebrand factor (vWF), and an increased risk of thrombosis [35]. Suppression of carboxylesterase-1 activity in endothelial cells is one of the factors causing damage to these cells with subsequent pathological modification of blood vessels [36]. However, unlike diabetic neuropathy, the mechanisms of endothelial damage during the development of late consequences of subacute and subchronic organophosphate poisoning have not been studied. There is virtually no direct evidence of a causal relationship between intoxication with choline and carboxylesterase inhibitors (carbamates and/or organophosphates) and endothelial damage, although our experimental and analytical studies allow us to hypothesize about the trigger role of organophosphate intoxication in the aging process and the pathogenesis of neuropathy [6,28]. In any case, modern concepts of vasculopathy link the transformation of endothelial cells with changes in the ratio of immune system cells and the spectrum of their activity [37]. Age-related characteristics of these types of changes are poorly studied. Even less information exists on the immune response in older adults with age-related cardiovascular diseases, and there is a complete lack of information on similar changes in older adults with occupational diseases.
In our experiment, we examined the immunological profile of a unique cohort of occupational patients with subacute and chronic poisoning by organophosphates and their degradation products, which exhibit varying degrees of inhibitory activity against choline- and carboxylesterases. Given the specific nature of the study, patients were grouped by vaccination status for additional statistical evaluation. This revealed a two-fold difference in the proportion of vaccinated individuals in the OP group and no differences in the “sick/not sick” status. Regardless of vaccination status, patients with occupational diseases had a higher drug load. These factors should certainly be considered in further work to improve differential diagnosis using machine learning methods; they may impact the interpretation of the obtained results.
An analysis of well-being assessments revealed approximately equal levels of problems in thinking, anxiety, melancholy, and depression, as assessed by common cognitive tests, in both the control and OP groups. However, the OP group had a significantly higher incidence of balance and memory impairment. An analysis of neurological status also revealed more pronounced symptoms in the OP group, manifested by a higher number of abnormal wrist reflexes, cranial changes, impaired vibration and distal sensory input, and decreased abdominal, ankle and plantar reflexes.
In the OP group, a decrease in red blood cell count and hematocrit and a slight increase in platelet count were observed. However, white blood cell counts showed no differences between the two groups. This made it particularly interesting to analyze the results of T- and B-lymphocyte phenotyping.
To date, detailed B-cell phenotyping has enabled significant advances in the development of immunodiagnostics for a wide variety of diseases and premorbid conditions, including age-related ones, enabling improved preventive measures and therapeutic options. For example, it has been shown that the level of circulating plasma cells does not change significantly in patients regularly exposed to tobacco smoke. However, these patients exhibit an increase in the level of IgD–CD27+ memory B cells against a background of a decrease in “naive” IgD+CD27– B lymphocytes, which is also reflected in an inversion of the IgD–CD27+/IgD+CD27– cell ratio [38]. Studies of human red bone marrow have shown that in the age range from 24 to 88 years, the levels of circulating B-lymphocyte precursors, including pro-B cells (CD34+CD10+CD19+), pre-B cells (CD34−CD19+sIg− or CD19+cμ+sIg−), and immature B cells (sIgM+CD24hiIgD−CD10+CD38+), do not change significantly [39]. However, the composition of circulating B-lymphocytes changes significantly with aging. Thus, with increasing age, the level of IgD+CD27+ memory B cells in the blood may decrease, whereas the content of “naive” IgD+CD27− B cells and “double-negative” IgD–CD27− memory B cells may increase [40,41]. Although other researchers have noted a sharp decrease in “double-negative” IgD–CD27− memory B cells with aging [42], this cell population also showed a decreased capacity for somatic mutagenesis, which hampered the effective formation of high-affinity antibodies and could be associated with past infectious processes [43]. Experiments on laboratory animals have shown that the spleens of old mice had a higher level of plasma cells compared to young control mice, and with aging, a significant decrease in the proportion of plasma cells producing high-affinity antibodies was observed [44]. In addition, in the red bone marrow of old mice, plasma cells synthesizing both low-affinity and high-affinity antibodies were significantly reduced relative to the control.
In healthy volunteers, plasma cell levels remained stable in the 0–50 year age range [45], although there is evidence that both the relative and absolute levels of plasma cell precursors may decrease with age [46]. However, elderly individuals were found to have higher levels of B cells with long CDR3 regions of immunoglobulin V domains, indicating the accumulation of IgM and IgG genes that had been repeatedly subjected to somatic mutagenesis, as well as the formation of a stable pool of certain B cell clones in the peripheral blood [47]. This may result in low vaccination efficacy in elderly individuals and a reduced ability of B cells to recognize new antigens [48]. Moreover, B cells from older people are characterized by limited clonal diversity, an oligoclonal pattern of activation, elevated basal levels of somatic mutagenesis, and the robust expansion of only a limited number of B cell clones in response to antigens [49].
In contrast to the general indicators of the hematology analyzer, lymphocyte phenotyping revealed a 1.5-2-fold increase in the relative and absolute levels of circulating plasma cell precursors with the IgD-CD27++ phenotype and in the absolute number of cells with the CD27++CD38++ phenotype in OP group patients.
It is known that the relative and absolute content of plasma cell precursors can decrease with age [46]. At the same time, an increase in the level of the plasmablast subpopulation with the CD27++CD38++ phenotype was detected during vaccination [50,51]; in patients with malaria and COVID-19 [52]; in systemic sclerosis [53] and focal segmental glomerulosclerosis [54]; in the postoperative period (bariatrics) during the treatment of obesity (as an indicator of chronic inflammation) [55], and also in children with allergic asthma (type I allergic reaction) [56].
Furthermore, in the OP group, the absolute number of TEMRA cells - terminally differentiated effector memory T cells with high cytotoxicity and proinflammatory capacity, indicating or even determining immunosenescence - was increased by 2-fold [22]. At the same time, with a slight increase in CD56-CD57- pE1Tcyt subpopulation cells (type 1 pre-effectors), the proportion of CD56+CD57+ EM4 subpopulation cells was more than 2-fold reduced in patients with OP. NK cells play an important role in eliminating abnormal and tumor cells. The CD57+CD56+ NK phenotype corresponds to large granular lymphocytes [57]. In acute myeloid leukemia (AML), the level of CD56+CD57+ NK cells is increased, and their cytotoxic function is impaired. In addition, telomerase activity is increased in patients with AML, so that its inhibition leads to a decrease/normalization of the level of CD56+CD57+ NK cells [58]. NK cells with the CD56+CD57+NKG2C+ phenotype, along with CD8+ TEMRA and CD8±TCRγδ+ cells, exhibit high antiviral cytotoxic activity, so elevated levels of these cells have been observed in post-COVID complications (the so-called long-COVID) [59].
There are no data in the scientific literature on the dynamics of NK cells in the EM4 and pE1Tcyt subsets. At the same time, it has been established that the proportion of CD56bright and CD56dim NK cells in peripheral blood does not change with age, but the absolute number of CD56bright cells decreases almost 2-fold from an average value of 15.6/μL in individuals aged 20-40 years to 8.1/μL in individuals aged 60+ years [23]. Because this population plays a central role in cytokine secretion during the innate immune response, a decrease in NK cell numbers may contribute to immune dysregulation in the elderly. In some diseases, NK cells exhibit a maturation/activation defect, in which CD56dim NK cells fail to acquire a terminally differentiated phenotype [24].
5. Methodology
5.1. Study Participants
This study was conducted in accordance with the Declaration of Helsinki and was approved by the Institute Ethics Committee of the Research Institute of Hygiene, Occupational Pathology, and Human Ecology (Protocol No. 3, registration date June 2, 2022). All study participants provided informed consent. Patients with a history of occupational pathology caused by exposure to organophospates were retrospectively divided into two groups: control (n=59) and with occupational pathology (n=84).
5.2. Blood Collection
Blood samples were collected and processed in accordance with international guidelines [60]. Blood was collected from fasting subjects from the cubital vein into BD Vacutainer vacuum tubes with K2EDTA anticoagulant. Immunological and hematological analyses of whole blood were performed on the day of blood collection.
5.3. Hematological Analysis
Baseline parameters and histograms of the volume distribution of red blood cells, white blood cells, and platelets were determined using a Medonic hematology analyzer (Boule Diagnostics, Sweden).
5.4. Immunological Analysis
The main maturation and “polarized” subsets of CD4+ and CD8+ T cells and the main subsets of peripheral blood B-cells were analyzed according to previously described recommendations [61,62].
5.4.1. Flow Cytometry B-Cell Immunophenotyping
Whole peripheral blood samples (200 µl) for B cell immunophenotyping were stained with the following anti-human monoclonal antibodies: IgD-Alexa Fluor 488 (cat. 348216, BioLegend, Inc., San Diego, CA, USA), CD38-PE (cat. A07779, Beckman Coulter, Brea, CA, USA), CD5-ECD (cat. A33096, Beckman Coulter, Brea, CA, USA), CD27-PC7 (cat. A54823, Beckman Coulter, Brea, CA, USA), CD19-APC/Cy7 (cat. 302218, BioLegend, Inc., USA), and CD45-Krome Orange (cat. A96416, Beckman Coulter, Brea, CA, USA); all antibodies were used at the dilutions recommended by the manufacturers. After incubation at room temperature in the dark for 15 min, the red blood cells were lysed for 15 min by adding 2 ml of VersaLyse lysis solution (Beckman Coulter, Inc., Brea, CA, USA) supplemented with 50 μl of IOTest 3 fixative solution (Beckman Coulter, Inc., Brea, CA, USA). The cells were then washed twice (7 min, 330 g) with buffer (sterile phosphate-buffered saline (PBS) containing 2% heat-inactivated fetal bovine serum, Sigma-Aldrich, St. Louis, MO, USA) and resuspended in 0.5 ml of PBS containing 2% neutral buffered formalin solution (Sigma-Aldrich, St. Louis, MO, USA). The data were collected using a Navios flow cytometer (Beckman Coulter, Inc., Brea, CA, USA) equipped with 405, 488, and 638 nm lasers. At least 5,000 CD19+ B cells were collected from each sample for analysis.
5.4.2. T-Cell Immunophenotype by Flow Cytometry
Ten-color flow cytometry was used to analyze the surface phenotype of CD4+ and CD8+ T cells. 200 μL of whole peripheral blood samples were stained (15 min at room temperature in the dark) the following monoclonal antibodies: anti-CD57 FITC (cat. B49188), anti-CD56 PE (cat. A07788), anti-CD62L ECD (cat. IM2713U), anti-CD28 PC5.5 (cat. B24027), anti-CD27 PC7 (cat. A54823), anti-CD4 APC (cat. IM2468U), anti-CD8 APC-AF700 (cat. B49181), CD3-APC-AF750 (cat. B94680), anti-CD45RA Pacific Blue (cat. A82946), and anti-CD45 Krome Orange (cat. B36294). All antibodies were manufactured by Beckman Coulter (Indianapolis, IN, USA), and were used according to the manufacturer’s recommendations. Next, red blood cell lysed for 15 min in the dark with 2 mL of the VersaLyse Lysing Solution (Beckman Coulter, Inc., USA) supplied with 50 μL of the IOTest 3 Fixative Solution (Beckman Coulter, Inc., USA). Finally, the data were collected using a Navios flow cytometer (Beckman Coulter, Inc., Brea, CA, USA) equipped with 405, 488, and 638 nm lasers. At least 50,000 CD3+ T cells were analyzed in each sample.
5.4.3. Statistical Analysis
Flow cytometry data were analyzed using Kaluza 2.1 software (Beckman Coulter, Inc., Brea, CA, USA). All statistical analyses were performed using STATISTICA version 8.0 (StatSoft Inc., Tulsa, OK, USA) and GraphPad Prism version 8.0 (USA). Data were tested for normal distribution using the Shapiro-Wilk and Kolmogorov-Smirnov tests. Quantitative data are presented as median, quartile (Med (Q25; Q75)), and minimum to maximum range. Statistical analysis was performed using the Mann-Whitney test, and the distribution of features within groups was analyzed using Fisher’s exact test. Differences between groups were considered significant at p < 0.05.
6. Conclusion
A study of the immunological profile of a unique cohort of occupational patients with subacute and chronic poisoning with organophosphates and their degradation products revealed an increase in the relative and absolute levels of plasma cell precursors with the IgD–CD27++ phenotype and the absolute number of cells with the CD27++CD38++ phenotype in the OP group, an increase in the absolute number of TEMRA cells, but a decrease in the proportion of CD56+CD57+ cells of the EM4 subpopulation. The identified changes indicate additional immune dysregulation in elderly individuals with occupational pathology, which along with indicators of patients’ neurological and cognitive status can shed light on the pathogenesis of late-onset pathology and serve as important markers in differential diagnosis.
Supplementary Materials
The following supporting information can be downloaded at the website of this paper posted on Preprints.org.
Author Contributions
Conceptualization, N.V.G., T.A.K. and I.V.K.; data curation, I.V.K. and N.G.V.; investigation, T.A.K., I.V.K., A.A.R., E.A.K. and K.V.S.; supervision, N.V.G.; writing—original draft, N.V.G. and I.V.K.; writing—review and editing, N.V.G., D.A.B. and R.O.J. All authors have read and agreed to the published version of the manuscript.
Funding
The study was supported by the Russian Science Foundation, grant No. 22-15-00155-P.
Institutional Review Board Statement
The study was conducted in accordance with the Declaration of Helsinki and approved by the Ethics Committee of the Research Institute of Hygiene, Occupational Pathology, and Human Ecology of the Federal Medical and Biological Agency (Approval No. 3, registration date June 2, 2022).
Informed Consent Statement
Informed consent was obtained from all subjects participating in the study.
Data Availability Statement
The data presented in this study are available from the corresponding authors upon reasonable request. The data are not publicly available due to confidentiality.
Conflicts of Interest
The authors declare no conflict of interest.
Abbreviations
| AML | acute myeloid leukemia; |
| BMI | body mass index; |
| CM | central memory; |
| COIND | chronic organophosphate-induced neuropsychiatric disorder; |
| CVA | acute cerebrovascular accident; |
| CVD | cerebrovascular disease; |
| DM | type II diabetes mellitus; |
| EM | effector memory; |
| GID | gastrointestinal diseases; |
| IHD | ischemic heart disease; |
| MCH | mean corpuscular hemoglobin; |
| MCHC | mean corpuscular hemoglobin concentration; |
| MCV | mean corpuscular volume; |
| MMSE | Mini Mental State Examination; |
| MSSD | musculoskeletal system diseases; |
| NK | natural killer; |
| NLR | neutrophil-to-lymphocyte ratio; |
| OP | occupational pathology; |
| OPIDP | organophosphates-induced delayed polyneuropathy; |
| PKC | protein kinase C; |
| PNP | polyneuropathy; |
| SAGE | Self-Administered Gerocognitive Exam; |
| TEMRA | terminal effector memory re-expressing CD45RA; |
| vWF | von Willebrand factor. |
References
- Lehman, P.C.; Cady, N.; Ghimire, S.; Shahi, S.K.; Shrode, R.L.; Lehmler, H.J.; Mangalam, A.K. Low-dose glyphosate exposure alters gut microbiota composition and modulates gut homeostasis. Environ. Toxicol. Pharmacol. 2023, 100, 104149. [Google Scholar] [CrossRef] [PubMed]
- Ali, A.; AlHussaini, K.I. Pesticides: Unintended Impact on the Hidden World of Gut Microbiota. Metabolites 2024, 14, 155. [Google Scholar] [CrossRef]
- Cao, J.; Wang, X.; Lei, Y.; Jiang, X.; Kannan, K.; Li, M. Health Risks of Low-Dose Dietary Exposure to Triphenyl Phosphate and Diphenyl Phosphate in Mice: Insights from the Gut-Liver Axis. Environ. Sci. Technol. 2025, 59, 8960–8971. [Google Scholar] [CrossRef]
- Jokanović, M. Neurotoxic effects of organophosphorus pesticides and possible association with neurodegenerative diseases in man: A review. Toxicology 2018, 410, 125–131. [Google Scholar] [CrossRef]
- Shen, Z.X. Pyridostigmine bromide and Gulf War syndrome. Med. Hypotheses 1998, 51, 235–237. [Google Scholar] [CrossRef]
- Goncharov, N.V.; Belinskaia, D.A.; Avdonin, P.V. Organophospate-Induced Pathology: Mechanisms of Development, Principles of Therapy and Features of Experimental Studies. J. Evol. Biochem. Physiol. 2023, 59, 1756–1796. [Google Scholar] [CrossRef]
- Zhang, H.Y.; Wang, C.; Li, H.S. [Effect of organophosphate pesticides poisoning on cognitive impairment]. Zhonghua Lao Dong Wei Sheng Zhi Ye Bing Za Zhi 2021, 39, 313–316. [Google Scholar] [CrossRef]
- Neylon, J.; Fuller, J.N.; van der Poel, C.; Church, J.E.; Dworkin, S. Organophosphate Insecticide Toxicity in Neural Development, Cognition, Behaviour and Degeneration: Insights from Zebrafish. J. Dev. Biol. 2022, 10, 49. [Google Scholar] [CrossRef] [PubMed]
- Roe, K. An Alternative Explanation for Alzheimer’s Disease and Parkinson’s Disease Initiation from Specific Antibiotics, Gut Microbiota Dysbiosis and Neurotoxins. Neurochem. Res. 2022, 47, 517–530. [Google Scholar] [CrossRef]
- Jokanović, M.; Oleksak, P.; Kuca, K. Multiple neurological effects associated with exposure to organophosphorus pesticides in man. Toxicology 2023, 484, 153407. [Google Scholar] [CrossRef] [PubMed]
- Goncharov, N.V.; Popova, P.I.; Kudryavtsev, I.V.; Golovkin, A.S.; Savitskaya, I.V.; Avdonin, P.P.; Korf, E.A.; Voitenko, N.G.; Belinskaia, D.A.; Serebryakova, M.K.; Matveeva, N.V.; Gerlakh, N.O.; Anikievich, N.E.; Gubatenko, M.A.; Dobrylko, I.A.; Trulioff, A.S.; Aquino, A.D.; Jenkins, R.O.; Avdonin, P.V. Immunological Profile and Markers of Endothelial Dysfunction in Elderly Patients with Cognitive Impairments. Int. J. Mol. Sci. 2024, 25, 1888. [Google Scholar] [CrossRef] [PubMed]
- Goncharov, N.V.; Popova, P.I.; Nadeev, А.D.; Belinskaia, D.A.; Korf, E.A.; Avdonin, P.V. Endothelium, Aging, and Vascular Diseases. J. Evol. Biochem. Physiol. 2024, 60, 2191–2214. [Google Scholar] [CrossRef]
- Sweeney, M.D.; Zhao, Z.; Montagne, A.; Nelson, A.R.; Zlokovic, B.V. Blood-Brain Barrier: From Physiology to Disease and Back. Physiol. Rev. 2019, 99, 21–78. [Google Scholar] [CrossRef]
- Wang, Y.; Ke, D.; Chen, Y.; Zhang, C.; Liu, W.; Chen, L.; Pu, J. Decoding immune aging at single-cell resolution. Trends Immunol. 2025, S1471-4906(25)00220-0. [Google Scholar] [CrossRef]
- Worku, D.A. Ageing, Nutrition, and Infection: The Forgotten Triad. Br. J. Hosp. Med. (Lond). 2025, 86, 1–25. [Google Scholar] [CrossRef]
- Lagunas-Rangel, F.A. Neutrophil-to-lymphocyte ratio in aging: Trends and clinical implications. Exp. Gerontol. 2025, 211, 112908. [Google Scholar] [CrossRef]
- Libby, P.; Mallat, Z.; Weyand, C. Immune and inflammatory mechanisms mediate cardiovascular diseases from head to toe. Cardiovasc. Res. 2021, 117, 2503–2505. [Google Scholar] [CrossRef] [PubMed]
- Graham, E.L.; Weir, T.L.; Gentile, C.L. Exploring the Impact of Intermittent Fasting on Vascular Function and the Immune System: A Narrative Review and Novel Perspective. Arterioscler. Thromb. Vasc. Biol. 2025, 45, 654–668. [Google Scholar] [CrossRef]
- Bohnhorst, J.Ø.; Bjørgan, M.B.; Thoen, J.E.; Natvig, J.B.; Thompson, K.M. Bm1-Bm5 classification of peripheral blood B cells reveals circulating germinal center founder cells in healthy individuals and disturbance in the B cell subpopulations in patients with primary Sjögren’s syndrome. J. Immunol. 2001, 167, 3610–3618. [Google Scholar] [CrossRef] [PubMed]
- Sanz, I.; Wei, C.; Lee, F.E.; Anolik, J. Phenotypic and functional heterogeneity of human memory B cells. Semin. Immunol. 2008, 20, 67–82. [Google Scholar] [CrossRef]
- Hanley, P.; Sutter, J.A.; Goodman, N.G.; Du, Y.; Sekiguchi, D.R.; Meng, W.; Rickels, M.R.; Naji, A.; Luning Prak, E.T. Circulating B cells in type 1 diabetics exhibit fewer maturation-associated phenotypes. Clin. Immunol. 2017, 183, 336–343. [Google Scholar] [CrossRef]
- Guo, L.; Liu, X.; Su, X. The role of TEMRA cell-mediated immune senescence in the development and treatment of HIV disease. Front. Immunol. 2023, 14, 1284293. [Google Scholar] [CrossRef] [PubMed]
- Chidrawar, S.M.; Khan, N.; Chan, Y.L.; Nayak, L.; Moss, P.A. Ageing is associated with a decline in peripheral blood CD56bright NK cells. Immun Ageing. 2006, 3, 10. [Google Scholar] [CrossRef] [PubMed]
- Domaica, C.I.; Fuertes, M.B.; Uriarte, I.; Girart, M.V.; Sardañons, J.; Comas, D.I.; Di Giovanni, D.; Gaillard, M.I.; Bezrodnik, L.; Zwirner, N.W. Human natural killer cell maturation defect supports in vivo CD56(bright) to CD56(dim) lineage development. PLoS One 2012, 7, e51677. [Google Scholar] [CrossRef] [PubMed]
- Nielsen, C.M.; White, M.J.; Goodier, M.R.; Riley, EM. Functional Significance of CD57 Expression on Human NK Cells and Relevance to Disease. Front. Immunol. 2013, 4, 422. [Google Scholar] [CrossRef]
- Kudryavtsev, I.V.; Arsentieva, N.A.; Korobova, Z.R.; Isakov, D.V.; Rubinstein, A.A.; Batsunov, O.K.; Khamitova, I.V.; Kuznetsova, R.N.; Savin, T.V.; Akisheva, T.V.; Stanevich, O.V.; Lebedeva, A.A.; Vorobyov, E.A.; Vorobyova, S.V.; Kulikov, A.N.; Sharapova, M.A.; Pevtsov, D.E.; Totolian, A.A. Heterogenous CD8+ T Cell Maturation and ‘Polarization’ in Acute and Convalescent COVID-19 Patients. Viruses 2022, 14, 1906. [Google Scholar] [CrossRef]
- Fazan, V.P.; Rodrigues Filho, O.A.; Jordão, C.E.; Moore, K.C. Phrenic nerve diabetic neuropathy in rats: unmyelinated fibers morphometry. J. Peripher. Nerv. Syst. 2009, 14, 137–145. [Google Scholar] [CrossRef]
- Goncharov, N.V.; Nadeev, A.D.; Jenkins, R.O.; Avdonin, P.V. Markers and Biomarkers of Endothelium: When Something Is Rotten in the State. Oxid. Med. Cell. Longev. 2017, 2017, 9759735. [Google Scholar] [CrossRef]
- Musial, D.C.; Ajita, M.E.; Bomfim, G.H.S. Benefits of Cilostazol’s Effect on Vascular and Neuropathic Complications Caused by Diabetes. Med. Sci. (Basel) 2024, 13, 1. [Google Scholar] [CrossRef]
- Yazdani, S.; Bilan, P.J.; Jaldin-Fincati, J.R.; Pang, J.; Ceban, F.; Saran, E.; Brumell, J.H.; Freeman, S.A.; Klip, A. Dynamic glucose uptake, storage, and release by human microvascular endothelial cells. Mol. Biol. Cell 2022, 33, ar106. [Google Scholar] [CrossRef]
- Zhang, C.; Gu, L.; Xie, H.; Liu, Y.; Huang, P.; Zhang, J.; Luo, D.; Zhang, J. Glucose transport, transporters and metabolism in diabetic retinopathy. Biochim. Biophys. Acta Mol. Basis Dis. 2024, 1870, 166995. [Google Scholar] [CrossRef]
- Wang, N.; Zhang, C. Oxidative Stress: A Culprit in the Progression of Diabetic Kidney Disease. Antioxidants (Basel) 2024, 13, 455. [Google Scholar] [CrossRef] [PubMed]
- Yang, W.S.; Seo, J.W.; Han, N.J.; Choi, J.; Lee, K.U.; Ahn, H.; Lee, S.K.; Park, S.K. High glucose-induced NF-kappaB activation occurs via tyrosine phosphorylation of IkappaBalpha in human glomerular endothelial cells: Involvement of Syk tyrosine kinase. Am. J. Physiol. Renal Physiol. 2008, 294, F1065–F1075. [Google Scholar] [CrossRef] [PubMed]
- Pahwa, R.; Nallasamy, P.; Jialal, I. Toll-like receptors 2 and 4 mediate hyperglycemia induced macrovascular aortic endothelial cell inflammation and perturbation of the endothelial glycocalyx. J. Diabetes Complicat. 2016, 30, 563–572. [Google Scholar] [CrossRef]
- Belcher, J.D.; Chen, C.; Nguyen, J.; Milbauer, L.; Abdulla, F.; Alayash, A.I.; Smith, A.; Nath, K.A.; Hebbel, R.P.; Vercellotti, G.M. Heme triggers TLR4 signaling leading to endothelial cell activation and vaso-occlusion in murine sickle cell disease. Blood 2014, 123, 377–390. [Google Scholar] [CrossRef]
- Orcholski, M.E.; Khurshudyan, A.; Shamskhou, E.A.; Yuan, K.; Chen, I.Y.; Kodani, S.D.; Morisseau, C.; Hammock, B.D.; Hong, E.M.; Alexandrova, L.; Alastalo, T.P.; Berry, G.; Zamanian, R.T.; de Jesus Perez, V.A. Reduced carboxylesterase 1 is associated with endothelial injury in methamphetamine-induced pulmonary arterial hypertension. Am. J. Physiol. Lung Cell Mol. Physiol. 2017, 313, L252–L266. [Google Scholar] [CrossRef]
- Kawaguchi, Y.; Kuwana, M. Pathogenesis of vasculopathy in systemic sclerosis and its contribution to fibrosis. Curr. Opin. Rheumatol. 2023, 35, 309–316. [Google Scholar] [CrossRef]
- Pinto, T.N.C.; da Silva, C.C.B.M.; Pinto, R.M.C.; da Silva Duarte, A.J.; Benard, G.; Fernandes, J.R. Tobacco exposure, but not aging, shifts the frequency of peripheral blood B cell subpopulations. Geroscience 2024, 46, 2729–2738. [Google Scholar] [CrossRef] [PubMed]
- Rossi, M.I.; Yokota, T.; Medina, K.L.; Garrett, K.P.; Comp, P.C.; Schipul, A.H. Jr.; Kincade, P.W. B lymphopoiesis is active throughout human life, but there are developmental age-related changes. Blood 2003, 101, 576–584. [Google Scholar] [CrossRef]
- Frasca, D.; Diaz, A.; Romero, M.; Blomberg, B.B. Human peripheral late/exhausted memory B cells express a senescent-associated secretory phenotype and preferentially utilize metabolic signaling pathways. Exp. Gerontol. 2017, 87(Pt A), 113–120. [Google Scholar] [CrossRef]
- Frasca, D.; Diaz, A.; Romero, M.; D’Eramo, F.; Blomberg, B.B. Aging effects on T-bet expression in human B cell subsets. Cell Immunol. 2017, 321, 68–73. [Google Scholar] [CrossRef] [PubMed]
- Shi, Y.; Yamazaki, T.; Okubo, Y.; Uehara, Y.; Sugane, K.; Agematsu, K. Regulation of aged humoral immune defense against pneumococcal bacteria by IgM memory B cell. J Immunol. 2005, 175, 3262–3267. [Google Scholar] [CrossRef] [PubMed]
- Buffa, S.; Bulati, M.; Pellicanò, M.; Dunn-Walters, D.K.; Wu, Y.C.; Candore, G.; Vitello, S.; Caruso, C.; Colonna-Romano, G. B cell immunosenescence: different features of naive and memory B cells in elderly. Biogerontology 2011, 12, 473–483. [Google Scholar] [CrossRef] [PubMed]
- Han, S.; Yang, K.; Ozen, Z.; Peng, W.; Marinova, E.; Kelsoe, G.; Zheng, B. Enhanced differentiation of splenic plasma cells but diminished long-lived high-affinity bone marrow plasma cells in aged mice. J. Immunol. 2003, 170, 1267–1273. [Google Scholar] [CrossRef]
- Morbach, H.; Eichhorn, E.M.; Liese, J.G.; Girschick, H.J. Reference values for B cell subpopulations from infancy to adulthood. Clin. Exp. Immunol. 2010, 162, 271–279. [Google Scholar] [CrossRef]
- Caraux, A.; Klein, B.; Paiva, B.; Bret, C.; Schmitz, A.; Fuhler, G.M.; Bos, N.A.; Johnsen, H.E.; Orfao, A.; Perez-Andres, M.; Myeloma Stem Cell, Network. Circulating human B and plasma cells. Age-associated changes in counts and detailed characterization of circulating normal CD138- and CD138+ plasma cells. Haematologica 2010, 95, 1016–1020. [Google Scholar] [CrossRef]
- Wang, C.; Liu, Y.; Xu, L.T.; Jackson, K.J.; Roskin, K.M.; Pham, T.D.; Laserson, J.; Marshall, E.L.; Seo, K.; Lee, J.Y.; Furman, D.; Koller, D.; Dekker, C.L.; Davis, M.M.; Fire, A.Z.; Boyd, S.D. Effects of aging, cytomegalovirus infection, and EBV infection on human B cell repertoires. J. Immunol. 2014, 192, 603–611. [Google Scholar] [CrossRef]
- Frasca, D.; Blomberg, B.B. Obesity Accelerates Age Defects in Mouse and Human B Cells. Front. Immunol. 2020, 11, 2060. [Google Scholar] [CrossRef]
- de Bourcy, C.F.; Angel, C.J.; Vollmers, C.; Dekker, C.L.; Davis, M.M.; Quake, S.R. Phylogenetic analysis of the human antibody repertoire reveals quantitative signatures of immune senescence and aging. Proc. Natl. Acad. Sci. U. S. A. 2017, 114, 1105–1110. [Google Scholar] [CrossRef]
- Islas-Vazquez, L.; Alvarado-Alvarado, Y.C.; Cruz-Aguilar, M.; Velazquez-Soto, H.; Villalobos-Gonzalez, E.; Ornelas-Hall, G.; Perez-Tapia, S.M.; Jimenez-Martinez, M.C. Evaluation of the Abdala Vaccine: Antibody and Cellular Response to the RBD Domain of SARS-CoV-2. Vaccines (Basel) 2023, 11, 1787. [Google Scholar] [CrossRef]
- Schrezenmeier, E.; Rincon-Arevalo, H.; Jens, A.; Stefanski, A.L.; Hammett, C.; Osmanodja, B.; Koch, N.; Zukunft, B.; Beck, J.; Oellerich, M.; Proß, V.; Stahl, C.; Choi, M.; Bachmann, F.; Liefeldt, L.; Glander, P.; Schütz, E.; Bornemann-Kolatzki, K.; López Del Moral, C.; Schrezenmeier, H.; Ludwig, C.; Jahrsdörfer, B.; Eckardt, K.U.; Lachmann, N.; Kotsch, K.; Dörner, T.; Halleck, F.; Sattler, A.; Budde, K. Temporary antimetabolite treatment hold boosts SARS-CoV-2 vaccination-specific humoral and cellular immunity in kidney transplant recipients. JCI Insight 2022, 7, e157836. [Google Scholar] [CrossRef] [PubMed]
- Wildner, N.H.; Ahmadi, P.; Schulte, S.; Brauneck, F.; Kohsar, M.; Lütgehetmann, M.; Beisel, C.; Addo, M.M.; Haag, F.; Schulze Zur Wiesch, J. B cell analysis in SARS-CoV-2 versus malaria: Increased frequencies of plasmablasts and atypical memory B cells in COVID-19. J. Leukoc. Biol. 2021, 109, 77–90. [Google Scholar] [CrossRef]
- Agarbati, S.; Benfaremo, D.; Viola, N.; Paolini, C.; Svegliati Baroni, S.; Funaro, A.; Moroncini, G.; Malavasi, F.; Gabrielli, A. Increased expression of the ectoenzyme CD38 in peripheral blood plasmablasts and plasma cells of patients with systemic sclerosis. Front. Immunol. 2022, 13, 1072462. [Google Scholar] [CrossRef]
- Liu, J.; Qu, Z.; Chen, H.; Sun, W.; Jiang, Y. Increased levels of circulating class-switched memory B cells and plasmablasts are associated with serum immunoglobulin G in primary focal segmental glomerulosclerosis patients. Int. Immunopharmacol. 2021, 98, 107839. [Google Scholar] [CrossRef]
- Šlisere, B.; Arisova, M.; Aizbalte, O.; Salmiņa, M.M.; Zolovs, M.; Levenšteins, M.; Mukāns, M.; Troickis, I.; Meija, L.; Lejnieks, A.; Bīlande, G.; Rosser, E.C.; Oļeiņika, K. Distinct B cell profiles characterise healthy weight and obesity pre- and post-bariatric surgery. Int. J. Obes. (Lond). 2023, 47, 970–978. [Google Scholar] [CrossRef]
- Zhu, Y.; Jiang, Q.; Lei, C.; Yu, Q.; Qiu, L. The response of CD27+CD38+ plasmablasts, CD24hiCD38hi transitional B cells, CXCR5-ICOS+PD-1+ Tph, Tph2 and Tfh2 subtypes to allergens in children with allergic asthma. BMC Pediatr. 2024, 24, 154. [Google Scholar] [CrossRef]
- Kumagai, T.; Nakaseko, C.; Nishiwaki, K.; Yoshida, C.; Ohashi, K.; Takezako, N.; Takano, H.; Kouzai, Y.; Murase, T.; Matsue, K.; Morita, S.; Sakamoto, J.; Wakita, H.; Sakamaki, H.; Inokuchi, K.; Kanto CML and Shimousa Hematology Study Groups. Silent NK/T cell reactions to dasatinib during sustained deep molecular response before cessation are associated with longer treatment-free remission. Cancer Sci. 2020, 111, 2923–2934. [Google Scholar] [CrossRef] [PubMed]
- Dizaji Asl, K.; Rafat, A.; Movassaghpour, A.A.; Nozad Charoudeh, H.; Tayefi Nasrabadi, H. The Effect of -Telomerase Inhibition on NK Cell Activity in Acute Myeloid Leukemia. Adv. Pharm. Bull. 2023, 13, 170–175. [Google Scholar] [CrossRef]
- Galán, M.; Vigón, L.; Fuertes, D.; Murciano-Antón, M.A.; Casado-Fernández, G.; Domínguez-Mateos, S.; Mateos, E.; Ramos-Martín, F.; Planelles, V.; Torres, M.; Rodríguez-Mora, S.; López-Huertas, M.R.; Coiras, M. Persistent Overactive Cytotoxic Immune Response in a Spanish Cohort of Individuals With Long-COVID: Identification of Diagnostic Biomarkers. Front. Immunol. 2022, 13, 848886. [Google Scholar] [CrossRef]
- Barnes, P.W.; Mcfadden, S.L.; Machin, S.J.; Simson, E.; International Consensus Group for Hematology. The international consensus group for hematology review: Suggested criteria for action following automated CBC and WBC differential analysis. Lab. Hematol. 2005, 11, 83–90. [Google Scholar] [CrossRef]
- Kudryavtsev, I.V.; Arsentieva, N.A.; Batsunov, O.K.; Korobova, Z.R.; Khamitova, I.V.; Isakov, D.V.; Kuznetsova, R.N.; Rubinstein, A.A.; Stanevich, O.V.; Lebedeva, A.A.; Vorobyov, E.A.; Vorobyova, S.V.; Kulikov, A.N.; Sharapova, M.A.; Pevtcov, D.E.; Totolian, A.A. Alterations in B Cell and Follicular T-Helper Cell Subsets in Patients with Acute COVID-19 and COVID-19 Convalescents. Curr. Issues Mol. Biol. 2021, 44, 194–205. [Google Scholar] [CrossRef] [PubMed]
- Kudryavtsev, I.; Zinchenko, Y.; Serebriakova, M.; Akisheva, T.; Rubinstein, A.; Savchenko, A.; Borisov, A.; Belenjuk, V.; Malkova, A.; Yablonskiy, P.; Kudlay, D.; Starshinova, A. A Key Role of CD8+ T Cells in Controlling of Tuberculosis Infection. Diagnostics, 2023, 13, 2961. [Google Scholar] [CrossRef] [PubMed]
Figure 1.
Structure of groups by vaccination status and history of COVID-19. The statistical significance of the differences indicated relates to the distribution of categories within each group, and the next step of statistical analysis allows us to determine the specific component responsible (in our case, those vaccinated but not those who had COVID-19; see Table 1.1).
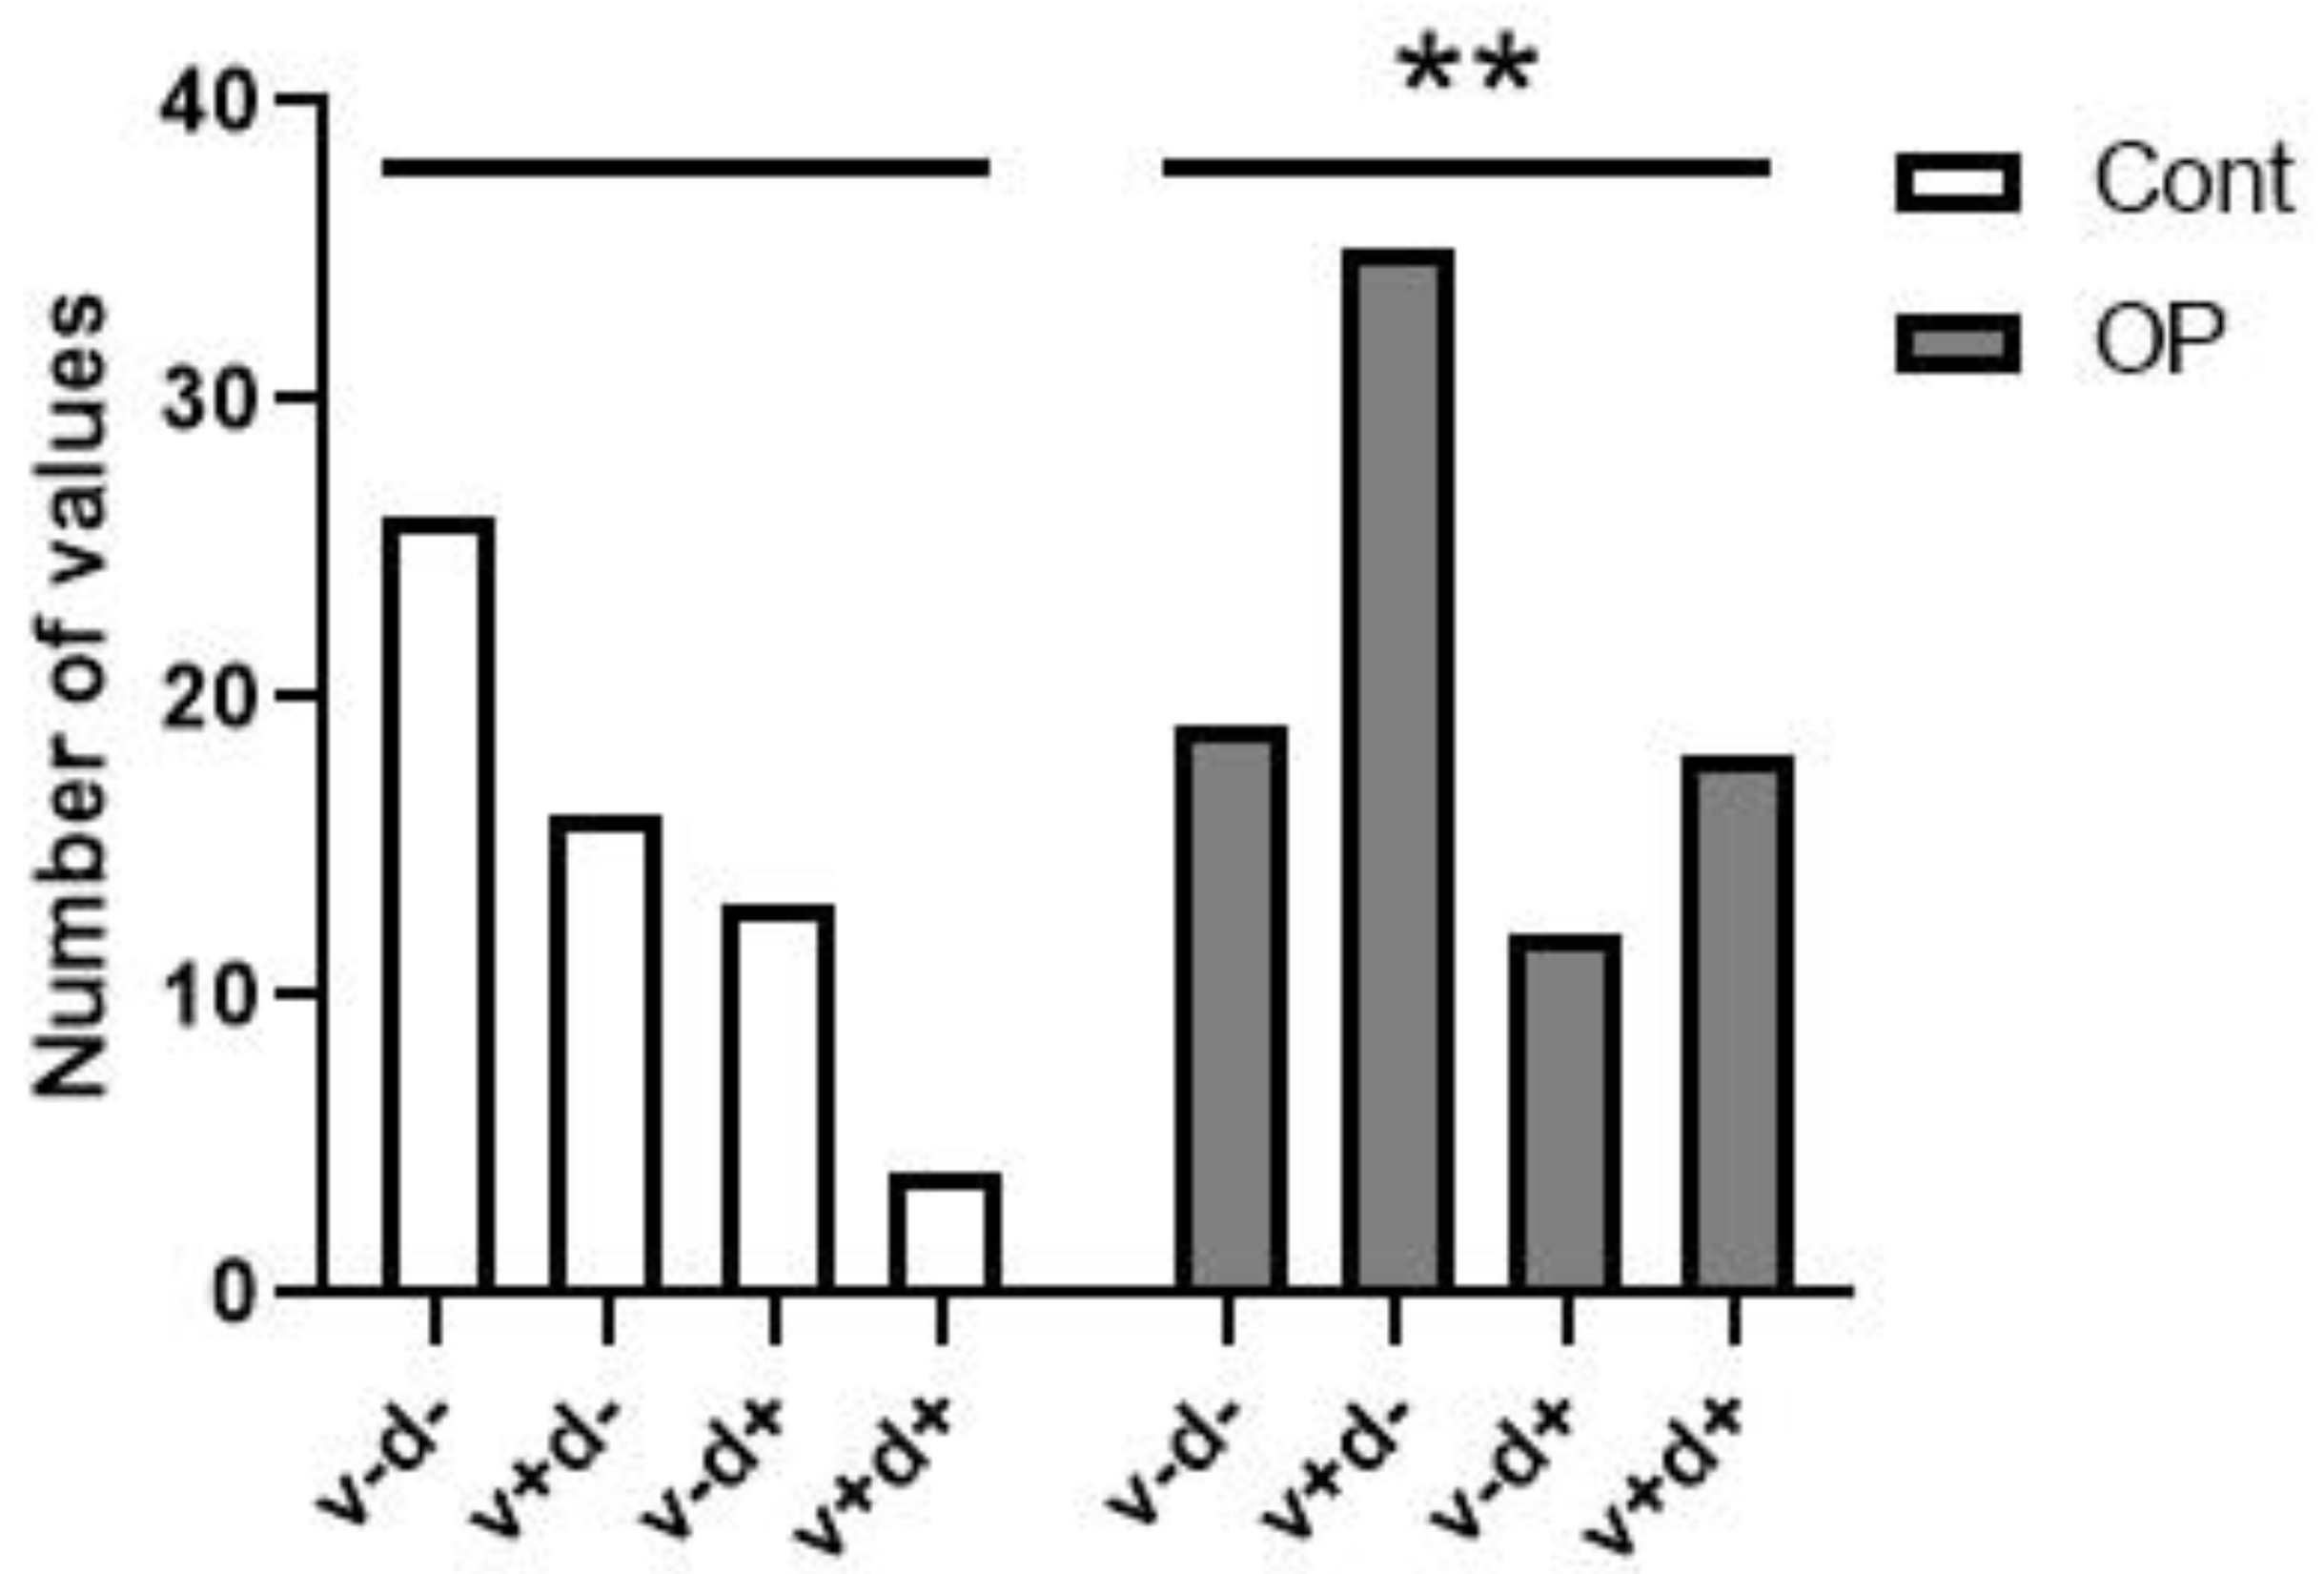
Figure 2.
Red blood cells.
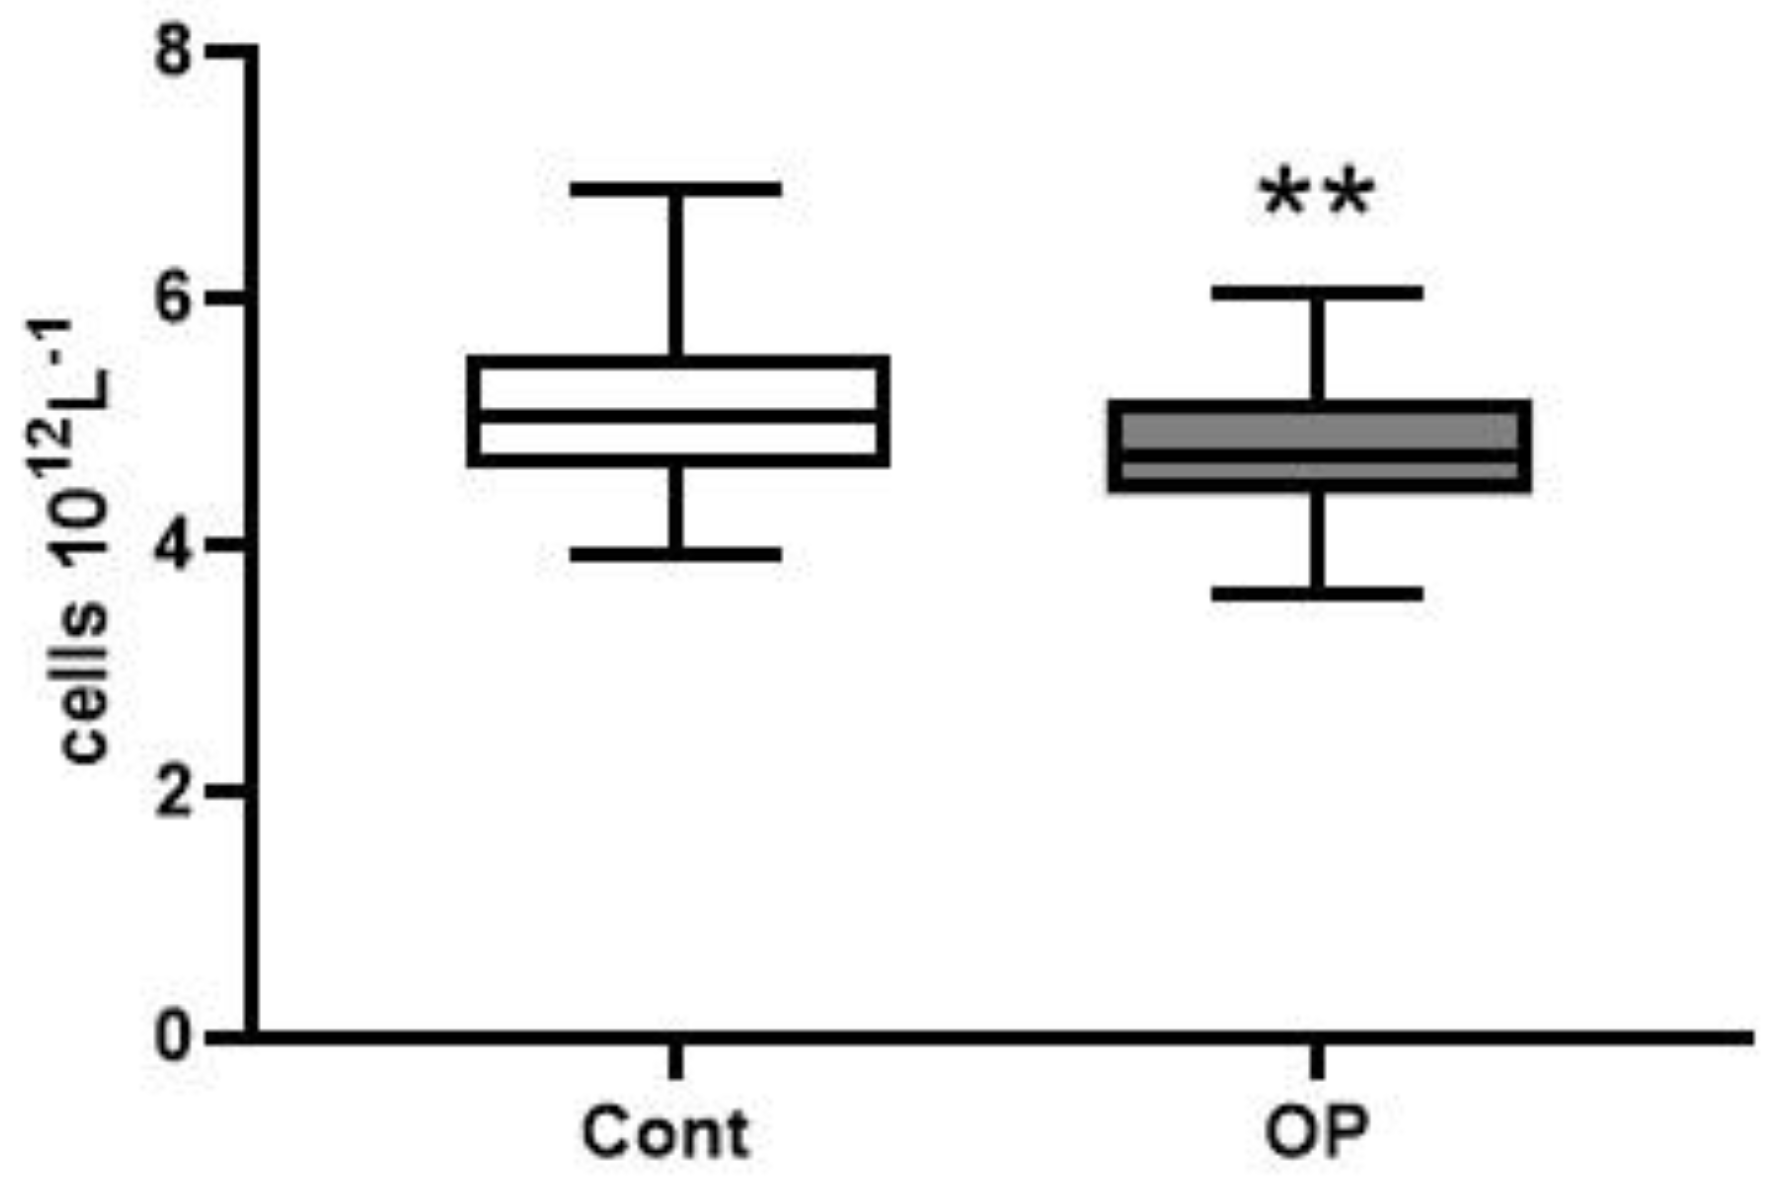
Figure 3.
Hematocrit.

Figure 4.
Platelets. The normal range is indicated by the dotted line.
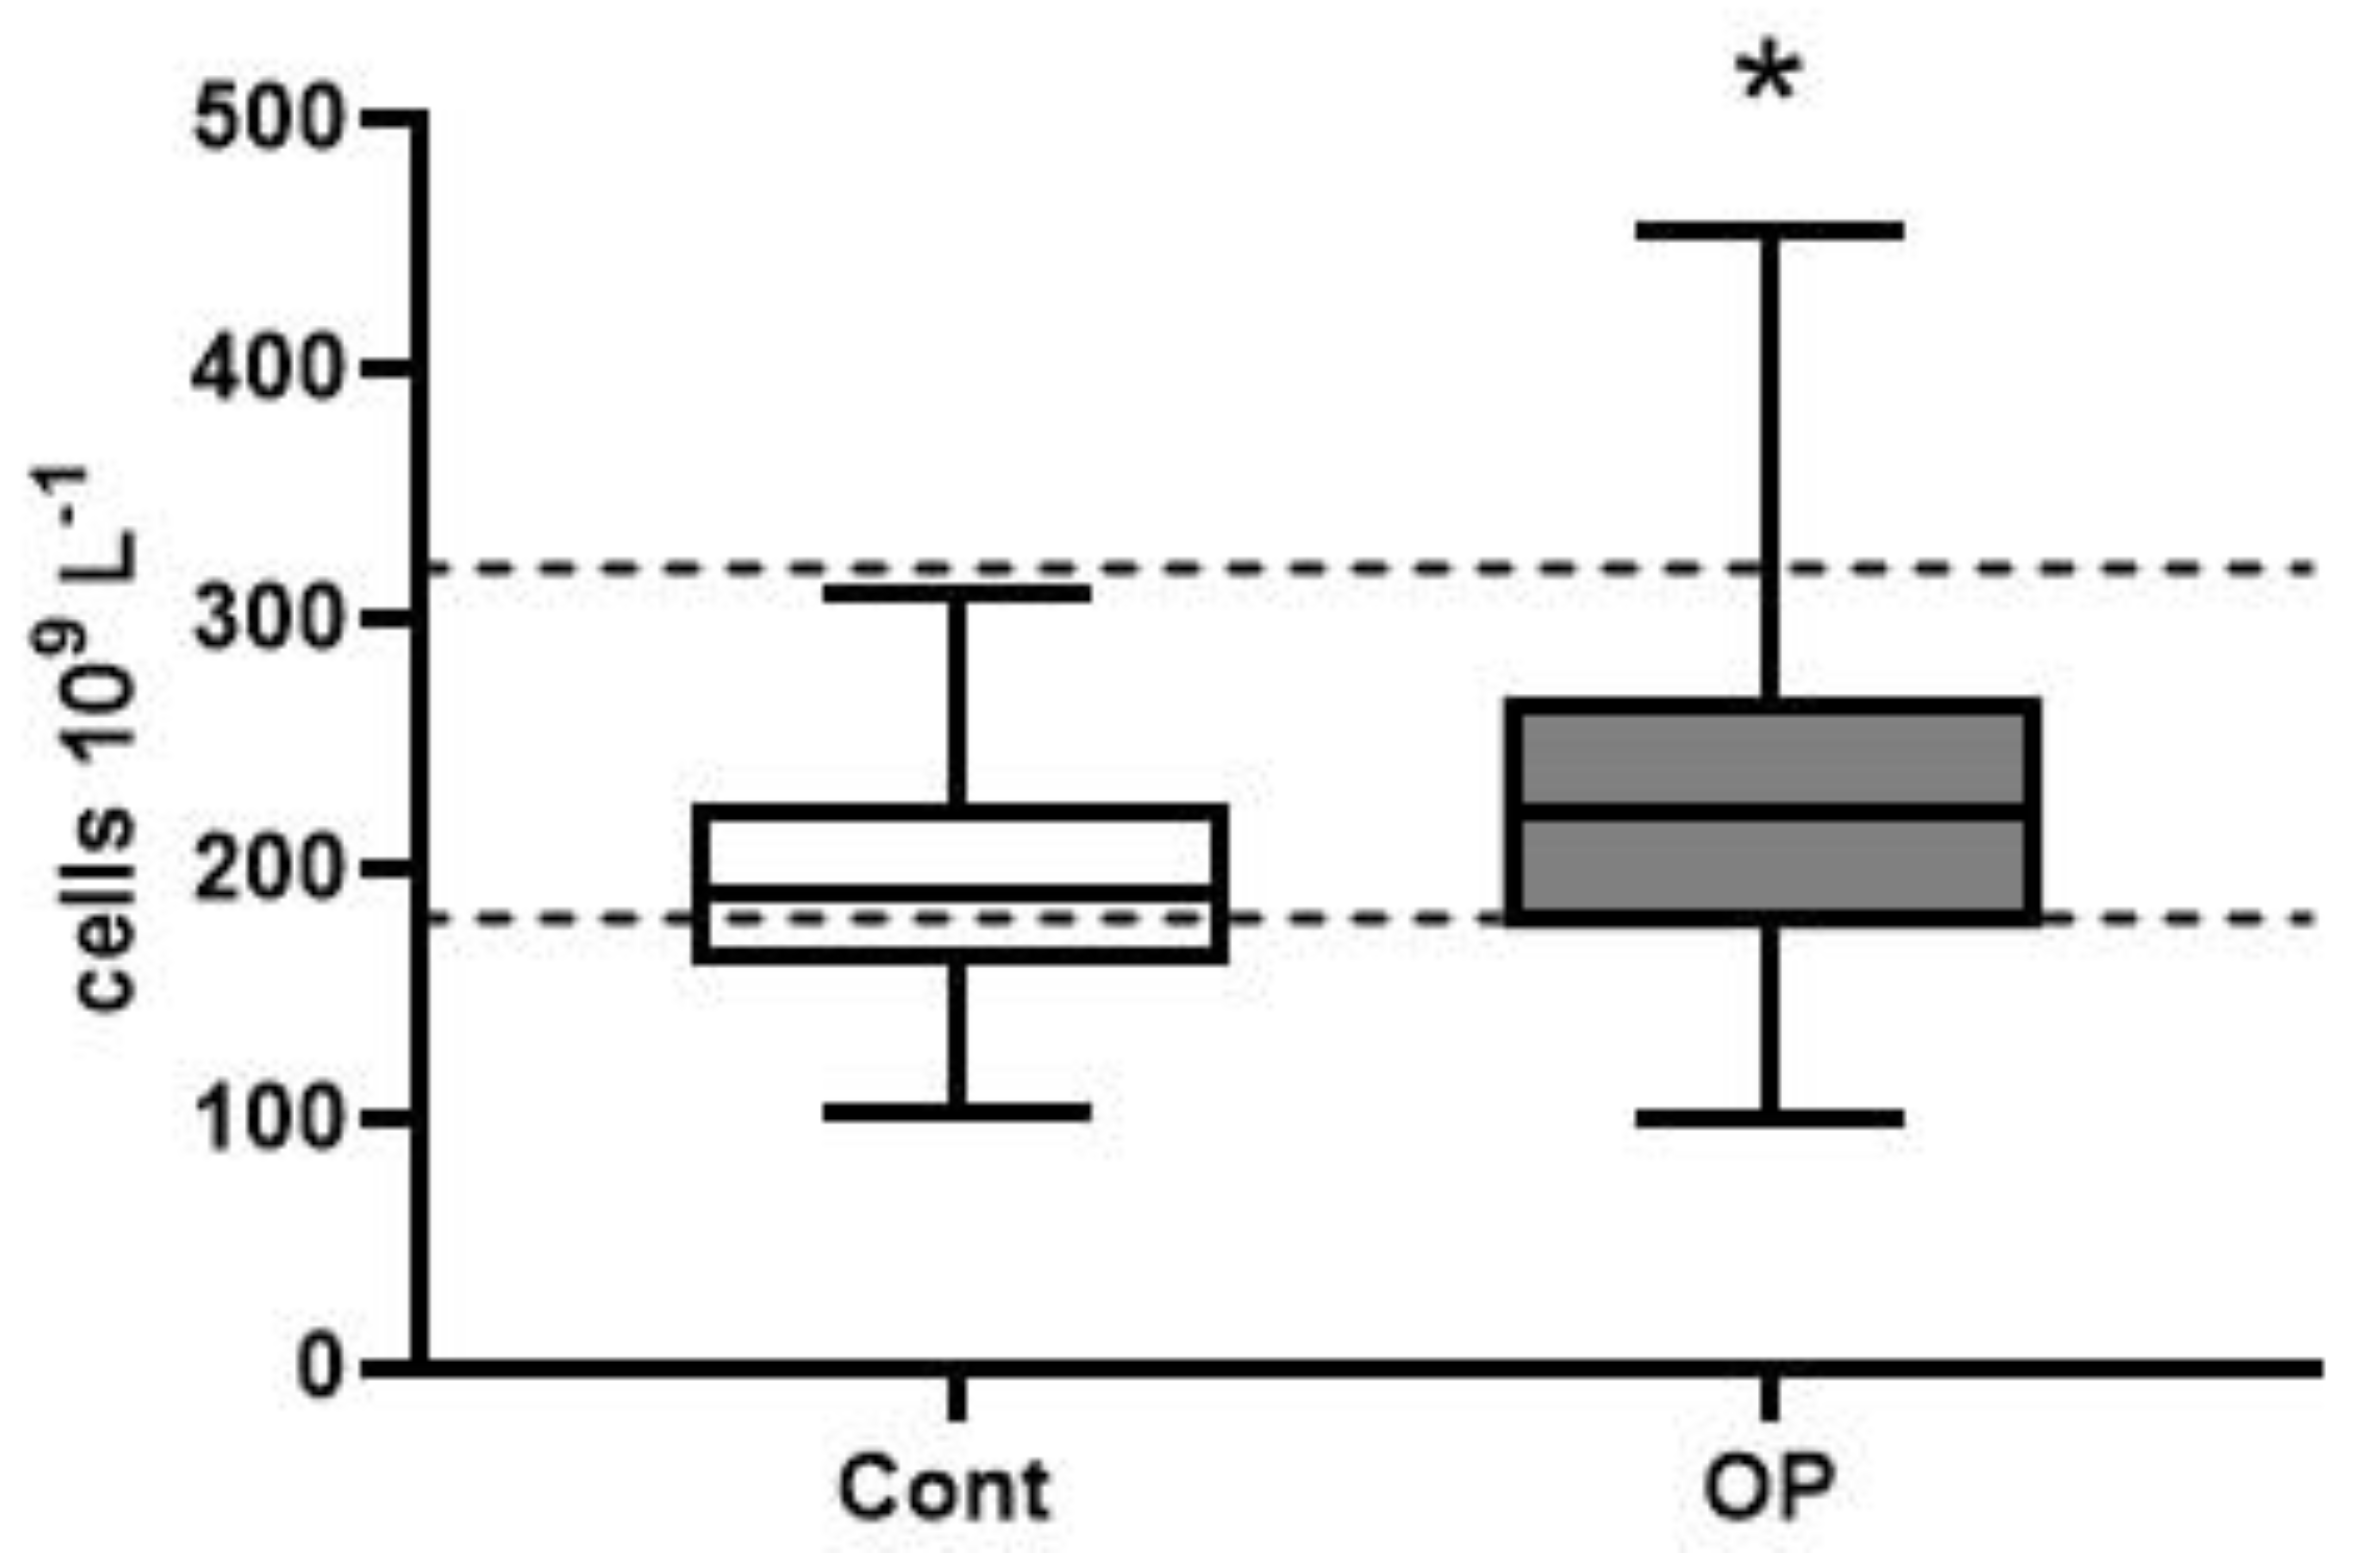
Figure 8.
TEMRA Th subpopulation (A - relative and B - absolute values). The relative (% within total circulating lymphocytes, plot A) and absolute (number of cell per 1 µL, plot B) frequencies of CD45RA+CD62L– TEMRA Th cells in the control (n=59, white) and OP (n=82, grey) groups. Quantitative data are presented as median, quartile (Med (Q25; Q75)), and minimum to maximum range. Statistical analysis was performed using the Mann-Whitney U-test.
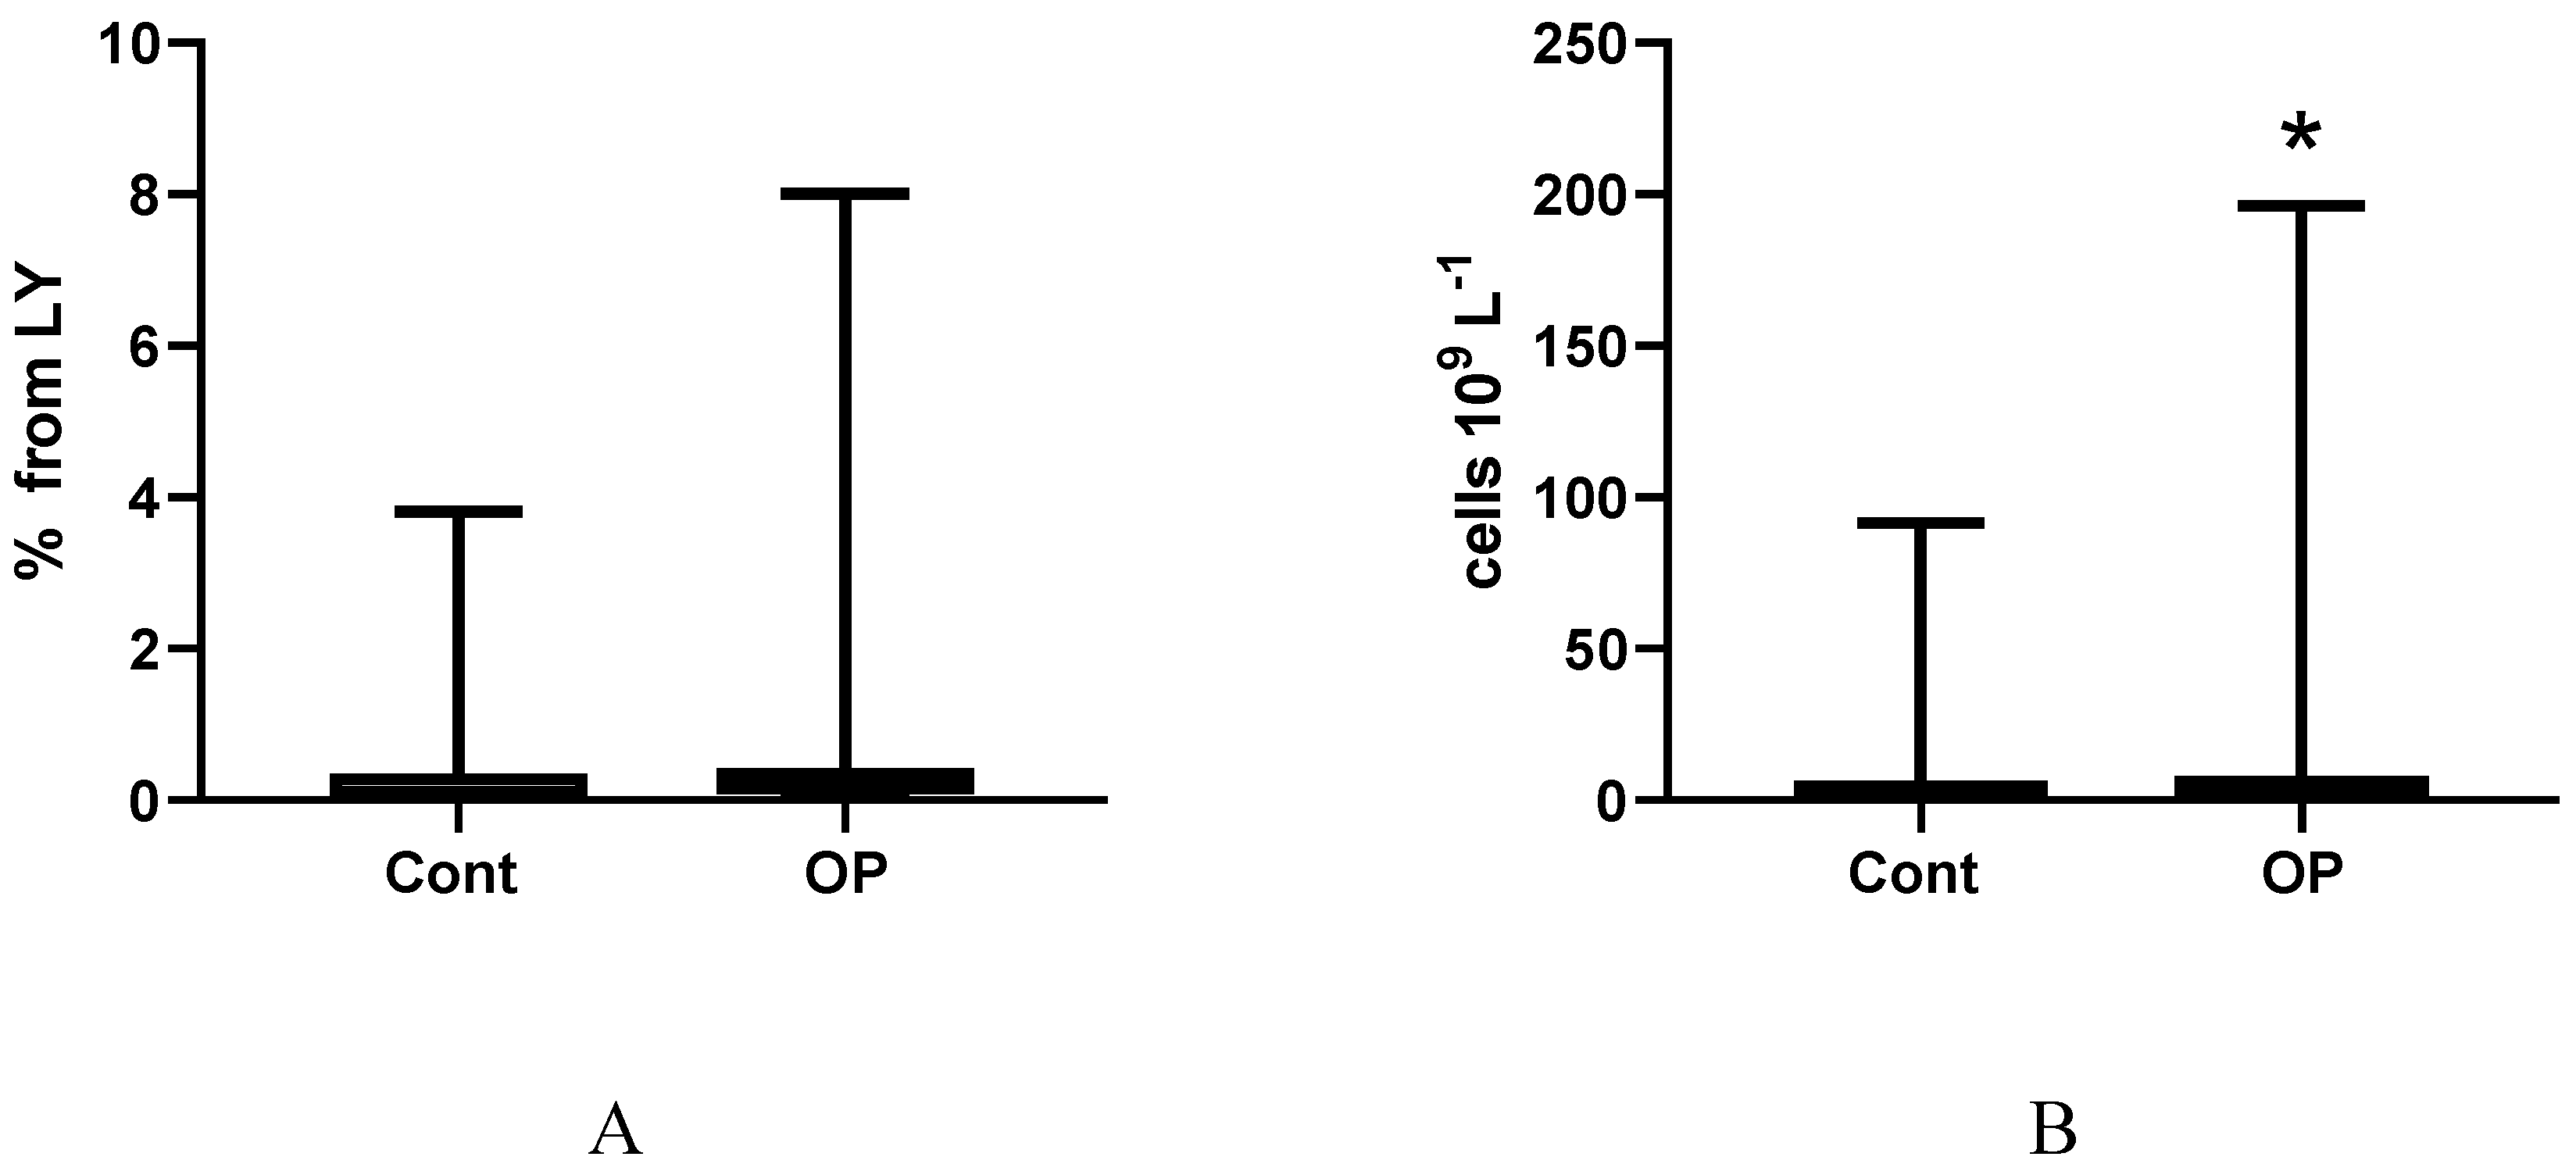
Figure 9.
T-cells 57 and 56 on Tcyt subpop. EM4 CD56+CD57+. The relative frequency of CD56+CD57+ cells within EM4 (CD27–CD28+CD45RA–CD62L–) CD8+ T cells in the control (n=59, white) and OP (n=82, grey) groups. Quantitative data are presented as median, quartile (Med (Q25; Q75)), and minimum to maximum range. Statistical analysis was performed using the Mann-Whitney U-test.
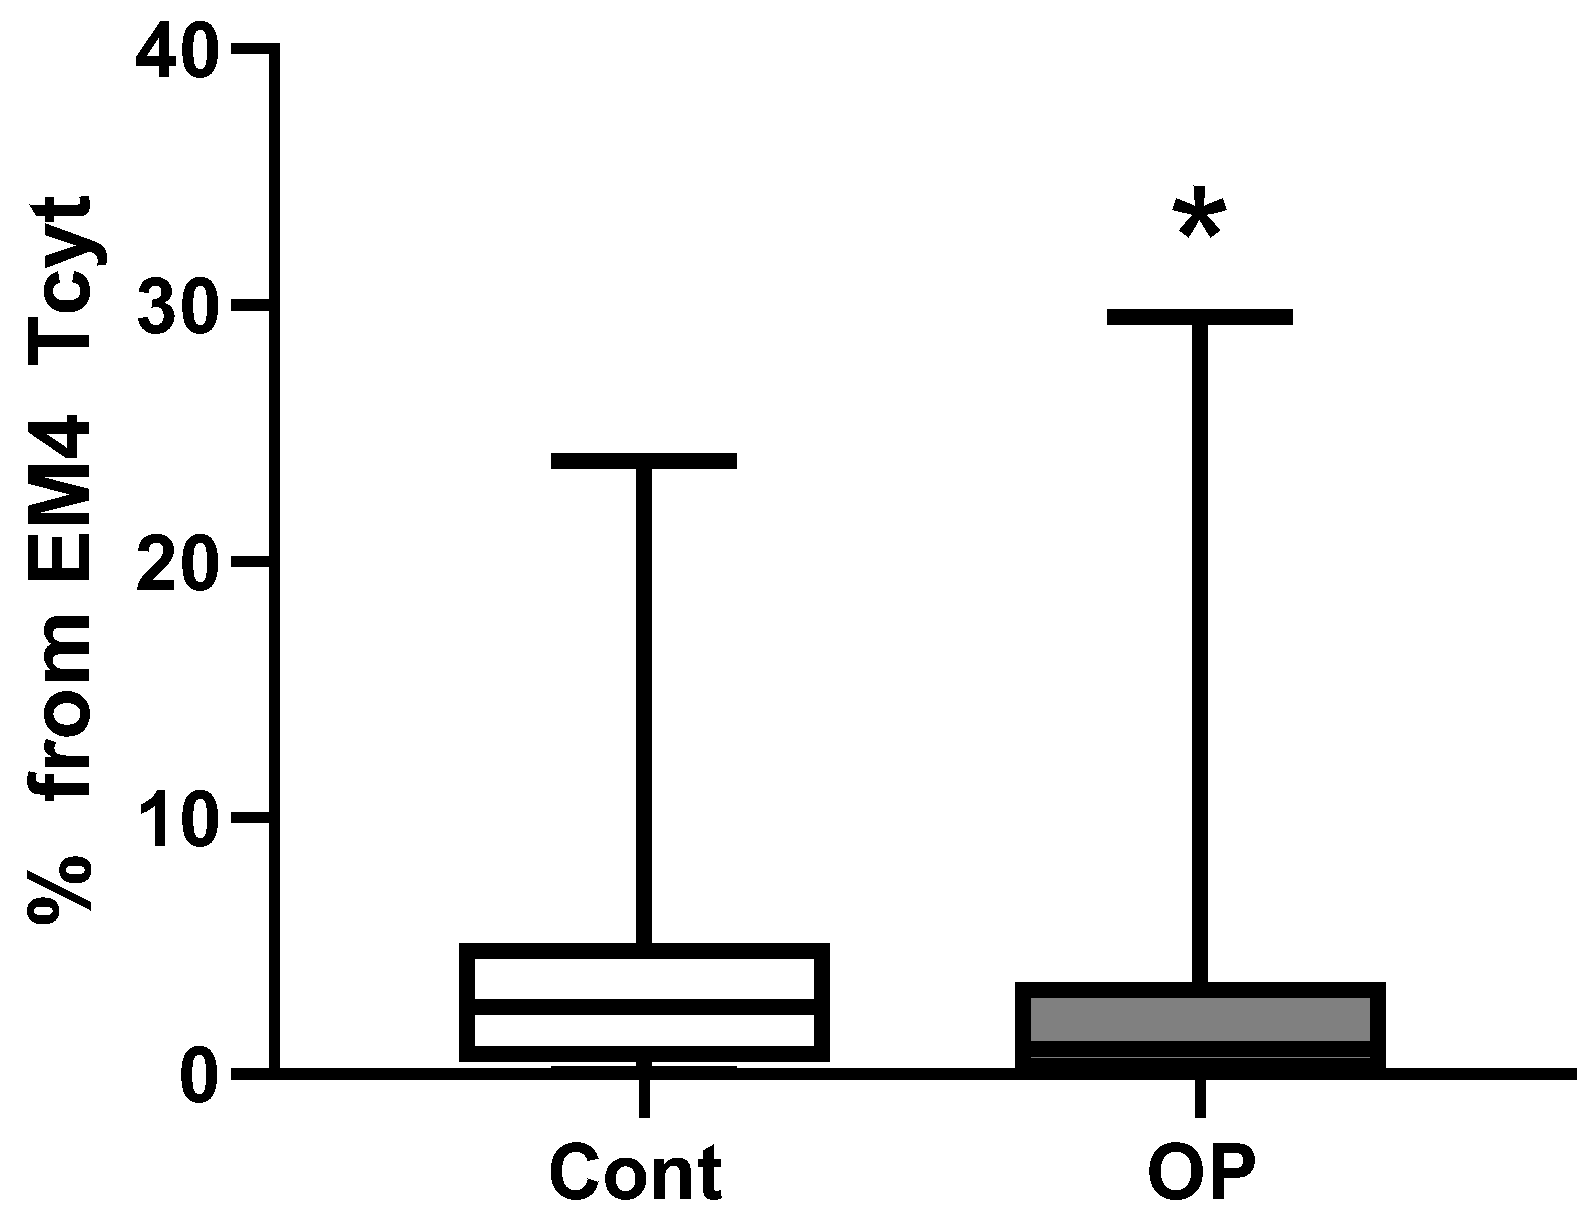
Figure 10.
T-cells 57 and 56 on Tcyt subpop. pE1 CD56-CD57-. The relative frequency of CD56–CD57– cells within pre-effector 1 (pE1, CD27+CD28+CD45RA+CD62L–) CD8+ T cells in the control (n=59, white) and OP (n=82, grey) groups. Quantitative data are presented as median, quartile (Med (Q25; Q75)), and minimum to maximum range. Statistical analysis was performed using the Mann-Whitney U-test.
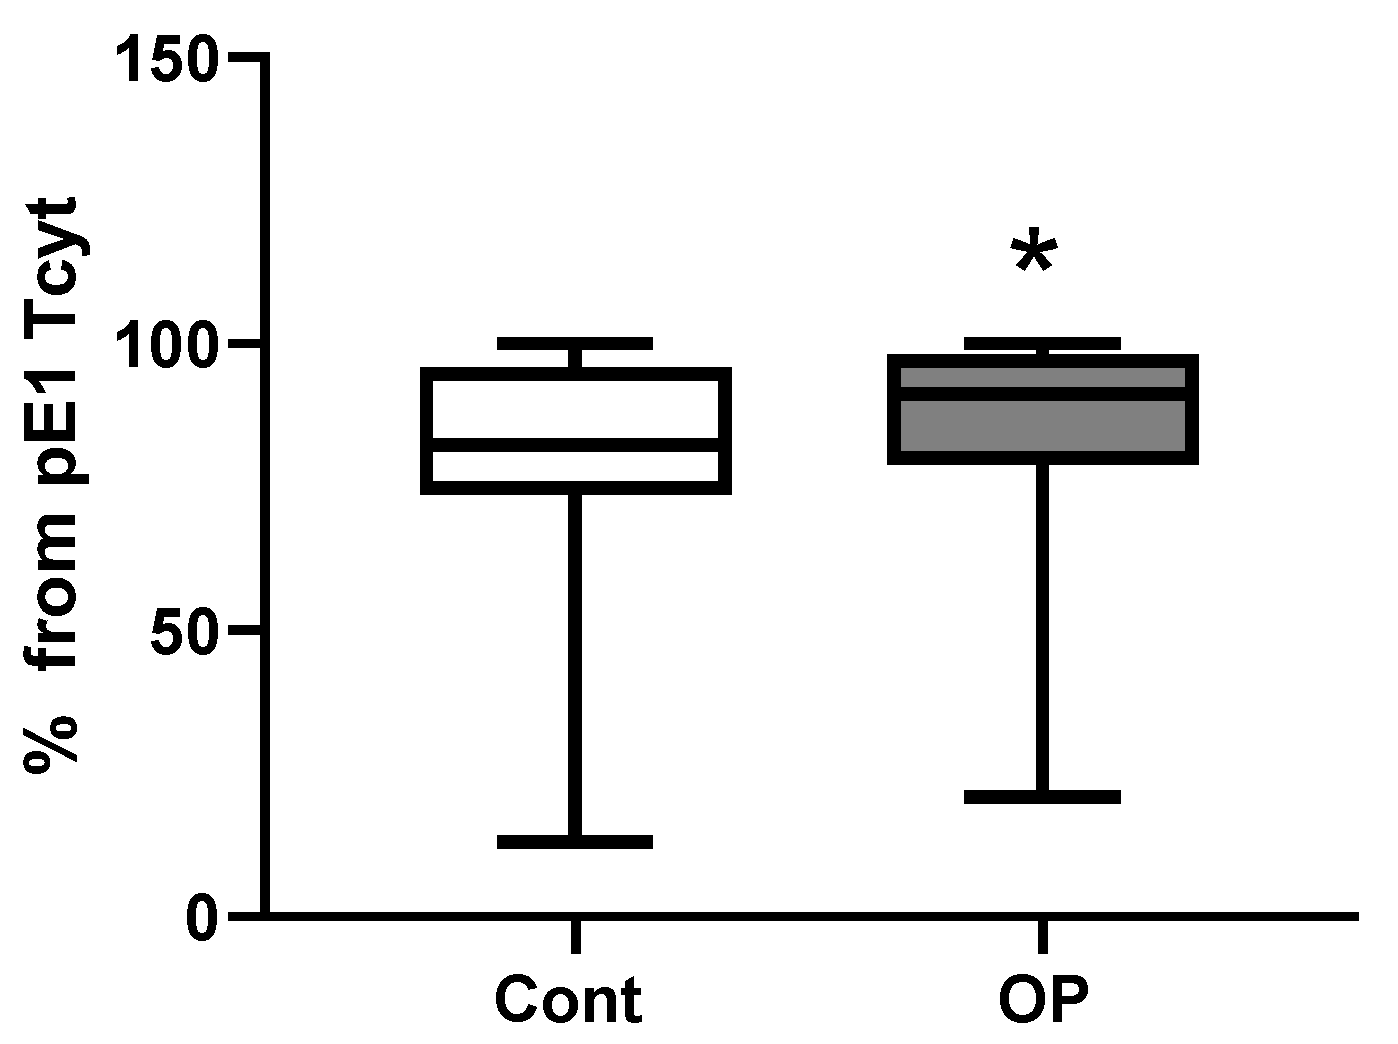

Table 1.
Characteristics of the sample of respondents. Age and BMI are presented as the mean and standard deviation; drug load - median, interquartile range and range from minimum to maximum; % - the proportion of the discussed feature in the sample under consideration.
Table 1.
Characteristics of the sample of respondents. Age and BMI are presented as the mean and standard deviation; drug load - median, interquartile range and range from minimum to maximum; % - the proportion of the discussed feature in the sample under consideration.
| Control | ОР | |
|---|---|---|
| Socio-demographic data | ||
| Number of people examined | 59 | 84 |
| Men | 17 (29%) | 24 (29%) |
| Women | 42 (71%) | 60 (71%) |
| Age, m±SD | 73±4 | 74±4 |
| BMI, m±SD | 28.4±4.1 n=59 |
30.0±4.6 * n=81 |
| BMI within normal range (18.5-25) | 13 (22.0%) | 13 (16.1%) |
| Overweight (BMI 25-30) | 27 (45.8%) | 28 (34.5%) |
| Obesity grade 1 (BMI 30-35) | 14 (23.7%) | 29 (35.8%) |
| Obesity grade 2 (BMI 35-40) | 4 (6.8%) | 9 (11.1%) |
| Obesity grade 3 (BMI 40 and more) |
1 (1.7%) | 2 (2.5%) |
| Proportion of smokers | 2 (3.4%) | 12 (14.6%) * |
| Education (higher) | 8 (14.5%) | 8 (10.4%) |
| Education (secondary specialized) | 33 (60.0%) | 56 (72.7%) |
| Education (secondary) | 14 (25.5%) | 13 (16.9%) |
| Vaccination | ||
| Non-recovered COVID-19 patients, not vaccinated | 26 (44.1%) | 19 (22.6%) |
| Vaccinated | 16 (27.1%) | 35 (41.7%) |
| Recovered | 13 (22.0%) | 12 (14.3%) |
| Recovered before or after vaccination, % | 4 (6.8%) | 18 (21.4%) |
| Grouped by “vaccinated” | 20 (34%) | 53 (63%) *** |
| Grouped by “recovered” | 17 (29%) | 30 (36%) |
| Drug load | 4 (3; 5) 0-20 n=58 |
5 (3; 8) *** 2-12 n=82 |
| Diseases | ||
| Ischemic heart disease (IHD) | 20 (34%) | 38 (46%) |
| Hypertention | 55 (95%) | 75 (91%) |
| Gastrointestinal diseases (GID), including hepatitis |
19 (32%) 4 (7%) |
45 (54%) * 27 (33%) *** |
| Diabetes mellitus (DM) | 10 (17%) | 19 (23%) |
| Oncological diseases | 3 (5%) | 4 (5%) |
| Musculoskeletal system diseases (MSSD) | 54 (92%) | 78 (95%) |
| Acute cerebrovascular accident (CVA) or chronic cerebrovascular disease (CVD) | 54 (92%) | 78 (95%) |
| Total with diagnosis of polyneuropathy (PNP), including DM |
39 (66%) | 71 (87%) ** |
| 8 (21%) | 16 (23%) | |
| PNP of the upper and lower extremities | 7 (12%) | 24 (29%) * |
*, **, *** - differences from control are statistically significant (p<0.05, p<0.01, p<0.001 ).
Table 2.
Self-assessment of cognitive impairment of participants.
| Response | Control | OP | |
| Self-assessment of memory and thinking problems | Yes | 23 (41.8%) | 45 (56.2%) |
| Sometimes | 25 (45.5%) | 31 (38.8%) | |
| No | 7 (12.7%) | 4 (5.0%) | |
| Self-assessment of balance problems | Yes | 38 (69%) | 66 (84%) * |
| No | 17 (31%) | 13 (16%) | |
| Self-assessment of feelings of anxiety, melancholy, depression | Yes | 24 (43.6%) | 45 (56.3%) |
| Sometimes | 25 (43.6%) | 25 (31.2%) | |
| No | 7 (12.8%) | 10 (12.5%) | |
| Self-assessment of personality change | Yes | 28 (50.9%) | 39 (48.8%) |
| No | 2 (3.6%) | 8 (10.0%) | |
| Do not know | 25 (45.5%) | 33 (41.2%) | |
| Self-assessment of difficulty in performing daily activities | Yes | 27 (49%) | 59 (75%) ** |
| No | 28 (51%) | 20 (25%) | |
| Data after grouping | |||
| There are problems with memory and thinking | 48 (87%) | 76 (95%) | |
| There is a feeling of anxiety, melancholy and depression | 48 (87%) | 70 (87%) | |
| There are personality changes | 28 (53%) | 39 (54%) | |
*, **, - differences from control are statistically significant (p<0.05, p<0.01).
Table 3.
Assessment of cognitive functions using the MMSE, SAGE, and “Clock” tests. Quantitative data are presented as median, quartile (Med (Q25; Q75)), and minimum to maximum range. Statistical analysis was performed using the Mann-Whitney U-test.
Table 3.
Assessment of cognitive functions using the MMSE, SAGE, and “Clock” tests. Quantitative data are presented as median, quartile (Med (Q25; Q75)), and minimum to maximum range. Statistical analysis was performed using the Mann-Whitney U-test.
| Control | OP | |
| MMSE | 27 (26; 28) 21-30 |
27 (26; 28) 13-31 |
| SAGE | 16 (12; 18) 6-21 |
16 (12; 18) 5-21 |
| “Clock” test | 9 (8; 10) 4-10 |
8 (7; 9) 4-10 |
| Total score for three tests | 51 (47; 54) 39-60 |
50 (46; 55) 24-61 |
Table 4.
Assessment of neurological status. Quantitative data are presented as median, quartile (Med (Q25; Q75)), and minimum to maximum range. Statistical analysis was performed using the Mann-Whitney U-test.
Table 4.
Assessment of neurological status. Quantitative data are presented as median, quartile (Med (Q25; Q75)), and minimum to maximum range. Statistical analysis was performed using the Mann-Whitney U-test.
| Control (n=59) | OP (n=82) | |
| Subjective symptoms (0 to 9) | 8 (6; 9) 1-9 |
8 (7; 9) * 3-9 |
| Presence of pathological foot reflexes | 4 (7%) | 6 (7%) |
| Presence of pathological wrist reflexes | 1 (2%) | 10 (12%) * |
| Impaired coordination (0 to 3 signs) | 2 (2; 2) 0-3 |
2 (2; 3) 1-3 |
| Cranial changes (0 to 6 signs) | 2 (1; 2) 0-4 |
2 (1; 3) *** 0-5 |
| Vibration sensitivity disorder | 47 (80%) | 77 (94%) * |
| Impaired distal sensitivity | 33 (56%) | 68 (83%) *** |
| Depression/absence of abdominal reflexes | 39 (66%) 15 (25%) |
55 (67%) 21 (26%) |
| Depression/absence of Achilles reflexes | 20 (34%) 24 (41%) |
34 (41%) 22 (27%) |
| Depression/absence of plantar reflexes | 28 (47%) 21 (36%) |
30 (37%) 30 (37%) |
| Hypothermia of the extremities | 4 (7%) | 5 (6%) |
| Hyperhidrosis of the extremities | 26 (44%) | 31 (38%) |
Disclaimer/Publisher’s Note: The statements, opinions and data contained in all publications are solely those of the individual author(s) and contributor(s) and not of MDPI and/or the editor(s). MDPI and/or the editor(s) disclaim responsibility for any injury to people or property resulting from any ideas, methods, instructions or products referred to in the content. |
© 2025 by the authors. Licensee MDPI, Basel, Switzerland. This article is an open access article distributed under the terms and conditions of the Creative Commons Attribution (CC BY) license (http://creativecommons.org/licenses/by/4.0/).
Copyright: This open access article is published under a Creative Commons CC BY 4.0 license, which permit the free download, distribution, and reuse, provided that the author and preprint are cited in any reuse.


