
Submitted:
28 November 2025
Posted:
02 December 2025
You are already at the latest version
Abstract
Developing effective CAR-T cell therapy for solid tumours remains challenging because of biological barriers such as antigen escape and an immunosuppressive microenvironment. The aim of this study is to develop a mathematical model of the spatio-temporal dynamics of tumour processes in order to assess key factors that limit treatment efficacy. We propose a reaction–diffusion model described by a system of partial differential equations for the densities of tumour cells and CAR-T cells, the concentration of immune inhibitors, and the degree of antigen escape. The methods of investigation include stability analysis and numerical solution of the model using a finite-difference scheme. The simulation results show that antigen escape leads to the formation of a persistent core within the tumour and subsequent relapse after an initial regression. We find that the efficacy of therapy critically depends on the balance between the rate of tumour-cell killing and the rate of resistance development, and that repeated administration of CAR-T cells provides deeper and more durable suppression of tumour growth compared with a single infusion. We conclude that the proposed model is a valuable tool for analysing and optimising CAR-T therapy protocols, and that our results highlight the need for combined strategies aimed at overcoming antigen escape.
Keywords:
tumour modelling
; reaction–diffusion equation
; spatio-temporal dynamics of tumour
; tumour growth
; simulations
; CAR-T therapy
; mathematical modelling
1. Introduction
The development of effective treatment modalities for solid tumours remains one of the most pressing and important challenges in contemporary oncology. Despite substantial advances in adoptive cell immunotherapy, most notably the successful use of chimeric antigen receptor T (CAR-T) lymphocytes in the treatment of haematological malignancies [1,2], the efficacy of CAR-T cell therapy against solid tumours remains limited by multiple biological and physical barriers [3,4]. The principal obstacles include impaired delivery and infiltration of CAR-T cells into the tumour matrix, the immunosuppressive influence of the tumour microenvironment, antigenic heterogeneity, as well as the risk of severe adverse effects, including cytokine release syndrome and immune effector cell-associated neurotoxicity [5,6,7]. Because of the complexity of the multilevel interactions between the tumour and the immune system, experimental methods alone are insufficient to fully explain the observed phenomena. Although in vitro experiments and animal models are indispensable, they are often time-consuming and costly and rarely provide a high-resolution spatio-temporal characterisation of the underlying processes [8,9]. Mathematical modelling therefore represents an effective tool for integrating experimental data, formulating testable hypotheses, identifying key mechanisms, and optimising therapeutic strategies [10,11]. Reaction–diffusion equations, originally proposed to explain morphogenetic processes [12], are of particular interest. Subsequently, this class of models has found wide application in ecology [13], chemistry [14], as well as in oncology and immunology [15,16]. The use of reaction–diffusion equations to model the tumour microenvironment is justified by the fact that they naturally combine two fundamental mechanisms: local cellular interactions and spatial propagation of cells and soluble factors [17,18].
CAR-T cells are genetically modified lymphocytes that express a chimeric antigen receptor enabling the recognition of tumour antigens independently of the major histocompatibility complex [4]. This makes it possible to overcome one of the key mechanisms by which the tumour evades the immune response. Nevertheless, under the conditions of solid tumours the efficacy of CAR-T cells is limited by a number of factors. Physical barriers include pathological angiogenesis accompanied by hypoxia and elevated interstitial pressure, as well as a dense extracellular matrix hindering cell migration [19]. Biological factors include the expression of immunoinhibitory ligands, the presence of regulatory T cells and tumour-associated macrophages of the M2 phenotype, and the secretion of immunosuppressive factors [4]. In the context of overcoming these barriers, a key challenge is the antigenic heterogeneity of the tumour and the associated mechanism of antigen escape [20]. This phenomenon is driven by the selective pressure exerted by CAR-T cells, leading to loss of target antigen expression on the surface of tumour cells and, consequently, to disease relapse [21]. Mathematical modelling capable of predicting the dynamics of such escape and evaluating strategies to overcome it therefore becomes a critically important tool.
Modern approaches to mathematical modelling in oncology are highly diverse and make it possible to capture the multiscale nature of tumour dynamics. Both classical models based on ordinary differential equations to describe population dynamics [22,23,24] and agent-based [25] and cellular automaton [26] models that account for stochasticity and spatial heterogeneity are widely used. For problems requiring explicit consideration of the spatial structure of the tumour and mechanical interactions, models based on partial differential equations are employed, including phase-field models [27,28], and multiscale hybrid approaches [29,30]. In recent years, fractional-calculus methods have undergone intensive development, enabling a more accurate description of memory effects and non-Markovian behaviour in biological systems [31,32,33,34]. A promising direction involves integrating artificial intelligence and big data analytics with mechanistic models to personalise predictions [35]. Numerical modelling of tumour growth based on the diffusion equation in a spatially heterogeneous medium can reproduce clinical growth curves and quantify the impact of tissue heterogeneity [36]. In parallel, the combined use of simulation-based modelling and artificial intelligence algorithms can substantially improve the diagnostic performance of thermometry-based cancer diagnosis [37].
Several mathematical models have been developed specifically to describe CAR-T cell therapy. Predator–prey-type models and systems of ordinary differential equations are widely used to analyse the kinetics of CAR-T cell – tumour cell interactions and to describe CAR-T cell proliferation, exhaustion and memory formation [38,39,40,41]. Such models have revealed a non-linear relationship between CAR-T cell dose, CAR-T cell exhaustion rate, and tumour-cell killing efficacy [38]. For problems involving solid tumours, where spatial gradients of cell and soluble-factor concentrations, as well as physical barriers, are of critical importance, models based on reaction–diffusion equations are the most appropriate [42,43]. Such spatially distributed models allow the study of CAR-T cell infiltration into the tumour matrix, the influence of the immunosuppressive microenvironment, and the heterogeneity of antigen distribution [21]. In particular, induction of the bystander effect, in which CAR-T cells indirectly activate an endogenous immune response against antigen-negative tumour cells, has been shown to be a promising strategy to overcome antigen escape [21]. Optimal control of therapy based on such models can substantially increase the chances of successful tumour eradication [42,43].
A review of microscopic and multiscale approaches for relating the molecular, cellular and tissue levels of tumour organisation is given in [56]. Classical reviews and models [18] demonstrate how comparatively simple systems of equations can describe tumour growth and the effects of various treatment regimens, while [54] proposes a model of tumour-nodule dynamics and its response to a single high-dose radiotherapy fraction, thereby allowing biological parameters to be calibrated from clinical observations. A comprehensive analysis of mathematical descriptions of cancer progression and the associated problems of therapy control is provided in [52], which emphasises the need to integrate qualitative analysis of dynamical systems with numerical modelling when interpreting clinical scenarios. In recent years, considerable attention has been devoted to the explicit representation of intratumoural heterogeneity, stochastic fluctuations and interactions between tumour cells and normal tissue. In [51], tumour growth is described as a stochastic process interacting with normal cells, thereby enabling investigation of the influence of stochastic effects and competition for resources on scenarios of tumour progression and regression. Modelling of multicellular tumour spheroids in [61] demonstrates that even in relatively simple in vitro systems mathematical analysis is necessary for a quantitative assessment of inter-patient and intratumoural variability. Spatially distributed models that incorporate angiogenesis and the structure of the vascular network are being developed, in particular, in [49,60], where the integration of mathematical models with time series data makes it possible to investigate the dynamics of tumour vascularisation and the dependence of antiangiogenic therapy efficacy on tumour size. The development of reaction–diffusion models of vascular tumours and combined treatment is proposed in [64], where stability and bifurcation analyses make it possible to describe different regimes of tumour recurrence and persistence.
Another important direction is the explicit inclusion of the immune response and immunotherapy in mathematical models. In [50], a model of breast cancer progression with immune-cell infiltration is proposed, which allows one to describe the relationship between tumour characteristics, the level of immune infiltration and disease outcomes. Models of competitive interactions between tumour and immune cells, including under chemotherapy, are developed in [59], where a symmetric system of competing populations is used to analyse the stability of different states and to identify regimes induced by therapy. More complex interaction schemes between tumour and immune system, including various immune-cell populations and the effects of combined targeted therapy, are considered in [63], where the joint action of FGFR and PD-1 inhibitors is studied and parameter combinations ensuring durable tumour control are identified. Using a mathematical modelling framework, Ghiyabi et al. [62] demonstrate how hypoxia and adenosine contribute to immune escape in DC-mediated immunotherapy. Their results highlight the importance of explicitly accounting for the tumour microenvironment when assessing the efficacy of immune strategies. In parallel, there has been active development of approaches based on fractional calculus in immuno-oncological models. In particular, [57] analyses a fractional-time model of tumour–immune system interactions under immunotherapy. The use of a modified He–Laplace algorithm makes it possible to obtain approximate analytical solutions and to demonstrate that the presence of memory in population dynamics substantially affects the rate of tumour elimination and the stability of therapeutic regimes. These results are consistent with the general trend towards incorporating non-Markovian effects and complex exposure histories into models of tumour growth. A separate class of studies is devoted to modelling drug resistance and the evolution of tumour subclones under therapy. The review [55] presents a systematic overview of mathematical approaches for describing and computationally predicting drug resistance, with an emphasis on the roles of heterogeneity and adaptive dynamics in treatment response. In [53], a model of tumour evolution incorporating subpopulations with differing drug sensitivities was developed, allowing analysis of transitions leading to dominance of resistant clones and evaluation of the efficacy of various dosing strategies. The study [58] details the dynamics of sensitive and resistant cells under chemotherapy for breast cancer, taking into account drug pharmacokinetics and resistance-induction processes. On this basis, optimal administration regimens and conditions for suppressing resistant subpopulations are investigated. These studies complement the classical models of tumour growth and treatment [18,54], substantiating the need to explicitly incorporate resistance mechanisms into the mathematical formulation already at the early stages of modelling.
The aim of the present study is to develop a mathematical model based on a system of reaction–diffusion equations to describe the spatio-temporal dynamics of the interaction between CAR-T cells and a solid tumour. The model is intended to take into account the key mechanism of resistance, namely antigen escape, as well as the influence of the immunosuppressive tumour microenvironment. Using numerical simulations, we aim to investigate how the rate of antigen escape and the level of tumour production of immune inhibitors affect the efficacy of CAR-T cell therapy.
This work is organised as follows. Section 2 presents the materials and methods of the study. SubSection 2.1 formulates the reaction–diffusion mathematical model of the interaction between CAR-T cells and a solid tumour taking into account the mechanism of antigen escape, SubSection 2.2 performs a linear stability analysis of the tumour-free equilibrium, SubSection 2.3 describes the numerical method based on a finite-difference approximation and an explicit Euler scheme, and SubSection 2.4 presents the software implementation of the computational algorithm. Section 3 reports the results of the numerical simulations: SubSection 3.1 analyses the overall spatio-temporal behaviour of the system and the formation of resistant regions within the tumour, SubSection 3.2 validates the dynamics of tumour growth on the basis of published clinical data, SubSection 3.3 investigates the influence of the rate of antigen escape on the efficacy of CAR-T therapy, SubSection 3.4 examines the combined effect of key model parameters and identifies parameter regions corresponding to successful tumour eradication, and SubSection 3.5 provides a comparative analysis of different temporal strategies for the administration of CAR-T cells under conditions of antigen escape. Section 4 discusses the biological and clinical implications of the results obtained, the limitations of the proposed model, and possible directions for its extension, while Section 5 summarises the main conclusions of the work and outlines the perspectives for further research.
2. Materials and Methods
2.1. Reaction–Diffusion Mathematical Model of the Spatio-Temporal Dynamics of the Interaction Between CAR-T Cells and a Solid Tumour
The dynamics of the interaction between CAR-T cells and a solid tumour are described by a system of partial differential equations that takes into account the spatio-temporal evolution of the cell populations, as well as the influence of microenvironmental factors:
where C is the density of CAR-T cells; T is the density of tumour cells; I is the concentration of immune inhibitors; and is the degree of tumour antigen escape.
The first equation of the system describes the spatial diffusion of CAR-T cells with diffusion coefficient , their proliferation under limited resources according to a logistic law with rate , cytotoxic interactions with tumour cells that depend on the level of antigen escape , as well as inhibition by microenvironmental factors and natural cell death. The second equation characterises the dynamics of the tumour population. The cells spread with diffusion coefficient , proliferate with rate , undergo lysis by CAR-T cells and experience natural cell death. The third equation reflects the kinetics of the immune inhibitors. They decay at a constant rate , while their production is induced by tumour cells with intensity . The last equation describes the process of tumour antigen escape, for which the growth rate of the escape degree is proportional to the density of tumour cells and bounded by the maximal value . A diagram of the interactions between the key components of the model is shown in Figure 1.
Thus, system (1) describes the spatio-temporal dynamics of the competing and interacting populations of CAR-T cells, tumour cells and immune inhibitors, taking into account tumour adaptive mechanisms [44].
Table 1 presents the initial values of the free parameters that are used in the proposed reaction–diffusion mathematical model. This table is key for the reproducibility of the results, as it defines the baseline conditions for the numerical simulations. It is important to note that a substantial proportion of the parameters in this work is used for the first time to describe specific interactions within this model. As no direct analogues for these parameters were available in the literature, their values were estimated by parameter fitting.
2.2. Linear Stability Analysis of the Tumour-Free Equilibrium of the Mathematical Model
Consider the system (1) in a neighbourhood of tumour-free equilibrium
where the steady-state values satisfy . Hence, there are two possibilities: or (for ). The parameter is arbitrary, because for the equation for degenerates and its value does not affect stationarity of the system.
To analyse stability, we write down the Jacobian of the reaction part of system (1). Let and , where
Then the general form of the Jacobian is
Substituting the steady-state values into (2), we obtain the Jacobian at the tumour-free point:
We consider small spatial perturbations of the form , where is the wave vector. Then the Laplace operator is replaced by , and the linear problem takes the form
Computing the determinant yields a factorised form of the characteristic polynomial:
From (4) the four eigenvalues follow directly:
The first eigenvalue, , reflects a neutral direction in the variable : for there is no change in , and this variable does not influence the dynamics of the remaining components at the linear level. The second eigenvalue, , is always negative for , which corresponds to stable inhibitor dynamics. The third and fourth eigenvalues describe the evolution of CAR-T cells and the tumour, respectively. For the C-mode, stability is ensured by the condition
and for the T-mode by
Since the addition of the diffusion terms and only decreases the real parts of , it is sufficient to check these inequalities at .
Thus, the tumour-free state is linearly stable provided three conditions are satisfied:
If (CAR-T cells are absent), the last inequality yields , which corresponds to positive tumour growth for . In the presence of a stable level of CAR-T cells, (for ), we have
and the condition for tumour elimination takes the form
This relationship shows that high efficacy of CAR-T therapy (large , small and moderate ) leads to a negative , thereby ensuring stability of the tumour-free state and disappearance of the tumour cells.
Figure 2 shows the region in the parameter plane in which the tumour-free equilibrium is linearly stable. The stability region is bounded by the curve obtained from condition (7) and demonstrates that a high rate of tumour-cell killing can compensate even for substantial values of the initial degree of antigen escape .
2.3. Numerical Method for Solving the System of Differential Equations
To obtain a numerical solution of the system of differential equations (1), we used the finite-difference method on a regular rectangular grid. The main idea of this method is to partition the domain into a uniform grid and replace derivatives by finite-difference approximations.
We represent the spatial domain in the form of a rectangular uniform grid. The spatial variables x and y are replaced by discrete points with steps and , respectively:
The grid steps are calculated as
where and are the domain sizes, and and are the numbers of nodes.
For each interior point , the second derivatives were approximated by second-order central differences:
Then the two-dimensional Laplacian is approximated by
Equation (13) is the classical five-point Laplace stencil on a rectangular grid and has second-order accuracy.
Neumann boundary conditions (second-type boundary conditions) are imposed on the boundaries:
where is the normal derivative and is the boundary of the domain.
This means that the flux across the boundary is zero, i.e. there is no exchange of material across the domain boundary.
For the time derivative, an explicit Euler scheme was used:
where is the value of the variable C at the n-th time step, is its value at the next step, and is the time step.
For the explicit Euler scheme there is a restriction on the time step to ensure stability of the numerical method. This condition is given by the Courant–Friedrichs–Lewy criterion:
where .
This condition guarantees that the model remains stable at each time step.
Analogous numerical schemes were applied to the variable T.
2.4. Software for Numerical Simulations
A block diagram of the programme implementing the numerical algorithms described above for solving the system of differential equations (1) is shown in Figure 3.
The programme starts by specifying the model parameters from Table 1, the geometric parameters of the domain, the grid size, the number of time steps and the discretisation intervals. The stability of the explicit Euler scheme is then checked using formula (16); if the condition is violated, a warning is issued. After that, vectors are created for the model variables, initial conditions are specified, the initial distribution of tumour cells is formed, and CAR-T cells are introduced into the central cell.
The main part of the programme is a time loop in which the state of the system is updated step by step. At each step, all grid nodes are traversed, the indices of neighbouring cells are determined taking into account reflecting Neumann boundary conditions (14), Laplacians are computed using central differences (13), and the values are updated according to the explicit Euler scheme (15). Subsequently, physically realistic constraints are applied, the variable arrays are updated for the next step, and at prescribed intervals the results are saved to CSV files. The loop continues until the final simulation time is reached, after which the programme terminates.
3. Results
3.1. Overall Behaviour of the System: Spatial Distribution of Cell Populations and Biochemical Factors in a Solid Tumour
To analyse the spatial heterogeneity of the tumour microenvironment and the distribution of cell populations, numerical simulations of the spatio-temporal dynamics of the reaction–diffusion system were performed. We considered a domain corresponding to a cross-section of a solid tumour, within which the densities of tumour cells and CAR-T cells , the concentration of immune inhibitors and the degree of antigen escape evolve.
Figure 4 shows one-dimensional profiles along a representative cross-section of the tumour at several characteristic time points. For each time point, the distributions of tumour-cell density, CAR-T cell density, immune-inhibitor concentration and antigen-expression level are plotted. At the initial stage of the simulation, the tumour has a relatively homogeneous distribution in the central part of the domain, antigen expression is high, and the concentration of immune inhibitors is negligible. After the administration of CAR-T cells, a pronounced gradient in their density is formed. The highest values are attained near the tumour nodule, which corresponds to intensive infiltration into the tumour matrix.
As the interaction between CAR-T cells and tumour cells develops, a reduction in tumour-cell density is observed in the central region of the tumour and a zone of partial tumour regression is formed, whereas higher concentrations of tumour cells are maintained in the periphery. At the same time, the concentration of immune inhibitors produced by the tumour increases, with its maximum localised in the central part, where the tumour-cell density was initially highest. This leads to the formation of an immunosuppressive core in which CAR-T cell activity is effectively suppressed. The degree of antigen escape also increases in the central region, which reduces the efficiency with which CAR-T cells recognise tumour cells and shifts the zone of effective cytotoxic activity towards the tumour periphery. Thus, even at the level of one-dimensional profiles, the domain is clearly partitioned into a central resistant zone with high levels of and immune inhibitors and a peripheral ring in which a more pronounced antitumour effect of CAR-T cells is maintained.
The two-dimensional dynamics of the interaction are shown in Figure 5, which presents spatial distributions of the concentrations of tumour cells and CAR-T cells at different time points. At early times, the tumour nodule has a compact shape, and the distribution of CAR-T cells is localised near the injection site. In subsequent days, as CAR-T cells spread by diffusion and proliferate, a zone of intensive contact with tumour cells emerges, accompanied by a decrease in the local tumour-cell density and partial regression of its central part. During this period, the formation of a ring structure is clearly visible in the distribution maps: a central region with a suppressed tumour population is surrounded by a ring of elevated tumour-cell concentration.
However, further development of antigen escape and accumulation of immune inhibitors lead to a gradual decline in the efficiency of the cytotoxic action of CAR-T cells. At late times in the simulation (of the order of hundreds of days), a region of resistant cells with a high degree of antigen escape is formed in the central part of the tumour, where the density of CAR-T cells is low, whereas the tumour population recovers and begins to dominate. In the two-dimensional distributions, this manifests itself as renewed growth of the tumour nodule and disappearance of the previously observed zone of effective CAR-T cell infiltration. Thus, the model predicts a typical scenario of transient partial regression followed by tumour relapse as a result of the combined effects of immunosuppression and antigen escape.
A comparison of the one-dimensional and two-dimensional distributions shows that even with sufficiently high initial concentrations of CAR-T cells and pronounced initial antitumour activity, the tumour is able to form spatially localised resistant clones. This result is consistent with the conclusions of the analytical study of the stability of the tumour-free state and emphasises that violation of the stability conditions already under moderate growth of the degree of antigen escape leads to restoration of the tumour population. Overall, the numerical solutions obtained demonstrate the nonlinear nature of competition between tumour-cell proliferation, CAR-T cell cytotoxic activity and the immunosuppressive influence of the microenvironment, and highlight the critical role of spatial effects in predicting the outcome of CAR-T cell therapy for solid tumours.
3.2. Validation of the Mathematical Model of Tumour Growth Based on Clinical Data
To validate the proposed reaction–diffusion model of solid-tumour growth, published clinical data on the temporal dynamics of tumour volume were used [62]. Validation was performed for the phase of natural tumour growth in the absence of immunotherapy, and therefore the CAR-T cell block was removed in the computational experiment. In system (1), we set , and , whereas the dynamics of the tumour population were described using the basic parameter set given in Table 1.
For a given set of experimental points , the tumour volume in the model was computed as the integral over the computational domain
after which it was rescaled so that the initial value coincided with the measured volume . Inter-individual differences between the observed curves were taken into account by fitting the proliferation coefficient of tumour cells within the admissible range specified in Table 1, while the remaining parameters were kept fixed.
The values were calculated separately for each data set:
where is the mean of the experimental measurements.
Figure 6 shows a comparison between the temporal dynamics of tumour volume predicted by the model and the clinical data for six independent solid-tumour growth groups. The blue solid lines correspond to the simulation results, and the red markers denote the measured tumour volumes . The value of the coefficient of determination between the model and the data is reported in each panel.
As can be seen from Figure 6, in all series considered, the model curve smoothly interpolates the experimental points and correctly reproduces both the initial almost exponential phase of accelerated growth and the subsequent moderate slowdown as the tumour volume increases. The values of the coefficient of determination lie in the narrow interval –, with a mean value of , indicating a high degree of agreement between the model and the data. The most noticeable discrepancies are observed at late observation times for some cases, where the model slightly overestimates or underestimates the final tumour volume; the magnitude of these deviations remains moderate and does not affect the overall shape of the growth curve.
These results indicate that the basic block describing tumour-cell proliferation and spatial spread in system (1) adequately captures the characteristic time scales and growth rates of solid tumours in the absence of therapy. This makes it possible to use the identified values of the parameter and the associated range of tumour-growth rates as an initial calibration in subsequent numerical investigations of the influence of CAR-T cells, immunosuppressive factors and the mechanism of antigen escape, which are considered in the following subsections.
3.3. Impact of Antigen Escape on Therapeutic Efficacy
The aim of this numerical experiment is to investigate the impact of the rate of tumour-cell antigen escape on the efficacy of CAR-T cell therapy. Within the model, we varied the parameter , which describes the rate of increase of the escape degree as the tumour-cell density increases in the corresponding equation for . The following values were considered: , while the other model parameters were fixed at their baseline values corresponding to the scenario from the previous section.
Figure 7 shows the spatial distribution of tumour-cell concentration along a cross-section of the tumour at the final simulation time ( days). Each curve corresponds to a separate numerical experiment with a different rate of antigen escape determined by the parameter . At the minimal value, , suppression of the tumour population is observed. The peak tumour-cell density is reduced relative to the initial value, and the profile becomes more flattened, which corresponds to partial tumour regression across the entire cross-section. As increases, the curves are successively shifted upwards, reflecting an increase in the local tumour-cell density in the central region and an expansion of the area with elevated cell density. For the largest value, , the tumour profile at the end of the simulation is maximally elevated, corresponding to the largest residual tumour mass.
Thus, Figure 7 shows that increasing leads to higher peak tumour-cell concentrations and poorer local control of the tumour. The smallest final tumour concentration corresponds to the lowest escape rate considered (), whereas the highest concentration is attained at . This clearly demonstrates that antigen escape directly reduces the efficacy of CAR-T cell therapy, allowing the tumour population to reach a higher density despite the presence of CAR-T cells.
The integral response of the system to changes in the antigen-escape rate is shown in Figure 8, which presents the dependence of the final tumour volume on the parameter . The horizontal axis is plotted on a logarithmic scale to clearly demonstrate the behaviour over a wide range of values from to . The graph exhibits a monotonically increasing dependence: as the antigen-escape rate increases, the final tumour volume steadily grows. No saturation of the effect is observed in the parameter range considered. The transition from low values of to higher ones is accompanied by a substantial increase in the residual tumour mass, and even a one-order-of-magnitude increase in leads to a noticeable deterioration in the therapeutic outcome.
From a biological standpoint, the dependencies obtained reflect the competition between two time scales: the rate of tumour-cell elimination by CAR-T cells and the rate of formation of a resistant tumour-cell clone. At low , CAR-T cells have time to substantially reduce the tumour mass before the escape mechanism becomes dominant, leading to partial or almost complete tumour regression. As increases, the escape process accelerates, and already at intermediate times in the simulation a substantial fraction of tumour cells that are poorly recognised by CAR-T cells is formed, enabling recovery and subsequent dominance of the tumour population.
Taken together, the results in Figure 7 and Figure 8 provide quantitative confirmation of the key role of antigen escape as a mechanism for the development of resistance of solid tumours to CAR-T cell therapy. High values of the parameter lead to a shift of the treatment outcome towards relapse even when the initial concentrations and functional activity of CAR-T cells remain unchanged. This points to the need either to slow down antigen escape or to broaden the targeting spectrum of CAR-T cells, which can effectively reduce the effective value of and thereby increase the likelihood of durable control of a solid tumour.
3.4. Interaction of Model Parameters and Identification of Conditions for Successful Therapy
To identify parameter combinations that ensure effective tumour eradication, we performed a parametric analysis of system (1). The analysis focused on the combined influence of the antigen-escape rate, the tumour-cell killing rate of CAR-T cells, the level of hypoxia, and the proliferation rate of CAR-T cells. For each parameter set, we computed the normalised final volume of the tumour cell population after 100 days of simulation.
To quantify the therapeutic outcome, we used the residual tumour volume, which characterises the fraction of tumour cells remaining at the end of the simulation. It is defined as the ratio of the integral tumour-cell volume at time to the initial tumour volume at time :
where denotes the local tumour-cell density and is the spatial domain of the simulation. Values correspond to complete tumour eradication and high therapeutic efficacy, whereas correspond to preservation of the initial volume or disease progression.
Figure 9 shows a map of the normalised residual tumour volume as a function of the antigen-escape rate and the coefficient of tumour-cell killing by CAR-T cells . The results demonstrate a pronounced dependence of therapeutic efficacy on the interplay between and . Minimal values of are observed at low antigen-escape rates and sufficiently high CAR-T cell cytotoxicity. Under these conditions, the model predicts complete or almost complete elimination of tumour cells by the end of the simulation. As increases, the boundary between successful and unsuccessful therapy systematically shifts towards larger , indicating the need for higher cytotoxic activity to compensate for the loss of efficacy associated with antigen escape. For example, at a therapeutic effect is achieved already at moderate values of order 1, whereas at it is necessary to increase to values of 2–5 in order to attain a comparable level of tumour control. The dependence of on the parameters is nonlinear in character. An increase in initially causes a pronounced decrease in , but further growth of leads to saturation of the effect. The impact of antigen escape exhibits a similar but oppositely directed pattern: a small increase in at low values has a moderate effect on the outcome of therapy, whereas further growth of causes a sharp deterioration in the result and an increase in the residual tumour volume.
3.5. Comparative Analysis of the Efficacy of Different CAR-T Cell Administration Strategies Under Antigen Escape
Despite progress in the development of CAR-T cells, their clinical efficacy against solid tumours depends to a large extent not only on the biological properties of the cells and the tumour, but also on the strategy of their delivery to the tumour site. Pathological vascularisation, a dense extracellular matrix and elevated interstitial pressure create substantial physical barriers that limit the uniform distribution and infiltration of effector lymphocytes. Existing mathematical models typically consider a simplified scenario of a single CAR-T cell injection, whereas in clinical practice a variety of approaches may be used, including multiple or fractionated infusions. Under conditions of antigenic heterogeneity and escape, the spatial pattern of the interaction between CAR-T cells and the tumour becomes critically important: the local concentration of effector cells forms gradients of selective pressure that determine the dynamics of the evolution of antigen-negative clones. Thus, the strategy of CAR-T cell administration can fundamentally influence the rate of resistance development and the long-term outcome of therapy.
To quantitatively assess the impact of the temporal administration scheme for CAR-T cells, we conducted a series of numerical experiments with fixed parameters for tumour growth, the immune microenvironment, and the antigen-escape rate . Four therapeutic strategies differing in the number of CAR-T cell infusions within the therapeutic observation window were considered: single, double, triple, and quadruple administration. For each strategy, the infusion times were chosen to reflect clinically realistic intervals between treatment courses. A schematic representation of the temporal schemes is shown in Figure 10. The vertical segments indicate the infusion time points and the horizontal axis represents the simulation time.
Figure 11a shows the dynamics of the normalised tumour volume (defined by equation (19)) for different CAR-T cell administration strategies. A single infusion leads to a typical scenario of transient regression. Initially, a rapid decline in the normalised tumour volume is observed owing to intense cytotoxic activity of CAR-T cells, but subsequently, as the effector population becomes exhausted and antigen-negative clones accumulate, the tumour mass recovers and grows again to values exceeding the baseline. As one moves to double and triple administration schemes, the curves exhibit intervals of sustained tumour-mass reduction corresponding to additional waves of CAR-T cell activation, which are accompanied by deeper and more prolonged suppression of tumour growth. The quadruple administration strategy does not yield a more pronounced and sustained suppression of tumour mass over the entire simulation period than triple administration.
An integral assessment of the therapeutic outcome for the different strategies is presented in Figure 11b, which shows the values of the residual normalised tumour volume at days. It can be seen that increasing the number of CAR-T cell infusions is accompanied by a monotonic decrease in the residual tumour volume. The transition from single to double administration yields the most substantial improvement, reflected in a sharp reduction in . As the number of infusions increases further to triple and quadruple regimens, the effect becomes less pronounced, indicating a substantial but partially saturating benefit of therapy intensification. Each additional infusion still makes a clinically meaningful contribution, but the relative reduction in compared with the preceding strategy becomes less marked, and in the quadruple scheme the efficacy even decreases.
It should be emphasised that all numerical experiments were performed under conditions of antigen escape of tumour cells, leading to gradual accumulation of clones that are poorly recognised by CAR-T cells. In this situation, a single infusion is insufficient for long-term tumour control. Even with pronounced initial regression, a substantial residual population is formed that is capable of subsequent growth. Multiple infusions partially compensate for this effect by maintaining a high effector CAR-T cell to tumour-cell ratio over a longer period and repeatedly intercepting expanding resistant clones. Nevertheless, even the quadruple scheme under the chosen parameter values does not result in complete tumour eradication, which points to fundamental limitations of modifying only the temporal administration strategy when the antigen-escape rate is sufficiently high.
Taken together, the results obtained demonstrate that the temporal structure of CAR-T cell administration is a critically important determinant of therapeutic efficacy under antigen escape. Multiple and fractionated administration schemes provide deeper and more durable suppression of tumour growth compared with a single infusion, but they do not completely overcome the adverse impact of rapidly progressing escape. This underscores the need for comprehensive protocol optimisation, incorporating both the choice of CAR-T cell administration strategy and reduction of the antigen-escape rate, in order to achieve durable control of a solid tumour.
4. Discussion
The results obtained within the framework of the model reveal the key mechanisms that limit the efficacy of CAR-T cell therapy for solid tumours and are consistent with known clinical observations. The model predicts a typical scenario: after an initial phase of intense CAR-T cell infiltration and partial tumour regression, a resistant clone of tumour cells is formed, leading to relapse. In particular, the numerical experiments demonstrate the emergence, in the central region of the tumour, of a resistant core with a high degree of antigen escape and a high concentration of immune inhibitors, surrounded by a peripheral layer of more susceptible tumour. This spatial pattern reflects the competition between the cytotoxic action of CAR-T cells and the adaptive response mechanisms of the tumour. Such behaviour is in line with clinical data indicating transient improvement followed by tumour progression under CAR-T cell treatment, driven by antigen heterogeneity and an immunosuppressive microenvironment [4,20]. Thus, the model provides a biologically grounded interpretation: selective pressure from CAR-T cells leads to the survival and domination of tumour variants that have lost the target antigen and display enhanced resistance to immune attack, which explains the insufficient duration of remissions observed in current clinical trials of CAR-T cell therapy for solid tumours [20,48].
An important conclusion of our study is the quantitative confirmation of the critical role of the balance between the rate of tumour-cell elimination and the rate of resistance development. Analysis of the temporal profiles showed that, for relatively slow antigen escape (small values of ), CAR-T cells are able to substantially reduce the tumour burden, achieving almost complete tumour regression. In contrast, accelerated escape (higher ) leads to rapid accumulation of poorly recognisable cells that survive the initial onslaught and initiate renewed tumour growth. Biologically, this points to a competition between time scales: the efficacy of therapy is determined by whether CAR-T cells can destroy the bulk of the tumour before a significant fraction of cells lose the target antigen. This observation is consistent with the findings of other models that emphasise the need to maximise the cytotoxic potential of CAR-T cells and minimise the rate of immune-mediated selection of resistant clones in order to achieve a durable effect [21]. Comparison of the simulation results with published data confirms the adequacy and novelty of the proposed model. First, tumour-growth dynamics are reproduced in accordance with typical growth curves, as demonstrated on the basis of clinical data. Second, the temporal profiles obtained for single CAR-T cell administration are consistent with known therapeutic limitations: in the model experiments only transient remission is observed, followed by resumption of tumour growth to nearly the initial volume. Similar conclusions were reached in [43] within a kinetic model of glioblastoma: a single CAR-T application, even in combination with chemotherapy, does not prevent long-term relapse, whereas continuous or repeated exposure can substantially improve the outcome. Our spatially distributed model extends this concept by demonstrating that multiple CAR-T cell infusions can suppress renewed expansion of resistant clones and maintain antitumour pressure over an extended period. According to our results, moving from one to several injections leads to a marked reduction in the residual tumour volume and a longer suppression of tumour growth. This effect, however, is partially saturating: the gain in efficacy from each additional administration diminishes over time. Moreover, even a quadruple scheme under conditions of high escape rate does not ensure complete tumour eradication, which is consistent with the conclusions of [42] regarding the limitations of optimising the temporal protocol alone. Thus, results from different research groups are mutually complementary: on the one hand, optimisation models based on ODEs highlight the importance of selecting an appropriate treatment regimen [42,43], while, on the other hand, our study underscores the critical role of spatial heterogeneity and shows that, without targeted action against antigen-negative cells and the immune microenvironment, even an optimised CAR-T cell administration schedule may still be insufficient.
The assumptions and limitations of the proposed model should be critically assessed. First, the immune response is described in a simplified manner. We account only for the population of exogenous CAR-T lymphocytes, whereas in a real tumour a wide spectrum of immune effector cells is involved. The absence from the model of endogenous cytotoxic T lymphocytes, natural killer cells, macrophages and other cell types means that phenomena such as immune memory are represented only indirectly through parameters rather than being reproduced explicitly. Second, the antigen escape mechanism is implemented as a homogeneous decrease in the expression of a single target antigen (via the parameter ), which does not capture the potentially multicomponent nature of tumour heterogeneity. In the clinical setting, a tumour may simultaneously express several distinct antigens, and a subset of cells can switch to alternative escape pathways; in the model, however, the focus is on a single dominant antigen. A third simplification is the aggregated representation of immunosuppression: the scalar inhibitor represents the cumulative impact of many factors. In addition, potential adverse effects and extra-tumour dynamics are not considered in the model. Finally, model parametrisation is based on a limited set of data and assumptions. Validation against a small number of experimental growth curves supports the realism of the basic dynamics, but comprehensive validation would require comparison with a wide range of preclinical and clinical data to calibrate parameters under different conditions. The lack of such data at present limits the assessment of the predictive power of the model. Nevertheless, despite these limitations, the model serves as a useful tool for generating hypotheses about system behaviour and identifying the most sensitive parameters that influence therapeutic outcome.
The results of this work suggest several promising avenues for future research. One such avenue is to incorporate a more complex spatial organisation of the tumour and its microenvironment into the model. In real solid neoplasms there may be regions of necrosis and hypoxia and heterogeneous vascularisation, which lead to nutrient gradients and, consequently, to local variations in the sensitivity of both tumour and immune cells. Within our reaction–diffusion framework, such heterogeneous effects can be incorporated by introducing spatially heterogeneous coefficients or additional equations, for example, for oxygen and metabolites. Extending the model in this way will enable investigation of how microenvironmental heterogeneity influences CAR-T cell infiltration and the formation of resistant niches. Another direction is the transition to multiscale and hybrid modelling approaches. Such hybrid models can more accurately describe processes in which fluctuations in small cell numbers or subtle spatial effects are important, going beyond the scope of a purely deterministic approach. Yet another way to improve the model is to employ fractional-calculus techniques. Fractional differential equations enable the incorporation of memory effects and long-term correlations in system dynamics. In the context of immunotherapy, this may be useful for describing phenomena such as long-lived cellular subpopulations or slowed diffusion of CAR-T cells within the complex tumour structure. Recent studies have demonstrated that fractional models can successfully capture the kinetics of tumour–immune interactions and the robustness of these systems to external perturbations [31,32]. Finally, the integration of artificial-intelligence methods for model calibration and personalisation of predictions appears extremely promising. In particular, modern machine-learning and big-data-analysis approaches can be used to determine optimal model-parameter values from patient-specific data. Such algorithms can automatically tune the model to the individual characteristics of a tumour, enabling prediction of the effects of different treatment strategies in a given patient. The combination of a mechanistic model with AI modules is already being applied to tumour-growth modelling and treatment assessment in a personalised setting [35], and in the future such hybrid platforms may substantially accelerate the development of new therapeutic protocols.
5. Conclusion
In this work, we have developed and studied a reaction–diffusion mathematical model of the spatio-temporal dynamics of the interaction between CAR-T cells and a solid tumour, incorporating key resistance mechanisms, including antigen escape and an immunosuppressive microenvironment. The mathematical model, formulated as a system of partial differential equations, makes it possible to adequately describe the nonlinear processes of infiltration, proliferation and cytotoxic response under conditions of spatial heterogeneity. The analysis of the stability of the tumour-free state revealed critical parameter relationships necessary for successful tumour eradication. Numerical simulations based on a finite-difference approximation of the system demonstrated the formation of resistant regions within the tumour and a relapse time course consistent with clinical observations. The results of the parametric analysis highlight that therapeutic efficacy strongly depends on the balance between the rate of tumour-cell killing and the rate of antigen escape. A comparative study of CAR-T cell administration strategies showed that multiple infusions provide deeper and more durable suppression of tumour growth than a single administration. Thus, the proposed model serves as an effective tool for studying the dynamics of CAR-T cell therapy, generating hypotheses and optimising therapeutic protocols. Future research directions include the development of multiscale hybrid approaches, explicit incorporation of spatial microenvironmental heterogeneity, the use of fractional derivatives to describe memory effects, and the integration of artificial-intelligence methods for the personalisation of predictions.
Author Contributions
Conceptualization, M.V.P.; methodology, M.V.P.; software, E.I.T.; formal analysis, M.V.P.; validation, M.V.P. and E.I.T.; investigation, M.V.P.; data curation, E.I.T.; writing—original draft preparation, M.V.P. and E.I.T.; visualization, M.V.P. and E.I.T.; supervision, M.V.P. All authors have read and agreed to the published version of the manuscript.
Funding
The study was funded by the Russian Science Foundation grant No. 25-71-00041, https://rscf.ru/project/25-71-00041/
Data Availability Statement
The original contributions presented in this study are included in the article. Further inquiries can be directed to the corresponding author.
Conflicts of Interest
The authors declare no conflicts of interest.
References
- Maude, S.L.; Laetsch, T.W.; Buechner, J.; Rives, S.; Boyer, M.; Bittencourt, H.; et al. Tisagenlecleucel in children and young adults with B-cell lymphoblastic leukemia. New England Journal of Medicine 2018, 378, 439–448. [Google Scholar] [CrossRef]
- Neelapu, S.S.; Tummala, S.; Kebriaei, P.; Wierda, W.; Gutierrez, C.; Locke, F.L.; et al. Axicabtagene ciloleucel CAR T-cell therapy in refractory large B-cell lymphoma. New England Journal of Medicine 2017, 377, 2531–2544. [Google Scholar] [CrossRef]
- Martinez, M.; Moon, E.K. CAR T cells for solid tumors: new strategies for finding, infiltrating, and surviving in the tumor microenvironment. Frontiers in Immunology 2019, 10, 128. [Google Scholar] [CrossRef] [PubMed]
- Sterner, R.C.; Sterner, R.M. CAR-T cell therapy: current limitations and potential strategies. Blood Cancer Journal 2021, 11, 69. [Google Scholar] [CrossRef]
- June, C.H.; Sadelain, M. Chimeric antigen receptor therapy. New England Journal of Medicine 2018, 379, 64–73. [Google Scholar] [CrossRef] [PubMed]
- Larson, R.C.; Maus, M.V. Recent advances and discoveries in the mechanisms and functions of CAR T cells. Nature Reviews Cancer 2021, 21, 145–161. [Google Scholar] [CrossRef]
- Brudno, J.N.; Kochenderfer, J.N. Recent advances in CAR T-cell toxicity: mechanisms, manifestations and management. Blood Reviews 2019, 34, 45–55. [Google Scholar] [CrossRef]
- Enderling, H.; Almog, N. In silico cancer modeling: Is it ready for prime time? Nature Reviews Clinical Oncology 2018, 15, 455–456. [Google Scholar]
- Quaranta, V.; Weaver, A.M.; Cummings, P.T.; Anderson, A.R. Mathematical modeling of cancer: the future of prognosis and treatment. Clinica Chimica Acta 2005, 357, 173–179. [Google Scholar] [CrossRef]
- de Pillis, L.G.; Radunskaya, A.E.; Wiseman, C.L. A validated mathematical model of cell-mediated immune response to tumor growth. Cancer Research 2005, 65, 7950–7958. [Google Scholar] [CrossRef] [PubMed]
- Altrock, P.M.; Liu, L.L.; Michor, F. The mathematics of cancer: integrating quantitative models. Nature Reviews Cancer 2015, 15, 730–745. [Google Scholar] [CrossRef]
- Turing, A.M. The chemical basis of morphogenesis. Philosophical Transactions of the Royal Society of London. Series B, Biological Sciences 1952, 237, 37–72. [Google Scholar]
- Skellam, J.G. Random dispersal in theoretical populations. Biometrika 1951, 38, 196–218. [Google Scholar] [CrossRef]
- Epstein, I.R.; Pojman, J.A. An introduction to nonlinear chemical dynamics: oscillations, waves, patterns, and chaos. Oxford University Press 1998.
- Swan, A.; Hillen, T.; Bowman, J.C.; Murtha, A.D. A patient-specific anisotropic diffusion model for brain tumour spread. Bulletin of Mathematical Biology 2018, 80, 1259–1291. [Google Scholar] [CrossRef]
- Rockne, R.C.; Hawkins-Daarud, A.; Swanson, K.R.; Sluka, J.P.; Glazier, J.A.; Macklin, P.; et al. The 2019 mathematical oncology roadmap. Physical Biology 2019, 16, 041005. [Google Scholar] [CrossRef] [PubMed]
- Byrne, H.M. Modelling avascular tumour growth. In: Preziosi, L., Ed. Cancer Modelling and Simulation; Chapman and Hall/CRC: Boca Raton, FL, USA, 2003; pp. 75–120.
- Enderling, H.; Chaplain, M.A.J. Mathematical modeling of tumor growth and treatment. Current Pharmaceutical Design 2014, 20, 4934–4940. [Google Scholar] [CrossRef]
- Holtermann, A.; Gislon, M.; Angele, M.; Subklewe, M.; von Bergwelt-Baildon, M.; Lauber, K.; Kobold, S. Prospects of synergy: local interventions and CAR T cell therapy in solid tumors. BioDrugs 2024, 38, 611–637. [Google Scholar] [CrossRef] [PubMed]
- Tu, Z.; Chen, Y.; Zhang, Z.; Meng, W.; Li, L. Barriers and solutions for CAR-T therapy in solid tumors. Cancer Gene Therapy 2025, 32, 923–934. [Google Scholar] [CrossRef]
- Kara, E.; Jackson, T.L.; Jones, C.; Sison, R.; McGee, R.L. II. Mathematical modeling insights into improving CAR T cell therapy for solid tumors with bystander effects. npj Systems Biology and Applications 2024, 10, 105. [Google Scholar] [CrossRef] [PubMed]
- Ghaffari Laleh, N.; Loeffler, C.M.L.; Grajek, J.; Staňková, K.; Pearson, A.T.; Muti, H.S.; et al. Classical mathematical models for prediction of response to chemotherapy and immunotherapy. PLOS Computational Biology 2022, 18, e1009822. [Google Scholar] [CrossRef]
- Alqahtani, R.T. A model of effector–tumor cell interactions under chemotherapy: bifurcation analysis. Mathematics 2025, 13, 1032. [Google Scholar] [CrossRef]
- Sofia, D.; Mohammad Mirzaei, N.; Shahriyari, L. Patient-specific mathematical model of the clear cell renal cell carcinoma microenvironment. Journal of Personalized Medicine 2022, 12, 1681. [Google Scholar] [CrossRef]
- Valentim, C.A.; Rabi, J.A.; David, S.A. Cellular-automaton model for tumor growth dynamics: virtualization of different scenarios. Computers in Biology and Medicine 2023, 153, 106481. [Google Scholar] [CrossRef] [PubMed]
- Flandoli, F.; Leocata, M.; Ricci, C. The mathematical modeling of cancer growth and angiogenesis by an individual based interacting system. Journal of Theoretical Biology 2023, 562, 111432. [Google Scholar] [CrossRef]
- Garcke, H.; Kovács, B.; Trautwein, D. Viscoelastic Cahn–Hilliard models for tumor growth. Mathematical Models and Methods in Applied Sciences 2022, 32, 2673–2758. [Google Scholar] [CrossRef]
- d’Angelo, M.; Papa, F.; D’Orsi, L.; Panunzi, S.; Pompa, M.; Palombo, G.; et al. A PDE model of glioblastoma progression: the role of cell crowding and resource competition in proliferation and diffusion. Mathematics 2025, 13, 3318. [Google Scholar] [CrossRef]
- Jafari Nivlouei, S.; Soltani, M.; Carvalho, J.; Travasso, R.; Salimpour, M.R.; Shirani, E. Multiscale modeling of tumor growth and angiogenesis: evaluation of tumor-targeted therapy. PLOS Computational Biology 2021, 17, e1009081. [Google Scholar] [CrossRef] [PubMed]
- Hadjigeorgiou, A.G.; Stylianopoulos, T. Hybrid model of tumor growth, angiogenesis and immune response yields strategies to improve antiangiogenic therapy. npj Biological Physics and Mechanics 2024, 1, 1–12. [Google Scholar] [CrossRef] [PubMed]
- Kar, N.; Özalp, N. A fractional mathematical model approach on glioblastoma growth: tumor visibility timing and patient survival. Mathematical Modelling and Numerical Simulation with Applications 2024, 4, 66–85. [Google Scholar] [CrossRef]
- Aderyani, S.R.; Saadati, R.; Aderyani, F.R.; Tunç, O. Mathematical modeling of tumor-immune dynamics: stability, control, and synchronization via fractional calculus and numerical optimization. Scientific Reports 2025, 15, 29094. [Google Scholar] [CrossRef]
- Qayyum, M.; Nayab, S.; Khan, O.; Al Zubaidi, A.; Saeed, S.T.; Merga, F.E. Fuzzy and fractional analysis of cancer tumor dynamics with depression effects on chemotherapy. Scientific Reports 2025, 15, 33185. [Google Scholar] [CrossRef]
- Nisar, K.S.; Farman, M.; Alotaibi, A.M.; Alharbi, S. Feedback design to measure the effect of therapies in controlling cancer using the fractional approach. Scientific Reports 2025, 15, 31494. [Google Scholar] [CrossRef]
- Lorenzo, G.; Ahmed, S.R.; Hormuth, D.A.; Vaughn, B.; Kalpathy-Cramer, J.; Solorio, L.; et al. Patient-specific, mechanistic models of tumor growth incorporating artificial intelligence and big data. Annual Review of Biomedical Engineering 2024, 26, 529–560. [Google Scholar] [CrossRef]
- Polyakov, M.V.; Ten, V.V. Simulation tumor growth in heterogeneous medium based on diffusion equation. International Journal of Modern Physics C 2024, 35, 2450010. [Google Scholar] [CrossRef]
- Khoperskov, A.V.; Polyakov, M.V. Improving the efficiency of oncological diagnosis of the breast based on the combined use of simulation modeling and artificial intelligence algorithms. Algorithms 2022, 15, 292. [Google Scholar] [CrossRef]
- Sahoo, P.; Yang, X.; Abler, D.; Maestrini, D.; Adhikarla, V.; Frankhouser, D.; et al. Mathematical deconvolution of CAR T-cell proliferation and exhaustion from real-time killing assay data. Journal of the Royal Society Interface 2020, 17, 20190734. [Google Scholar] [CrossRef] [PubMed]
- León-Triana, O.; Sabir, S.; Calvo, G.F.; Belmonte-Beitia, J.; Chulián, S.; Martínez-Rubio, A.; et al. CAR T cell therapy in B-cell acute lymphoblastic leukaemia: insights from mathematical models. Communications in Nonlinear Science and Numerical Simulation 2021, 94, 105570. [Google Scholar] [CrossRef]
- Barros, L.R.C.; Paixão, E.A.; Valli, A.M.P.; Naozuka, G.T.; Fassoni, A.C.; Almeida, R.C. Cart math—a mathematical model of CAR-T immunotherapy in preclinical studies of hematological cancers. Cancers 2021, 13, 2941. [Google Scholar] [CrossRef] [PubMed]
- Alqahtani, R.T.; Ajbar, A.; Aljebli, E.H. Dynamics of a model of tumor–immune cell interactions under chemotherapy. Mathematics 2025, 13, 2200. [Google Scholar] [CrossRef]
- Bodzioch, M.; Belmonte-Beitia, J. Optimal control of a mathematical model of CAR-T cell therapy for glioblastoma. Discrete and Continuous Dynamical Systems-B 2025, 30, 4255–4275. [Google Scholar] [CrossRef]
- Sinelshchikov, D.; Belmonte-Beitia, J.; Italia, M. A mathematical model of CAR-T cell therapy in combination with chemotherapy for malignant gliomas. Chaos 2025, 35, 063104. [Google Scholar] [CrossRef]
- Owens, K.; Rahman, A.; Bozic, I. Spatiotemporal dynamics of tumor–CAR T-cell interaction following local administration in solid cancers. PLOS Computational Biology 2025, 21, e1013117. [Google Scholar]
- Santurio, D.S.; Barros, L.R.C. A mathematical model for on-target off-tumor effect of CAR-T cells on gliomas. Frontiers in Systems Biology 2022, 2, 923085. [Google Scholar] [CrossRef]
- Sabir, S.; León-Triana, O.; Serrano, S.; Barrio, R.; Pérez-García, V.M. Mathematical model of CAR T-cell therapy for a B-cell lymphoma lymph node. Bulletin of Mathematical Biology 2025, 87, 1–33. [Google Scholar] [CrossRef] [PubMed]
- Kimmel, G.J.; Locke, F.L.; Altrock, P.M. The roles of T cell competition and stochastic extinction events in chimeric antigen receptor T cell therapy. Proceedings of the Royal Society B 2021, 288, 20210229. [Google Scholar] [CrossRef] [PubMed]
- Uslu, U.; June, C.H. Beyond the blood: expanding CAR T cell therapy to solid tumors. Nature Biotechnology 2025, 43, 506–515. [Google Scholar] [CrossRef] [PubMed]
- Hormuth, D.A.; Phillips, C.M.; Wu, C.; Lima, E.A.B.F.; Lorenzo, G.; Jha, P.K.; et al. Biologically-based mathematical modeling of tumor vasculature and angiogenesis via time-resolved imaging data. Cancers 2021, 13, 3008. [Google Scholar]
- Mohammad Mirzaei, N.; Su, S.; Sofia, D.; Hegarty, M.; Abdel-Rahman, M.H.; Asadpoure, A.; et al. A mathematical model of breast tumor progression based on immune infiltration. Journal of Personalized Medicine 2021, 11, 1031. [Google Scholar] [CrossRef]
- Beigmohammadi, F.; Khorrami, M.; Masoudi, A.A.; Fatollahi, A.H. Mathematical modeling of tumor growth as a random process in the presence of interaction between tumor cells and normal cells. International Journal of Modern Physics C 2024, 35, 2450102. [Google Scholar] [CrossRef]
- Azizi, T. Mathematical modeling of cancer progression. AppliedMath 2024, 4, 1065–1079. [Google Scholar] [CrossRef]
- Ochieng, F.O. Mathematical modeling of cancerous tumor evolution incorporating drug resistance. Engineering Reports 2025, 7, e70021. [Google Scholar] [CrossRef]
- Watanabe, Y.; Dahlman, E.L.; Leder, K.Z.; Hui, S.K. A mathematical model of tumor growth and its response to single irradiation. Theoretical Biology and Medical Modelling 2016, 13, 6. [Google Scholar] [CrossRef] [PubMed]
- Sun, X.; Hu, B. Mathematical modeling and computational prediction of cancer drug resistance. Briefings in Bioinformatics 2018, 19, 1382–1399. [Google Scholar] [CrossRef] [PubMed]
- Masoudi-Nejad, A.; Bidkhori, G.; Ashtiani, S.H.; Najafi, A.; Bozorgmehr, J.H.; Wang, E. Cancer systems biology and modeling: microscopic scale and multiscale approaches. Seminars in Cancer Biology 2015, 30, 60–69. [Google Scholar] [CrossRef] [PubMed]
- Qayyum, M.; Nayab, S.; Siddique, I.; Ghallab, A. Analysis of time-fractional cancer-tumor immunotherapy model using modified He-Laplace algorithm. Scientific Reports 2025, 15, 8929. [Google Scholar] [CrossRef]
- Pompa, M.; Urso, G.; Panunzi, S.; Drexler, D.A.; Gombos, B.; De Gaetano, A. A mathematical model of breast cancer growth and drug resistance evolution under chemotherapy. Mathematics 2025, 13, 1115. [Google Scholar] [CrossRef]
- Ajbar, A.; Alqahtani, R.T. Dynamics of a symmetric model of competition between tumor and immune cells under chemotherapy. Symmetry 2025, 17, 492. [Google Scholar] [CrossRef]
- Kuznetsov, M.; Kolobov, A. Antiangiogenic therapy efficacy can be tumor-size dependent, as mathematical modeling suggests. Mathematics 2024, 12, 353. [Google Scholar] [CrossRef]
- Malik, A.A.; Nguyen, K.C.; Nardini, J.T.; Krona, C.C.; Flores, K.B.; Nelander, S. Mathematical modeling of multicellular tumor spheroids quantifies inter-patient and intra-tumor heterogeneity. npj Systems Biology and Applications 2025, 11, 20. [Google Scholar] [CrossRef]
- Ghiyabi, E.; Arabameri, A.; Charmi, M. Mathematical modeling of hypoxia and adenosine to explore tumor escape mechanisms in DC-based immunotherapy. Scientific Reports 2024, 14, 11387. [Google Scholar] [CrossRef] [PubMed]
- Li, C.; Ren, Z.; Yang, G.; Lei, J. Mathematical modeling of tumor immune interactions: the role of anti-FGFR and anti-PD-1 in the combination therapy. Bulletin of Mathematical Biology 2024, 86, 116. [Google Scholar] [CrossRef] [PubMed]
- Sekyere, P.O.; Bani-Yaghoub, M.; Youan, B.C. Reaction-diffusion modeling of vascular tumor growth: bifurcation, relapse, and therapy efficacy. Mathematical Biosciences and Engineering 2025, 22, 2944–2987. [Google Scholar] [CrossRef] [PubMed]
Figure 1.
Schematic representation of the interactions in the reaction–diffusion model: CAR-T cells C infiltrate the tumour nodule and destroy tumour cells T; the tumour produces immune inhibitors I that suppress CAR-T cell activity, and also initiates antigen escape , which leads to a reduction in the efficiency of the cytotoxic response.
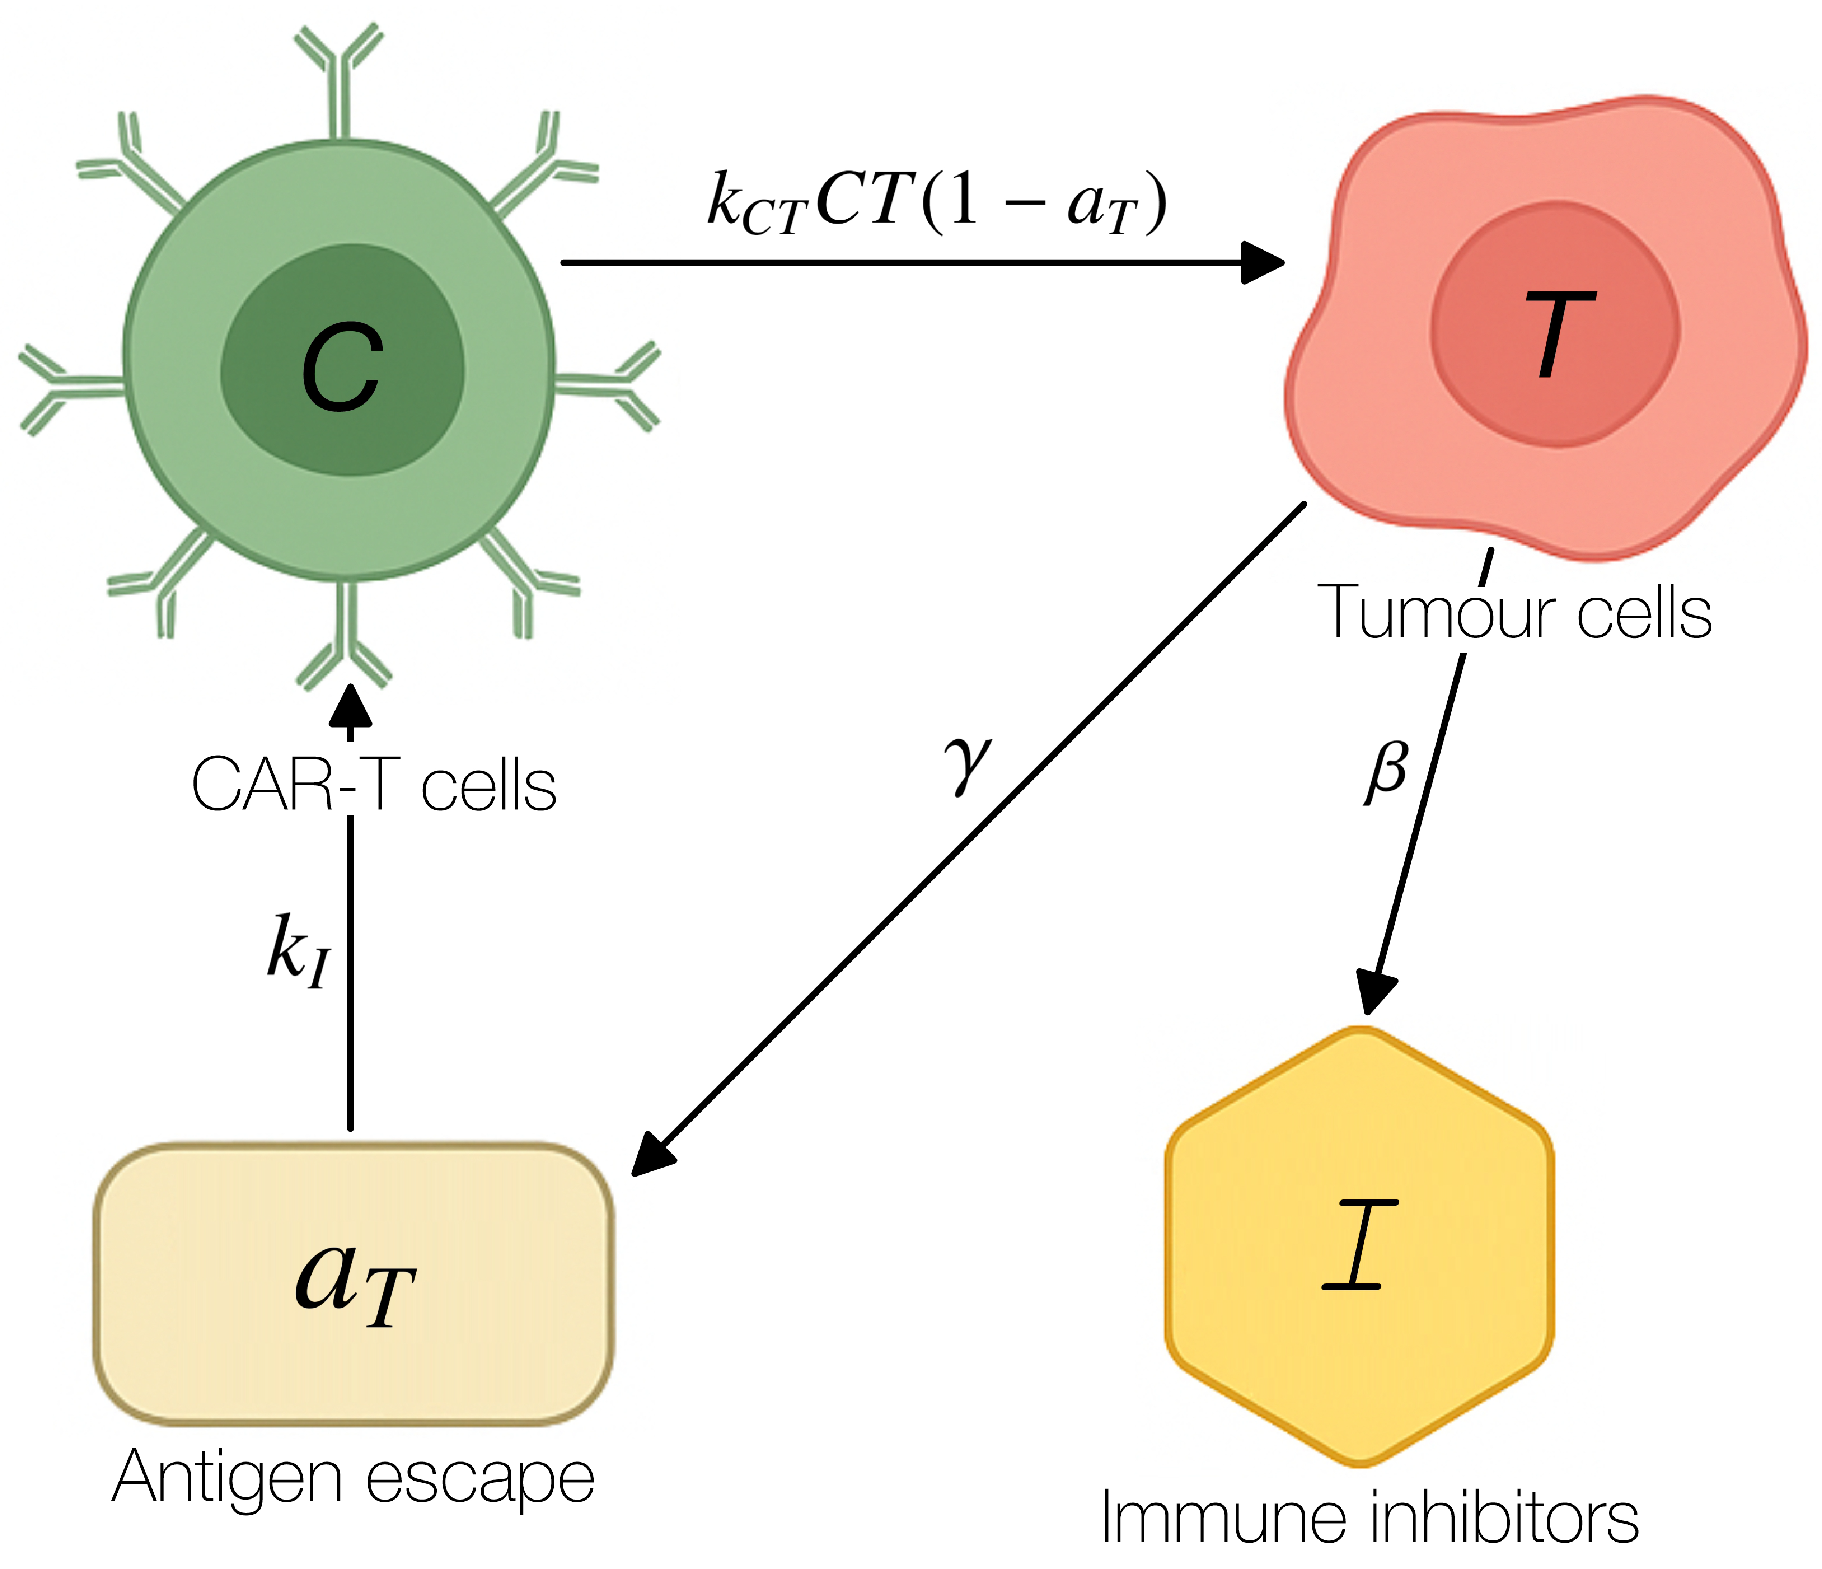
Figure 2.
Region of linear stability of the tumour-free equilibrium in the plane for fixed model parameters.
Figure 2.
Region of linear stability of the tumour-free equilibrium in the plane for fixed model parameters.
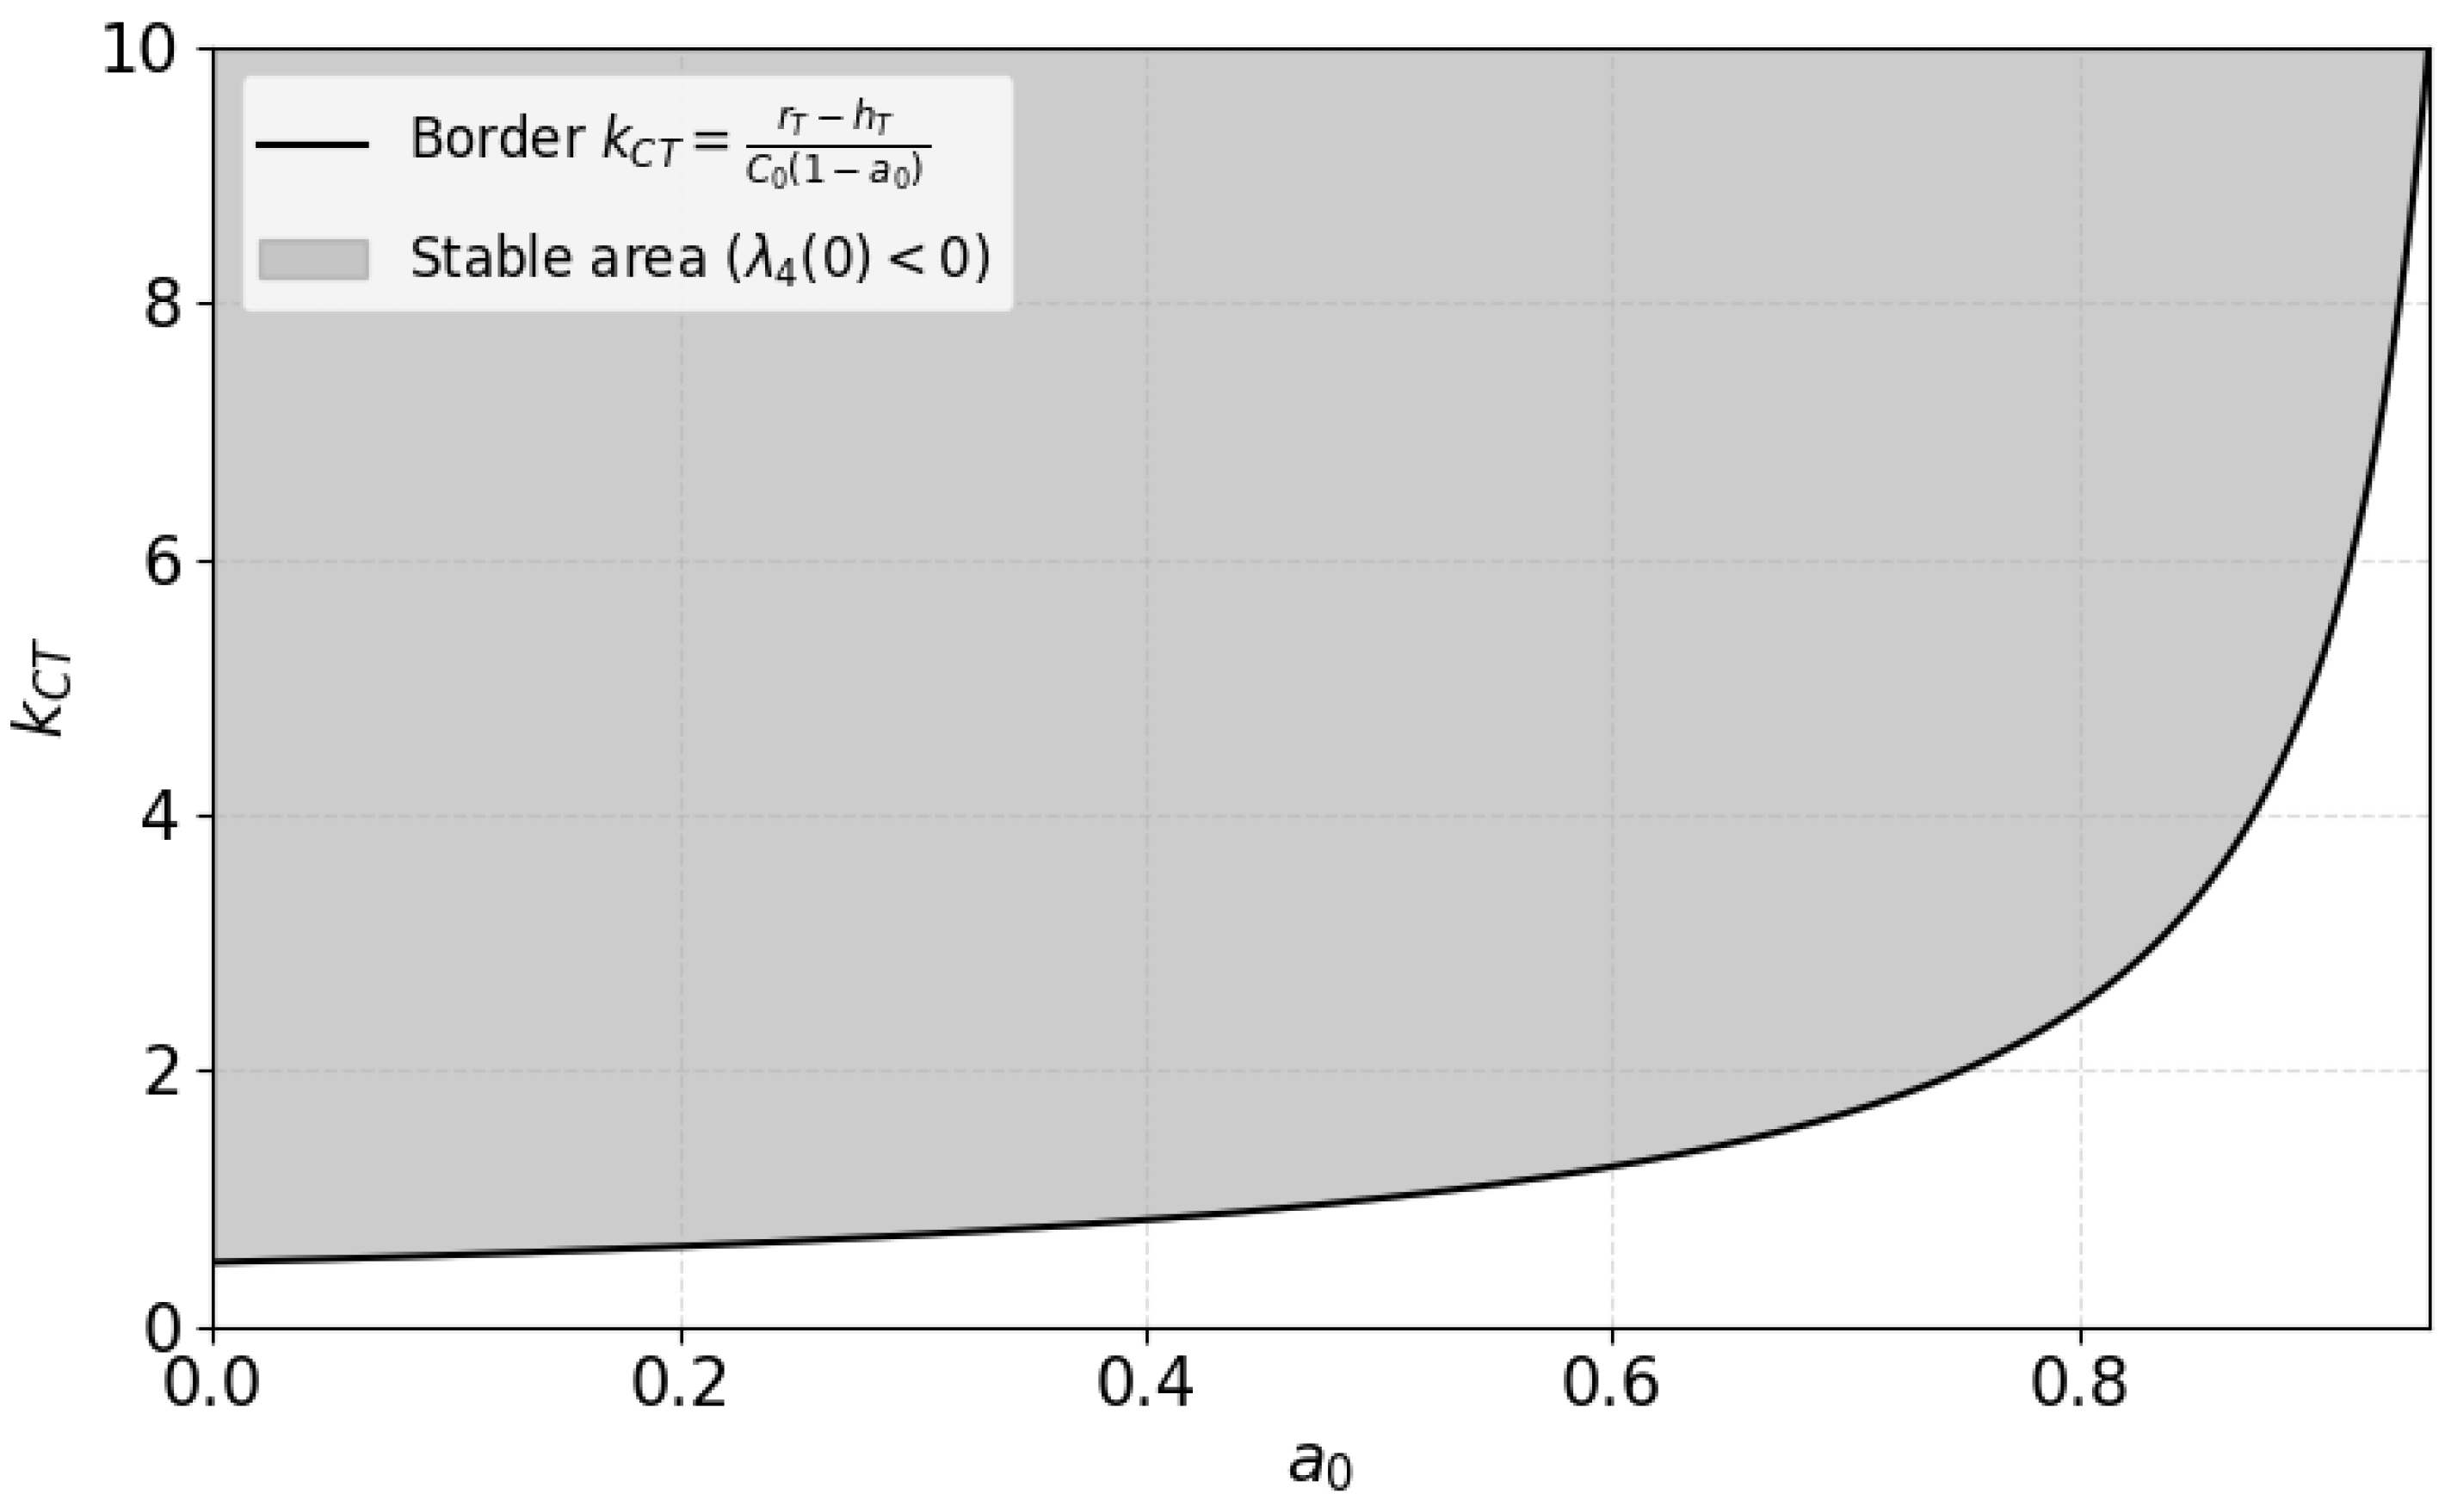
Figure 3.
Block diagram of the programme algorithm for numerical simulation of tumour dynamics under CAR-T cell therapy.
Figure 3.
Block diagram of the programme algorithm for numerical simulation of tumour dynamics under CAR-T cell therapy.
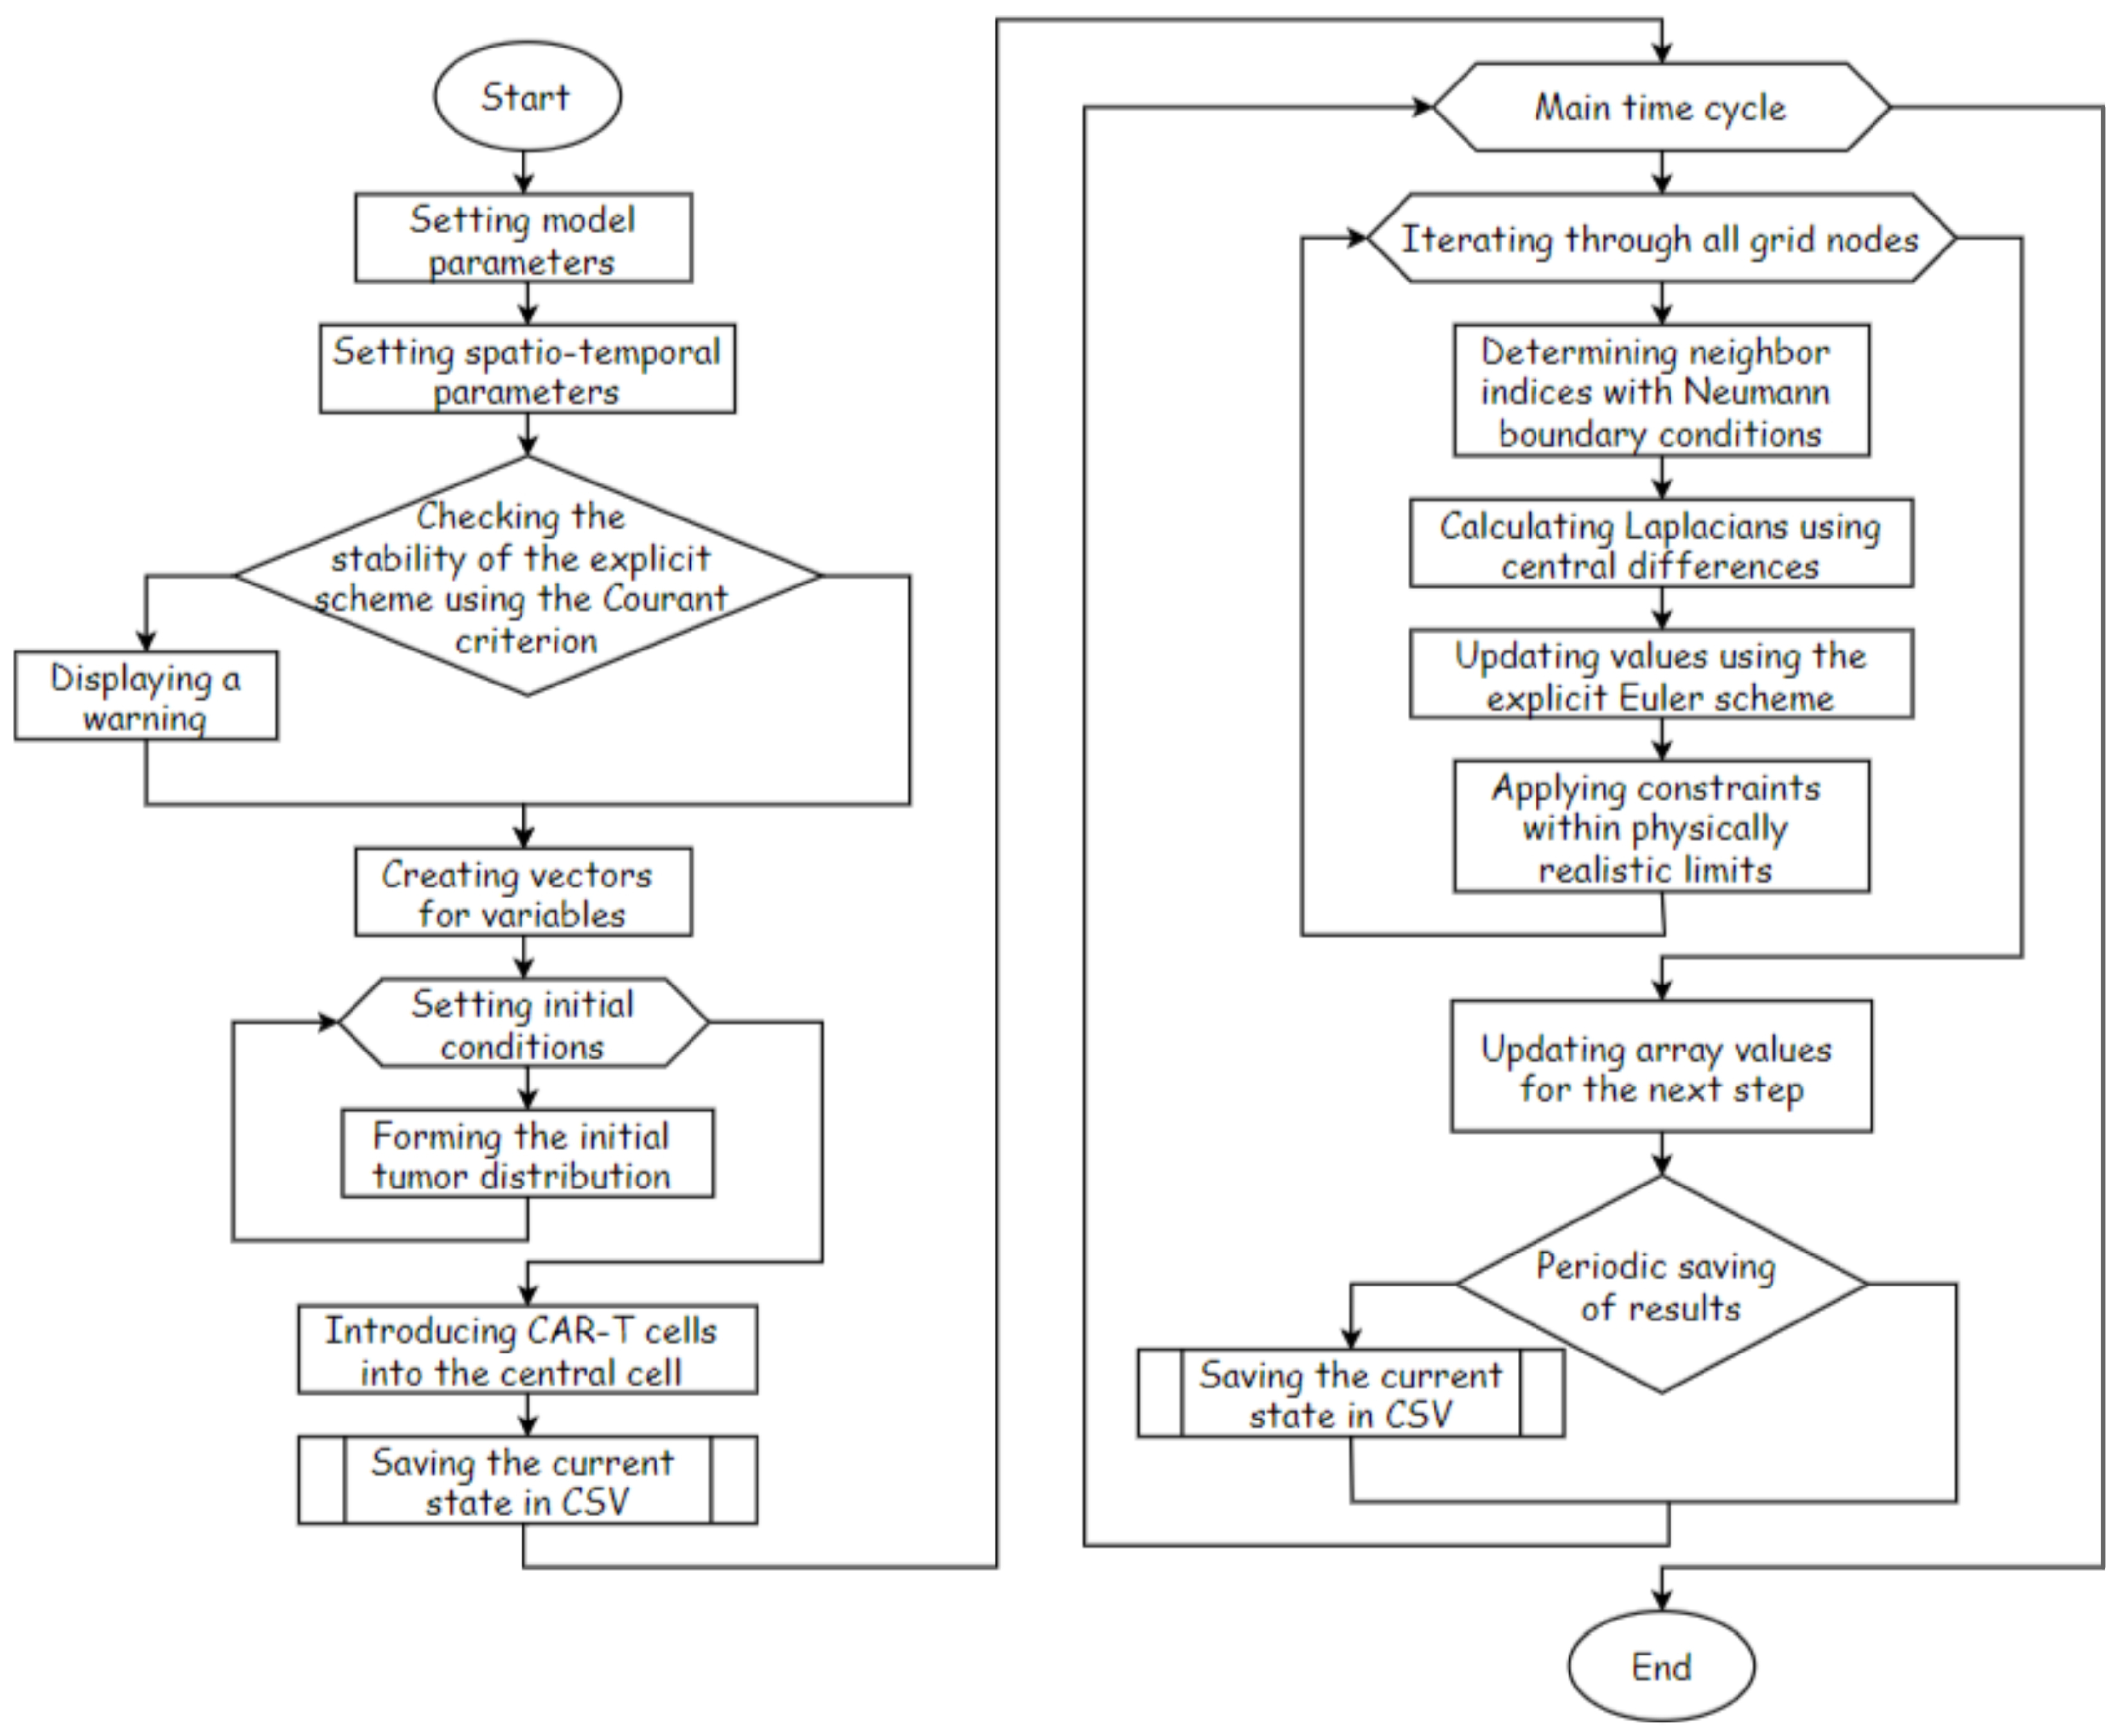
Figure 4.
Spatial distribution of the density of CAR-T cells, tumour cells, immune inhibitors and the level of antigen expression along a cross-section of a solid tumour at different time points.
Figure 4.
Spatial distribution of the density of CAR-T cells, tumour cells, immune inhibitors and the level of antigen expression along a cross-section of a solid tumour at different time points.
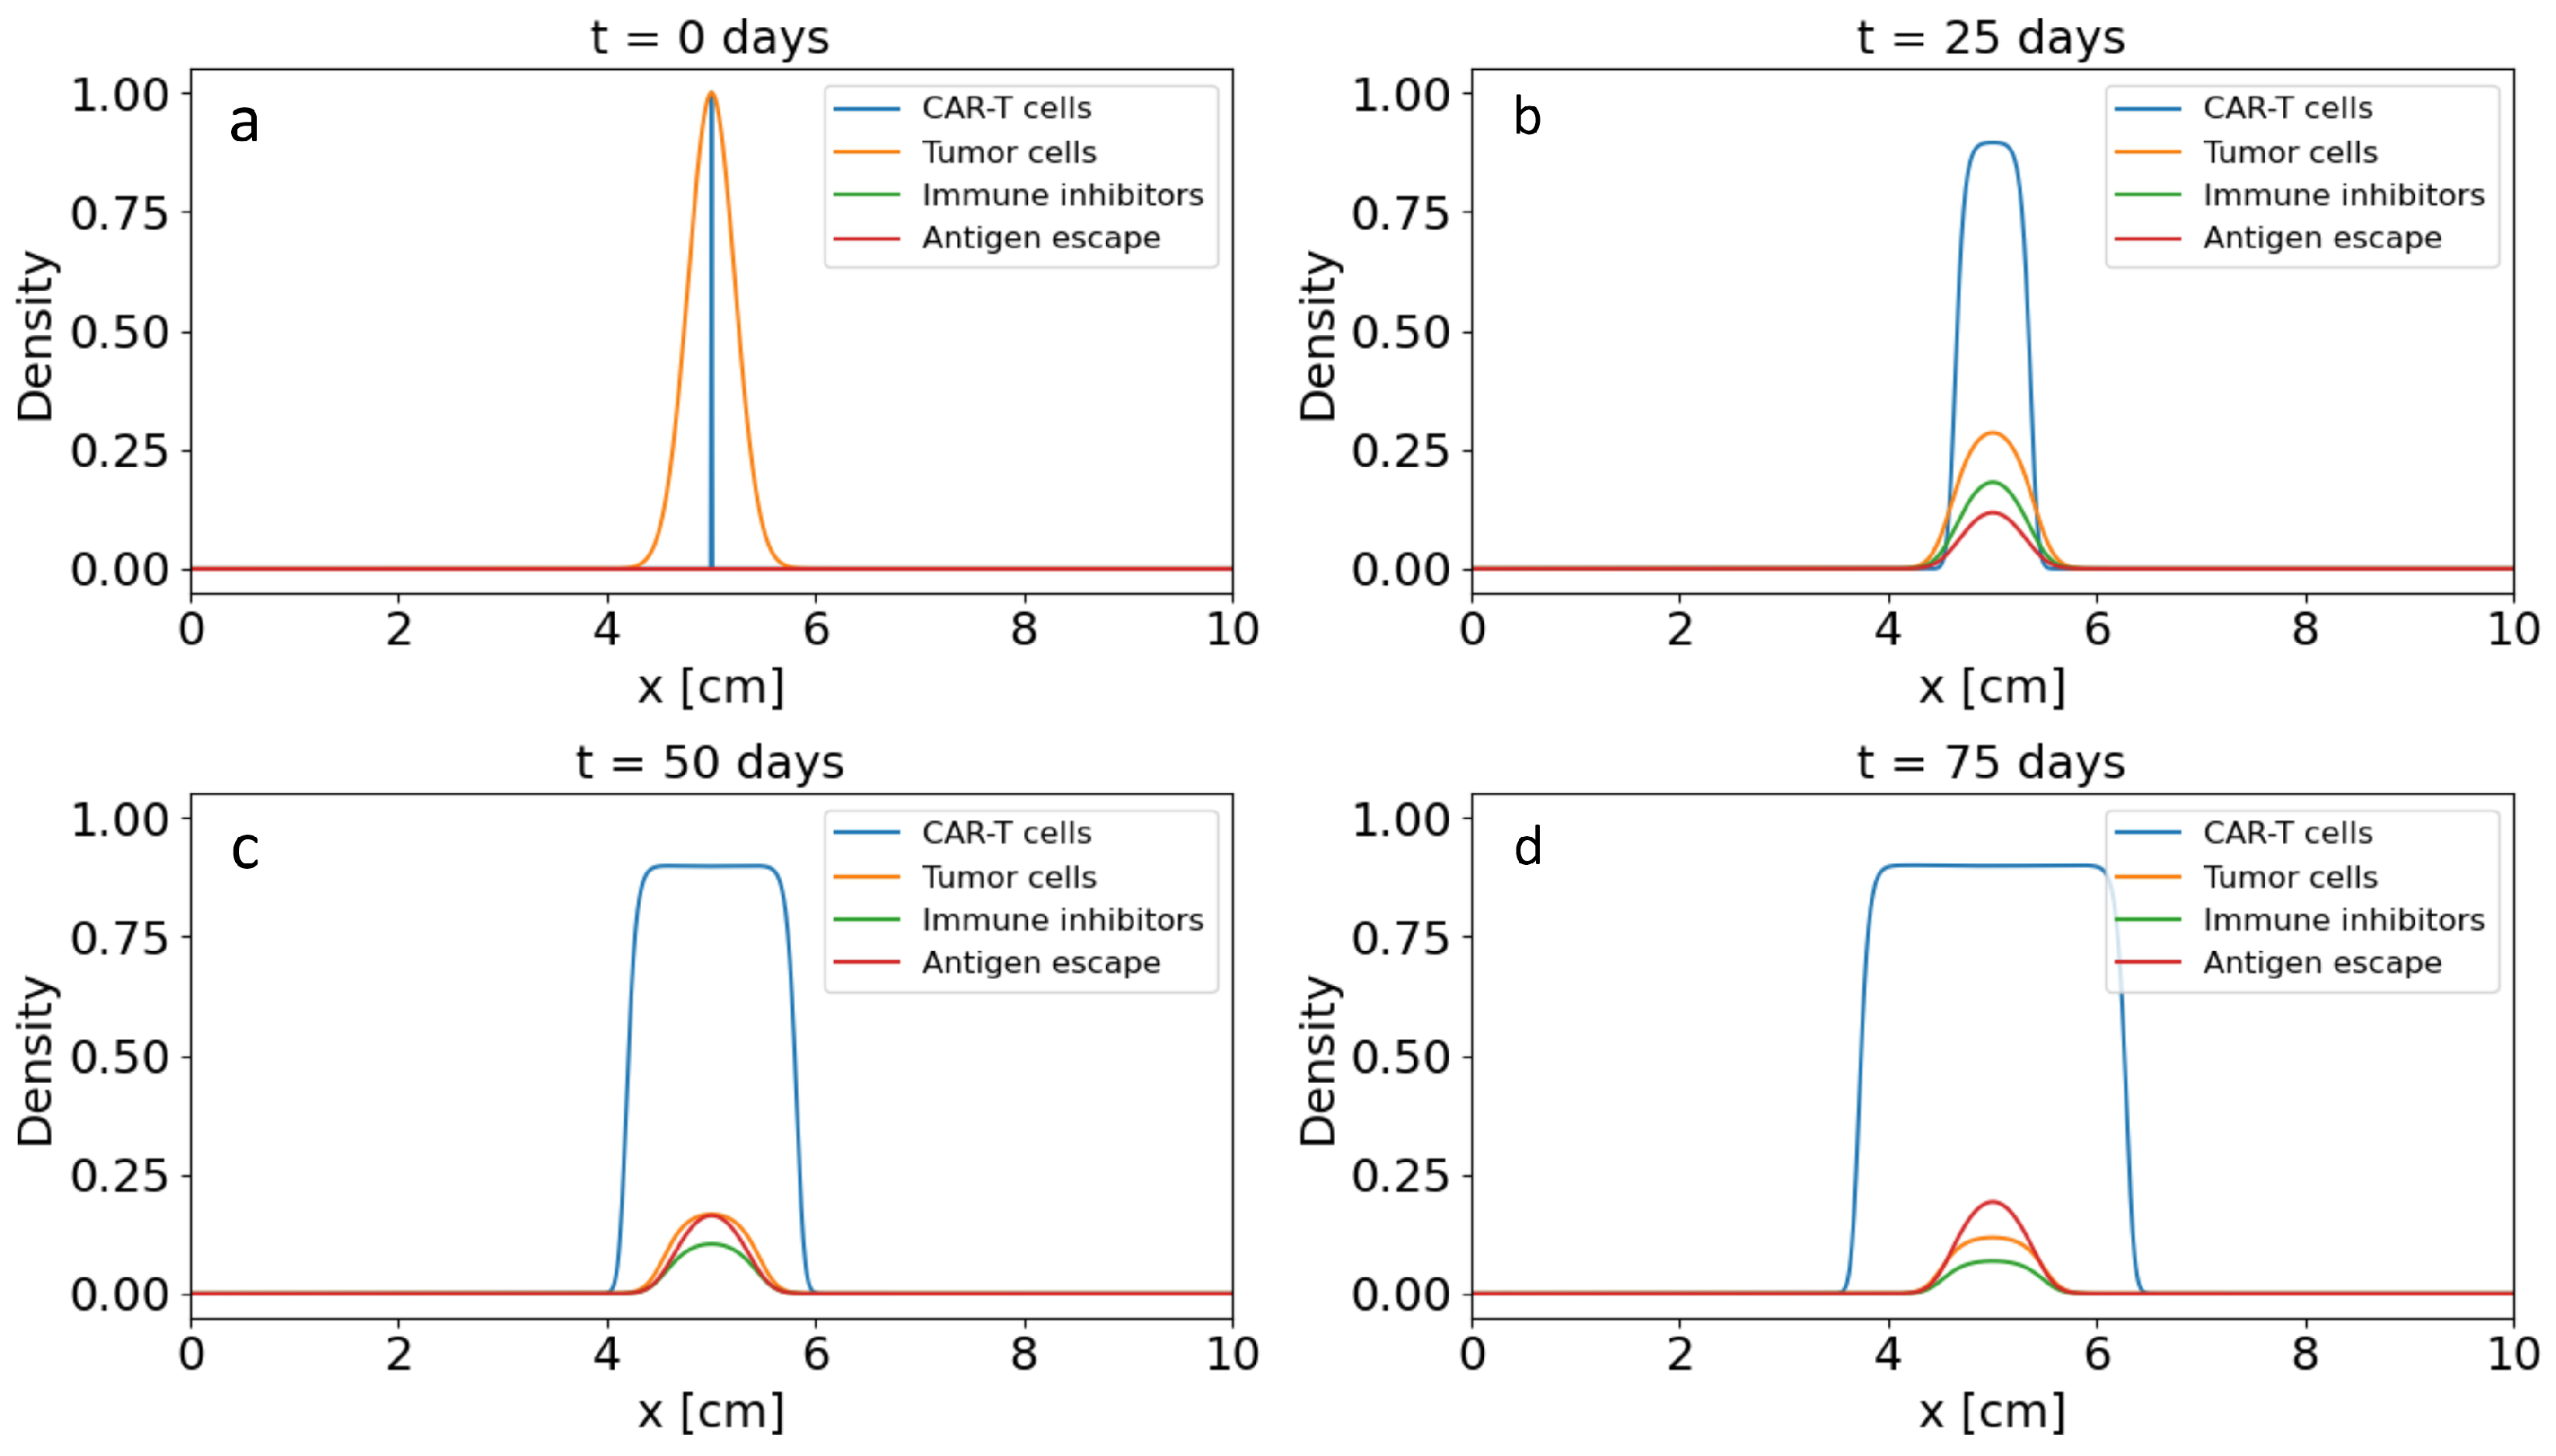
Figure 5.
Spatial distribution of the concentrations of tumour cells and CAR-T cells at different time points.
Figure 5.
Spatial distribution of the concentrations of tumour cells and CAR-T cells at different time points.
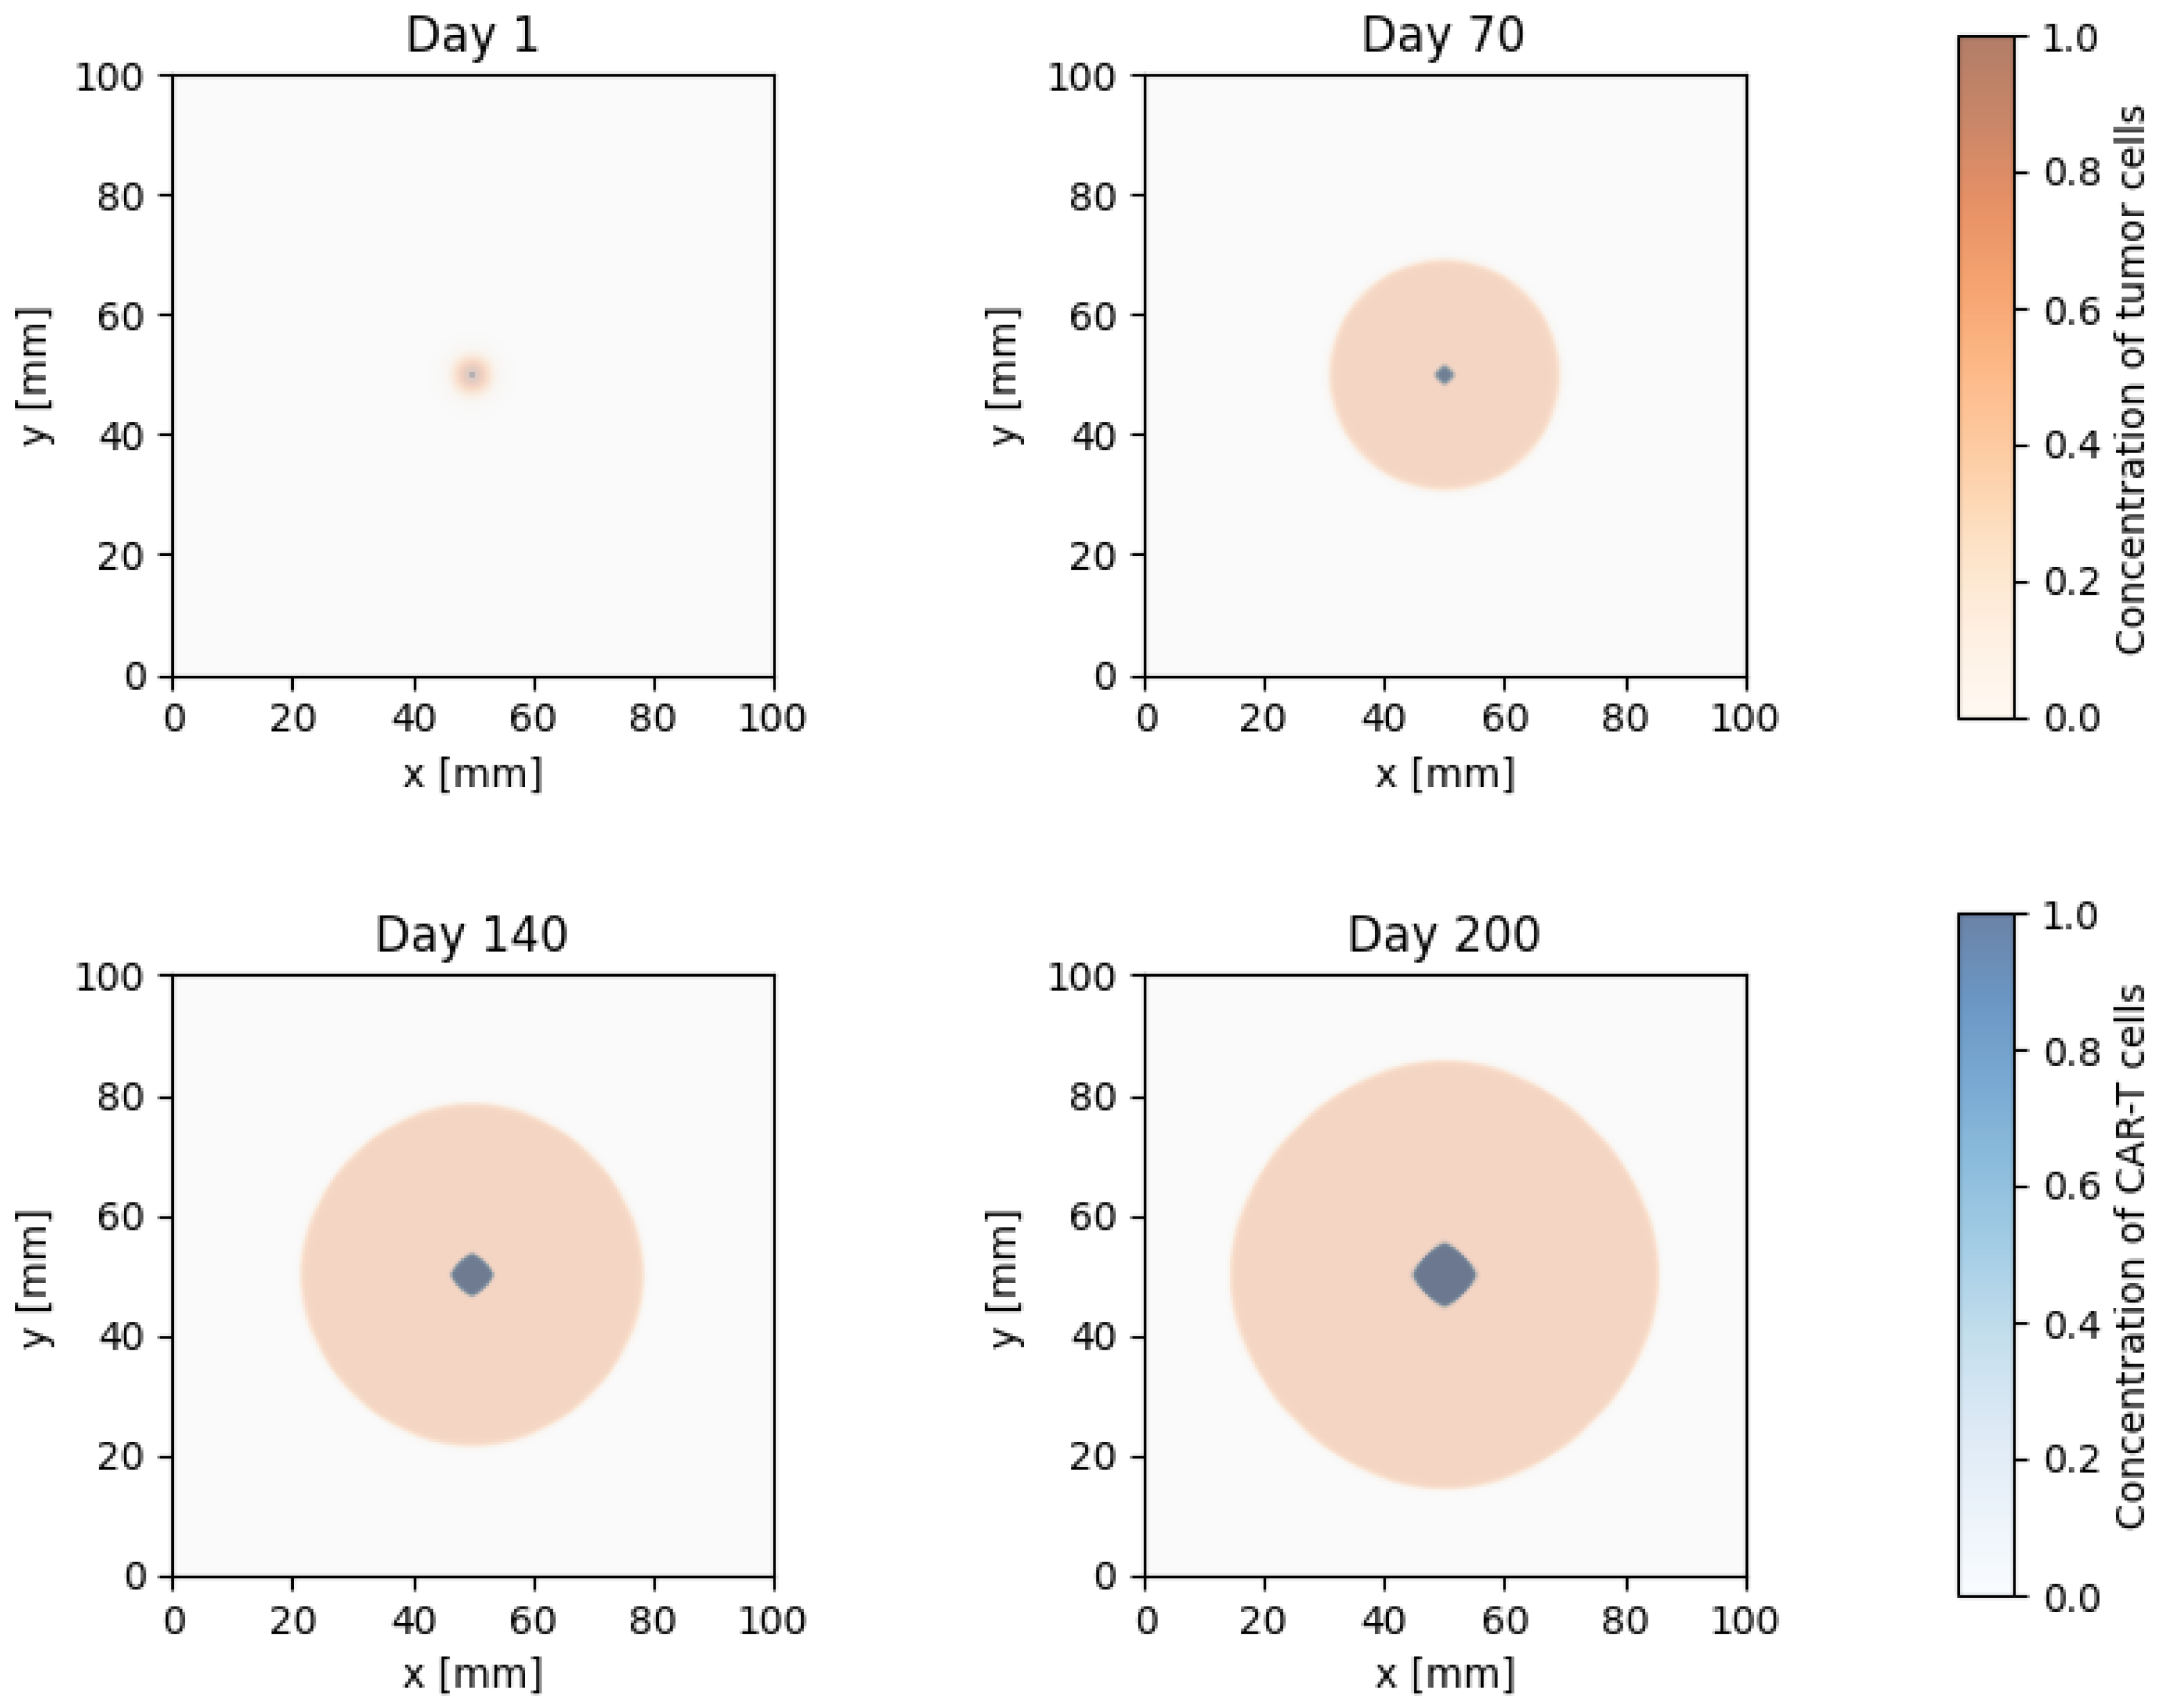
Figure 6.
Comparison of the temporal dynamics of tumour volume predicted by the reaction–diffusion model (solid lines) with clinical data (points) for six independent solid-tumour growth cases without therapy.
Figure 6.
Comparison of the temporal dynamics of tumour volume predicted by the reaction–diffusion model (solid lines) with clinical data (points) for six independent solid-tumour growth cases without therapy.
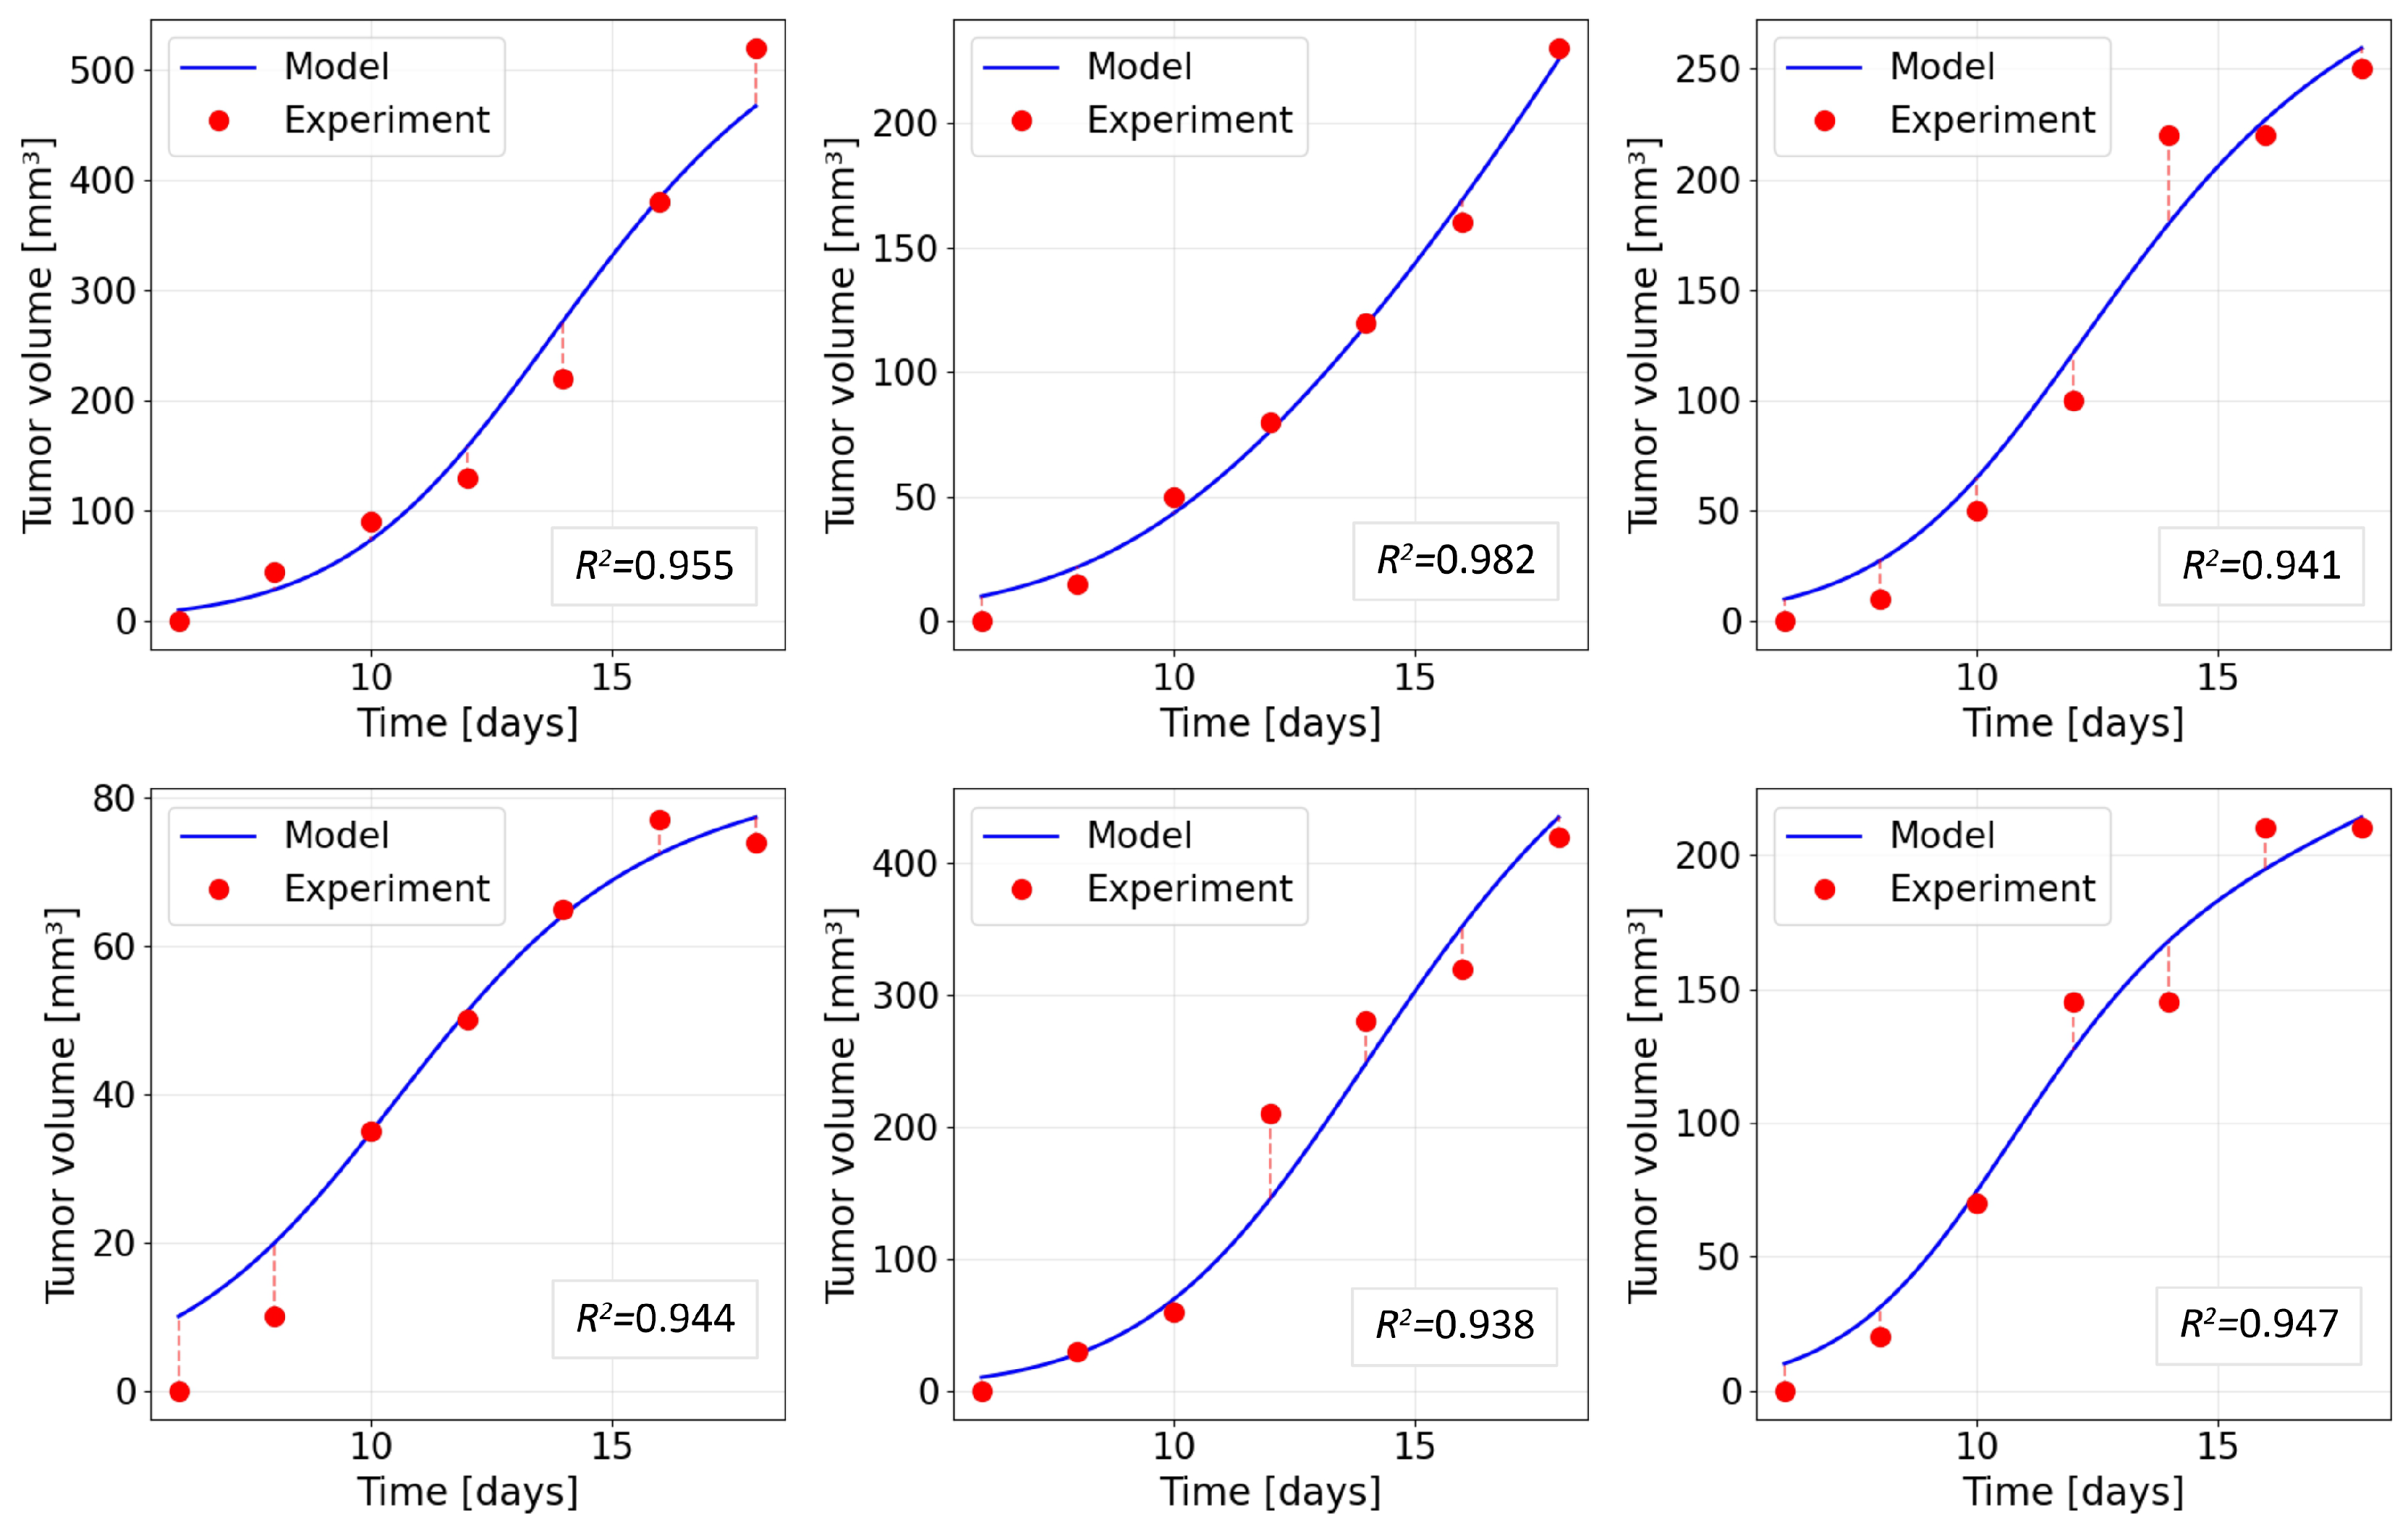
Figure 7.
Spatial distribution of tumour-cell concentration along a cross-section of a solid tumour for different values of the antigen-escape rate at time days.
Figure 7.
Spatial distribution of tumour-cell concentration along a cross-section of a solid tumour for different values of the antigen-escape rate at time days.
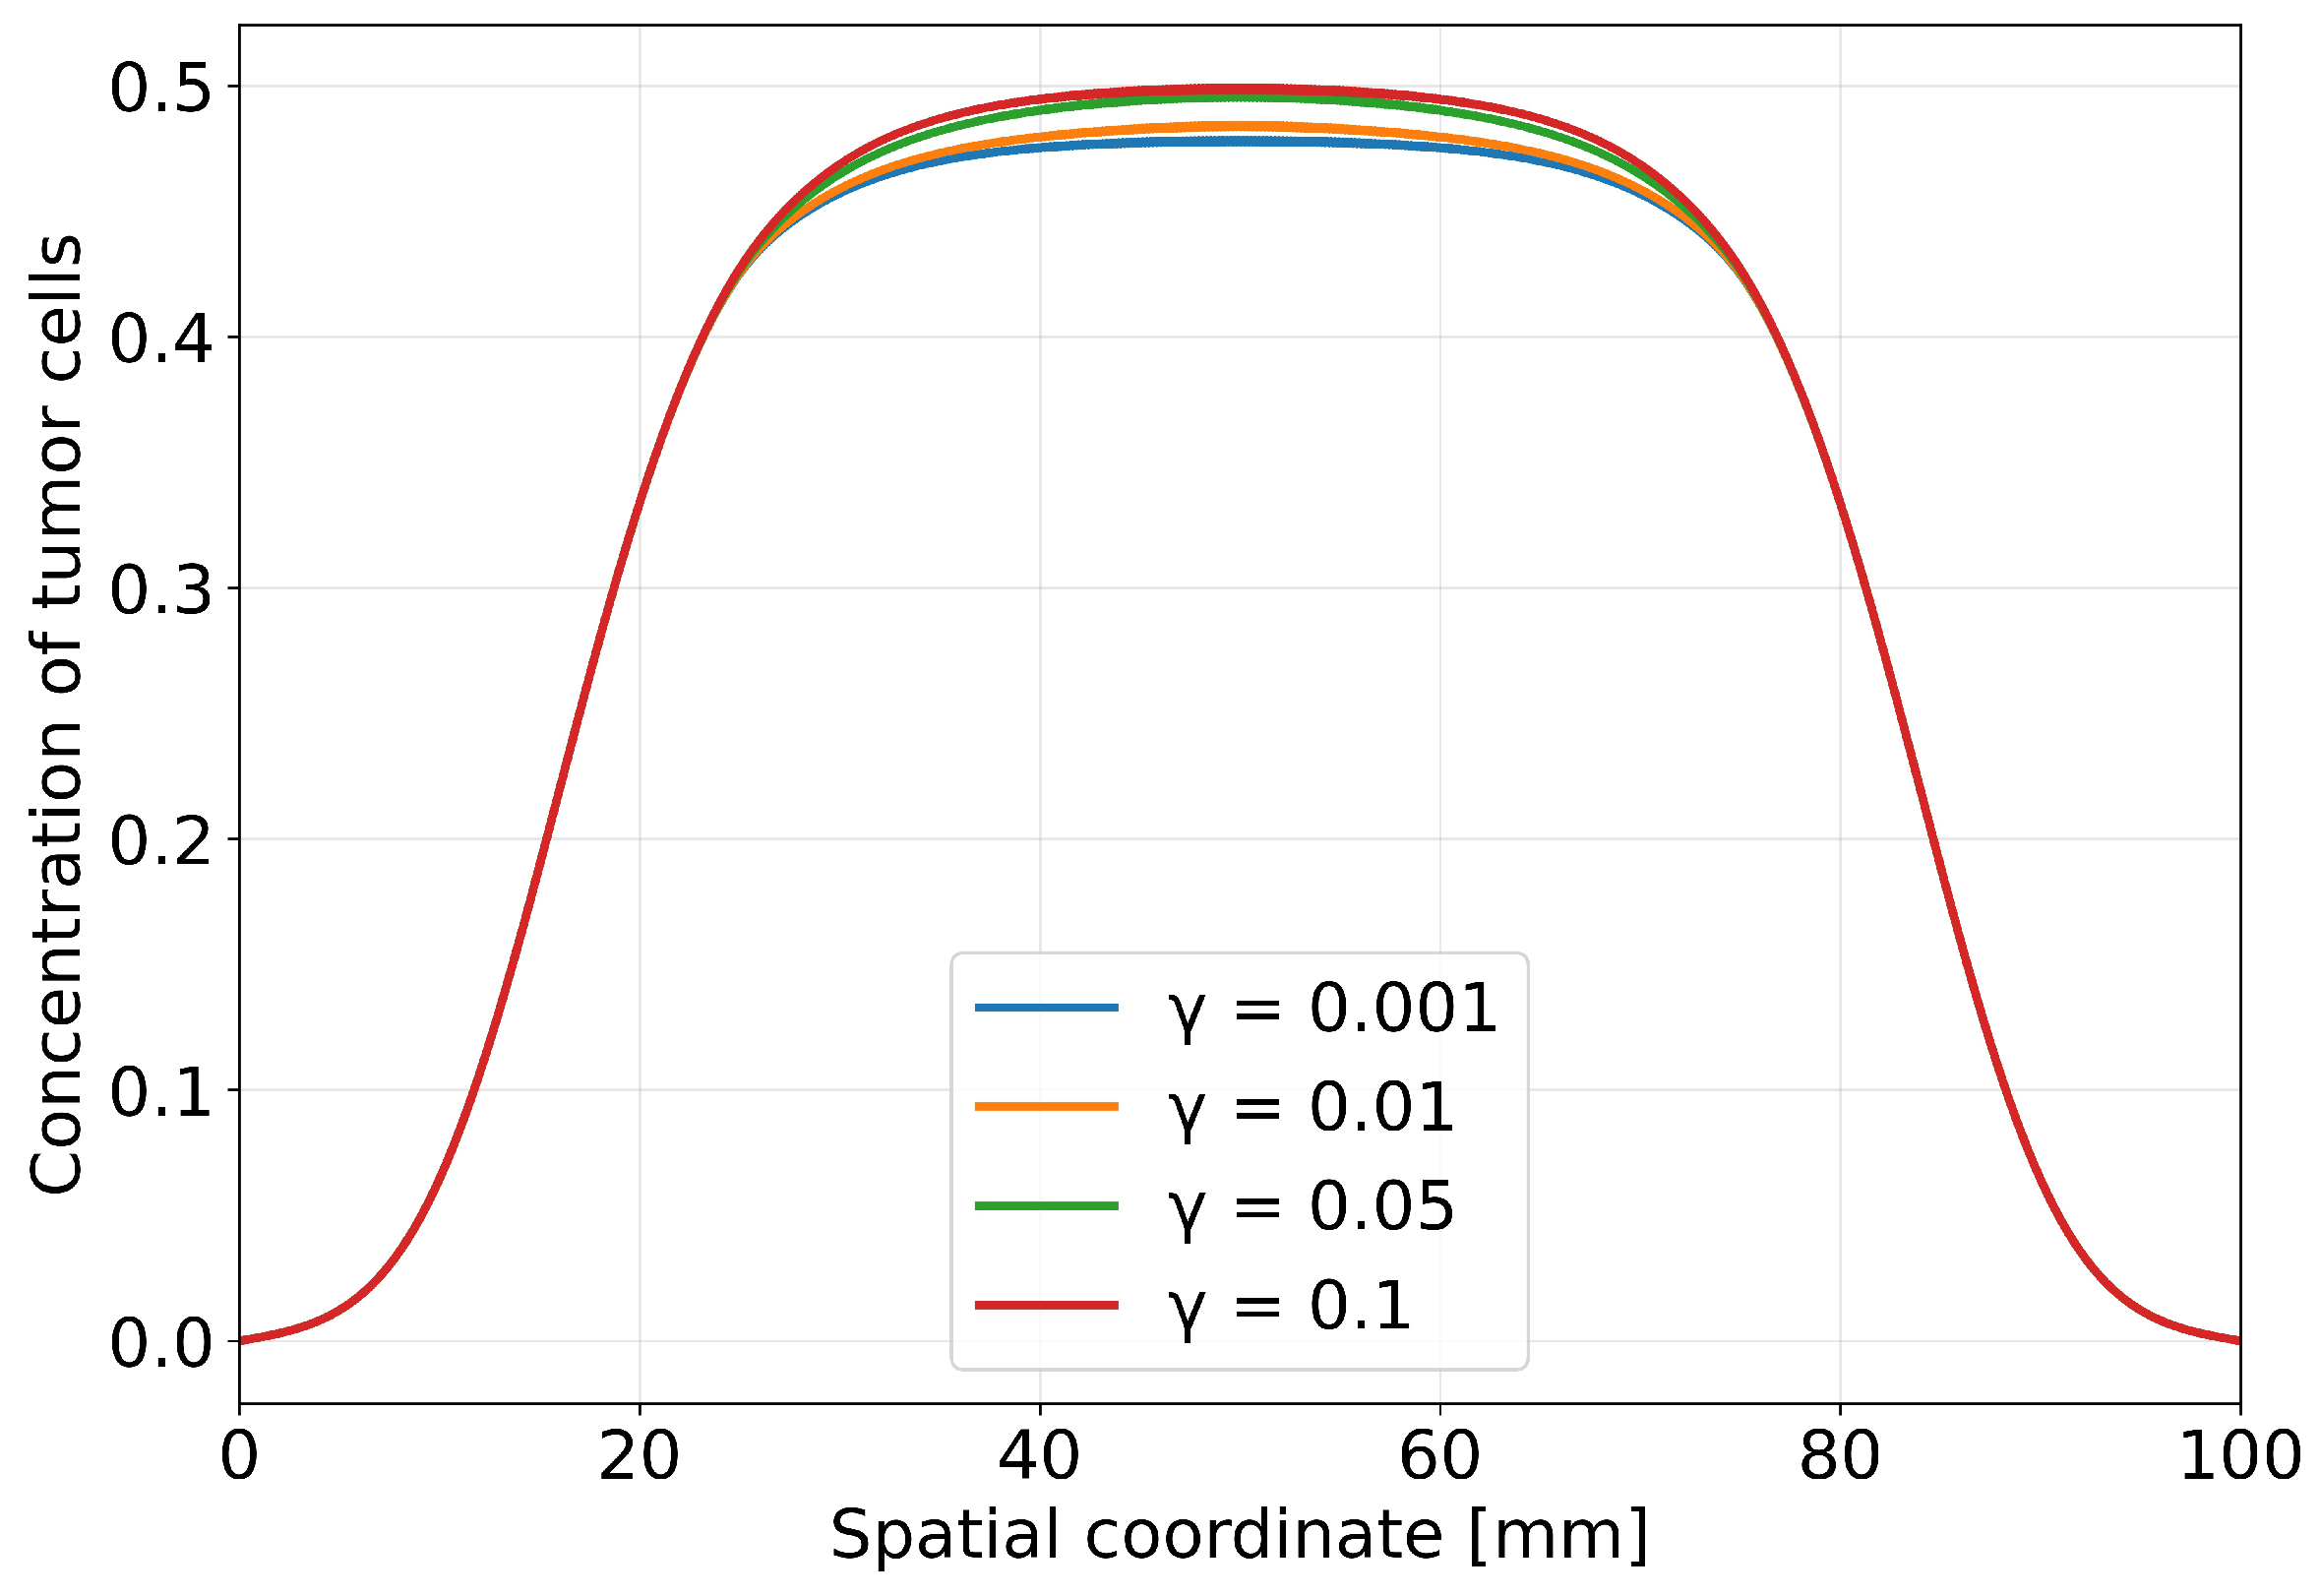
Figure 8.
Dependence of tumour volume at time days on the antigen-escape rate (horizontal axis in logarithmic scale).
Figure 8.
Dependence of tumour volume at time days on the antigen-escape rate (horizontal axis in logarithmic scale).
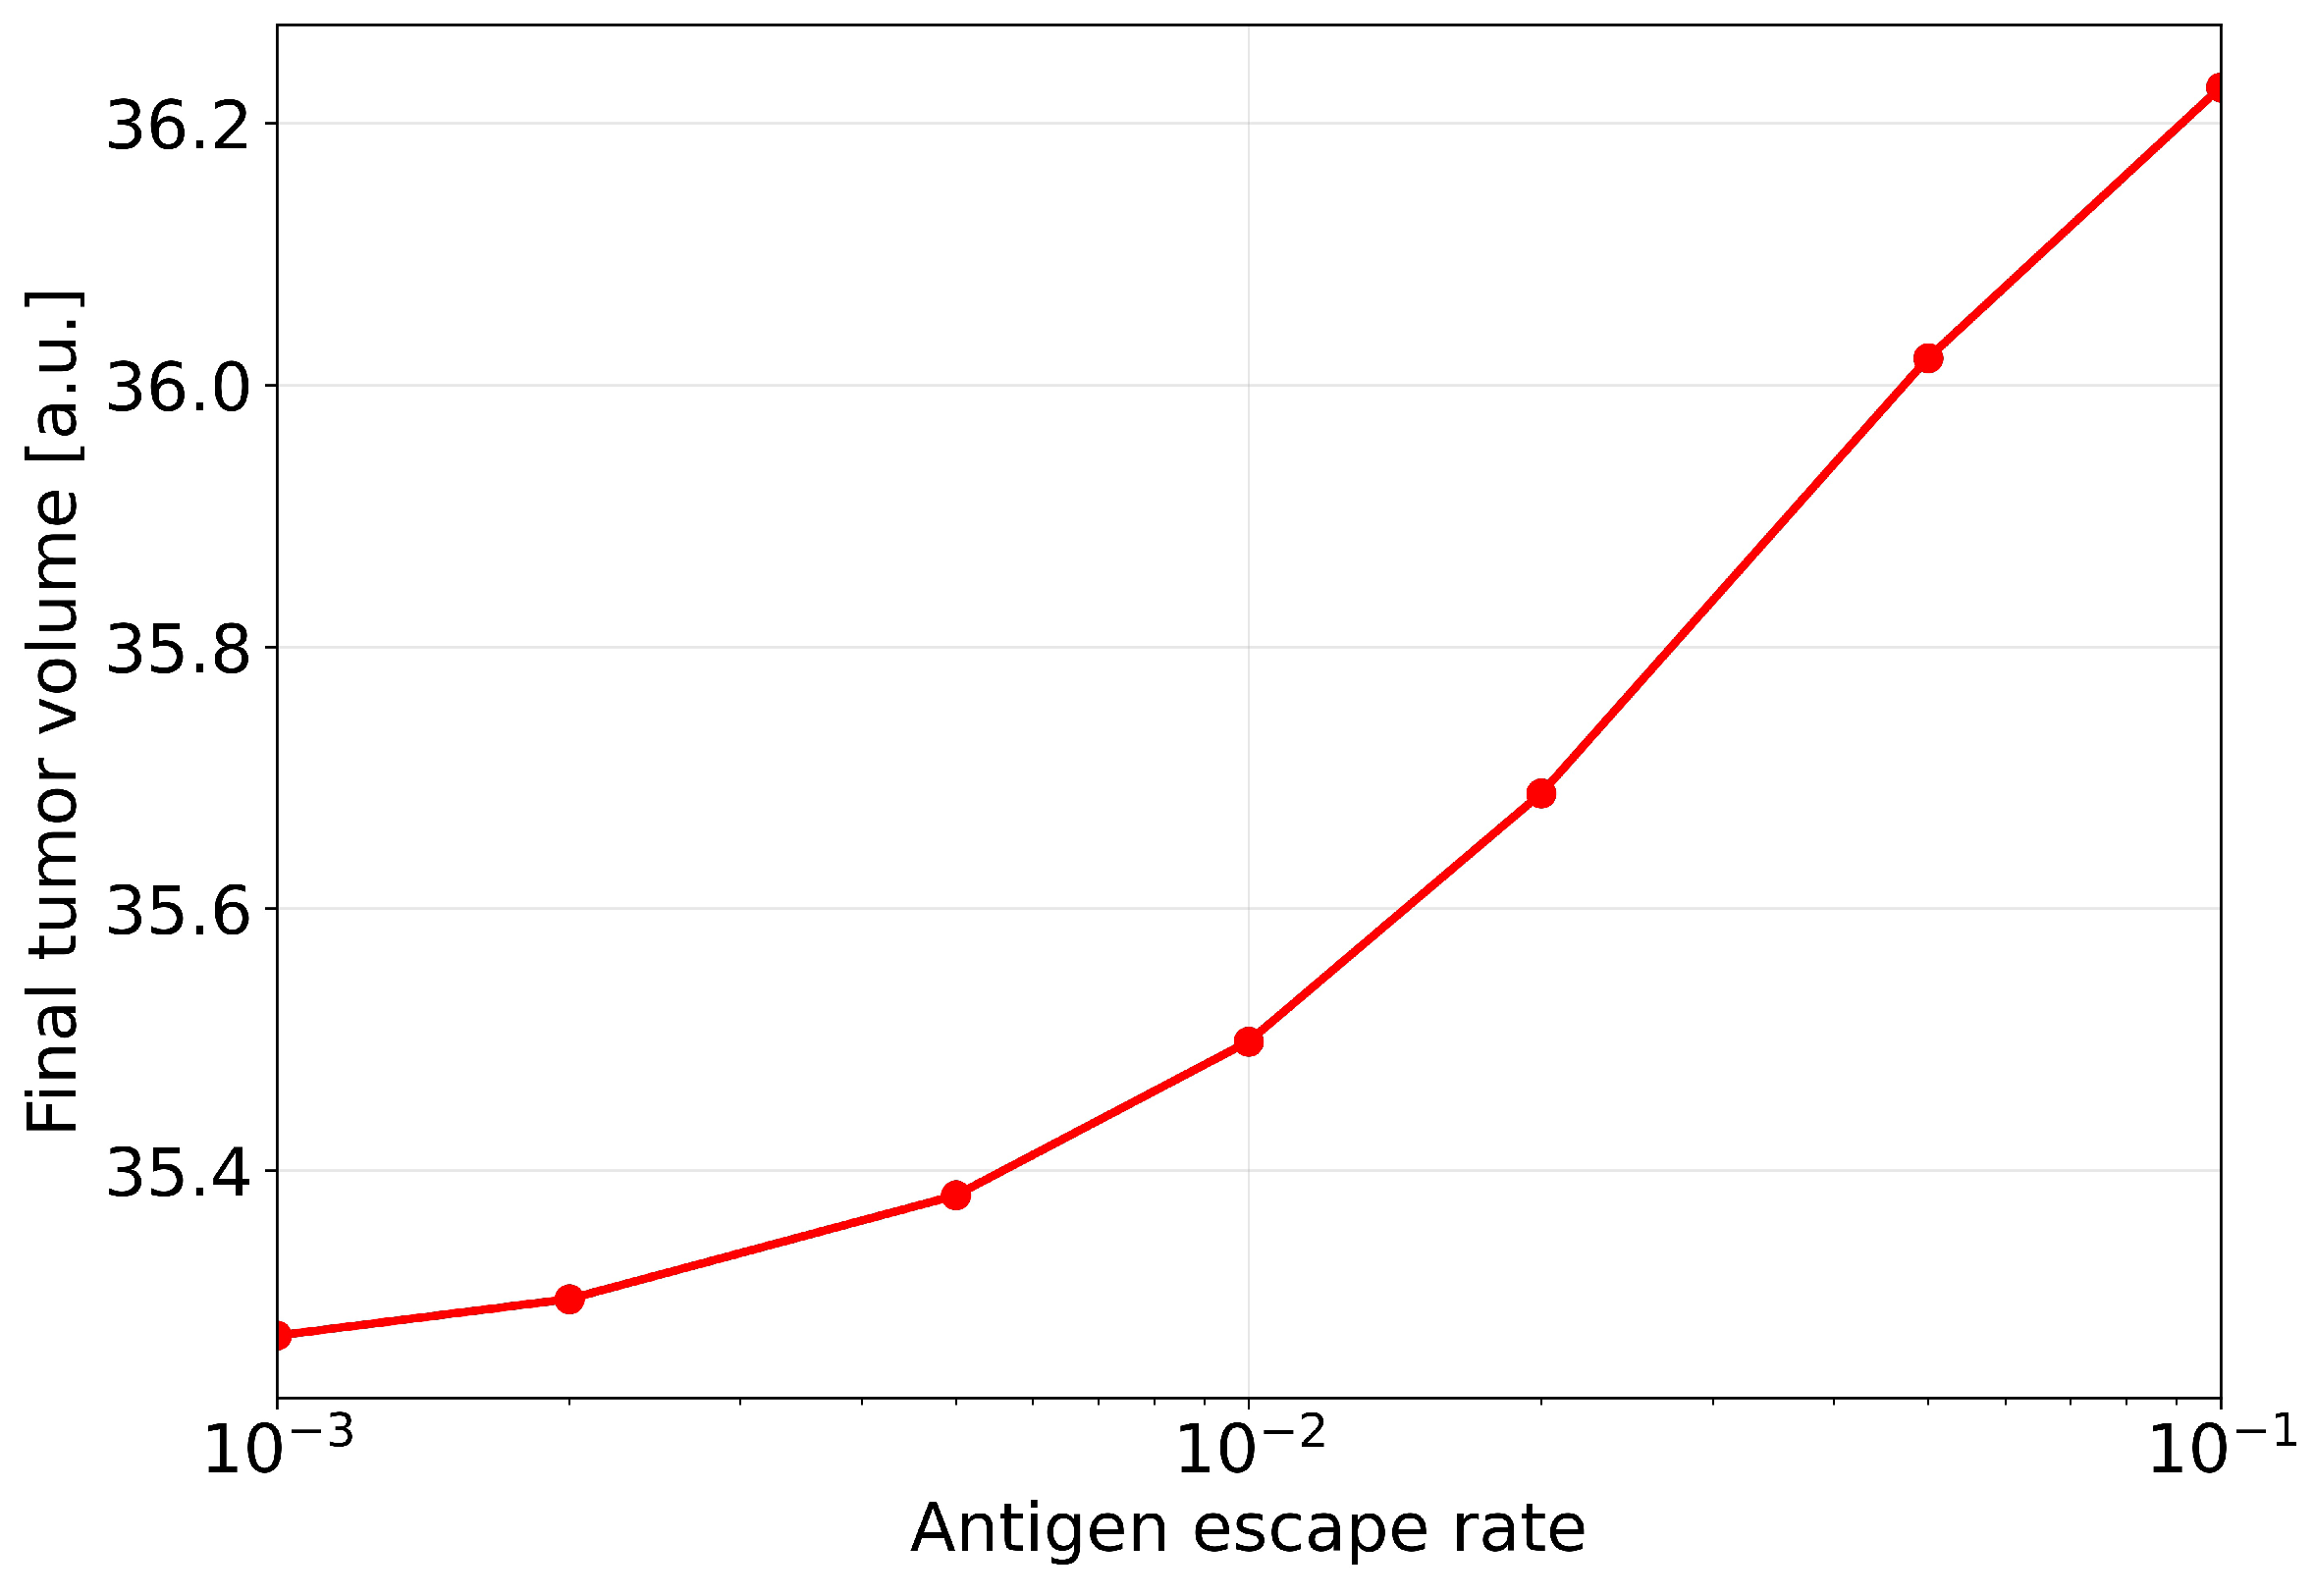
Figure 9.
Interaction of model parameters: (a) dependence of CAR-T therapy efficacy on the antigen-escape rate and the tumour-cell killing rate ; (b) influence of the proliferation rate and the degree of hypoxic suppression on CAR-T cell activity.
Figure 9.
Interaction of model parameters: (a) dependence of CAR-T therapy efficacy on the antigen-escape rate and the tumour-cell killing rate ; (b) influence of the proliferation rate and the degree of hypoxic suppression on CAR-T cell activity.
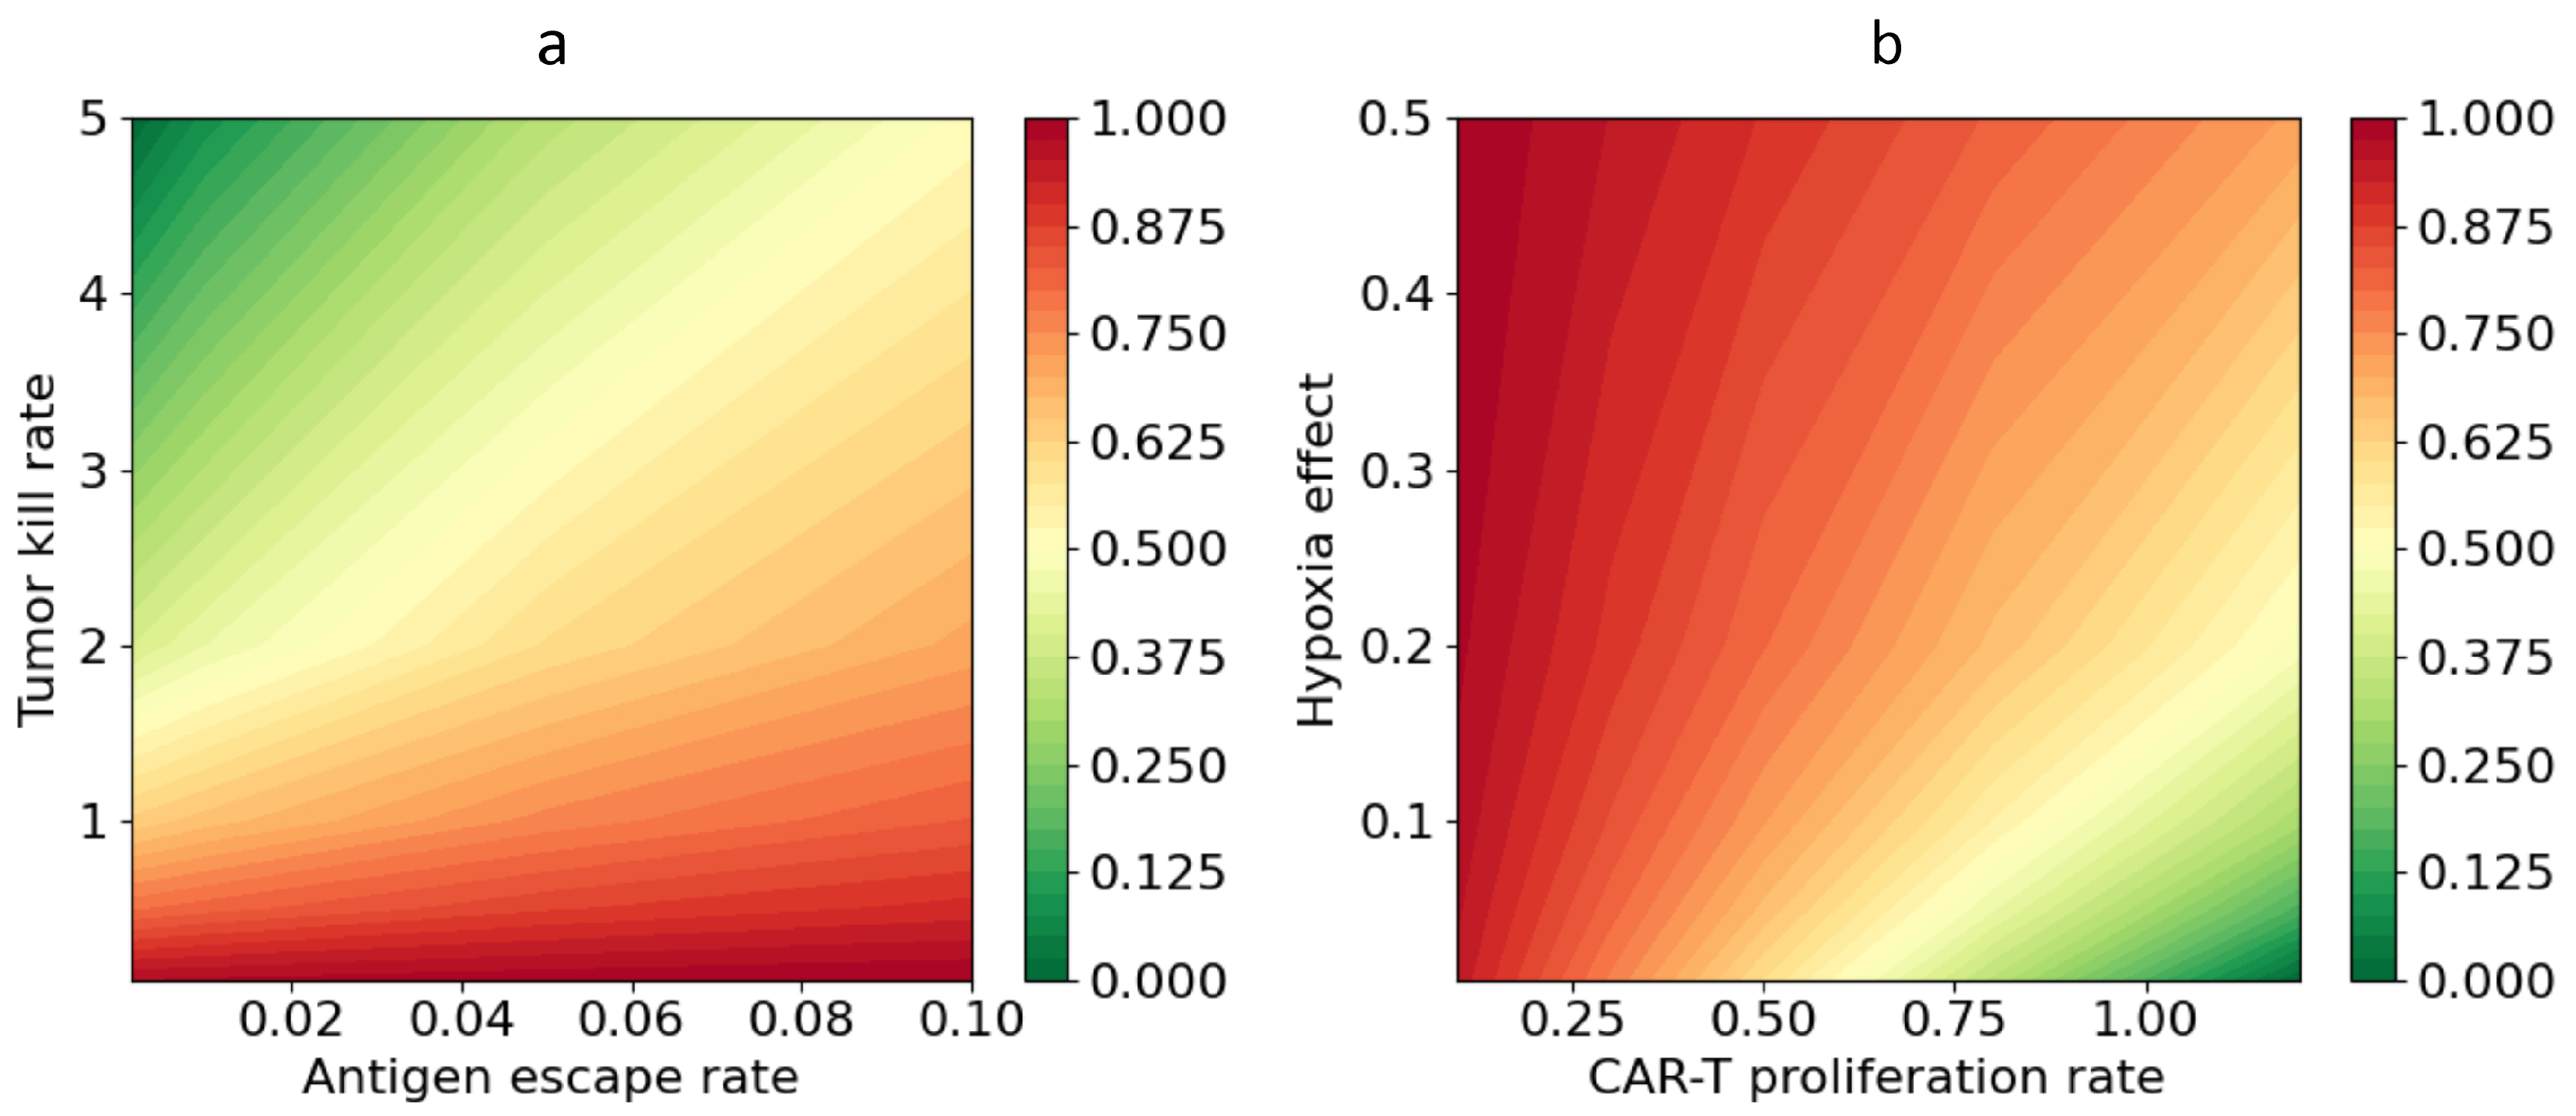
Figure 10.
Schematic representation of temporal schemes of CAR-T cell administration for four therapeutic strategies: single, double, triple and quadruple administration.
Figure 10.
Schematic representation of temporal schemes of CAR-T cell administration for four therapeutic strategies: single, double, triple and quadruple administration.
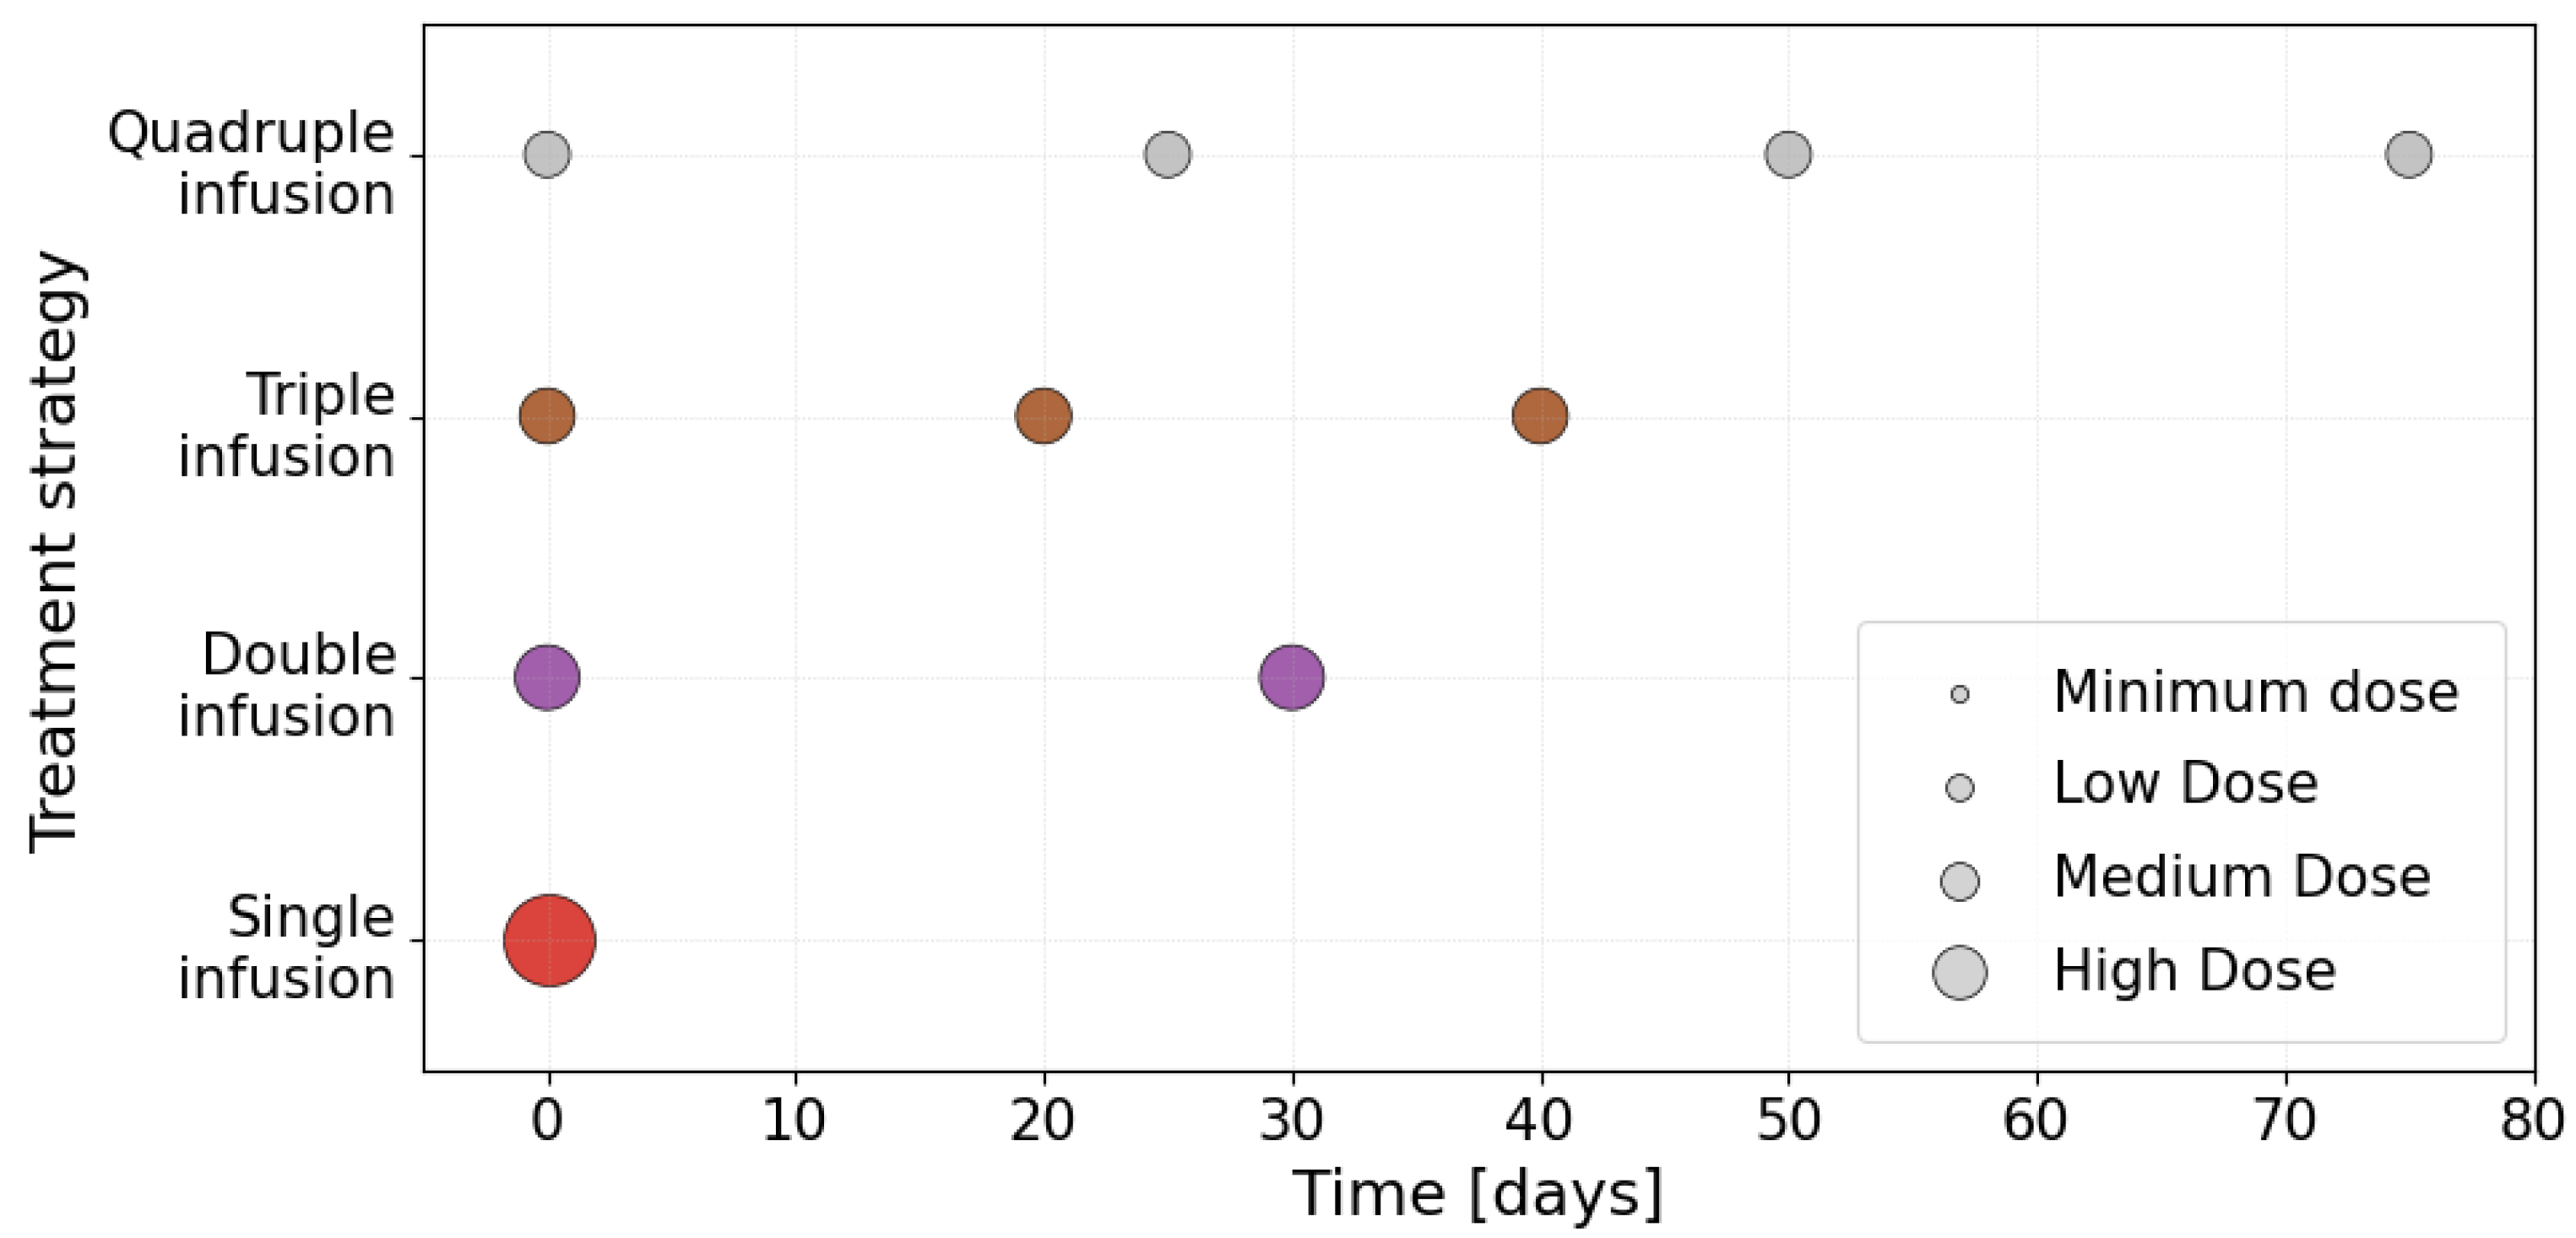
Figure 11.
(a) Dynamics of the normalised tumour volume for different CAR-T cell administration strategies; (b) comparative assessment of the residual normalised tumour volume at days for different temporal CAR-T cell administration strategies.
Figure 11.
(a) Dynamics of the normalised tumour volume for different CAR-T cell administration strategies; (b) comparative assessment of the residual normalised tumour volume at days for different temporal CAR-T cell administration strategies.
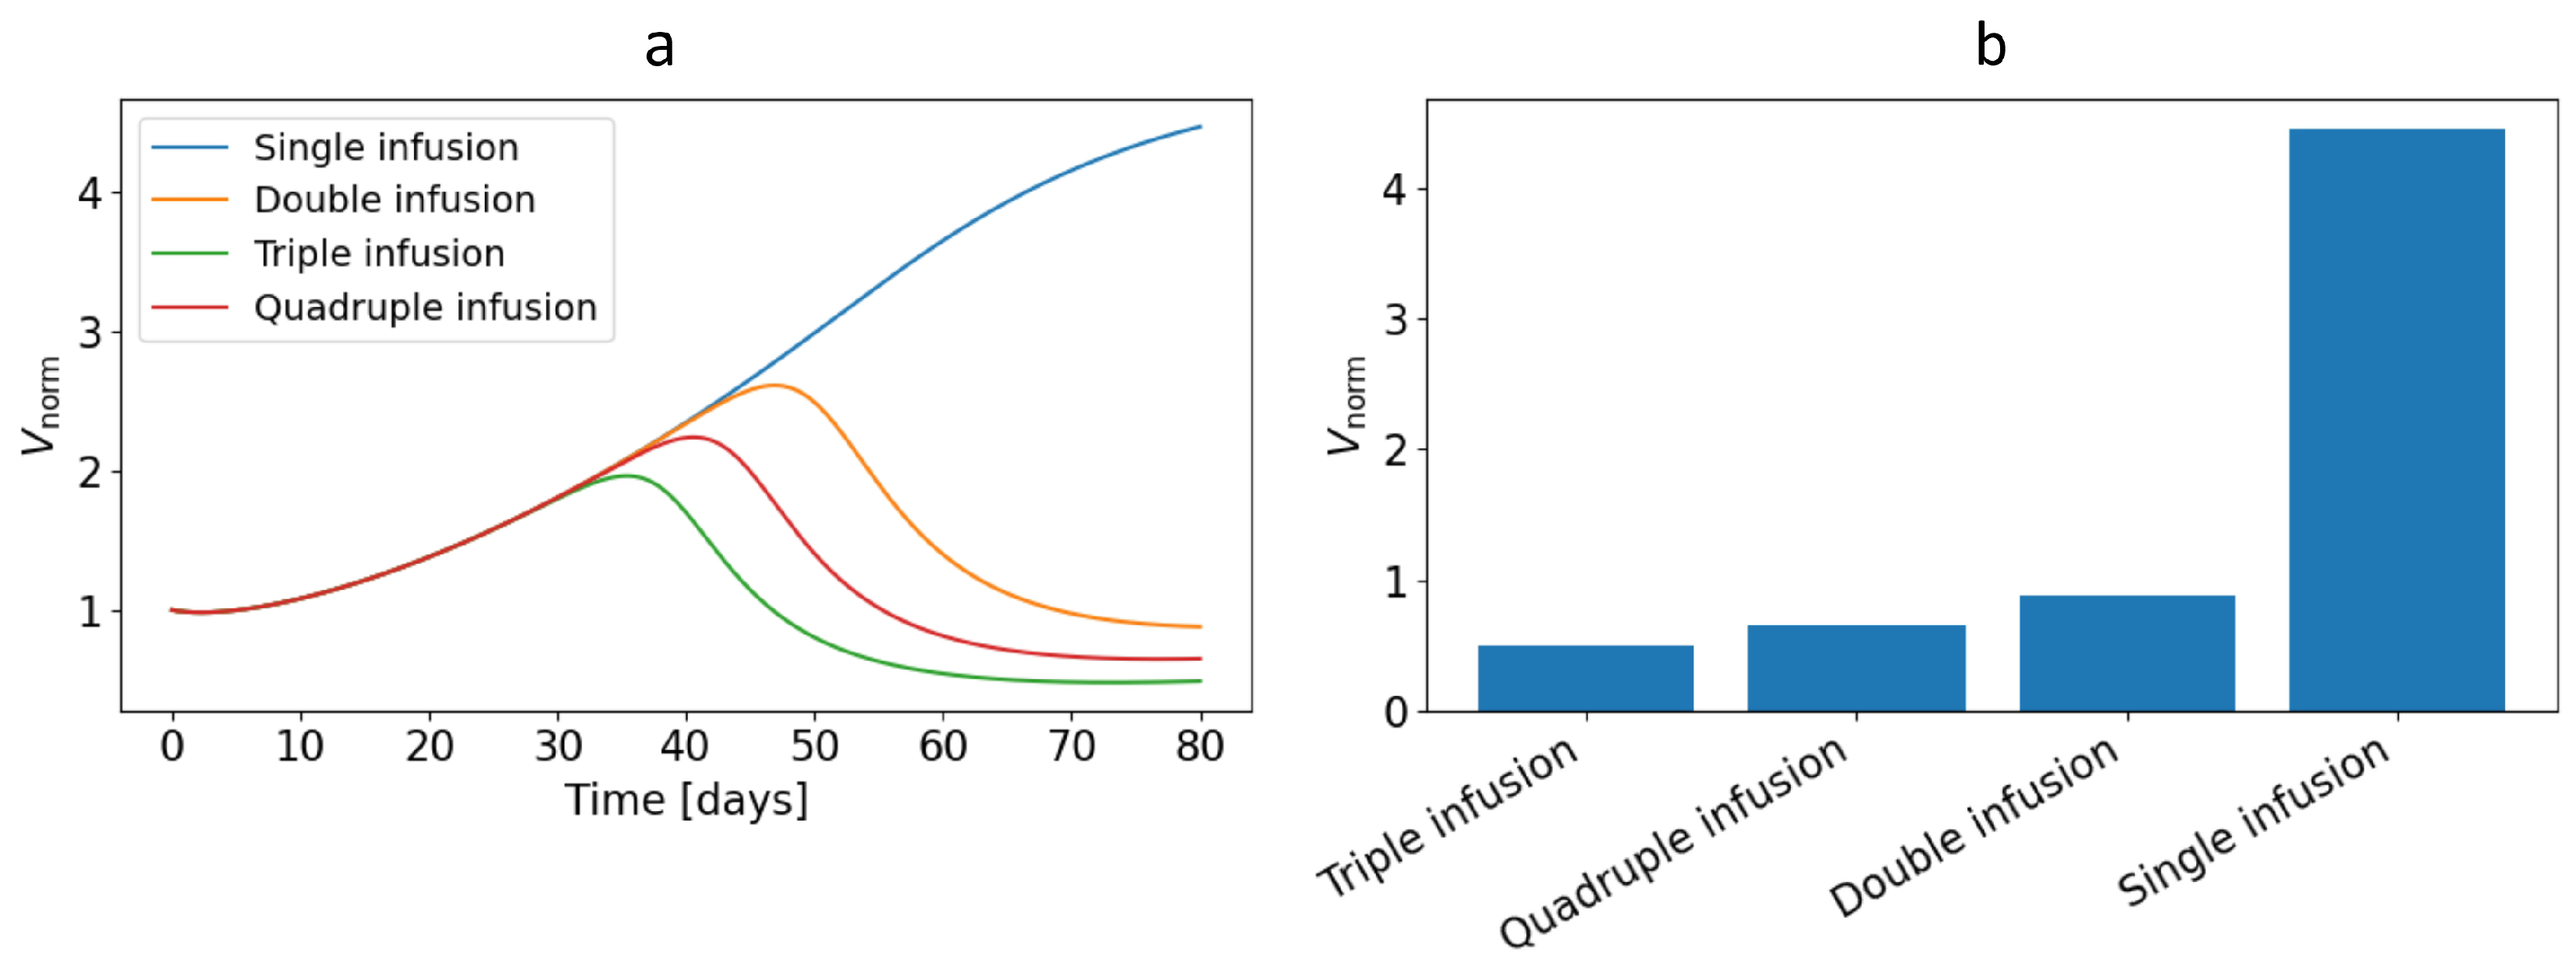

Table 1.
Initial values of the free model parameters.
| Parameter | Description | Value in the model | Range of values |
|---|---|---|---|
| Diffusion coefficient of CAR-T cells | 0.05 | assumed | |
| Diffusion coefficient of tumour cells | 0.00005 | – cm2/day [44] | |
| Proliferation rate of CAR-T cells | 0.5 | 0.2–0.9 day−1 [45], 0.1–0.9 day−1 [46] | |
| Tumour growth rate | 0.1 | 0.01–0.2 day−1 [46] | |
| Rate of tumour-cell killing by CAR-T cells | 0.64 | 0.64–1.35 day−1 [47] | |
| Inhibition of CAR-T cells by immune factors | 0.01 | assumed | |
| Effect of hypoxia on CAR-T cell activity | 0.05 | assumed | |
| Effect of hypoxia on tumour growth | 0.5 | assumed | |
| Decay rate of immune inhibitors | 0.1 | assumed | |
| Rate of inhibitor production by the tumour | 0.05 | assumed | |
| Rate of tumour antigen escape | 0.01 | assumed |
Disclaimer/Publisher’s Note: The statements, opinions and data contained in all publications are solely those of the individual author(s) and contributor(s) and not of MDPI and/or the editor(s). MDPI and/or the editor(s) disclaim responsibility for any injury to people or property resulting from any ideas, methods, instructions or products referred to in the content. |
© 2025 by the authors. Licensee MDPI, Basel, Switzerland. This article is an open access article distributed under the terms and conditions of the Creative Commons Attribution (CC BY) license (http://creativecommons.org/licenses/by/4.0/).
Copyright: This open access article is published under a Creative Commons CC BY 4.0 license, which permit the free download, distribution, and reuse, provided that the author and preprint are cited in any reuse.


